Embed Size (px)
Citation preview

ISISS'2005, International Symposium on Innovation & Sustainability of Structures in Civil Engineer-ing, Nanjing, China, November 20-22, 2005 Page 1 of 16
Overview of fibre optic sensing to structural health monitoring applications
Daniele Inaudi
SMARTEC SA Manno, Switzerland, www.smartec.ch
1 ABSTRACT From many points of view, fiber optic sensors are the ideal transducers for civil structural monitoring. Being durable, stable and insensitive to external perturbations, they are par-ticularly interesting for the long-term health assessment of civil structures. Many different fiber optic sensor technologies exist and offer a wide range of performances and suitability for different applications. Europe has been on the forefront of fiber optic sensor development and a number of systems have matured to full commercial exploitation and routine application in structural health monitoring. This contribution reviews some of these systems and technologies and briefly presents some significant application examples. 2 INTRODUCTION The construction and maintenance of the civil infrastructure represents be-tween 10% and 20% of the public investment in most European countries. In the last decade we have however witnessed an increasing shift from invest-ments in the construction of new structures to the maintenance and the life-time extension of the existing ones. With the exception of the high-speed

ISISS'2005, International Symposium on Innovation & Sustainability of Structures in Civil Engineer-ing, Nanjing, China, November 20-22, 2005 Page 2 of 16
train lines, most of the transportation network, including highways and rail-way, is completed and in service. However, the steady increase of the pas-sengers and goods circulating in the continent, amplified by the free circula-tion policy introduced by the European Community, is putting the civil infrastructure under a rude test. Many bridges and tunnels built a few tens of years ago need repair and in many case an extension of their bearing capacity and lifetime that exceed the original plans. Besides the direct costs associated with these interventions, the disruption to the normal use of the structures causes additional inconvenience including traffic jams and accidents that carry additional hidden costs. The authorities managing the civil infrastructures face the challenge of main-taining the transportation network in a satisfactory state using a limited budget and with little perturbation to its normal use. This task is far more complex than that of building new structures and requires new management instruments. Structural health monitoring is certainly one of the most powerful manage-ment tools and is therefore gaining in importance in the civil engineering community. Monitoring is often and mistakenly presented as a security tool. This is however only the case for the few structures that present a high poten-tial danger such as nuclear power plants and dams. For most other structures the security risks are very limited and fortunately we rarely witness casualties due to a structural collapse. For all other structures, monitoring should be seen as a management tool delivering information on the state of a single structure or on a network of structures. In what we call the information age, structural health monitoring closes the gap between the seemingly inert world of structures and the frenetic one of information technology. A typical health monitoring system is composed of a network of sensors that measure the parameters relevant to the state of the structure and its environ-ment. For civil structures such as bridges, tunnels, dams, geostructures, power plants, high-rise buildings and historical monuments, the most relevant parameters are: • Physical quantities: position, deformations, inclinations, strains, forces,
pressures, accelerations, and vibrations. • Temperatures. • Chemical quantities: humidity, pH, and chlorine concentration. • Environmental parameters: air temperature, wind speed and direction, ir-
radiation, precipitation, snow accumulation, water levels and flow, pol-lutant concentration.
Conventional sensors based on mechanical and/or electrical transducers are able to measure most of these parameters. In the last few years, fiber optic
ISISS'2005, International Symposium on Innovation & Sustainability of Structures in Civil Engineer-ing, Nanjing, China, November 20-22, 2005 Page 3 of 16
sensors have made a slow but significant entrance in the sensor panorama. After an initial euphoric phase when optical fiber sensors seemed on the verge of invading the whole world of sensing, it now appears that this tech-nology is only attractive in the cases where it offers superior performance compared to the more proven conventional sensors. The additional value can include an improved quality of the measurements, a better reliability, the pos-sibility of replacing manual readings and operator judgment with automatic measurements, an easier installation and maintenance or a lower lifetime cost. The first successful industrial applications of fiber optic sensors to civil structural monitoring demonstrate that this technology is now sufficiently mature for a routine use and that it can compete as a peer with conventional instrumentation.
3 FIBER OPTIC SENSOR TYPES Europe offers a great variety of fiber optic sensors (Udd 1991, Udd 1995, In-audi 1997a) for structural monitoring in both the academic and the industrial areas. In this overview we will concentrate on sensors for civil health moni-toring that have reached an industrial level or are at least at the stage of ad-vanced field trials.
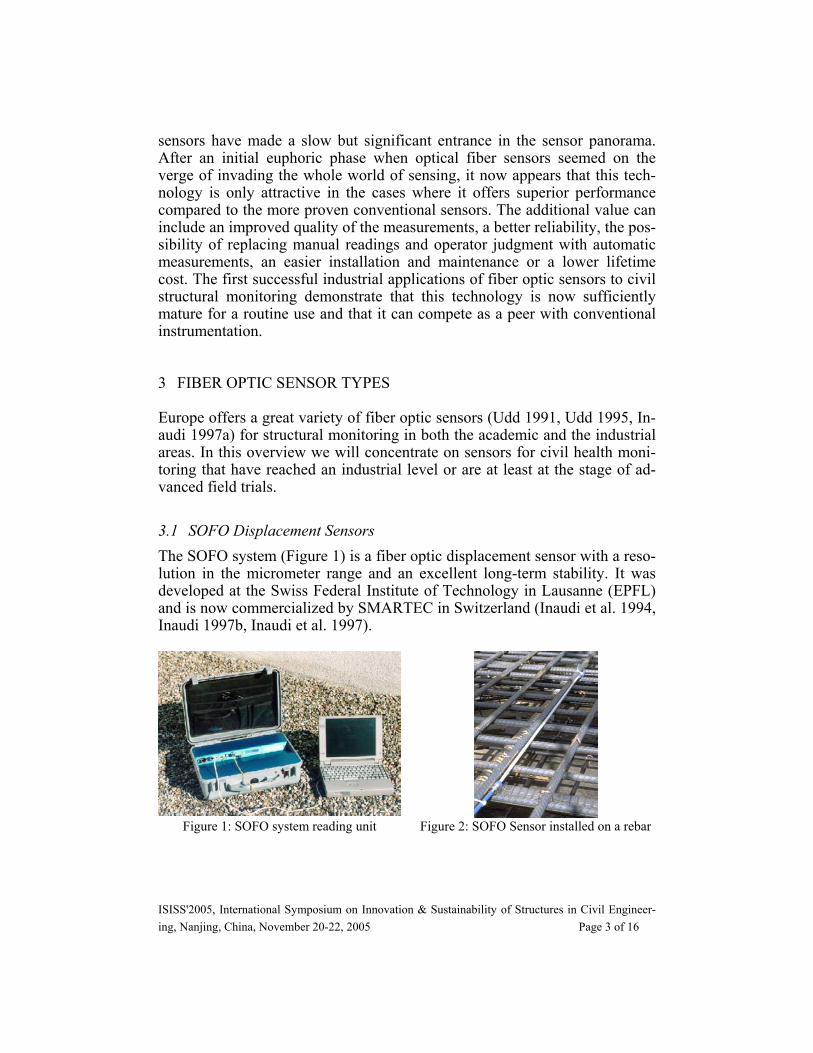
3.1 SOFO Displacement Sensors The SOFO system (Figure 1) is a fiber optic displacement sensor with a reso-lution in the micrometer range and an excellent long-term stability. It was developed at the Swiss Federal Institute of Technology in Lausanne (EPFL) and is now commercialized by SMARTEC in Switzerland (Inaudi et al. 1994, Inaudi 1997b, Inaudi et al. 1997).
Figure 1: SOFO system reading unit Figure 2: SOFO Sensor installed on a rebar

ISISS'2005, International Symposium on Innovation & Sustainability of Structures in Civil Engineer-ing, Nanjing, China, November 20-22, 2005 Page 4 of 16
The measurement setup uses low-coherence interferometry to measure the length difference between two optical fibers installed on the structure to be monitored (Figure 2). The measurement fiber is pre-tensioned and mechani-cally coupled to the structure at two anchorage points in order to follow its deformations, while the reference fiber is free and acts as temperature refer-ence. Both fibers are installed inside the same pipe and the measurement ba-sis can be chosen between 200mm and 10m. The resolution of the system is of 2 µm independently from the measurement basis and its precision of 0.2% of the measured deformation even over years of operation. The SOFO system has been successfully used to monitor more than 150 structures, including bridges, tunnels, piles, anchored walls, dams, historical monuments, nuclear power plants as well as laboratory models.
3.2 Bragg Grating Strain Sensors
Bragg gratings are periodic alterations in the index of refraction of the fiber core that can be produced by adequately exposing the fiber to intense UV light. The produced gratings typically have length of the order of 10 mm. If white light is injected in the fiber containing the grating, the wavelength cor-responding to the grating pitch will be reflected while all other wavelengths will pass through the grating undisturbed. Since the grating period is strain and temperature dependent, it becomes possible to measure these two pa-rameters by analyzing the spectrum of the reflected light (Kersey 1997). This is typically done using a tunable filter (such as a Fabry-Perot cavity) or a spectrometer. Resolutions of the order of 1 µε and 0.1 °C can be achieved with the best demodulators. If strain and temperature variations are expected simultaneously, it is necessary to use a free reference grating that measures the temperature alone and use its reading to correct the strain values. Setups allowing the simultaneous measurement of strain and temperature have been proposed, but have yet to prove their reliability in field conditions. The main interest in using Bragg gratings resides in their multiplexing potential. Many gratings can be written in the same fiber at different locations and tuned to reflect at different wavelengths. This allows the measurement of strain at dif-ferent places along a fiber using a single cable. Typically, 4 to 16 gratings can be measured on a single fiber line. It has to be noticed that since the grat-ings have to share the spectrum of the source used to illuminate them, there is a trade-off between the number of grating and the dynamic range of the measurements on each of them. Because of their length, fiber Bragg gratings can be used as replacement of conventional strain gages and installed by gluing them on metals and other

ISISS'2005, International Symposium on Innovation & Sustainability of Structures in Civil Engineer-ing, Nanjing, China, November 20-22, 2005 Page 5 of 16
smooth surfaces (Vohra et al. 1998). With adequate packaging they can also be used to measure strains in concrete over basis length of typically 100 mm.
3.3 Fabry-Perot strain sensors Extrinsic Fabry-Perot Interferometers (EFPIs) are constituted by a capillary silica tube containing two cleaved optical fibers facing each other’s, but leav-ing an air gap of a few microns or tens of microns between them. When light is launched into one of the fibers, a back-reflected interference signal is ob-tained. This is due to the reflection of the incoming light on the glass-to-air and on air-to-glass interfaces. This interference can be demodulated using coherent or low-coherence techniques to reconstruct the changes in the fiber spacing. Since the two fibers are attached to the capillary tube near its two extremities (with a typical spacing of 10 mm), the gap change will corre-spond to the average strain variation between the two attachment points . (Habel et al 1998 and Habel et al. 1994).
3.4 Raman Distributed Temperature Sensors Raman scattering is the result of a non-linear interaction between the light traveling in a fiber and silica. When an intense light signal is shined into the fiber, two frequency-shifted components called respectively Raman Stokes and Raman anti-Stokes will appear in the back-scattered spectrum. The rela-tive intensity of these two components depends on the local temperature of the fiber. If the light signal is pulsed and the back-scattered intensity is re-corded as a function of the round-trip time, it becomes possible to obtain a temperature profile along the fiber (Dakin et al. 1986). Typically a tempera-ture resolution of the order of 1°C and a spatial resolution of less than 1m over a measurement range up to 10 km are obtained for multi-mode fibers. A new system based on the use of singlemode fibers should extend the range to about 30km with a spatial resolution of 8 m and a temperature resolution of 2°C.
3.5 Brillouin Distributed Temperature sensors Brillouin scattering sensors show an interesting potential for distributed strain and temperature monitoring (Karashima et al. 1990). Systems able to measure strain or temperature variations of fibers with length up to 50 km with spatial resolution down in the meter range are now demonstrating their potential in field applications. For temperature measurements, the Brillouin

ISISS'2005, International Symposium on Innovation & Sustainability of Structures in Civil Engineer-ing, Nanjing, China, November 20-22, 2005 Page 6 of 16
sensor is a strong competitor to systems based on Raman scattering, while for strain measurements it has practically no rivals. Brillouin scattering is the result of the interaction between optical and sound waves in optical fibers. Thermally excited acoustic waves (phonons) produce a periodic modulation of the refractive index. Brillouin scattering occurs when light propagating in the fiber is diffracted backward by this moving grating, giving rise to a frequency-shifted component by a phenomenon simi-lar to the Doppler shift. This process is called spontaneous Brillouin scatter-ing. Acoustic waves can also be generated by injecting in the fiber two counter-propagating waves with a frequency difference equal to the Brillouin shift. Through electrostriction, these two waves will give rise to a traveling acous-tic wave that reinforces the phonon population. This process is called stimu-lated Brillouin amplification. If the probe signal consists in a short light pulse and its reflected intensity is plotted against its time of flight and frequency shift, it will be possible to obtain a profile of the Brillouin shift along the fi-ber length. The most interesting aspect of Brillouin scattering for sensing applications resides in the temperature and strain dependence of the Brillouin shift (Niklès et al. 1997). This is the result of the change the acoustic velocity according to variation in the silica density. The measurement of the Brillouin shift can be approached using spontaneous or stimulated scattering. The main challenge in using spontaneous Brillouin scattering for sensing applications resides in the extremely low level of the detected signal. This requires sophisticated signal processing and relatively long integration times. A commercial system based on spontaneous Brillouin scattering is available from ANDO (Japan).
Figure 3: DiTeSt Reading Unit

ISISS'2005, International Symposium on Innovation & Sustainability of Structures in Civil Engineer-ing, Nanjing, China, November 20-22, 2005 Page 7 of 16
Systems based on the stimulated Brillouin amplification have the advantage of working with a relatively stronger signal but face another challenge. To produce a meaningful signal the two counter-propagating waves must main-tain an extremely stable frequency difference. This usually requires the syn-chronization of two laser sources that must inject the two signals at the oppo-site ends of the fiber under test. The MET (Metrology laboratory) group at Swiss Federal Institute of Technology in Lausanne (EPFL) proposed a more elegant approach (Niklès et al. 1994). It consists in generating both waves from a single laser source using an integrated optics modulator. This ar-rangement offers the advantage of eliminating the need for two lasers and in-trinsically insures that the frequency difference remains stable independently from the laser drift. SMARTEC and Omnisens (Switzerland) commercialize a system based on this setup and named DiTeSt (Figure 3). It features a measurement range of 10 km with a spatial resolution of 1 m or a range of 25 km with a resolution of 2 m. The strain resolution is 2 µε and the temperature resolution 0.1°C. The system is portable and can be used for field applica-tions. Since the Brillouin frequency shift depends on both the local strain and tem-perature of the fiber, the sensor setup will determine the actual sensitivity of the system. For measuring temperatures it is sufficient to use a standard tele-communication cable. These cables are designed to shield the optical fibers from an elongation of the cable. The fiber will therefore remain in its un-strained state and the frequency shifts can be unambiguously assigned to temperature variations. If the frequency shift of the fiber is known at a refer-ence temperature it will be possible to calculate the absolute temperature at any point along the fiber. Measuring distributed strains requires a specially designed sensor. A mechanical coupling between the sensor and the host structure along the whole length of the fiber has to be guaranteed. To resolve the cross-sensitivity to temperature variations, it is also necessary to install a reference fiber along the strain sensor. Similarly to the temperature case, knowing the frequency shift of the unstrained fiber will allow an absolute strain measurement.
4 SELECTED PROJECTS
This section will introduce a few projects showing an effective use of fiber optic technology for the health monitoring of different types of structures, with different aims and during different phases of the structure’s lifetime.

ISISS'2005, International Symposium on Innovation & Sustainability of Structures in Civil Engineer-ing, Nanjing, China, November 20-22, 2005 Page 8 of 16
4.1 Expo.02 Piazza Pinocchio Once every generation, Switzerland treats itself to a National Exhibition commissioned by the Swiss Confederation. Expo 02 was spread out in five “Arteplage” over a whole region: the land of the three lakes, on the shores of the lakes of Biel, Murten and Neuchâtel, which are located in the northwest of Switzerland. Each “Arteplage” relates to a theme, which is reflected in its architectures and exhibitions. The “Arteplage” of Neuchâtel was related to “Nature and Artificiality”; a big steel-wood whale eating a village represents the fairy tale named “Pinocchio” from the Italian writer Collodi. The “Piazza Pinocchio” was built together with other exposition buildings on one large artificial peninsula.
Figure 4: Piazza Pinocchio and the big
wooden whale
Figure 5: Piazza Pinocchio control center with load indicators
The belly of the whale (Figure 4) holds the exposition dedicated to robotic and artificial intelligence, while the rest of the village was developed on two floors with steel piles / beams and wood walls and floors.
To guarantee that the life loads generated by the visitors accessing the plat-form would never exceed the design loads, it was decided to install a real-time monitoring system that would guide the exhibition personnel in granting or not the access to additional visitors. The SOFO system based on low co-herence fiber optic deformation sensors was selected for this project. 31 SOFO sensors and 31 thermocouples were installed on steel piles to monitor real time visitor’s live loads. The main requirements were: real-time com-puter results display of the live loads during 18 hours a day (Figure 5), auto-matic thermal-induced strain compensation, real-time warnings and pre-warnings for each single pile, automatic phone calls produced when reaching warning thresholds and remote monitoring for complete management of the monitoring system. The system operated flawlessly during 6 months and generated a few pre-warning, no warning and no false alerts. This project is a

ISISS'2005, International Symposium on Innovation & Sustainability of Structures in Civil Engineer-ing, Nanjing, China, November 20-22, 2005 Page 9 of 16
nice example of real-time monitoring with integration in a facility manage-ment system. If the selective access of the visitors can be considered a form of actuation, we can even describe the Piazza Pinocchio as a true “Smart Structure”.
4.2 Colle Isarco Bridge The development of a life extension and/or replacement strategy for highway structures is a crucial point in an effective bridge management system. An example of a global monitoring approach in establishing a bridge manage-ment system is represented by the project of the Colle d’Isarco viaduct on the Italian Brenner-Highway A22. The section of the highway that is subject to monitoring activities includes four columns, each of them supporting asym-metrical cantilevers in the north and south direction as can bee seen in Figure 6.
Figure 6: View of the Colle Isarco Bridge on the Brennero Highway in Italy
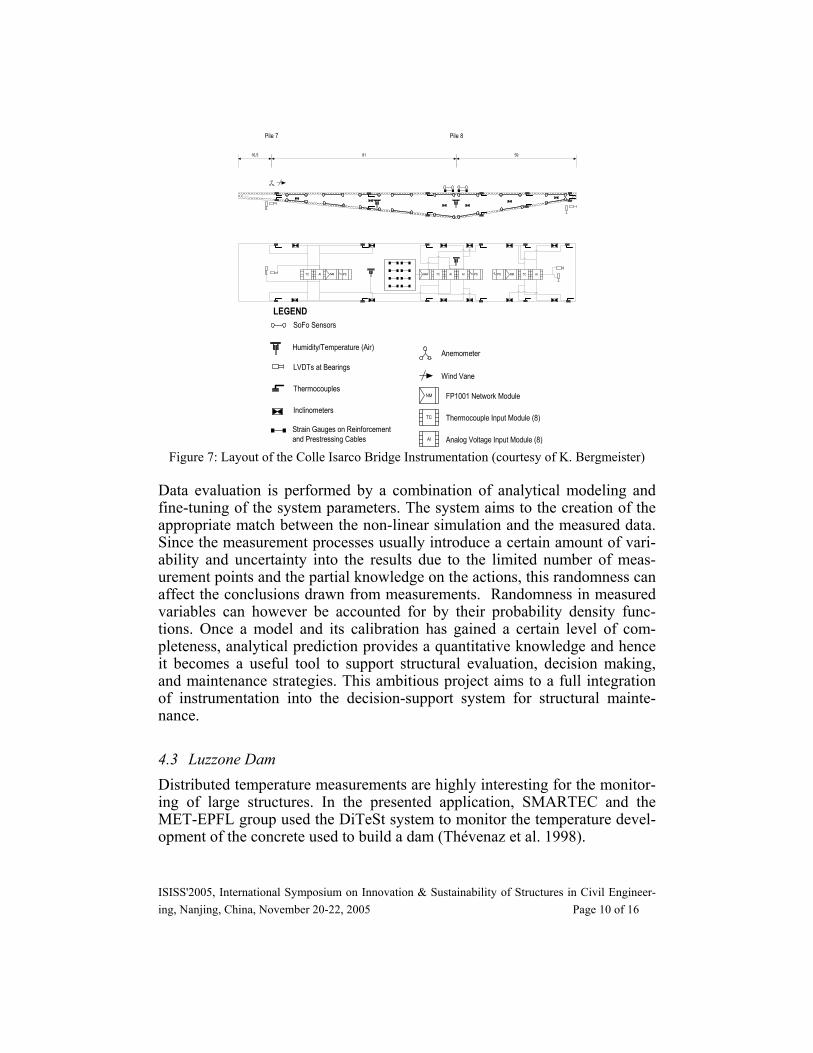
The overall length of this section is 378 m. The height of the girders near the supports number 8 and 9 is 11 m, at the supports 7 and 10 the height is 4.50 m. The girders have a uniform width of 6 m, the arrangement for each road bed is approximately 11 m wide. A wide set of sensors have been installed, including both traditional and SOFO fiber optic sensors and, due to the large dimensions of the section, a data acquisition system able to collect widely distributed sensing units was also installed (Figure 7). Wireless serial com-munication is used to transfer the measured data from the almost inaccessible locations on the bridge to the location of the personal computer used to evaluate the measured data.
ISISS'2005, International Symposium on Innovation & Sustainability of Structures in Civil Engineer-ing, Nanjing, China, November 20-22, 2005 Page 10 of 16
16,5 91 59
AITC NM AITCNM AITCNM
Pile 7 Pile 8
AIPS PSPS
LEGEND
Humidity/Temperature (Air)
LVDTs at Bearings
Thermocouples
Inclinometers
Strain Gauges on Reinforcementand Prestressing Cables
SoFo Sensors
Anemometer
Wind Vane
AI
TC
NM FP1001 Network Module
Thermocouple Input Module (8)
Analog Voltage Input Module (8) Figure 7: Layout of the Colle Isarco Bridge Instrumentation (courtesy of K. Bergmeister)
Data evaluation is performed by a combination of analytical modeling and fine-tuning of the system parameters. The system aims to the creation of the appropriate match between the non-linear simulation and the measured data. Since the measurement processes usually introduce a certain amount of vari-ability and uncertainty into the results due to the limited number of meas-urement points and the partial knowledge on the actions, this randomness can affect the conclusions drawn from measurements. Randomness in measured variables can however be accounted for by their probability density func-tions. Once a model and its calibration has gained a certain level of com-pleteness, analytical prediction provides a quantitative knowledge and hence it becomes a useful tool to support structural evaluation, decision making, and maintenance strategies. This ambitious project aims to a full integration of instrumentation into the decision-support system for structural mainte-nance.
4.3 Luzzone Dam Distributed temperature measurements are highly interesting for the monitor-ing of large structures. In the presented application, SMARTEC and the MET-EPFL group used the DiTeSt system to monitor the temperature devel-opment of the concrete used to build a dam (Thévenaz et al. 1998).

ISISS'2005, International Symposium on Innovation & Sustainability of Structures in Civil Engineer-ing, Nanjing, China, November 20-22, 2005 Page 11 of 16
The Luzzone dam was recently raised by 17 meters to increase the capacity of the reservoir (Figure 9). The raising was realized by successively concret-ing 3m thick blocks. The tests concentrated on the largest block to be poured, the one resting against the rock foundation on one end of the dam. An ar-mored telecom cable installed in serpentine during concrete pouring consti-tuted the Brillouin sensor.
303030
Figure 9: Luzzone Dam raising works
Figure 10: Temperature measurements in the Luzzone Dam 15 days after concrete pouring
The temperature measurements started immediately after pouring and ex-tended over 6 months. The measurement system proved reliable even in the demanding environment present at the dam (dust, snow, and temperature ex-cursions). The temperature distributions after 15 and 55 days from concrete pouring are shown in Figure 10. Comparative measurements obtained locally with conventional thermocouples showed agreement within the error of both systems. This example shows how it is possible to obtain a large number of measure-ment points with relatively simple sensors. The distributed nature of Brillouin sensing make it particularly adapted to the monitoring of large structures were the use of more conventional sensors would require extensive cabling.
4.4 Bitumen Joint Monitoring Plavinu hes is a dam belongs to the complex of three most important hydro-power stations on the Daugava River in Latvia (see figure 11). In terms of capacity this is the largest hydropower plant in Latvia and is considered to be the third level of the Daugavas hydroelectric cascade. It was constructed 107 km distant from the firth of Daugava and is unique in terms of its construc-tion - for the first time in the history of hydro-construction practice; a hydro-power plant was built on clay-sand and sand-clay foundations with a maxi-

ISISS'2005, International Symposium on Innovation & Sustainability of Structures in Civil Engineer-ing, Nanjing, China, November 20-22, 2005 Page 12 of 16
mum pressure limit of 40 m. The HPP building is merged with a water spill-way. The entire building complex is extremely compact. There are ten hydro-aggregates installed at the hydropower plant and its current capacity is 870,000 kW.
Figure 11: Plavinu dam in Latvia
Figure 12: SMARTape installation in the in-
spection gallery.
One of the dam inspection galleries coincides with a system of three bitumen joints that connects two separate blocks of the dam. Due to abrasion of water, the joints lose bitumen and the redistribution of loads in concrete arms ap-pears. Since the structure is nearly 40 years old, the structural condition of the concrete can be compromised due to ageing. Thus, the redistribution of loads can provoke damage of concrete arm and as a consequence the inunda-tion of the gallery. In order to increase the safety and enhance the manage-ment activities it was decided to monitor the average strain in the concrete arm next to the joints. The DiTeSt system with SMARTape deformation (see Figure 12) sensor and Temperature Sensing Cable is used for this. The sen-sors were installed by company VND2 with SMARTEC support and config-ured remotely from the SMARTEC office. Threshold detection software with SPST (open-ground) module was installed in order to send pre-warnings and warnings from the DiTeSt instrument to the Control Office.
4.5 Gas Pipeline Monitoring About 500 meters of a buried, 35 years old gas pipeline, located near Rimini, Italy, lie in an unstable area. Distributed strain monitoring could be useful in order to improve vibrating wire strain gauges monitoring system, actually used in the site. The landslide progress with time and could damage pipelines

ISISS'2005, International Symposium on Innovation & Sustainability of Structures in Civil Engineer-ing, Nanjing, China, November 20-22, 2005 Page 13 of 16
up to be put out of service. Three symmetrically disposed vibrating wires were installed in several sections at a distance typically of 50/100 m chosen as the most stressed ones according a preliminary engineering evaluation. These sensors were very helpful, but could not fully cover the length of the pipeline and only provide local measurements.
Figure 13: SMARTape on the gas pipeline.
Different types of distributed sensors were used: SMARTape and Tempera-ture Sensing Cable. Three parallel lines constituted of five segments of SMARTape sensor were installed over whole concerned length of the pipe-line (see figure 9). The lengths of segments were ranged from 71 m to 132 m, and the position of the sensors with respect to the pipeline axis were at 0°, 120° and –120° approximately. The strain resolution of the SMARTape is 20 micro-strains, with spatial resolution of 1.5 m (and an acquisition range of 0.25m) and provides the monitoring of average strains, average curvatures and deformed shape of the pipeline. The Temperature Sensing Cable was in-stalled onto the upper line (0°) of the pipeline in order to compensate the strain measurements for temperature. The temperature resolution of the sen-sor is 1°C with the same resolution and acquisition of the SMARTape. All the sensors are connected to a Central Measurement Point by means of exten-sion optical cables and connection boxes. They are read from this point using a single DiTeSt® reading unit. Since the landslide process is slow, the meas-urements sessions are performed manually once a month. In case of earth-quake a session of measurements is performed immediately after the event. All the measurements obtained with the DiTeSt® system are correlated with

ISISS'2005, International Symposium on Innovation & Sustainability of Structures in Civil Engineer-ing, Nanjing, China, November 20-22, 2005 Page 14 of 16
the measurements obtained with vibrating wires. At present stage, the sensors have been measured for a period of two years, providing interesting informa-tion on the deformation induced by burying and by the landslide progression. A gas leakage simulation was also performed with success using the tempera-ture sensing cable.
5 CONCLUSIONS
The monitoring of new and existing structures is one of the essential tools for a modern and efficient management of the infrastructure network. Sensors are the first building block in the monitoring chain and are responsible for the accuracy and reliability of the data. Progress in the sensing technology can therefore be produced by more accurate measurements, but also from systems that are easier to install, use and maintain. In the recent years, fiber optic sen-sors have moved the first steps in structural monitoring and in particular in civil engineering. Different sensing technologies have emerged and quite a few have evolved into commercial products. It is difficult to find a common reason for the success of so diverse types of sensors, each one seems to have found a niche where it can offer performance that surpass or complement the ones of the more traditional sensors. If three characteristics of fiber optic sensors should be highlighted as the probable reason of their present and future success, I would cite the stability of the measurements, the potential long-term reliability of the fibers and the possi-bility of performing distributed and remote measurements. Furthermore, the much larger market of fiber optic telecommunication offers an interesting po-tential for cost reduction in most components used for sensing applications. In the near future it is therefore to expect that fiber optic sensors will con-solidate their presence in the structural sensing industry.
6 AKNOWLEDGEMENTS
The author is indebted to Prof. K. Bergmeister, U. Santa, B. Glisic, M. Nik-lès, L. Thévenaz, VND2 Ltd (Latvia) and SNAM Rete Gas (Italy) for provid-ing information on the presented application examples.
ISISS'2005, International Symposium on Innovation & Sustainability of Structures in Civil Engineer-ing, Nanjing, China, November 20-22, 2005 Page 15 of 16
REFERENCES
Brönnimann R. et al. 1998. Packaging of Fiber Optic Sensors for Civil Engineering Applica-tions", Symposium DD, Reliability of Photonics Materials and Structures, San Francisco, paper DD7.2
Bugaud M. et al. 1998. Health Monitoring of Composite Plastic Waterworks Lock Gates us-ing in-Fiber Bragg Grating Sensors", 4th European Conference on Smart Structures and Materials, Harrogate, UK
Dakin, J. P. et al. 1986. Distributed optical fiber Ra-man temperature sensor using a semi-conductor light source and detector, Proc, IEE Colloq. on Distributed Optical Fiber sen-sors
Falco & Parriaux 1992. Structural metal coatings for distributed fiber sensors, Opt. Fiber Sens. Conf. Proc., pp. 254
Ferdinand P. et al. 1997. Application of Bragg grating sensors in Europe, 12th International conference on OFS ’97- Optical Fiber Sensors, Williamsbourg, OSA Technical Digest Series, Vol. 16, pp. 14-19
Ferdinand P. et al. 1994. Mine Operating Accurate Stability Control with Optical Fiber Sens-ing and Bragg Grating technology: the Brite-EURAM STABILOS Project, OFS 10 Glasgow, pp. 162-166. Extended paper: Journal of Lightwave Technology, Vol. 13, No. 7, pp. 1303-1313, 1995
Ferdinand P. et al. 2002. "Potential Applications for Optical Fiber Sensors and Networks within the Nuclear Power Industry" in Optical Fiber Sensing Technology, J. M. Lopez-Higuera ed., Universidad de Cantabria
Habel W. & Hofmann D. 1994. Determination of Structural Parameters Concerning Load Capacity Based on Fiber Fabry-Perot-Interferometers, Proc. SPIE, Vol. 2361, pp. 176-179
Habel W. et al. 1998. Non-reactive Measurement of Mortar Deformation at Very Early Ages by Means of Embedded Compliant Fiber-optic Micro Strain Gages, 12th Engineering Mechanics ASCE Conference, La Jolla USA
Inaudi D. 1997a. Fiber optic smart sensing, Optical Measurement techniques and applica-tions, P. K. Rastogi editor, Artech House, pp. 255-275
Inaudi D. 1997b. Field testing and application of fiber op-tic displacement sensors in civil structures, 12th International conference on OFS ’97- Optical Fiber Sensors, Williams-burg, OSA Technical Digest Series, Vol. 16, pp. 596-599
Inaudi D. et al. 1994. Low-coherence deformation sensors for the monitoring of civil-engineering structures, Sensor and Actuators A, Vol. 44, pp. 125-130
Inaudi D. et al. 1997. Embedded and surface mounted fiber optic sensors for civil structural monitoring, Smart Structures and Materials Conference, San Diego, SPIE Volume 3044, pp. 236-243
Karashima T. et al. 1990. Distributed Temperature sensing using stimulated Brillouin Scat-tering in Optical Silica Fibers, Optics Letters, Vol. 15, pp. 1038
Kersey A. 1997. Optical Fiber Sensors, Optical Measurement techniques and applications, P. K. Rastogi editor, Artech House, pp. 217-254
Niklès M. et al. 1994. Simple Distributed temperature sensor based on Brillouin gain spec-trum analysis, Tenth International Conference on Optical Fiber Sensors OFS 10, Glas-gow, UK, SPIE Vol. 2360, pp. 138-141
Niklès M. et al. 1997. Brillouin Gain Spectrum Characterization in Single-Mode Optical Fi-bers", Journal of Lightwave Technology, Vol. 15, No. 10, pp. 1842-1851

ISISS'2005, International Symposium on Innovation & Sustainability of Structures in Civil Engineer-ing, Nanjing, China, November 20-22, 2005 Page 16 of 16
Thévenaz L. et al. 1998. Truly Distributed Strain and Temperature Sensing Using Embedded Optical Fibers, Smart Structure and Materials Conference, San Diego USA, SPIE Vol. 3330, pp. 301-314
Udd E 1995. Fiber optic smart structures, Wiley, New York, 1995 Udd E. 1991. Fiber Optic Sensors, Wiley Vohra S. T. et al. 1998. Quasi-Static Strain Monitoring During the Push Phase of a Box-
Girder Bridge Using Fiber Bragg Grating Sensors", European Workshop on Optical Fi-bre Sensors, Peebls Hydro, UK