Embed Size (px)
Citation preview

National Aeronautics and Space Administration
Overview of Fatigue and Damage Tolerance Performance of SLM Alloy 718
Kristin MorganMSFC Science and Technology Office
Douglas WellsMSFC Damage Tolerance Branch
21 June 20162016 National Space and Missile Materials Symposium
https://ntrs.nasa.gov/search.jsp?R=20160007853 2018-06-25T01:50:03+00:00Z

The SLM Process
S2

MSFC SLM Capability
S3
M1 M2 XLine 1000R
Procured 2015
Build envelope250 x 250 x 250 mm
Laser systemFiber laser 400 W
No glovebox
Procured 2012
Build envelope250 x 250 x 280 mm
Laser systemFiber laser 400 W
Inert atmosphere glovebox
Procured 2015
Build envelope:630 x 400 x 500 mm
Laser system: Fiber laser 1 kW
Inert atmosphere glovebox

Stable Alloy 718 Metallurgical Process
As-built microstructure Heat treated microstructure
Stress Relief: 1065°C for 1.5 hours; furnace cool.
HIP: 1165°C, 100 MPa, 3-4 hours
AMS 5664 Solution Treat: 1066°C for 1 hour; air cool.
AMS 5664 Age: 760°C for 10 hours; furnace cool to 650°C; treat for total of 20 hours.
S4

SLM Alloy 718 Typical Build Properties
S5
• Typical tensile witness test curve for SLM 718.• Ultimate Tensile Strength: ~ 1380 MPa• Yield Strength: ~ 1170 MPa• Fracture Elongation: > 20%

• A build of test specimens was produced; all indications were that the build was successful.
• Witness tensile testing revealed lower than expected material properties.
S6
SLM 718 Defective Build

SLM 718 Defective Build
S7
• Metallographic examination revealed lack of fusion defects in the material.
• Source was eventually determined to be a clogged ventilation duct that was causing attenuation of the laser and allowing combustion by-products to settle on the powder bed.

SLM 718 High Cycle Fatigue
Key Variables
1. OrientationZ – loading axis perpendicular to powder bed plane.XY – loading axis parallel to powder bed plane.45° – loading axis 45° from powder bed plane.
2. Surface FinishLow Stress Ground – ASTM E466 finishing procedureAs-Built – Surface finish from the SLM machine
S8

Low stress ground; minimal effect from orientation
High Cycle Fatigue of SLM 718
MMPDS reference curve is wrought N07718 bar stock, heat
treated to AMS 5662, from MMPDS-08 Figure 6.3.5.1.8 (f).
Plotted fits are power-law fits of the form Y = axb+c
S9

MMPDS Wrought data vs.Low Stress Ground, Room Temperature, R = 0.1
High Cycle Fatigue of SLM 718
MMPDS reference curve is wrought N07718 bar stock, heat
treated to AMS 5662, from MMPDS-08 Figure 6.3.5.1.8 (f).
Plotted fits are power-law fits of the form Y = axb+c
S10

Z-oriented, as-built surface finish; decreased fatigue life
High Cycle Fatigue of SLM 718
MMPDS reference curve is wrought N07718 bar stock, heat
treated to AMS 5662, from MMPDS-08 Figure 6.3.5.1.8 (f).
Plotted fits are power-law fits of the form Y = axb+c
S11

45°-oriented, as-built surface finish; comparable fatigue life 45° tend to be rougher than Z
High Cycle Fatigue of SLM 718
MMPDS reference curve is wrought N07718 bar stock, heat
treated to AMS 5662, from MMPDS-08 Figure 6.3.5.1.8 (f).
Plotted fits are power-law fits of the form Y = axb+c
S12

High Cycle Fatigue of SLM 718
Fatigue life decreases with increasing surface roughness.
Low stress ground
Tumbled & Electropolished Tumbled & Chem Milled
As-built
S13
Z-oriented, lathe-turned surface for faster machining turnaround. Slight decrease in life from low stress ground finish.
High Cycle Fatigue of SLM 718
MMPDS reference curve is wrought N07718 bar stock, heat
treated to AMS 5662, from MMPDS-08 Figure 6.3.5.1.8 (f).
Plotted fits are power-law fits of the form Y = axb+c
S14

Z-oriented, tumbled then electropolished.
High Cycle Fatigue of SLM 718
MMPDS reference curve is wrought N07718 bar stock, heat
treated to AMS 5662, from MMPDS-08 Figure 6.3.5.1.8 (f).
Plotted fits are power-law fits of the form Y = axb+c
S15

Z-Oriented, tumbled then chem milled.
High Cycle Fatigue of SLM 718
MMPDS reference curve is wrought N07718 bar stock, heat
treated to AMS 5662, from MMPDS-08 Figure 6.3.5.1.8 (f).
Plotted fits are power-law fits of the form Y = axb+c
S16

Vendor Round Robin
- Identical builds were procured from three third-party SLM vendors; one build was provided by MSFC.
- The specimens were heat treated per MSFC guidance, although allowances were made for vendors with existing mature processes.
- A series of comparison testing was done to evaluate the quality of the material.
S17

Z-oriented, low stress ground surface finish. Compared to M1 and wrought reference curves.
Round Robin High Cycle Fatigue of SLM 718
S18

Fatigue Crack Growth of SLM 718
Round Robin Specifications
• 3 specimens from each build
• Z-XY test orientation
• Post-processing same as fatigue specimens
Testing Methodology
• Tested according to ASTM E647
• R = 0.1 and R = 0.7 data shown
• Compression pre-cracking procedure (CPC)
S19

Compression Pre-Cracking
• Compression-compression loading used to generate a crack at the notch root of a c(T) specimen.
• May produce more conservative threshold and near-threshold crack growth rates.
• Following CPC procedure detailed by Newman and Yamada.
S20

Reference: FCG of Wrought Alloy 718 at R = 0.1
• Wrought Inconel-718 alloy obtained from Boeing-Rockwell. Tested using the ASTM LR test method and CA loading.
• Garr KR, Boeing-Rocketdyne Propulsion and Power Company, as referenced by Newman, J.C., Jr. and Yamada, Y., “Compression Precracking Methods to Generate Near-Threshold Fatigue-Crack-Growth-Rate Data”, International Journal of Fatigue, Vol. 32, 2010, p.879-885.
S21

• Wrought Inconel-718 alloy obtained from Boeing-Rockwell. Tested using the CPCA loading.
• Newman, J.C., Jr. and Yamada, Y., “Compression Precracking Methods to Generate Near-Threshold Fatigue-Crack-Growth-Rate Data”, International Journal of Fatigue, Vol. 32, 2010, p.879-885.
Reference: FCG of Wrought Alloy 718 at R = 0.1
S22

FCG of SLM 718 vs Wrought 718 at R = 0.1
• MSFC’s SLM 718 M1 data included as reference. This data is not part of the Round Robin.
• Produced using ASTM LR and CA loading.
S23

FCG of SLM 718: MSFC results at R = 0.1
• MSFC Round-Robin data.
• Consistent with M1 data.
S24

FCG of SLM 718: Lab B results at R = 0.1
• Lab B - Higher observed growth rates than MSFC data.
S25

FCG of SLM 718: Lab C results at R = 0.1
• Lab C - Consistent with MSFC data.
S26

FCG of SLM 718: Lab D results at R = 0.1
• Lab D - Consistent with MSFC data. CPLR only.
S27

FCG of SLM 718: All results at R = 0.1
• Only Lab B varied from the MSFC data.
• All of the Round Robin data at R = 0.1 was self-consistent.
S28

• Wrought Inconel-718 alloy obtained from Boeing-Rockwell. Tested using the ASTM LR test method and CA loading.
• Garr KR, Boeing-Rocketdyne Propulsion and Power Company, as referenced by Newman, J.C., Jr. and Yamada, Y., “Compression Precracking Methods to Generate Near-Threshold Fatigue-Crack-Growth-Rate Data”, International Journal of Fatigue, Vol. 32, 2010, p.879-885.
Reference: FCG of Wrought Alloy 718 at R = 0.7
S29

• Wrought Inconel-718 alloy obtained from Boeing-Rockwell. Tested using the CPLR test method and CA loading.
• Newman, J.C., Jr. and Yamada, Y., “Compression Precracking Methods to Generate Near-Threshold Fatigue-Crack-Growth-Rate Data”, International Journal of Fatigue, Vol. 32, 2010, p.879-885.
Reference: FCG of Wrought Alloy 718 at R = 0.7
S30

FCG of SLM 718 vs Wrought 718 at R = 0.1
• SLM 718 M1 data included as a reference. This data is not part of the Round-Robin.
• Produced using ASTM LR and CA loading.
• Higher observed growth rates compared to wrought 718 near-threshold.
S31

FCG of SLM 718: MSFC results at R = 0.7
• MSFC Round Robin Build is consistent with M1 data.
S32

FCG of SLM 718: Lab B results at R = 0.7
• Lab B - Consistent with MSFC data at R = 0.7
S33

FCG of SLM 718: Lab C results at R = 0.7
• Lab C - Lower crack growth rates near-threshold compared to MSFC data. More closely follows Newman data.
S34

FCG of SLM 718: Lab D results at R = 0.7
• Lab D - Lower crack growth rates near-threshold compared to M1 data. More closely follows Newman data.
S35

• MSFC & Lab B: Consistent with M1 data
• Lab C & Lab D: Consistent with Newman data
FCG of SLM 718: All results at R = 0.7
S36

Fracture Toughness of SLM Alloy 718
Round Robin Specifications• 2 specimens from each build• Z-XY test orientation• Post-processing same as fatigue specimens
Test Methodology• Tested according to ASTM E1820
S37

Reference: Fracture Toughness of SLM Alloy 718
S38

Reference: Fracture Toughness of SLM Alloy 718
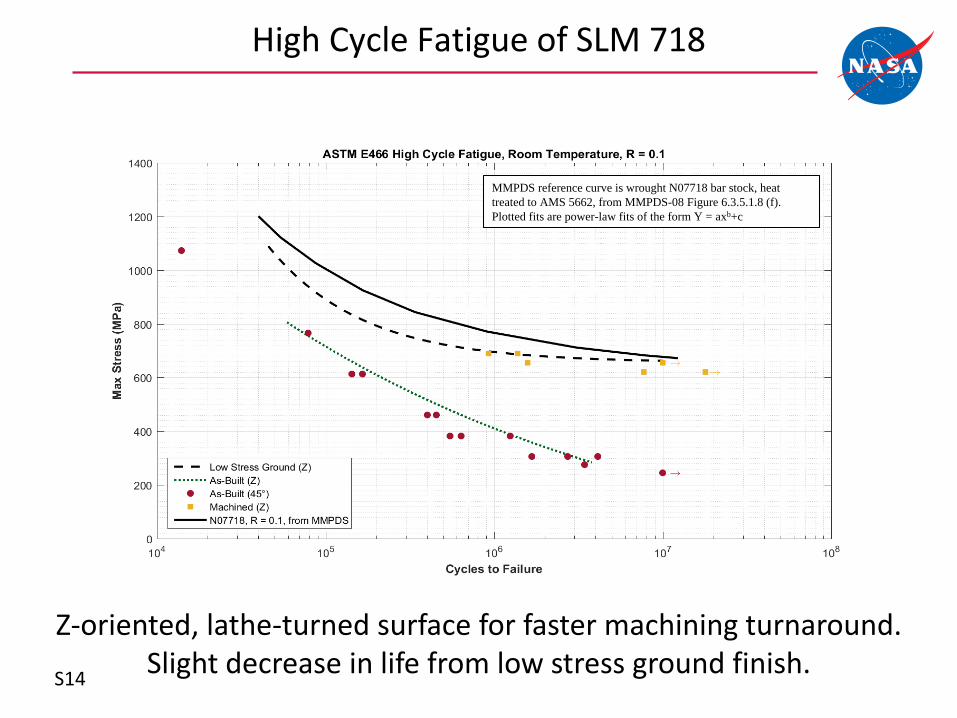
- Fits are power law regression line
specified in ASTM E1820.
- Fits of highest and lowest value
obtained from M1 machine for
reference.
S39

Fracture Toughness of SLM Alloy 718: MSFC Results
S40

Fracture Toughness of SLM Alloy 718: Lab B Results
S41

Fracture Toughness of SLM Alloy 718: Lab C Results
S42
Fracture Toughness of SLM Alloy 718: Lab D Results
S43

Fracture Toughness of SLM Alloy 718: All Results
S44

Summary of Observations
Tensile
• Reduced elongation is good indicator of poor quality build.
Fatigue
• Surface finish effects were stronger than build orientation influence.
• Surface finish effects dominated internal defects for a defective build.
• Surface finish effects appear to more strongly influence HCF than LCF.
• Mostly consistent da/dN data across 4 laboratories.
Fracture
• Similar initiation toughness values; more variability in R curve shape (tearing modulus).
S45

Propulsion Design and Development
S46

Additive Manufacturing Demonstrator
Nozzle
Turbine
Discharge
Duct
MFV (Hidden)Part Count (Approx): 1 vs. 5
FTPPart Count (Approx): 22 vs. 40
MCC
CCV
(Hidden)Part Count (Approx): 1 vs. 5
InjectorPart Count (Approx): 6 vs. 255
Thrust Structure
Mixer (Hidden)Part Count: 2 vs. 8
MOVPart Count (Approx): 1 vs. 6
OTBVPart Count (Approx): 1 vs. 5
S47

Transforming Liquid Propulsion Systems DDT&E
Main Fuel Valve
Cryo Test
Advanced Manufacturing
Demonstrator Test Stand
Full Scale
Injector Swirl
Elements
Advanced Manufacturing
Demonstrator (AMD)
Investment directly benefits
prototype engine development
and indirectly enables and
facilitates technology across
multiple current and future
activities for NASA and industry.Methane
Lander
Nuclear Thermal
Propulsion (NTP)
Exploration Upper
Stage (EUS)
LCUSP MCC
Liner
Fuel Turbopump
Performance Test
in Hydrogen
Sub-scale Injector Test
Fuel Scale Injector
Swirl ElementsFull Scale Injector
Water Flow
S28

Breadboard Testing
S49

Questions?