Embed Size (px)
Citation preview


Overview
We showed one way to read data into R using read_csv and read.csv. In thismodule, we will show you how to:
1. Select specific elements of an object by an index or logical condition
2. Renaming columns of a data.frame
3. Subset rows of a data.frame
4. Subset columns of a data.frame
5. Add/remove new columns to a data.frame
6. Order the columns of a data.frame
7. Order the rows of a data.frame
2/55


Loading in dplyr and tidyverse
Note, when loading dplyr, it says objects can be “masked”/conflicts. That meansif you use a function defined in 2 places, it uses the one that is loaded in last.
library(tidyverse)
── Attaching packages ─────────────────────────────────────── tidyverse 1.3.0 ──
✔ ggplot2 3.2.1 ✔ purrr 0.3.3 ✔ tibble 2.1.3 ✔ stringr 1.4.0 ✔ tidyr 1.0.0 ✔ forcats 0.4.0 ✔ readr 1.3.1
── Conflicts ────────────────────────────────────────── tidyverse_conflicts() ──✖ dplyr::filter() masks stats::filter() ✖ dplyr::lag() masks stats::lag()
4/55

Loading in dplyr and tidyverse
For example, if we print filter, then we see at the bottom namespace:dplyr,which means when you type filter, it will use the one from the dplyr package.
filter
function (.data, ..., .preserve = FALSE) { UseMethod("filter") } <bytecode: 0x7fb65c85f6f0> <environment: namespace:dplyr>
5/55
Loading in dplyr and tidyverse
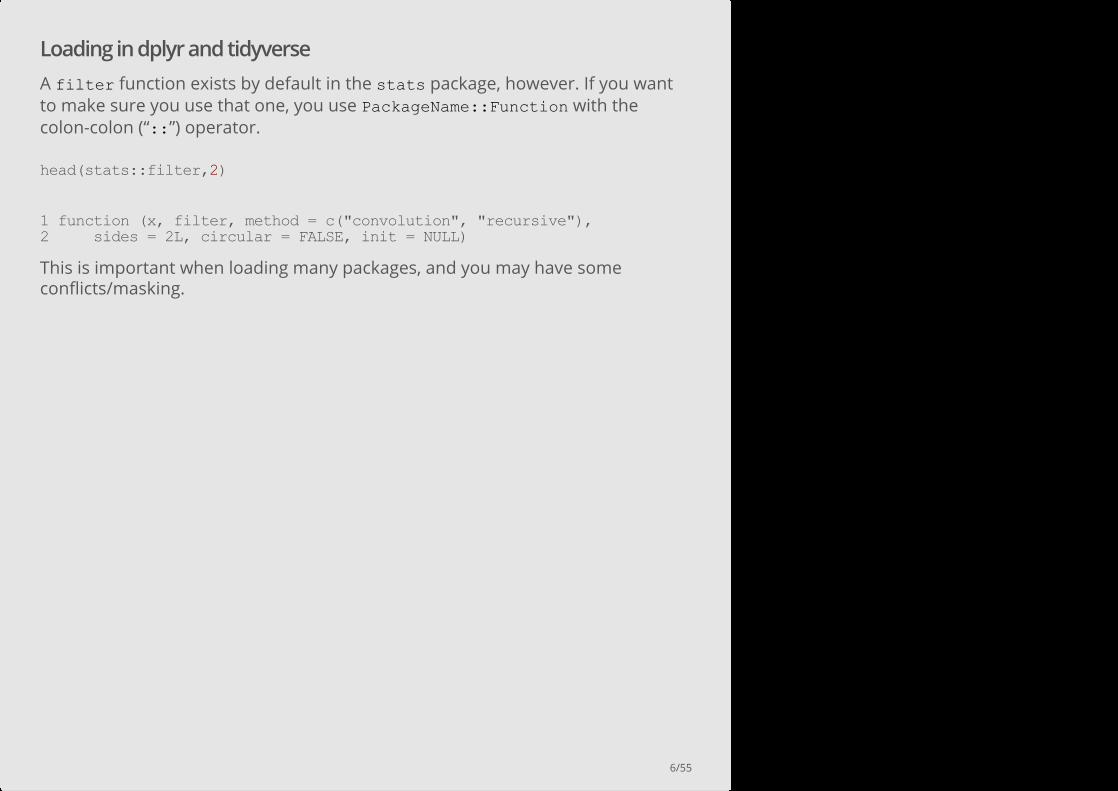
A filter function exists by default in the stats package, however. If you wantto make sure you use that one, you use PackageName::Function with thecolon-colon (“::”) operator.
This is important when loading many packages, and you may have someconflicts/masking.
head(stats::filter,2)
1 function (x, filter, method = c("convolution", "recursive"), 2 sides = 2L, circular = FALSE, init = NULL)
6/55

Creating a data.frame to work with
Here we use one of the datasets that comes with jhu called jhu_cars, which is a(copy of another called mtcars) create a toy data.frame named df using randomdata:
data(jhu_cars) df = jhu_cars # df is a copy of jhu_cars head(df) # changing df does **not** change jhu_cars
car mpg cyl disp hp drat wt qsec vs am gear carb 1 Mazda RX4 21.0 6 160 110 3.90 2.620 16.46 0 1 4 4 2 Mazda RX4 Wag 21.0 6 160 110 3.90 2.875 17.02 0 1 4 4 3 Datsun 710 22.8 4 108 93 3.85 2.320 18.61 1 1 4 1 4 Hornet 4 Drive 21.4 6 258 110 3.08 3.215 19.44 1 0 3 1 5 Hornet Sportabout 18.7 8 360 175 3.15 3.440 17.02 0 0 3 2 6 Valiant 18.1 6 225 105 2.76 3.460 20.22 1 0 3 1
7/55

Creating a data.frame to work with
If we would like to create a tibble (“fancy” data.frame), we can using as.tbl oras_tibble.
tbl = as_tibble(df) head(tbl)
# A tibble: 6 x 12 car mpg cyl disp hp drat wt qsec vs am gear carb <chr> <dbl> <dbl> <dbl> <dbl> <dbl> <dbl> <dbl> <dbl> <dbl> <dbl> <dbl>1 Mazda RX4 21 6 160 110 3.9 2.62 16.5 0 1 4 42 Mazda RX4 W… 21 6 160 110 3.9 2.88 17.0 0 1 4 43 Datsun 710 22.8 4 108 93 3.85 2.32 18.6 1 1 4 14 Hornet 4 Dr… 21.4 6 258 110 3.08 3.22 19.4 1 0 3 15 Hornet Spor… 18.7 8 360 175 3.15 3.44 17.0 0 0 3 26 Valiant 18.1 6 225 105 2.76 3.46 20.2 1 0 3 1
8/55
No rownames in tibbles!
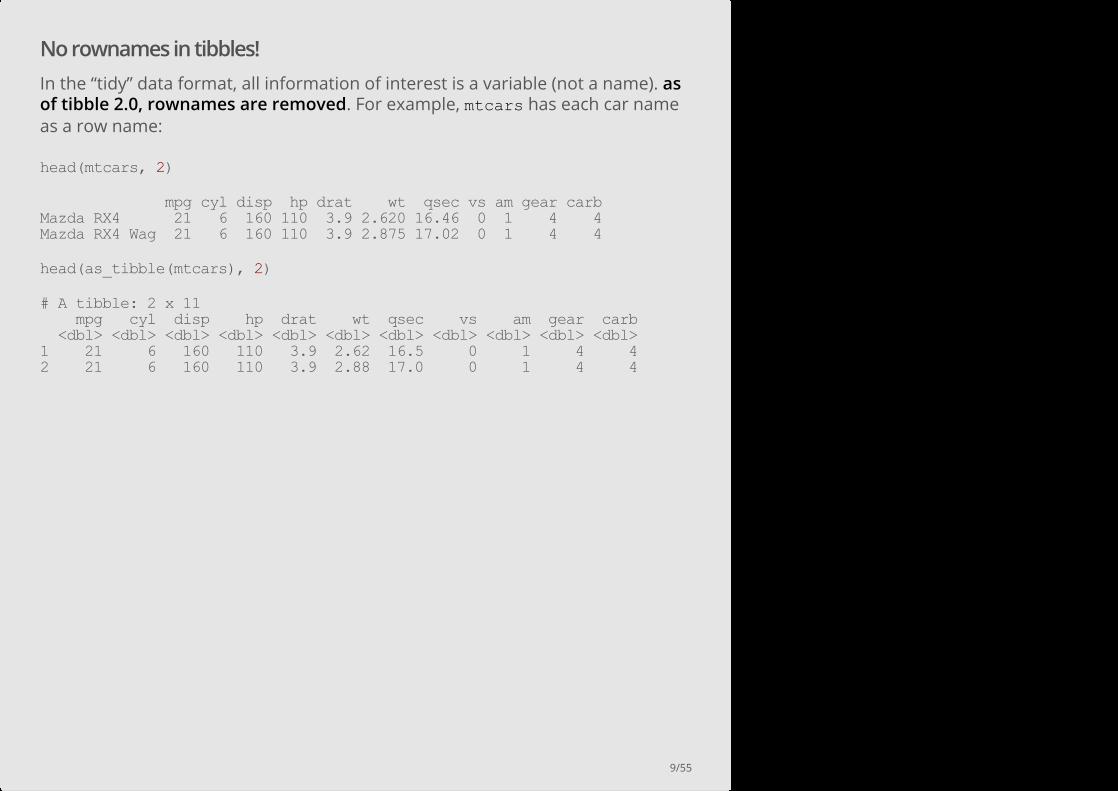
In the “tidy” data format, all information of interest is a variable (not a name). asof tibble 2.0, rownames are removed. For example, mtcars has each car nameas a row name:
head(mtcars, 2)
mpg cyl disp hp drat wt qsec vs am gear carb Mazda RX4 21 6 160 110 3.9 2.620 16.46 0 1 4 4 Mazda RX4 Wag 21 6 160 110 3.9 2.875 17.02 0 1 4 4
head(as_tibble(mtcars), 2)
# A tibble: 2 x 11 mpg cyl disp hp drat wt qsec vs am gear carb <dbl> <dbl> <dbl> <dbl> <dbl> <dbl> <dbl> <dbl> <dbl> <dbl> <dbl> 1 21 6 160 110 3.9 2.62 16.5 0 1 4 4 2 21 6 160 110 3.9 2.88 17.0 0 1 4 4
9/55

Renaming Columns

Renaming Columns of a data.frame: dplyr
To rename columns in dplyr, you use the rename command
df = dplyr::rename(df, MPG = mpg) head(df)
car MPG cyl disp hp drat wt qsec vs am gear carb 1 Mazda RX4 21.0 6 160 110 3.90 2.620 16.46 0 1 4 4 2 Mazda RX4 Wag 21.0 6 160 110 3.90 2.875 17.02 0 1 4 4 3 Datsun 710 22.8 4 108 93 3.85 2.320 18.61 1 1 4 1 4 Hornet 4 Drive 21.4 6 258 110 3.08 3.215 19.44 1 0 3 1 5 Hornet Sportabout 18.7 8 360 175 3.15 3.440 17.02 0 0 3 2 6 Valiant 18.1 6 225 105 2.76 3.460 20.22 1 0 3 1
df = rename(df, mpg = MPG) # reset don't need :: b/c not masked
11/55
Renaming All Columns of a data.frame: dplyr
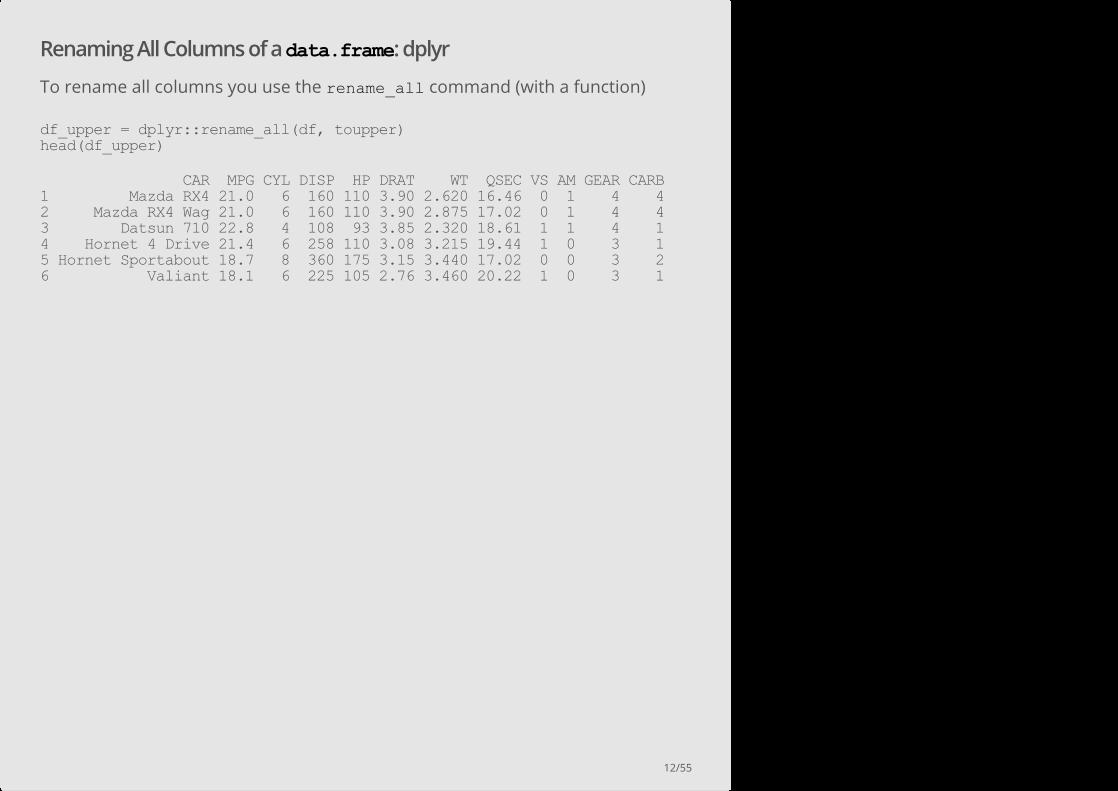
To rename all columns you use the rename_all command (with a function)
df_upper = dplyr::rename_all(df, toupper) head(df_upper)
CAR MPG CYL DISP HP DRAT WT QSEC VS AM GEAR CARB 1 Mazda RX4 21.0 6 160 110 3.90 2.620 16.46 0 1 4 4 2 Mazda RX4 Wag 21.0 6 160 110 3.90 2.875 17.02 0 1 4 4 3 Datsun 710 22.8 4 108 93 3.85 2.320 18.61 1 1 4 1 4 Hornet 4 Drive 21.4 6 258 110 3.08 3.215 19.44 1 0 3 1 5 Hornet Sportabout 18.7 8 360 175 3.15 3.440 17.02 0 0 3 2 6 Valiant 18.1 6 225 105 2.76 3.460 20.22 1 0 3 1
12/55
Subsetting Columns

Subset columns of a data.frame:
We can grab the carb column using the $ operator.
df$carb
[1] 4 4 1 1 2 1 4 2 2 4 4 3 3 3 4 4 4 1 2 1 1 2 2 4 2 1 2 2 4 6 8 2
15/55
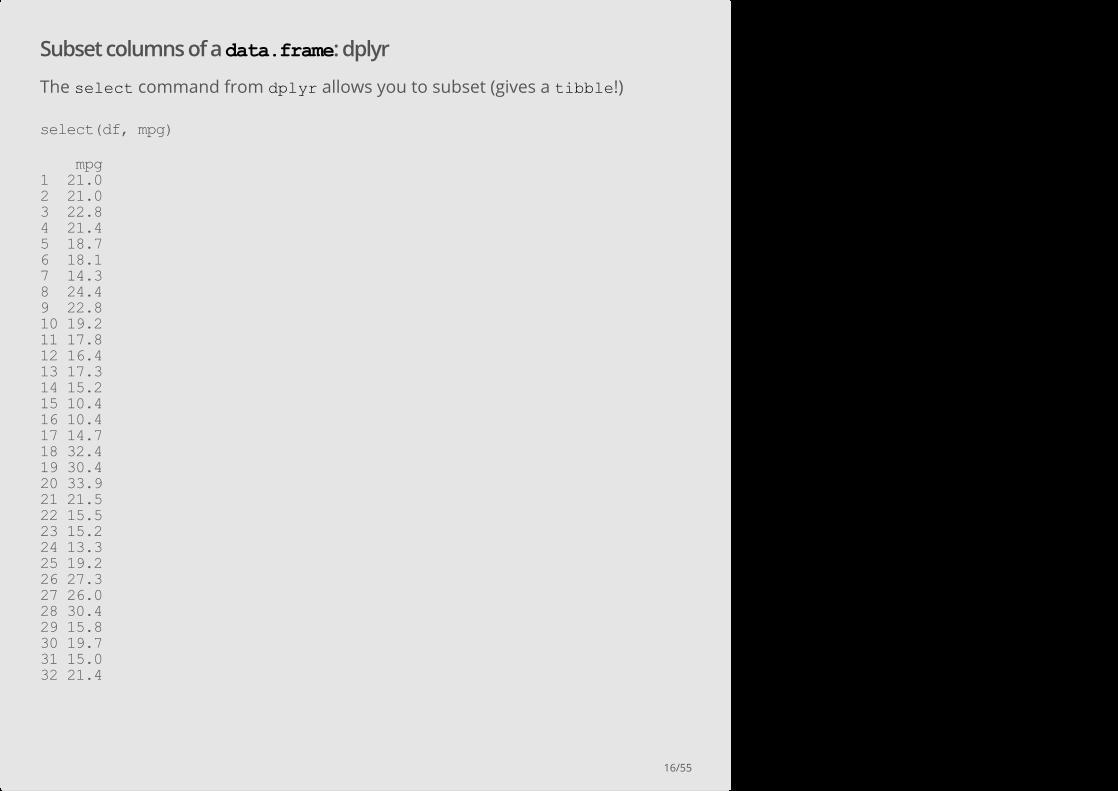
Subset columns of a data.frame: dplyr
The select command from dplyr allows you to subset (gives a tibble!)
select(df, mpg)
mpg 1 21.0 2 21.0 3 22.8 4 21.4 5 18.7 6 18.1 7 14.3 8 24.4 9 22.8 10 19.2 11 17.8 12 16.4 13 17.3 14 15.2 15 10.4 16 10.4 17 14.7 18 32.4 19 30.4 20 33.9 21 21.5 22 15.5 23 15.2 24 13.3 25 19.2 26 27.3 27 26.0 28 30.4 29 15.8 30 19.7 31 15.0 32 21.4
16/55
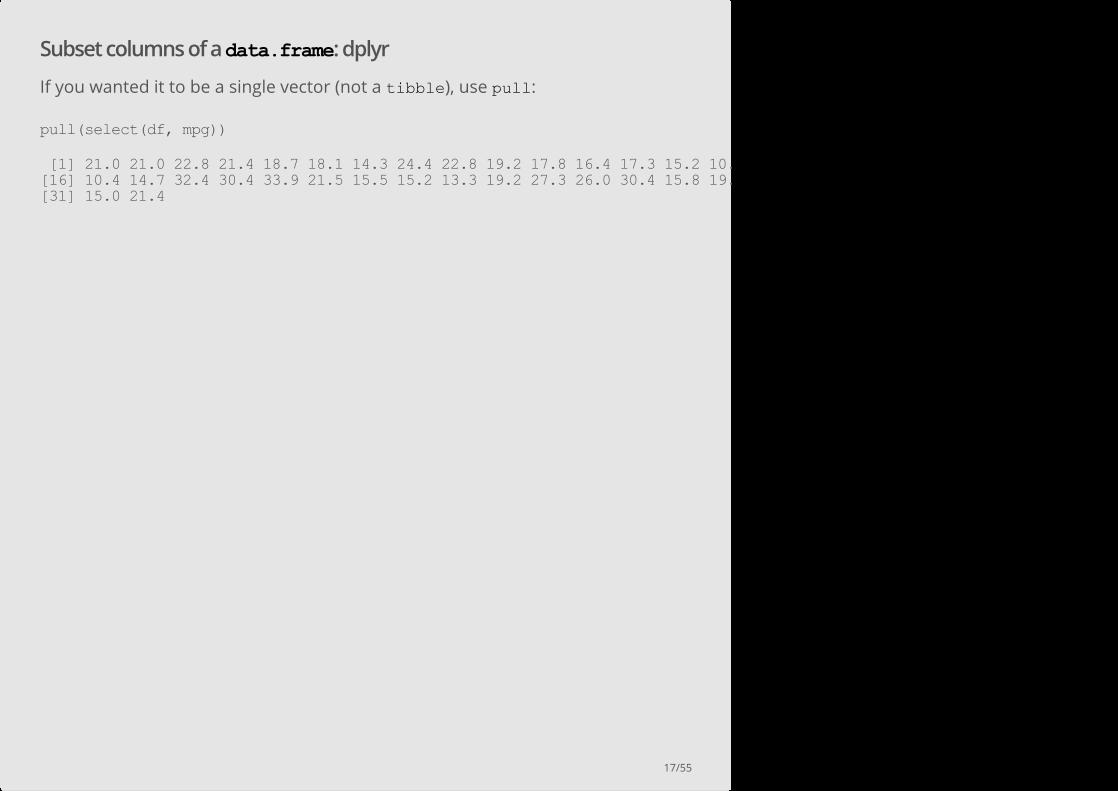
Subset columns of a data.frame: dplyr
If you wanted it to be a single vector (not a tibble), use pull:
pull(select(df, mpg))
[1] 21.0 21.0 22.8 21.4 18.7 18.1 14.3 24.4 22.8 19.2 17.8 16.4 17.3 15.2 10.4[16] 10.4 14.7 32.4 30.4 33.9 21.5 15.5 15.2 13.3 19.2 27.3 26.0 30.4 15.8 19.7[31] 15.0 21.4
17/55

Select columns of a data.frame: dplyr
The select command from dplyr allows you to subset columns matchingstrings:
select(df, mpg, cyl)
mpg cyl 1 21.0 6 2 21.0 6 3 22.8 4 4 21.4 6 5 18.7 8 6 18.1 6 7 14.3 8 8 24.4 4 9 22.8 4 10 19.2 6 11 17.8 6 12 16.4 8 13 17.3 8 14 15.2 8 15 10.4 8 16 10.4 8 17 14.7 8 18 32.4 4 19 30.4 4 20 33.9 4 21 21.5 4 22 15.5 8 23 15.2 8 24 13.3 8 25 19.2 8 26 27.3 4 27 26.0 4 28 30.4 4 29 15.8 8 30 19.7 6 31 15.0 8 32 21.4 4
select(df, starts_with("c"))
car cyl carb 1 Mazda RX4 6 4 2 Mazda RX4 Wag 6 4
18/55

See the Select “helpers”
Run the command:
Here are a few:
??tidyselect::select_helpers
one_of() last_col() ends_with() contains() # like searching matches() # Matches a regular expression cover later
19/55

Subsetting Rows

Subset rows of a data.frame: dplyr
The command in dplyr for subsetting rows is filter. Try ?filter
Note, no $ or subsetting is necessary. R “knows” mpg refers to a column of df.
filter(df, mpg > 20 | mpg < 14)
car mpg cyl disp hp drat wt qsec vs am gear carb 1 Mazda RX4 21.0 6 160.0 110 3.90 2.620 16.46 0 1 4 4 2 Mazda RX4 Wag 21.0 6 160.0 110 3.90 2.875 17.02 0 1 4 4 3 Datsun 710 22.8 4 108.0 93 3.85 2.320 18.61 1 1 4 1 4 Hornet 4 Drive 21.4 6 258.0 110 3.08 3.215 19.44 1 0 3 1 5 Merc 240D 24.4 4 146.7 62 3.69 3.190 20.00 1 0 4 2 6 Merc 230 22.8 4 140.8 95 3.92 3.150 22.90 1 0 4 2 7 Cadillac Fleetwood 10.4 8 472.0 205 2.93 5.250 17.98 0 0 3 4 8 Lincoln Continental 10.4 8 460.0 215 3.00 5.424 17.82 0 0 3 4 9 Fiat 128 32.4 4 78.7 66 4.08 2.200 19.47 1 1 4 1 10 Honda Civic 30.4 4 75.7 52 4.93 1.615 18.52 1 1 4 2 11 Toyota Corolla 33.9 4 71.1 65 4.22 1.835 19.90 1 1 4 1 12 Toyota Corona 21.5 4 120.1 97 3.70 2.465 20.01 1 0 3 1 13 Camaro Z28 13.3 8 350.0 245 3.73 3.840 15.41 0 0 3 4 14 Fiat X19 27.3 4 79.0 66 4.08 1.935 18.90 1 1 4 1 15 Porsche 9142 26.0 4 120.3 91 4.43 2.140 16.70 0 1 5 2 16 Lotus Europa 30.4 4 95.1 113 3.77 1.513 16.90 1 1 5 2 17 Volvo 142E 21.4 4 121.0 109 4.11 2.780 18.60 1 1 4 2
22/55

Subset rows of a data.frame: dplyr
You can have multiple logical conditions using the following:
== : equals to
! : not/negation
> / <: greater than / less than
>= or <=: greater than or equal to / less than or equal to
& : AND
| : OR
·
·
·
·
·
·
23/55

Subset rows of a data.frame: dplyr
By default, you can separate conditions by commas, and filter assumes thesestatements are joined by &:
filter(df, mpg > 20 & cyl == 4)
car mpg cyl disp hp drat wt qsec vs am gear carb 1 Datsun 710 22.8 4 108.0 93 3.85 2.320 18.61 1 1 4 1 2 Merc 240D 24.4 4 146.7 62 3.69 3.190 20.00 1 0 4 2 3 Merc 230 22.8 4 140.8 95 3.92 3.150 22.90 1 0 4 2 4 Fiat 128 32.4 4 78.7 66 4.08 2.200 19.47 1 1 4 1 5 Honda Civic 30.4 4 75.7 52 4.93 1.615 18.52 1 1 4 2 6 Toyota Corolla 33.9 4 71.1 65 4.22 1.835 19.90 1 1 4 1 7 Toyota Corona 21.5 4 120.1 97 3.70 2.465 20.01 1 0 3 1 8 Fiat X19 27.3 4 79.0 66 4.08 1.935 18.90 1 1 4 1 9 Porsche 9142 26.0 4 120.3 91 4.43 2.140 16.70 0 1 5 2 10 Lotus Europa 30.4 4 95.1 113 3.77 1.513 16.90 1 1 5 2 11 Volvo 142E 21.4 4 121.0 109 4.11 2.780 18.60 1 1 4 2
filter(df, mpg > 20, cyl == 4)
car mpg cyl disp hp drat wt qsec vs am gear carb 1 Datsun 710 22.8 4 108.0 93 3.85 2.320 18.61 1 1 4 1 2 Merc 240D 24.4 4 146.7 62 3.69 3.190 20.00 1 0 4 2 3 Merc 230 22.8 4 140.8 95 3.92 3.150 22.90 1 0 4 2 4 Fiat 128 32.4 4 78.7 66 4.08 2.200 19.47 1 1 4 1 5 Honda Civic 30.4 4 75.7 52 4.93 1.615 18.52 1 1 4 2 6 Toyota Corolla 33.9 4 71.1 65 4.22 1.835 19.90 1 1 4 1 7 Toyota Corona 21.5 4 120.1 97 3.70 2.465 20.01 1 0 3 1 8 Fiat X19 27.3 4 79.0 66 4.08 1.935 18.90 1 1 4 1 9 Porsche 9142 26.0 4 120.3 91 4.43 2.140 16.70 0 1 5 2 10 Lotus Europa 30.4 4 95.1 113 3.77 1.513 16.90 1 1 5 2 11 Volvo 142E 21.4 4 121.0 109 4.11 2.780 18.60 1 1 4 2
24/55

Subset rows of a data.frame: dplyr
If you want OR statements, you need to do the pipe | explicitly:
filter(df, mpg > 20 | cyl == 4)
car mpg cyl disp hp drat wt qsec vs am gear carb 1 Mazda RX4 21.0 6 160.0 110 3.90 2.620 16.46 0 1 4 4 2 Mazda RX4 Wag 21.0 6 160.0 110 3.90 2.875 17.02 0 1 4 4 3 Datsun 710 22.8 4 108.0 93 3.85 2.320 18.61 1 1 4 1 4 Hornet 4 Drive 21.4 6 258.0 110 3.08 3.215 19.44 1 0 3 1 5 Merc 240D 24.4 4 146.7 62 3.69 3.190 20.00 1 0 4 2 6 Merc 230 22.8 4 140.8 95 3.92 3.150 22.90 1 0 4 2 7 Fiat 128 32.4 4 78.7 66 4.08 2.200 19.47 1 1 4 1 8 Honda Civic 30.4 4 75.7 52 4.93 1.615 18.52 1 1 4 2 9 Toyota Corolla 33.9 4 71.1 65 4.22 1.835 19.90 1 1 4 1 10 Toyota Corona 21.5 4 120.1 97 3.70 2.465 20.01 1 0 3 1 11 Fiat X19 27.3 4 79.0 66 4.08 1.935 18.90 1 1 4 1 12 Porsche 9142 26.0 4 120.3 91 4.43 2.140 16.70 0 1 5 2 13 Lotus Europa 30.4 4 95.1 113 3.77 1.513 16.90 1 1 5 2 14 Volvo 142E 21.4 4 121.0 109 4.11 2.780 18.60 1 1 4 2
25/55

Combining filter and select
You can combine filter and select to subset the rows and columns,respectively, of a data.frame:
In R, the common way to perform multiple operations is to wrap functionsaround each other in a nested way such as above
select(filter(df, mpg > 20 & cyl == 4), cyl, hp)
cyl hp 1 4 93 2 4 62 3 4 95 4 4 66 5 4 52 6 4 65 7 4 97 8 4 66 9 4 91 10 4 113 11 4 109
27/55

Assigning Temporary Objects
One can also create temporary objects and reassign them:
df2 = filter(df, mpg > 20 & cyl == 4) df2 = select(df2, cyl, hp)
28/55

Using the pipe (comes with dplyr):
Recently, the pipe %>% makes things such as this much more readable. It readsleft side “pipes” into right side. RStudio CMD/Ctrl + Shift + M shortcut. Pipedf into filter, then pipe that into select:
df %>% filter(mpg > 20 & cyl == 4) %>% select(cyl, hp)
cyl hp 1 4 93 2 4 62 3 4 95 4 4 66 5 4 52 6 4 65 7 4 97 8 4 66 9 4 91 10 4 113 11 4 109
29/55

Adding/Removing Columns
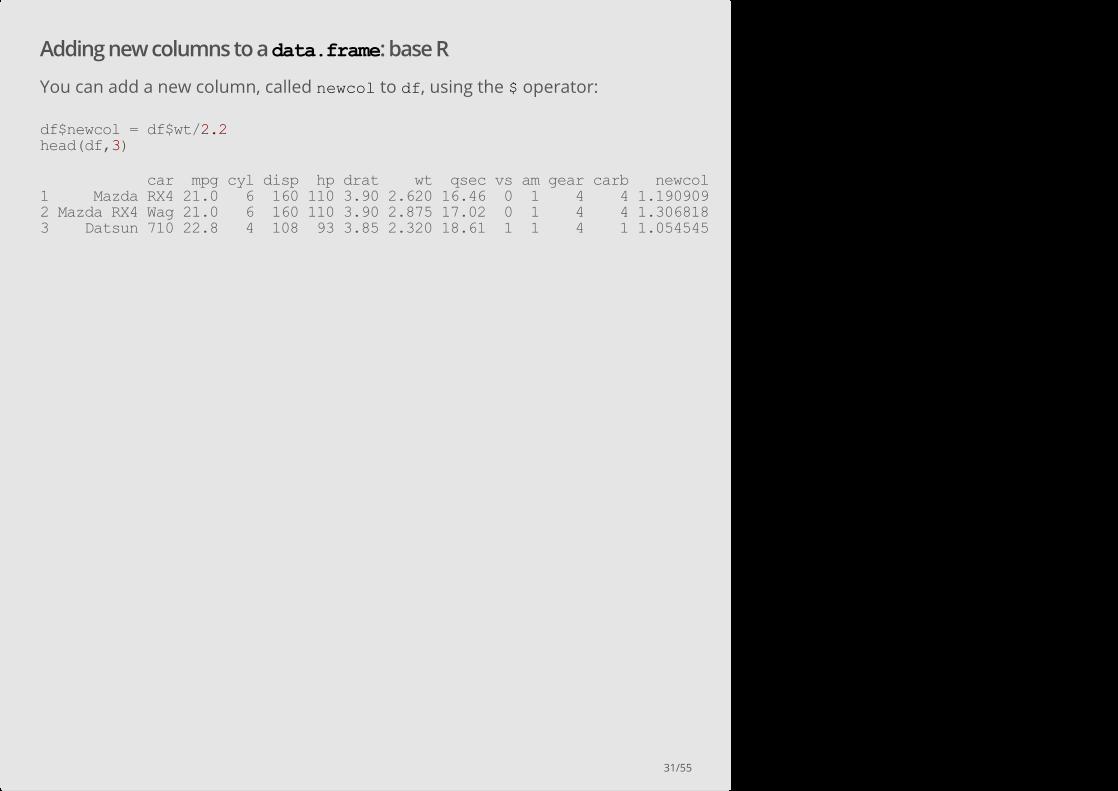
Adding new columns to a data.frame: base R
You can add a new column, called newcol to df, using the $ operator:
df$newcol = df$wt/2.2 head(df,3)
car mpg cyl disp hp drat wt qsec vs am gear carb newcol 1 Mazda RX4 21.0 6 160 110 3.90 2.620 16.46 0 1 4 4 1.190909 2 Mazda RX4 Wag 21.0 6 160 110 3.90 2.875 17.02 0 1 4 4 1.306818 3 Datsun 710 22.8 4 108 93 3.85 2.320 18.61 1 1 4 1 1.054545
31/55

Adding columns to a data.frame: dplyr
The $ method is very common.
The mutate function in dplyr allows you to add or replace columns of adata.frame:
df = mutate(df, newcol = wt/2.2)
car mpg cyl disp hp drat wt qsec vs am gear carb newcol 1 Mazda RX4 21 6 160 110 3.9 2.620 16.46 0 1 4 4 1.190909 2 Mazda RX4 Wag 21 6 160 110 3.9 2.875 17.02 0 1 4 4 1.306818
32/55

Creating conditional variables
One frequently-used tool is creating variables with conditions.
A general function for creating new variables based on existing variables is theifelse() function, which “returns a value with the same shape as test which isfilled with elements selected from either yes or no depending on whether theelement of test is TRUE or FALSE.”
ifelse(test, yes, no) # test: an object which can be coerced to logical mode. # yes: return values for true elements of test. # no: return values for false elements of test.
33/55

Adding columns to a data.frame: dplyr
Combined with ifelse(condition, TRUE, FALSE), it can give you:
df = mutate(df, disp_cat = ifelse( disp <= 200, "Low", ifelse(disp <= 400, "Medium", "High") ) ) head(df$disp_cat)
[1] "Low" "Low" "Low" "Medium" "Medium" "Medium"
34/55

Adding columns to a data.frame: dplyr
Alternatively, case_when provides a clean syntax as well:
df = mutate(df, disp_cat2 = case_when( disp <= 200 ~ "Low", disp > 200 & disp <= 400 ~ "Medium", disp > 400 ~ "High", )) head(df$disp_cat2)
[1] "Low" "Low" "Low" "Medium" "Medium" "Medium"
35/55

Removing columns to a data.frame: base R
You can remove a column by assigning to NULL:
df$newcol = NULL
36/55

Removing columns to a data.frame: dplyr
The NULL method is still very common.
The select function can remove a column with minus ():
select(df, newcol)
car mpg cyl disp hp drat wt qsec vs am gear carb disp_cat1 Mazda RX4 21.0 6 160 110 3.90 2.620 16.46 0 1 4 4 Low2 Mazda RX4 Wag 21.0 6 160 110 3.90 2.875 17.02 0 1 4 4 Low3 Datsun 710 22.8 4 108 93 3.85 2.320 18.61 1 1 4 1 Low4 Hornet 4 Drive 21.4 6 258 110 3.08 3.215 19.44 1 0 3 1 Medium5 Hornet Sportabout 18.7 8 360 175 3.15 3.440 17.02 0 0 3 2 Medium6 Valiant 18.1 6 225 105 2.76 3.460 20.22 1 0 3 1 Medium disp_cat2 1 Low 2 Low 3 Low 4 Medium 5 Medium 6 Medium
37/55

Removing columns to a data.frame: dplyr
Remove newcol and drat
select(df, one_of("newcol", "drat"))
car mpg cyl disp hp wt qsec vs am gear carb disp_cat 1 Mazda RX4 21.0 6 160 110 2.620 16.46 0 1 4 4 Low 2 Mazda RX4 Wag 21.0 6 160 110 2.875 17.02 0 1 4 4 Low 3 Datsun 710 22.8 4 108 93 2.320 18.61 1 1 4 1 Low 4 Hornet 4 Drive 21.4 6 258 110 3.215 19.44 1 0 3 1 Medium 5 Hornet Sportabout 18.7 8 360 175 3.440 17.02 0 0 3 2 Medium 6 Valiant 18.1 6 225 105 3.460 20.22 1 0 3 1 Medium disp_cat2 1 Low 2 Low 3 Low 4 Medium 5 Medium 6 Medium
38/55

Ordering columns

Ordering the columns of a data.frame: dplyr
The select function can reorder columns. Put newcol first, then select the restof columns:
select(df, newcol, everything())
newcol car mpg cyl disp hp drat wt qsec vs am gear carb1 1.190909 Mazda RX4 21.0 6 160 110 3.90 2.620 16.46 0 1 4 42 1.306818 Mazda RX4 Wag 21.0 6 160 110 3.90 2.875 17.02 0 1 4 43 1.054545 Datsun 710 22.8 4 108 93 3.85 2.320 18.61 1 1 4 14 1.461364 Hornet 4 Drive 21.4 6 258 110 3.08 3.215 19.44 1 0 3 15 1.563636 Hornet Sportabout 18.7 8 360 175 3.15 3.440 17.02 0 0 3 26 1.572727 Valiant 18.1 6 225 105 2.76 3.460 20.22 1 0 3 1 disp_cat disp_cat2 1 Low Low 2 Low Low 3 Low Low 4 Medium Medium 5 Medium Medium 6 Medium Medium
40/55

Ordering the columns of a data.frame: dplyr
Put newcol at the end (“remove, everything, then add back in”):
select(df, newcol, everything(), newcol)
car mpg cyl disp hp drat wt qsec vs am gear carb disp_cat1 Mazda RX4 21.0 6 160 110 3.90 2.620 16.46 0 1 4 4 Low2 Mazda RX4 Wag 21.0 6 160 110 3.90 2.875 17.02 0 1 4 4 Low3 Datsun 710 22.8 4 108 93 3.85 2.320 18.61 1 1 4 1 Low4 Hornet 4 Drive 21.4 6 258 110 3.08 3.215 19.44 1 0 3 1 Medium5 Hornet Sportabout 18.7 8 360 175 3.15 3.440 17.02 0 0 3 2 Medium6 Valiant 18.1 6 225 105 2.76 3.460 20.22 1 0 3 1 Medium disp_cat2 newcol 1 Low 1.190909 2 Low 1.306818 3 Low 1.054545 4 Medium 1.461364 5 Medium 1.563636 6 Medium 1.572727
41/55

Ordering rows

Ordering the rows of a data.frame: dplyr
The arrange function can reorder rows By default, arrange orders in ascendingorder:
arrange(df, mpg)
car mpg cyl disp hp drat wt qsec vs am gear carb 1 Cadillac Fleetwood 10.4 8 472.0 205 2.93 5.250 17.98 0 0 3 4 2 Lincoln Continental 10.4 8 460.0 215 3.00 5.424 17.82 0 0 3 4 3 Camaro Z28 13.3 8 350.0 245 3.73 3.840 15.41 0 0 3 4 4 Duster 360 14.3 8 360.0 245 3.21 3.570 15.84 0 0 3 4 5 Chrysler Imperial 14.7 8 440.0 230 3.23 5.345 17.42 0 0 3 4 6 Maserati Bora 15.0 8 301.0 335 3.54 3.570 14.60 0 1 5 8 7 Merc 450SLC 15.2 8 275.8 180 3.07 3.780 18.00 0 0 3 3 8 AMC Javelin 15.2 8 304.0 150 3.15 3.435 17.30 0 0 3 2 9 Dodge Challenger 15.5 8 318.0 150 2.76 3.520 16.87 0 0 3 2 10 Ford Pantera L 15.8 8 351.0 264 4.22 3.170 14.50 0 1 5 4 11 Merc 450SE 16.4 8 275.8 180 3.07 4.070 17.40 0 0 3 3 12 Merc 450SL 17.3 8 275.8 180 3.07 3.730 17.60 0 0 3 3 13 Merc 280C 17.8 6 167.6 123 3.92 3.440 18.90 1 0 4 4 14 Valiant 18.1 6 225.0 105 2.76 3.460 20.22 1 0 3 1 15 Hornet Sportabout 18.7 8 360.0 175 3.15 3.440 17.02 0 0 3 2 16 Merc 280 19.2 6 167.6 123 3.92 3.440 18.30 1 0 4 4 17 Pontiac Firebird 19.2 8 400.0 175 3.08 3.845 17.05 0 0 3 2 18 Ferrari Dino 19.7 6 145.0 175 3.62 2.770 15.50 0 1 5 6 19 Mazda RX4 21.0 6 160.0 110 3.90 2.620 16.46 0 1 4 4 20 Mazda RX4 Wag 21.0 6 160.0 110 3.90 2.875 17.02 0 1 4 4 21 Hornet 4 Drive 21.4 6 258.0 110 3.08 3.215 19.44 1 0 3 1 22 Volvo 142E 21.4 4 121.0 109 4.11 2.780 18.60 1 1 4 2 23 Toyota Corona 21.5 4 120.1 97 3.70 2.465 20.01 1 0 3 1 24 Datsun 710 22.8 4 108.0 93 3.85 2.320 18.61 1 1 4 1 25 Merc 230 22.8 4 140.8 95 3.92 3.150 22.90 1 0 4 2 26 Merc 240D 24.4 4 146.7 62 3.69 3.190 20.00 1 0 4 2 27 Porsche 9142 26.0 4 120.3 91 4.43 2.140 16.70 0 1 5 2 28 Fiat X19 27.3 4 79.0 66 4.08 1.935 18.90 1 1 4 1 29 Honda Civic 30.4 4 75.7 52 4.93 1.615 18.52 1 1 4 2 30 Lotus Europa 30.4 4 95.1 113 3.77 1.513 16.90 1 1 5 2 31 Fiat 128 32.4 4 78.7 66 4.08 2.200 19.47 1 1 4 1 32 Toyota Corolla 33.9 4 71.1 65 4.22 1.835 19.90 1 1 4 1 newcol disp_cat disp_cat2 1 2.3863636 High High 2 2.4654545 High High 3 1.7454545 Medium Medium 4 1.6227273 Medium Medium 5 2.4295455 High High
43/55

Ordering the rows of a data.frame: dplyr
Use the desc to arrange the rows in descending order:
arrange(df, desc(mpg))
car mpg cyl disp hp drat wt qsec vs am gear carb 1 Toyota Corolla 33.9 4 71.1 65 4.22 1.835 19.90 1 1 4 1 2 Fiat 128 32.4 4 78.7 66 4.08 2.200 19.47 1 1 4 1 3 Honda Civic 30.4 4 75.7 52 4.93 1.615 18.52 1 1 4 2 4 Lotus Europa 30.4 4 95.1 113 3.77 1.513 16.90 1 1 5 2 5 Fiat X19 27.3 4 79.0 66 4.08 1.935 18.90 1 1 4 1 6 Porsche 9142 26.0 4 120.3 91 4.43 2.140 16.70 0 1 5 2 7 Merc 240D 24.4 4 146.7 62 3.69 3.190 20.00 1 0 4 2 8 Datsun 710 22.8 4 108.0 93 3.85 2.320 18.61 1 1 4 1 9 Merc 230 22.8 4 140.8 95 3.92 3.150 22.90 1 0 4 2 10 Toyota Corona 21.5 4 120.1 97 3.70 2.465 20.01 1 0 3 1 11 Hornet 4 Drive 21.4 6 258.0 110 3.08 3.215 19.44 1 0 3 1 12 Volvo 142E 21.4 4 121.0 109 4.11 2.780 18.60 1 1 4 2 13 Mazda RX4 21.0 6 160.0 110 3.90 2.620 16.46 0 1 4 4 14 Mazda RX4 Wag 21.0 6 160.0 110 3.90 2.875 17.02 0 1 4 4 15 Ferrari Dino 19.7 6 145.0 175 3.62 2.770 15.50 0 1 5 6 16 Merc 280 19.2 6 167.6 123 3.92 3.440 18.30 1 0 4 4 17 Pontiac Firebird 19.2 8 400.0 175 3.08 3.845 17.05 0 0 3 2 18 Hornet Sportabout 18.7 8 360.0 175 3.15 3.440 17.02 0 0 3 2 19 Valiant 18.1 6 225.0 105 2.76 3.460 20.22 1 0 3 1 20 Merc 280C 17.8 6 167.6 123 3.92 3.440 18.90 1 0 4 4 21 Merc 450SL 17.3 8 275.8 180 3.07 3.730 17.60 0 0 3 3 22 Merc 450SE 16.4 8 275.8 180 3.07 4.070 17.40 0 0 3 3 23 Ford Pantera L 15.8 8 351.0 264 4.22 3.170 14.50 0 1 5 4 24 Dodge Challenger 15.5 8 318.0 150 2.76 3.520 16.87 0 0 3 2 25 Merc 450SLC 15.2 8 275.8 180 3.07 3.780 18.00 0 0 3 3 26 AMC Javelin 15.2 8 304.0 150 3.15 3.435 17.30 0 0 3 2 27 Maserati Bora 15.0 8 301.0 335 3.54 3.570 14.60 0 1 5 8 28 Chrysler Imperial 14.7 8 440.0 230 3.23 5.345 17.42 0 0 3 4 29 Duster 360 14.3 8 360.0 245 3.21 3.570 15.84 0 0 3 4 30 Camaro Z28 13.3 8 350.0 245 3.73 3.840 15.41 0 0 3 4 31 Cadillac Fleetwood 10.4 8 472.0 205 2.93 5.250 17.98 0 0 3 4 32 Lincoln Continental 10.4 8 460.0 215 3.00 5.424 17.82 0 0 3 4 newcol disp_cat disp_cat2 1 0.8340909 Low Low 2 1.0000000 Low Low 3 0.7340909 Low Low 4 0.6877273 Low Low 5 0.8795455 Low Low
6 0.9727273 Low Low
44/55

Ordering the rows of a data.frame: dplyr
It is a bit more straightforward to mix increasing and decreasing orderings:
arrange(df, mpg, desc(hp))
car mpg cyl disp hp drat wt qsec vs am gear carb 1 Lincoln Continental 10.4 8 460.0 215 3.00 5.424 17.82 0 0 3 4 2 Cadillac Fleetwood 10.4 8 472.0 205 2.93 5.250 17.98 0 0 3 4 3 Camaro Z28 13.3 8 350.0 245 3.73 3.840 15.41 0 0 3 4 4 Duster 360 14.3 8 360.0 245 3.21 3.570 15.84 0 0 3 4 5 Chrysler Imperial 14.7 8 440.0 230 3.23 5.345 17.42 0 0 3 4 6 Maserati Bora 15.0 8 301.0 335 3.54 3.570 14.60 0 1 5 8 7 Merc 450SLC 15.2 8 275.8 180 3.07 3.780 18.00 0 0 3 3 8 AMC Javelin 15.2 8 304.0 150 3.15 3.435 17.30 0 0 3 2 9 Dodge Challenger 15.5 8 318.0 150 2.76 3.520 16.87 0 0 3 2 10 Ford Pantera L 15.8 8 351.0 264 4.22 3.170 14.50 0 1 5 4 11 Merc 450SE 16.4 8 275.8 180 3.07 4.070 17.40 0 0 3 3 12 Merc 450SL 17.3 8 275.8 180 3.07 3.730 17.60 0 0 3 3 13 Merc 280C 17.8 6 167.6 123 3.92 3.440 18.90 1 0 4 4 14 Valiant 18.1 6 225.0 105 2.76 3.460 20.22 1 0 3 1 15 Hornet Sportabout 18.7 8 360.0 175 3.15 3.440 17.02 0 0 3 2 16 Pontiac Firebird 19.2 8 400.0 175 3.08 3.845 17.05 0 0 3 2 17 Merc 280 19.2 6 167.6 123 3.92 3.440 18.30 1 0 4 4 18 Ferrari Dino 19.7 6 145.0 175 3.62 2.770 15.50 0 1 5 6 19 Mazda RX4 21.0 6 160.0 110 3.90 2.620 16.46 0 1 4 4 20 Mazda RX4 Wag 21.0 6 160.0 110 3.90 2.875 17.02 0 1 4 4 21 Hornet 4 Drive 21.4 6 258.0 110 3.08 3.215 19.44 1 0 3 1 22 Volvo 142E 21.4 4 121.0 109 4.11 2.780 18.60 1 1 4 2 23 Toyota Corona 21.5 4 120.1 97 3.70 2.465 20.01 1 0 3 1 24 Merc 230 22.8 4 140.8 95 3.92 3.150 22.90 1 0 4 2 25 Datsun 710 22.8 4 108.0 93 3.85 2.320 18.61 1 1 4 1 26 Merc 240D 24.4 4 146.7 62 3.69 3.190 20.00 1 0 4 2 27 Porsche 9142 26.0 4 120.3 91 4.43 2.140 16.70 0 1 5 2 28 Fiat X19 27.3 4 79.0 66 4.08 1.935 18.90 1 1 4 1 29 Lotus Europa 30.4 4 95.1 113 3.77 1.513 16.90 1 1 5 2 30 Honda Civic 30.4 4 75.7 52 4.93 1.615 18.52 1 1 4 2 31 Fiat 128 32.4 4 78.7 66 4.08 2.200 19.47 1 1 4 1 32 Toyota Corolla 33.9 4 71.1 65 4.22 1.835 19.90 1 1 4 1 newcol disp_cat disp_cat2 1 2.4654545 High High 2 2.3863636 High High 3 1.7454545 Medium Medium 4 1.6227273 Medium Medium 5 2.4295455 High High
6 1.6227273 Medium Medium
45/55
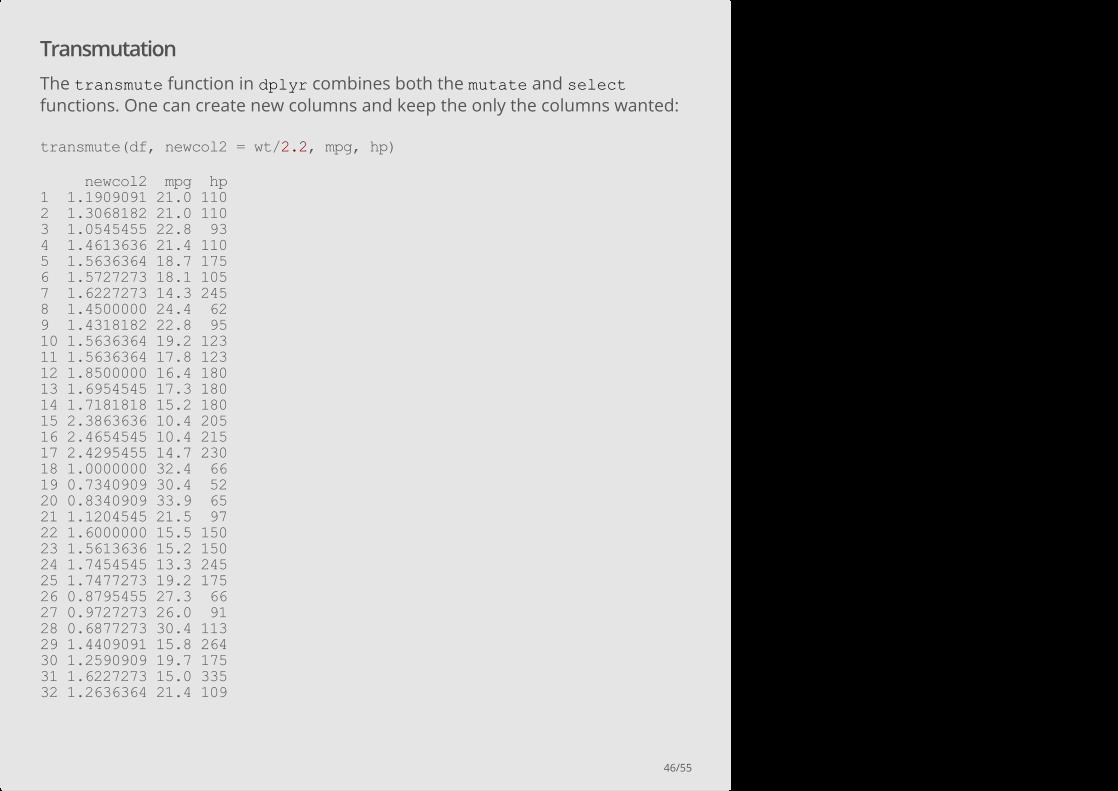
Transmutation
The transmute function in dplyr combines both the mutate and selectfunctions. One can create new columns and keep the only the columns wanted:
transmute(df, newcol2 = wt/2.2, mpg, hp)
newcol2 mpg hp 1 1.1909091 21.0 110 2 1.3068182 21.0 110 3 1.0545455 22.8 93 4 1.4613636 21.4 110 5 1.5636364 18.7 175 6 1.5727273 18.1 105 7 1.6227273 14.3 245 8 1.4500000 24.4 62 9 1.4318182 22.8 95 10 1.5636364 19.2 123 11 1.5636364 17.8 123 12 1.8500000 16.4 180 13 1.6954545 17.3 180 14 1.7181818 15.2 180 15 2.3863636 10.4 205 16 2.4654545 10.4 215 17 2.4295455 14.7 230 18 1.0000000 32.4 66 19 0.7340909 30.4 52 20 0.8340909 33.9 65 21 1.1204545 21.5 97 22 1.6000000 15.5 150 23 1.5613636 15.2 150 24 1.7454545 13.3 245 25 1.7477273 19.2 175 26 0.8795455 27.3 66 27 0.9727273 26.0 91 28 0.6877273 30.4 113 29 1.4409091 15.8 264 30 1.2590909 19.7 175 31 1.6227273 15.0 335 32 1.2636364 21.4 109
46/55

Extra Slides
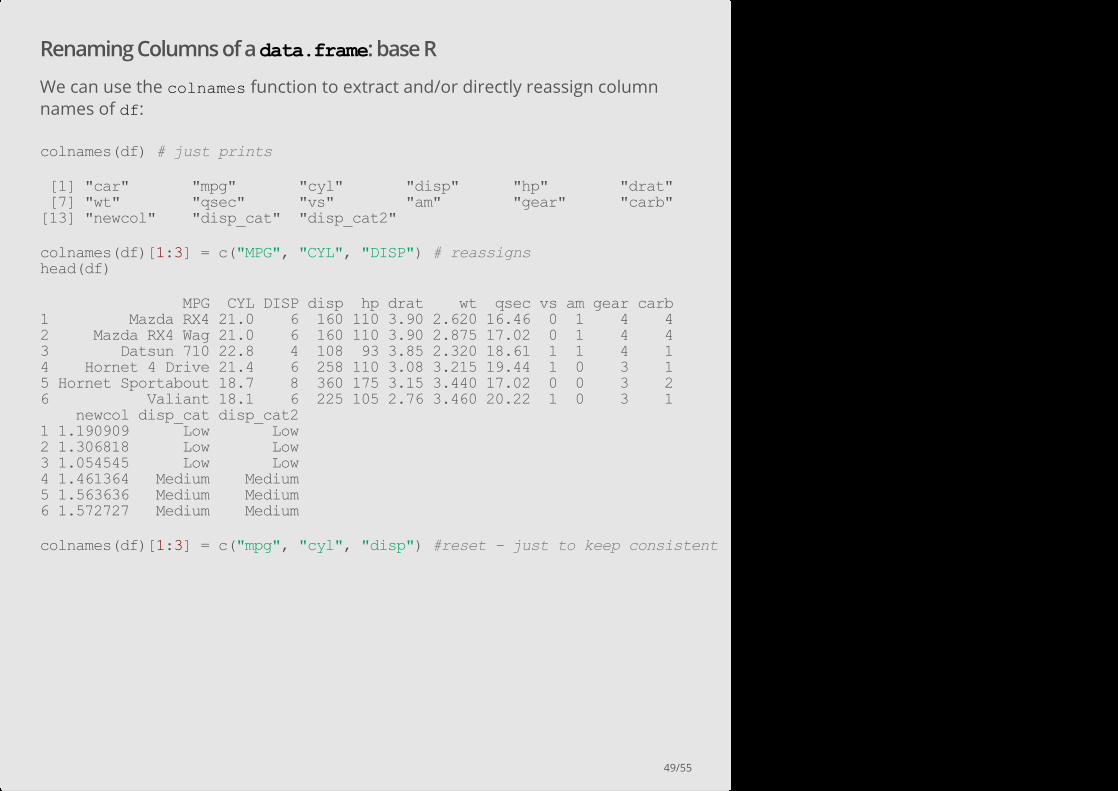
Renaming Columns of a data.frame: base R
We can use the colnames function to extract and/or directly reassign columnnames of df:
colnames(df) # just prints
[1] "car" "mpg" "cyl" "disp" "hp" "drat" [7] "wt" "qsec" "vs" "am" "gear" "carb" [13] "newcol" "disp_cat" "disp_cat2"
colnames(df)[1:3] = c("MPG", "CYL", "DISP") # reassigns head(df)
MPG CYL DISP disp hp drat wt qsec vs am gear carb 1 Mazda RX4 21.0 6 160 110 3.90 2.620 16.46 0 1 4 4 2 Mazda RX4 Wag 21.0 6 160 110 3.90 2.875 17.02 0 1 4 4 3 Datsun 710 22.8 4 108 93 3.85 2.320 18.61 1 1 4 1 4 Hornet 4 Drive 21.4 6 258 110 3.08 3.215 19.44 1 0 3 1 5 Hornet Sportabout 18.7 8 360 175 3.15 3.440 17.02 0 0 3 2 6 Valiant 18.1 6 225 105 2.76 3.460 20.22 1 0 3 1 newcol disp_cat disp_cat2 1 1.190909 Low Low 2 1.306818 Low Low 3 1.054545 Low Low 4 1.461364 Medium Medium 5 1.563636 Medium Medium 6 1.572727 Medium Medium
colnames(df)[1:3] = c("mpg", "cyl", "disp") #reset just to keep consistent
49/55
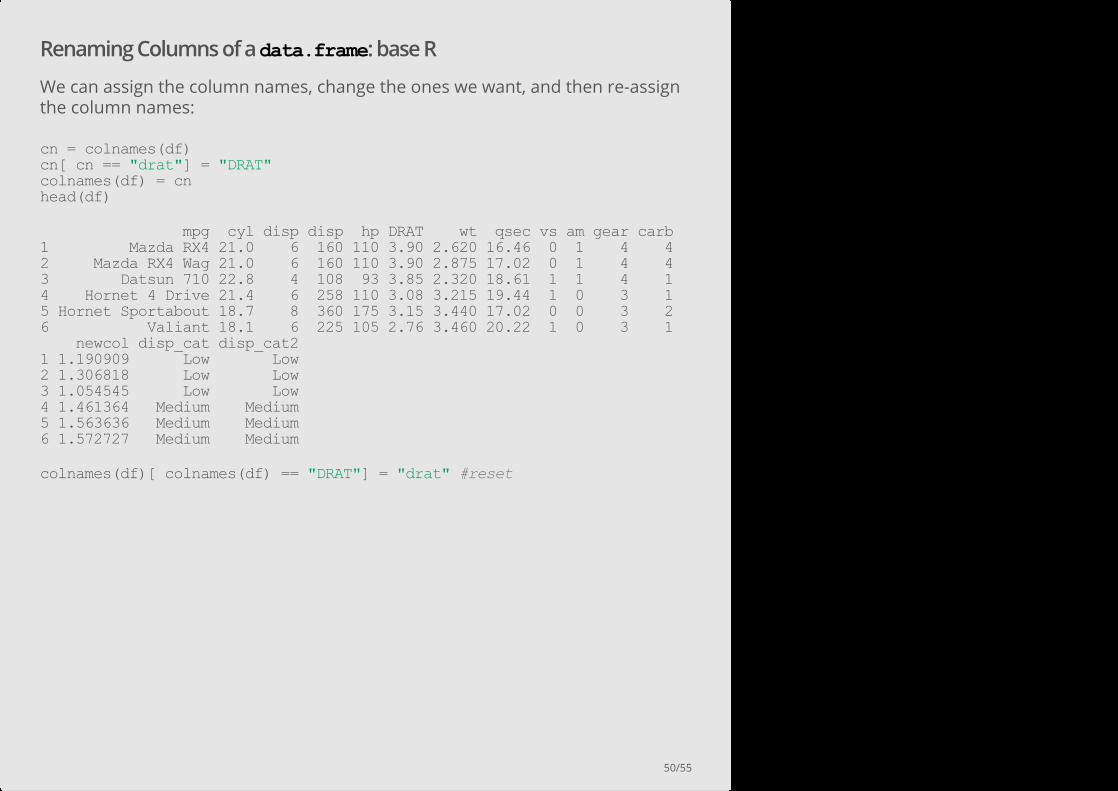
Renaming Columns of a data.frame: base R
We can assign the column names, change the ones we want, and then re-assignthe column names:
cn = colnames(df) cn[ cn == "drat"] = "DRAT" colnames(df) = cn head(df)
mpg cyl disp disp hp DRAT wt qsec vs am gear carb 1 Mazda RX4 21.0 6 160 110 3.90 2.620 16.46 0 1 4 4 2 Mazda RX4 Wag 21.0 6 160 110 3.90 2.875 17.02 0 1 4 4 3 Datsun 710 22.8 4 108 93 3.85 2.320 18.61 1 1 4 1 4 Hornet 4 Drive 21.4 6 258 110 3.08 3.215 19.44 1 0 3 1 5 Hornet Sportabout 18.7 8 360 175 3.15 3.440 17.02 0 0 3 2 6 Valiant 18.1 6 225 105 2.76 3.460 20.22 1 0 3 1 newcol disp_cat disp_cat2 1 1.190909 Low Low 2 1.306818 Low Low 3 1.054545 Low Low 4 1.461364 Medium Medium 5 1.563636 Medium Medium 6 1.572727 Medium Medium
colnames(df)[ colnames(df) == "DRAT"] = "drat" #reset
50/55
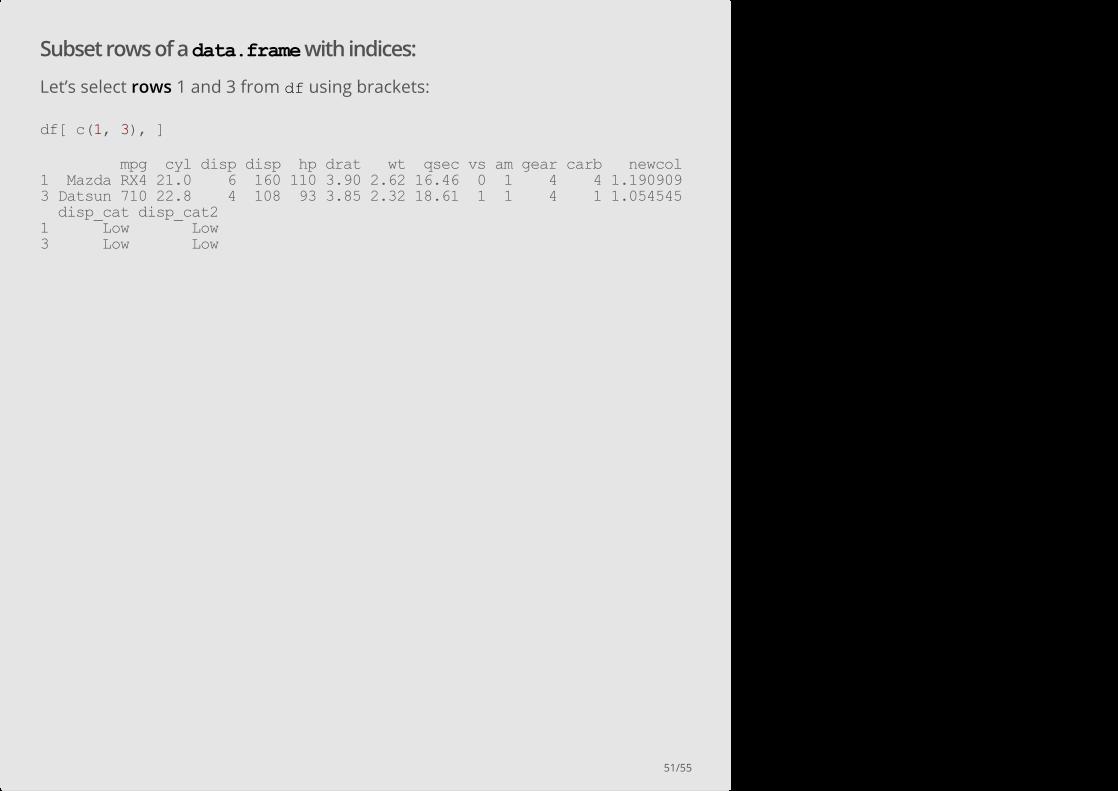
Subset rows of a data.frame with indices:
Let’s select rows 1 and 3 from df using brackets:
df[ c(1, 3), ]
mpg cyl disp disp hp drat wt qsec vs am gear carb newcol 1 Mazda RX4 21.0 6 160 110 3.90 2.62 16.46 0 1 4 4 1.190909 3 Datsun 710 22.8 4 108 93 3.85 2.32 18.61 1 1 4 1 1.054545 disp_cat disp_cat2 1 Low Low 3 Low Low
51/55

Subset columns of a data.frame:
We can also subset a data.frame using the bracket [, ] subsetting.
For data.frames and matrices (2-dimensional objects), the brackets are [rows,columns] subsetting. We can grab the x column using the index of the columnor the column name (“carb”)
df[, 11]
[1] 4 4 4 3 3 3 3 4 4 4 4 3 3 3 3 3 3 4 4 4 3 3 3 3 3 4 5 5 5 5 5 4
df[, "carb"]
[1] 4 4 1 1 2 1 4 2 2 4 4 3 3 3 4 4 4 1 2 1 1 2 2 4 2 1 2 2 4 6 8 2
52/55

Biggest difference between tbl and data.frame:
Mostly, tbl (tibbles) are the same as data.frames, except they don’t print alllines. When subsetting only one column using brackets, a data.frame will returna vector, but a tbl will return a tbl
df[, 1]
[1] "Mazda RX4" "Mazda RX4 Wag" "Datsun 710" [4] "Hornet 4 Drive" "Hornet Sportabout" "Valiant" [7] "Duster 360" "Merc 240D" "Merc 230" [10] "Merc 280" "Merc 280C" "Merc 450SE" [13] "Merc 450SL" "Merc 450SLC" "Cadillac Fleetwood" [16] "Lincoln Continental" "Chrysler Imperial" "Fiat 128" [19] "Honda Civic" "Toyota Corolla" "Toyota Corona" [22] "Dodge Challenger" "AMC Javelin" "Camaro Z28" [25] "Pontiac Firebird" "Fiat X19" "Porsche 9142" [28] "Lotus Europa" "Ford Pantera L" "Ferrari Dino" [31] "Maserati Bora" "Volvo 142E"
tbl[, 1]
# A tibble: 32 x 1 car <chr> 1 Mazda RX4 2 Mazda RX4 Wag 3 Datsun 710 4 Hornet 4 Drive 5 Hornet Sportabout 6 Valiant 7 Duster 360 8 Merc 240D 9 Merc 230 10 Merc 280 # … with 22 more rows
tbl[, "mpg"]
# A tibble: 32 x 1 mpg <dbl> 1 21 2 21 3 22.8
53/55

Subset columns of a data.frame:
We can select multiple columns using multiple column names:
df[, c("mpg", "cyl")]
mpg cyl 1 Mazda RX4 21.0 2 Mazda RX4 Wag 21.0 3 Datsun 710 22.8 4 Hornet 4 Drive 21.4 5 Hornet Sportabout 18.7 6 Valiant 18.1 7 Duster 360 14.3 8 Merc 240D 24.4 9 Merc 230 22.8 10 Merc 280 19.2 11 Merc 280C 17.8 12 Merc 450SE 16.4 13 Merc 450SL 17.3 14 Merc 450SLC 15.2 15 Cadillac Fleetwood 10.4 16 Lincoln Continental 10.4 17 Chrysler Imperial 14.7 18 Fiat 128 32.4 19 Honda Civic 30.4 20 Toyota Corolla 33.9 21 Toyota Corona 21.5 22 Dodge Challenger 15.5 23 AMC Javelin 15.2 24 Camaro Z28 13.3 25 Pontiac Firebird 19.2 26 Fiat X19 27.3 27 Porsche 9142 26.0 28 Lotus Europa 30.4 29 Ford Pantera L 15.8 30 Ferrari Dino 19.7 31 Maserati Bora 15.0 32 Volvo 142E 21.4
54/55

No rownames in tibbles!
If you run into losing a variable contained in your row names, userownames_to_column to add it before turning it into a tibble to keep them:
head(rownames_to_column(mtcars, var = "car"), 2)
car mpg cyl disp hp drat wt qsec vs am gear carb 1 Mazda RX4 21 6 160 110 3.9 2.620 16.46 0 1 4 4 2 Mazda RX4 Wag 21 6 160 110 3.9 2.875 17.02 0 1 4 4
head(as_tibble(rownames_to_column(mtcars, var = "car")), 2)
# A tibble: 2 x 12 car mpg cyl disp hp drat wt qsec vs am gear carb <chr> <dbl> <dbl> <dbl> <dbl> <dbl> <dbl> <dbl> <dbl> <dbl> <dbl> <dbl>1 Mazda RX4 21 6 160 110 3.9 2.62 16.5 0 1 4 42 Mazda RX4 W… 21 6 160 110 3.9 2.88 17.0 0 1 4 4
55/55


![Introduction to R (with Tidyverse) - Babraham Bioinf€¦ · Introduction to R (with Tidyverse) Simon Andrews v2020-02. R can just be a calculator > 3+2 [1] 5 > 2/7 [1] 0.2857143](https://img.dokumen.tips/doc/110x75/5ec5473b4cb03e2ac362f679/introduction-to-r-with-tidyverse-babraham-bioinf-introduction-to-r-with-tidyverse.jpg)