Embed Size (px)
Citation preview

SKU 33227
Innovation, Integration, Agglomeration, and Competition
Future Driversof Growth in
RWANDA
A strong and widely acknowledged record of economic success—including a three-and-a-
half-fold increase in per capita income since 1994—places Rwanda among the world’s
fastest-growing economies. Traumatic memories of the 1994 genocide are gradually fading,
as associations begin to take a more positive form—of a nation on the rise, powered by
human resilience, a sense of common purpose, and a purposeful government.
Past successes and a sense of frailty have fueled aspirations for a secure, prosperous, and
modern future. Sustaining high rates of economic growth is at the heart of these ambitions.
Recent formulations of the nation’s Vision 2050 set a target of achieving upper-middle-
income status by 2035 and high-income status by 2050.
Future Drivers of Growth in Rwanda: Innovation, Integration, Agglomeration, and
Competition, a joint undertaking by experts from Rwanda and the World Bank Group,
evaluates the country’s possibilities and options in this endeavor. The report identifies four
essential drivers of growth—innovation, integration, agglomeration, and competition—and
reforms in six priority areas: human capital development, export dynamism and regional
integration, well-managed urbanization, competitive domestic enterprises, agricultural
modernization, and capable and accountable public institutions.
Government of Rwanda
Government of Rwanda
O V E R V I E W


Overview
Future Drivers of Growth in Rwanda
Innovation, Integration, Agglomeration, and Competition

This booklet contains the overview, as well as a list of contents and other front matter, from Future Drivers of Growth in Rwanda: Innovation, Integration, Agglomeration, and Competition, doi: 10.1596/978-1-4648-1280-4. A PDF of the final, full-length book, once published, will be available at https://openknowledge.worldbank.org/ and print copies can be ordered at http://Amazon.com. Please use the final version of the book for citation, reproduction, and adaptation purposes.
© 2020 International Bank for Reconstruction and Development / The World Bank1818 H Street NW, Washington, DC 20433Telephone: 202-473-1000; Internet: www.worldbank.org
Some rights reserved
This work is a product of the staff of The World Bank with external contributions. The findings, interpreta-tions, and conclusions expressed in this work do not necessarily reflect the views of The World Bank, its Board of Executive Directors, or the governments they represent. The World Bank does not guarantee the accuracy of the data included in this work. The boundaries, colors, denominations, and other information shown on any map in this work do not imply any judgment on the part of The World Bank concerning the legal status of any territory or the endorsement or acceptance of such boundaries.
Nothing herein shall constitute or be considered to be a limitation upon or waiver of the privileges and immunities of The World Bank, all of which are specifically reserved.
Rights and Permissions
This work is available under the Creative Commons Attribution 3.0 IGO license (CC BY 3.0 IGO) http://creativecommons.org/licenses/by/3.0/igo. Under the Creative Commons Attribution license, you are free to copy, distribute, transmit, and adapt this work, including for commercial purposes, under the following conditions:
Attribution—Please cite the work as follows: World Bank and Government of Rwanda. 2020. “Future Drivers of Growth in Rwanda: Innovation, Integration, Agglomeration, and Competition.” Overview booklet. World Bank, Washington, DC. License: Creative Commons Attribution CC BY 3.0 IGO
Translations—If you create a translation of this work, please add the following disclaimer along with the attribu-tion: This translation was not created by The World Bank and should not be considered an official World Bank translation. The World Bank shall not be liable for any content or error in this translation.
Adaptations—If you create an adaptation of this work, please add the following disclaimer along with the attri-bution: This is an adaptation of an original work by The World Bank. Views and opinions expressed in the adaptation are the sole responsibility of the author or authors of the adaptation and are not endorsed by The World Bank.
Third-party content—The World Bank does not necessarily own each component of the content contained within the work. The World Bank therefore does not warrant that the use of any third-party-owned individual com-ponent or part contained in the work will not infringe on the rights of those third parties. The risk of claims resulting from such infringement rests solely with you. If you wish to re-use a component of the work, it is your responsibility to determine whether permission is needed for that re-use and to obtain permission from the copyright owner. Examples of components can include, but are not limited to, tables, figures, or images.
All queries on rights and licenses should be addressed to World Bank Publications, The World Bank Group, 1818 H Street NW, Washington, DC 20433, USA; e-mail: [email protected].
Cover and interior design: Bill Pragluski, Critical Stages, LLCCover illustration: © Municipality of Kigali. Used with permission; further permission required for reuse.

F U T U R E D R I V E R S O F G R O W T H I N R W A N D A iii
Overview Contents
Full Contents of Future Drivers of Growth in Rwanda . . . . . . . . . . . . . . . . . . . . . . . . . . . . vForeword . . . . . . . . . . . . . . . . . . . . . . . . . . . . . . . . . . . . . . . . . . . . . . . . . . . . . . . . . . . . . . xiiiAcknowledgments . . . . . . . . . . . . . . . . . . . . . . . . . . . . . . . . . . . . . . . . . . . . . . . . . . . . . . . xvExecutive Summary . . . . . . . . . . . . . . . . . . . . . . . . . . . . . . . . . . . . . . . . . . . . . . . . . . . . . . xixAbbreviations . . . . . . . . . . . . . . . . . . . . . . . . . . . . . . . . . . . . . . . . . . . . . . . . . . . . . . . . . . xxxi
Overview . . . . . . . . . . . . . . . . . . . . . . . . . . . . . . . . . . . . . . . . . . . . . . . . . . . . . . . . . . . . . 1Introduction . . . . . . . . . . . . . . . . . . . . . . . . . . . . . . . . . . . . . . . . . . . . . . . . . . . . . . . . . . . . . 1A Strong Start despite Initial Conditions and Emerging Concerns . . . . . . . . . . . . . . . . . . . . 2Future Aspirations . . . . . . . . . . . . . . . . . . . . . . . . . . . . . . . . . . . . . . . . . . . . . . . . . . . . . . . . 8Opportunities and Risks . . . . . . . . . . . . . . . . . . . . . . . . . . . . . . . . . . . . . . . . . . . . . . . . . . . 12Main Elements of Rwanda’s Growth Strategy . . . . . . . . . . . . . . . . . . . . . . . . . . . . . . . . . . 19Six Reform Areas of Importance for Rwanda . . . . . . . . . . . . . . . . . . . . . . . . . . . . . . . . . . . 22Notes . . . . . . . . . . . . . . . . . . . . . . . . . . . . . . . . . . . . . . . . . . . . . . . . . . . . . . . . . . . . . . . . . 45References . . . . . . . . . . . . . . . . . . . . . . . . . . . . . . . . . . . . . . . . . . . . . . . . . . . . . . . . . . . . . 46


F U T U R E D R I V E R S O F G R O W T H I N R W A N D A v
Full Contents of Future Drivers of Growth in Rwanda
Foreword . . . . . . . . . . . . . . . . . . . . . . . . . . . . . . . . . . . . . . . . . . . . . . . . . . . . . . . . . . . . . . xiiiAcknowledgments . . . . . . . . . . . . . . . . . . . . . . . . . . . . . . . . . . . . . . . . . . . . . . . . . . . . . . . xvExecutive Summary . . . . . . . . . . . . . . . . . . . . . . . . . . . . . . . . . . . . . . . . . . . . . . . . . . . . . . xixAbbreviations . . . . . . . . . . . . . . . . . . . . . . . . . . . . . . . . . . . . . . . . . . . . . . . . . . . . . . . . . . xxxi
Overview . . . . . . . . . . . . . . . . . . . . . . . . . . . . . . . . . . . . . . . . . . . . . . . . . . . . . . . . . . . . . 1Introduction . . . . . . . . . . . . . . . . . . . . . . . . . . . . . . . . . . . . . . . . . . . . . . . . . . . . . . . . . . . . . 1A Strong Start despite Initial Conditions and Emerging Concerns . . . . . . . . . . . . . . . . . . . . 2Future Aspirations . . . . . . . . . . . . . . . . . . . . . . . . . . . . . . . . . . . . . . . . . . . . . . . . . . . . . . . . 8Opportunities and Risks . . . . . . . . . . . . . . . . . . . . . . . . . . . . . . . . . . . . . . . . . . . . . . . . . . . 12Main Elements of Rwanda’s Growth Strategy . . . . . . . . . . . . . . . . . . . . . . . . . . . . . . . . . . 19Six Reform Areas of Importance for Rwanda . . . . . . . . . . . . . . . . . . . . . . . . . . . . . . . . . . . 22Notes . . . . . . . . . . . . . . . . . . . . . . . . . . . . . . . . . . . . . . . . . . . . . . . . . . . . . . . . . . . . . . . . . 45References . . . . . . . . . . . . . . . . . . . . . . . . . . . . . . . . . . . . . . . . . . . . . . . . . . . . . . . . . . . . . 46
1 Human Capital and Innovation . . . . . . . . . . . . . . . . . . . . . . . . . . . . . . . . . . . . . 49Introduction . . . . . . . . . . . . . . . . . . . . . . . . . . . . . . . . . . . . . . . . . . . . . . . . . . . . . . . . . . . . 49Why Is Human Capital Important for Growth? . . . . . . . . . . . . . . . . . . . . . . . . . . . . . . . . . 51A Framework for Thinking about Human Capital . . . . . . . . . . . . . . . . . . . . . . . . . . . . . . . 52Stunting . . . . . . . . . . . . . . . . . . . . . . . . . . . . . . . . . . . . . . . . . . . . . . . . . . . . . . . . . . . . . . . 53Fertility . . . . . . . . . . . . . . . . . . . . . . . . . . . . . . . . . . . . . . . . . . . . . . . . . . . . . . . . . . . . . . . 59Basic Education . . . . . . . . . . . . . . . . . . . . . . . . . . . . . . . . . . . . . . . . . . . . . . . . . . . . . . . . . 60Skills Training . . . . . . . . . . . . . . . . . . . . . . . . . . . . . . . . . . . . . . . . . . . . . . . . . . . . . . . . . . 72Tertiary Education and Innovation . . . . . . . . . . . . . . . . . . . . . . . . . . . . . . . . . . . . . . . . . . . 79Notes . . . . . . . . . . . . . . . . . . . . . . . . . . . . . . . . . . . . . . . . . . . . . . . . . . . . . . . . . . . . . . . . . 84References . . . . . . . . . . . . . . . . . . . . . . . . . . . . . . . . . . . . . . . . . . . . . . . . . . . . . . . . . . . . . 85
2 Transformation through Trade: Using Exports and Regional Integration to Drive Future Growth . . . . . . . . . . . . . . . . . . . . . . . . . . . . . . . . . 91
Introduction . . . . . . . . . . . . . . . . . . . . . . . . . . . . . . . . . . . . . . . . . . . . . . . . . . . . . . . . . . . . 91Setting the Stage: Policy, Performance, and Challenges . . . . . . . . . . . . . . . . . . . . . . . . . . . . 93

vi F U T U R E D R I V E R S O F G R O W T H I N R W A N D A
Envisioning the Future . . . . . . . . . . . . . . . . . . . . . . . . . . . . . . . . . . . . . . . . . . . . . . . . . . . 100Priority 1: Harness the EAC as a Platform for Transformation . . . . . . . . . . . . . . . . . . . . 107Priority 2: Improve Trade Connectivity by Lowering Transport Costs within the
Region and with the World . . . . . . . . . . . . . . . . . . . . . . . . . . . . . . . . . . . . . . . . . . . . . 115Priority 3: Increase Service Sector Productivity, Both as a Critical Input to Other
Priority Sectors and as a Source of Exports . . . . . . . . . . . . . . . . . . . . . . . . . . . . . . . . . 118Priority 4: Stimulate Foreign and Domestic Investment into Tradable Sectors by Using
Selective and Performance-Driven Incentives . . . . . . . . . . . . . . . . . . . . . . . . . . . . . . . 124Priority 5: Accelerate Industrialization through Diversification, Value Addition,
and Quality Upgrading . . . . . . . . . . . . . . . . . . . . . . . . . . . . . . . . . . . . . . . . . . . . . . . . 127Conclusion . . . . . . . . . . . . . . . . . . . . . . . . . . . . . . . . . . . . . . . . . . . . . . . . . . . . . . . . . . . . 128Notes . . . . . . . . . . . . . . . . . . . . . . . . . . . . . . . . . . . . . . . . . . . . . . . . . . . . . . . . . . . . . . . . 129References . . . . . . . . . . . . . . . . . . . . . . . . . . . . . . . . . . . . . . . . . . . . . . . . . . . . . . . . . . . . 130
3 Faster Urbanization, Greater Agglomeration . . . . . . . . . . . . . . . . . . . . . . . 135Introduction . . . . . . . . . . . . . . . . . . . . . . . . . . . . . . . . . . . . . . . . . . . . . . . . . . . . . . . . . . . 135The Promise of Urbanization and Agglomeration . . . . . . . . . . . . . . . . . . . . . . . . . . . . . . . 137Constraints to Successful Urbanization in Rwanda . . . . . . . . . . . . . . . . . . . . . . . . . . . . . 144Priorities for Faster Urbanization, Greater Agglomeration . . . . . . . . . . . . . . . . . . . . . . . . 151Annex 3A The Rwanda Spatial CGE Model and Scenarios . . . . . . . . . . . . . . . . . . . . . 167Notes . . . . . . . . . . . . . . . . . . . . . . . . . . . . . . . . . . . . . . . . . . . . . . . . . . . . . . . . . . . . . . . . 168References . . . . . . . . . . . . . . . . . . . . . . . . . . . . . . . . . . . . . . . . . . . . . . . . . . . . . . . . . . . . 169
4 Competitiveness and Enterprise Development for Innovation-Led Growth . . . . . . . . . . . . . . . . . . . . . . . . . . . . . . . . . . . . . . . . . . . 171
Introduction . . . . . . . . . . . . . . . . . . . . . . . . . . . . . . . . . . . . . . . . . . . . . . . . . . . . . . . . . . . 171Current State of Rwanda’s Enterprise Sector . . . . . . . . . . . . . . . . . . . . . . . . . . . . . . . . . . 172Constraints Faced by Rwanda’s Enterprise Sector . . . . . . . . . . . . . . . . . . . . . . . . . . . . . . 177Reform Agenda for Reaching Upper-Middle-Income Levels . . . . . . . . . . . . . . . . . . . . . . . 188Annex 4A Measuring Resource Misallocation . . . . . . . . . . . . . . . . . . . . . . . . . . . . . . . . 210Notes . . . . . . . . . . . . . . . . . . . . . . . . . . . . . . . . . . . . . . . . . . . . . . . . . . . . . . . . . . . . . . . . 211References . . . . . . . . . . . . . . . . . . . . . . . . . . . . . . . . . . . . . . . . . . . . . . . . . . . . . . . . . . . . 213
5 Transitioning Agriculture and Food as an Engine of Growth . . . . . . . . . 217Introduction . . . . . . . . . . . . . . . . . . . . . . . . . . . . . . . . . . . . . . . . . . . . . . . . . . . . . . . . . . . 217Policy Support for Strong Growth in Agriculture . . . . . . . . . . . . . . . . . . . . . . . . . . . . . . 219Emerging Policy Challenges . . . . . . . . . . . . . . . . . . . . . . . . . . . . . . . . . . . . . . . . . . . . . . . 221Targeting Larger Markets for Growth . . . . . . . . . . . . . . . . . . . . . . . . . . . . . . . . . . . . . . . 225Securing the Natural Resource Base for Innovation . . . . . . . . . . . . . . . . . . . . . . . . . . . . . 233Policies to Achieve Rapid and Sustainable Growth in Agriculture . . . . . . . . . . . . . . . . . . 236Annex 5A A Graphic Presentation of the TFP Story in Rwandan Agriculture . . . . . . . . 242Notes . . . . . . . . . . . . . . . . . . . . . . . . . . . . . . . . . . . . . . . . . . . . . . . . . . . . . . . . . . . . . . . . 244References . . . . . . . . . . . . . . . . . . . . . . . . . . . . . . . . . . . . . . . . . . . . . . . . . . . . . . . . . . . . 246
6 Capable and Accountable State Institutions . . . . . . . . . . . . . . . . . . . . . . . 251Introduction . . . . . . . . . . . . . . . . . . . . . . . . . . . . . . . . . . . . . . . . . . . . . . . . . . . . . . . . . . . 251Rwanda’s Record in Governance and Government Effectiveness . . . . . . . . . . . . . . . . . . . 253Remaining Governance Challenges . . . . . . . . . . . . . . . . . . . . . . . . . . . . . . . . . . . . . . . . . 258

F U L L C O N T E N T S O F F U T U R E D R I V E R S O F G R O W T H I N R W A N D A vii
An Agenda for Reforms . . . . . . . . . . . . . . . . . . . . . . . . . . . . . . . . . . . . . . . . . . . . . . . . . . 264Annex 6A Rwanda’s Territorial Organization . . . . . . . . . . . . . . . . . . . . . . . . . . . . . . . . 276Annex 6B Investment as a Share of GDP . . . . . . . . . . . . . . . . . . . . . . . . . . . . . . . . . . . 277Annex 6C Overview of the Public Investment Management Assessment Questionnaire . . . 278Notes . . . . . . . . . . . . . . . . . . . . . . . . . . . . . . . . . . . . . . . . . . . . . . . . . . . . . . . . . . . . . . . . 278References . . . . . . . . . . . . . . . . . . . . . . . . . . . . . . . . . . . . . . . . . . . . . . . . . . . . . . . . . . . . 280
BoxesO .1 Major requirements of Rwanda’s income aspirations . . . . . . . . . . . . . . . . . . . . . . 10O .2 The importance of regional value chains for growth and outward orientation
in East Asia . . . . . . . . . . . . . . . . . . . . . . . . . . . . . . . . . . . . . . . . . . . . . . . . . . . . 14O .3 Opportunities in the region around Rwanda . . . . . . . . . . . . . . . . . . . . . . . . . . . . 15O .4 An international comparison of Rwanda’s long-term growth trajectory . . . . . . . . 211 .1 What is the role of social safety nets for economic growth? . . . . . . . . . . . . . . . . . 541 .2 Confronting a learning crisis in basic education: Key areas for action . . . . . . . . . 651 .3 Increasing access to education and training in the Republic of Korea . . . . . . . . . . 671 .4 Achieving world-class education in Singapore . . . . . . . . . . . . . . . . . . . . . . . . . . . 691 .5 Lessons from China: Teacher management in Shanghai . . . . . . . . . . . . . . . . . . . . 701 .6 Technology for improving teachers’ English skills . . . . . . . . . . . . . . . . . . . . . . . . . 721 .7 A strong foundation in basic education for transforming TVET in Singapore . . . . 751 .8 Partnering with firms to invest in workforce skills in Malaysia . . . . . . . . . . . . . . . 761 .9 Developing skills for economic growth and transformation in the
“Asian Tiger” economies . . . . . . . . . . . . . . . . . . . . . . . . . . . . . . . . . . . . . . . . . 771 .10 Achieving high-quality tertiary education in the Republic of Korea . . . . . . . . . . . 832 .1 Transformation of the coffee sector . . . . . . . . . . . . . . . . . . . . . . . . . . . . . . . . . . . 952 .2 Stimulating product upgrading through a supplier development program . . . . . 1122 .3 The benefits of a mutual recognition agreement for Rwanda’s engineering
professional body . . . . . . . . . . . . . . . . . . . . . . . . . . . . . . . . . . . . . . . . . . . . . . 1222 .4 The strategy to transform the textiles, apparel, and leather sector . . . . . . . . . . . 1263 .1 Seoul becomes a global city . . . . . . . . . . . . . . . . . . . . . . . . . . . . . . . . . . . . . . . . 1393 .2 Measuring urbanization in Rwanda . . . . . . . . . . . . . . . . . . . . . . . . . . . . . . . . . . 1403 .3 Avoiding slums through property rights and infrastructure . . . . . . . . . . . . . . . . . 1543 .4 The New York grid: Transformation of structures and the economy around a
planned grid . . . . . . . . . . . . . . . . . . . . . . . . . . . . . . . . . . . . . . . . . . . . . . . . . . 1553 .5 Land readjustment for urban renewal . . . . . . . . . . . . . . . . . . . . . . . . . . . . . . . . . 1563 .6 How will urban mobility change by 2050? . . . . . . . . . . . . . . . . . . . . . . . . . . . . . 1593 .7 Examples of successful engagement by large cities with the informal sector . . . . 1603 .8 Mobilizing rural-urban links: Chengdu’s coordinated development model . . . . . 1613 .9 Land value capture: The rail + property program in Hong Kong SAR, China . . . 1633 .10 Land value capture in East Asia . . . . . . . . . . . . . . . . . . . . . . . . . . . . . . . . . . . . . 1643 .11 Updating land values in Bogotá, Colombia . . . . . . . . . . . . . . . . . . . . . . . . . . . . . 1653 .12 Institutions for market-responsive urban planning: Yokohama, Japan . . . . . . . . 1653 .13 Participatory planning and budgeting: Kerala, India . . . . . . . . . . . . . . . . . . . . . . 1663 .14 Involving stakeholders in city development: Lessons on participatory
planning from global cities . . . . . . . . . . . . . . . . . . . . . . . . . . . . . . . . . . . . . . . 1663 .15 Cross-district governance: The Republic of Korea’s happy living zones . . . . . . . 1674 .1 Is informal normal? . . . . . . . . . . . . . . . . . . . . . . . . . . . . . . . . . . . . . . . . . . . . . . 1744 .2 The global context and technological transformation . . . . . . . . . . . . . . . . . . . . . 1844 .3 The national innovation system . . . . . . . . . . . . . . . . . . . . . . . . . . . . . . . . . . . . . 185

viii F U T U R E D R I V E R S O F G R O W T H I N R W A N D A
4 .4 Rwanda’s Long-Term Saving Scheme: Opportunities and challenges . . . . . . . . . 1894 .5 Institutional framework for PPPs: An international perspective . . . . . . . . . . . . . 1944 .6 Targeted interventions in the Republic of Korea . . . . . . . . . . . . . . . . . . . . . . . . . 1974 .7 “Made in Rwanda” policy . . . . . . . . . . . . . . . . . . . . . . . . . . . . . . . . . . . . . . . . . 1984 .8 Developing Rwanda’s mining sector . . . . . . . . . . . . . . . . . . . . . . . . . . . . . . . . . . 1994 .9 The importance of firm capabilities for productivity: Examples from
Brazil, India, and Singapore . . . . . . . . . . . . . . . . . . . . . . . . . . . . . . . . . . . . . . 2054 .10 The experience of Apps .co . . . . . . . . . . . . . . . . . . . . . . . . . . . . . . . . . . . . . . . . . 2074 .11 Kigali Innovation City . . . . . . . . . . . . . . . . . . . . . . . . . . . . . . . . . . . . . . . . . . . . 2085 .1 High-value tea development in Yunnan Province, China . . . . . . . . . . . . . . . . . . 2265 .2 Horticulture and floriculture exports from East Africa . . . . . . . . . . . . . . . . . . . . 2285 .3 Successful restoration of the productive landscape on China’s Loess Plateau . . . 2355 .4 Israeli success at being more efficient with agricultural water . . . . . . . . . . . . . . . 2376 .1 A major turnaround in the Rwandan civil service . . . . . . . . . . . . . . . . . . . . . . . . 2566 .2 Imihigo: A Rwandan management tool of accountability . . . . . . . . . . . . . . . . . . 2586 .3 Relationship between trust and long-term development . . . . . . . . . . . . . . . . . . . 2596 .4 Lessons from East Asia on strengthening public administration . . . . . . . . . . . . . 2666 .5 The role of competition policy in regulatory reform in the Republic of Korea . . 268
FiguresES .1 Future drivers of Rwanda’s growth: Innovation, integration,
agglomeration, and competition . . . . . . . . . . . . . . . . . . . . . . . . . . . . . . . . . . . xxiiiO .1 Rwanda’s global rankings on Ease of Doing Business indicators . . . . . . . . . . . . . . . 3O .2 Average growth of GDP per capita in Rwanda and select countries, 2006–16 . . . . 4O .3 Sectoral labor productivity and annual change in share of employment
in Rwanda, 2000–16 . . . . . . . . . . . . . . . . . . . . . . . . . . . . . . . . . . . . . . . . . . . . . 5O .4 Human capital outcomes in Rwanda and other countries, by income level, 2015 . . . . 6O .5 Average gross domestic savings rate for Rwanda and regional comparators,
2014–16 . . . . . . . . . . . . . . . . . . . . . . . . . . . . . . . . . . . . . . . . . . . . . . . . . . . . . . . 6O .6 Rwanda’s domestic savings and investment rates, 1995–2015 . . . . . . . . . . . . . . . . 6O .7 Labor productivity and GDP per capita in Rwanda and other countries . . . . . . . . 6O .8 Total factor productivity (TFP) and GDP per capita in Rwanda and
other countries . . . . . . . . . . . . . . . . . . . . . . . . . . . . . . . . . . . . . . . . . . . . . . . . . 7O .9 Average growth of labor productivity in Rwanda, by sector, 2001–16 . . . . . . . . . . 7O .10 Price levels and GDP per capita in Rwanda and comparator countries and
economies, 2011 . . . . . . . . . . . . . . . . . . . . . . . . . . . . . . . . . . . . . . . . . . . . . . . . 8O .11 Manufacturing value added in the East African Community, 2006–16 . . . . . . . . . . 8O .12 Projected GDP per capita for Rwanda under alternate growth scenarios, 2016–50 . . . . 9O .13 Measures of global vertical integration in Rwanda, 1995–2014 . . . . . . . . . . . . . . 14O .14 Share of global net outflows of foreign direct investment, by region, 1994–2016 . . . . . 17O .15 Growth scenarios for Rwanda and share of the population, by consumption
category, by 2040 . . . . . . . . . . . . . . . . . . . . . . . . . . . . . . . . . . . . . . . . . . . . . . . 19O .16 Labor productivity gaps in Rwanda, by sector, 2014 . . . . . . . . . . . . . . . . . . . . . . 19O .17 Future drivers of Rwanda’s growth: Innovation, integration, agglomeration,
and competition . . . . . . . . . . . . . . . . . . . . . . . . . . . . . . . . . . . . . . . . . . . . . . . . 20BO .4 .1 GDP per capita in Rwanda and select countries and economies . . . . . . . . . . . . . . 21O .18 Early-grade “bulge index” in Rwanda and select countries . . . . . . . . . . . . . . . . . . 24O .19 Projected share of Rwanda’s workforce with tertiary education under
two growth scenarios, 2010–50 . . . . . . . . . . . . . . . . . . . . . . . . . . . . . . . . . . . . 25O .20 Exports as a share of GDP and log GDP per capita in Rwanda, 2000–16 . . . . . . 28

O .21 Intra-bloc goods imports as a share of GDP before and after joining the bloc . . . 29O .22 Changes in urbanization and income in East Asia and Pacific and in
Sub-Saharan Africa, 1985–2010 . . . . . . . . . . . . . . . . . . . . . . . . . . . . . . . . . . . . 32O .23 Share of firms in Rwanda, by firm size, 2011 and 2014 . . . . . . . . . . . . . . . . . . . . 36O .24 Resource misallocation in formal manufacturing in Rwanda and select countries . . . . 37O .25 Decomposition of sources of agricultural growth in Rwanda, 1961–2014 . . . . . . 39O .26 Benchmarking of Rwanda along the various dimensions of governance . . . . . . . . 42O .27 A framework for assessing effectiveness of state institutions in Rwanda . . . . . . . . 441 .1 Human capital outcomes in Rwanda and other countries, by
income level, 2015 . . . . . . . . . . . . . . . . . . . . . . . . . . . . . . . . . . . . . . . . . . .501 .2 Rates of human capital in Rwanda and the Republic of Korea at similar
income levels . . . . . . . . . . . . . . . . . . . . . . . . . . . . . . . . . . . . . . . . . . . . . . . . . . . 521 .3 The array of human capital investments . . . . . . . . . . . . . . . . . . . . . . . . . . . . . . . 531 .4 The trade-off between lower returns now and higher returns later . . . . . . . . . . . . 531 .5 Stunting rate in Rwanda versus the world, 1995–2015 . . . . . . . . . . . . . . . . . . . . . 541 .6 Prevalence of stunting and GDP per capita, 2017 . . . . . . . . . . . . . . . . . . . . . . . . . 551 .7 Prevalence of stunting in Rwanda, by wealth quintile, 2000–15 . . . . . . . . . . . . . 551 .8 Reduction in stunting in countries with less than 50 percent stunting . . . . . . . . . . 571 .9 Projected reduction in stunting in Rwanda, 2000–35 . . . . . . . . . . . . . . . . . . . . . . 581 .10 School completion rates in primary and secondary school in Rwanda
compared with countries at different levels of income, 2017 . . . . . . . . . . . . . . 611 .11 Early-grade “bulge index” in Rwanda and select countries . . . . . . . . . . . . . . . . . . 621 .12 Gap between actual and learning-adjusted years of schooling in select
countries and economies . . . . . . . . . . . . . . . . . . . . . . . . . . . . . . . . . . . . . . . . . 631 .13 Key proximate determinants of learning . . . . . . . . . . . . . . . . . . . . . . . . . . . . . . . . 641 .14 Lag in teacher salaries in Rwanda, by primary and secondary levels . . . . . . . . . . . 661 .15 Current and projected primary and lower-secondary completion in
Rwanda, 2000–35 . . . . . . . . . . . . . . . . . . . . . . . . . . . . . . . . . . . . . . . . . . . . . . 671 .16 Enrollment in secondary TVET, by region and within Africa, circa
2000 and 2014 . . . . . . . . . . . . . . . . . . . . . . . . . . . . . . . . . . . . . . . . . . . . . . . . . 731 .17 Conceptual framework outlining the links between higher education
and economic growth . . . . . . . . . . . . . . . . . . . . . . . . . . . . . . . . . . . . . . . . . . . . 791 .18 Projected share of Rwanda’s workforce with tertiary education under
two growth scenarios, 2010–50 . . . . . . . . . . . . . . . . . . . . . . . . . . . . . . . . . . . . 791 .19 Current and projected tertiary enrollment in Rwanda, 2000–35 . . . . . . . . . . . . . . 801 .20 Number of Rwandan scientific publications available on the Web of Science,
1970–2015 . . . . . . . . . . . . . . . . . . . . . . . . . . . . . . . . . . . . . . . . . . . . . . . . . . . . 801 .21 Tertiary enrollment rate as a function of secondary completion rates . . . . . . . . . 811 .22 Spending on tertiary education in Rwanda versus other countries, circa 2000
and 2015 . . . . . . . . . . . . . . . . . . . . . . . . . . . . . . . . . . . . . . . . . . . . . . . . . . . . . 821 .23 Current spending on education and health in Rwanda relative to other
countries in the world . . . . . . . . . . . . . . . . . . . . . . . . . . . . . . . . . . . . . . . . . . . . 842 .1 Rwanda’s Ease of Doing Business Ranking, 2007–19 . . . . . . . . . . . . . . . . . . . . . . 93B2 .1 .1 Number of coffee-washing stations and average price of coffee cherries
in Rwanda, 2002–15 . . . . . . . . . . . . . . . . . . . . . . . . . . . . . . . . . . . . . . . . . . . . 962 .2 Value of Rwandan exports, by destination, 2001–16 . . . . . . . . . . . . . . . . . . . . . . 962 .3 Exports of Rwandan goods, by destination, 2016 . . . . . . . . . . . . . . . . . . . . . . . . 972 .4 Agroprocessing and other manufacturing as a share of total exports
in Rwanda, 2005–16 . . . . . . . . . . . . . . . . . . . . . . . . . . . . . . . . . . . . . . . . . . . . 972 .5 Ranking of revealed comparative advantage for East African
Community countries, 2013 . . . . . . . . . . . . . . . . . . . . . . . . . . . . . . . . . . . . . . . 98
F U L L C O N T E N T S O F F U T U R E D R I V E R S O F G R O W T H I N R W A N D A ix

x F U T U R E D R I V E R S O F G R O W T H I N R W A N D A
2 .6 Value and volume index of Rwandan commodity exports, 2000–15 . . . . . . . . . . 992 .7 Share of export value in Rwanda, 2009–16 . . . . . . . . . . . . . . . . . . . . . . . . . . . . . 992 .8 Labor productivity in Rwanda, 2005 and 2014 . . . . . . . . . . . . . . . . . . . . . . . . . 1002 .9 Rwanda’s financing stock, by sector, 2006–15 . . . . . . . . . . . . . . . . . . . . . . . . . . 1002 .10 Exports as a share of GDP and log GDP per capita in Rwanda, 2000–16 . . . . . 1012 .11 Cumulative exports as a share of GDP in Rwanda, 2005–16, and potential
trajectory to upper-middle-income status by 2035 . . . . . . . . . . . . . . . . . . . . . 1062 .12 Intra-bloc goods imports as a share of GDP before and after joining the bloc . . . . 1072 .13 Total imports of exporting versus nonexporting firms in Rwanda, 2008–14 . . . 1082 .14 Impact of One Network Area on mobile phone traffic
between Rwanda and Kenya . . . . . . . . . . . . . . . . . . . . . . . . . . . . . . . . . . . . . . 1132 .15 Average transport time, by route . . . . . . . . . . . . . . . . . . . . . . . . . . . . . . . . . . . . 1162 .16 Transport rates for a 40-foot container, by route . . . . . . . . . . . . . . . . . . . . . . . . 1162 .17 Tertiary gross enrollment rate and log services exports per capita, 2000–16 . . . 1232 .18 Upper-secondary completion rate and log services exports per capita, 2000–16 . . . 1232 .19 Number of professionals per 100,000 inhabitants in select African countries . . . 1242 .20 FDI stock as a share of GDP in select East African countries, 2000–16 . . . . . . . 1253 .1 Changes in urbanization and income in East Asia and Pacific, 1985–2010 . . . . . 1383 .2 Contribution of urbanization to structural transformation and
labor productivity in Rwanda, 2002–12 . . . . . . . . . . . . . . . . . . . . . . . . . . . . . 1413 .3 Simulated changes in growth outcomes with faster urbanization in Rwanda . . . 1413 .4 Puga Index of connectedness in Kigali and select comparators . . . . . . . . . . . . . . 1443 .5 Share and scale of rural-urban migration in Rwanda, 2014 . . . . . . . . . . . . . . . . 1493 .6 Remittances from Kigali (and other locations) to rural areas of Rwanda,
by province . . . . . . . . . . . . . . . . . . . . . . . . . . . . . . . . . . . . . . . . . . . . . . . . . . . 149B3 .5 .1 Land readjustment . . . . . . . . . . . . . . . . . . . . . . . . . . . . . . . . . . . . . . . . . . . . . . . 1574 .1 Share of firms in Rwanda, by firm size, 2011 and 2014 . . . . . . . . . . . . . . . . . . . 1724 .2 Share of employment in Rwanda, by firm size, 2011 and 2014 . . . . . . . . . . . . . 1724 .3 Share of firms and employment in Rwanda, by year of establishment . . . . . . . . . 1734 .4 Share of firms and employment in Rwanda, by sector, 2011 and 2014 . . . . . . . . 1734 .5 Informality as a share of total firms and employment in
Rwanda, 2011 and 2014 . . . . . . . . . . . . . . . . . . . . . . . . . . . . . . . . . . . . . . . . 174B4 .1 .1 Informal employment as a share of GDP per capita in Latin America
and Southeast Asia, various years . . . . . . . . . . . . . . . . . . . . . . . . . . . . . . . . . . 1754 .6 Number of formal firms and total employment in Rwanda, by type of
firm, 2011–16 . . . . . . . . . . . . . . . . . . . . . . . . . . . . . . . . . . . . . . . . . . . . . . . . . 1764 .7 Number and share of exporters in Rwanda, by sector, 2015 . . . . . . . . . . . . . . . 1764 .8 Price levels and GDP per capita in Rwanda and comparator
countries and economies, 2011 . . . . . . . . . . . . . . . . . . . . . . . . . . . . . . . . . . . . 1774 .9 Average lending and deposit rates in Rwanda, 2000–17 . . . . . . . . . . . . . . . . . . 1784 .10 Cost of electricity in Rwanda and other Sub-Saharan African countries, 2016 . . . . 1794 .11 Rwanda’s global rankings on Ease of Doing Business indicators . . . . . . . . . . . . . 1794 .12 Labor productivity and GDP per capita in Rwanda and other countries . . . . . . . 1804 .13 Average growth of labor productivity in Rwanda, by sector, 2001–16 . . . . . . . . 1814 .14 Total factor productivity and GDP per capita in Rwanda and other countries . . . . 1814 .15 Resource misallocation in formal manufacturing in Rwanda and select countries . . . 1824 .16 Probability of receiving tax incentives in Rwanda, by size of firm
revenue, 2013–16 . . . . . . . . . . . . . . . . . . . . . . . . . . . . . . . . . . . . . . . . . . . . . . 1824 .17 Sectoral revenue growth and tax incentives in Rwanda, 2010–16 . . . . . . . . . . . . 1834 .18 Correlation between innovation capacity and total factor productivity . . . . . . . 184
B4 .3 .1 The national innovation system as an ecosystem for economywide innovation . . . . 1854 .19 Ranking of Rwanda and other East African Community countries on
the Global Innovation Index, 2013 and 2017 . . . . . . . . . . . . . . . . . . . . . . . . .1864 .20 Frontier of innovation capacity in Rwanda, South Africa, and Switzerland . . . . 1864 .21 Quality of research institutions and number of patent applications in
Rwanda and other countries . . . . . . . . . . . . . . . . . . . . . . . . . . . . . . . . . . . . . 1874 .22 Number of trademark applications and registrations in Rwanda, 2001–15 . . . . 1884 .23 The capabilities escalator: A framework to support innovation
and entrepreneurial activity . . . . . . . . . . . . . . . . . . . . . . . . . . . . . . . . . . . . . . . 2045 .1 Decomposition of sources of agricultural growth in Rwanda, 1961–2014 . . . . . 2215A .1 Heuristic diagram of the production possibility frontier . . . . . . . . . . . . . . . . . . . 2436 .1 Relationship between government effectiveness and level of development . . . . . 2536 .2 Benchmarking of Rwanda along the various dimensions of governance . . . . . . . 2546 .3 Correlation between prosecution of office abuse and GDP per capita . . . . . . . . . 2546 .4 Revenue (tax and nontax) excluding grants . . . . . . . . . . . . . . . . . . . . . . . . . . . . 2556 .5 Rwanda’s decentralization framework for service delivery . . . . . . . . . . . . . . . . . 2576 .6 A framework for assessing effectiveness of state institutions in Rwanda . . . . . . . 2596 .7 Rwanda’s performance on product market regulations . . . . . . . . . . . . . . . . . . . . 2626 .8 Public and publicly guaranteed debt as a percentage of GDP in
Rwanda, 2010–17 . . . . . . . . . . . . . . . . . . . . . . . . . . . . . . . . . . . . . . . . . . . . . 2636 .9 The main elements for an efficient and capable civil service . . . . . . . . . . . . . . . . 2666A .1 Territorial organization in Rwanda . . . . . . . . . . . . . . . . . . . . . . . . . . . . . . . . . . 2776B .1 Gross fixed capital formation as a share of GDP in Rwanda, 1965–2015 . . . . . . 277
Maps1 .1 Prevalence of stunting in Rwanda, by district, 2014–15 . . . . . . . . . . . . . . . . . . . . 553 .1 Visualizing economic concentration across five countries . . . . . . . . . . . . . . . . . 1393 .2 Fragmentation of densities beyond the central business district of Kigali . . . . . . 1453 .3 Built land in Kigali, 1990, 2000, and 2010 . . . . . . . . . . . . . . . . . . . . . . . . . . . . . 1463 .4 Building footprint in central areas of three secondary cities in Rwanda . . . . . . . 1463 .5 Location of formal jobs in Kampala, Uganda; Lusaka, Zambia; and
Kigali, Rwanda . . . . . . . . . . . . . . . . . . . . . . . . . . . . . . . . . . . . . . . . . . . . . . . . 1473 .6 Changes in building stock in Kigali, by cell, 2009–15 . . . . . . . . . . . . . . . . . . . . . 1473 .7 Simulated change in access to employment in Kigali with a 50 percent
drop in bus journey speed . . . . . . . . . . . . . . . . . . . . . . . . . . . . . . . . . . . . . . . . 1483 .8 Location of planned imidugudu (grouped villages) in 12 districts of
Rwanda, 2016–17 . . . . . . . . . . . . . . . . . . . . . . . . . . . . . . . . . . . . . . . . . . . . . 1503 .9 Variation in tomato prices in western Rwanda . . . . . . . . . . . . . . . . . . . . . . . . . 1513 .10 Expressways in the Republic of Korea, 1970–2015 . . . . . . . . . . . . . . . . . . . . . . 1523 .11 Goldilocks density: Getting density “just right” through fine-grain
differentiation and adaptation over time . . . . . . . . . . . . . . . . . . . . . . . . . . . . . 153B3 .4 .1 Plan of Manhattan, New York City, 1811 . . . . . . . . . . . . . . . . . . . . . . . . . . . . . 1563 .12 Concentrated urban development and universal basic services in the
Republic of Korea . . . . . . . . . . . . . . . . . . . . . . . . . . . . . . . . . . . . . . . . . . . . . 162
PhotosB3 .5 .1 Way-markers map plot boundaries . . . . . . . . . . . . . . . . . . . . . . . . . . . . . . . . . . . 157B3 .5 .2 Land readjustment sites in Gahanga, Kigali . . . . . . . . . . . . . . . . . . . . . . . . . . . . 157B5 .3 .1 China’s Loess Plateau, 1990 and 2012 . . . . . . . . . . . . . . . . . . . . . . . . . . . . . . . . 236
F U L L C O N T E N T S O F F U T U R E D R I V E R S O F G R O W T H I N R W A N D A xi

xii F U T U R E D R I V E R S O F G R O W T H I N R W A N D A
TablesO .1 Social and economic indicators in Rwanda compared with low- and
middle-income-country averages, 1994 and 2015 . . . . . . . . . . . . . . . . . . . . . . . . 5BO .1 .1 Aspirational high-growth scenario for Rwanda: Demand-side requirements,
2000–35 . . . . . . . . . . . . . . . . . . . . . . . . . . . . . . . . . . . . . . . . . . . . . . . . . . . . . . 10BO .1 .2 Aspirational high-growth scenario for Rwanda: Productivity requirements . . . . . 11BO .1 .3 Aspirational high-growth scenario for Rwanda: Sectoral share of
employment, 2000–35 . . . . . . . . . . . . . . . . . . . . . . . . . . . . . . . . . . . . . . . . . . . 11BO .1 .4 Aspirational high-growth scenario for Rwanda: Sectoral share of GDP,
2000–35 . . . . . . . . . . . . . . . . . . . . . . . . . . . . . . . . . . . . . . . . . . . . . . . . . . .111 .1 Distribution of tertiary students in Rwanda, by field of study . . . . . . . . . . . . . . . . 822 .1 Ease of Doing Business 2019 ranking for Rwanda and average for the
East African Community . . . . . . . . . . . . . . . . . . . . . . . . . . . . . . . . . . . . . . . . . . 942 .2 Rwandan exports, by sector, 2005 and 2016 . . . . . . . . . . . . . . . . . . . . . . . . . . . . 952 .3 Decomposition of merchandise export growth, 2008–13 . . . . . . . . . . . . . . . . . . . 992 .4 Manufacturing subsectors, grouped by pro-development characteristics . . . . . . . 1032 .5 Labor costs in manufacturing in select countries . . . . . . . . . . . . . . . . . . . . . . . . 1032 .6 Service subsectors in Rwanda, grouped by pro-development characteristics . . . . 1042 .7 Rwanda’s labor productivity and participation in the external sector, 2015 . . . . 1082 .8 Cost of electricity in 2016 in select East African Community countries . . . . . . . 1142 .9 Stock of foreign direct investment in Rwanda, by sector, 2015 . . . . . . . . . . . . . . 1253 .1 Share of firms in Kampala, Uganda; Lusaka, Zambia; and Kigali,
Rwanda, by size, 2011 . . . . . . . . . . . . . . . . . . . . . . . . . . . . . . . . . . . . . . . . . . 1474 .1 Efficiency and profitability of banks in Rwanda and other East African
Community countries, 2013 . . . . . . . . . . . . . . . . . . . . . . . . . . . . . . . . . . . . . . 1784 .2 Share of total tax revenue for firms, by return on investment with and
without incentives . . . . . . . . . . . . . . . . . . . . . . . . . . . . . . . . . . . . . . . . . . . . . . 1834 .3 Large exposures in the banking sector in Rwanda, 2015–17 . . . . . . . . . . . . . . . 1914 .4 State-owned enterprise policy initiatives in the OECD since 2006 . . . . . . . . . . . 2024 .5 Use of science, technology, and innovation funding initiatives in Rwanda . . . . . 2095 .1 Rwanda’s main agricultural exports, 2012/13 to 2015/16 . . . . . . . . . . . . . . . . . 227B5 .2 .1 Exports to Europe of flowers, vegetables, and fruits from select
African countries, 2017 . . . . . . . . . . . . . . . . . . . . . . . . . . . . . . . . . . . . . . . . . 2285 .2 Indicators of comparative advantage for select crops in Rwanda, 2016 . . . . . . . 2305 .3 Exports of Irish potatoes and green beans by Rwanda and select African
competitors, 2003 and 2013 . . . . . . . . . . . . . . . . . . . . . . . . . . . . . . . . . . . . . . 2315 .4 Response of demand to a 1 percent increase in household income in
Rwanda, by degree of urbanization . . . . . . . . . . . . . . . . . . . . . . . . . . . . . . . . 2326 .1 The Rwanda Governance Scorecard: Scores for 2016 compared with
previous scores . . . . . . . . . . . . . . . . . . . . . . . . . . . . . . . . . . . . . . . . . . . . . . . . 2536 .2 Components and ratings of public investment management framework . . . . . . . 255

F U T U R E D R I V E R S O F G R O W T H I N R W A N D A xiii
Foreword
A widely acknowledged record of more than two decades of strong eco-nomic growth—including a three-
and-half-fold increase in per capita income since 1994—has placed Rwanda among the fastest-growing economies in Africa and the world . Traumatic memories of the 1994 genocide, still prevalent, are gradually fading, as associations begin to take a more positive form—of a nation on the rise, powered by human resilience, a sense of common pur-pose, and a purposeful government .
Having launched its development with a measure of success, Rwanda is now keen to forge a future of security, prosperity, and modernity . Sustaining high rates of inclu-sive economic growth is at the heart of these ambitions . Future aspirations in this regard are high, with Vision 2050 aspiring to achieve upper-middle-income status by 2035 and high-income status by 2050 . These aspi-rations translate into average annual growth rates of more than 10 percent .
Motivated by these aspirations, in May 2017, the government of Rwanda and the World Bank Group jointly initiated this study
on the future drivers of growth to inform Rwanda’s Vision 2050 . The report identifies four essential and interdependent drivers: innovation, integration, agglomeration, and competition . These future drivers of growth, in turn, would receive the necessary boost from reforms in six priority areas: (a) human capital development; (b) export dynamism and regional integration; (c) well-managed urban-ization; (d) competitive domestic enterprises; (e) agricultural modernization; and (f) capable and accountable public institutions .
The report has already helped to shape the reform agenda in all of the above six prior-ity areas . The study has been conducted at the same time Rwanda was developing its national strategy for transformation (2017–2024) and Rwanda Vision 2050 . Both have been informed by recommendations from the study . For example, the report’s find-ings about challenges facing Rwanda in human capital motivated the government to redouble its efforts by fighting malnutrition, launching reforms for improving the quality of education at all levels, and establishing the National Early Childhood Development

xiv F U T U R E D R I V E R S O F G R O W T H I N R W A N D A
Program to coordinate all interventions on early childhood development and fighting malnutrition .
We are delighted by the close partnership forged between the experts from Rwanda and the World Bank Group in preparation
of this report . We are convinced that keeping the momentum in implementing the recom-mendations offered will support Rwanda’s development journey and take it closer to the transformed society it aspires to be .
Hafez M . H . Ghanem Dr . Ngirente EdouardVice President, Africa Region Prime Minister of the Republic of RwandaThe World Bank

F U T U R E D R I V E R S O F G R O W T H I N R W A N D A xv
Acknowledgments
F uture Drivers of Growth in Rwanda: Innovation, Integration, Agglomeration, and Competition is a joint initiative of
the Government of Rwanda and the World Bank Group, emanating from a March 2017 agreement between President Paul Kagame of Rwanda and Jim Yong Kim, President of the World Bank Group .
The report was written by a joint Rwanda-World Bank Group team under the supervi-sion and guidance of Uzziel Ndagijimana (Minister of Finance and Economic Planning), Claver Gatete (Minister of Infrastructure and Former Minister of Finance and Economic Planning), the late Jan Walliser (Former Vice President, Equitable Growth, Finance, and Institutions Practice Group, World Bank Group), Makhtar Diop (Vice President for Infrastructure and Former Vice President for Africa Region, World Bank Group), Hafez M . H . Ghanem (Vice President for Africa Region, World Bank Group), Diarietou Gaye (Director of Strategy and Operations of Africa Region and Former Country Director for Rwanda, World Bank Group), Ceyla Pazarbasioglu-Dutz (Vice President, Equitable Growth, Finance, and Institutions Practice Group, World Bank Group), and Carlos Felipe Jaramillo (Country Director for Rwanda and Former Senior Director, Macroeconomics, Trade and Investment Global Practice, World Bank Group) . The National Steering Committee for the National Strategy for
Transformation and Rwanda Vision 2050 provided guidance to the team and validated the report .
A joint Rwanda–World Bank Group team was established to prepare the report . Team leaders were Leonard Rugwabiza Minega (Economic Advisor to the Minister of Finance and Economic Planning) and Sandeep Mahajan (Practice Manager, Macroeconomics, Trade and Investment Global Practice, World Bank Group) .
Financial support from the Republic of Korea is gratefully acknowledged .
William Maloney (Chief Economist, Equitable Growth, Finance, and Institutions Practice Group, World Bank Group), Richard Newfarmer (Country Director for Uganda and Rwanda, International Growth Centre), and Andrew Nyamvumba (Former Head, Strategy and Policy Unit, Office of the President, Republic of Rwanda) were senior advisers for the report . The report also benefitted from valuable comments from peer reviewers David Dollar (Senior Fellow, John L . Thornton China Center, Brookings Institution), Mona Haddad (Director, International Finance Corporation), Steve Jaffee (Lead Agriculture Economist, World Bank Group), Godfrey Kabera (Director General, National Planning and Research, Ministry of Finance and Economic Planning), Michael Woolcock (Lead Social Scientist, World Bank Group), and Albert Zeufack

xvi F U T U R E D R I V E R S O F G R O W T H I N R W A N D A
(Chief Economist for Africa Region, World Bank Group), as well as the following reviewers who provided comments on the concept note and the decision draft: Emre Alper (Senior Economist, International Monetary Fund), Iftikhar Malik (Senior Social Protection Specialist, World Bank Group), Laura Rawlings (Lead Social Protection Specialist, World Bank Group), Laure Redifer (Deputy Division Chief, International Monetary Fund), and Alun Thomas (Former Resident Representative in Rwanda, International Monetary Fund) .
We extend special thanks for the insights and recommendations received from Abebe Adugna (Practice Manager, Macroeconomics, Trade and Investment, World Bank Group), Anstes Agnew (Country Head for Rwanda at Tony Blair Institute for Global Change), Yasser El-Gammal (Country Manager for Rwanda, World Bank Group), Obald Hakizimana (Economist, Ministry of Finance and Economic Planning), Mary Hallward-Driemeier (Senior Economic Adviser, World Bank Group), Emmanuel Hategeka (Deputy Ch ief Execut ive Officer, Rwanda Development Board), Thierry Mihigo Kalisa (Senior Economist, Minist ry of Finance and Economic Planning), Danny Leipziger (Managing Director of Growth Dialogue and Professor of Practice of International Business, George Washington University), Norman V . Loayza (Lead Economist, World Bank Group), Johan A . Mistiaen (Program Leader, World Bank Group), Geraldine Mukeshimana (Minister for Agriculture and Animal Resources), Ildephonse Musafiri (Head of the Strategy and Policy Unit, Office of the President, Republic of Rwanda), Richard Mushabe (Division Manager of National Planning and Research Division, Ministry of Finance and Economic Planning), Tom O’Brien (Senior Adviser, World Bank Group), Amina Rwakunda (Chief Economist, Ministry of Finance and Economic Planning), Kampeta Pitchette Sayinzoga (Director General, National Industrial Research and Development Agency of Rwanda), Claudine Uwera (State Minister, Ministry of
Finance and Economic Planning), and Ariane Zingiro (Planning and Program Special ist , Ministry of Finance and Economic Planning) .
The report was edited by William Shaw . Production and publication were managed by Stephen Pazdan and Patricia Katayama of the World Bank Group’s Formal Publishing Program .
The report has an overview and six chap-ters written by individual chapter teams, whose members are presented in alphabetical order by their surnames .
OverviewLead authors: Sandeep Mahajan (Practice Manager, Macroeconomics, Trade and Investment, World Bank Group) and Leonard Rugwabiza Minega (Economic Advisor to the Minister of Finance and Economic Planning) .
Chapter 1: Human Capital and InnovationLead authors: David Evans (Lead Economist, World Bank Group) and François Ngoboka (Division Manager, Former Capacity Development and Employment Services Board) .
Core team: Rose Baguma (Director General of Education Policy and Planning, Minist ry of Educat ion), Dr . Ignace Gatare (Principal, College of Science and Technology, University of Rwanda), Deepika Ramachandran (Consultant), Jee-Peng Tan (Consultant), and Fei Yuan (Consultant) .
Chapter 2: Transformation through Trade: Using Exports and Regional Integration to Drive Future GrowthLead authors: Thomas R . Kigabo (Chief Economist, National Bank of Rwanda), Richard Newfarmer (Country Director, International Growth Centre), and Victor Steenbergen (Former Country Economist, International Growth Centre) .

A C k N O W L E D G m E N T S xvii
Core team: John H . Arnold (Consultant), Robert Opirah (Director General for Trade and Investment, Ministry of Trade and Industry), and Cordula Rastogi (Senior Economist, World Bank Group) .
Chapter 3: Faster Urbanization, Greater AgglomerationLead authors: Narae Choi (Urban Specialist, World Bank Group), Edward Kyazze (Manager of Urbanization and Human Settlements Division, Ministry of Infrastructure), Somik V . Lall (Lead Urban Economist, World Bank Group), and Sally Beth Murray (Former Senior Country Economist, International Growth Centre) .
The chapter builds on an International Food Policy Research Institute (IFPRI) research paper by Xinshen Diao, Peixun Fang, Josée Randriamamonjy, and James Thurlow and on background notes by David Bridgman (Lead Private Sector Specialist, World Bank Group) and Hoza Thierry Ngoga (Consultant) .
Chapter 4: Competitiveness and Enterprise Development for Innovation-Led GrowthLead authors: Claire Honore Hollweg (Senior Economist, World Bank Group), Aghassi Mkrtchyan (Senior Economist, World Bank Group), Jani Moliis (Former Country Head for Rwanda at Tony Blair Institute for Global Change), and Jean Louis Uwitonze (Former Director General of Planning, Ministry of Trade and Industry) .
Core team: Teymour Abdel Aziz (Senior Financial Sector Specialist, World Bank Group), Brice Gakombe (Financial Sector Specialist, World Bank Group), Justin Piers William Hill (Senior Private Sector Specialist, World Bank Group), Louise Kanyonga (Head, Competitiveness and Business Reforms, Rwanda Development Board), Hibret Belete Maemir (Economist, World Bank Group), Gaurav Nayyar
(Senior Economist, World Bank Group), Peace Aimée Niyibizi (Economist, World Bank Group), Pierre Sauve (Senior Private Sector Specialist, World Bank Group), and Marcio Jose Vargas da Cruz (Senior Economist, World Bank Group) .
The chapter builds on background papers and notes prepared by David Bridgman (Lead Private Sector Specialist, World Bank Group), Joern Huenteler (Energy Specialist, World Bank Group), Maksym Iavorskyi (Operations Analyst, World Bank Group), Danny Leipziger (Managing Director of Growth Dialogue and Professor of Practice of International Business, George Washington Un ivers it y), H ibre t B ele te Maemi r (Economist, World Bank Group), William Peter Mako (Consultant), Hoza Thierry Ngoga (Consultant), Ha Minh Nguyen (Economist, World Bank Group), Yadviga Viktorivna Semikolenova (Senior Energy Economist, World Bank Group), Victor Steenbergen (Former Country Economist, International Growth Centre), Desiree Van Welsum (Consultant), Jan Erik von Uexkull (Senior Economist, World Bank Group), and Ezequiel Zylberberg (Consultant) .
Chapter 5: Transitioning Agriculture and Food as an Engine of Growth Lead authors: Christopher L . Delgado (Consultant) and Dr . Octave Semwaga (Director General of Planning, Ministry of Agriculture and Animal Resources) .
Core team: Winston Dawes (Senior Agriculture Economist , World Bank Group), Aparajita Goyal (Senior Economist, World Bank Group), Christopher Jackson (Senior Agriculture Specialist, World Bank Group), and Aimée Marie Ange Mpambara (Agricultural Special ist , World Bank Group) .
The chapter builds on an International Food Policy Research Institute (IFPRI) research paper by Xinshen Diao, Peixun Fang, Josée Randriamamonjy, and James Thurlow .

xviii F U T U R E D R I V E R S O F G R O W T H I N R W A N D A
Chapter 6: Capable and Accountable State Institutions Lead authors: Shyaka Anastase (Former Chief Executive Officer, Rwanda Governance Board), Nicoletta Feruglio (Senior Public Sector Specialist, World Bank Group), and Gael J . R . F . Raballand (Lead Public Sector Specialist, World Bank Group) .
Core team: Monica Beuran (Consultant), Deborah Hannah Isser (Lead Governance Specialist, World Bank Group), and Felicién Nsengumukiza (Head, Governance , Research, and Monitoring Department, Rwanda Governance Board) .
The chapter builds on background papers by Jonathan Argent (Consultant), Tania Begazo (Senior Economist, World Bank
Group), David Bridgman (Lead Private Sector Specialist, World Bank Group), Maksym Iavorskyi (Operations Analyst, World Bank Group), and Hoza Thierry Ngoga (Consultant) .
Administration and coordination activities were managed by Lydie Ahodehou (Program Assistant, World Bank Group) and Sylvie Ingabire (Executive Assistant, World Bank Group) .
It is with great pleasure that the Government of Rwanda and the World Ban k Group i nt roduce t he repor t Future Drivers of Growth in Rwanda: Innovation, Integration, Agglomeration, and Competition . We hope that Rwandan citizens and all actors of development in Rwanda will find it useful .

F U T U R E D R I V E R S O F G R O W T H I N R W A N D A xix
Executive Summary
Rwanda: the land of a thousand hills, untold beauty, a poignant past, and boundless ambition . It has, in a way, become an important fragment of modern consciousness . Traumatic memories of the 1994 genocide against the Tutsi, still prevalent, are fading
gradually, as associations begin to take a more positive form: a nation on the rise, powered by human resilience, a sense of common purpose, and a purposeful government . Past successes, combined with a sense of frailty, have fueled bold ambitions for the future . But these are early days, and Rwanda is keen to continue taking meaningful strides toward becoming a more hopeful, secure, modern, and prosperous nation . Strong and inclusive growth sustained over an extended period is at the heart of these ambitions . This report—a joint undertaking by experts from Rwanda and the World Bank—seeks to evaluate the country’s possibilities and options in this endeavor .
IntroductionAfter 1994 everything was a priority and our people were completely broken . But we made three fundamental choices that guide us to this day . One—we chose to stay together . Two—we chose to be accountable to ourselves . Three—we chose to think big .
—His Excellency President Paul Kagame in a speech on the 20th Commemoration
of the genocide against the Tutsi (April 7, 2014)
Every country, born of unique circumstances, can claim with good justification to be spe-cial . Rwanda’s claims are self-evident in both what is manifest and what is being sought . A strong and widely acknowledged record of economic success— including a three-and-a-half-fold increase in per capita income since 1994—places Rwanda among the world’s
fastest-growing economies, surpassed on the continent only by Ethiopia . Equally striking are its ambitions and approaches . In ambi-tion, it models itself after the East Asian Tigers, seeking a development trajectory to take it from abject poverty to prosperity within a couple of generations . In approach, it has adopted high standards and demands discipline, self-reliance, and hard work of itself—its formula for escaping the vortex of low expectations, corruption, and chaos that it rejected early on .
Having launched its development with a measure of success, Rwanda is now keen to forge a future of security, prosperity, and modernity . Sustaining high rates of inclusive economic growth is at the heart of these ambitions . Future aspirations in this regard have been set extremely high . Recent formulations of Vision 2050 set a target of achieving upper-middle-income status

xx F U T U R E D R I V E R S O F G R O W T H I N R W A N D A
by 2035 and high-income status by 2050 . These aspirations translate into average annual growth rates of more than 12 percent (more than 10 percent in per capita terms) .
Opportunities and RisksBold aspirations require Rwanda to play closely to its strengths and make the most of all available opportunities, while judiciously managing risks . Rwanda’s main endowment is its people, whose determination, agaciro (dignity), and strong sense of personal and social responsibility should serve it well . How well the country nurtures and deploys this resource will determine its true potential . The country’s record of good economic gover-nance, policy coherence, and strong focus on implementation also will prove useful . Major opportunities lie in favorable demographics, an emergent and rapidly urbanizing middle class (in Rwanda and regionally), a fertile (though hilly)1 agricultural landscape, and untapped regional and global market poten-tial that offers opportunities for economic spe-cialization and scale economies that Rwanda otherwise lacks . Counterbalancing these opportunities are challenges associated with being a small, landlocked economy and risks from regional security and stability, a poten-tial widening of domestic disparities, intensi-fying population pressures, and global climate change .
Rwanda’s population dynamics present a significant domestic challenge and possibly also an opportunity . Rwanda is a youthful nation, with a median age of just 19 years, a result of rapid demographic shifts that are influenced by relatively high but declining fertility rates and sharp reductions in child mortality . But there also are legitimate con-cerns regarding the pace of rising popula-tion density, already the highest in mainland Africa, and the growing population pressures on the country’s environment and limited natural resources . Managed well, the popu-lation pressures can be contained, and the underlying demographic shifts can be har-nessed to achieve significantly higher growth and faster poverty reduction .2 Policy options
include better-targeted family planning mea-sures and continued emphasis on female edu-cation, health, and economic empowerment (United Nations Population Fund 2017) .
New technologies associated with indus-try 4 .0—robotics, the Internet of Things, three-dimensional printing—will remain disruptive for Rwanda (as for the rest of the world), presenting more risks and opportuni-ties, with Rwanda’s net benefits depending on its responses . The immediate gains for Rwanda are from the adoption and diffusion of new technologies and improved produc-tion processes, rather than the development of sophisticated research and development capabilities . On the one hand, to the extent that the new technologies are labor saving, they risk narrowing the scope for manufac-turing as a pathway to development . On the other hand, the diffusion and adoption of new technologies can help to leapfrog tradi-tional enablers of development . For example, Zipline, which uses unmanned drones to deliver critical medical supplies across Rwanda, has the potential to overcome geo-graphical barriers and increase efficiency in distribution of medical supplies . Modern services, enabled by information and com-munication technology and sharing the spe-cial characteristics (scalability, international tradability, and amenability to technological upgrading) that allowed productivity conver-gence in manufacturing, are another area of opportunity, with business process outsourc-ing, banking, and health care as examples .
Future growth has to be powered by trade and regional integration . As a small, land-locked economy, Rwanda does not have the scale economies to sustain high growth on its own . It has to stay alert to major shifts in patterns of global trade and production . For one, the global value chains are maturing and losing momentum since the “unbundling of production” has largely already happened (OECD 2017) . At the same time, production is becoming increasingly concentrated in regional or local hubs closer to end markets: the share of intra-African trade for most manufactur-ing industries rose between 2000 and 2014 (Hallward-Driemeier and Nayyar 2017) .

E x E C U T I V E S U m m A R y xxi
Fortunately for Rwanda, the region around it abounds in (largely untapped) opportunities . Plus, with its landlocked geography as a lim-iting factor, the ability of Rwandan firms to compete globally depends on the “competitive-ness” and “connectedness” of its neighbors . Rwanda is thus likely to seize regional trade opportunities through intraregional trade and participation in regional value chains con-nected to the global market .
The strongest regional opportunities exist in commodity-based processing and exports and services trade—what some have called “industries without smokestacks” (Newfarmer, Page, and Tarp, forthcom-ing) . Taken together, these activities hold the promise of doing for Rwanda what manufac-turing did for East Asia . This promise applies particularly to agribusiness and food pro-cessing, the only subsectors in which Rwanda currently has a revealed comparative advan-tage (Hallward-Driemeier and Nayyar 2017) . These subsectors employ unskilled workers, have low intensity of physical capital, and exhibit high returns from the application of basic research and development while, for now, being less exposed to automation . The products (for example, wood products, bev-erages) typically are traded regionally (rather than internationally) because they are bulky to transport or require proximity to raw materials (for example, food production) . Rwanda could look to expand high-value agricultural exports (such as horticulture)—much like Peru has done with specialty agricultural products such as artichokes, asparagus, and avocados, among others—even beyond the region, building on its repu-tation for having a superior regulatory and policy environment .
The region also offers major opportunities for trade in services, which already provides more than half of Rwanda’s export earn-ings . While tourism has the most immediate potential, Rwanda also could look toward higher-skill services such as business process outsourcing, health care, and higher educa-tion . Medical tourism is on the rise in Sub-Saharan Africa, as it is elsewhere (Dihel and Goswami 2016) . With its many investments
and innovations in the health sector, Rwanda could become a hub for modern medical services for the region . Similarly, in higher education, Rwanda has attracted top-flight university subsidiaries, such as Carnegie Mellon . A recent grant from the Buffett Foundation will enable the country to build a first-class agriculture school . Another logi-cal services export, given Rwanda’s location, could be mining services .
The presence of new technologies and business and trade opportunities bodes well, but it is not in itself enough to generate high growth . This issue connects to the broader “productivity paradox,” whereby global pro-ductivity growth has slowed considerably since 2004 or so, even as new technologies have emerged and diffused at a rapid clip . Frustrated by a similar disconnect (between massive investments in information technol-ogy and productivity growth), Robert Solow, a Nobel laureate in economics, famously said in 1987 (36), “You can see the computer age everywhere but in the productivity sta-tistics .” The productivity statistics did pick up eventually, but only after a considerable lag in the mid-1990s . The missing link then, as it likely is now, was capabilities—of peo-ple, firms, and institutions—that take time to build . That missing link is also Rwanda’s main challenge—and the focus of this study—as the country seeks to harness the new wave of technologies and trade patterns for future high growth . Its investments in this regard need to bring the core capabilities continually closer to the ever-moving global frontier .
An Agenda for ReformRwanda’s aspiration for upper-middle income by 2035 and high income by 2050 calls for stretch targets for future growth rates . Such targets may prove helpful in lifting the nation’s vision and infusing a future orien-tation among the people, while mobilizing citizen support and resources for the needed economic reforms . This has to be supported with periodic and systematic review of goals and targets, with an eye to reassessing their

xxii F U T U R E D R I V E R S O F G R O W T H I N R W A N D A
feasibility according to evolving trends and with scope for readjustment if needed .
Any future high-growth strategy will require a multisectoral approach . Relying on manufacturing alone as a pathway for high growth clearly has become trickier than in the past . Services can offer significant scope for productivity gains (IMF 2018), but the service sector alone cannot yet absorb all of the unskilled labor released by agricul-ture . Moreover, important interdependen-cies between sectors (most notably between services and manufacturing) prevent any one sector from growing too large without suf-ficient inputs from others—for example, in China from 2000 to 2014, services inputs into manufacturing accounted for 38 percent of growth in services value added, while manufacturing inputs into services accounted for 30 percent .
The reform agenda is complex and highly demanding: nothing short of an extraordinary effort will suffice . The hard work begins in classrooms . The country needs a massive effort to build human capital—its own educa-tion-focused Marshall Plan—if it is to realize its ambitious growth targets . With all of its achievements, Rwanda still lags the average of low-income countries in crucial aspects of human capital—for example, in stunting and primary and lower-secondary school comple-tion . Moreover, the concern is as much about quality as it is about quantity .3 An impor-tant related issue is high stunting rates in early years—with implications for children’s future learning abilities and participation in the knowledge and services-led economy that Rwanda envisages .
The next requirement is higher investment and savings rates . Rwanda already has a rela-tively high investment rate of about 26 percent of GDP, well in excess of the domestic savings rate of less than 10 percent . But double-digit growth rates would require the investment rate to be significantly higher . Achieving this level of investment would require a sharp increase in investment by the private sector; a multifold rise in the domestic savings rate; and higher foreign direct investment . Nothing short of
this will achieve the growth ambitions that Rwanda has .
A higher-order challenge is to boost pro-ductivity growth, which also has a bearing on Rwanda’s ability to maintain high investment rates . Rwanda’s labor productivity (output per worker) and total factor productivity (output generated by a given quantity of labor and capital) are low for its income level . Moreover, the rate of total factor productivity growth has slowed significantly in recent years .
The principal requirements for sustained high productivity growth are scale econo-mies and economic specialization in areas of Rwanda’s comparative advantage, with com-petition and technology diffusion as essential complements . These elements have proved essential for sustaining high growth across the world, but they are even more important for a small, landlocked country like Rwanda . Scale and specialization require Rwanda to make the most of external opportunities and to enhance the benefits of urban agglomera-tion . But, to succeed in these areas, Rwanda has to have a competitive domestic enterprise sector, both public and private, with a strong potential to do well in competitive environ-ments . Such enterprises themselves have three critical requirements: a strong ecosys-tem for technological innovation, world-class human capital, and robust institutions of governance . This chain of priorities forms the high-growth strategy for Rwanda .
Rwanda’s strategy for high growth thus has four essential and interdependent drivers—innovation, integration, agglom-eration, and competition (figure ES .1) . These future drivers of growth, in turn, would receive the necessary boost from reforms in six high- priority areas: (1) human capi-tal development; (2) export dynamism and regional integration; (3) well-managed urbanization; (4) competitive domestic enter-prises; (5) agricultural modernization; and (6) capable and accountable public institu-tions . The six reform areas are discussed in more detail in the next section .
Doing well on each of these six neces-sary reform areas is what separated the

E x E C U T I V E S U m m A R y xxiii
high-growth East Asian economies from those that achieved rapid growth for a decade or two, only to see it fizzle out . Even more chal-lenging perhaps is to go beyond the necessary to the sufficient conditions . Rwanda sees rapid development not as a choice but as an existen-tial matter and will be pushed to take high-risk strategic bets to gain high returns . These efforts have to be calibrated and managed carefully . Unlike the East Asian economies, Rwanda does not have the luxury of high savings, which gives it far less scope to make costly mistakes . Policy responses first need to address key cross-cutting constraints (such as skills, finance, infrastructure, and business regulation), clarify the future role of state-owned enterprises (SOEs), and then, if deemed necessary, selectively pick areas for direct sup-port that are aligned closely with Rwanda’s comparative advantages and focused on export promotion rather than import sub-stitution . Any direct support will have to set clear policy objectives and performance tar-gets for beneficiary firms; be coordinated closely across government entities; and include a rigorous system for monitoring progress and enforcing sanctions as well as incentives for
rewarding success and punishing failure—a model that the Republic of Korea closely fol-lowed in its early years of development .
Reform Priorities for High GrowthReform Priority 1: Develop Higher-Order Human Capital
Building an innovation-led economy, as well as getting the most out of greater integration (especially services trade) and agglomera-tion, will require much higher investments in human capital . Such investments, particu-larly in the priority areas of reducing stunting and improving basic education, contribute to growth only after considerable time, so mov-ing on them early is essential for Rwanda’s growth aspirations .
Building human capital involves a wide array of investments across the life cycle . Allocating more resources and providing bet-ter information on outcomes are key, together with making dramatic progress in the follow-ing five policy areas:
1 . Reduce stunting . A big push is needed to improve food security and nutritional practices and to increase access to clean water, good sanitation, and nutritional supplementation . Careful monitoring sys-tems are required to evaluate which poli-cies deliver the greatest gains .
2 . Expand access to basic education . Achieving universal basic education requires ensuring that children are not turned away for failure to pay incidental fees, which may require increasing the per student benefit paid to schools, and reduc-ing repetition in early grades so that chil-dren do not become too old for their grade level . Providing information on the finan-cial returns to schooling has been dem-onstrated to increase parent and student investment in education, while improving the quality of schooling facilitates both reduced repetition and higher perceived returns .
FIGURE ES.1 Future drivers of Rwanda’s growth: Innovation, integration, agglomeration, and competition
Highlydeveloped
humancapital
Trade andregional
integration
Modernagriculture/food sector
Capable andaccountableinstitutions
Well-managed
urbanization
Competitivedomestic
enterprisesDRIVERS OF
GROWTHInnovationIntegrationAgglomerationCompetition

xxiv F U T U R E D R I V E R S O F G R O W T H I N R W A N D A
3 . Improve the quality of education . Improved teaching practices are neces-sary to ensure that children in the first three years are literate in Kinyarwanda before transitioning to English . There is good evidence regarding effective pro-grams, including partially scripted lessons, on which Rwanda can draw . Because these improvements take time, transition-ing to English later (end of primary) may be valuable . Rwanda could leverage its major investment in technology to pro-vide upper-primary and secondary school teachers with regular opportunities to improve their English and to increase stu-dents’ learning performance . Recruiting expatriates may help to remedy the imme-diate shortage of teachers and train a core group of high-quality Rwandan teachers .
4 . Strengthen technical and vocational train-ing . Collecting and disseminating infor-mation on the quality of skills providers and the returns to different skills would improve quality and encourage participa-tion in high-return programs .
5 . Build the tertiary sector and foster inno-vation . Increasing access to financing (including private) would expand enroll-ment . Enrollment in high-return fields could be increased through financing incentives and higher-quality science and engineering instruction in earlier grades . Creating incentives for researchers to develop and to adapt innovations to benefit industries and getting industries to pay for the research are essential to reaping the maximum returns to innovation .
Reform Priority 2: Establish Export Dynamism and Leverage Regional Integration
Although exports have grown rapidly and diversified over the past decade, the sector remains too small and narrow to achieve the country’s aspirations for growth . Development of a more robust export sector serving both regional and global economies and a renewed effort to attract foreign direct investment in
tradable sectors would boost scale economies and specialization and constitute an important source of competition and innovation .
Meeting Rwanda’s export objectives requires a comprehensive trade policy that spans services, industry, and agriculture . Producing high-quality products for the region (especially in manufacturing and agroprocessing) and developing other, less location-dependent sectors (such as horti-culture, tourism, professional services, and information and communication technology) for broader markets could do for Rwanda what manufacturing did for East Asia from the 1990s . These products are labor inten-sive, tradable, and capable of scale econo-mies; and they have high value added per worker . As in traditional manufacturing, technological change can occur quickly and drive rapid productivity growth . There are five major priorities to meet medium-term trade objectives:
1 . Harness the regional blocs as platforms for transformation . Key priorities are to lower and revise the common external tariff within the East African Community (EAC) to benefit Rwandan producers and consumers better, promote harmo-nized standards in goods and services, and reduce nontariff barriers . For key sectors such as energy and finance, the regional blocs should develop regional value chains to achieve scale economies . Finally, Rwanda should advocate for stronger regional Economic Communities’ secretariats to review and discuss potential violations of common market protocols . The recently agreed African Continental Free Trade Area can also be advantageous, once details are penned and implementa-tion modalities agreed to .
2 . Closely monitor the exchange rate to maintain export competitiveness . Greater flexibility and close monitoring of exchange rates are necessary to avoid inadvertent episodes of overvaluation, especially in regional markets . It may be important to require the accommoda-tion of import surges or the use of reserve

E x E C U T I V E S U m m A R y xxv
accumulation to sterilize capital inflows . A first step is to undertake more analyti-cal work on the past relationship between exchange rate policy and export growth, particularly for dynamic export sectors .
3 . Invest in economic diplomacy . More investment in staff knowledge is needed regarding how to prioritize, prepare for, and undertake external negotiations .
4 . Improve trade connectivity by lowering transport costs . Building railway lines along the two East African trade corridors holds promise for reducing freight costs but is expensive . Developing Rwanda as a regional logistics hub offers another way to lower transport costs . Lowering regional road tolls, ensuring their uniform application across all EAC vehicles, and applying a standard tax policy for truck-ers from all countries would lower costs further . An aggressive push for open skies within the EAC would help to improve air connectivity and reduce the costs of air cargo .
5 . Increase service sector productivity . Backbone services (such as transport, telecommunications, and professional ser-vices) need fewer policy barriers to compe-tition for both domestic and foreign firms and improved access to EAC and South African Development Community profes-sionals . Services trade also offers promi-nent opportunities for direct exports, particularly in tourism, but also in mining services, education, and business services .
Reform Priority 3: Leverage the Urban Dividend
Urbanization, managed well, can be an important driver of growth by generat-ing agglomeration economies that enhance productivity, spur innovation, and foster economic diversification . More than one-quarter of Rwanda’s population lives in urban areas, which contributed more than one-third of national structural change and half of national labor productivity growth over the past 15 years . However, urbaniza-tion has driven economic growth through
the reallocation of labor off-farm, without the accompanying agglomeration economies essential for rapid growth of productivity .
Policy should focus on delivering the fun-damental drivers that link urbanization to robust economic growth . This approach means focusing on where to prioritize urban development, what package of policies and investments to include, and who needs to be in charge of implementing solutions . On where, Kigali is Rwanda’s main interface with the world and needs to fulfill its sig-nificant economic potential following market demand . This effort would be accompanied by a more calibrated approach toward a complementary (and well-networked) set of secondary cities and small towns . On what, reforms to strengthen land markets and urban planning are essential to enhance the efficiency of necessary capital investments in infrastructure, housing, and commercial structures . Finally, on who, stronger inter-governmental coordination of economic and spatial planning is needed to avoid coordi-nation failures in urban development . The reform agenda has the following three main elements:
1 . Unleash Kigali’s potential . Kigali’s urban fabric is fragmented by small-scale, patchy land development, which undermines the potential to achieve agglomeration econo-mies; and raises costs . Addressing this fragmentation requires integrating labor markets through efficient, affordable, inte-grated public transport; prioritizing dense central infrastructure (particularly roads) to crowd in dense private investment in firms and houses; and promoting connec-tivity to global product markets .
2 . Strengthen land markets . Rwanda may want to consider moving from the quantity-based regulation of land use to price-based allocation . This effort requires strengthening institutions so that they can independently and reliably value and pub-licly disseminate land values across uses and assign and protect property rights . Credible land valuations would also enable urban areas to fiscalize public investments

xxvi F U T U R E D R I V E R S O F G R O W T H I N R W A N D A
in land through land value capture . Moreover, regulations on structures should be used to mitigate negative exter-nalities like environmental degradation .
3 . Foster institutional coordination . The main priorities are first to unite spatial and economic planning, second to strengthen cross-district and municipal coordination, and finally to boost district capacity for urban planning and land valuation .
Reform Priority 4: Enable the Emergence of Competitive Domestic Enterprises
Strengthening the enabling environment for both private firms and SOEs to achieve efficient market-led outcomes is the corner-stone of improving the four future drivers of growth—innovation, integration, agglomera-tion, and competition . Competitive firms are essential to reap the benefits of integration and agglomeration and are also at the center of innovation activity . This effort calls for a strong state and a strong private sector, with complementary functions . The following are the main elements of the reform agenda:
1 . Address cross-cutting constraints . The first imperative is to provide affordable access to finance, probably best achieved through regional (rather than national) banking institutions . Over time, capital markets and nonbank financial institu-tions need to be developed (again, prefera-bly as part of regional agreements) . Efforts to reduce logistics costs are important, as is improved access to—and reduced cost of—broadband connectivity, backed by effective competition in key telecom-munications markets . To reduce the cost and increase the reliability of electricity, Rwanda needs to push forward for the establishment of a regional energy pool, build capacity to procure and implement power-purchasing agreements, strengthen demand forecasting, and better integrate system planning and system operations functions in the utility sector .
2 . Improve targeting and monitoring of industrial incentives . The effectiveness of the government’s extensive industrial policy interventions could be improved by shifting from general support to tar-geting successful enterprises . Crucially, a performance-based approach (focused on firm productivity and exports) should be mainstreamed in all interventions . Industrial incentives also need to be coor-dinated better across government agen-cies . Incentives also could do a better job of attracting foreign direct investment in tradable activities . Building and rigorously implementing a credible performance mon-itoring system are critical for this effort .
3 . Define the future role of SOEs . An assess-ment of the level of competition, the com-petitiveness of SOEs versus private firms, economic development goals, and social considerations could be used to divide key sectors into four groups: (1) sectors in which SOEs will retain a monopoly; (2) sectors in which SOEs will compete with private firms; (3) sectors from which SOEs will withdraw when efforts to build up private sector capacity prove success-ful; and (4) sectors from which SOEs will withdraw immediately because the pri-vate sector is already capable and there is no compelling social rationale for them . Public-private boundaries can shift as the private sector gains strength .
4 . Build an effective national innovation sys-tem . Wide-ranging policies are needed in this regard . On the demand side, a strong competitive environment would encour-age firms to seek out the best available knowledge and strengthen managerial capabilities to introduce new processes and technologies, integrate them in the production system, allocate skilled staff to use them, and make them financially viable . Key steps to help firms to meet technical standards would involve a more effective standards board; effective, more easily available, and affordable key ser-vices; greater firm awareness of the ben-efits of following standards; and better

E x E C U T I V E S U m m A R y xxvii
collaboration among firms or between firms and knowledge providers . Stronger coordination, monitoring, and evaluation of funding programs for science, technol-ogy, and innovation are also needed . The agenda on the supply side of innovation is discussed under reform priority 1 .
5 . Maximize gains from the mining sector . Recent discoveries of mineral deposits bode well, but they require greater efficiency and attention toward raising fiscal revenues . It is necessary to provide extensive sup-port for artisanal miners, to improve the bargaining position of the miners, and to provide well-targeted extension services . Undertaking detailed geological investiga-tions for promising deposits and develop-ing a consolidated information system are important initial steps . Other measures include improving land management, incorporating social impact assessments, strengthening the capacity of the Rwanda Mining Board, and developing an optimal fiscal regime to capture an efficient and fair share of mineral wealth .
Reform Priority 5: Transition Agriculture and Food to Be an Engine of Growth
The transformation of agriculture from supplying commodities for domestic use to producing higher-value-added goods through regional and global food supply chains requires continued modernization and greater responsiveness to market signals . Agriculture is central to the four drivers of growth, because it is an important source of exports and a key driver of the pace at which rural resources are released for urban agglomeration; the transformation itself will be built on more competition and innovation within the sector .
Achieving higher productivity through private sector–led growth requires using direct public support of the private sector more strategically and strengthening the pub-lic sector’s role as a regulator, facilitator, and provider of public goods . The following seven priorities are key:
1 . Strengthen research and regulatory insti-tutions . These institutions should be adapted continually to evolving opportu-nities and threats . Certifications, a key ele-ment of Rwanda’s comparative advantage, have to remain credible . The high techni-cal expertise of the Rwanda Agriculture Board will be increasingly important as the frequency and importance of sanitary and phytosanitary issues increase .
2 . Strengthen vertical coordination . More effective vertical coordination in agri-culture requires private sector partners to provide skills, capital, and entrée into international markets . Private sector vertical coordination arrangements and changes in horizontal coordination through producer groups are likely to grow rapidly . Government promotion of more standardized approaches would serve the interests of both farmers and aggregators .
3 . Engage the region more effectively . Rwanda could engage more effectively and opportunistically with the EAC, the South African Development Community, and the Common Market for Eastern and Southern Africa and bilaterally with the Democratic Republic of Congo on a regional division of labor, both in production based on com-parative advantage and in knowledge gen-eration and diffusion . Regional approaches could help to satisfy the demand for food staples; improve certification of food safety, sanitary, and phytosanitary condi-tions; and adopt transparent science-based standards, product registrations, and certi-fication of agricultural inputs .
4 . Profit from the big-data revolution in innovation . The benefits of big data can be made more accessible to smallhold-ers . “Smart farming,” where just the right amounts of the right inputs are used for each parcel on the basis of information gathered by handheld devices with the right sensors, offers one such opportunity . Big-data approaches such as blockchain technology similarly offer the potential for lowering the costs of small financial

xxviii F U T U R E D R I V E R S O F G R O W T H I N R W A N D A
transactions that require secure record keeping and decentralized input, such as land registration and mortgages .
5 . Improve targeting of public investment in infrastructure . Public spending on agriculture is low, and greater resources are needed for irrigation, especially in the drier eastern regions of the country . However, such investments are high cost (due to Rwanda’s hilly landscape) and have to be targeted on high-return prod-ucts (for example, horticulture exports) .
6 . Develop a more robust policy on high-level human capital formation in agri-culture . In particular, a more consistent approach to vertical integration is needed for training managers and tech-nical experts working for aggregators . Companies might be involved in this pro-cess by instituting training programs to build up nationally needed skill sets in agribusiness, high-value supply chains, and agricultural technology .
7 . Address land degradation and the impact of climate change . Although considerable progress has been made in construct-ing robust “bench” (wide) terraces, much more needs to be done to secure land assets . Proactive promotion of adaptation to climate change is also vital . Fortunately, the soil and water management interven-tions central to halting land degrada-tion support adaptation through better water retention and improved soil quality . Landscape restoration and conservation require the involvement of local govern-ment, producer groups, and national tech-nical expertise and funding .
Reform Priority 6: Develop Capable and Accountable Institutions of Governance
Rapid improvements in governance, includ-ing control of corruption, rule of law, regu-latory quality, and civil service performance, give Rwanda a competitive edge over its peers . Even so, its ambitious aspirations are bound to test its institutions severely . Building effective institutions is a long-term
endeavor where improvements are necessarily incremental .
Considerable progress in restoring trust between the country’s leadership and citi-zens, and more broadly within the society, has been achieved from the low level fol-lowing the 1994 genocide against the Tutsi . However, further progress is essential to maintaining stability, promoting innovation, and achieving rapid growth .
Key recommendations are organized around the three pillars of state effectiveness and societal trust, all of which are essential for rapid growth:
1 . Build the state’s core capabilities on the basis of capacity, meritocracy, coordina-tion, and rule-based authority . This effort requires empowering local governments and civil servants, which could mean adopting more flexible imihigo (perfor-mance contracts) with multiyear targets; improving coordination of policies on key cross-cutting issues; expanding the train-ing offered by the Rwanda Management Institute, supported by skills audits and functional reviews to identify key gaps; paying higher compensation to individu-als with scarce skills; and developing non financial incentives to attract compe-tencies in the civil service .
2 . Strengthen market economy foundations . Strengthening corporate governance of SOEs, ensuring that they are not accorded an advantage over private firms, opera-tionalizing the Rwanda Inspectorate and Competition Authority . Creating special courts and fast-track procedures to adju-dicate small claims; promoting alternative means of resolving commercial disputes; boosting reliance on technology; increasing training and specialization of justice sec-tor employees, including judges, prosecu-tors, and investigators; and improving case management techniques would enhance the judiciary’s effectiveness in enforcing con-tracts . The proper enforcement of expro-priation procedures, a more efficient land management system, and full enforcement of the law on intellectual property would

E x E C U T I V E S U m m A R y xxix
strengthen property rights . Further, tighter controls on public investment allocations and prudent fiscal management to build fis-cal policy buffers are essential to developing the state’s financial capacity .
3 . Strengthen accountability of the state and ensure that policies and programs are aligned with the needs of citizens . Enhancing the performance of key watch-dog agencies, increasing revenue-raising by local governments, streamlining expen-diture assignments, and ensuring greater involvement of citizens in local decision making (for example, in setting imihigo objectives), coupled with reliance on more qualitative information in monitoring per-formance, could make local officials more accountable and improve the quality of services .
Notes1 . Ninety percent of cropland is on slopes of
5 percent to 55 percent .2 . There are important gains to be had from a
demographic dividend if the decline in the fer-tility rate, and thus the population growth rate, could be accelerated . A recent United Nations Population Fund report (UNFPA 2017) found that Rwanda could boost its gross domestic product growth 1 percentage point by target-ing a lower dependency ratio, which is the number of people who are under and above the working ages of 15–64 for every 100 persons within the working-age population .
3 . Eighty-five percent of students at the end of grade 3 were rated “below comprehension” on a recent reading test, and one in six students in grade 3 could not answer a single reading comprehension question .
ReferencesDihel, N ., and A . G . Goswami . 2016 . The
Unexplored Potential of Trade in Services in Africa: From Hair Stylists and Teachers to Accountants and Doctors . Washington, DC: World Bank . https://openknowledge . worldbank .org/handle/10986/24968 .
Hallward-Driemeier, M ., and G . Nayyar . 2017 . Trouble in the Making: The Future of Manufac tur ing-Led Development . Washington, DC: World Bank .
IMF (International Monetary Fund) . 2018 . World Economic Outlook: Cyclical Upswing, Structural Change . Washington, DC: IMF, April .
Newfarmer, R ., J . Page, and F . Tarp, eds . Forthcoming . Industries without Smokestacks: African Industrialization Revisited . Oxford, U .K .: Oxford University Press .
OECD (Organisation for Economic Co-operation and Development) . 2017 . “The Future of Global Value Chains: ‘Business as Usual’ or ‘A New Normal’?” Directorate for Science, Technology, and Innovation Policy Note, OECD, Paris .
Solow, Robert . 1987 . “We’d Better Watch Out .” New York Times Book Review, July 12, 36 .
UNFPA (United Nations Population Fund) . 2017 . “Unlocking Rwanda’s Potential to Reap the Demographic Dividend .” Policy Brief, UNFPA, New York, October .


F U T U R E D R I V E R S O F G R O W T H I N R W A N D A xxxi
Abbreviations
AfCFTA African Continental Free Trade AreaASEAN Association of Southeast Asian NationsCET common external tariffCOMESA Common Market for Eastern and Southern AfricaEAC East African CommunityFDI foreign direct investmentGDP gross domestic productICT information and communication technologyNISR National Institute of Statistics of RwandaNST1 National Strategy for TransformationODA official development assistancePPP purchasing power parityR&D research and developmentSADC Southern African Development CommunitySOE state-owned enterpriseTFP total factor productivityWIOD World Input-Output DatabaseWITS World Integrated Trade Solution

1
Overview
Future Drivers of Growth in Rwanda
Innovation, Integration, Agglomeration, and Competition
IntroductionRapid economic growth is Rwanda’s over-arching development goal—a strategic choice to anchor its long-term vision . Vision 2050 encapsulates this choice with long-term, income-based goals that aim for upper-middle- income status by 2035 and high-income sta-tus by 2050 . With this vision, Rwanda has aligned itself with the successful East Asian economies that began their development jour-ney with a similar quest for high growth . The prioritization of long-term growth recognizes an important truth—sustained growth does not just happen, especially in a global land-scape marked by forces of technology, trade, and tremendous competition . It requires a combination of leadership, social cohesion, and deep investments in core capabilities—of people, firms, and institutions—to harness the opportunities on offer .
The implications of different growth pathways are staggering . At its current pace of growth (4 percent per capita), Rwanda will barely cross the threshold for lower-middle-income status by 2035 . At growth of
7 percent per capita, average income would reach US$2,400 (2017 prices) . To become an upper-middle-income country by 2035, Rwanda will need to grow at more than 10 percent per capita . In 2035, the economic landscape of Rwanda could resemble that of present-day Bangladesh or, alternatively, sur-pass that of today’s Vietnam or even Georgia and Indonesia . It is not surprising, therefore, that almost 70 percent of Rwandan respon-dents in a recent survey mentioned high economic growth as their first priority for the country (World Values Survey, Wave 6: 2010–2014; Inglehart et al . 2014) .
But economic growth is not only a matter of income . Growth matters for a broad range of other development outcomes, including poverty reduction, as shown globally and in Rwanda’s own experience as chronicled in this report .1 Sustained high growth has another, higher purpose for Rwanda: to escape from its tragic past . The country is keen to put great distance between a bright future and a painful past .
This is not to say that economic growth should be the only area of policy focus .

2 F U T U R E D R I V E R S O F G R O W T H I N R W A N D A
The challenges of inequality, public service delivery, and environmental sustainabil-ity, among others, are just as important for development and need to be looked at in parallel, as is being done in Rwanda .
Rwanda’s income ambitions are built on a strong and widely acknowledged record of success . Emerging from the dev-astation of the 1994 genocide against the Tutsi, which itself followed three decades of economic stagnation, the country has seen its average income rise three-and-a-half-fold . In 1994, only Mozambique was poorer than Rwanda, which today is ahead of 20 countries . This rapid progress was made possible by the second-fastest growth of gross domestic product (GDP) per capita on the continent, sustained over two decades .
Past successes justify bold ambitions but do not guarantee them . The reform agenda for accelerating growth to even higher levels and then sustaining it is complex and highly demanding, as described in this report .
A Strong Start despite Initial Conditions and Emerging ConcernsThe genocide against the Tutsi in 1994 left in its wake a shattered and traumatized nation . It was, above all, a human trag-edy, with few precedents . More than one million people perished, leaving behind suffering in indescribable forms and on immeasurable scales . About two million Rwandans sought refuge in neighbor-ing countries, and at least one million were internally displaced (Chukwuma 2003) . The economic and social costs were enormous . The country’s GDP col-lapsed that year, falling in half from an already low base . Inflation climbed to more than 60 percent . Four out of every five persons were living below the official poverty line . Life expectancy at birth fell to below 30 years, and hunger and food insecurity were widespread, with severe
long-term consequences . Of all the coun-tries in the world, only Mozambique had lower per capita income in 1994, and none had lower life expectancy at birth than Rwanda .
Facing these grim conditions, a new Government of National Unity took over in 1994 . Its task was made more difficult by the fact that its coffers were running empty, infrastructure (social and physical) had been decimated, trade links were broken, businesses and agricultural assets had collapsed, and institutions of governance needed to be rebuilt . Insecurity and instability loomed large, both internally and from threats within the region, and social trust had fallen to worrying depths .
Even so, relief, recovery, and reconstruc-tion efforts were swift and multipronged . National reconciliation and healing evolved through homegrown initiatives, includ-ing the establishment of a National Unity and Reconciliation Commission in 1999 and, eventually, the Gacaca courts, mod-eled after a traditional approach to set-tling disputes . In December 1994, the Government of National Unity issued and implemented (and subsequently closely followed) a Declaration of Principles that outlined its political, social, and economic agenda for a “New Rwanda .” The decla-ration emphasized social stability, national security, and a commitment to a market economy, backed by a capable state and a strong private sector (World Bank 2007) . In the absence of a viable private sector, the state led the economic recovery through large public investments that were financed through external assistance . At the same time, to strengthen the foundations for growth, a series of reforms liberalized the economy,2 promoted private investment, and sought to privatize some of the state-owned enterprises (SOEs) that dominated industry . A multiphase decentralization program was launched in 2000 .
These early efforts proved effective . The poverty rate had declined to 60 per-cent by the early 2000s, on the back of a solid economic recovery . GDP had recovered

O V E R V I E W 3
to pre-genocide levels by 2000 . And, by 2005, per capita income had surpassed pre- genocide peak levels, as had many health and education indicators such as infant and child mortality, life expectancy, and pri-mary school enrollment rates .3 Government revenues (excluding grants) had picked up to 14 percent of GDP by the mid-2000s (from 4 percent in 1994), which together with the consolidation of expenditures led to higher government and national savings . The task of accommodating and reintegrating the influx of returning refugees had also pro-ceeded well .
With the dual post-genocide objectives of economic recovery and social and politi-cal stability largely met, a strong platform was laid for long-term growth and devel-opment . This agenda was picked up early under Vision 2020 (adopted in 2000), with far-reaching development targets that were later backed by ambitious reform programs implemented under a series of poverty reduc-tion strategies . Reform efforts were most noteworthy in strengthening business regula-tions, as reflected in Rwanda’s strong stand-ing on the World Bank’s Doing Business Indicators, where Rwanda is ranked 29th in the world (figure O .1)—above all other low-income countries and second only to Mauritius on the continent (World Bank 2019) . Decentralization was deepened fur-ther, aimed at strengthening quality and accountability in service delivery . Large-scale public investments continued to close the infrastructure gaps, particularly in energy, telecommunications, and road transport . Trade integration was also accelerated with Rwanda’s accession to the East African Community (EAC) in 2009, which signifi-cantly brought down tariffs—from an aver-age of 16 .5 to 11 percent .
Economic and social achievements in the post-recovery phase (2006 onward) have continued to be impressive . Growth of GDP per capita has averaged 5 percent a year since 2006, second only to Ethiopia on the continent (figure O .2) . GDP growth, for the most part, has been broad based,
supported by robust performance in each of the major economic sectors . Industry (propelled by construction) and services (driven by information and communication technology [ICT] and trade and transport) each has grown at an annual rate between 9 and 10 percent since 2006, and agricul-ture (led by crops and livestock) has grown at 5 .4 percent .
Broad-based sectoral growth facilitated rapid structural transformation, meaning the movement of labor out of low- productivity agriculture and into industry and services and from farms to cities . Close to two-thirds of GDP growth since 2000 has been on account of structural transformation, with the rest coming from growth within sectors . The percentage of the population in urban areas increased from 16 percent in 2002 to 27 percent in 2015, and the urban popula-tion more than doubled (from 1 .5 million to 3 .5 million) . Because the agriculture sector had such low labor productivity at the beginning
FIGURE O.1 Rwanda’s global rankings on Ease of Doing Business indicators
Source: World Bank 2019.
Global ranking
Registering property
Getting credit
Paying taxes
Overall
Starting a business
Resolving insolvency
Enforcing contracts
Trading across borders
Dealing withconstruction permits
Getting electricity
Protecting minority investors
106
88
78
68
58
51
35
29
14
3
2
0 20 40 60 80 100 120

4 F U T U R E D R I V E R S O F G R O W T H I N R W A N D A
of the process, the transformation brought significant gains . With close to 70 percent of the labor force still in agriculture—the sector even now with the lowest labor productivity ( figure O .3)— significant potential remains for realizing continued gains from structural transformation, which is still in its early stages in Rwanda .
Rwanda has also seen impressive improve-ments in social indicators, including gender equality (table O .1) . On many of the health indicators, Rwanda is now closer to the aver-age of lower-middle-income countries, well ahead of its low-income peers . Maternal and child mortality rates have fallen 80–90 percent, and life expectancy at birth has more than doubled (to 69 years) in the past 20 years or so . Basic infrastructure—from roads to telecommunications and energy supply—has improved solidly . A nationwide rollout of health care, includ-ing health insurance coverage for more than 80 percent of the population, is also impres-sive . Rwanda has surpassed several financial inclusion targets, with almost 90 percent of the adult population having some access to financial institutions . Crucially, the institu-tions of governance have been strengthened significantly, earning the government a repu-tation for efficiency and probity (Ggombe and Newfarmer 2017) .
In some areas, progress has been less satisfactory . Some of the more visible gaps are in educational outcomes . Rwanda’s cur-rent levels of human capital and its current trajectory of investment in human capi-tal are not consistent with its ambitions . In some areas—for example, stunting and primary and lower-secondary school com-pletion rates—Rwanda lags behind the aver-age of low-income countries (figure O .4) . Achieving rapid economic growth and job creation will require a large increase in the quality of human capital .
A second area of policy concern is the low savings rate . The domestic savings rate is less than 10 percent, well short of the investment rate of 26 percent and behind that of many of Rwanda’s regional peers (figure O .5) . The domestic savings rate,
China Ethiopia
India
Cambodia Bangladesh RWANDA Vietnam
Sudan Indonesia mauritius Ghana
mozambique Philippines Poland
Zambia Turkey
Tanzania Colombia
malaysia Uganda korea, Rep. Thailand
Congo, Dem. Rep. Namibia
Botswana Chile
kenya Singapore Nigeria
malawi Egypt, Arab Rep.
Russian Federation
Pakistan
Niger
Togo
Cameroon
Brazil
Senegal
South Africa
mexico
Grenada
Ukraine
Chad
madagascar Burundi
Jordan
yemen, Rep.
Percent –6 –4 –2 0 2 4 6 108
Sources: World Development Indicators data (World Bank, various years); National Institute of Statistics of Rwanda data.
FIGURE O.2 Average growth of GDP per capita in Rwanda and select countries, 2006–16

O V E R V I E W 5
which tends to move with income levels, has remained virtually unchanged since the mid-2000s, despite a 70 percent increase in per capita income (figure O .6) .4 The gap has been made up by external assistance and, increasingly, by inflows of foreign direct investment (FDI) . To meet its growth objectives, Rwanda will need to raise its domestic savings rate to at least 30 percent and to attract more FDI in tradable sec-tors .5 The high-growth East Asian econo-mies, whose record Rwanda would like to surpass, had savings rates that were at least double Rwanda’s at similar income levels . Determining the causes of Rwanda’s low savings rate and identifying specific reform options require more in-depth analysis . Further, continued reliance on external assistance, in any case, carries risks . As a share of GDP, this assistance has been declining since 2004, and, as Rwanda approaches middle-income status, it can be expected to continue declining . Even if Rwanda can fill the gap through inflows of private capital, the associated macro-economic challenges are substantial if the gap continues to be large for an extended period .
A third challenge is low productivity . Despite high GDP growth, Rwanda lags other countries on labor productivity (out-put per worker) (figure O .7) . Rwanda’s per-formance on this measure is explained to a
FIGURE O.3 Sectoral labor productivity and annual change in share of employment in Rwanda, 2000–16
Source: Derived from Diao, Randriamamonjy, and Thurlow 2017.Note: The bubble sizes indicate the share of total employment in 2016.
Agriculture
Mining and quarrying Manufacturing
Utilities
Construction Wholesale andretail trade
Hotels and restaurants
Transport services
Financialservices andreal estate
Administrativeand support
services
Human health and social work Culture and other services
–1.0
–0.5
0
0.5
1.0
1.5
2.0
2.5
–2.0
Average annual change in employment share(percentage points), 2000–16
–1.5 –1.0 –0.5 0 0.5
Sect
oral
labo
r pro
duct
ivity
(log
dev
iatio
n in
sect
oral
GD
P pe
r wor
ker f
rom
eco
nom
ywid
e G
DP
per w
orke
r)
TABLE O.1 Social and economic indicators in Rwanda compared with low- and middle-income-country averages, 1994 and 2015
Indicator
Rwanda
Low-income-country
average (2015)a
Low- and middle-income-country average
(2015)a
Initial condition
(1994)aLatest (2015)a
% of population below national poverty line 80 < 40 (2014) n.a. n.a.Gini indexb 0.49 (2000) 0.50 (2014) n.a. n.a.Immunization, measles (% of children ages 12–23 months) 76 (1996) 96 76 80Improved sanitation facilities (% of population with access) 39 62 28 52Improved water source (% of population with access) 62 76 66 90Births attended by skilled health staff (% of total) 27 (2000) 91 49 (2012) 59 (2012)Maternal mortality ratio (modeled estimate, per 100,000 live births) 1,270 290 496 254Mortality rate, under-five (per 1,000 live births) 284 41 76 53Life expectancy at birth, total (years) 31 69 64 70Secondary school enrollment (%, gross) 9 (1999) 37 n.a. n.a.Literacy rate, adult females (% of females ages 15 and above) 49 (1991) 68 49 (2010) 66 (2010)Literacy rate, adult males (% of males ages 15 and above) 68 (1991) 75 66 (2010) 80 (2010)
Sources: World Development Indicators data (World Bank, various years); National Institute of Statistics of Rwanda data.Note: n.a. = not applicable. a. Unless specified otherwise.b. The Gini index is a measure of income inequality. Zero represents perfect equality, and 1 represents the most extreme inequality.

6 F U T U R E D R I V E R S O F G R O W T H I N R W A N D A
FIGURE O.4 Human capital outcomes in Rwanda and other countries, by income level, 2015
Source: World Development Indicators data (World Bank, various years).
Lower-secondarycompletion rate
Primarycompletion rate
Stunting rate
0 20 40 10060 80Percent
Rwandamiddle income
Low incomeHigh income
FIGURE O.6 Rwanda’s domestic savings and investment rates, 1995–2015
Sources: Calculations based on data from World Development Indicators (World Bank, various years) and National Institute of Statistics of Rwanda data.Note: FDI = foreign direct investment; ODA = official development assistance.
–10
0
% o
f GD
P
10
20
30
19951997
19992001
20032005
20072009
20112013
2015
Gross domestic savings rateNet ODA receivedDomestic investment rate
Net FDI inows
FIGURE O.5 Average gross domestic savings rate for Rwanda and regional comparators, 2014–16
Sources: Calculations based on data from World Development Indicators (World Bank, various years) and National Institute of Statistics of Rwanda data.
0
5
10
15
20
25
Savi
ngs r
ate
Ethiopia Tanzania Uganda Kenya Rwanda
FIGURE O.7 Labor productivity and GDP per capita in Rwanda and other countries
Source: Calculations based on Penn World Tables 9.0 data (Feenstra, Inklaar, and Timmer 2015).Note: PPP = purchasing power parity.
20
0
40
60
10
50
30
70
80
90
100
400GDP per capita (2010 US$, PPP)
4,000 40,000
Labo
r pro
duct
ivity
(201
0 US
$, P
PP)
All countries Rwanda

O V E R V I E W 7
large extent by weak total factor productivity (TFP) ( figure O .8) . TFP growth has fallen to just 1 percent since 2008 . Although resources have moved broadly from agriculture to other sectors with higher labor productivity, the allocative efficiency within sectors has been suboptimal in Rwanda . Within-sector labor productivity either fell or rose only slightly across most sectors from 2001 to 2016 ( figure O .9) .
Fourth, the private sector still maintains a relatively limited presence, has shown low capacity for innovation, and lacks the scale economies that are crucial for productiv-ity . In large part, this reflects the historical legacy, whereby the formal private sector was decimated after the genocide . Rwanda has since been successful in streamlining business regulations, as seen, for example, in its high ratings on the Doing Business Indicators . But the work is by no means over . A key issue is that costs faced by businesses are higher in Rwanda than in economies at similar stages of their development . For example, the high-growth East Asian economies had Rwanda’s cost levels only after they had crossed the upper-middle-income-country threshold ( figure O .10) .6 The high costs of energy, finance, and trade logistics have been impor-tant contributing factors . Private investors will also look for stronger economic returns, for which a pickup in productivity growth would be essential .
Fifth, in the midst of high growth and rapid structural transformation, the per-formance of the manufacturing sector has been subpar . Growing at a pace just short of the overall economy, the sector’s share of total value added has dropped to just 6 percent—2 percentage points lower than at the turn of the century . Only 4 percent of the labor force is in manufacturing (two-thirds in agro-processing), and even that share has been declining (World Bank 2015b) . As a result, Rwanda has fallen behind in generating manufacturing value addition ( figure O .11) .
Finally, Rwanda’s outward orientation has not kept pace with its economic objectives . The ratio of exports to GDP remains low
(at about 20 percent) for a small economy seeking high growth . Goods exports have edged up only slightly (from 4 .8 percent of GDP in 2005 to 8 .4 percent in 2015), and much of the increase was accounted for by
FIGURE O.9 Average growth of labor productivity in Rwanda, by sector, 2001–16
Source: Calculations based on Diao, Randriamamonjy, and Thurlow 2017.
–3 –2 –1 0 1 2 3 4 5
Construction
manufacturing
Utilities
Administrative and support services
Financial services and real estate
Culture and other services
mining and quarrying
Wholesale and retail trade
Hotels and restaurants
Health and social services
Transportation services
Agriculture
Average growth rate inoutput per worker (%)
FIGURE O.8 Total factor productivity (TFP) and GDP per capita in Rwanda and other countries
Source: Calculations based on Penn World Tables 9.0 data (Feenstra, Inklaar, and Timmer 2015).Note: PPP = purchasing power parity.
TFP
(Uni
ted
Stat
es =
1)
GDP per capita (2011 US$, PPP)
–0.1
0.1
0.3
0.5
0.7
0.9
1.1
1.3
1.5
400 4,000 40,000
All countries Rwanda Log of all countries

8 F U T U R E D R I V E R S O F G R O W T H I N R W A N D A
(largely unprocessed) commodities such as coffee, tea, and reexported minerals . Value addition from manufactured exports has not made a major contribution to early-stage growth, even though the export base has become more diversified . Export of ser-vices (dominated by tourism) has risen at an uneven pace, with their share of GDP rising sharply from 2002 to 2007 and falling there-after, finally settling in at about 6 percent . FDI in export-oriented activity also has been relatively low, again despite Rwanda’s very strong performance on the Doing Business Indicators and efforts to attract FDI .
Future AspirationsBuilding on its strong record, Rwanda’s future aspirat ions are ambit ious, as reflected in the country’s Vision 2020 and Vision 2050 currently under preparation . These documents, products of extensive national consultations, are being opera-tionalized by a series of economic devel-opment and poverty reduction strategies and seven-year government programs . For 2018 to 2024, they are being combined into a single process, the National Strategy for Transformation .
Vision 2020 set the country on an ambi-tious course . Achieving middle-income status and reducing the poverty rate to 20 percent by 2020 were among its key objectives . The vision identified six pillars to achieve its goals: (1) human resource devel-opment and a knowledge-based economy, (2) regional and international economic integration, (3) infrastructure development, (4) a private sector–led economy, (5) produc-tive and market-oriented agriculture, and (6) good governance and a capable state . Gender equality, environmental sustain-ability, and long-term commitment to sci-ence and technology were the cross-cutting themes to support the six pillars .
Vision 2050 aspires to take Rwanda to upper-middle-income-country status by 2035 and high-income status by 2050, with the intention of providing productive eco-nomic opportunities and higher-quality
FIGURE O.10 Price levels and GDP per capita in Rwanda and comparator countries and economies, 2011
Inde
x (le
vel o
f U.S
. GD
P in
201
1 =
1)
GDP per capita (2011 prices, PPP)
0
0.1
0.2
0.3
0.4
0.5
0.6
0.7
0.8
0.9
500 5,000 50,000
VietnamIndia
Rwandakorea, Rep. Taiwan, China
China
Source: Calculations based on Penn World Tables 9.0 data (Feenstra, Inklaar, and Timmer 2015). Note: PPP = purchasing power parity.
FIGURE O.11 Manufacturing value added in the East African Community, 2006–16
Source: World Development Indicators data (World Bank, various years).
5
6
7
8
9
10
11
12
13
14
15
2006 2007 2008 2009 2010 2011 2012 2013 2014 2015 2016
man
ufac
turin
g va
lue
adde
d (%
GD
P)
Burundikenya Sub-Saharan Africa
Tanzania RwandaUganda

O V E R V I E W 9
living standards to all Rwandan citizens (Government of Rwanda 2017) . These aspi-rations translate into double-digit average annual growth rates (more than 10 percent in per capita terms), requiring Rwanda to grow faster than China or the Republic of Korea at similar stages of their development ( figure O .12) . If growth falls even slightly short of this, Rwanda’s upper-middle-income- country ambitions would be pushed back by at least a decade . The aspirational growth scenario has major underlying requirements, as described in box O .1 .
To achieve these ambitions, Vision 2050 adopts four broad priorities, which also underpin the design, policies, and actions of the National Strategy for Transformation:
1 . Higher quality of life and standard of living . To move beyond meeting basic needs to ensuring a higher standard of liv-ing for all people, Rwanda will focus on (1) access to affordable high-quality edu-cation and health care; (2) modern hous-ing and settlements with environmentally friendly and climate-resilient surround-ings; (3) comprehensive adequate social security and safety nets; (4) universal access to daily amenities; and (5) compre-hensive personal security and safety .
2 . Transformation for prosperity (develop-ment of high-value and competitive jobs and sectors) . To improve productivity and competitiveness, Rwanda will tar-get diversified tourism, manufacturing driven by competitive local industries, business and financial services, informa-tion technology, logistics and aviation, agroprocessing, science and technology innovation, construction, and extrac-tive industries . All of these efforts will be underpinned by high-quality services in public and private sectors .
3 . Development of modern infrastructure and productive livelihoods . This effort would involve modernization with smart green cities, towns, and rural settlements; well-designed transport facilities and services; and efficient public and private services .
4 . Positive contributions to international peace and prosperity . Rwanda will forge its own place in the world in the context of regional integration, multilateral and bilateral cooperation, freedom from aid dependency, pan-Africanism, and South-South cooperation .
These objectives will be underpinned by strong and sustainable macroeconomic fun-damentals, effective institutions, and positive Rwandan values . The values underpinning economic and social progress are self-reliance and self-determination, dignity, unity and Rwandan identity, integrity, equity (including gender and youth), transparency and open-ness, participation in the global community, good governance and accountability, com-munity participation, local innovation, and national stability .
Centered on the Rwandan people, Vision 2050 considers Rwandans as the country’s main resource, reflects the society’s core val-ues, recognizes a strong collaborative role
FIGURE O.12 Projected GDP per capita for Rwanda under alternate growth scenarios, 2016–50
Sources: Calculations based on World Development Indicator data (World Bank, various years); Penn World Tables 9.0 data (Feenstra, Inklaar, and Timmer 2015)Note: Alternate GDP per capita trajectories if Rwanda were to grow at the pace of other countries from a similar income level as Rwanda in 2016.
0
20162018
20202022
20242026
20282030
20322034
20362038
20402042
20482046
20442050
2,000
4,000
6,000
8,000
10,000
12,000
14,000
US$,
201
6 pr
ices
BotswanaThailandIndiaRwanda, aspirational
Korea, Rep.China
Taiwan, China
Rwanda’s GDP per capita in 2016
High-income cuto ($12,476)
Upper-middle-income cuto ($4,035)

10 F U T U R E D R I V E R S O F G R O W T H I N R W A N D A
BOX O.1 Major requirements of Rwanda’s income aspirations
The aspirational income targets of Vision 2050 require substantial increases in savings and invest-ment, as illustrated in the aspirational high-growth scenario summarized in table BO .1 .1 . The sce-nario assumes that gross domestic product (GDP) growth rises to 12 .5 percent a year (10 .2 percent in per capita terms) by 2022 and stabilizes at that level for the foreseeable future (the slightly lower GDP growth rate in table BO .1 .1 reflects slower growth from now until 2022) . As a result, GDP per capita rises to just over US$4,000 in 2035 and to more than US$12,000 in 2050, which is the threshold currently used to determine high-income status . The investment rate would have to rise to about 40 percent, in a context of declining foreign assistance . The slack would have to be picked up by increased private investment, because public investment is already at the limits set by financing options . Further, the savings rate would need to increase four- to fivefold (from 8 percent in 2016) in the next two decades to finance these much higher levels of investment .
Total factor productivity growth also would need to accelerate rapidly (tables BO .1 .2, BO .1 .3, and BO .1 .4)—to about 6 percent a year—and to account for two-thirds of future growth . Another crucial requirement is greater human capital, calling for strong improvements in the level and
quality of education and worker skills . A much stronger external orientation also would be nec-essary, with the ratio of exports to GDP more than doubling to well over 40 percent by 2035 .
The aspirational high-growth scenario would further require significantly higher labor produc-tivity growth—aggregate and within each of the major sectors . The demands on industry would be especially strong, with labor productivity in the sector having to switch from a declining trend in the past decade to solid 6 percent annual growth in the coming period . Labor productivity growth in agriculture and services also would have to accel-erate significantly . Even with strong within-sector improvements, almost 70 percent of the overall growth of labor productivity in the next couple of decades would be generated by structural transfor-mation, reflecting massive movement of labor out of agriculture and into industry (mining, construction, manufacturing, utilities) and services .
The requirements of less ambitious income growth trajectories (by matching, for example, the growth rate of China or the Republic of Korea or the slightly lower growth rate of Botswana, India, or Vietnam at a similar stage) would be slightly less onerous, but not by much . Rwanda would require significantly higher savings and private investment rates and productivity growth .
TABLE BO.1.1 Aspirational high-growth scenario for Rwanda: Demand-side requirements, 2000–35
Indicator
Share of GDP (%) Average annual growth (%)
2016 2025 2035 2000–16 2016–35
Gross domestic investment 28 39 40 12.9 13.6Public 12 10 8 n.a. n.a.Private 16 29 32 n.a. n.a.
Domestic consumption 92 77 62 7.3 9.2Gross domestic savings 8 23 38 n.a. 21.0External transfers (net) 4 3 2 n.a. 6.9Gross national savings 12 26 40 n.a. 18.6Exports of goods and services 17 27 46 12.4 17.7Imports of goods and services 37 43 48 10.8 13.1Trade balance −20 −16 −2 n.a. n.a.Current account balance −16 −13 0 n.a. n.a.
Sources: Estimates based on World Development Indicators data (World Bank, various years); National Institute of Statistics of Rwanda data. Note: n.a. = not applicable.
(Box continues next page)

O V E R V I E W 11
BOX O.1 (continued)
TABLE BO.1.2 Aspirational high-growth scenario for Rwanda: Productivity requirements
Indicator
Average annual growth (%)
2000–14 1999–2008 2009–16 2015–35 2017–35
Labor productivity 5.3 — — 8.1 —Agriculture 3.1 — — 5.0 —Industry −2.8 — — 6.1 —Services 3.2 — — 6.1 —
Total factor productivity — 4.3 1.1 — 6.0
Sources: Estimates based on World Development Indicators data (World Bank, various years); National Institute of Statistics of Rwanda data. Note: — = use of different time periods for labor productivity growth and total factor productivity growth.
TABLE BO.1.3 Aspirational high-growth scenario for Rwanda: Sectoral share of employment, 2000–35
Indicator
Share of total employment (%) Average annual growth (%)
2015 2025 2035 2000–14 2015–35
Total employment 100 100 100 2.5 2.8
Agriculture 66 49 36 0.6 −0.2Industry 9 16 27 14.6 8.6Services 24 36 37 9.4 4.8
Source: Estimates based on National Institute of Statistics of Rwanda data. Note: The assumed decline in average growth in agriculture from 2000–14 to 2015–35, despite higher labor productivity growth in the sector, in part reflects the massive movement of labor to other sectors.
TABLE BO.1.4 Aspirational high-growth scenario for Rwanda: Sectoral share of GDP, 2000–35
Indicator
Share of total GDP (%) Average annual growth (%)
2015 2025 2035 2000–14 2015–35
Total GDP 100 100 100 8.0 10.1Agriculture 30 16 9 5.4 3.8Industry 19 27 38 10.0 14.1Services 51 57 53 9.6 10.1
Source: Estimates based on National Institute of Statistics of Rwanda data. Note: The assumed decline in average growth in agriculture from 2000–14 to 2015–35, despite higher labor productivity growth in the sector, in part reflects the massive movement of labor to other sectors.
for both the state and the private sector, and signals an outward reach to make up for the small domestic market and to access criti-cal knowledge and ideas . Strong connective infrastructure and a focus on efficient urban development are viewed as being crucial for future growth . The vision further envisages a dynamic knowledge-based economy, with the service sector playing a leading role: Rwanda
is envisioned as the innovation, telecommu-nications, financial, and logistics hub for East Africa .
Rwanda in 2050 will be a vastly altered place—an innovative, knowledge-based, and globally integrated economy with a highly creative population and world-class enter-prises . Not only will it be substantially richer, but also its people will be universally endowed

12 F U T U R E D R I V E R S O F G R O W T H I N R W A N D A
with much higher levels of human capital, and its cities, hosting more than 60 percent of the country’s population, will be brim-ming with economic vitality and serving as continental centers of specialized knowledge . High levels of societal trust will be the glue holding the country firmly together . Rwanda also will have comfortably transitioned to becoming an open economy (akin to today’s Singapore)—with cross- border trade, con-nective infrastructure, investment flows, and people-to-people exchanges marking close economic ties across the continent and beyond . Drawing on the vitality of its cities and the highly developed capabilities of its people, Rwanda will transition to becoming a continental hub for higher-end services, hav-ing maximized the industrial opportunities along the way . The institutions of governance will evolve into even higher forms of capa-bility and accountability, with the country ranked alongside high-income nations on key measures of governance .
Opportunities and RisksGlobal Megatrends
Global megatrends of technological innova-tions, shifting patterns of production, and changing sources of cross-border investments have major implications for economic activ-ity in Rwanda and elsewhere . Global climate change is another major trend, with significant downside risks for all countries, but especially for those in the low- and middle-income world that are reliant on agriculture and have lim-ited resources to mitigate the impact . Rwanda can shape the net benefits of these forces in its favor with early and decisive action to develop the capabilities of its workers, firms, and pub-lic institutions, the right investment decisions, and more effective business regulations .
Technology Megatrends Global technological and business innova-tions, powered by the information revo-lution, are increasingly disrupting the patterns of production and trade across the world, with major implications for low- and
middle- income countries . The innovations are affecting what is produced, how it gets produced, and where it is produced—not just for advanced goods but also for more tradi-tional manufactured goods .
New technologies associated with indus-try 4 .0—or the fourth industrial revolu-tion, including industrial automation and advanced robotics, digitalization and integra-tion of Internet-based systems (the Internet of Things), and additive manufacturing (three-dimensional printing)—are part of a larger trend of automation and data exchange in economic activity . For example, consumer goods are increasingly embedded with elec-tronics, software, sensors, and network con-nectivity to enable these objects to connect and exchange data, which is changing manu-facturing . The service sector, traditionally a nontradable sector, is becoming a major part of the global trade story .
Technology and the information revolu-tion are also enabling disruptive innovations in business models . Apple is an early (and highly successful) example, with its disrup-tion of a wide range of industries, including personal computers, music, movies, media, and telecommunications . Other prominent examples include digital platform com-panies like Airbnb and Uber, which have fundamentally altered the hospitality and taxi industries, respectively . Increased auto-mation is further affecting production loca-tions, enabling, for example, some leading firms, albeit still in small measure, to return labor-intensive manufacturing back to high-income economies and closer to consumers .
Their disruptive nature notwithstand-ing, technological innovations, for the most part, bring upside opportunities for low- and middle-income countries . There is evidence that more widespread use of scale-neutral digital technologies, such as ICT, allows firms in emerging economies to access wider markets by cutting entry costs and by reduc-ing the impact of distance .7 For example, scale is expected to matter less with addi-tive manufacturing technologies, such as three-dimensional printing . Combined with the demand for customized, fast-delivered

O V E R V I E W 13
goods, widespread use of digital technolo-gies could lead to geographically dispersed production, potentially helping small econo-mies like Rwanda to overcome some of their scale and locational constraints .8 ICT in the Internet of Things space, such as big data and cloud computing, can similarly reduce the impact of distance on firms’ competitive-ness . This, too, is positive news for Rwanda, given its landlocked geography and distance from markets . The Rwandan government aims to capitalize on this emerging trend by continuing to invest in network connec-tivity and sensor deployment in different applications .
In services, the information revolution has allowed low- and middle-income countries to go beyond traditional export sectors such as tourism and transport to more modern ones such as health care and business . These new export products can be exported electroni-cally (taking distance out of the equation), can achieve scale economies, and are an effec-tive channel for technology diffusion . The spread of productivity-enhancing characteris-tics in services expands the range of activities available as pathways for development .
Modern technological innovations also pose major threats . To the extent that they are labor efficient and skills intensive, the concern is that they will narrow the paths for low- and middle-income countries to benefit from manufacturing . Some observers have raised the specter of premature deindustrialization (Rodrik 2015) . The implication is not just that machines will displace unskilled labor, but also that production will be retained in higher-income economies . In addition to reshoring of manufacturing activity from low- and middle-income countries back to high-income countries, there is also a concern that the expected migration of labor-intensive activities from China to poorer economies with lower labor costs might not happen or might happen only in select locations that form part of China’s regional value chains . Technological innovations also threaten to exacerbate inequality, both within and across countries, as countries in a position to lever-age technology gain higher incomes .
Consequently, cheap labor as a source of competitive advantage is increasingly giving way to a more demanding ecosystem . It is still not a zero-one choice for global produc-ers, which remain open to producing in both high-income and low- and middle-income countries . But their requirements are getting more stringent with regard to infrastructure, available skills, logistics, other backbone services, regulations, supplier base, and intel-lectual property rights . There is also growing demand for low- and middle-income-country firms to adopt new technologies to remain competitive, but to do so they need to have greater capacity to use the new technolo-gies, raising the bar further in terms of the mentioned prerequisites .
An early mover in some areas, Rwanda may be well placed to take advantage of these trends . The cell phone revolution, for example, has lessened the need for landline connectivity, reducing the potential cost of investing in such legacy technologies .9 Similarly, drones can potentially reduce the need for air transport–related infrastructure . The much-cited example of Zipline, which uses unmanned drones to make 50–150 daily deliveries of critical medical supplies to various locations across Rwanda, is perhaps just the begin-ning . Furthermore, commercial drone services could transport items other than emergency supplies .10 The impact is already being felt in agriculture . e-Soko—an electronic platform that gives farmers, consumers, and traders up-to-date market price information by short message service—is widely used in Rwanda, enabling farmers to market their agricultural produce better and to get premium prices .
ICT-enabled modern services could enable Rwanda to leapfrog—at least in part—the stage of manufacturing-led development in the conventional process of structural change . Business process outsourcing services, for example, can be developed without a manu-facturing core, with the potential to become a major export area . To derive the most benefits, Rwanda will have to build its human capital rapidly, enable the emergence of vibrant and competitive domestic enterprises, and invest further in building resilient market institutions .

14 F U T U R E D R I V E R S O F G R O W T H I N R W A N D A
Regional Value ChainsFragmentation of production into global value chains has created a critical oppor-tunity for countries to develop through export-led manufacturing . In East Asia, for example, several countries have leveraged these opportunities to achieve export-led rapid
development (box O .2) . These trends have brought tremendous benefits to participating countries, seen in their growing heft in the world economy: the share of low- and middle-income G-20 countries11 in world GDP rose from 11 percent in 1990 to 28 percent in 2016 . China’s share alone increased from less than 2 percent to 15 percent, as its share of global manufacturing rose from less than 5 percent in 1990 to 10 percent in 2016 .
The world economy is now experienc-ing structural shifts that could dramatically change the outlook for global value chains in the coming years (OECD 2017) . On the one hand, global value chains are maturing and losing momentum because the “unbundling of production” has largely already happened, as seen in the flattening of the share of foreign value added in gross exports of goods and services since the onset of the 2008 global financial crisis (figure O .13) . On the other hand, new forces are reorienting produc-tion within global value chains . Production costs have risen significantly in some low- and middle-income economies, eroding their competitiveness in labor-intensive manufac-turing activities and driving the transition from labor- to capital-intensive industries .12 Digitalization of production is also shaping global value chains by reorienting global pro-duction and trade closer to demand .13
Production is becoming increasingly con-centrated in regional and local hubs closer
FIGURE O.13 Measures of global vertical integration in Rwanda, 1995–2014
Source: Hallward-Driemeier and Nayyar 2017.Note: WIOD = World Input-Output Database; WITS = World Integrated Trade Solution.
120
110
100
90
80
70
60
19951996
19971998
19992000
20012002
20032004
20052006
20072008
20092010
20112012
20132014
Perc
ent
Foreign value added, share of exports per gross exports (WIOD 2013)Foreign value added, share of exports per gross exports (WIOD 2016)manufacturing import content, share of manufacturing exports per gross exports (WIOD, WITS)
BOX O.2 The importance of regional value chains for growth and outward orientation in East Asia
Light manufacturing has long been seen as a cata-lyst for economic development . It is labor intensive, is capital parsimonious, and offers viable develop-ment pathways for low- and middle-income coun-tries . Various economies in East Asia, including the Republic of Korea and Taiwan, China, began their engagement with buyer-driven value chains in apparel and footwear, among others, by importing intermediate goods and assembling them into final products, often in export-processing zones . Over time, firms in these countries were able to upgrade
into full package production . Some were eventually able to develop and commercialize brands of their own (Gereffi 1999; Gereffi and Memedovic 2003) . In the process, they offshored lower-value-adding activities to other countries in the region, which eventually upgraded into higher-value-adding func-tions themselves, sending their previously held com-petencies elsewhere (Akamatsu 1962) . The shift of manufacturing activity from coastal China to Vietnam is the latest step in this “flying geese” pat-tern of industrial development .

O V E R V I E W 15
to end markets . This concentration has implications for manufacturing-led growth in Africa, where cross-border production networks have yet to materialize because of weak regional integration . Enormous oppor-tunities for cross-border trade in food prod-ucts, basic manufactured goods, and services therefore remain unexploited because of high transport costs, nontariff barriers, and regu-latory constraints (Brenton and Isik 2012) . Enhanced regional integration is important to derive the benefits on offer . The conti-nent also will need to keep a close eye on the rapid technological innovations and changing sources of FDI (discussed next) .
T he g rowing reg iona l i zat ion- in - production trend can work in Rwanda’s favor . The region around it abounds in (largely untapped) opportunities (box O .3) . Moreover, the ability of Rwandan firms to compete globally depends on the “competi-tiveness” and “connectedness” of its neigh-bors . Rwanda is therefore likely to seize regional trade opportunities through intra-regional trade and participation in regional value chains connected to the global market .
The strongest regional opportunities for Rwanda exist in commodity-based processing
and exports and services trade . These oppor-tunities apply in particular to agribusiness and food processing, subsectors in which Rwanda currently has a revealed comparative advan-tage (Hallward-Driemeier and Nayyar 2017) . These activities employ unskilled workers and have relatively low intensity of physical capital and research and development . The products typically are traded regionally (rather than internationally) because they are bulky to transport (for example, wood products, bev-erages) or require proximity to raw materials (for example, food production) . The region also offers major opportunities for trade in services, which already forms more than half of Rwanda’s export earnings . There is sig-nificant potential to boost services exports further, while benefitting from the greater competition, lower prices, and improved qual-ity that come with services imports .
Changing Sources of Outward FDIThe sources of FDI are changing, a trend that is likely to continue (figure O .14) . In response to higher labor costs, labor- intensive man-ufacturing is moving out of China, and with it new opportunities are emerging for other low- and middle-income countries .
The regional economic blocks around Rwanda abound in opportunities for trade, investment, and transfer of ideas . They also offer scale economies and specialization in production, which would be hard for Rwanda to achieve by relying solely on its own small, landlocked economy .
The most significant regional opportunity arises from Rwanda’s membership in the East African Community (EAC), an ambitious platform for eco-nomic, political, social, technological, and security cooperation for six Great Lakes countries: Burundi, Kenya, Rwanda, South Sudan, Tanzania, and Uganda . The combined population of the EAC is 170 million (about 15 times that of Rwanda), and its combined gross domestic product (GDP) in 2016 was US$163 billion (about 18 times larger than that
of Rwanda) . Revived as a free trade area in 2000 (following dissolution of a previous arrangement in 1977) and upgraded to a customs union in 2005, the community aims to create a common currency and aspires to establish itself as a full political fed-eration . EAC members have duty-free preferential access to the United States through the African Growth and Opportunity Act and to the European Union through Everything But Arms .
The EAC Customs Union entails three key aspects: duty-free trade within the EAC; common external tariffs (CETs) on imports from a third country;a and common customs procedures . The securities exchanges of four countries (minus Burundi, which does not have one) are members of the East African Securities Exchanges Association . Other areas of
BOX O.3 Opportunities in the region around Rwanda
(Box continues next page)

16 F U T U R E D R I V E R S O F G R O W T H I N R W A N D A
cooperation include a regional power pool, transport links, and trade facilitation . EAC-wide competition policy and law are in place .
Despite this good progress, several impedi-ments prevent more meaningful economic integra-tion . First, free trade is hampered by a long list of duty exemptions and significant nontariff barriers . Second, lack of policy harmonization holds back cross-border infrastructure development (Dihel, Fernandes, and Mattoo 2012) . Third, although member countries have committed themselves to developing harmonized and complementary trade and transport policies, these commitments gen-erally remain on paper only .b Fourth, the region is still some way from enabling free cross-border mobility of labor and capital . Issues such as perma-nent residency and the right of access to, and use of, land remain subject to national policies rather than being part of the common market protocol . Fifth, EAC member states still have to harmonize customs procedures in practice . Moreover, customs revenues are not pooled .c Finally, regional institu-tions are weak, and enforcement mechanisms are especially so .
Further opportunities lie in the Common Market for Eastern and Southern Africa (COMESA) and the expected opening of the African Continental
Free Trade Area (AfCFTA) . COMESA, a free trade area with Rwanda as one of its members, has 40 times Rwanda’s population and 80 times its GDP . The AfCFTA, an even bigger opportunity, is a pan-African push to promote and harmonize trade liberalization across the continent’s subregions . Once operational, it will be one of the world’s largest free trade areas, potentially involving 55 nations (only 44 have signed the agreement thus far) with a combined popula-tion of more than 1 .2 billion and GDP of more than US$2 trillion (UNCTAD 2018) . The United Nations Economic Commission for Africa estimates that intra-African trade could increase more than 50 percent under the AfCFTA if import duties were eliminated, and more than 100 percent if nontariff barriers were also reduced (UNECA 2018) .
Finally, there is significant untapped market potential to the west in the Democratic Republic of Congo . While conflict in the Democratic Republic of Congo limited trade prior to 2007, exports have increased considerably in the last decade . By 2016, Rwanda exported more goods to the Democratic Republic of Congo than to the EAC . The main exports include livestock and crops, but there also is significant (informal) cross-border trade in ser-vices such as finance, transportation, and wholesale trading .
BOX O.3 (continued)
FDI outflows from East Asia rose 7 percent in 2016 to US$363 billion, mainly because of new outflows from China . On the back of surging cross-border mergers and acqui-sitions by Chinese firms, China has become the second-largest Asian investor, after Japan (UNCTAD 2017) .
Investment abroad by Chinese firms tar-gets a wide range of manufacturing and ser-vices industries,14 with increasing attention to Africa as a destination . African countries still account for a small share of net global FDI inflows (2 .4 percent in 2015), but the continent’s share has almost tripled since
2000, as has the stock of Chinese FDI in the continent . In 2015, 4 of the top 10 FDI investors in Africa were Asian economies, led by China .15 Notably, greenfield FDI into Africa is coming largely from low- and middle- income economies, whose compa-nies are also participating through mergers and acquisitions and purchases of assets held by high-income-country multinationals . In 2016, almost 80 percent (US$73 .6 billion of US$94 .1 billion) of announced green-field FDI projects in Africa were from low- and middle-income countries, nearly half of it (US$36 .1 billion) from China alone
a. Currently, there are three CET rates: 0 percent for raw materials, 10 percent for intermediate goods, and 25 percent for finished goods.b. For example, regulations on vehicle dimensions, axle-load limits, road transit charges, and highway codes have yet to be harmonized. Even common definitions of road classes and route numbers are missing. Similarly, rail connectivity is impeded by minimal integration of national technical standards, such as those for building and maintaining railway facilities. Shipping on inland waterways and lakes would benefit from common regulations on ship registration as well as safety standards, including those on periodic ship surveys, staffing requirements, and aids to navigation and radio communication (World Bank 2015a).c. Customs operations, including revenue collection, are managed by national authorities, creating delays and increasing transaction costs.

O V E R V I E W 17
(UNCTAD 2017) . However, these projects are mostly in real estate, natural gas, infra-structure, renewable energy, chemicals, and automotive; FDI in manufacturing is still relatively rare in Africa .
The top FDI investors in Rwanda are already low- and middle-income nations . Faced with declining foreign assistance, Rwanda surely needs more FDI to address its massive investment needs . However, it also needs to make sure that FDI is targeted increasingly to the tradable sector to support the massive export drive needed for high growth . The regional trade agreements are likely to enhance Rwanda’s (and the rest of the continent’s) attractiveness to FDI, as they promote a unified market structure and inte-grated production networks .
Global Climate ChangeClimate change is potentially the most con-sequential global issue . Greenhouse gas emis-sions are on path to cause a 3 .5°C to 4 .0°C warmer planet by the end of the century . Climatic conditions, heat, and other weather extremes considered highly unusual or unprecedented today could become the new normal . The impact of global climate change is already being felt, with the number of cat-egory 4 and 5 storms having risen sharply over the past 35 years . The Arctic Ocean’s ice has shrunk to its lowest area on record, and global sea levels have risen about 10–20 centimeters in the past century, increasing the risk of storm surges and fluctuations in pre-cipitation (World Bank 2016) .
The threat to Rwanda’s economy from climate change is already being felt . The aver-age temperature in Rwanda has increased at a higher rate than the global average . Its rain-fall patterns are becoming more irregular and unpredictable, with shorter rainy seasons, which has had a major impact on food pro-duction . Rwandan agriculture is mostly rain-fed (less than 10 percent of cultivable land is irrigated), which is why crop production is highly vulnerable to climate- and weather-related risks . These risks are compounded by high levels of soil erosion and periodic floods and landslides .
Medium-term cl imate projec t ions for Rwanda indicate further increases in temperature—between 1°C and 2 .5°C—by the middle of this century . Rainfall projec-tions, though less certain, suggest increased year-to-year variability in rainfall . The agri-culture and livestock sectors will likely be affected . Rwanda will need to plan for these vulnerabilities and seek to manage them with climate adaptation policies and investments .
Domestic Opportunities and Challenges
Population Dynamics and the Promise of a Demographic DividendRwanda’s population has grown about 2 .5 percent a year since 1960, a pace that has been sustained since 2000 . This is a brisk but not exceptional pace in compari-son with the rest of the low- and middle-income world: 54 nations have seen a faster increase in population since 1960 (44 since 2000) . As a result of demographic shifts, influenced by relatively high but declining fertility rates and sharp reductions in child mortality, today’s Rwanda is a youthful
FIGURE O.14 Share of global net outflows of foreign direct investment, by region, 1994–2016
Source: World Development Indicators data (World Bank, various years).Note: Net outflows of investment from the reporting economy to the rest of the world.
–10
0
1994 1996 1998 2000 2002 2004 2006 2008 2010 2012 2014 2016
10
20
30
40
50
60
70
80
Perc
ent
90
East Asia and PacificEurope and Central Asia
Latin America and the Caribbean
Middle East and North Africa
South AsiaSub-Saharan Africa

18 F U T U R E D R I V E R S O F G R O W T H I N R W A N D A
nation, with a median age of just 19 years: 40 percent of the population is under the age of 15, and almost 70 percent is under the age of 30 (UNFPA 2017) .
Rwanda has the potential to harness its demographic dividend . Yet risks associated with population increase are heightened by Rwanda’s high population density (the high-est in mainland Africa) and rising pressures on its limited natural resources and the envi-ronment . In addition, the fertility rate, one of the main drivers of population growth, has declined only gradually on average—from an average of 5 .6 births per woman in 2000 to 4 .2 births per woman in 2015, includ-ing a brief rise and fall during that period . At the current pace, Rwanda’s population, 11 million in 2016, is projected at least to double by 2050, which would more than dou-ble the density of population to close to 1,000 people per square kilometer of land area .
Important gains from a demographic div-idend are possible if the decline in the fertil-ity rate—and thus in the population growth rate—could be accelerated . Rwanda could boost its GDP growth 1 percentage point by targeting a lower dependency ratio—the number of people who are under and above the working ages of 15–64 years for every 100 persons of working age—in parallel with improved schooling (UNFPA 2017) .16 Rwanda’s dependency ratio is relatively high at 75 percent . The United Nations Population Fund estimates that the depen-dency ratio could fall to anywhere between 53 and 64 percent by 2050, depending on the pace of the decline in fertility . High-growth countries in East Asia bottomed out at dependency ratios of about 40 percent, so perhaps there is scope to accelerate Rwanda’s progress . Policy options include better-targeted family planning measures and continued emphasis on female educa-tion, health, and economic empowerment (UNFPA 2017) .
Emerging Middle ClassHigh growth sustained over an extended period can profoundly affect the income characteristics of the population . If GDP
growth remains high, Rwanda can expect a rapid decline in the poverty rate and a con-comitant rise in the share of its middle-class population . With 7 .5 percent growth of GDP per capita and with income distribu-tion assumed to remain unchanged, Rwanda would virtually eliminate extreme poverty (those spending less than US$1 .90 purchas-ing power parity a day) somewhere between 2035 and 2040 and more than halve the share of the moderate poor (those spending between US$1 .90 and US$3 .20 purchasing power parity a day) from the 21 percent rate observed in 2014 (figure O .15) . At the same time, more than 70 percent of its population would be middle class or higher ( persons cat-egorized as emerging consumers and global middle class) . Even if per capita growth comes in at about 5 .5 percent a year (still quite high by global standards), half of Rwanda’s popu-lation would be middle class by 2040 .
These projected shifts are likely to be rep-licated at the regional level and will have profound implications for the population’s purchasing power, preferences, aspirations, and expectations of government . The thrust of Rwanda’s growth strategy would still need to be oriented outward, producing tradable goods and services to meet regional and global demand rather than internal demand . This orientation is the only way for Rwanda to overcome the constraints of being a small economy and reach the scale economies and specialization necessary for high growth . But rising consumer incomes will generate strong demand for nontradable products, which will create an important secondary opportunity for local businesses .
Strong Potential for Structural TransformationWith close to 70 percent of the labor force still in agriculture, which has much lower labor productivity than the major subsectors within industry and services (figure O .16), a significant potential remains for realizing fur-ther gains from structural transformation—the process by which labor and other resources shift from one economic sector to another . By this report’s estimate, more than

O V E R V I E W 19
70 percent of Rwanda’s GDP growth in the next two decades is likely to be accounted for by structural transformation, even under a high-growth scenario . But gains from structural transformation cannot be taken for granted . Only strong labor productivity growth within sectors can assure continued gains from structural transformation . For that assurance, policies to boost competi-tiveness within sectors, as discussed in this report, and well-functioning factor markets (for land, labor, and capital) are essential .
Main Elements of Rwanda’s Growth StrategyAs noted, aspirations have been set extremely high, targeting an upper-middle-income Rwanda by 2035 and a high-income econ-omy by 2050 . These aspirations translate into double-digit average annual growth rates (more than 10 percent in per capita terms)—targets that will require Rwanda to grow faster than any country (China and Korea included) has in the past . The requirements—regarding
future investment and savings rates, human capital development, export orientation, technological innovation, and other forms of productivity improvements—are demanding .
FIGURE O.16 Labor productivity gaps in Rwanda, by sector, 2014
Sources: Estimates based on World Development Indicators data (World Bank, various years); National Institute of Statistics of Rwanda data.
0
Agricultu
re
Constructi
on
Other service
s
mining
Transporta
tion
and communica
tions
Human reso
urces
manufacturin
g
Utilitie
s
Financial se
rvices
100
200
300
400
500
600
700
800
900
43
141180 207
250 251295
970
714
1,000
Sect
oral
pro
duct
ivity
as a
shar
eof
ave
rage
pro
duct
ivity
(%)
FIGURE O.15 Growth scenarios for Rwanda and share of the population, by consumption category, by 2040
Source: Calculations based on National Institute of Statistics of Rwanda data.Note: PPP = purchasing power parity.
20142016
20182020
20222032
20342036
20382040
20242026
20282030
Shar
e of
pop
ulat
ion,
by
cons
umpt
ion
cate
gory
(%)
Shar
e of
pop
ulat
ion,
by
cons
umpt
ion
cate
gory
(%)
0
10
20
30
40
50
60
70
80
90
100a. Aspirational high-growth scenario (7.5% per capita growth)
0
10
20
30
40
50
60
70
80
90
100b. High-growth scenario (5.5% per capita growth)
20142016
20182020
20222032
20342036
20382040
20242026
20282030
Global middle class (> US$15.00 PPP/day)Emerging consumer (US$5.51–US$15.00 PPP/day)Near poor (US$3.21–US$5.50 PPP/day)
moderate poor (US$1.90–US$3.20 PPP/day)Extreme poor (< US$1.90 PPP/day)

20 F U T U R E D R I V E R S O F G R O W T H I N R W A N D A
Essential ingredients for success are strong leadership, social cohesion, and deep invest-ments in core capabilities—of people, firms, and institutions—to harness the global and technology-related opportunities that are on offer .
The reform agenda is complex and highly demanding: nothing short of an extraordinary effort will suffice, given the level of Rwanda’s ambition . The hard work begins in class-rooms . The country needs a massive effort focusing on human capital development—its own education-focused Marshall Plan—if it is to achieve its income ambitions . With all of its achievements, Rwanda still lags the aver-age of low-income countries in crucial aspects of human capital—for example, in stunting and in primary and lower-secondary school completion . An important related issue is the high stunting in early years, with implications for children’s future learning abilities and par-ticipation in the knowledge and services-led economy that Rwanda envisages .
The next requirement is to achieve higher investment rates . Rwanda already has a relatively high investment rate of about 26 percent . But double-digit growth rates would require investment to be significantly higher still—at least 35–40 percent—in an environment of declining external assistance . Achieving this level of investment will require a sharp increase in investment by the private sector, because public investment is already at the limit set by the available financing options; a more than fourfold rise in the domestic sav-ings rate; and even higher FDI .
A higher-order challenge is to boost pro-ductivity growth, which also has a bearing on Rwanda’s ability to raise the investment and savings rates . High productivity growth, in turn, will require scale economies and eco-nomic specialization in areas of Rwanda’s comparative advantage, with competition and technology diffusion as essential comple-ments . Scale economies and economic spe-cialization have proved essential for sustained high growth across the world (Commission on Growth and Development 2008), but it is even more important for a small, landlocked country like Rwanda .
For scale and specialization, Rwanda will need to make the most of external oppor-tunities and enhance the benefits of urban agglomeration . To succeed in these areas, Rwanda needs to have a competitive domes-tic enterprise sector, both public and pri-vate, with a strong potential to do well in competitive environments . Such enterprises themselves have three critical requirements: a strong ecosystem for technological innova-tion, world-class human capital, and robust institutions of governance . This chain of pri-orities forms Rwanda’s high-growth strategy .
Rwanda’s strategy for high growth thus has four essential and interdependent drivers—innovation, integration, agglom-eration, and competition (figure O .17) . These future drivers of growth, in turn, would receive the necessary boost from reforms in six high- priority areas: (1) human capital development; (2) export dynamism and regional integration; (3) well-managed urbanization; (4) competitive domestic enterprises; (5) agricultural modernization; and (6) capable and accountable public insti-tutions . The six reform areas are discussed in more detail in the report .
FIGURE O.17 Future drivers of Rwanda’s growth: Innovation, integration, agglomeration, and competition
Highlydeveloped
humancapital
Trade andregional
integration
Modernagriculture/food sector
Capable andaccountableinstitutions
Well-managed
urbanization
Competitivedomestic
enterprisesDRIVERS OF
GROWTHInnovationIntegrationAgglomerationCompetition

O V E R V I E W 21
BOX O.4 An international comparison of Rwanda’s long-term growth trajectory
Only a handful of economies in East Asia have achieved an income trajectory even approaching the one Rwanda aspires to achieve . A comparison with those economies, therefore, can shed useful light on the fundamental areas that need to be at the center of Rwanda’s policy focus .
Rwanda’s long-term growth trajectory stacks up well against the early growth records of global economies that sustained rapid growth over several decades . Figure BO .4 .1 compares Rwanda against two Asian Tiger economies plus Brazil, China, Morocco, and Thailand . The figure is striking on two counts . First, the long-term acceleration of growth in each of these economies started at similar per capita income levels—between US$1,000 and US$1,600 (in 2010 U .S . dollar purchasing power parity) . Second, by 2016, Rwanda (roughly a decade into its postrecovery growth acceleration) had kept pace with comparators (including China) at a simi-lar stage .
What happens from here on seems critical on the basis of international comparisons . About a decade into their respective growth accelerations—Rwanda’s current stage—successful economies such as China, the Republic of Korea, and Taiwan, China, started to pull ahead of the rest . They were able in years 10–50 either to maintain or to surpass their growth records of the first 10 years . However, economies such as Brazil, Morocco, and Thailand saw their growth plunge early in the latter period . The challenge for Rwanda is to follow the trajec-tory of the former group and to avoid that of the lat-ter group . Doing so will mean raising its growth of gross domestic product per capita to the 7–8 percent range . However, if recent-year growth rates of about 4 percent per capita continue, then even after three decades or so, Rwanda could not expect to get past where Brazil or Thailand is today .
Rwanda therefore is at a seemingly important juncture . Decisions in the next 5–10 years will mat-ter for meeting its long-term aspirations . In this
critical period, the successful economies focused on a core set of fundamentals . Common elements included high rates of savings and investment; strong agricultural productivity; early and sustained emphasis on human capital; strong outward orien-tation; robust urban agglomeration; a competitive domestic enterprise sector; and strong, stable, and adaptable institutions of governance . Those condi-tions are necessary for Rwanda to achieve its long-term growth aspirations .
FIGURE BO.4.1 GDP per capita in Rwanda and select countries and economies
Sources: Calculations based on Penn World Tables 9.0 data (Feenstra, Inklaar, and Timmer 2015); National Institute of Statistics of Rwanda data. Note: The base year is the year prior to the one in which long-term growth began to accelerate in each economy. It is 1951 for Taiwan, China, and Brazil; 1958 for Thailand; 1959 for Morocco; 1962 for the Republic of Korea; 1977 for China; and 2005 for Rwanda. The base year for Rwanda is 2005 because that is when GDP per capita recovered to the pre-genocide peak levels. PPP = purchasing power parity.
0
5
10
15
20
25
30
35
GDP
per c
apita
(tho
usan
ds o
f US$
, 201
0 PP
P)
Baseyear
+2 +6 +10 +14 +18
Number of years beyond base year
+26+22 +30 +34 +38 +42 +46 +50
Thailand
China
korea, Rep.
Taiwan, ChinaBrazil
moroccoRwanda
Rwanda(7.8% per capita growth)
Rwanda(4% per capita growth)
Doing well on each of these six neces-sary reform areas is what separated the high-growth East Asian economies from countries that achieved rapid growth for a decade or two, only to see it fizzle
out (box O .4) . The more challenging part is to go beyond the necessary to the sufficient conditions . Rwanda will be pushed to take high-risk strategic bets to gain high returns . These efforts must be calibrated and

22 F U T U R E D R I V E R S O F G R O W T H I N R W A N D A
managed carefully . Policy responses need first to address key cross-cutting constraints (such as skills, finance, infrastructure, and business regulation), clarify the future role of SOEs, and then selectively target areas for direct support that are closely aligned with Rwanda’s comparative advantages . Any such direct support will have to set clear policy objectives and performance targets for beneficiary firms, be coordinated closely across government entities, and include a rigorous system to monitor progress, enforce sanctions, and provide incentives to reward success and punish failure—a model that Korea followed closely in its early years of development .
Any future growth strategy is unlikely to succeed if it leads to further widening of income disparities or does not provide equality of opportunity for all citizens . Growth accel-erations can widen inequalities in the initial stages as returns on skill levels rise and urban agglomeration leads to spatial concentration of economic activity . Rwanda will need to be keenly mindful of its future trends . Building a strong system of social protection to pro-vide basic safety nets to the most vulnerable and expanding access to quality public ser-vices (education, health care, and basic infra-structure such as sanitation, potable water, electricity, and road and telecommunications connectivity, for example) to give everyone a fair chance to enjoy the fruits of growth will be important efforts in this regard . A stronger emphasis on educating girls and empowering women can be especially fruitful in breaking the initial cycle of poverty and expanding the country’s base of human capital .
The growth strategy also will have to protect the environment: economic growth, however fast-paced it may be, at the cost of the environment is not sustainable . Low- and middle-income countries often make the mis-take of neglecting these aspects in the early stages of development, only to find the cost of reversing them later to be much higher—both financially and in terms of lost growth poten-tial . It is not necessary to adopt high-income-country environmental standards from the beginning . But it is necessary to put a price
on water and air pollution from early on, to protect the quality of natural resources (air, land, water), to build climate resilience into economic planning and infrastructure invest-ments, and to meet international commit-ments on cutting greenhouse gas emissions .
The high-growth strategy thus enunci-ated, with emphasis on economic special-ization, scale economies, and trade, leaves open the question of food security at the national level . Rwanda will need to work closely with its regional partners to ensure an uninterrupted flow of food staples—for example, through the provision of financial guarantees under a regional process . If the country decides to maintain self-sufficiency in any particular staple, then it should do so after a careful analysis of the full eco-nomic implications of such a move . For example, Japan and Korea still produce their own rice and beef, but at significant economic costs, which they fully recognize and willingly accept .
Finally, the reform agenda and invest-ment programs underlying the high growth strategy will be financially and institution-ally demanding . Given the limited fiscal space available and expected continued decline of external concessional financ-ing, future interventions will require far greater involvement of the private sector, together with efforts to enhance access to domestic and external capital markets and to strengthen the planning and imple-mentation capabilities of the government . The latter involves better prioritization and greater efficiency of public spending, increased flow of government revenues, and stronger and more transparent public finan-cial management systems . Strong emphasis on macroeconomic and social stability will remain essential to these efforts, even as Rwanda navigates a more uncertain global economic and political landscape .
Six Reform Areas of Importance for RwandaThis section discusses in more detail the six reform areas of importance for Rwanda .

O V E R V I E W 23
Human Capital and Innovation
IntroductionRwanda’s aspirations to reach upper- middle-income status by 2035 require dramatic improvements in human capital . Economies that have grown rapidly over an extended period have made substantial investments in the education and health of their citizens . Human capital includes the knowledge and skills of the popula-tion, and it results from investments in education and health . Ultimately, human capital investment and economic growth form a virtuous cycle: greater human devel-opment increases economic growth, and greater economic growth finances further human development . Cross-country analy-sis demonstrates that countries that invest in human capital early in the cycle enjoy the benefits of this virtuous cycle, whereas countries that experience high initial eco-nomic growth without investing in human capital almost always fall into a vicious cycle of low human capital followed by a slowdown of economic growth (Ranis, Stewart, and Ramirez 2000) .
A broad set of policies is needed to support human capital formation . Building human capital entails a wide array of interventions across the life cycle, starting with invest-ments in early childhood, including prenatal and early child nutrition and cognitive stim-ulation, and continuing with high-quality basic education, higher education oppor-tunities, and skills that individuals gain as adults, both through on-the-job training and through adult education . Interventions also include health investments beyond early child nutrition, from vaccinations for children to preventive and curative health care for chil-dren and adults . Finally, a strong economy invests in innovation to continue creating new opportunities .
Recogniz ing the country ’s s t rong future ambitions, progress on human capital needs to be dramatic and swift . Under the current rate of improvement, Rwanda will still have low-income-coun-try rates of human capital in 2035, which
is insufficient given the country’s ambi-tious aspirations . Moreover, investments in human capital, particularly efforts to reduce stunting and improve basic educa-tion, contribute to growth only after con-siderable time (the beneficiaries have to grow up) . Only a small fraction of the pop-ulation enters the labor force each year, so even dramatic improvements in education will adjust the skills of the overall work-force only slowly . The sooner Rwanda increases its human capital investments, the sooner it will be on track to achieve more rapid growth .
Challenges and OpportunitiesHuman capital efforts are urgent for Rwanda on a wide range of interventions, including prevention of stunting, improve-ment of access to and quality of basic edu-cation, increase in enrollment in higher education, and building of innovation capacity .
Despite the launch of several success-ful initiatives, stunting still represents a major challenge in Rwanda . At last mea-sure, 36 .5 percent of children suffered from stunting . Furthermore, the elasticity of stunting with respect to economic growth in Rwanda is less than half the elasticity in the rest of the world, so future economic growth cannot be counted on to eliminate it . Stunting has significant short- and long-term impacts on Rwanda’s human capital and—ultimately—on economic growth . Adults who were stunted in childhood have poorer health and shorter height, are at risk of suffering noncommunicable diseases, and have lower cognitive ability and fewer socioemotional skills . These effects trans-late into reduced productivity, lower wages, and slower economic growth . By one esti-mate, the per capita income of today’s workforce would be 10 percent higher if adult Rwandans had not been stunted as children . These impacts spill over to the next generation, with stunted women more likely to have babies who are underweight and who have cognitive challenges (Galasso et al . 2016) .

24 F U T U R E D R I V E R S O F G R O W T H I N R W A N D A
Rwanda faces the same two challenges in basic education as many other coun-tries: access and quality . Virtually all children in Rwanda begin primary school, but only about two-thirds of them com-plete it . One reason is out-of-pocket costs . Another is high opportunity costs, which are accounted for in part by high repetition rates in the early grades . Nearly one-quarter of first-grade students are made to repeat that grade (USAID 2017) . Repetition—along with other factors, such as limited early childhood education coverage and late school starters—results in a large “bulge” of students in P1 (first grade) (figure O .18), lowering the likelihood of primary school
completion and making improvements in quality difficult .
The concern about the quality of educa-tion is just as serious as the concern about access . If students are failing to learn, then economic growth will not follow from investments in education . Yet 85 percent of Rwandan students at the end of grade 3 were rated “below comprehension” on a recent reading test, and one in six students in grade 3 could not answer a single read-ing comprehension question (EDC 2017) . In addition, youth who are approaching the job market also need better opportunities for skills training to help them to transition to employment .
FIGURE O.18 Early-grade “bulge index” in Rwanda and select countries
Source: Bashir et al. 2018. Note: Low values in Rwanda reflect high enrollment in P1 (first grade) relative to the age group, low progression to P2 (second grade) (that is, many repeaters), and low preprimary coverage.
Rwanda
madagascar
UgandaGuinea-Bissau
BurundiEthiopiaSierra Leone
TogoChad
BeninAngolaCongo, Dem. Rep.
Cameroon
Central African RepublicLesotho
Congo, Rep.Equatorial Guinea
ComorosBotswana
Namibia
SwazilandZimbabwe
SenegalGhana Gambia, The Niger
South AfricaGuinea
Burkina FasoTanzania
Côte d'Ivoire malimauritius
São Tomé and Príncipe
Cabo Verde
–6
–5
–4
–3
–2
–1
0
1
2
3
Early
-gra
de "b
ulge
inde
x"

O V E R V I E W 25
Rwandan teachers attend and put forth significant effort, yet this effort is under-mined by skills and pedagogy . Crucially, many teachers have limited command of the language of instruction: a recent assessment found that less than half of teachers are at the “intermediate level” in English . A lack of pro-ficiency in the language of instruction inevi-tably affects student performance not only in English reading, writing, and speaking ability but also in all other subjects that are taught in English, including math, science, and social studies . The government has invested exten-sively in teacher language training, but more intensive efforts are needed to bring teachers the rest of the way to fluency in the language of instruction .
Currently, relatively few Rwandans com-plete tertiary education, although enrollment rates are rising rapidly . The latest numbers (2015) suggest that just 8 percent of tertiary-age youth are enrolled in tertiary education, well below the level in middle-income coun-tries . Furthermore, even with rising tertiary enrollments—and those enrollments have doubled in the last 10 years—shifting the proportion of the population with tertiary education in the workforce takes significant time, because only a small proportion of the workforce changes with each graduating cohort (figure O .19) . Moreover, relatively few graduates are specializing in key job creation fields, such as science and engineering . Just 6 percent of university students in Rwanda are enrolled in engineering, manufactur-ing, and construction; and only 9 percent are studying sciences . If Rwanda intends to grow its manufacturing and technology sectors, then the number of students in sci-ences and engineering clearly also needs to grow . Even though historically Rwanda has invested more in higher education than other countries in the region, public financing of higher education has declined recently, even as demand for higher education continues to grow . Financing for innovation in Rwanda also remains very low, most recently esti-mated at 0 .4 percent of GDP (Lemarchand and Tash 2015), which is a tenth of the share in countries like Korea and Singapore .
RecommendationsRwanda faces an array of needs with regard to human capital investment and needs to expand investment at all levels of human capi-tal formation . Each human capital investment builds on previous ones . Therefore, invest-ments yielding returns that are realized more quickly need to be balanced with investments in younger generations . For example, the returns from investments in tertiary education and skills training are realized most imme-diately . However, their continued expansion is dependent on an increased flow of well- educated individuals from earlier levels, and their returns are complemented by a popula-tion with broad literacy and numeracy .
Government should consider two prin-ciples in setting investment priorities to
FIGURE O.19 Projected share of Rwanda’s workforce with tertiary education under two growth scenarios, 2010–50
Source: Construction based on data from Lutz, Butz, and KC 2014. Note: Panel a is based on the current rate of growth of enrollment in Rwanda. Panel b is based on the rate of growth of enrollment in the Republic of Korea and Singapore.
0
20
40
60
80
100
Perc
ent
Perc
ent
a. General education trend scenario (business as usual)
0
20
40
60
80
100
2010 2015 2020 2025 2030 2035 2040 2045 2050
2010 2015 2020 2025 2030 2035 2040 2045 2050
b. Fast-track scenario (at the pace of theRepublic of korea and Singapore)
No educationSome or all primary
Some or all secondarySome or all tertiary

26 F U T U R E D R I V E R S O F G R O W T H I N R W A N D A
maximize the impact on growth . First, it is necessary to identify the “binding con-straints”: Which problems are so severe that, unless they are solved first, no amount of money or time spent solving the less severe problems will help? Second, it is necessary to identify the investment required in activi-ties that yield economic growth both now and later . Complementary investments, such as safety nets, can help households to make investments that will contribute to inclusive growth .
A holistic approach is needed, with special emphasis on the following areas .
Drastically Lower the High Rates of Stunting . Reducing Rwanda’s stunting rate requires multiple coordinated interventions, and incentives are key . Currently, many pro-grams to address these incentives in Rwanda suffer from limited coverage and inconsis-tent financing from a patchwork of donors . A big push is needed to improve food secu-rity and nutritional practices and to increase access to clean water and good sanitation . Careful monitoring systems are required to evaluate which policies deliver the greatest gains . The good news is that high rates of stunting are not inevitable . Many countries (including Peru and Senegal) have made dra-matic gains, with political will, civil soci-ety cooperation, media campaigns, robust monitoring, adequate resources, and a multi-pronged approach seen as key to their success .
Expand Access to Basic Education . In Rwanda, expanding access first means reduc-ing costs and improving perceived benefits . Countries that have achieved widespread basic literacy have offered free primary education . Achieving universal primary edu-cation requires ensuring that children are not turned away for failure to pay incidental fees, which may require increasing the per student benefit paid to schools and reducing repetition in early grades so that children do not become too old for their grade . It is also important to provide information on the financial returns to schooling because such information has
been demonstrated to increase parent and stu-dent investment in education and to improve the quality of education .
Improve the Quality of Education . Improving the quality of teachers is essential . Teachers in Rwanda generally attend school and teach, which is itself a great challenge in many coun-tries . But primary school teachers need to be trained in improved pedagogies so that chil-dren in the first three years get a firm grasp on literacy before transitioning to English . There is good evidence on effective programs to teach literacy in the early years, including partially scripted lessons and ongoing coaching of teach-ers . Because these improvements take time, transitioning to English later (for example, at the end of primary) may also be valuable . Many teachers in the upper grades of primary and in secondary have a limited grasp of the language of instruction: a recent assessment showed that only 43 percent of teachers have the “intermediate level” in English . Rwanda could consider leveraging its major investment in laptops in schools to provide teachers with regular opportunities to improve their English . Technology could also be applied to increase students’ learning performance .17 Rwanda also could consider recruiting English-speaking expatriates to remedy the immediate shortage of teachers and, for the longer run, to train a core group of high-quality Rwandan teachers .
Strengthen the Provision of Technical and Vocational Training . Collection and dissemination of information on the quality of skills providers and the returns to differ-ent skills would encourage youth to partici-pate in sectors with high returns and help to improve the quality of skills training pro-grams . Many high-growth countries, includ-ing Korea, Malaysia, and Singapore, used an activist approach to skills development by setting a strategic direction, tone, and culture for efforts to improve workforce skills; creat-ing an organizational infrastructure with the appropriate governance design; and fostering efficient and effective management of service delivery by providers .

O V E R V I E W 27
Develop a Quality Tertiary Education System Focused on High-Return Activities . Rwanda has taken dramatic steps to improve the quality of tertiary edu-cation in recent years, consolidating public universities into the University of Rwanda for better governance . Increasing access to financing, including loosening restrictions on private financing, would help to expand enrollment . Rwanda also needs to focus its tertiary education system on key areas of investment: more science and engineering . Strategies used in high-income countries to encourage university students to enter high-return fields—including financing incentives (as in Argentina and Australia) and improv-ing the quality of science and engineering instruction in earlier grades (as in Norway and Poland)—could be considered .
Foster Innovation . The tertiary education sector is an ideal space to foster innovation in Rwanda . Publications and patents in Rwanda have been rising, although from a very low base . Likewise, Rwanda has invested in a range of graduate and postgraduate centers for technical training, including Carnegie Mellon University and the various centers of excellence . Creating incentives for researchers to develop and adapt innovations that benefit industries in Rwanda can help Rwanda to reap the maximum returns to local innovation . A practical way to do this follows the model common in high-income countries, where pri-vate firms finance university research to solve production challenges . Given the nascent pri-vate sector, the government will have to con-tinue to play a supporting role .
Allocate More Resources to Human Capital Development . The amount that success-ful countries spend on health and education varies, and financing is far from the only fac-tor in successful human capital investment . Governance of the sectors arguably matters far more and is a strength in Rwanda . It is impossible to imagine achieving universal primary education and a significant increase in secondary education without expanding
the amount of resources devoted to educa-tion over time .
Provide Better Information on Out-comes . Rwanda is an innovator in holding ser-vice providers accountable, with performance contracts for educators and health workers, along with innovations in performance-based pay (Basinga et al . 2011; Zeitlin et al . 2017) . In many countries, service provision has improved because of the effective involve-ment of parents, pointing to the importance of dissemination of information on learn-ing outcomes and other elements of school performance . More regular measurement of learning outcomes and stunting reduction would allow the government to evaluate the effectiveness of different interventions and to accelerate progress on both aims .
Transformation through Trade: Using Exports and Regional Integration to Drive Future Growth
IntroductionTo achieve its aspiration of becoming a high-income country by 2050, Rwanda needs to accelerate the growth of trade . Inflows of development assistance have financed a large share of investment and powered GDP growth in the past two decades, but they are likely to attenuate in the coming two decades as Rwanda progresses toward middle-income status . Trade will become an increasingly important driver of growth . Exports will provide foreign exchange to purchase much-needed investment in equip-ment, high- technology goods, intermedi-ate components, and product varieties and will foster productivity by allowing firms to exploit increasingly large economies of scale . Increased import capacity will facilitate access to high- technology goods and foster competition that drives productivity . Trade expansion also implies the need to attract FDI, because multinational companies bring in managerial, technical, and design skills while their networks facilitate access to new export markets (Freund and Moran 2017) .

28 F U T U R E D R I V E R S O F G R O W T H I N R W A N D A
Trade expansion is central to creat-ing new, higher-productivity jobs that faci l itate growth through structural transformation . Moving labor from low-productivity jobs mainly in agriculture to higher-productivity jobs in a range of mostly urban activities is imperative for growth . East Asia made this transition to high growth by relying on labor-intensive manufacturing for export . Rwanda, as with much of Africa, requires not only labor-intensive manufacturing but also agribusiness, horticulture, and selected services—what some have called “indus-tries without smokestacks” (Newfarmer, Page, and Tarp, forthcoming) . These activities, taken together, hold the prom-ise of doing for Rwanda what manufactur-ing did for East Asia in the 1990s . They are labor intensive and tradable, and they have high value added per worker . As in traditional manufacturing, technologi-cal change is rapid and can spawn rapid productivity growth . In a world of recent technological revolutions in ICT, manufac-turing techniques, and global value chains, Rwanda has an opportunity to leverage greater integration into regional and global
markets and to propel structural transfor-mation and growth (Hallward-Driemeier and Nayyar 2017) .
Challenges and OpportunitiesOn the basis of a comparison with countries experiencing high rates of economic growth, Rwanda’s exports as a share of GDP have to increase significantly for Rwanda to achieve its income objectives for 2050 . A review of global experience shows a large spread of exports-to-GDP ratios as countries achieve upper-middle-income status, but that ratio tends to be upward of 40 percent (figure O .20) . Since 2000, Rwanda has consistently increased its share of exports in national income, but the share is still far below the average for upper-middle-income countries . Rwanda needs to have double-digit year-on-year export growth every year up to 2035 if it is to cross the 40 percent threshold . Meeting such a target is difficult but not impossible, given that the share of exports in national income is still low relative to that of other countries with com-parable levels of per capita income . Therefore, significant export opportunities are avail-able to Rwanda, and exports still have ample room to grow .
Rwanda has begun laying the foundations for an export push . Over the last decade, exports have grown about 20 percent annu-ally, and the export portfolio has become more diversified, with the share of coffee, tea, and minerals falling from 41 percent in 2005 to 25 percent in 2015 . New activities, particularly services exports, have surged in importance . Tourism alone now accounts for 23 percent of export earnings, and services account for about half . New exports of goods are also becoming important, especially exports to regional markets . In 2014, the EAC accounted for 41 percent of manufac-turing exports, 66 percent of leather goods, and 53 percent of horticultural products sold abroad . Non-EAC neighboring mar-kets have also become important . Exports to the Democratic Republic of Congo have increased considerably in the last decade: by 2016, Rwanda exported more goods to the Democratic Republic of Congo than to
FIGURE O.20 Exports as a share of GDP and log GDP per capita in Rwanda, 2000–16
Source: Calculations based on Comtrade data (United Nations, various years).
0
25
50
75
100
125
Expo
rts o
f goo
ds a
nd se
rvic
es (%
of G
DP)
4 6 8 10 12
Log GDP per capita
Upper-middle-incomecountries
Rwanda, 2000
Rwanda, 2007 Rwanda, 2016

O V E R V I E W 29
the EAC .18 Rwanda has also attracted more FDI of late, which is contributing to export performance .
That said, Rwanda still exports below the average of other countries at its per capita income . Whereas exports in agro-processing have been dynamic, exports in other manufacturing areas have been disap-pointing, declining from 8 percent of total exports (2012–14) to 5 percent in 2016 . This decline is largely due to reductions in some of the higher-skill export prod-ucts such as machinery, mechanical appli-ances, and electrical equipment . Further, Rwanda’s exports remain concentrated in a small number of firms . Over 2009–16, the top 1 percent of exporters accounted for more than 40 percent of the total value of exports (while the top 5 percent accounted for 80 percent) . Exporter survival rates are also low . Export performance continues to suffer from low labor productivity in key backbone services such as transport and ICT and low levels of private investment in tradable sectors .
An important challenge is that the ben-efits to trade from regional integration in the EAC have been limited so far . By remov-ing internal tariff and nontariff barriers, regional integration is expected to result in trade creation . Yet a comparison of intra-regional imports as a share of GDP before and after joining the EAC shows that this effect has been limited (figure O .21) . After a small increase in the first five years, the EAC’s intra-bloc imports of goods as a share of GDP fell to a level below initial integra-tion 10 years after membership . In contrast, other regional bodies experienced a consid-erable increase in intra-bloc trade . After 10 years of regional integration, the Southern African Development Community (SADC) saw a tripling of intra-bloc imports, while the Association of Southeast Asian Nations doubled intra-bloc imports to almost 16 per-cent of GDP .
Trade connectivity and high trans-port costs pose a constraint for Rwanda . The single most important determinant of long-run trade growth, in fact, is the cost of
getting goods to market and getting inputs to local producers . Rwanda is a land-locked country, which means that trans-port costs typically add some 50 percent to the cost of exporting products and import-ing inputs . Because more than 90 percent of goods exports are transported by truck, Rwanda relies heavily on the land trans-port corridors of other countries for access to the sea . Almost all of its trade in global markets goes through two East African trade corridors: the Northern Corridor (Mombasa) and the Central Corridor (Dar es Salaam) . The lack of facilitation at the border, fragmentation of the supply chain, and limited access to affordable air cargo opportunities also contribute to the high cost of trading .
RecommendationsMeeting Rwanda’s export objectives requires a comprehensive trade policy that spans ser-vices, industry, and agriculture . Analysis from this report suggests that no one sector can drive the necessary export and employ-ment growth on its own . Rwanda should look to produce high-quality products for the region (especially in agribusiness and food
FIGURE O.21 Intra-bloc goods imports as a share of GDP before and after joining the bloc
Source: Shepherd, de Melo, and Sen 2017.Note: EAC = East African Community; SADC = Southern African Development Community; ASEAN = Association of Southeast Asian Nations.
2.23.0
2.0 2.1
5.1
6.5
8.7
13.2
15.8
18
8
4
0
12
14
16
6
10
2
Shar
e of
GD
P (%
)2 years before 5 years after 10 years after
EAC SADC ASEAN

30 F U T U R E D R I V E R S O F G R O W T H I N R W A N D A
processing) and to develop other sectors that are similarly tradable and productive, but less dependent on location (such as horticulture, tourism, professional services, and ICT) . The government thus has to build further on the service sector (the largest current source of exports), strongly accelerate industrial growth, and expand into other high-value agricultural exports (such as horticulture) .
Six major policy priorities should figure prominently in a comprehensive reform pro-gram that uses trade to accelerate and sustain growth .
Harness the Regional Blocs as Platforms for Transformation . The region offers a crucial learning ground for exporting higher-quality products, especially in man-ufacturing and agroprocessing . Entering regional supply chains can help to prepare Rwandan firms to enter the global market . The region can also be used to stimulate within-sector productivity growth and to develop other tradable sectors such as tour-ism, transport, and professional services through greater regional scale economies and greater competition from leading firms . A key focus should be on revising and low-ering the common external tariff within the EAC to benefit Rwandan producers and exporters that use imported inputs and poor consumers who disproportionately consume heavily taxed imports . The inte-grated market can also be extended by pro-moting harmonized standards in goods and services and by reducing nontariff barriers . For key sectors such as energy and finance, the EAC should develop regional supply chains that can result in economies of scale . Intra-industry regional trade competition can force firms to larger scale and drive out less productive firms . Finally, Rwanda could advocate for a stronger EAC secre-tariat that can review and discuss potential violations of common market protocols . The recently agreed African Continental Free Trade Area, a pan-African initiative to liberalize continental trade, can also be advantageous, once details are penned and implementation modalities agreed to .
Monitor the Exchange Rate Closely to Maintain Export Competitiveness . Export drives in other countries have been sus-tained by maintaining a competitive real exchange rate over a long period . Similar benefits may be on offer for Rwanda, but greater flexibility and close monitoring of exchange rates are needed to ensure that the real exchange rate remains in line with fundamentals and that episodes of over-valuation are avoided, especially in regional markets where manufactured goods and new products predominate . A first step is to undertake more analytical work on the link between exchange rates and export growth,19 particularly as it affects poten-tially dynamic export sectors . Because imports consume capital inflows for for-eign exchange payments, it is advisable for the government to focus on export growth rather than on the trade deficit as a macro-economic objective .
Invest in Economic Diplomacy . The complex issues under consideration in trade negotia-tions require more investment in staff knowl-edge and expertise to usefully engage in and undertake negotiations, especially in highly specialized sectors .
Improve Trade Connectivity by Lowering Transport Costs . Intensive collaboration along Rwanda’s two trade corridors has already lowered costs and increased exports, but costs can decline even more . Lowering regional road tolls and ensuring their uniform application across all EAC vehicles is one avenue . Reviewing tax policy to ensure that truckers from all countries compete on a level playing field is another . Developing Rwanda as a regional logistics hub by attracting pio-neer foreign firms in logistics would further lower transport costs and strengthen nascent services exports . RwandAir has provided the basis for expanding air connectivity, and its efforts have reduced the cost of air cargo . More can be done here, in part by aggressively pursuing open skies arrangements within the EAC and SADC . Rail connectivity also could become important eventually; a long- standing

O V E R V I E W 31
ambition to build a railway along the two trade corridors continues to hold promise for reducing freight costs .
Increase Service Sector Productivity . Lower policy barriers to services competition and stronger services trade within the region would enhance competitiveness across the EAC . Rwanda should look to broaden value added tax exemptions on services exports by aligning itself with leading African coun-tries such as Mauritius and South Africa . Rwanda would benefit from elevating tour-ism promotion in a separate, high-visibility strategy that seeks to expand leisure tourism beyond gorillas and to convince tourists to spend more time in Rwanda . In the decades ahead, Rwanda is strategically positioned to take advantage of exports in mining, educa-tion, and business services . Realizing these opportunities requires seeking out foreign firms and facilitating near-term services trade for EAC and SADC professionals, which can be strengthened by extending mutual recognition agreements beyond architec-ture, accounting, and engineering to include, for example, legal, finance, and consulting services . Abolishing limits in work-permit regimes for all eligible professionals is also critical and would help to facilitate services trade for short-term assignments . However, stimulating services exports requires con-siderable investment in addressing Rwanda’s skills deficit .
Attract Private (Foreign and Domestic) Investment into Tradable Sectors . More pri-vate investment is needed in tradable sectors . Building on its investor promotion activities, the government could track firm performance and tailor specific incentives to priority sectors . To improve Rwanda’s export compet-itiveness and compensate for relatively high transport costs, the government could offer additional, integrated assistance across min-istries (for example, by linking the Rwanda Development Board’s investment promotion with the Rwanda Revenue Authority’s abil-ity to exempt import tariffs and the Rwanda Standards Board’s support for standards
upgrading and certification) . The solid results in the special economic zone offer a model that could be extended to the whole produc-tive sector . Upgrading the product quality of domestic firms through a designated sup-plier development program would offer great potential by enabling domestic firms to sup-ply large international firms, which could facilitate integration within global value chains . Such a program also would provide an opportunity for strengthening regional manufacturing exports .
Faster Urbanization, Greater Agglomeration
IntroductionFew countries have attained upper-middle-income status without substantial urbaniza-tion . Urbanization is the spatial corollary of structural transformation that involves the movement of workers from less to more productive sectors—typically from farm-ing to off-farm sectors in the early stages of development . Urbanization has the potential to generate enormous benefits by increas-ing economic density, which, when man-aged well, facilitates the transmission of knowledge and ideas, increases economies of scale and opportunities for specialization, and improves firms’ access to both critical services and a large pool of labor with a wide variety of skills . Cities are also instru-mental in matching skilled people with jobs that value those skills . The presence of these agglomeration economies means that the more workers and firms are added to an urban location, the higher their indi-vidual productivity becomes . International evidence suggests that a 1 percentage point increase in the urban population is associ-ated with a 3–8 percent increase in a coun-try’s per capita income .
The close association between urban-ization and economic development is seen most vividly in the high-growth economies of East Asia . These economies have had intense spatial concentration of economic activity, typically in locations well con-nected to domestic and external markets .

32 F U T U R E D R I V E R S O F G R O W T H I N R W A N D A
Consider the “flat” development trajec-tories of China, Korea, Thailand, and Vietnam in figure O .22, panel a . The flat slopes reflect the fact that their urban-ization has been accompanied by sharp increases in per capita income . However, in an unsupportive policy environment, urbanization can just as easily be discon-nected from economic transformation; many countries in Sub-Saharan Africa have urbanized even more rapidly than their East Asian counterparts, but with minimal or negative growth of GDP per capita (figure O .22, panel b) .
Rwanda is on a path to rapid urban-ization and needs to manage the process well to harness the urban agglomeration economies that are essential for future high growth . The country’s urban population has more than doubled since 2002, and Kigali has been one of the fastest- growing African cit ies . This report’s analysis shows that urbanization has accounted for 37 percent of national structural change in
Rwanda, and urban areas have accounted for 48 percent of national labor productiv-ity growth over the past 15 years . However, urban areas in Rwanda—and Kigali in par-ticular—have not generated the kind of productivity gains and agglomeration econ-omies that rapidly growing cities in success-ful East Asian economies have achieved . The pace of rural-to-urban migration also has been relatively muted,20 which has lim-ited the potential benefits of urbanization .
Institutional, regulatory, and infra-structural reforms are needed along three dimensions—spatial, sectoral, and institutional—and should be supported by even faster rural-urban migration and deeper economic specialization . The nature of agglomeration economies, however, dif-fers by the function of different urban settle-ments . Rwanda’s small towns, secondary cities, and Kigali should perform comple-mentary functions, differentiated by the type of scale and agglomeration economy they can deliver .
FIGURE O.22 Changes in urbanization and income in East Asia and Pacific and in Sub-Saharan Africa, 1985–2010
Sources: Based on World Development Indicators data (World Bank, various years); Economist 2012. Note: Bottom of arrow = 1985; top of arrow = 2010.
% o
f pop
ulat
ion,
urb
an
% o
f pop
ulat
ion,
urb
an
Korea, Rep.Gambia, The
Cameroon
Zimbabwe
Benin
Mauritania
Nigeria
Madagascar
Guinea-Bissau
Congo,Dem. Rep.
Togo
GDP per capita (constant 2005 international $)GDP per capita (constant 2005 international $)
80
a. East Asia and Pacic b. Sub-Saharan Africa
70
60
60
40
20
50
40
30
20
10
200 2,000 20,000 300 600 1,200
Malaysia
Fiji
Mongolia
ChinaIndonesia
Lao PDR
Thailand
Vietnam

O V E R V I E W 33
Challenges and OpportunitiesTo achieve the rapid economic growth targeted until 2050, Rwanda needs to have an efficient portfolio of urban locations . With its relatively small population, Rwanda requires one espe-cially strong urban economic powerhouse—of the sort that Seoul was for Korea or Tokyo for Japan . Kigali has that potential . To fulfill its urbanization potential, Rwanda also needs to have a portfolio of complementary secondary cities and small towns .
However, although Kigali has seen rapid urbanization and strong urban infrastruc-ture investments, its urban fabric remains fragmented by small-scale, patchy land devel-opment . Kigali needs to operate more like an effective, integrated labor and product market, which would increase its potential for realizing agglomeration economies and reduce the costs of private inputs and public infrastructure . As regards the secondary cit-ies and small towns, Rwanda should be ready to support the emerging economic activities in those locations . There is great uncertainty concerning what kinds of economic activities will settle in which locations . All urban loca-tions are showing similar trends, manifested in fragmented spatial development, poor transport connectivity, and weak fiscal handles .
Urban fragmentation in Rwanda is driven by institutional and infrastructural con-straints . Inefficiencies in land use management are exacerbated by the ineffective imple-mentation of master plans and urban design documents with targets for densities, building structures, and land uses that do not match current market demand . Rwanda essentially has been managing cities by regulating the type and intensity of private development by location—epitomized by the zoning of struc-tural characteristics and building uses . Such mismatches, not uncommon in low- and middle-income countries, are particularly serious in Rwanda, because master plans are updated only irregularly . A lack of local plan-ning capacity and inconsistent application of regulations exacerbate the problem .
Rural and urban connectivity is another key challenge . A third of Rwanda’s poor live
within 20 kilometers of a secondary city, yet the locational advantages are undetectable more than 5 kilometers from the city center . Half of the rural population lacks access to a road network in good condition within a 2-kilometer walking distance . Better rural-urban transport links around secondary cities would improve both their access to inputs and their impact on surrounding areas . Stronger rural-urban transport links also would enhance the benefits of growing urbanization along Rwanda’s major transport routes, most notably along the Rubavu-Nyabihu-Musanze corridor, but also along corridors running south from Kigali to Burundi and the newly developed Kivu shoreline .
Outside of Kigali, own-source revenue mobilization is low—estimated at 10 percent of district budgets in 2013–14 . Districts rely on central revenues and do not capture many of the gains from their investments . This reliance reduces both district resources for investment and the incentives to identify and prioritize investments where they are most likely to unlock growth .
RecommendationsKigali has a crucial role to play in Rwanda’s future development, because “urbaniza-tion” economies—especially those involv-ing knowledge spillovers—are generated mainly by large cities . Market forces—reflected by the location decisions of people and businesses—have chosen Kigali . Durable investments in infrastructure, housing, and other amenities are needed to ensure that the city is productive and livable . However, Rwanda’s small towns, secondary cities, and Kigali should be performing complementary functions, each differentiated by the type of scale and agglomeration economy they can deliver . These complementary urban locations do not have to be huge to generate agglom-eration benefits . The size of settlements mat-ters less than their function: with reasonable transport costs, towns can be large enough to facilitate internal scale economies . Medium-size cities are often large enough for “local-ization” economies that come from thick input markets . The implication is that policy

34 F U T U R E D R I V E R S O F G R O W T H I N R W A N D A
makers should focus on the functions of dif-ferent types of cities and support agglomera-tion though economic density .
As a general principle, policy makers should look to deliver a basic standard of ser-vices to all people, while letting markets pick the pace and form of private sector devel-opment by location . This principle is exem-plified by Korea, which allowed the dense concentration of economic activity in Seoul, while delivering basic services like education, health care, and clean water evenly across the population . Investments in human capital are especially “safe” bets, because human capi-tal is a portable asset that can have powerful effects on people’s welfare and mobility .
Getting on the path to faster urbaniza-tion and greater agglomeration will involve reshaping regulatory policy, prioritizing investments, and strengthening institutions along three dimensions: spatial, sectoral, and institutional . On spatial reforms, a more bull-ish view is needed to unleash the economic potential of Kigali, which market forces have chosen as the main center of production and commerce . On sectoral reforms to enhance the efficiency of capital investment in infra-structure, housing, and commercial struc-tures, there is an urgent need to strengthen land markets . On institutional reforms, stronger intergovernmental coordination of economic and spatial planning processes is needed .
Reshape Regulatory Policy . The main priority is to strengthen land markets so that private developers have the appropri-ate incentives to increase density . Rwanda should explore moving from the quantity-based regulation of land use, epitomized by highly prescriptive zoning requirements for structures, to price-based allocation . Land prices, which reflect the demand for and scarcity of locations, should become the basis for allocating private investments across space and for allowing structures to serve the evolving economy . Regulations on structures should be used to mitigate nega-tive externalities like environmental degra-dation and structural safety .
Prioritize Investments . Another priority is to provide efficient, affordable, and integrated public transport and to boost investment in roads . Public transit routes to Kigali’s center are congested and likely to become more so . To limit sprawl, excellent central public trans-port should be combined with quality pub-lic transport to a small number of strategic peripheral locations . Grids should be provided (in Kigali and in secondary cities) to ensure that rapid peripheral development takes place in a planned way . Greater investment in roads also is necessary to improve the integration of Rwanda’s cities with the countryside and with neighboring countries and to strengthen connections between urban centers .
Kigali’s growth needs to be accompanied by a more calibrated approach toward devel-oping a complementary set of secondary cit-ies and small towns . Potential investments in other settlements should be divided into those that can be made at low risk before market demand has emerged versus those that are better suited after it has emerged . Here, choices need to be made between investments in place-specific durable assets (such as infrastructure, industrial complexes, and housing) and people-focused portable assets (such as health, education, and water and sanitation) . International experience shows that such investments should center on increasing external connectivity . Stronger connectivity, however, does not guarantee the greater development of secondary cities and other towns versus Kigali . Connectivity and specialization may well entail greater concentration of activities in Kigali .
The government has pursued a policy of grouped villages (imidugudu) . The program provides rural-urban links by preparing future urban dwellers for urban life while they are in rural areas, and aims to preserve agricultural land . Improvement in the plan-ning and establishment of settlements is needed to ensure that they serve the intended purpose while minimizing huge infrastruc-ture costs and potential future financial losses . Prioritization of rural-urban connec-tivity and better anticipation of migration to larger urban areas are needed to address

O V E R V I E W 35
underlying concerns . This effort can be complemented with “off-grid” rural infra-structure (for example, maintenance of rural roads and bridges) that delivers key services while placing smaller “bets” on the long-run vocation of the location .
Strengthen Institutions . Faster urbanization and greater agglomeration require stronger institutions . Urban planning capabilities at the city and district levels need to be con-siderably stronger . Plans should respond to markets and community needs, while safe-guarding against capture by special interests through strong public oversight and engage-ment . Further, broad institutional and gov-ernance reforms such as clarification of land and property rights set the foundations for urbanization and urban development .
Rationalization of planning activities is needed to foster institutional coordina-tion . To accomplish this, economic planners should start to think spatially, and spatial planners should become more aligned with economic planning and goals .
Further, economically connected districts have to be encouraged and required to coor-dinate land use plans, transport and service provision, major infrastructure like special economic zones, tourism infrastructure, and so on to exploit complementarities .
Finally, stronger institutions are needed to value land, to disseminate land values pub-licly across uses, and to assign and protect property rights . Rwanda has a strong basis for efficient and transparent valuation, with centralized and digitized landownership and transaction records, a professional valuation body, and credible institutions for oversight . Credible land valuation would enable urban areas to fiscalize public investments in land through land value capture .
Competitiveness and Enterprise Development for Innovation-Led Growth
IntroductionEmergence of a vibrant, competitive, and innovation-driven enterprise sector—both
private and public firms—that responds with agility to emerging domestic, regional, and global opportunities is essential for future growth . As Rwanda’s economy develops and matures, the need for the pri-vate sector to play a leading role in achiev-ing the rapid growth required to reach Rwanda’s ambitious income aspirations only increases . Private enterprises create jobs and generate income, drive economic transformation, compete in global export markets, and, ultimately, drive aggre-gate productivity growth and innovation . Moreover, the private sector has to provide much of the huge investment needed to sup-port future growth ambitions .
Rwanda needs to strengthen the com-petitiveness of the private sector as it under-takes necessary infrastructural investments . To support the development of viable enter-prises, the government has continued the strong track record of reforms initiated after the genocide against the Tutsi, as evi-denced, for example, in Rwanda’s rapidly improved ranking in the Ease of Doing Business Index, which now need to be fol-lowed through with the reform measures described below .
The state has an equally important, but complementary, role to play in correcting market failures and defining its role in pri-vate investment—by implementing well-targeted public investments, strengthening bureaucratic capacity, withdrawing gradu-ally from productive activity while enhancing its regulatory and facilitation functions, and developing capable and accountable market institutions . Public investments will remain important for several years to come, given the vast infrastructural and social needs of the country; that said, with growing financ-ing needs under the National Strategy for Transformation and tightening limits on public borrowing, the relative share of pub-lic investment will decline over time as the private sector share increases . SOEs will also remain crucial for several years to come, because the private sector needs time to build .
The reform agenda to boost the competi-tiveness and innovativeness of the enterprise

36 F U T U R E D R I V E R S O F G R O W T H I N R W A N D A
sector is comprehensive and demanding, reflecting Rwanda’s strong ambitions for future growth .
Challenges and OpportunitiesThe enterprise sector in Rwanda, in its current form, remains relatively small, young, and concentrated in the nontradable sector . Private sector firms are small (figure O .23); they lack the scale economies critical for competitiveness and have limited export pres-ence . Moreover, as in other low-income coun-tries, informality is prevalent .
The limited presence of formal enter-prises reflects high cross-cutting costs, lower productivity than what is needed to sustain rapid economic growth, and low capacity for innovation .
Price levels and thus input costs are high in Rwanda, which constrains the competi-tiveness of its enterprises . Low- and middle-income economies tend to have lower price levels than high-income economies because of the lower costs of nontradable goods and ser-vices (the prices of tradable goods tend to be similar across all countries) . This divergence in prices tends to close as countries’ income levels rise . Rwanda’s relative prices have fol-lowed such patterns, but at more elevated lev-els compared with other economies at similar
stages of development . The contrast is espe-cially stark when compared with the relative price trajectories of the Asian high-growth economies whose long-term performance Rwanda aspires to surpass . It was only when these economies reached income per capita of more than US$5,000 (2010 U .S . dollars, purchasing power parity) that the ratio of their price levels to those of the United States exceeded Rwanda’s current ratio .
Low returns (real and perceived) also con-tribute to the slow uptake in private sector activity . Rwanda’s labor productivity (output per worker) is low by international standards, explained by negative or weak growth in within-sector labor productivity across most sectors . Moreover, Rwanda’s TFP levels (out-put generated by a given quantity of labor and capital) are low for its income, and the rate of TFP growth has slowed significantly in recent years, further widening the gap with other countries .
What explains Rwanda’s weak TFP performance? A country’s TFP has two key determinants . The first is the alloca-tive efficiency of its resources (land, labor, capital)—that is, the extent to which these public and private resources get channeled to their most productive use . The second is the pace of technological innovation in the economy—that is, the pace at which the frontiers of technology and good business practices expand . The significance of tech-nological innovation will gather pace as the Rwandan economy moves toward middle-income status and beyond, becoming an increasingly pressing subject of reform for future growth .
Resource misallocation refers to ineffi-cient enterprises commanding more resources (land, labor, capital) than warranted by their productivity levels . Analysis of Rwanda’s manufacturing sector suggests that TFP in Rwanda’s manufacturing sector could be dou-bled if resource misallocations were reduced drastically (figure O .24) . The scope for improving productivity through this channel is likely even larger in other sectors .21
Some of the underlying causes for mis-allocation are straightforward, rooted in
FIGURE O.23 Share of firms in Rwanda, by firm size, 2011 and 2014
Sources: Calculations based on 2011 and 2014 Rwanda Census of Business Establishments data (NISR 2011, 2015).
Shar
e of
rm
s (%
)
Firm size (number of employees)
2011 2014
20
0
40
60
70
80
10
50
30
1 2–4 5–9 10–19 20–99 100+
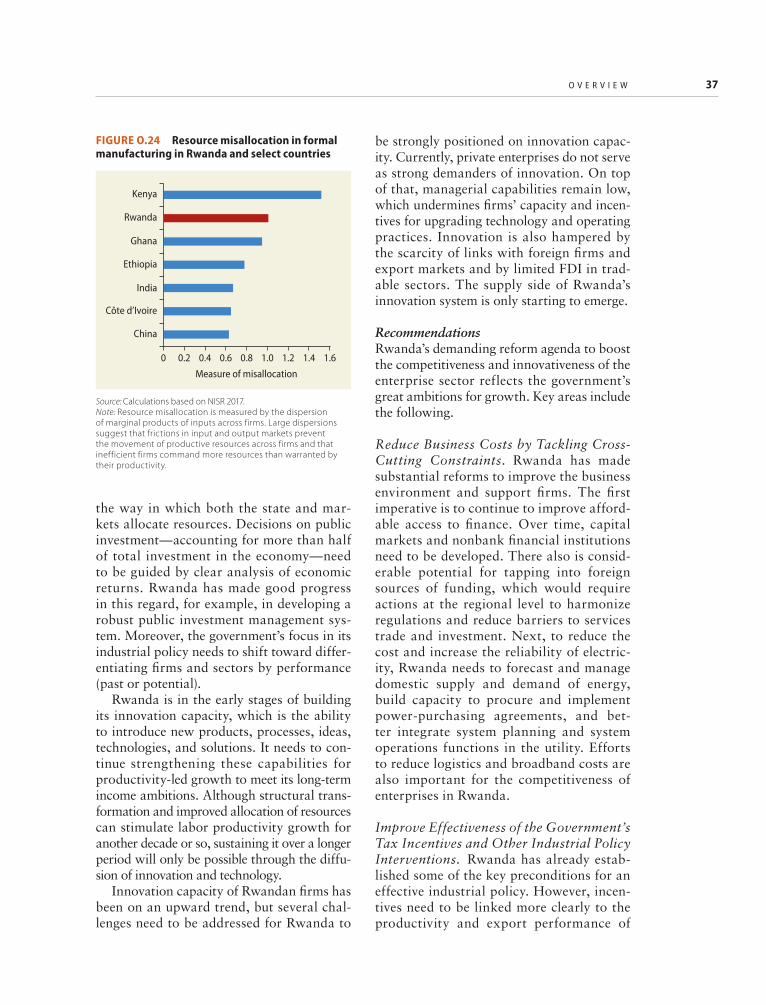
O V E R V I E W 37
the way in which both the state and mar-kets allocate resources . Decisions on public investment—accounting for more than half of total investment in the economy—need to be guided by clear analysis of economic returns . Rwanda has made good progress in this regard, for example, in developing a robust public investment management sys-tem . Moreover, the government’s focus in its industrial policy needs to shift toward differ-entiating firms and sectors by performance (past or potential) .
Rwanda is in the early stages of building its innovation capacity, which is the ability to introduce new products, processes, ideas, technologies, and solutions . It needs to con-tinue strengthening these capabilities for productivity- led growth to meet its long-term income ambitions . Although structural trans-formation and improved allocation of resources can stimulate labor productivity growth for another decade or so, sustaining it over a longer period will only be possible through the diffu-sion of innovation and technology .
Innovation capacity of Rwandan firms has been on an upward trend, but several chal-lenges need to be addressed for Rwanda to
be strongly positioned on innovation capac-ity . Currently, private enterprises do not serve as strong demanders of innovation . On top of that, managerial capabilities remain low, which undermines firms’ capacity and incen-tives for upgrading technology and operating practices . Innovation is also hampered by the scarcity of links with foreign firms and export markets and by limited FDI in trad-able sectors . The supply side of Rwanda’s innovation system is only starting to emerge .
RecommendationsRwanda’s demanding reform agenda to boost the competitiveness and innovativeness of the enterprise sector reflects the government’s great ambitions for growth . Key areas include the following .
Reduce Business Costs by Tackling Cross-Cutting Constraints . Rwanda has made substantial reforms to improve the business environment and support firms . The first imperative is to continue to improve afford-able access to finance . Over time, capital markets and nonbank financial institutions need to be developed . There also is consid-erable potential for tapping into foreign sources of funding, which would require actions at the regional level to harmonize regulations and reduce barriers to services trade and investment . Next, to reduce the cost and increase the reliability of electric-ity, Rwanda needs to forecast and manage domestic supply and demand of energy, build capacity to procure and implement power-purchasing agreements, and bet-ter integrate system planning and system operations functions in the utility . Efforts to reduce logistics and broadband costs are also important for the competitiveness of enterprises in Rwanda .
Improve Effectiveness of the Government’s Tax Incentives and Other Industrial Policy Interventions . Rwanda has already estab-lished some of the key preconditions for an effective industrial policy . However, incen-tives need to be linked more clearly to the productivity and export performance of
FIGURE O.24 Resource misallocation in formal manufacturing in Rwanda and select countries
Source: Calculations based on NISR 2017. Note: Resource misallocation is measured by the dispersion of marginal products of inputs across firms. Large dispersions suggest that frictions in input and output markets prevent the movement of productive resources across firms and that inefficient firms command more resources than warranted by their productivity.
0 0.2 0.4 0.6 0.8 1.0 1.2 1.4 1.6
China
Côte d’Ivoire
India
Ethiopia
Ghana
Rwanda
Kenya
Measure of misallocation

38 F U T U R E D R I V E R S O F G R O W T H I N R W A N D A
beneficiary firms . Direct support should be focused on maximizing foreign exchange earnings (or savings) and targeted to strategic sectors well placed to generate exports, economic growth, and job cre-ation . Crucially, a strongly monitored performance-based approach (focused on firm productivity and exports) should be mainstreamed in all interventions . Rwanda’s industrial incentives need to be better coordinated across government agen-cies . Incentives also could do a better job of attracting FDI in tradable activities .
Define the Future Role of SOEs and Further Strengthen Their Corporate Gover nance . SOEs played an important role in the early stages of Rwanda’s economic development and will continue to do so in the medium term . On the basis of sectoral assess-ment of the level of competition, competitive-ness of SOEs versus private firms, economic development goals, and social considerations, a useful starting point would be to divide key sectors into four groups: (1) sectors in which SOEs will retain a monopoly; (2) sectors in which SOEs will compete with private firms; (3) sectors from which SOEs will withdraw when efforts to build up private sector capacity prove successful; and (4) sectors from which SOEs will withdraw immediately because the private sector is already capable and there is no compelling social rationale for them . Public-private boundaries can shift as the pri-vate sector gains strength . Strong government support will still be needed, but its role will increasingly be to facilitate private investment and build strong market institutions that sig-nal priority sectors . Enterprise development in Rwanda must somehow resolve the some-times-conflicting goals of alleviating market failures and encouraging private sector devel-opment . The reluctance of private investors to invest enough in public goods such as infra-structure is one market failure . Another may be low investment capacity among Rwanda’s private sector .
Build an Effective National Innovation System . On the demand side, a strong
competitive environment would encourage firms to seek out the best available knowl-edge and strengthen managerial capabilities to introduce new processes and technologies, integrate them in the production system, allo-cate skilled staff to use them, and make them financially viable . Improvements in man-agement practices can be achieved through various training and coaching services, improvements in graduate-level management courses, and efforts to encourage increased interaction between multinational firms and local suppliers . Stronger coordination, moni-toring, and evaluation of funding programs for science, technology, and innovation are also needed . The agenda on the supply side of innovation is discussed in chapter 1 .
Transitioning Agriculture and Food to Be a Longer-Term Engine of Growth
IntroductionAgriculture has been a major source of national income and growth for Rwanda . It accounts for close to 70 percent of employ-ment, more than 30 percent of GDP, and more than 50 percent of exports of goods . Agricultural value added has risen more than 5 percent a year over the past 15 years, which is a high rate of growth by global standards; and productivity in the sector has increased strongly . Further, growth in agriculture has likely stimulated growth in other sectors through backward links (for example, by encouraging input industries such as fertil-izers) and forward links (for example, by increasing food processing) . Widespread growth in the purchasing power of farm households in remote areas has also helped to mobilize unemployed local resources by increasing demand for local goods and services .
Considerable government effort has been devoted to developing the sector, especially after the food price shocks of 2007–08 . Major government efforts have included development of new irrigated land, large-scale land consolidation, and land regis-tration . The development of cooperatives has been a major component of state-led

O V E R V I E W 39
collective action, although there is scope for much more . Promotion of the use of fertil-izers and improved seeds and effective inter-ventions in livestock production have also contributed to growth in agriculture .
With this strong start, the main question now is how long and to what extent agricul-ture will remain an engine of growth in the Rwandan economy . Does Rwanda’s highly ambitious economic future continue to have agriculture at its core, or will the sector be useful mostly to launch high long-term growth and then gradually take a back seat? This report contends that the agriculture sector will remain a major source of com-parative advantage for Rwanda, even as the country climbs the income ladder over the coming decades .
Challenges and OpportunitiesPeriods of rapid growth in the past have largely reflected either the expansion of agri-cultural land or the increased use of inputs (figure O .25) . However, there is diminishing marginal scope for further expansion of cul-tivated land . There is significant potential for continuing to improve farmer skills, extend irrigated area, stabilize and expand terraces, boost the use of more adapted fertilizers, and increase farmers’ use of better seeds . Programs targeting these improvements could boost agricultural growth over the next decade or so . Maintaining rapid growth over a longer period, however, requires greater emphasis on TFP growth through more effi-cient allocation of resources and greater reli-ance on technological innovation .
For stronger productivity growth, the sec-tor has to continue to modernize, become more responsive to market signals, and integrate more effectively with regional and global markets . Its contribution needs to shift from supplying commodities primarily for domestic use to producing higher-value-added goods as an integral part of food supply chains linked to regional and international markets . This effort requires an institutional, infrastructural, and policy environment led by the market, with a commensurate gradual shift in the public role to facilitating the fair
implementation of those private sector deci-sions . Like any rapidly growing economy, Rwanda needs to evaluate shifting patterns of demand in regional and global markets, discover its core advantages, and then assess how they can best be deployed to specialize in food and other agricultural products that will maximize income gains .
Rapid increases in productivity also require more mechanization, higher use of inorganic fertilizer and improved seeds, and improved access to financing . Despite sub-stantial progress in land consolidation, most of Rwandan agriculture is carried out under conditions of abundant labor on small plots, mostly on hillsides . The use of labor-saving machinery, such as tractors and combine harvesters, is confined to a few small niches . However, mechanical solutions are needed to expand bench terraces and extend irriga-tion at lower costs per unit, in both cases involving whole communities . Mechanical solutions also are needed for postharvest functions such as transport, processing,
FIGURE O.25 Decomposition of sources of agricultural growth in Rwanda, 1961–2014
Source: Compiled from U.S. Department of Agriculture 2017 data. Notes: The three sources of growth listed sum to output growth in the period in question. Output growth may be different than column height because of negative contributions to growth in the period in question. Growth not explained by area expansion or increased use per hectare of inputs (including labor) is attributed to total factor productivity (TFP). TFP is a combination of increased allocative and technical efficiency and technological change. Because the numerator of TFP (output growth) is highly affected by weather outcomes in any given year, it makes sense to consider TFP outcomes over at least a 10-year period that includes both good and less good weather. This explains the strategy for handling differences between the early and later parts of the period 2001–14.
TFP Area expansion Inputs intensification
65.04 4.01
1.84
0.05
5.155.55
5
3
4
2
0
–1
–2
1
Aver
age
annu
al n
et a
gric
ultu
ral
outp
ut g
row
th (%
)
1961–70 1971–80 1981–90 1991–2000 2001–10 2005–14

40 F U T U R E D R I V E R S O F G R O W T H I N R W A N D A
and packaging . The declining use of inor-ganic fertilizer also needs to be reversed, by continuing to expand the coverage of loca-tions and to improve the formulation of fertilizers . The government is already mod-ernizing its seeds regulations and is also tak-ing steps to legalize agricultural genetically modified organisms . Finally, limited agricul-tural finance remains a major constraint: the use of formal financial services in the agri-culture sector is quite low .
Environmental concerns arising from global climate change and land degrada-tion are a particular challenge that needs to be managed proactively for improving agricultural prospects in Rwanda . Rwanda has experienced a 1 .4°C mean tempera-ture increase since 1970 and is on track to experience another 1°C to 2 .5°C increase over the next three decades . Higher tem-peratures have led to the spread of pests and diseases, impairing the health of livestock and humans, lowering crop yields, harming food security, and decreasing export earn-ings . Rainfall patterns, already highly vari-able in Rwanda, have become even more variable, with projections of a 20 percent increase in variability by the 2050s . In the east and parts of the south, this limits the availability of water and feed for livestock and increases the vulnerability to diseases . At the same time, heavier rains, particu-larly in the north and west of the country, increased floods and landslides, resulting in crop losses, health risks, and damage to infrastructure . Moreover, the combination of rain-fed, small-scale agriculture, high rainfall levels, and steep hillsides (where most of Rwanda’s agriculture is practiced) leads to very high rates of soil erosion .
Rwanda can harness its comparative advantage in high-value crops and livestock products benefitting from a hillside envi-ronment combined with extensive biomass, intensive inputs of skilled labor, the ability to brand credibly (as in organic or Fair Trade), and the ability to support higher transport costs to final markets . Potential products include branded mountain cheeses, essen-tial oils, potato chips, baby food, certified
organic fruits and vegetables including jams and frozen dinners, packaged perishable ani-mal products, cut flowers, and gourmet teas and coffees of specific geographic origins . Even under current conditions, Rwanda’s comparative advantage in these items rela-tive to its neighbors is strong by conventional measures .
RecommendationsIn the medium term, Rwanda will have an agriculture sector that is increasing in pro-ductivity and adapting to the future . State-led efforts to increase agricultural productivity and maximize the sector’s potential in Rwanda remain relevant in the medium term . These efforts involve extending the approach to con-solidation of production decisions and inten-sification of staple food crops . Public support should continue to improve the efficiency of small farms that are still not using fertilizer in appreciable amounts, lack access to adequate agricultural water, are situated on unprotected hillside slopes, or use inferior seeds, so that such farms can achieve the technical efficiency of Rwanda’s better farmers .
Higher agricultural growth in the longer run can only be achieved by reaping the ben-efits of scale economies and specialization through trade and the production of higher-value-added goods . Such efforts require a rapid response to market signals, ready access to investment resources, technical expertise, and ability to organize production and provide appropriate incentives for work-ers, led by the private sector . The state needs to continue playing a leading role as umpire, generator of public knowledge, provider of public goods such as infrastructure and basic research, and responder to other market fail-ures . Targeted high-return initiatives should receive public financial support, accompa-nied by a rigorous evaluation to determine whether adequate returns are being achieved .
Public sector activities in agriculture will increasingly be targeted more effectively to pro-viding key public goods in seven key areas .
Adapt Rwanda’s Research and Regulatory Institutions to Evolving Opportunities and

O V E R V I E W 41
Threats . A key element of Rwanda’s com-parative advantage is the credibility of its cer-tifications, including ISO 22000 certification for food safety and Fair Trade standards under the Rwanda Standards Board . Organic certification also may become advanta-geous . The high technical expertise of the Rwanda Agriculture Board will be increas-ingly important as improving standards and Rwanda’s efforts to expand exports increase the frequency and importance of sanitary and phytosanitary issues . Rwanda’s reputation for probity and accountability is one of its most precious assets and is especially important in agriculture, where quality and food safety issues are dominant concerns of consumers .
Improve the Effectiveness of Policies on Vertical Coordination . Improved policies can be achieved by expanding participa-tion in cooperatives and encouraging private sector aggregators . More effective vertical coordination in agriculture would be where private sector partners provide skills, capi-tal, and entrée into international markets and where farmers acquire higher incomes and new resources . Government can improve general operating conditions for aggregators and develop a knowledge platform regarding which forms of industrial organization work best for addressing specific industrial organi-zation problems . The platform could provide reliable data on vertical coordination, finance, prices, costs, and weather; this information is critical to reducing uncertainties and lowering risks for private investors and should encour-age competition .
Engage with Neighboring Countries on a Regional Division of Labor . A regional division of labor would include both production based on comparative advantage and knowledge generation and diffusion . Rwanda has a major stake in increasing the importation of raw materials such as cere-als for its food- processing and animal pro-tein industries, while increasing its exports of processed foods and high-value calories, for example, from milk and meat products . Ways should be explored to guarantee the
integrity of food security . Regional integra-tion also should be pursued through continu-ing efforts to adopt science-based standards, product registrations, and certification of agricultural inputs .
Profit from the Big-Data Revolution in Innovation, and Make the Benefits of Big Data Accessible at Reasonable Cost to Smallholders . This effort is critical both to increasing innovation and private sector investment and to dealing with the smallest farms and most densely settled rural areas in Africa . “Smart farming,” where just the right amounts of the right inputs are used for each parcel in response to information gathered by handheld devices with the right sensors, offers one such opportunity . Big-data approaches such as blockchain technol-ogy could offer the potential for lowering the costs of small financial transactions that require secure record keeping and decen-tralized input, such as land registration and mortgages .
Link Public Investments in Infrastructure More Effectively to Agricultural Development and Higher-Value-Added Products . Irrigation is clearly a constraint, especially in marsh-lands and in the drier eastern regions of the country . High-value export crops (such as horticulture for export) would likely cover the cost levels much more easily if cost-effective supply chains were in place that could realize international prices .
Further Develop High-Level Human Capital Formation in Agriculture . In particular, to achieve vertical integration, a more consis-tent approach is needed to training managers and technical experts working for aggrega-tors . Companies could be involved in this effort through training programs to build up nationally needed skill sets in agribusiness, high-value supply chains, and agricultural technology . The best multinational com-panies have a track record of making these investments and provide examples of how investments in human capital can be done to mutual advantage .

42 F U T U R E D R I V E R S O F G R O W T H I N R W A N D A
Address Land Degradation and Global Climate Change More Comprehensively . Although considerable progress has been made in constructing robust “bench” (wide) ter-races, much more needs to be done to secure Rwanda’s land asset . Fortunately, the soil and water management interventions central to halting land degradation also would increase the ability of farmers to adapt to climate change through better water retention and improved soil quality . Landscape restora-tion and conservation are a community-level activity, not an individual one . Local govern-ment, producer groups, and national techni-cal expertise and funding all have a role to play in implementation . The development and use of climate-smart and big-data agricultural technologies can further help farmers to cope with the challenges of climate change .
Capable and Accountable Institutions
IntroductionEmerging from very difficult initial condi-tions after the 1994 genocide against the Tutsi, Rwanda’s leadership faced an enor-mous challenge not only of rebuilding a dev-astated economy but also, more broadly, of constructing a national identity and renewed sense of national purpose . Reestablishing peace and social stability and building the decimated social capital of trust were viewed as the underlying sociopolitical challenges of governance (see Jones and Murray 2018) . The government’s response was decisive in several forms, establishing security and seek-ing to channel social energies toward the national purpose of raising incomes, improv-ing opportunities, and providing health and education to all citizens .
Along the way, the government created new homegrown solutions and programs to create an integrated Rwandan community, including revitalizing the community work program to bring people together around a common community purpose (“Umuganda”) once a month; reestablished the traditional community courts (Gacaca) and created mediation committees (abunzi) to achieve reconciliation and mete out justice; sought to
hold all government officials accountable for performance through the system of perfor-mance contracts (imihigo); established the Joint Action Development Forum, a partici-patory planning mechanism to improve the alignment of citizens’ and districts’ priorities; and created an annual forum for national dialogue (Umushyikirano) to allow all citi-zens to have direct access to the most senior leadership in government .
These efforts have proved effective, well reflected in Rwanda’s international rank-ings, with particularly strong performance on indicators of government effectiveness, control of corruption, rule of law, and reg-ulatory quality (figure O .26) . Reflecting the government’s high-profile anticorrup-tion efforts, Rwanda was ranked 48 (out of 180 countries) for control of corruption on Transparency International’s Corruption Perceptions Index in 2018, marking a vast improvement over its 2006 ranking of 121 .
Challenges and OpportunitiesRwanda’s strong overall governance has been a driving force behind its rapid growth and
FIGURE O.26 Benchmarking of Rwanda along the various dimensions of governance
Source: 2016 Worldwide Governance Indicators from Kaufmann, Kraay, and Mastruzzi 2010.Note: LIC = low-income country; LMIC = lower-middle-income country; UMIC = upper-middle-income country.
0 20 40 60 80
Voice andaccountability
Political stability
Governmenteffectiveness
Regulatory quality
Rule of law
Control ofcorruption
Percentile rank, 2016
Mean of UMICsMean of LMICs
Mean of LICsRwanda

O V E R V I E W 43
provides a key comparative advantage over most peers in the region . But the require-ments of a middle-income Rwanda will be different—more demanding—than those that sufficed in the low-income period . Building effective institutions is a long-term endeavor . The improvements are necessarily incremental, building on global and local les-sons and factoring in the specific context of the country .
To strengthen institutional effectiveness requires greater social capital of trust—between citizens, between civil society and government, and even within national political leadership . In Rwanda, interper-sonal trust was understandably very low in the immediate aftermath of the genocide against the Tutsi . Impressive progress has been made since then on achieving reconcili-ation, promoting economic and social devel-opment, and strengthening the structures of governance . But more work is needed in this regard, given the strong positive relationship between trust and long-term development .
Key challenges also relate to limited inno-vation for public civil servants and local governments . Imihigo has made a strong contribution to instilling a culture of results . Building a more complex, richer society requires an approach where civil servants, local officials, and civil society can serve as a source of innovation . It also requires the gov-ernment to obtain and act on feedback from citizens . Essentially, public institutions need to become more innovative, better coordi-nated, and more adaptive .
To achieve continued, rapid growth, an effective market-based economic system is needed to encourage private sector develop-ment, matched by financial resources of the state . Despite Rwanda’s impressive improve-ments in governance, private sector invest-ment and the entry of new firms remain low, reflecting gaps in market institutions . Creating special courts and fast-track pro-cedures to adjudicate small claims; further promoting alternative means of resolving commercial disputes (such as arbitration, mediation, and conciliation); boosting reli-ance on technology; increasing training and
specialization of justice sector employees, including judges, prosecutors, and inves-tigators; and improving case management techniques would enhance the judiciary’s effectiveness in enforcing contracts . Further improvements in the efficiency of the land management system and provision of more resources to implement the law on intellec-tual property would strengthen property rights . Reviewing the performance of fiscal incentives with a view to reducing expan-sion in Rwanda’s tax expenditures, increas-ing local government revenue collection, ensuring that the state captures an appro-priate share of the expected rise in mineral revenues, and taking further steps to raise Rwanda’s strong public financial manage-ment to international standards would strengthen the state’s financial capacity .
A final set of governance challenges has to do with accountability mechanisms between the government and citizens . Rwanda has in place homegrown initiatives, which aid in creating demand for accountability by citi-zens through making them shareholders of development .
RecommendationsStrong growth over the next decades will depend on specific institutional requirements, including a market system that encourages entrepreneurs to take more risks in search of higher rewards by protecting private prop-erty and minimizing policy uncertainty .
Strong growth also requires enhancing state effectiveness through three core insti-tutional pillars: (1) enabling innovative, coordinated, capable bureaucracy and local governments; (2) using efficient market sig-nals to enable strong cooperation between the state and the business sector and maintaining fiscal prudence; and (3) strengthening public administration accountability . All three com-ponents are essential for an effective state (figure O .27), which, in turn, is necessary for sustained high growth .
Pillar 1: Enable Innovative, Coordinated, Capable Bureaucracy and Local Governments . To achieve strong growth

44 F U T U R E D R I V E R S O F G R O W T H I N R W A N D A
over the next decades, well-structured, capa-ble, and empowered civil service and local governments are needed, with the resources and other incentives to be innovative (even entrepreneurial) . Such innovation entails the incentives and resources to inform decision makers and challenge them with evidence and analysis when needed; to share information and coordinate actions within and outside the administration; and to take informed risks, experiment, scale up successes, and learn from failures . Creating such institutions will strengthen capacity and coordination within the government and make progress on decen-tralization to encourage local initiative and eliminate overlaps in responsibilities .
Modifying the imihigo to adopt multiyear targets with annual benchmarks (rather than focusing only on short-term goals), making greater use of qualitative surveys, and placing a stronger focus on outcomes rather than pro-cesses could enhance innovation . Increasing the importance of the joint imihigo and a strong delivery unit to coordinate policies on key cross-cutting issues would improve inter-agency coordination . Further increases in training by the Rwanda Management Institute should be supported by skills audits and func-tional reviews to identify the missing skills in the public sector . Regular compensation reviews, higher compensation for individu-als with scarce skills, and the development of nonfinancial incentives could become increas-ingly important to retain and attract highly skilled staff as competition for scarce skills increases from private companies .
Pillar 2: Strengthen Market Institutions and Fiscal Prudence . The evidence is compelling that functioning markets require well-defined rules of the game, enforced transparently and predictably . Advanced economies (almost as a rule) have a system of highly evolved eco-nomic institutions that convey prices, define property rights, enforce contracts and com-petition policies, and close informational gaps between buyers and sellers (Commission on Growth and Development 2008) . As part of its long-term development, Rwanda has to develop these key market institutions (for competition, contract enforcement, and prop-erty rights), backed by strong financial capac-ity of the state .
Establishing the Rwanda Inspectorate and Competition Authority and extending its mandate to monitor the impact of SOEs on competition, promoting the principle of com-petitive neutrality to ensure equal treatment of all investors, and removing regulatory barriers to entry and rivalry in input sectors would improve the competition framework . Creating special courts and fast-track proce-dures to adjudicate small claims, promoting alternative means of resolving commercial disputes (such as arbitration, mediation, and conciliation); boosting reliance on technol-ogy; increasing training and specialization of judges, and improving case management techniques would enhance the effectiveness of the judiciary system for contract enforce-ment . Further improvements in the efficiency of the land management system, better public information on market values of all catego-ries of land, and provision of more resources to implement the 2008 law on intellectual property would strengthen property rights . Increasing local government revenue col-lection, ensuring that the state captures an appropriate share of the expected rise in mineral revenues, and taking further steps to strengthen Rwanda’s public financial man-agement will be crucial . A better balance has to be found between public investments that are expected to generate high returns over the long term versus investments in areas with potentially high short-term returns based on market signals of scarcity .
FIGURE O.27 A framework for assessing effectiveness of state institutions in Rwanda
Stateeffectiveness
Societal trust
Well-structuredand innovative
government
Strong marketinstitutions
Stateaccountability

O V E R V I E W 45
Pillar 3: Enhance the State’s Accountability to Citizens . For institutions to remain legiti-mate, the state has to be “citizen-centered,” supported by an effective feedback loop between civil society and local governments and service providers . The capacity and moti-vation of citizens to participate with state actors in assessing service delivery and find-ing solutions are critical for Rwanda’s emer-gence as a strong, successful middle-income economy .
Reform measures can seek to strengthen checks and balances further to improve accountability over the executive, local offi-cials, and service providers . Strengthening key watchdog agencies (the Public Accounts Committee, the Office of the Auditor General, the Office of the Ombudsman, and the Rwanda Governance Board) could improve government accountability . Greater involvement of citizens in local decision mak-ing (for example, in setting imihigo objectives) and reliance on more qualitative information in monitoring performance would strengthen support for local government and improve the quality of services .
Notes 1 . Worldwide, almost 80 percent of income
growth of the poor is due to increases in countries’ income levels (Dollar and Kraay 2016) . Rwanda, too, has witnessed the close association between growth and general improvements in welfare along several dimen-sions of welfare in the past two decades, as chronicled in this report .
2 . Key l iberal izat ion measures included (1) elimination of most price controls; (2) liberalization of exchange rates in 1995; (3) lowering of tariff rates from 35 to 18 percent; (4) liberalization of the mon-etary and financial sectors, including adop-tion of new currency exchange regulations, creation of private commercial banks, and privatization of state-owned banks; (5) lib-eralization of current account operations (imports, exports, services); (6) elimination or easing of certain restrictions on capital flows, including the transfer of capital and revenues related to foreign direct investment
and the free withdrawal from foreign exchange accounts in commercial banks (Ggombe and Newfarmer 2017) .
3 . This report considers the period 1995–2005 as the recovery period and the subsequent phase as the postrecovery period .
4 . This stagnation mostly reflects a decline in private savings, as government savings increased . The savings-investment gap has been made up by external assistance and, increasingly, by FDI inflows .
5 . Although future investment does not have to be financed through domestic savings if the country has ready access to external financ-ing, running large external imbalances over long periods has proved unsustainable for countries .
6 . Rwanda’s high costs stem from the small market size, long distance to external mar-kets (by virtue of being landlocked), shallow and costly credit markets, high cost of energy generation, and scarcity of land that increases the rent on it .
7 . For example, Lendle and Olarreaga (2017) find that the impact of distance on cross-border trade flows—across 61 countries and 40 product categories—is about 65 percent smaller for eBay transactions relative to total international trade . More generally, Osnago and Tan (2016) find that a 10 percent increase in an exporter’s rate of Internet adoption leads to a 1 .9 percent increase in bilateral exports .
8 . Initial signs are encouraging . FabLab, an innovation hub at the government-backed ICT park, has started to work with three- dimensional printers (BBC 2016) .
9 . Rwanda’s priorities in this regard are already well reflected, for instance, in the soon-to-roll-out 4G LTE broadband network—a wireless broadband technology designed to support roaming Internet access via cell phones and handheld devices .
10 . Three drone ports, which will allow the drone network to send supplies to 44 percent of the country, are expected to be completed by 2020 .
11 . These countries are Argentina, Brazil, China, India, Indonesia, Korea, Mexico, the Russian Federation, Saudi Arabia, South Africa, and Turkey . Korea is counted in this group because it was not yet a high-income country in 1990, the base year for the comparison .
12 . For example, Chinese domestic companies have captured larger market shares and moved

46 F U T U R E D R I V E R S O F G R O W T H I N R W A N D A
up the value chain in highly competitive manu-facturing industries, such as high-end chemi-cals, electronics (in particular, information technology), automotive, and aircraft .
13 . Robotics, automation, computerized manu-facturing, and artificial intelligence could reduce the advantages of production in low-labor-cost emerging economies, discouraging offshoring from and favoring reshoring to these countries .
14 . Purchases of real estate properties by Chinese individuals in high-income countries also contributed to the boom in FDI outflows . Outflows from Korea have also increased, driven by rising greenfield investments .
15 . In 2015, the top 10 investors (by FDI stock) in Africa were the United States, United Kingdom, France, China, South Africa, Italy, India, Singapore, Switzerland, and Malaysia .
16 . High dependency imposes costs at the house-hold and national levels, in the form of educa-tion, health care, social protection, and other essential needs of children and the elderly . When dependency ratios are low, under con-ducive conditions, lower costs should support higher growth through higher savings and investments, including in building human capital of children .
17 . For example, Mindspark, an interactive computer-assisted learning software, increased math scores by 0 .59 standard deviation and language scores by 0 .36 standard deviation for a group of Indian students in 90 days (Muralidharan, Singh, and Ganimian 2017) . Similarly, the Adaptive Mathematics Platform that has been used by half of students in grades 3–6 in Uruguay improved math scores by 0 .2 standard deviation, equivalent to half a semes-ter of schooling (Perera and Aboal 2017) .
18 . The main exports to the Democratic Republic of Congo include livestock and crops, but the Democratic Republic of Congo also provides an important source of (informal) cross- border trade in services such as finance, transporta-tion, and wholesale trading (Lalui 2016) .
19 . Nguyen (2017) shows that a competitive exchange rate is likely to boost Rwanda’s growth by boosting its exports and manufac-turing production but also cautions that the costs and institutional requirements of main-taining an undervalued exchange rate have to be considered before embarking on any such policy .
20 . Only 14 percent of Rwanda’s urban popula-tion were recent migrants from rural areas in 2014, while only 20 percent of recent inter-nal migrants moved from rural to urban areas (NISR 2015) .
21 . Efficiency of resource allocation across sec-tors can be just as important as allocation within sectors . However, the available data do not permit a comparison of the magnitude of misallocation of resources across sectors in Rwanda and in other countries .
ReferencesAkamatsu, K . 1962 . “A Historical Pattern of
Economic Growth in Developing Countries .” Journal of Developing Economies 1 (s1): 3–25 .
Bashir, S ., M . Lockheed, E . Ninan, and J .- P . Tan . 2018 . Facing Forward: Schooling for Learning in Sub-Saharan Africa . Washington, DC: World Bank .
Basinga, P ., P . J . Gertler, A . Binagwaho, A . L . B . Soucat, J . Sturdy, and M . J . C . Vermeersch . 2011 . “Effect on Maternal and Child Health Services in Rwanda of Payment to Primary Health-Care Providers for Performance: An Impact Evaluation .” Lancet 377 (9775): 1421–28 .
BBC (British Broadcasting Corporation) . 2016 . “Rwanda’s Technology Revolution Helps Country Forge New Path after Genocide .” BBC, May13 . http://www .bbc .com/news / world-africa-36285889# .
Brenton, P ., and G . Isik . 2012 . De-Fragmenting Africa: Deepening Regional Trade Integration in Goods and Services . Washington, DC: World Bank .
Chukwuma, O . 2003 . “Rwanda—The Search for Post-Conflict Socio-Economic Change, 1995–2001 .” Afr ica Reg ion Working Paper 59, World Bank, Washington, DC . http://documents .worldbank .org /curated /en /643271468759893135/ Rwanda-the -search-for-post-conflict-socio-economic -change-1995-2001 .
Commission on Growth and Development . 2008 . The Growth Report: Strategies for Sustained Growth and Inclusive Development . Washington, DC: World Bank .
Diao, X ., J . Randriamamonjy, and J . Thurlow . 2017 . “Urbanization and the Future of Economic Development in Rwanda .” International Food Policy Research Institute, Washington, DC . Background paper for Future

O V E R V I E W 47
Drivers of Growth in Rwanda, World Bank, Washington, DC .
Dihel, N ., A . M . Fernandes, and A . Mattoo . 2012 . “Developing Professional Services in Africa through Regional Integration .” In De-Fragmenting Africa: Deepening Regional Trade Integration in Goods and Services, edited by P . Brenton and G . Isik . Washington, DC: World Bank .
Dollar, D ., and T . Kraay . 2016 . “Growth Is Still Good for the Poor .” European Economic Review 81 (January): 68–85 .
Economist . 2012 . “Daily Graph: The Urbanisation Trap .” Economist (online), October 2 .
EDC (Education Development Center) . 2017 . Literacy, Language, and Learning Initiative (L3): National Fluency and Mathematics Assessment of Rwandan Schools . Report for the U .S . Agency for International Development . Waltham, MA: EDC .
Feenstra, R . C ., R . Inklaar, and M . P . Timmer . 2015 . “The Next Generation of the Penn World Table .” American Economic Review 105 (10): 3150–82 . www .ggdc .net/pwt .
Freund, C ., and T . Moran . 2017 . “Multinational Investors as Export Superstars: How Emerging Market Governments Can Reshape Comparative Advantage .” Working Paper 17-1, Peterson Institute for International Economics, Washington, DC .
Galasso, E ., A . Wagstaff, S . Naudeau, and M . Shekar . 2016 . “The Economic Costs of Stunting and How to Reduce Them .” Policy Research Note, World Bank, Washington, DC .
Gereffi, G . 1999 . “International Trade and Indust r ia l Upgrading in the Apparel Commodity Chain .” Journal of International Economics 48 (1): 37–70 .
Gereffi, G ., and O . Memedovic . 2003 . “The Global Apparel Value Chain: What Prospects for Upgrading by Developing Countries?” United Nations Industrial Development, New York . https://ssrn .com/abstract=413820 .
Ggombe, K ., and R . Newfarmer . 2017 . “Rwanda: From Devastation to Services—First Transformation .” WIDER Working Paper 2017/84, United Nations University World Institute for Development Economics Research, Helsinki .
Government of Rwanda . 2017 . “7 Years Government Programme: National Strategy for Transformation (NST1): 2017–24 .” Draft . Government of Rwanda, Kigali .
Hallward-Driemeier, M ., and G . Nayyar . 2017 . Trouble in the Making: The Future of Manufac tur ing-Led Development . Washington, DC: World Bank .
Inglehart, R ., C . Haerpfer, A . Moreno, C . Welzel, K . Kizilova, J . Diez-Medrano, M . Lagos, P . Norris, E . Ponarin, and B . Puranen, eds . 2014 . World Values Survey: Round Six—Country-Pooled Datafile 2010–2014 . Madrid: JD Systems Institute . http://www .worldvalues survey .org/WVSDocumentationWV6 .jsp .
Jones, W ., and S . Murray . 2018 . “Consolidating Peace and Legitimacy in Rwanda .” Country Study, London School of Economics, Oxford Commission on Fragility, Growth, and Development, London .
Kaufmann, D ., A . Kraay, and M . Mastruzzi . 2010 . The Worldwide Governance Indicators: Methodolog y and Analy t ic a l I ssues . Washington, DC: Brookings Institution Press .
Lalui, A . 2016 . “Analysis of Cross-Border Trade in Services: Issues and Trends with a Focus on Rwanda and DRC .” TradeMark East Africa, Kigali .
Lemarchand, G . A ., and A . Tash, eds . 2015 . Mapping Research and Innovation in the Republic of Rwanda . GO-SPIN Country Prof i les in Science , Technology, and Innovation Policy, vol . 4 . Paris: United Nations Educat ional , Scient i f ic , and Cultural Organization (UNESCO) .
Lendle, A ., and M . Olarreaga . 2017 . “Can Online Markets Make Trade More Inclusive?” ADBI Working Paper 742, Asian Development Bank Institute, Tokyo .
Lutz, W ., W . P . Butz, and S . KC . 2014 . World Population and Human Capital in the Twenty-First Century . Oxford, U .K .: Oxford University Press .
Muralidharan, K ., A . Singh, and A . J . Ganimian . 2017 . “Disrupting Education? Experimental Evidence on Technology-Aided Instruction in India .” NBER Working Paper 22923, National Bureau of Economic Research, Cambridge, MA .
Newfarmer, R ., J . Page, and F . Tarp, eds . Forthcoming . Industries without Smokestacks: African Industrialization Revisited . Oxford, U .K .: Oxford University Press .
Nguyen, H . 2017 . “Real Exchange Rate Misalignment and Its Relationship to Output Growth in Rwanda .” Background paper for Future Drivers of Growth in Rwanda, World Bank, Washington, DC .

48 F U T U R E D R I V E R S O F G R O W T H I N R W A N D A
NISR (National Institute of Statistics of Rwanda) . 2011 . Establishment Census 2011 . Kigali: NISR, September .
——— . 2015 . Rwand a Pove r t y Prof i l e Report 2013–2014: Results of Integrated Living Conditions Survey (EICV) . Kigali: Government of Rwanda . September .
——— . 2017 . “Seasonal Agricultural Surveys—Season A (May) and Season B (September) .” NISR, Kigali .
OECD (Organisation for Economic Co-operation and Development) . 2017 . “The Future of Global Value Chains: ‘Business as Usual’ or ‘A New Normal’?” Directorate for Science, Technology, and Innovation Policy Note, OECD, Paris .
Osnago, A ., and S . W . Tan . 2016 . “Disaggregating the Impact of the Internet on International Trade .” Policy Research Working Paper 7785, World Bank, Washington, DC . ht tps: / /openknowledge .worldbank .org / handle/10986/24866 .
Perera, M ., and D . Aboal . 2017 . “Evaluación del impacto de la plataforma adaptativa de matemática en los resultados de los aprendizajes .” Centro de Investigaciones Económicas, Montevideo .
Ranis, G ., F . Stewart, and A . Ramirez . 2000 . “Economic Growth and Human Development .” World Development 28 (2): 197–219 .
Rodrik, D . 2015 . “Premature Deindustrialization .” NBER Working Paper 20935, National Bureau of Economic Research, Cambridge, MA .
Shepherd, B ., J . de Melo, and R . Sen . 2017 . “Reform of the EAC Common External Tariff: Evidence from Trade Costs .” IGC Policy Paper, International Growth Centre, Kampala .
UNCTAD (United Nations Conference on Trade and Development) . 2017 . Science, Technology, and Innovation Policy Review . Geneva: UNCTAD .
——— . 2018 . “The Task Ahead Is Great Say African Leaders as Continent-wide Free Trade Deal Is Signed .” UNCTAD (news), March 21 . http://unctad .org/en/pages/newsdetails .aspx?OriginalVersionID=1695 .
UNECA (United Nations Economic Commission for Africa) . 2018 . “Signing AfCFTA Giant Stride
Forward for the Development of Africa: ECA’s Vera Songwe .” UNECA (news), March 21 . https://www .uneca .org/stories/signing -afcfta -giant-stride-forward-development -africa -eca%E2%80%99s-vera-songwe .
UNFPA (United Nations Population Fund) . 2017 . “Unlocking Rwanda’s Potential to Reap the Demographic Dividend .” Policy Brief, UNFPA, New York, October .
United Nations . Various years . Comtrade database . New York: United Nations .
USA I D (U . S . Agency for I nternat iona l Development) . 2017 . Literacy, Language, and Learning Initiative: National Fluency and Mathematics Assessment of Rwandan Schools . Washington, DC: USAID .
U . S . Depar tment of Agr icu lture . 2017 . International Agricultural Productivity database . Washington, DC: Economic Research Service . https://www .ers .usda .gov /data -prod ucts / international-agricultural -productivity/ .
World B a n k . 20 07 . R wan d a : Toward Sustained Growth and Competitiveness . 2 vols . Washington, DC: World Bank . ht tps: //openknowledge .worldbank .org / handle/10986/7700 .
——— . 2015a . “Building a Reform Consensus for Integrated Corridor Development in the East African Community .” World Bank, Washington, DC .
——— . 2015b . Rwanda: Employment and Jobs Study . Washington, DC: World Bank .
——— . 2016 . Vietnam 2035: Toward Prosperity, Creat iv i t y, Equi t y, and Democracy . Washington, DC: World Bank .
——— . 2019 . Doing Business 2019: Training for Reform . Washington, DC: World Bank .
——— . Various years . World Development Indicators database . Washington, DC: World Bank . ht tps : / /data /worldbank .org / data- cata log /world-development -indicators .
Zeitlin, A ., C . Leaver, O . Ozier, and P . Serneels . 2017 . “Recruitment, Motivation, and Retention Effects of Teacher Performance Pay .” Project Report S-38408-RWA-1, International Growth Centre, London School of Economics, London .


The World Bank Group is committed to reducing its environmen-tal footprint. In support of this commitment, we leverage elec-tronic publishing options and print-on-demand technology, which is located in regional hubs worldwide. Together, these initiatives enable print runs to be lowered and shipping distances decreased, resulting in reduced paper consumption, chemical use, greenhouse gas emissions, and waste.
We follow the recommended standards for paper use set by the Green Press Initiative. The majority of our books are printed on Forest Stewardship Council (FSC)–certified paper, with nearly all containing 50–100 percent recycled content. The recycled fiber in our book paper is either unbleached or bleached using totally chlorine-free (TCF), processed chlorine–free (PCF), or enhanced elemental chlorine–free (EECF) processes.
More information about the Bank’s environmental philosophy can be found at http://www.worldbank.org/corporateresponsibility.
ECO-AUDIT
Environmental Benefits Statement

SKU 33227
Innovation, Integration, Agglomeration, and Competition
Future Driversof Growth in
RWANDA
A strong and widely acknowledged record of economic success—including a three-and-a-
half-fold increase in per capita income since 1994—places Rwanda among the world’s
fastest-growing economies. Traumatic memories of the 1994 genocide are gradually fading,
as associations begin to take a more positive form—of a nation on the rise, powered by
human resilience, a sense of common purpose, and a purposeful government.
Past successes and a sense of frailty have fueled aspirations for a secure, prosperous, and
modern future. Sustaining high rates of economic growth is at the heart of these ambitions.
Recent formulations of the nation’s Vision 2050 set a target of achieving upper-middle-
income status by 2035 and high-income status by 2050.
Future Drivers of Growth in Rwanda: Innovation, Integration, Agglomeration, and
Competition, a joint undertaking by experts from Rwanda and the World Bank Group,
evaluates the country’s possibilities and options in this endeavor. The report identifies four
essential drivers of growth—innovation, integration, agglomeration, and competition—and
reforms in six priority areas: human capital development, export dynamism and regional
integration, well-managed urbanization, competitive domestic enterprises, agricultural
modernization, and capable and accountable public institutions.
Government of Rwanda
Government of Rwanda
O V E R V I E W