Embed Size (px)
Citation preview


Overview
Climate negotiations are at an impasse. To overcome it we propose a 4-step compromise for reducing emissions: 1. limiting initial action to the MEF members, 13
economies (81.3% of emissions) 2. utilizing consumption-based carbon accounting 3. applying equity principles of responsibility and
capability to share the burden of reductions 4. bringing this deal back to the UN negotiations
for wider adoption

Key objective: a morally-grounded compromise
Given the stalemate in UN negotiations, our proposal changes some ‘rules of the game’: it devises a science-based compromise to break the impasse for rapidly, fairly, and effectively, sharing the burden of GHGs reductions
Equity is unavoidable for moving forward the negotiations, especially for sharing the burden of emissions abatements, the most urgent coordination problem of the climate crisis

The problem: entrenched positions
Key developed countries will not accept any regime that excludes from abatements emerging economies such as China and India
Key developing countries have made equity a prerequisite for any kind of agreement: they will not take on mandatory emissions
reductions targets unless the wealthier countries commit to deep emissions cuts commensurate with their contribution

The solution: loosening the knot
A successful approach to emiss reductions must: involve the largest emitters from both the developed and
developing countries find a way to engage the latter without penalizing
disproportionately any particular economies
For securing progress, above all it must: On theoretical grounds, be built on agreed equity
principles for sharing the burden of required emissions On empirical grounds, be acceptable to the two world
superpowers and top carbon emitters, China and the U.S. With this leadership, other emitters will likely follow

Four feasible steps to a compromise
1. MEF
2. Consumption-based carbon accounting
3. Equity principles of responsibility and capability
4. Back to the UN negotiations

1. The MEF
Twenty years of painful negotiations among the 194 parties to the UNFCCC show that a deal needs to initially be struck in a setting with a limited number of subjects
The MEF includes the 13 largest emitters in the world (81.3% of global emissions)
The MEF is therefore a group small enough to avoid the unworkability of UN universalism and sufficiently broad to have significant global impact and exert global leverage

MEF members’ cumulative consumption-based emissions, 1990-2010. Absolute values (million tonnes CO2) and percentage of global emissions
MEF member Absolute values (Mt CO2) Percentage of global emissions (%)
U.S. 118,034.2 22.1 EU 101,987.9 19.1 China 79,202.7 14.8 Japan 30,171.3 5.7 Russia 26,683.7 5.0 India 23,885.9 4.5 Canada 10,952.7 2.1 Korea 10,117.0 1.9 Mexico 8,584.4 1.6 Brazil 6,788.2 1.3 Australia 6,258.9 1.2 South Africa 5,805.3 1.1 Indonesia 5,668.1 1.1 Total MEF 434,140.3 81.3 Total World 533,919.0 100

2. Consumption-based
C-based measures emissions associated with the final consumption of goods and services, and is calculated by subtracting from P-based emissions those associated with export and adding those generated for import
Production-based accounting penalizes economies with carbon-intensive productions, and incentivizes the “off-shoring” of these productions (carbon leakage)
C-based, generally considered fairer per se, encourages participation in, and increases flexibility of, agreements A promising system for the most widely agreed compromise
possible for fair and effective collective action against GHGs

Carbon-exporting and -importing MEF members. Final two columns show the difference between these two accounting systems [P – C], in absolute (million tonnes CO2) and % values
MEF member Production-based
cumulative emissions (Mt CO2)
Consumption-based cumulative emissions
(Mt CO2) [P – C] (Mt CO2)
[P – C] (%)
South Africa (Exp) 8,166.6 5,805.3 2,361.3 28.9 Russia (Exp) 36,150.4 26,683.7 9,466.7 26.2 China (Exp) 93,059.5 79,202.7 13,856.8 14.9 Australia (Exp) 7,090.5 6,258.9 831.6 11.7 Indonesia (Exp) 6,141.5 5,668.1 473.4 7.7 India (Exp) 25,751.1 23,885.9 1,865.2 7.2 Canada (Imp) 10,693.2 10,952.7 -259.4 -2.4 U.S. (Imp) 114,464.9 118,034.2 -3,569.3 -3.1 Brazil (Imp) 6,492.0 6,788.2 -296.2 -4.6 Mexico (Imp) 8,129.6 8,584.4 -454.8 -5.6 Korea (Imp) 8,755.5 10,117.0 -1,361.5 -15.6 Japan (Imp) 24,907.5 30,171.3 -5,263.8 -21.1 EU (Imp) 83,545.0 101,987.9 -18,442.9 -22.1
3. Responsibility and capability
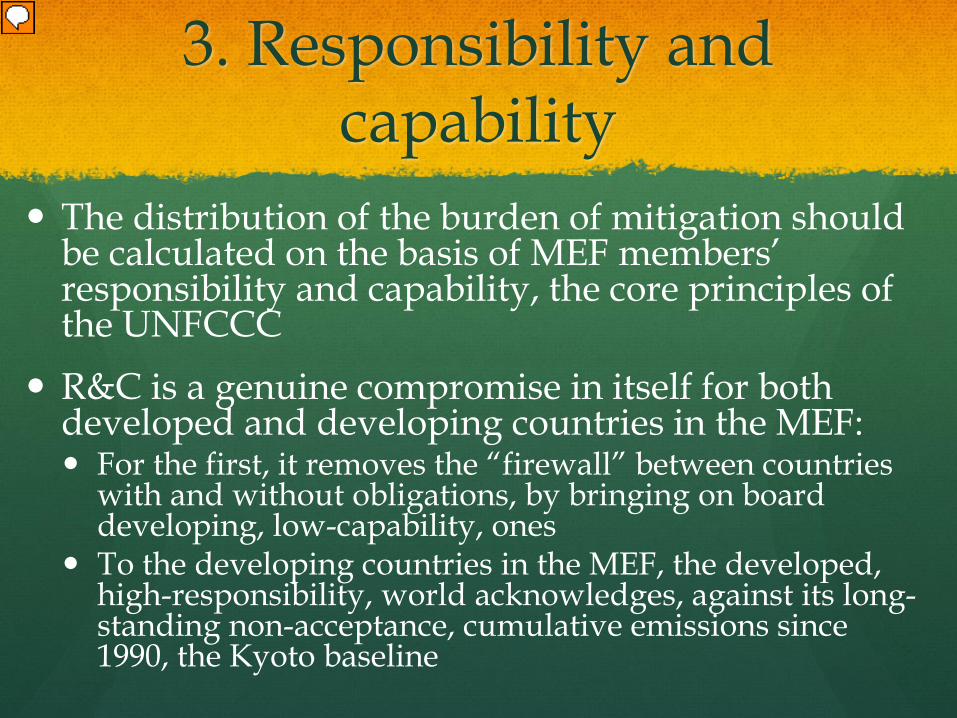
The distribution of the burden of mitigation should be calculated on the basis of MEF members’ responsibility and capability, the core principles of the UNFCCC
R&C is a genuine compromise in itself for both developed and developing countries in the MEF: For the first, it removes the “firewall” between countries
with and without obligations, by bringing on board developing, low-capability, ones
To the developing countries in the MEF, the developed, high-responsibility, world acknowledges, against its long-standing non-acceptance, cumulative emissions since 1990, the Kyoto baseline

4. Bringing the deal back to the UNFCCC
The compromise must finally be brought back into the UNFCCC
A Trojan horse for expanding commitments to the UNFCCC members
The affluent countries, MEF and non-MEF, should also have obligations to extend a “green ladder” to poorer developing non-MEF members, to realize their equitable access to sustainable development
Operationalizing the compromise: the carbon budget
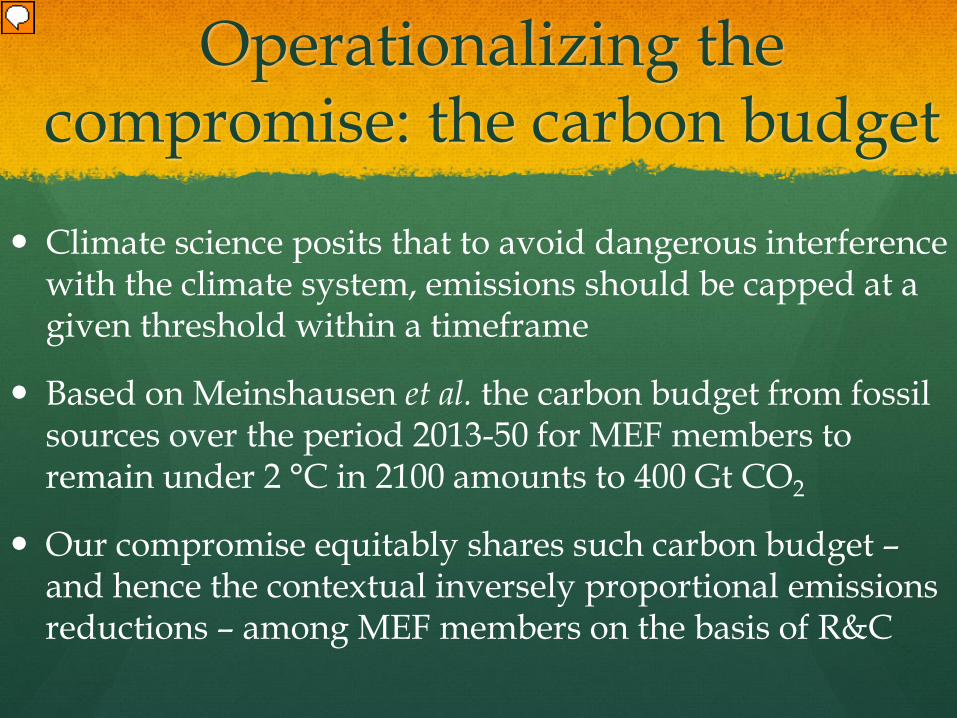
Climate science posits that to avoid dangerous interference with the climate system, emissions should be capped at a given threshold within a timeframe
Based on Meinshausen et al. the carbon budget from fossil sources over the period 2013-50 for MEF members to remain under 2 °C in 2100 amounts to 400 Gt CO2
Our compromise equitably shares such carbon budget – and hence the contextual inversely proportional emissions reductions – among MEF members on the basis of R&C

Operationalizing the compromise: R&C
Our operationalization of responsibility follows a short-horizon polluter pays principle, based on 1990-2010 cumulative emissions, and defines capability as mean per capita income (2010 per capita GDP, US$ PPP )
For being politically feasible the calculation of the shares of the carbon budget takes account of the dimension of the economies of MEF members, estimated through their emissions

Determination of R&C
Calculation of baseline/non-corrected shares on the basis of 2010 emissions
Calculation of the responsibility correction on the basis of consumption-based 1990-2010 cumulative emissions
Calculation of the capability correction on the basis of 2010 GPD US$ per capita in purchasing power parity (PPP)
Application of the responsibility and capability corrections to baseline shares in a directly proportional way. From (1) are subtracted (2) and (3)
Scaling of the shares calculated in (4) to the 400 Gt carbon budget
1
2
3
4
5

CONSUMPTION-BASED CORRECTION - All non % values expressed in Mt CO2
2010 Em % 2010 Em on Tot
Baseline (non-corrected CB)(1)
1990-2010 aggregate Cons-Em
Responsibility Correction (2)
2010 GPD US$ per capita (PPP) World Bank
Capability Correction(3)
Intermediate CB corrected R&C(4) e.g. 5619 –1.4%*5619 – 13.5%*5619
Percent Intermediate CB corrected R&C
CARBON BUDGET (5)
Australia 362 1,4% 5619 6259 1,4% 39721 13,5% 4782 1,6% 6309
Brazil 419 1,6% 6499 6788 1,6% 11183 3,8% 6151 2,0% 8116
Canada 524 2,0% 8133 10953 2,5% 40370 13,7% 6815 2,2% 8992
China 8295 32,2% 128676 79203 18,2% 7794 2,6% 101802 33,6% 134321
EU27 total 3736 14,5% 57956 101988 23,5% 32101 10,9% 38037 12,5% 50186
India 2102 8,2% 32603 23886 5,5% 3454 1,2% 30427 10,0% 40147
Indonesia 509 2,0% 7903 5668 1,3% 4636 1,6% 7676 2,5% 10128
Japan 1173 4,6% 18201 30171 6,9% 33874 11,5% 14847 4,9% 19589
Korea 558 2,2% 8652 10117 2,3% 30286 10,3% 7562 2,5% 9978
Mexico 453 1,8% 7023 8584 2,0% 15266 5,2% 6521 2,2% 8604
Russia 1634 6,3% 25352 26684 6,1% 20036 6,8% 22073 7,3% 29123 South Africa 512 2,0% 7940 5805 1,3% 10465 3,5% 7552 2,5% 9965
USA 5508 21,4% 85443 118034 27,2% 45922 15,6% 48917 16,1% 64542
25786 100% 400000 434140 100% 295108 100% 303163 100% 400000

Shares of the Carbon Budget
Projected 2013-2050 emissions at current rates
(Mt CO2) Baseline shares
(Mt CO2)
Production-based R&C-corrected
shares (Mt CO2)
Consumption-based R&C-
corrected shares
(Mt CO2) Differential
(%) Differential
(Mt CO2)
Australia (Exp) 13,765 5,619 6,327 6,309 -0.3% -18 Brazil (Imp) 15,921 6,499 8,163 8,116 -0.6% -48 Canada (Imp) 19,924 8,133 9,045 8,992 -0.6% -52 China (Exp) 315,220 128,676 129,500 134,321 3.6% 4,821 EU (Imp) 141,975 57,956 53,683 50,186 -7.0% -3,497 India (Exp) 79,868 32,603 40,163 40,147 0.0% -17 Indonesia (Exp) 19,361 7,903 10,168 10,128 -0.4% -41 Japan (Imp) 44,587 18,201 19,981 19,589 -2.0% -391 Korea (Imp) 21,195 8,652 10,065 9,978 -0.9% -87 Mexico (Imp) 17,205 7,023 8,658 8,604 -0.6% -54 Russia (Exp) 62,105 25,352 28,535 29,123 2.0% 588
South Africa (Exp) 19,451 7,940 9,959 9,965 0.1% 6 U.S. (Imp) 209,311 85,443 65,752 64,542 -1.9% -1,210

Emissions reductions
0
50
100
150
200
250
300
Aus
t…Br
azil
Can
a…C
hina EU
Indi
aIn
do…
Japa
nK
orea
Mex
ico
Russ
iaSo
ut…
U.S
.
Gt C
O2
Projected 2013-2050emissions at currentratesBaseline shares (non-corrected)
Production-basedR&C-corrected shares
Consumption-basedR&C-corrected shares

Main outcomes
Largest carbon-importers would be somewhat penalized by consumption-based accounting In particular, the EU would have a 7% larger emissions abatements
burden (i.e. 3.5 Gt CO2) than with current production-based More modest shifts occur for the U.S., who would have 1.9% larger
emissions reductions (1.2 Gt CO2) and for Japan (2%, or 0.4 Gt CO2)
Conversely, the leading carbon exporters (China and Russia) would have respectively 3.6 (or 4.8 Gt CO2) and 2.0 (or 0.6 Gt CO2) % smaller emissions reductions required in consumption rather than in production terms
For the remaining MEF members the differences in emissions reductions are not significant (< 1%)

Some considerations
Our compromise seems capable of furthering climate negotiations for three ‘pragmatic’ reasons: 1. C-based more acceptable to China, who would have
substantial “headroom” and less stringent targets 2. The U.S., the other top emitter, would not be
excessively penalized by C-based accounting 3. C-based accounting does not disproportionally
penalize anyone The main difference involves the EU, whose relatively
successful recent de-carbonization seems largely due to the off-shoring of carbon intensive productions

Policy pointers
MEF’s emissions reductions are highly ambitious, especially for China, the U.S. and to a lesser extent for the EU, even though there is still time for greening these economies
With emission trading, it would be in principle possible for the most penalized economies to carry out part of their mitigation commitments in other countries also not belonging to MEF
Consumption-based accounting, though not profoundly different from production-based accounting, satisfies most of the requisites for successful climate negotiations
At the same time, consumption-based accounting answers a legitimate concern of economies with substantial embodied emissions in their exports, and especially those of the largest carbon-exporters like China

A new way forward
Our compromise is indeed ambitious in terms of emissions reductions, but it is politically feasible: Each MEF member would, in fact, achieve and give up
some of their short-term goals in this simple framework Despite the importance of national sovereignty each
MEF member will have to relax some of their hard-line positions: no one will win if they do not
Other details will have to be worked out In the short-term, and especially with the 2015
deadline to structure a deal under the Durban Platform approaching, the MEF, with this compromise, can constructively lead the way