Embed Size (px)
Citation preview

Overview browser for PalCom assemblies
Vatan Bytyqi, Jonas Jinbäck
MASTER’S THESIS | LUND UNIVERSITY 2015
Department of Computer ScienceFaculty of Engineering LTH
ISSN 1650-2884 LU-CS-EX 2015-43


Overview browser for PalCom assemblies
(A Master’s Thesis at Lund University)
Vatan [email protected]
Jonas Jinbä[email protected]
September 10, 2015
Master’s thesis work carried out atthe Department of Computer Science, Lund University.
Supervisor: Boris Magnusson, [email protected]
Examiner: Görel Hedin, [email protected]


Abstract
Internet of Things (IoT) has become a frequent subject mentioned worldwide.PalCom is a system for handling the problems that occurs in IoT applicationsand is focused on the user groups that are developers and skilled PalCom par-ticipants. This forecloses a higher level user group for managing their ownPalCom network, e.g. end users for a smart home where they build their ownsmart home manager with PalCom.
In this Master’s Thesis we came up with a solution for a tool that shows anoverview of an assembly and that is able to edit such an assembly. The assem-bly is used to create and manage the devices in the network. The evaluationwas done by letting people try our solution and the old one and then comparethe results.
Keywords: IoT, PalCom, overview browser, assembly editor, smart home

2

Acknowledgements
We would like to thank Boris Magnusson for his guidance throughout the work and forproviding us with material that we weren’t able to get. We would also like to thank MattiasNordahl and Björn A. Johnsson for their help in working and making changes in PalCom.Lastly we would like to thank all the persons that were willingly to participate in ourexperiment. Thank you all for your contributions that made this work possible.
3

4

Contents
1 Introduction 71.1 Problem statement . . . . . . . . . . . . . . . . . . . . . . . . . . . . . 71.2 Method . . . . . . . . . . . . . . . . . . . . . . . . . . . . . . . . . . . 81.3 Related work . . . . . . . . . . . . . . . . . . . . . . . . . . . . . . . . 81.4 Approach . . . . . . . . . . . . . . . . . . . . . . . . . . . . . . . . . . 9
1.4.1 Scenario experiment . . . . . . . . . . . . . . . . . . . . . . . . 91.4.2 Smart home scenario . . . . . . . . . . . . . . . . . . . . . . . . 9
1.5 Work responsibilities . . . . . . . . . . . . . . . . . . . . . . . . . . . . 10
2 Background 132.1 Internet of Things (IoT) . . . . . . . . . . . . . . . . . . . . . . . . . . . 132.2 PalCom . . . . . . . . . . . . . . . . . . . . . . . . . . . . . . . . . . . 14
2.2.1 TheThing . . . . . . . . . . . . . . . . . . . . . . . . . . . . . . 152.2.2 BrowserGUI . . . . . . . . . . . . . . . . . . . . . . . . . . . . 15
3 Previous work 173.1 Assembly editor . . . . . . . . . . . . . . . . . . . . . . . . . . . . . . . 17
3.1.1 Devices . . . . . . . . . . . . . . . . . . . . . . . . . . . . . . . 173.1.2 Services . . . . . . . . . . . . . . . . . . . . . . . . . . . . . . . 183.1.3 Connections . . . . . . . . . . . . . . . . . . . . . . . . . . . . 193.1.4 Script . . . . . . . . . . . . . . . . . . . . . . . . . . . . . . . . 193.1.5 Synthesized Services . . . . . . . . . . . . . . . . . . . . . . . . 20
3.2 PalCom overview browser (OVB) . . . . . . . . . . . . . . . . . . . . . 213.3 Control Builder Diagram Editor - ABB editor . . . . . . . . . . . . . . . 213.4 If This Then That (IFTTT) . . . . . . . . . . . . . . . . . . . . . . . . . 22
4 New assembly editor with implementation 254.1 Assembly editor . . . . . . . . . . . . . . . . . . . . . . . . . . . . . . . 25
4.1.1 The workspace . . . . . . . . . . . . . . . . . . . . . . . . . . . 264.1.2 Variable handler . . . . . . . . . . . . . . . . . . . . . . . . . . 29
5

CONTENTS
4.1.3 Synthesized service handler . . . . . . . . . . . . . . . . . . . . 294.2 Services . . . . . . . . . . . . . . . . . . . . . . . . . . . . . . . . . . . 30
4.2.1 Philips TV service . . . . . . . . . . . . . . . . . . . . . . . . . 314.2.2 Tellstick service . . . . . . . . . . . . . . . . . . . . . . . . . . . 314.2.3 Linocell bluetooth camera shutter service . . . . . . . . . . . . . 32
4.3 Graph implementation . . . . . . . . . . . . . . . . . . . . . . . . . . . 334.3.1 Java classes used from Jgraphx . . . . . . . . . . . . . . . . . . . 344.3.2 Java classes from Palcom . . . . . . . . . . . . . . . . . . . . . . 344.3.3 Java classes created . . . . . . . . . . . . . . . . . . . . . . . . . 344.3.4 Xml to graph . . . . . . . . . . . . . . . . . . . . . . . . . . . . 364.3.5 Graph to xml . . . . . . . . . . . . . . . . . . . . . . . . . . . . 36
5 Evaluation 375.1 Overview . . . . . . . . . . . . . . . . . . . . . . . . . . . . . . . . . . 375.2 Create assembly . . . . . . . . . . . . . . . . . . . . . . . . . . . . . . . 39
5.2.1 The scenario setup . . . . . . . . . . . . . . . . . . . . . . . . . 395.2.2 Scenario experiment . . . . . . . . . . . . . . . . . . . . . . . . 40
6 Discussion 43
7 Future work 45
8 Conclusion 47
Bibliography 49
Appendix A Manual for describing the devices and their services 53
Appendix B Manual for describing BrowserGUI 55
6

Chapter 1Introduction
This chapter provides a brief introduction to our Master’s Thesis at Lund University. Wewill describe the problem and the background to our work. This chapter also presents howthe responsibilities were divided between the two authors to complete this Master’s Thesis.
Internet of Things (IoT) is a very hot topic worldwide and there are many and increas-ing devices that has enabled connectivity in all areas - industry, healthcare, private homesetc. (more information about this can be found in section 2.1). A system that enables allthese connected devices to communicate is required and currently there are some solutionsdeveloped for accomplishing these tasks. One of them is the PalCom system developed byuniversities for over 10 years. The PalCom project was initiated in 2004 and funded by theEuropean Commission, within the Society Technologies priority in the Sixth FrameworkProgramme, for four years [3]. After these four years PalCom has been funded and devel-oped mainly by Lund University consisting of professors, PhD students, Master’s Thesisstudents etc. The PalCom system has been designed with the end-user in mind, but thefocus of the implementation work has not yet been on these aspects and in particular amore intuitive GUI for end-user-composition was necessary. This has led to a GraphicalUser Interface (GUI) that is difficult to handle for people outside the PalCom developmentteam.
1.1 Problem statementPalCom is mainly handled by the professors and students developing the system. The im-plementation is in most cases not carried out by the people using it but rather by a PalComdeveloper. To open up the opportunity for other people, not the PalCom developers, to con-nect the devices and make them communicate with each other, one need to have a systemthat is easy to handle and to interact with.
There is also a problem for the PalCom developers when they make connections. Theproblem is the lack of an overview of what the connections look like when there is a system
7

1. Introduction
consisting of many devices. The developers often need to draw on paper how the systemworks since it is difficult to determine it by the current GUI.
The problem can be divided into two separate problems which require the same so-lution. Therefore, it is convenient in this case to do one master thesis for solving twoproblems.
1. It is difficult for non-technical users to create an assembly without a proper intro-duction.
2. It is impossible to get an overview of how devices are connected in a PalCom as-sembly.
Transforming these problems into questions that we will be answering with our thesiswill be:
• How can non-technical users create an assembly without a proper introduction?
• How can PalCom users get an overview of how devices are connected by applyingthe same solution as for the first question?
1.2 MethodIn this thesis similar editing tools and design approaches that can solve the stated prob-lems will be evaluated, see chapter 3. The implementation of the new developed editingtool during this thesis will then be based on the result of our previous evaluation. To fi-nally evaluate the new editor and compare it to the old solution an experiment of a smarthome scenario (see section 1.4.2) will be conducted. In the scenario experiment the timeefficiency of the new editor will be measured, i.e. if the new editor is more time efficientregarding users understanding how to create an assembly. In simple form the method willbe:
1. Evaluate similar tools
2. Implement a solution
3. Do an experiment on real test subjects with the two editors to see if problem 1 issolved
4. Evaluate and compare our editor with the old assembly editor to see if problem 2 issolved
1.3 Related workThere has been a previous overview browser [13] for PalCom but it is not compatible withthe current PalCom version, v3.1.12. This overview browser only solves one of the prob-lems, namely the problem for palcom developers to get an overview of the assembly. It isnevertheless possible to use this overview browser as a starting point in this thesis for solv-ing the problems. The thesis is highly dependent on the work in the doctoral dissertation
8

1.4 Approach
by David Svensson Fors[4]. His thesis dissertation provides all the required informationregarding the assemblies and all the functions that the GUI needs to support to be fullyfunctional for PalCom.
1.4 ApproachInitially the authors will commence by stripping down the current PalCom editor to get allthe parts that the new editor needs to support. To solve the problems the previous browsersolution, that enabled an overview, will be studied and on similar solutions used in othersystems that solves the stated problems. To get an understanding if the developed solutionin this thesis is better for non-technical users an experiment will be performed, see section1.4.1, on some random test persons.
1.4.1 Scenario experimentOne way to verify the work in this thesis and its improvement over the previous solutionis by applying some kind of measurement. The selected measurement that fulfills the re-quirements of this thesis is the amount of time it takes for the test subjects to accomplisha task, see section 1.4.2. The task will be conducted by the random test persons by us-ing both the previous editor and the new solution, followed by comparing the time resultsand lastly extracting an evaluation based on that. This will provide the conclusion if thereare any improvements and simplifications of the new editor. In comparison, by only con-ducting observations and interviews of random persons to receive data for evaluation isdifficult, due to the reasons that measuring feelings and thoughts can result in skewed andambiguous results.
1.4.2 Smart home scenarioInternet of Things is wide spread also in home appliances. There are Smart TV’s, con-nected refrigerators, connected light bulbs and much more. This is not what every homehas installed today, but the trend is going towards that every home will be connected. Inthe experiment conducted in this thesis, it will be shown how PalCom can be used in a realhome scenario with some connected devices. The scenario consists of:
• 40" Philips Smart TV [14]
• 2 Tellstick on/off switches [11]
• Linocell Bluetooth camera shutter [9]
• Regular lamp for the living room.
All the devices are going to be used according to their manufactured purpose, i.e. theTV is going to display a channel, the switch is going to turn on/off some lights etc. Oneexception is the Linocell camera shutter, which is a bluetooth device that is connected to asmart phone to take pictures remotely. This device will be used as a button to trigger someevent in your home.
9

1. Introduction
The scenario is as follows:You come home from work and have an hour to rest before you need to cook dinner.
This is something that you do everyday. When you enter your home you have a physicalbutton (Linocell device) on the wall near your kitchen and living room. When you pushbutton number 1 on the Linocell device a reaction is started in your home
• The light in the living room is turned off (if it was off from the beginning nothingwill happen).
• The TV in your living room is turned on and set to your favorite channel which isSVT2 in channel 2 (SVT1 is in channel 1 and TV4 is on channel 3).
After an hour you feel it is time to start making dinner. Then you leave the living roomand on your way to the kitchen you pass by that button that initialized the reaction earlier(started the TV, etc.). But this time you push button number 2, which causes anotherreaction in your home
• The TV is turned off.
• The light in the living room is turned on.
Now you have the energy to make dinner.
1.5 Work responsibilitiesThe two authors have been involved on all aspects within the scope of this thesis. Never-theless, a division of the main responsibilities and the parts where each has contributedthe most can be made following.
Vatan was responsible for the following parts
• Development
– Data structure for the new GUI– Function for creating Synthesized Services– Function for creating variables– Creating a service for the Bluetooth device
• Report
– Overall structure– Chapter 1 - Introduction– PalCom overview browser in 3.2– ABB Editor in 3.3– IFTTT in 3.4– Solution of services in 4.2
10

1.5 Work responsibilities
Jonas was responsible for the following parts
• Development
– Creating Graph manager, which can be divided in a backend and frontend part.– Connecting graph to the new assembly script– Creating a new service for TellStick– Creating services for the Philips TV
• Report
– Chapter 2 - Background– Assembly editor in 3.1– Graph implementation in 4.3
The following parts are where both have contributed equally and are equally responsi-ble of:
• Development
– Handling the scenario experiment
• Report
– Solution of PalCom editor 4.1– Evaluation– Discussion– Future work– Conclusion
11

1. Introduction
12

Chapter 2Background
This chapter will describe two major subjects in order to help the reader understand thecontents of this master’s thesis. The first subject to describe is Internet of Things (IoT) andwhat problems have emerged regarding this. The next subject is PalCom, which solves theproblems emerged with IoT. Two PalCom programs will be used in this thesis, TheThingand BrowserGUI. Therefore, a description of these two programs will be embraced in thischapter as well.
2.1 Internet of Things (IoT)The Internet of Things (IoT) is an expression that emerged during the time when RFIDwasgrowing as a technical field and RFID devices began to connect to the Internet in 1999[16]. IoT means that physical devices create a network with other devices so that theycan exchange data with each other. The possibility for many devices and sensors to senddata over the Internet opens up opportunities to create advanced distributed systems withmany different sensors/devices from different manufacturers. These networks of physicaldevices can react when things happens in the physical world and notify each other of thechanges to perform different tasks in tandem.
The problem, however, is that even though the devices can be connected to Internetand other networks, they are not constructed to communicate with each other. There mustbe a mutual protocol so that everyone understands how to communicate with the devices.
The applications of IoT can be in almost every field. When you have a network con-nected device with low CPU and power it can be made cheaply and portable to put any-where. The devices can be used to send data for monitoring natural ecosystems or evenbuildings and factories to help improve resource usage. IoT is used for environmentalmonitoring to assist in protection of water and air pollution by collecting data and send-ing it to a main controller. It is also used for infrastructure management in large cities toassist in traffic or warn about dangers in the area. Another growing area is in healthcare
13

2. Background
where IoT is used for monitoring a patient’s health remotely. The doctors simultaneouslyfollow a large sample of patients’ health conditions without forcing the patients to leavetheir homes.
Today we think of IoT also as Ambient Intelligence (AmI), even though AmI doesn’trequire any Internet connection. But we expect that our connected devices should be smartenough and together with other connected devices learn patterns and help us in our every-day life. This is a vision of the future in consumers electronics, telecommunications andcomputing. But this future is present, considering the vast amount of smart smoke detec-tors and alarm systems by NEST and others.
2.2 PalComPalCom is a system that tackles the problem that has emerged since IoT has become areality. PalCom is an abbreviation of Palpable Computing which is a concept for comput-ing that will make technologies a lot easier to understand, use and to construct on the fly.Palpable computing is about constructing IT that is easy to grasp, modify and understandalso for users that are not software developers.
PalCom began as a project from the European Union and was funded by the com-mission for four years [3]. After that it was continued by Lund University and is nowapplied in the areas within the academic world and in hospitals where different devices areconnected to monitor a patient’s health remotely. The remote monitoring in healthcare isan area growing rapidly within PalCom. Therefore, a separate project named itACiH[6]emerged to be able to fulfill the demands required within this area.
PalCom is now an open source architecture developed in Java for making differentdevices on different datatransferprotocols (bluetooth, IP etc.) to be able to understand eachother and communicate. The PalCom architecture creates an application layer for the usersso that all devices are represented equally even though they run in different protocols. Thisenables the users to only see the relevant part and make seamless integration of devices tobuild up their distributed system.
The core components in the PalCom architecture consists of:
Devices corresponds to physical hardware or software that are thought of as objects. Adevice has one or more services. They have a unique ID in the PalCom network andthe device will automatically be discovered when it is connected through its defaultnetwork connection (bluetooth, LAN, etc.).
Services have commands that can either receive or send. These are the commands thatare presented to the user so they can easily interact with the device.
Connections is the function that allows communication between services. If there is noconnection established between services on different devices there can’t be any com-munication.
Assemblies are user defined rules and actions that tells which services are connected andhow they should behave together. These are created as a script by using an XMLeditor or by using the Assembly Editor, see section 3.1. When you have created an
14

2.2 PalCom
assembly you need to load it into PalCom, this can be done with TheThing or withthe BrowserGUI.
2.2.1 TheThingTheThing is a middleware where users can load assemblies and stand-alone services.These are loaded as class files or jars and will then be available for users to interact withthrough the BrowserGUI 2.2.2. TheThing is a Java program with a GUI, see figure 2.1,and it will show up as a device in the PalCom network for other services to interact withit.
A very neat feature in PalCom is that it is possible to make two PalCom devices indifferent networks located in the opposite corner of the planet to be visible as if they wereon the same network. By creating an IP tunnel between TheThing and another TheThingor BrowserGUI it will be possible to call the services running on the different places seam-lessly.
Figure 2.1: TheThing running a service called "BluetoothBtnPal-ComService"
2.2.2 BrowserGUIThe BrowserGUI is a manager for creating a complete distributed system that is easy tograsp and overview. It is a java program that uses the Palcom system to find connected
15

2. Background
devices, run assemblies, create IP tunnels to other Palcom networks etc. The GUI can bedivided into three major parts:
Devices are shown as number 1 in figure 2.2. This area displays the current devices visiblein the PalCom network and their status. It is also possible to see what services thedevices are running and which commands that can be used for each service.
Assemblies are located at number 2 in figure 2.2. This area holds the scripts created withthis Browser and whether they are running or not. There can be multiple Browser-GUI’s in the PalCom network but it is not possible to see what assemblies the otherbrowser has created. The assemblies are stored locally and will show up every timewhen the BrowserGUI starts but an assembly can run on other PalCom devices aslong as the device has support for executing assemblies even if it hasn’t created it orcan’t create assemblies.
Assembly editor is located at number 3 in figure 2.2. This is where you will edit an as-sembly that you have created. Furthermore, this is the area which causes the definedproblems in our thesis. We will thoroughly explain the editor in the next chapter.
Figure 2.2: The BrowserGUI with three major parts; 1. Devices,2. Assemblies and 3. Assembly editor.
16

Chapter 3Previous work
In this chapter some existing tools will be described and in what way their design approachcan be used to solve the defined problems from chapter 1. The mentioned work here willset the base of the solution in the next chapter.
A definition of the main parts in the current assembly editor that the new solution needsto support will initially be presented. Followed by examining the old PalCom overviewBrowser and an ABB editor to see what can be useful to the new solution for solving thestated problems. Furthermore, the design approach (IfThisThenThat) will also be exam-ined in order to extract what can be useful for this thesis.
3.1 Assembly editorThe current PalCom editor will be stripped down in order to find some core parts that thenew editor also must support to be useful in real situations.
A Palcom Assembly is represented in XML format and is also managed and saved inthat format. The existing Assembly editor have two different ways to view an assembly.The assembly can be viewed as a tree, as seen in 3.1 , or directly as the underlying XMLcode as seen in fig 3.2. The tree view of the xml provides a better overview than the xmlview but the xml view provides more flexibility to the user. However, with the downsideof increased risk of error.
The assembly consists of five main parts; Devices, Services, Connections, Script andSynthesized Services as seen in fig 3.1.
3.1.1 DevicesThe device section of an assembly consists of every Palcom device that are to be used inthat assembly. It contains the name of the device as well as its device id. The underlyingXML for an example device has the following layout.
17

3. Previous work
Figure 3.1: An overview of an assembly’s tree view in the currentPalCom assembly editor
Figure 3.2: An overview of an assembly’s xml representation inthe current PalCom assembly editor
<DeviceDec l>< I d e n t i f i e r i d =" GeotaggerCamera " / >< i s t . palcom . r e s o u r c e . d e s c r i p t o r . Dev iceAddress >
<DID id =" C:43749ba6 −6495−4e9b−b028 −120374182845 " / >< / i s t . palcom . r e s o u r c e . d e s c r i p t o r . Dev iceAddress >
< / Dev iceDec l>
3.1.2 ServicesThe services node contains all services that are used in the assembly. Each used serviceis assigned a unique id within the assembly for references of the service in the connec-tions and eventhandler described later. The underlying XML layout for a service has thefollowing format:<Se r v i c eDe c l >
< I d e n t i f i e r i d =" s9 " / >< S i n g l e S e r v i c eD e c l r u i d =" f a l s e ">
< I d e n t i f i e r i d =" Photo " / ><DeviceUse>
18

3.1 Assembly editor
< I d e n t i f i e r i d =" GeotaggerCamera " / >< / DeviceUse><SIID i n =" 1 ">
<SID cd i d ="X:1 " cn="TF37 " ud id="X:1 " un="TF37 " / >< / SIID>
< / S i n g l e S e r v i c eD e c l >< / S e r v i c eDe c l >
3.1.3 ConnectionsIn the connections node all connections to the used services are set. The assembly needthe connections to enable communication to the corresponding service. A connection isalso assigned a unique id within the assembly like the services were. A connection has thefollowing XML layout.<Connec t i onDec l c i d =" conn−2">
<Se rv i c eUse >< I d e n t i f i e r i d =" s9 " / >
< / Se rv i c eUse ><Th i s S e r v i c e / >
< / Connec t i onDec l >
3.1.4 ScriptThe Script node contains variables that are used within the assembly as well as even-thandlers.
Script - VariableThe variable node inside script contains all the local variables which are to be used withinthis assembly. A variable holds a name and a type. The XML layout for a variable has thefollowing format:<Va r i a b l eDe c l t ype =" image / j p eg " i d e n t i f i e r =" imageVar " / >
Script - EventhandlersIn the handler node all event triggers are handled and it is defined what correspondingactions that should be triggered.
An event can be triggered by either a service from a device or a synthesized service(described later) within the assembly. The triggering command can contain zero or oneparameter. A trigger command has the following format:<CommandEvent commandName=" photoTaken ">
<Se rv i c eUse >< I d e n t i f i e r i d =" s9 " / >
< / Se rv i c eUse ><CmdI i d =" photoTaken " he l p =" S i g n a l s ␣ t h a t ␣a␣ pho to ␣was␣ t a k en " d i r e c t i o n
=" ou t " commandNumber=" 2 " / >< / CommandEvent>
19

3. Previous work
In this case it’s a trigger without a parameter from a service in a device. The other typeshave a slightly different appearance.
There are three types of actions that can be triggered from a commandevent. These arethe following:
• AssignAction that assigns a value on a variable from a parameter in the comman-devent. The AssignAction contains a variablename to be used as well as a parametername which refers to the parameter name from the triggering command.<Ass i gnAc t i on v a r i a b l eU s e =" imageVar " paramUse=" img " / >
• MessagAction which triggers a command on a service. MessageAction contains acommandname, a serviceid and optionally a ParamUse or VariableUse. Command-name refers to the command which should be triggered in the used service which inturn is refered by the internal service id in serviceUse. ParamUse or VariableUseis added if the command takes a parameter. ParamUse refers to the param from thetriggering command and VariableUse refers to a variable in the current assemblywhere the value will be fetched.<SendMessageAct ion command=" s t o r e P i c t u r e ">
<Se rv i c eUse >< I d e n t i f i e r i d =" s12 " / >
< / Se rv i c eUse ><ParamUse name=" img " / >
< / SendMessageAct ion>
• InvokeAction triggers a command on a synthesized service. InvokeAction is muchlike theMessageAction but is used for synthesized services instead of a service froma device. It contains a SynthesizedServiceUse which refers to a synthesized serviceand a command that refers to a command in that specific service. InvokeAction alsocontains an optional ParamUse or VariableUse that works exactly the same as abovein the MessageAction.< InvokeAc t i on command=" img " add r e s s i n gType=" ">
<Syn t h e s i z e dS e r v i c eU s e >< I d e n t i f i e r i d =" syn t h2 " / >
< / Syn t h e s i z e dS e r v i c eU s e ><Va r i ab l eUse name=" imageVar " / >
< / I nvokeAc t i on >
3.1.5 Synthesized ServicesThis section contains all synthesized services in this assembly. A synthesized service isa virtual service with its own commands which are defined by the assembly. The synthe-sized service contains an id, commands and groups which contains other groups and/orcommands. The xml layout for a synthesized service has the following layout:<Sy n t h e s i z e d S e r v i c e d i s t r i b u t i o n =" 1 " RemoteConnect=" f a l s e ">
<SD id =" syn t h2 " he l p =" "><CmdI i d =" img " he l p =" " d i r e c t i o n =" i n " commandNumber=" 1 ">
20

3.2 PalCom overview browser (OVB)
<PI i d =" image " he l p =" " t ype =" image / j p eg " da t aRe f =" 0 " / >< / CmdI>
< /SD>< / S y n t h e s i z e d S e r v i c e >
3.2 PalCom overview browser (OVB)A similar attempt, to obtain an overview of how the assemblies are set up and the con-nection between the devices, has been made previously. But it has not been made as aneditor for the assemblies but as an overview when all the assemblies are running [13]. Thisbrowser has not been continued and is unfortunately not compatible with the latest PalComversion, v3.1.12. However, a summary of it will be made in order to examine and selectthe parts that will be useful for the new editor.
The OVB focuses on bringing a subset of the overall system and the developing toolsfor PalCom to a user group that is non-technical. It allows users to inspect the topologyand some internal states of devices that are connected to the PalCom network. The browseritself is a PalCom device with an assembly manager that maintains one assembly. This as-sembly contains two services; Swing Display Service and a Visual BrowserAccomplice Service. These services will then provide the solution for updating thegraphics in OVB in real time. Figure 3.3 shows the graphical user interface of OVB andthe relationship between the services and the assembly that makes it possible for the OVBto work properly and update all the connections in real time.
Figure 3.4 shows the overview of one example where three devices are used; Myserver, My GPS, My camera. These device are then connected to My laptopthrough an assembly. The connected services on each device are shown by lines goingfrom one end to another. If one thinks of a workspace where there are objects on the tableand requires to connect these to each other, they could be wired together. This metaphor[12] can be used on the OVB as well where there are devices that are connected to eachother with some lines.
3.3 Control Builder Diagram Editor - ABBeditor
The Control Builder Diagram Editor[10], CBDE, is a tool used by ABB [1] for their ownproduct, AC 800M, which is a Programmable Automation Controller, PAC. A PAC is acontroller used in the process industry to handle digital, serial and analog signals fromdifferent industrial applications and then process that data into some PID algorithm tocontrol some process in the manufacturing line. The same hardware can also be used inother fields and not just for process control, but for collecting data, remote monitoring etc.
A PAC uses standard open protocols such as Ethernet to communicate with the differ-ent applications. Ethernet is something most enterprise computer have support for. Thismakes it easy for PACs to be integrated in already running systems.
The editor that ABB has for their PAC is a GUI running on Windows. This GUI isused to create and monitor control systems for the process industry. Moreover, the editor
21

3. Previous work
Figure 3.3: The overview browser showing the topology ofthe OVB device. It shows how the Swing Display Service andBrowser Accomplice Service are connected through an assembly,VizBrowser3
uses Block Diagram[17] that represents the different functions and algorithms as blocksand the relationship to other blocks are represented by lines through the ports that can goin or out, see figure 3.5.
The diagram editor has a workspace on which users can drag and drop objects. Userscan drop the same object multiple times on the workspace to arrange interconnectivityamong objects and each object on the workspace can show different ports going in or outto save space and make it easier to understand. See figure 3.6 that shows how the samedevice is displayed on two blocks and with different ports visible.
3.4 If This Then That (IFTTT)If This Then That (IFTTT) is a design approach that simplifies for non-programmers todo chains of conditional statements. This is similar to an IF-statement in all commonprogramming languages. Today IFTTT is widely used in mobile applications were therecan be a web services that connect other services on your smart phone to do tasks whensome event occurs, e.g. If I post a picture on Instagram, save the photo on Dropbox asseen in fig 3.7.
22

3.4 If This Then That (IFTTT)
Figure 3.4: The overview browser showing an example of threedevices (My server, My GPS, My camera) in the PalCom net-work connected through one assembly running on another com-puter (My laptop).
Figure 3.5: ABB editor with Block Diagram where relationshipbetween blocks are represented by lines.
In the current PalCom editor we have the same conceptual model where services andcommands on services are triggeredwhen some condition is met in a state. Instead of usingan IF-statement, which tells us that it may or it may not happen, the PalCom assemblyeditor uses a When-statement, which tells us when the condition is met to do somethingand as result invokes some action. These actions are managed by the assembly editor andsome parallels can be drawn between IFTTT and the contents of the assemblies. The THISpart in IFTTT is the same as the triggering event in the assembly and THAT corresponds
23

3. Previous work
Figure 3.6: Two blocks for the same device but with differentports that are visible.
Figure 3.7: If This Then That example where instagram photosgets saved to dropbox.
to the actions which in Palcom can contain multiple actions instead of single one as inIFTTT.
24
Chapter 4New assembly editor withimplementation
In this chapter the emerged new solutionwill be presented, as a result from the observationsin the previous chapter. A description of the features of the final solution is set out, togetherwith the reason behind the made design choices.
Furthermore, a detailed description is provided on how the converting from a regu-lar XML description of an assembly to a graph representation in our editor is done andvice versa. This detailed description will be helpful when future research is conducted onimprovements of the new solution.
4.1 Assembly editorThe new solution must solve both of the defined problems, laid out in the beginning of thisthesis:
1. It is difficult for non-technical users to create an assembly without a proper intro-duction.
2. It is impossible to derive an overview of how devices are connected in a PalComassembly.
To make it easier to create an overview of how the services are connected with eachother, i.e. solving the second problem, a solution that behaved like the OVB is intended.The OVB has been used in previous PalCom versions and has fulfilled its purpose.
To solve the first problem a conceptual model of how people would think when con-necting different devices with each other had to be created. The conceptual model that wasused in the OVB and ABB editor follows the natural description. By using a workspace
25

4. New assembly editor with implementation
with devices as objects and allow users to drag lines between commands, thus creating anexperience close to the real world.
The functionality that the previous assembly editor had was taken in considerationwhilst the new solution emerged. This resulted in a GUI, see figure 4.1, consisting ofthree major parts:
• The workspace
• Variable handler
• Synthesized service handler
These will be explained in detail further on.
Figure 4.1: Our solution for editing assemblies and obtaining anoverview of the connections. Section 1 contains the Variable han-dler. Section 2 is the workspace to make connections. Section 3is the handler for synthesized services
4.1.1 The workspaceThe whole solution was thought of as a workspace area where the user grabs devices anddrops them on theworkspace to establish interconnectivity. This enables a natural mappingto a real physical workspace, where you have your physical devices and connect cords inbetween to make some sort of connection. In this new solution the connection between aservice inside a device to another service on anther device was made by simply dragging
26

4.1 Assembly editor
a symbol from one command to another. This results in a better and simplified overviewof the complete system, compared to the existing solution where it is difficult to see howthe system is connected when there are many devices.
By dragging the devices, variables or synthesized services on the drop area a graphobject will be created and displayed on the workspace. Because of limitations in the soft-ware and libraries a specific drop area had to be used for the objects, see figure 4.2. Thisis less intuitive compared to having the whole workspace as a drop area. All the deviceswill begin by not showing any service and the users will have to press the + sign to seeall the available services. The users then choose which services they need to use in thisassembly and all the commands will then be displayed in that graph object.
Figure 4.2: Drag device and drop them on the grey marked areawhere it says drop device, variable or SS here. All the deviceshave their services hidden and the user needs to press the + signto choose which services to display.
All the commands that go in to a service are on the left side of the object and all thecommands that go out are on the right side of the object. Each command is displayed witha name and a circle with a specific color of what type of parameter that command canobtain or send out (the color description can be found in 4.1.2). To connect a commandthat goes out from a service to another command that goes in, the user drags the circlefrom out command to in command. See figure 4.3 of how two devices are connected toeach other. If the connection is supported (the parameters are of the same type) a line willbe fixed between those commands, otherwise no line will be fixed and the circle will bemarked with a red border to indicate that this connection cannot be made.
We have three different objects that can be on the workspace; Devices, SynthesizedServices and Variables. To identify an object on the workspace, their name is displayedon top in bold and each object type has also their specific color. This helps the user tobe able perceive a quicker overview and separate the devices from synthesized servicesand variables. If a device is not available in the network, but it is used in the assembly, itwill be displayed as a dark graph object whilst as all the commands and connections stillremain on the workspace. See figure 4.4 for an overview of these types.
A variable has three different commands, see figure 4.5. Two of them that goes inare set variable and get variable and one that goes out is variable. Theset variable is used to set a value and the get variable is used to trigger whensomething happens get this variable and send it to some other command. The command
27

4. New assembly editor with implementation
Figure 4.3: This shows how the AxisCamera has three differentservices visible and that it sends a photo from its photo commandto the store command on the Server, which only has one serviceavailable, Photo DB
Figure 4.4: This shows how graph objects display different colorsdepending of their type. From left is a Camera device that is notavailable on the network but used in the assembly. On top, is anobject that is a variable with the name message. On the bottom, isan object that is a synthesized service named SS. In addition thereis an AxisCamera device and last a Server device.
variable that goes out will only get the value of the variable and pass it over to acommand.
JgraphXThe workspace could be created by either developing a new graph tool or by using an ex-isting tool. The latter was chosen due to the time to create a custom graph tool would be toimmense to fit within this thesis. After trying out several different graph visualisation li-braries (JGraphT, JGraphX), the JGraphX[5] was chosen since it provides the best supportand documentation and is the one which was updated most recently. JGraphX is a JavaSwing graph visualisation library which is platform independent as well as open source
28

4.1 Assembly editor
Figure 4.5: This shows what a variable looks like when it is dis-played on the workspace. The three commands can be used to setand get the variable.
licensed under the BSD license. It is a library for visualizing and interacting node-edgegraphs by creating graph objects and adding coordinates for them to place them on theworkspace. It supports many default functions for visualizing different blocks and con-nections. Our solution is highly dependent on this library and we have had the ability tocustomize it for our purposes.
4.1.2 Variable handlerThis area of the GUI, see figure 4.6, is required to make the variables that are used in anassembly. A variable consists of a name and a type (like in a programming language). Wehave defined some standard mime types that are used regularly in services and colorizedthese in different groups.
• Image types are colored from the blue spectrum
• text types are from black/white area
• audio types are in green
• video types are in red/purple.
When a type, which is not defined in the standard list is used, a random color will bepicked. The predefined color description is always available in the variable area to helpusers understand what the colors are used for. When a new variable is created it will getassigned a color that is defined in the mentioned list. To use a variable (to assign it a valueand read it) the user drags it from the list and drops it on the workspace.
To assign a value to a variable users will only drag the symbol from a service to thevariable. Then that service output will be assigned to that variable.
4.1.3 Synthesized service handlerThe Synthesized Service handler, figure 4.7, is very similar to the Variable handler regard-ing the design. The SS handler is also hidden initially not to confuse the user with to muchfunctions and buttons. These synthesized services are also more likely to be used by themore advanced user and therefore does not need to be visible initially.
29

4. New assembly editor with implementation
Figure 4.6: The variables are hidden and displayed by clickingthe big variable bar. A description of what the colors mean andthe ability to create a variable for later use in the workspace canbe found here.
The handler consists of a list where all the created SS are available for that assemblyand a button where the user can create new synthesized services. An SS can be verycomplex since it can have many commands in a deep tree structure and this is solved bycreating an object of an SS that contains the same structure as the previous browser so thatthe more advance users will feel familiar with the new design.
To use an synthesized service the same approach as in the previous areas has beenfollowed, where the user drags and drops things to the workspace to make the connections.This is also done with the SS and when a user drops the service on the workspace theywill see the available commands for that service and initiate the connections.
Figure 4.7: The services are hidden and displayed by clicking theSynthesized Service bar. Here it is possible to create new services.The layout of a service is similar to the previous assembly editorwhere a tree structure is used.
4.2 ServicesTo use the devices that were required according to the scenario, they were initially intro-duced to the Palcom network since they are not directly built for this. A service controllerfor Philips TVs and a service for the Linocell shutter device was created. The services for
30

4.2 Services
Tellstick were imported from a previous project, with a minor modification to simplify itfor the users when conducting the experiment.
4.2.1 Philips TV serviceThis PalCom service can handle multiple Philips TVs, but to add a Philips TV one has todo this manually with the controller since the service does not support automatic discoveryof Philips TVs. The controller has three methods that can be invoked:
Add TV takes in an IP as a parameter and then adds that Philips TV that is referred bythe IP.
Remove TV takes in an IP as a parameter and removes that Philips TV that is referred bythat IP.
List all TVs lists all the Philips TVs that has been added.
All the added TVs will then be displayed on the network as separate devices withunique DeviceIDs consisting of their IP. To use the Philips controller service one has toload the jar-file into TheThing that will run the service. All the added TVs will be storedin the file system so that every time TheThing is started all the TV devices will appear onthe network.
The Philips devices that are automatically created by the controller have the followingcommands that can be invoked:
• Favorite channel 1
• Favorite channel 2
• Favorite channel 3
• Favorite channel 4
These commands will set the TV on the specific favorite channel.
4.2.2 Tellstick serviceThis service consists of a controller service that will find different tellstick devices (justlike the Philips service). It is loaded by adding the jar into the TheThing that will run theservice. To add devices the tellstick manual[2] has to be followed.
The difference from the previous tellstick service is that when a tellstick device isvisible it will not show up as a service in TheThing but a separate device will be displayedon the network just like the Philips TV. This will simplify it for the users in the scenarioexperiment since they will see every tellstick device as a separate device in the network andnot as services under TheThing. In figure 4.8 the difference of the result that our changesmade is visualized. The left view is the old tellstick service and the right view is the newone.
The tellstick devices have many commands but the ones of interest are:
31

4. New assembly editor with implementation
Figure 4.8: The old tellstick service added each tellstick deviceas a service in TheThing. The new service creates each device asa separate PalCom device
• turn on
• turn off
These are the only commands that will be used in the scenario experiment for the twotellstick switches.
4.2.3 Linocell bluetooth camera shutter serviceThis is a single Bluetooth service that will interact with a Linocell Bluetooth camera shut-ter. It is loaded by inserting the jar-file into TheThing that will run the service. The camerashutter is then displayed as a service under TheThing that is running its service. Due toproblems with paring bluetooth devices in the service, the service had to be made to listenon key presses on the keyboard since the operating system running TheThing did connectthe camera shutter as a bluetooth keyboard. In other words the camera shutter service waslistening for the key presses Return and Volume_up and when the camera shutter wasnot connected to bluetooth the service would be unavailable in PalCom.
The service has two commands that go outwards:
• button1pressed
• button2pressed
32

4.3 Graph implementation
These are the event triggering commands that will be listened in our scenario.
4.3 Graph implementationIn this section it will be described how the editor is built and how the different java-classesare dependent of each other to help any future developer that is going to make any im-provements. Figure 4.9 shows an overview of the classes in this solution.
Figure 4.9: An overview of the java classes used for the graph im-plementation. The gray ones already existed in Palcom, blue onescome from the Jgraphx library and the white ones were created forthis solution.
33

4. New assembly editor with implementation
4.3.1 Java classes used from JgraphxmxGraph The graph which AssemblyGraph extends. It represents the graph that is ren-
dered in the workspace and manages all interactions with the graph.
mxCell Represents a single object in the mxGraph. A device, service, command andcommand-connection are all represented in the GUI by a mxCell.
4.3.2 Java classes from PalcomThe following existing classes in Palcom were used or modified to support the graph im-plementation.
AddSynthServiceDialog This class was modified so it has support for opening the dialogwindow for adding synthesized services in the graph editor as well.
AssemblyPanel One of the main classes for the complete assembly editor. This classhandles all the switching from the graph editor to the tree editor and to XML view.
4.3.3 Java classes createdThe following classes were created to add the graph functionality to the assembly editor.Each class has a short description of its purpose. The UML over the classes can be seenin fig 4.9
AssemblyGraphTransferHandler This class handles the drag and drops from the pal-com tree containing all available devices. It passes the object on to the GraphEditorwhich in turn adds it to the graph.
AssemblyGraph This class extends the mxGraph from the jgraphx package. It holds allgraph information printed in the workspace, devices, variables, synthesized servicesand events between these. AssemblyGraph also contains an important method thattranslates a palcom assembly from a xml string to a graph object with all nodes andconnections belonging to it.
CellConnection A cellconnection is a connection in the graph and represents an eventin the Palcom assembly. This object is used within the AssemblyGraph to createa connection between two nodes in the graph from the event parsed from the xmlstring.
GraphDevice A GraphDevice is a graph representation of a Device or a Synthesized ser-vice. It holds the graph object displayed in the GUI as well as a root Node containingthe Service(s) in the device/synthesized service. This object is rendered differentlywhen it’s a synthesized service or an online device or an offline device with somecolor variation. GraphDevice objects are created from the GraphEditor when a userdrags a device or synthesized service into the drop area of the workspace. Theyare also created when AssemblyGraph are parsing the used devices and synthesizedservices from the xml string.
34

4.3 Graph implementation
Node The Node object are stored inside a GraphDevice object and contain nested Nodesas well as in and out commands. They are the same as a PalCom service. Thus,containing AbstractServiceDecl as well as the assemblies service id.
Command A command is a representation of a Palcom command and is either an in orout command. They are stored inside the Node objects corresponding to the servicewhich the Palcom-command belongs to. These are the objects which the user dragslines in between to create an event. Commands are created when a Device’s serviceis displayed from the add menu or when an assembly is loaded in AssemblyGraphbetween the different events.
GraphDeviceView GraphDeviceView is used to render a popup menu where the user canselect some options. It is used when the user wants to add more services from adevice by clicking on the + button inside the device in the graph GUI or when rightclicking a service or device to remove them from the graph GUI.
GraphEditor The GraphEditor class is the hub of the graph GUI. The interactions be-tween the graph GUI and PalCom are all passed through this class. It contains allobjects which are rendered inside the graph as well as the variables and synthesizedservices inside the current assembly. It manages what colors are to be used for theknown and unknown connection types. It creates all objects that needs to exist forthe graph to be rendered which includes AssemblyGraph, GraphDeviceView andthe panels for management of variables and synthesized services. It creates deviceswhen a user drags them into the drop area as well as services and connections thatthe user wants to add. Lastly it creates the XML representation of the graph neededwhen changing tabs of the assemblymanager.
GraphObjectPositioning This class contains the positioning data for the GraphDeviceand GraphVariable objects. The data is saved in a new file beside the original assem-bly file to reduce the chance of error if opened in an older version. When opening anold assembly lacking this information a counter is used to render the graph objectson different positions to simplify reading.
GraphObjectsHandler This class is used to parse and create the xml string for all Gra-phObjectPositioning objects. It contains all current position for the graph objects.GraphObjectsHandler is initiated from the AssemblyPanel of Palcom before theGraphEditor object is created.
GraphSynthServiceMenus This class is used to create popup menus for the differentparts in each tree node when creating a synthesized service.
GraphSynthServicePanel This is a JPanel for handling the synthesized services on theGUI.
GraphVariablePanel This is a JPanel for handling the variables on the GUI.
35

4. New assembly editor with implementation
4.3.4 Xml to graphThe parsing from the xml-string to a graph is done inside the GraphHandler object. Theparsing is done from an existing method parseAssembly inside the class OldschoolAssem-blyLoader. The .assgraph file (which holds all the positions of every object on theworkspace)is also parsed containing all devices, synthesized services and variables positions in thegraph. The parser first retrieves all devices and for each one of them searches the PalComnetwork if the device is online and adds it as a flag to the GraphDevice objects. If thedevice is offline the whole assembly is iterated for all used services and connections forthis device. Otherwise, the device is added the same way as when a user drags it into thedroparea with the additional position information.
The variables are iterated through and if it has a position information from the .assgraphfile it’s added to the graph workspace.
The services are all iterated and added to a list containing all services that are going tobe extended inside the graph GUI.
All synthesized services are looped through and just like the variables, added to thegraph GUI if they have position data from the .assgraph file.
Last the events are iterated. The events consist of a command event that is the triggerand one or more actions. The graph will create a line from the command event to eachof the actions unless the action uses a value from a variable. If that is the case a line isdrawn to the get variable command on a variable and then another is drawn fromthe variable output to the action.
4.3.5 Graph to xmlThe generation of the xml-string from the graph workspace is done inside the GraphEditorobject. It loops through the variables and synthesized services from the respective panelsand adds them to the PRDAssemblyVer object. PRDAssemblyVer is a representationof an assembly that can directly be saved as a xml string. For every device shown in thegraph workspace they are added to the assemblies devices. For every extended node (akaservice) the service is added to the assembly. For every command in the node that have aconnection to another command, an event is createdwith a command event in the assembly.This also creates a connection for each service used. For every action which points to getvariable on a variable an action event is created for each command connected to thevariable output from that variable.
36

Chapter 5Evaluation
In this chapter we will evaluate the solution described in the previous chapter. The ques-tions that needed to be answered in the theses were:
• How can non-technical users create an assembly without a proper introduction?
• How can PalCom users get an overview of how devices are connected in a PalComassembly with the same solutions as in first question?
The chapter will begin by discussing how the solution answered the second question (get-ting an overview). This is due to the fact that to solve both of the problems with the samesolution - a solution to the second question must be found first.
To evaluate the solution regarding question one an experiment with the two editors willbe performed on users who have never used PalCom and don’t know how the editors work.This is the user group that are not PalCom developers. Thus, it will be an evaluation tosee if the first problem is solved. At first we will describe the setup of the experiment andthen an evaluation on the findings will be conducted.
5.1 OverviewThe assemblies are created by dragging and dropping devices on the workspace and thealtered solution is able to load already created assembly scripts to the workspace and dis-play the devices accordingly as if the assembly was created by the new editor. This meansthat support also is provided for already created scripts to be displayed in the new editor.The connections are represented by a line between the two services that are communicat-ing and the users only need to drag from one command to another to make a connection.This is very similar to getting an overview with the OVB and the ABB editor since it isvery intuitive for the users. A difference of the OVB compared to the new solution is thatit shows in detail what is connected in the assembly. The OVB displays that some services
37

5. Evaluation
are connected to an assembly but not in which way and what commands are used to ac-complish this. The new solution displays the devices inside an assembly while the OVBdisplays the devices outside the assembly but connected with lines. This implies that thesolution gives an overview of the assembly itself while the OVB gives an overview of howdevices are used in the PalCom network, regardless of one specific assembly.
In ITTT it is easy for users to define what they want to do when some event occursbut the problem is getting an overview. The current PalCom editor uses some kind ofITTT design but it has been shown not to be sufficient for the more advanced PalComusers when they create larger and more complicated connections. Therefore, this solutionis only based on Block Diagram [17] as in the ABB editor.
To not overwhelm the users with all the device specific data and their services, thesolution uses visibility of different parts to be highlighted when they are interesting for theuser.
• The users decide which services a device uses and not all of them are directly dis-played.
• The manager for handling variables is only visible when the users want it to bevisible and same is valid for the synthesized service handler.
This provides an overview of what is actually used in an assembly and does not show thecomplete available information contained in that assembly. Like the ABB editor this isvery good for the users and the difference from the new solution compared to the ABBeditor is that the users choose which services they wish to display whilst in ABB theychoose exactly which commands/ports because their objects can’t be divided into servicesor groups. A solution where the users had to choose services instead of commands waschosen, because a device can have many services containing commands with the samenames. This would be confusing for the end-user.
The devices in theABB editor can be displayedmultiple times as objects in theworkspace.But in the new solution one can drag the device into the workspace only once because thisis more intuitive for the users that one can’t copy a physical device and say that it is equalto the other copy. In the ABB editor they choose to have the ability of multiple copiesof the same device because it can simplify the overview of the connections. If there areseveral connections going from one device to several other devices it can be favorable todivide the device into two objects so the lines don’t cross all over the workspace.
Another improvement to obtain a faster overview of what exactly is happening in theassembly is by using different shapes and colors. In the new solution all the objects arerectangular like a class diagram in UML [8] and all the commands are circles with differentcolors that tells what type they return or need as parameter. With this, one can get a quickoverview of which commands can interact with each other. In the ABB editor the sameconcept is used with Block Diagram and different colors for the type of objects. In contrastthey haven’t chosen to use different colors in the ports that can communicate with eachother. This requires more knowledge from the user where he must know what connectionscan go where instead of assigning the tool to handle that. In the long term by assigningthe tool to handle the connections, it reduces the risk for conducting any errors.
38

5.2 Create assembly
5.2 Create assemblyBy conducting the experiment on persons with no previous experience of PalCom, data isobtained to answer if the new solution works for question 1. An experiment on test personswho had to try both of the editors was conducted. First the test persons began with oneeditor to accomplish the task and when they felt done they switched to the other editorwhere they had to accomplish the same task again. Both of the accomplishments weretimed and the results provided two types of data:
1. Data for how long it takes to accomplish the task with each editor
2. Data for how long it takes to go from editor 1 to editor 2 and vice versa, from editor2 to editor 1.
This data enables evaluation over the editors with two different approaches which is moreaccurate than only using one.
5.2.1 The scenario setupThe same computer with the same screen resolution on all our tests was used. All thedevices and their services were thoroughly explained, see appendix A. The test subjectshad time to familiarize with the physical devices prior the experiment began so that they feltcomfortable with everything. In addition, this gave all the test subjects the same startingpoint, none having more necessary information than the other to carry out the test.
When they felt comfortable with the hardware the Palcom Browser was explained.Only the common parts of the solution and the current GUI was explained so that themeasurements only involved the different GUIs and not the complete PalCom system, seeappendix B for the description.
Lastly the scenario 1.4.2 that they had to accomplish with the introduced devices andbrowser was explained. A test subject was first instructed to only use either the new so-lution or the current one. Then the test subject had to accomplish the same task with theother editor as well.
Before the tests began, all devices were properly inspected and assuring they wereconnected and functioning.
An internal PalCom network was created, disabling other devices to appear during thetest in order not to confuse the test subjects. Two computers were used to perform thescenario, with the reason that the bluetooth device was not functioning properly on thecomputer where everything was run. See figure 5.1 for an overview of the connections.
Computer 1 was aMacBook. This computer ran TheThingwith the PhilipsControllerSer-vice and TellstickControllerService and the BrowserGUI. This is the computer thatthe test subjects used to edit the assemblies.
Computer 2 was a Windows and it was running TheThing with a bluetooth service forthe buttons.
39

5. Evaluation
Figure 5.1: The overview of how all the devices to create the Pal-Com network were set up.
5.2.2 Scenario experimentThe experiment was conducted on three different users U1-U3. This was sufficient forspotting the most problematic usability problems, but to few for collecting any metrics.The most usability problems will emerge after five tests[7] but since we did see a patternalready after three we choose not to continue with more tests.
The results in table 5.1 show how long it took for each user to accomplish the task withthe different editors. Two users, U1 and U3, did the experiment by starting with the neweditor. All of them, U1-U3, failed running a working assembly when they felt done withthe task using the previous editor. The reason why not a single user managed to create aworking assembly was because they all forgot to add the services inside the connectionsdirectory. This is a step that one can’t figure out by himself and further explanation isrequired. Only by using this statement, that not a single assembly could run using theprevious editor and all the assemblies did function properly using the new solution, isenough to draw the conclusion that the new editor does solve problem one. In all the testcases the timer was stopped when the user felt that the scenario was completed.
The results clearly indicate that the time it takes to create the assembly to accomplishthe task is faster with the new editor by all the users regardless if they began testing the new
40

5.2 Create assembly
editor first or not. One can argue that if the test begins with one editor the other editor willhave a slightly greater advantage since the user already knows how to use the completeBrowserGUI. Thus, it can be argued that it will go faster to finalize the test. This can bethe case here but it does not affect the result, since the test was performed significantlyfaster with the new solution regardless of starting editor.
The time difference between the users when using the new editor is mainly due to howfast the user understood that they had to drag the devices onto the special drop area inthe workspace. When this was known to the testers they all took about the same time tocomplete the scenario.
Besides the fact that the users didn’t manage to create a functioning assembly with theprevious editor we think the editor performed well also for users that had not used PalCombefore. It uses a similar method to ITTT (with some modifications) and people seems tobe comfortable with that kind of thinking and solved it better than was initially anticipated.
Table 5.1: Result of the measured times in minutes for accom-plishing the task.(S = started with this editor, F = Failed running aworking assembly which the user considered was completed)
User new solution previous editorU1 10:23 (S) 15:05 (F)U2 2:53 11:52 (SF)U3 5:57 (S) 12:32 (F)
41

5. Evaluation
42

Chapter 6Discussion
This chapter will be discussing the findings, if the study can be carried out in some otherway and if the conclusions can be altered differently using the same result but with adifferent approach.
The approach was to observe previous editors to obtain what is useful to be includedin the new solution for solving the problems. To evaluate the solution an experiment onthree test persons was conducted. The test was a scenario that required to be solved withPalcom.
Considering another approach for getting an overview browser, by doing a research incognitive science instead, could result in ending up having a completely different solutionif the previous editors that we observed didn’t follow any of the design principles of DonaldA. Norman [12] or the gestalt laws of perceptual organization[15]. Fortunately as the newsolution was developed, the principles ofmapping and consistency and the design laws re-garding similarity, proximity and symmetrywere taken into consideration. Nevertheless, itwould be very interesting to conduct an evaluation completely based on interaction designin cognitive science to see if it fulfills the requirements for human interaction.
To obtain an overview based on the previous browsers required thorough understandingof them. What can be discussed here is that we didn’t have the actual tools to feel and test,but we did get an understanding of them based on the images and text descriptions thatwere available. To actually get an understanding of the user experience whilst using thesetools it is better to have the physical product for testing, but in our case we could get most ofthe information we needed from the images because our user experience was not focusedon e.g. how smooth a transaction is when moving an object from one area to another. Wewere more interested in the final view rather than the style effects in between.
For the experiment only three test persons were used. This can thus only result in con-clusions that are not comparable but only indicative. The scenario can also be discussedsince it is adapted for a smart home that is not complicated. The users had one devicewith two buttons that triggered some simple events like turn on/off some switch. Whatif the scenario included some further steps that triggered other events in a smart home,
43

6. Discussion
e.g. when one enters the home the light turn on, but only if it is dark outside, and turnon the TV but only if it isn’t weekend because weekends one listens to music through themusic system and play video game on the TV. Nevertheless, the target in the scenario werepeople who haven’t used Palcom before and they will most likely not begin with creatingcomplicated assemblies immediately.
Can the scenario be conducted in another field beside a smart home? What if thescenario was something commonly occurring in healthcare and where PalCom currentlyis being applied? The solution should be field independent just as the current editor is(which the solution is based on). This implies that it shouldn’t affect a user that is going touse it for a smart home nor a doctor or nurse that is going to use it in health care. It wouldhowever be interesting to use a scenario in the field of health care with the appropriateusers to see if the results will be the same.
44

Chapter 7Future work
The solution to the PalCom editor is convenient to be used when editing an assembly toobtain an overview of that particular setup. But what if one requires an overview of all theconnections of the complete system that contains many assemblies and many services con-nected to each other? This is something that is currently not possible with the developedsolution. However, it can be implemented by using the same GUI. Instead of loading theassembly script for editing, the assemblies that are running at the moment can be loaded.Editing in this mode will not be possible since it will only show the current running stateof the system. This can also be taken a step further to help the PalCom users in debuggingthe connection in the running mode. To visually show the user how the data is sent in realtime from one service to another can help them debug when an assembly is not workingproperly.
This paper can also be evaluated through another perspective. In this thesis the so-lution has been conducted based on similar graphical interfaces and evaluated with anexperiment. The research could be carried forward by the department of Design Sciencesand they could do further improvements regarding the interaction design. They could lookat guidelines for proper user interfaces and apply them to the Palcom assembly editor andperhaps ascertain why the ABB editor doesn’t use multiple colors and how to handle userdisabilities such as color blindness in the editor.
It would be interesting to test a different scenario where more advanced PalCom userswould have to create an assembly which consist of variables and synthesized services aswell to see if this also is simplified.
Further work to be implemented in our editor that the previous editor does support are:
• Disconnected devices should be cached so all their commands are visible even thoughthey are offline.
• Make self. Function so that a service can be found on the running device withoutspecifying exactly which device.
45

7. Future work
• Set constants to variables. Our solution can only set a variable by getting the returnparameter from another command, sometimes a user needs to set a constant (userdefined value) in the variable.
• A command can have multiple parameters. Our solution is only a proof of concept,thus only one parameter was implemented.
46

Chapter 8Conclusion
IoT is a topic growing widely and there is an increasing amount of devices connected innetworks each day. This implies that an increasing amount of users will get in touch witha system that combines all these devices and enables them to communicate. PalCom issuch a system, and some of the users will have to do combinations themselves. It is thenparamount that they can use such a system without being a professional user.
This thesis solved such a problem for PalCom. By observing similar tools and designapproaches and then create a new assembly editor that was based on Block Diagram. Thenew solution was much more intuitive for new users and gave a better overview of theassemblies for the professional users. By conducting an experiment where the test subjectshad to use the new solution and the previous editor it can be concluded that it has been asignificant improvement, especially in making the users feel comfortable and understandwhat they are doing with the editor. There can be done further work in improving thenewly developed editor by focusing completely in user interaction and improve those partsto make it even better. Our editor isn’t complete for usage in real applications since itis lacking some functions. But the core design and functionality is there and it has beentested on a few users and the experiment indicates that the new editor performs better.
A next step for this editor can be to make it more useful in debugging in real time.When an assembly is running it is not possible to see exactly what and when something ishappening through the user interface.
47

8. Conclusion
48

Bibliography
[1] ABB. Power and productivity for a better world. http://www.abb.se/, 2015.Accessed: 2015-08-31.
[2] Boris Magnusson, John Lindholm. Tellstick to palcom bridge users man-ual. http://palcom.cs.lth.se/Palcom/Users_Manuals_files/tellstick-users-manual-3.0.14.pdf, 2012. Accessed: 2015-08-31.
[3] European Comission. Community research and development service (cordis).http://cordis.europa.eu/project/rcn/74625_en.html, 2008.Accessed: 2015-08-31.
[4] David Svensson Fors. Assemblies of Pervasive Services. PhD thesis, LundUniversity,2009.
[5] Gaudenz Alder. Jgraphx on github. https://github.com/jgraph/jgraphx, 2008. Accessed: 2015-08-31.
[6] itACih. It-stöd för avancerad cancervård i hemmet. http://itacih.cs.lth.se/itACiH/itACiH.html, 2015. Accessed: 2015-08-31.
[7] Jakob Nielsen. How many test users in a usability study? http://www.nngroup.com/articles/how-many-test-users/, 2012. Accessed:2015-08-31.
[8] Lennart Andersson, Datavetenskap, LTH. Uml-syntax. http://fileadmin.cs.lth.se/cs/Education/EDAF10/documents/umlsyntax.pdf,2013. Accessed: 2015-08-31.
[9] Linocell. Bluetooth camera shutter selfie remote. http://www.kjell.com/sortiment/telefoni-kommunikation/mobiltelefon-tillbehor/gadgets/selfie-tillbehor/linocell-bluetooth-fjarrutlosare-for-foto-p96117, 2015. Accessed: 2015-08-31.
49

BIBLIOGRAPHY
[10] Mikael Steiner, Product Group Extended Automation, ABB. The controlbuilder diagram editor. https://library.e.abb.com/public/2806d5e53b87725cc1257b55001f08fd/3BSE074022_en_2013-Apr_NEU_Partner_Day_-_Diagram_Editor_oversikt.pdf, 2013.Accessed: 2015-08-31.
[11] Nexa. Nexa tellstick on/off switch. http://www.nexa.se/vara-produkter/system-nexa/paket/eycr-2, 2015. Accessed: 2015-08-31.
[12] Donald A Norman. The Design of Everyday Things. Basic Books, 2002.
[13] Peter Andersen (ed.), Simon Bo Larsen (ed.). PalCom External Report #70: Devel-oper’s Companion. 2009. IST-002057 PalCom.
[14] Philips. Philips smart tv - 40pfs6909. http://www.philips.se/c-p/40PFS6909_12/6900-series-ultratunn-smart-led-tv-med-full-hd-2-sidig-ambilight-och-smart-tv, 2015. Accessed:2015-08-31.
[15] Soegaard, Mads. Gestalt principles of form perception. https://www.interaction-design.org/encyclopedia/gestalt_principles_of_form_perception.html, 2015. Accessed: 2015-08-31.
[16] Computerworld Sue Bushell. M-commerce key to ubiquitous inter-net. http://www.computerworld.com.au/article/84178/m-commerce_key_ubiquitous_internet/, 2000. Accessed: 2015-08-31.
[17] Concordia University. Block diagram. http://web2.concordia.ca/Quality/tools/3blockdiagram.pdf, 2015. Accessed: 2015-08-31.
50

Appendices
51

Appendix AManual for describing the devices and theirservices
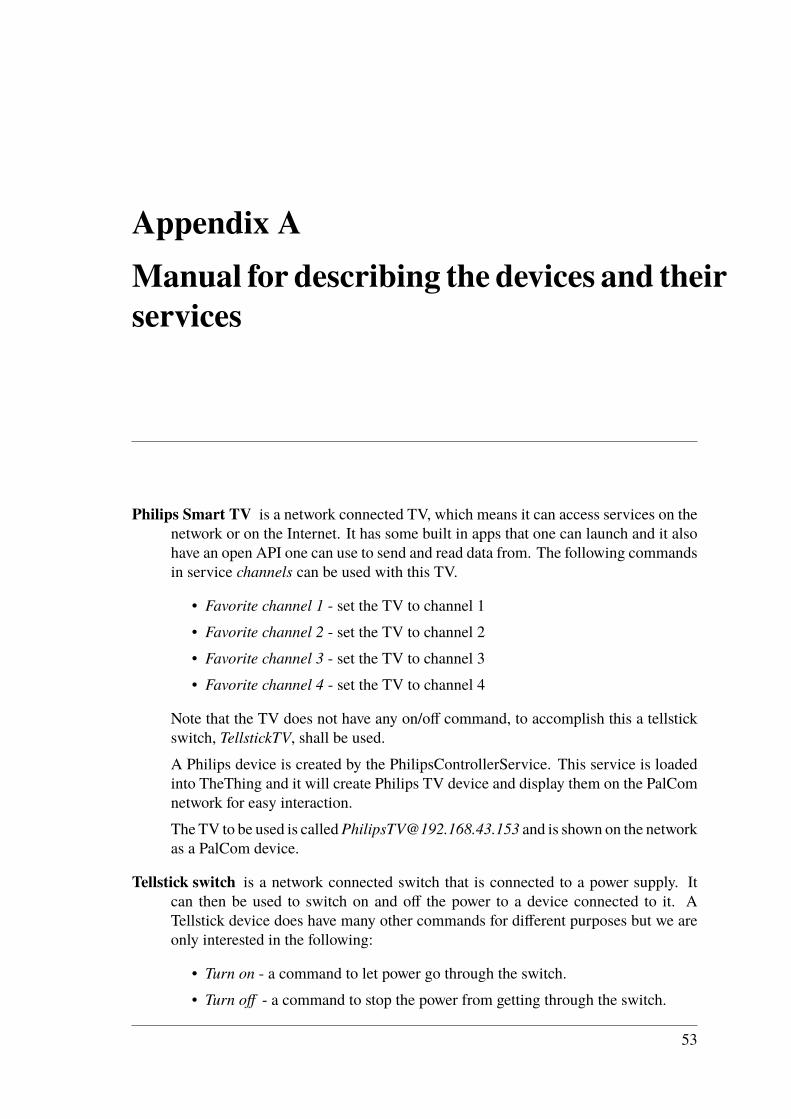
Philips Smart TV is a network connected TV, which means it can access services on thenetwork or on the Internet. It has some built in apps that one can launch and it alsohave an open API one can use to send and read data from. The following commandsin service channels can be used with this TV.
• Favorite channel 1 - set the TV to channel 1• Favorite channel 2 - set the TV to channel 2• Favorite channel 3 - set the TV to channel 3• Favorite channel 4 - set the TV to channel 4
Note that the TV does not have any on/off command, to accomplish this a tellstickswitch, TellstickTV, shall be used.A Philips device is created by the PhilipsControllerService. This service is loadedinto TheThing and it will create Philips TV device and display them on the PalComnetwork for easy interaction.The TV to be used is [email protected] and is shown on the networkas a PalCom device.
Tellstick switch is a network connected switch that is connected to a power supply. Itcan then be used to switch on and off the power to a device connected to it. ATellstick device does have many other commands for different purposes but we areonly interested in the following:
• Turn on - a command to let power go through the switch.• Turn off - a command to stop the power from getting through the switch.
53

A. Manual for describing the devices and their services
TellStick devices are created by a TellStickControllerService which is loaded intoTheThing. This controller service will display a tellstick device on the PalComnetwork for easy interaction.The switch for the lamp is called Lampa and the switch for the TV is called Tell-stickTV
Linocell camera shutter is a bluetooth connected device that has two buttonswhich givesdifferent outputs when pressed.
• button1Pushed - is triggered when button number 1 is pushed.• button2Pushed - is triggered when button number 2 is pushed.
This device is loaded as a service on a TheThing called BluetoothTheThing@Vatan
54

Appendix BManual for describing BrowserGUI
The BrowserGUI consists of three different parts. The devices, The assemblies and theassembly editor. Only two of these parts will be described since the third part, the assemblyeditor, is what is being evaluated and the users should figure out how to use.
Devices are things, physical or software simulated objects, which can do things in thephysical world or in the computer. A device can then be divided in services that itsupports and each service has commands. One can think of these as functions of theservices in the device. One can call these commands and they will give somethingback or when something internally happens in the devices they will notify. Let’stake a camera device as an example:
The device can have a service called Picture with these commands:
• TakePicture - when this command is called, the camera will open its lens andgrab the picture and return it.
• PictureTaken - This can be a service that is triggeredwhen something internallyin the device happens. Somebody pushed a button on the camera to take apicture. Then whoever was waiting for this action will get notified with theservice that a picture was taken.
The users can drag and drop the devices from the list (Figure B.1) onto the assemblyeditor to build their own assemblies and make the connections.
Assemblies are located in the left corner (Figure B.1). They define how the devices andservices are connected with each other and what will happen when commands aretriggered. You can create assemblies and when you have made your connectionsof the devices you can run this assembly and when it is running it will perform theconnections that were defined.
55

B. Manual for describing BrowserGUI
Assembly editor is the tool that is used to modify the assemblies to perform the specifictasks. This is the tool that is being evaluated. Therefore, it will not be shown nordescribed here.
Figure B.1: The BrowserGUI showing where the devices and as-semblies are listed
56


Ett krav för att den vanliga konsumenten ska använda sig av ett Internet of Things- system är användarvänligheten. PalCom efterlevde inte detta krav, men numera kan användarna genom vårt grafiska gränssnitt enkelt få en överblick över sina kopplingar.
Internet of Things, IoT, är ett hett ämne inom teknik-branschen. IoT innebär att allt fler enheter ansluter sig till Internet och andra nätverk för att kunna kommunicera med varandra. Denna kommunikation i ett smart system kan utnyttjas i bland annat sjukhus, industri och privata hem. LTH har arbetat i över 10 år med en lösning, PalCom, som möjliggör sådan kommunikation oberoende av tillverkare och protokoll (IP, bluetooth med mera). PalCom har börjat appliceras i verklig miljö, på bland annat sjukhus för att möjliggöra för patienter att hemifrån göra regelbundna kontroller som vikt, blodtryck, blodsocker med mera. Dessa mätningar kan sedan läkare och sjuksköterskor följa direkt från sjukhuset. Om mätningarna visar tecken på sjukdomar eller försämringar av patientens hälsotillstånd kan de enkelt kalla in patienten för en grundligare kontroll på sjukhuset. PalCom-användare som har satt upp assemblies för att få dessa enheter (våg, blodtrycksmätare, insulinmätare med mera) att kommunicera med en centralenhet (sjukhuset) har problem med att få en överblick över vilka enheter som är kopplade och hur kommunikationen mellan dem sker. Tidigare har användare behövt rita upp, på papper, hur de har kopplat de olika enheterna och servicerna för att få en bättre överblick och förståelse för vad som sker. Denna metod är varken användarvänlig
eller hanterbar när systemet utvidgas med personal som använder det, antal produkter som kopplas, utökandet av enheter på sjukhusen med mera. Vår lösning är ett nytt grafiskt gränssnitt som gör det enkelt att få en överblick över hur man har gjort sina kopplingar samt hantera sina kopplingar. Gränssnittet gör det betydligt enklare att applicera PalCom till även andra områden, som till exempel hemmen, för att automatisera vardagliga sysslor. Komplexiteten i det befintliga verktyget är orsaken till att man behöver vara en erfaren PalCom-användare och att man får en introduktion till verktyget för att det ska vara möjligt att skapa och redigera assemblies. Vi har därför tagit fram ett gränssnitt som är väsentligt enklare för den vanliga användaren och testat detta genom att utföra ett scenario för smarta hem där användarna kopplade ihop en TV, en lampa och en bluetooth-knapp. Genom att mäta tiden för att utföra scenariot med det gamla verktyget och det nya kunde vi jämföra vilket verktyg som var bäst. Resultatet av mätningarna visar att vårt nya verktyg är mycket bättre för användare som aldrig tidigare har använt PalCom. Med vår lösning kan nu PalCom distribueras till vanliga hemma-användare som enkelt vill kunna koppla enheter så att de kan kommunicera och på så sätt bygga sitt smarta hem.
EXAMENSARBETE Overview Browser for PalCom Assemblies
STUDENT Vatan Bytyqi, Jonas Jinbäck
HANDLEDARE Boris Magnusson (LTH)
EXAMINATOR Görel Hedin
Lösning för bättre överblick och snabbare kom-igång-tid för ett Internet of Things-system POPULÄRVETENSKAPLIG SAMMANFATTNING Vatan Bytyqi, Jonas Jinbäck
INSTITUTIONEN FÖR DATAVETENSKAP | LUNDS TEKNISKA HÖGSKOLA | PRESENTATIONSDAG 2015-08-28


![REXTAL: Regional Extension of Assemblies Using Linked-Reads · UCSC browser [4] to access HG38 and selected subtelomere DNA segments for analysis. 2.3 Alignment of Subtelomeric Region](https://img.dokumen.tips/doc/110x75/603e5fea9c60dd452d768d82/rextal-regional-extension-of-assemblies-using-linked-reads-ucsc-browser-4-to.jpg)