Embed Size (px)
Citation preview

Overstock.com:Business Strategy Analysis
Case Overview
Comprehensive case that we will use throughout the course
Rapidly growing “e-tailer” Strong sales growth and high stock price
valuation But struggling to report a profit

Overview of Business
Close-out Internet retailer– http://www.overstock.com
Revenues grown from $2 million in 1999 to $200 million in 2003
Offers 12,000 non-BMV products and 500,000 BMV products
Reported losses for each of the last 3 years
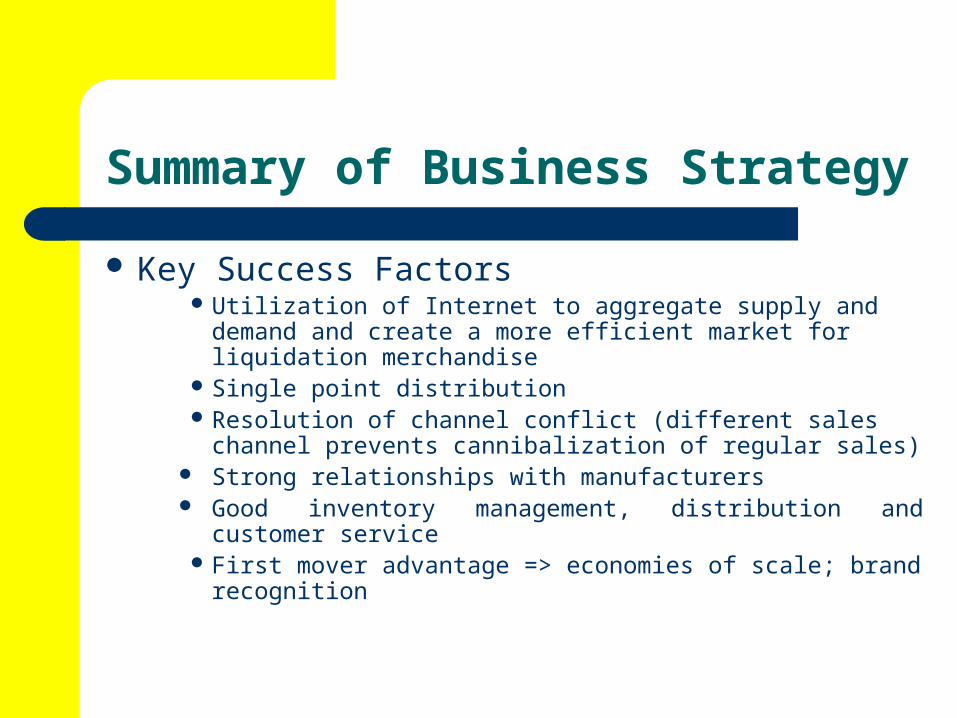
Summary of Business Strategy
Key Success Factors Utilization of Internet to aggregate supply and demand and
create a more efficient market for liquidation merchandise Single point distribution Resolution of channel conflict (different sales channel
prevents cannibalization of regular sales) Strong relationships with manufacturers Good inventory management, distribution and customer
service First mover advantage => economies of scale; brand
recognition

Summary of Business Strategy
Key Risks Competition from established competitors (Amazon.com,
SmartBargains.com) and new entrants Inventory obsolescence risk (direct business) Risk associated with sales returns (direct and fulfillment business) Growing too quickly and losing control of operations and costs Key personnel, particularly Patrick Byrne Suppliers start their own liquidation websites Regulatory costs associated with taxes, pirating, fraud etc. Can’t access capital required to execute growth strategy

Overall Evaluation of Overstock’s Business Strategy
Currently characterized by rapid growth, but no profits Competition is high, so it will be difficult to establish a
sustainable competitive advantage Are they selling products to cheaply?
or Are they investing in developing a first-mover
advantage that will generate sustainable competitive advantage?

Key Takeaways
Do not assume that rapid sales growth reflects a viable business strategy. It is easy to grow when you are selling something for less than it costs.
Good ideas are easily imitated in a competitive industry
Economies of scale can create a first-mover advantage that may lead to sustainable competitive advantage
Overstock.com:Accounting Analysis

Critical Accounting Policies
Revenue Recognition Major switch from commission basis to gross basis for fulfillment
partner revenue on July 1, 2003
Reserve for Returns Allowance for Doubtful Accounts Allowance for Obsolete and Damaged Inventory Accounting for Income Taxes Valuation of Long-Lived and Intangible Assets and
Goodwill
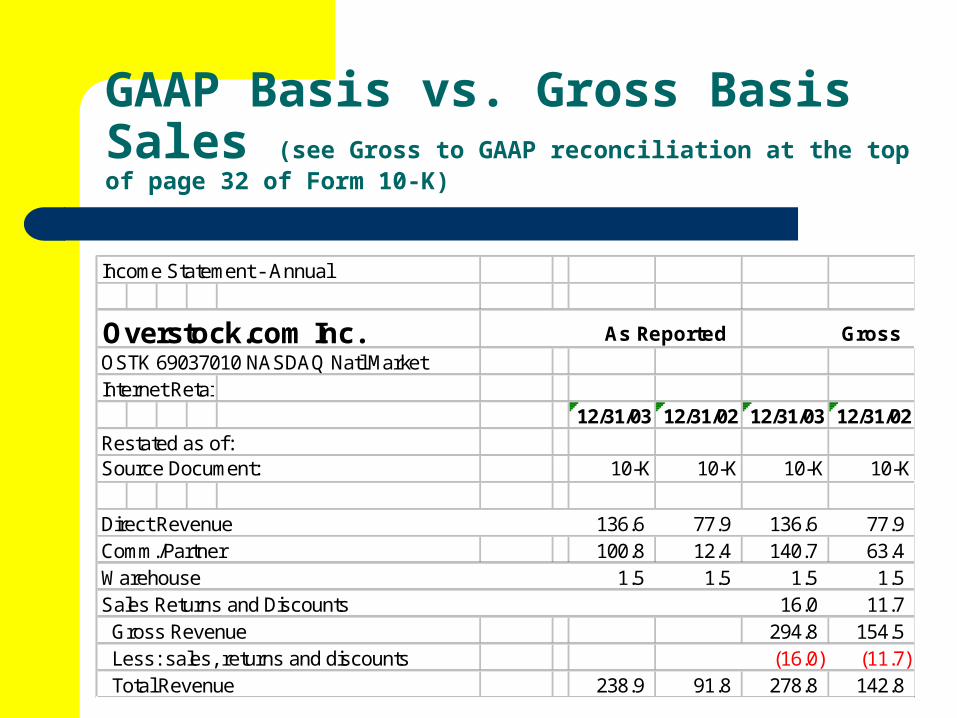
Income Statement - Annual
Overstock.com Inc. As Reported Gross
OSTK 69037010 NASDAQ Natl MarketInternet Retail
12/31/03 12/31/02 12/31/03 12/31/02Restated as of:Source Document: 10-K 10-K 10-K 10-K
Direct Revenue 136.6 77.9 136.6 77.9Comm./Partner 100.8 12.4 140.7 63.4Warehouse 1.5 1.5 1.5 1.5Sales Returns and Discounts 16.0 11.7 Gross Revenue 294.8 154.5 Less: sales, returns and discounts (16.0) (11.7) Total Revenue 238.9 91.8 278.8 142.8
GAAP Basis vs. Gross Basis Sales (see Gross to GAAP reconciliation at the top of page 32 of Form 10-K)
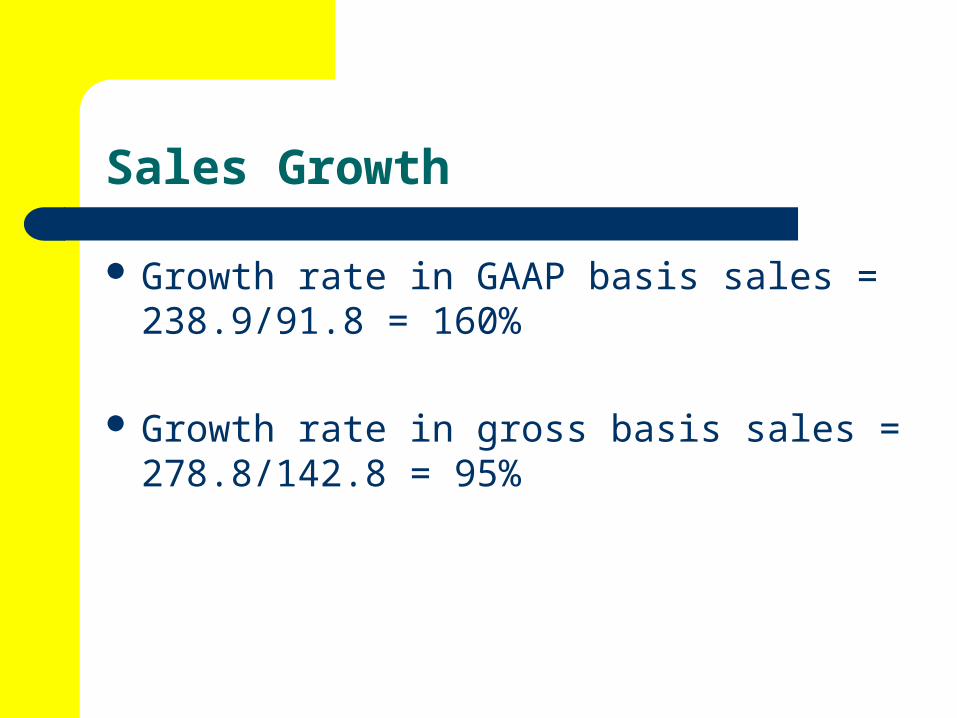
Sales Growth
Growth rate in GAAP basis sales = 238.9/91.8 = 160%
Growth rate in gross basis sales = 278.8/142.8 = 95%
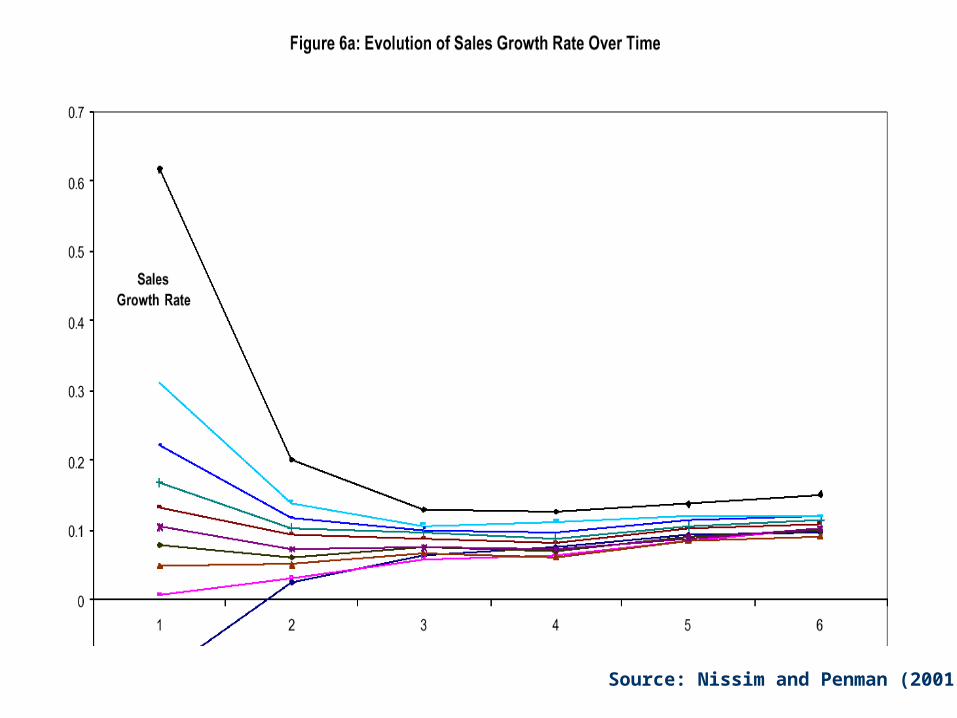
Source: Nissim and Penman (2001)
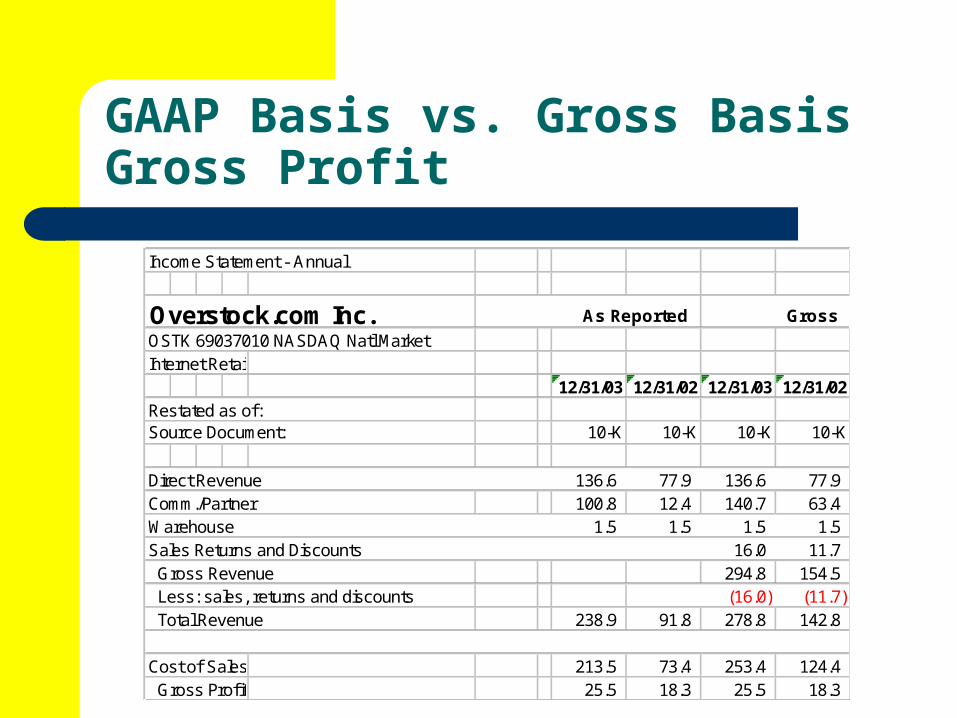
GAAP Basis vs. Gross Basis Gross Profit
Income Statement - Annual
Overstock.com Inc. As Reported Gross
OSTK 69037010 NASDAQ Natl MarketInternet Retail
12/31/03 12/31/02 12/31/03 12/31/02Restated as of:Source Document: 10-K 10-K 10-K 10-K
Direct Revenue 136.6 77.9 136.6 77.9Comm./Partner 100.8 12.4 140.7 63.4Warehouse 1.5 1.5 1.5 1.5Sales Returns and Discounts 16.0 11.7 Gross Revenue 294.8 154.5 Less: sales, returns and discounts (16.0) (11.7) Total Revenue 238.9 91.8 278.8 142.8 Cost of Sales 213.5 73.4 253.4 124.4 Gross Profit 25.5 18.3 25.5 18.3

Gross Profit Growth
Growth rate in GAAP basis gross profit = 25.3/18.3 = 39%
Growth rate in gross basis gross profit = 25.3/18.3 = 39%

GAAP Basis vs. Gross Basis Common Size Income Statements
Income Statement - Annual COMMON SIZE
Overstock.com Inc. As Reported Gross
OSTK 69037010 NASDAQ Natl MarketInternet Retail
12/31/03 12/31/02 12/31/03 12/31/02Restated as of:Source Document: 10-K 10-K 10-K 10-K
Total Revenue 100.0% 100.0% 100.0% 100.0% Cost of Sales 89.3% 80.0% 90.9% 87.2% Gross Profit 10.7% 20.0% 9.1% 12.8%
Sales/Marketing 8.4% 9.4% 7.2% 6.1%General/Admin. 7.1% 11.8% 6.1% 7.6%Goodw ill Amort. 0.0% 0.0% 0.0% 0.0%Stock Comp. 0.3% 3.2% 0.3% 2.0% Total Operating Expense 105.2% 104.4% 90.1% 67.1%

Accounting Performance vs. Economic Performance
Overstock.com is ‘investing’ significant amounts to fuel sales growth, customer loyalty and brand awareness. Most of these amounts must be immediately expensed for accounting purposes:
Sales and marketing expenses General and administrative expenses Loss-leading margins on BMV merchandise
Key Takeaways
Subjective accounting choices can produce significant distortions to sales growth rates and profit margins. Make sure you are aware of such distortions before interpreting the information in the financial statements
GAAP requires the immediate expensing of many expenditures that are potentially investments that could lead to future benefits. Thus, lack of profitability does not necessarily imply a flawed business model.
Overstock.com:Ratio Analysis
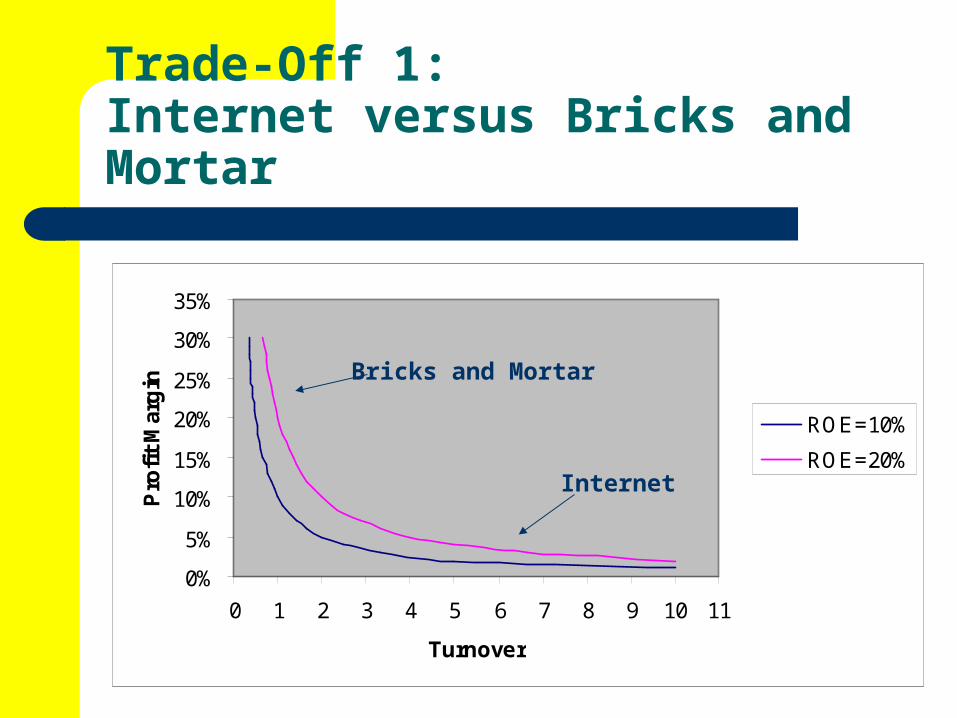
Trade-Off 1:Internet versus Bricks and Mortar
0%
5%
10%
15%
20%
25%
30%
35%
0 1 2 3 4 5 6 7 8 9 10 11
Turnover
Pro
fit
Mar
gin
ROE=10%
ROE=20%
Bricks and Mortar
Internet

Trade-Off 2:Liquidation versus Regular Retail
0%
5%
10%
15%
20%
25%
30%
35%
0 1 2 3 4 5 6 7 8 9 10 11
Turnover
Pro
fit
Mar
gin
ROE=10%
ROE=20%
Liquidation
Regular Retail

Trade-Off 3:Direct versus Fulfillment Partner
0%
5%
10%
15%
20%
25%
30%
35%
0 1 2 3 4 5 6 7 8 9 10 11
Turnover
Pro
fit
Mar
gin
ROE=10%
ROE=20%DirectFulfillment Partner(Gross-Basis: they take returns)
Fulfillment Partner(Commission-Basis)
Fulfillment Partner(Gross-Basis: we take returns)
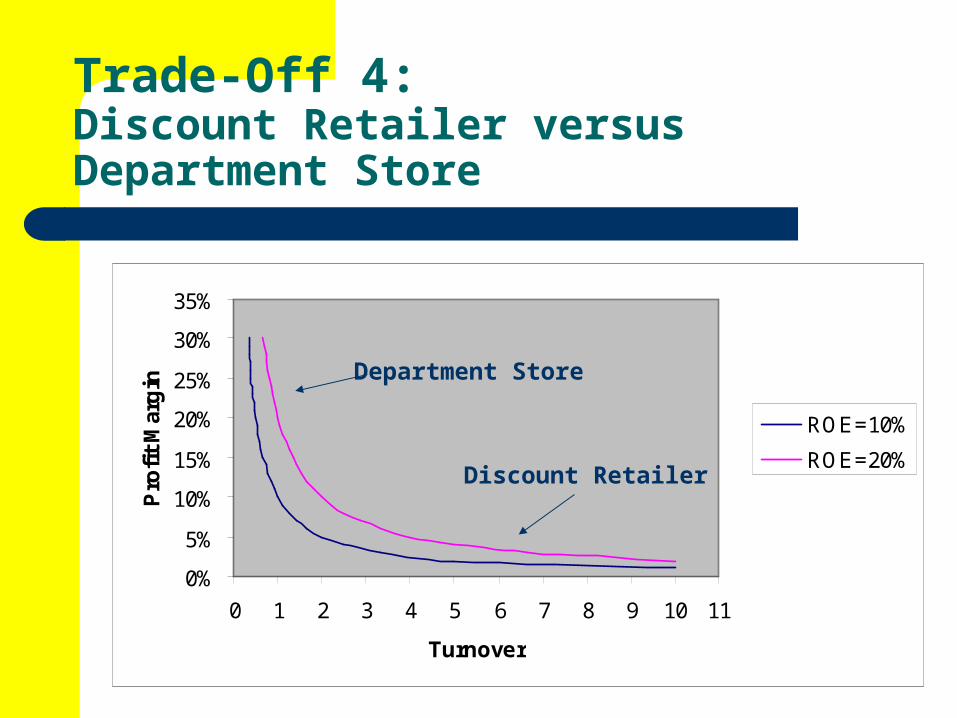
Trade-Off 4:Discount Retailer versus Department Store
0%
5%
10%
15%
20%
25%
30%
35%
0 1 2 3 4 5 6 7 8 9 10 11
Turnover
Pro
fit
Mar
gin
ROE=10%
ROE=20%
Department Store
Discount Retailer

Overall Evaluation of Trade-Off
0%
5%
10%
15%
20%
25%
30%
35%
0 1 2 3 4 5 6 7 8 9 10 11
Turnover
Pro
fit
Mar
gin
ROE=10%
ROE=20%
May Department Stores
Overstock.com
Ross Stores
Amazon.com

Dupont Analysis:Overstock versus Amazon
Overstock.com
Advanced Dupont Model 2001 2002 2003
Net Operating Margin (0.327) (0.045) (0.049) x Net Operating Asset Turnover 7.507 3.663 5.056 = Return on Net Operating Assets (2.454) (0.163) (0.250) Net Borrowing Cost (NBC) 0.312 3.078 1.971 Spread (RNOA - NBC) (2.766) (3.241) (2.221) Financial Leverage (LEV) 0.782 0.107 0.004 ROE = RNOA + LEV*Spread (4.617) (0.512) (0.258)
Amazon.com
Advanced Dupont Model 1999 2000 2001 2002 2003
Net Operating Margin (0.387) (0.464) (0.137) (0.002) 0.031 x Net Operating Asset Turnover 1.889 3.273 4.713 5.686 = Return on Net Operating Assets (0.876) (0.449) (0.007) 0.179 Net Borrowing Cost (NBC) 0.072 0.065 0.064 0.061 Spread (RNOA - NBC) (0.948) (0.513) (0.072) 0.117 Financial Leverage (LEV) (5.171) (1.793) (1.598) (1.775) ROE = RNOA + LEV*Spread 4.027 0.471 0.107 (0.030)
Dupont Analysis:Overstock versus Ross Stores
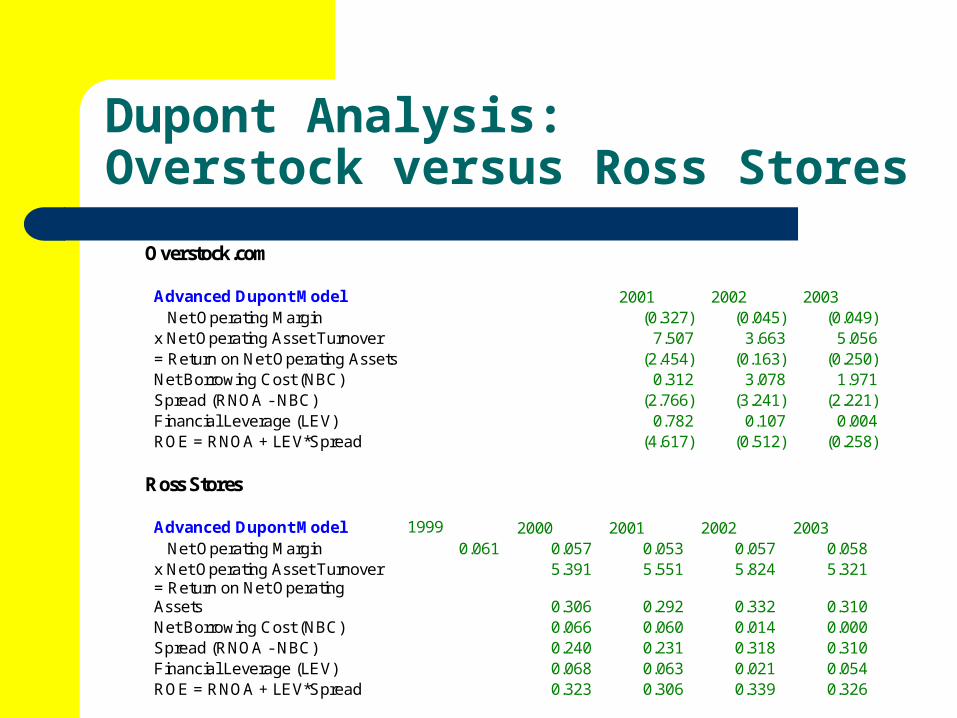
Overstock.com
Advanced Dupont Model 2001 2002 2003
Net Operating Margin (0.327) (0.045) (0.049) x Net Operating Asset Turnover 7.507 3.663 5.056 = Return on Net Operating Assets (2.454) (0.163) (0.250) Net Borrowing Cost (NBC) 0.312 3.078 1.971 Spread (RNOA - NBC) (2.766) (3.241) (2.221) Financial Leverage (LEV) 0.782 0.107 0.004 ROE = RNOA + LEV*Spread (4.617) (0.512) (0.258)
Ross Stores
Advanced Dupont Model 1999 2000 2001 2002 2003
Net Operating Margin 0.061 0.057 0.053 0.057 0.058 x Net Operating Asset Turnover 5.391 5.551 5.824 5.321 = Return on Net Operating Assets 0.306 0.292 0.332 0.310 Net Borrowing Cost (NBC) 0.066 0.060 0.014 0.000 Spread (RNOA - NBC) 0.240 0.231 0.318 0.310 Financial Leverage (LEV) 0.068 0.063 0.021 0.054 ROE = RNOA + LEV*Spread 0.323 0.306 0.339 0.326
Dupont Analysis:Overstock versus May Dep’t Stores
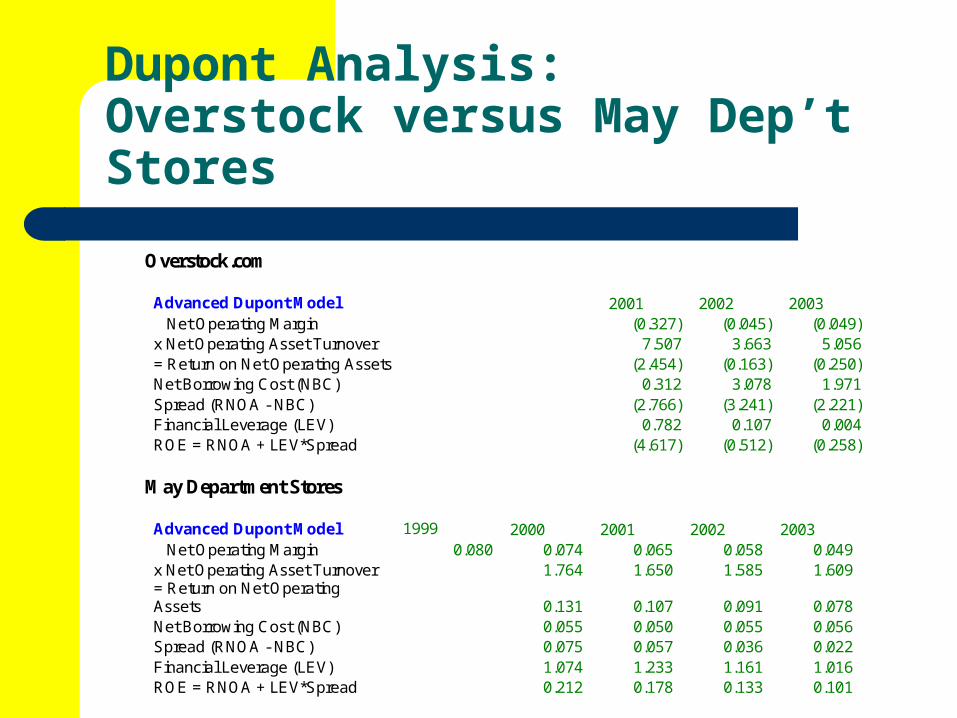
Overstock.com
Advanced Dupont Model 2001 2002 2003
Net Operating Margin (0.327) (0.045) (0.049) x Net Operating Asset Turnover 7.507 3.663 5.056 = Return on Net Operating Assets (2.454) (0.163) (0.250) Net Borrowing Cost (NBC) 0.312 3.078 1.971 Spread (RNOA - NBC) (2.766) (3.241) (2.221) Financial Leverage (LEV) 0.782 0.107 0.004 ROE = RNOA + LEV*Spread (4.617) (0.512) (0.258)
May Department Stores
Advanced Dupont Model 1999 2000 2001 2002 2003
Net Operating Margin 0.080 0.074 0.065 0.058 0.049 x Net Operating Asset Turnover 1.764 1.650 1.585 1.609 = Return on Net Operating Assets 0.131 0.107 0.091 0.078 Net Borrowing Cost (NBC) 0.055 0.050 0.055 0.056 Spread (RNOA - NBC) 0.075 0.057 0.036 0.022 Financial Leverage (LEV) 1.074 1.233 1.161 1.016 ROE = RNOA + LEV*Spread 0.212 0.178 0.133 0.101
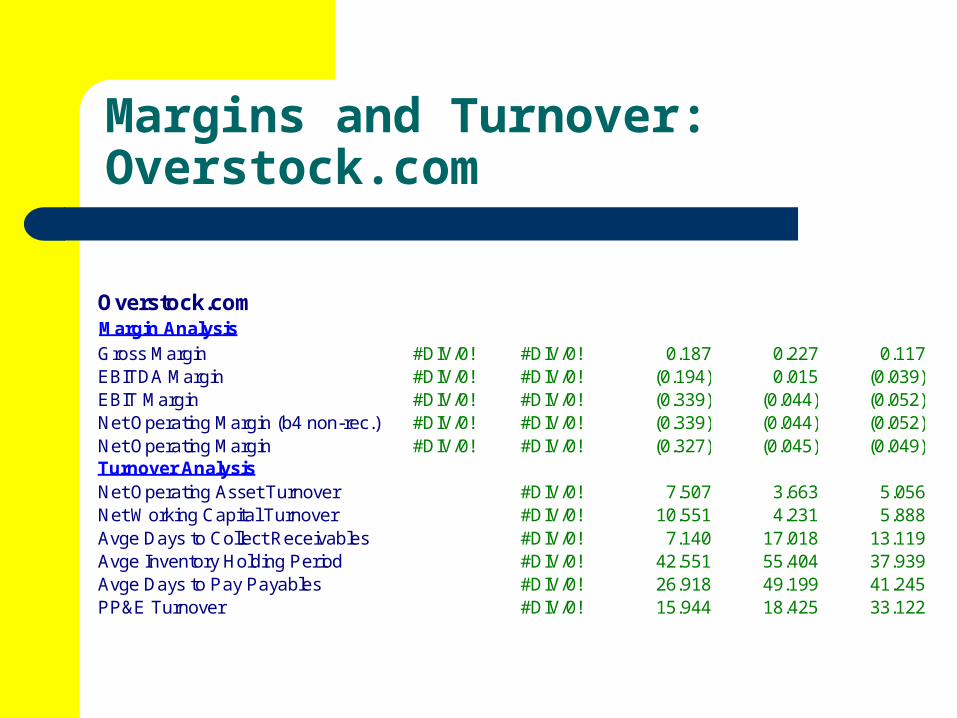
Margins and Turnover:Overstock.com
Overstock.com Margin Analysis Gross Margin #DIV/0! #DIV/0! 0.187 0.227 0.117 EBITDA Margin #DIV/0! #DIV/0! (0.194) 0.015 (0.039) EBIT Margin #DIV/0! #DIV/0! (0.339) (0.044) (0.052) Net Operating Margin (b4 non-rec.) #DIV/0! #DIV/0! (0.339) (0.044) (0.052) Net Operating Margin #DIV/0! #DIV/0! (0.327) (0.045) (0.049) Turnover Analysis Net Operating Asset Turnover #DIV/0! 7.507 3.663 5.056 Net Working Capital Turnover #DIV/0! 10.551 4.231 5.888 Avge Days to Collect Receivables #DIV/0! 7.140 17.018 13.119 Avge Inventory Holding Period #DIV/0! 42.551 55.404 37.939 Avge Days to Pay Payables #DIV/0! 26.918 49.199 41.245 PP&E Turnover #DIV/0! 15.944 18.425 33.122

Margins and Turnover:Amazon.com
Amazon.com Margin Analysis Gross Margin 0.218 0.238 0.239 0.273 0.253 EBITDA Margin (0.192) (0.123) (0.032) 0.049 0.066 EBIT Margin (0.364) (0.240) (0.074) 0.027 0.051 Net Operating Margin (b4 non-rec.) (0.364) (0.240) (0.074) 0.027 0.051 Net Operating Margin (0.387) (0.464) (0.137) (0.002) 0.031 Turnover Analysis Net Operating Asset Turnover 1.889 3.273 4.713 5.686 Net Working Capital Turnover 8.002 8.867 9.098 9.272 Avge Days to Collect Receivables 0.000 0.000 5.210 8.472 Avge Inventory Holding Period 34.261 24.458 22.103 23.043 Avge Days to Pay Payables 80.458 70.558 69.293 68.349 PP&E Turnover 8.076 9.786 15.389 22.704
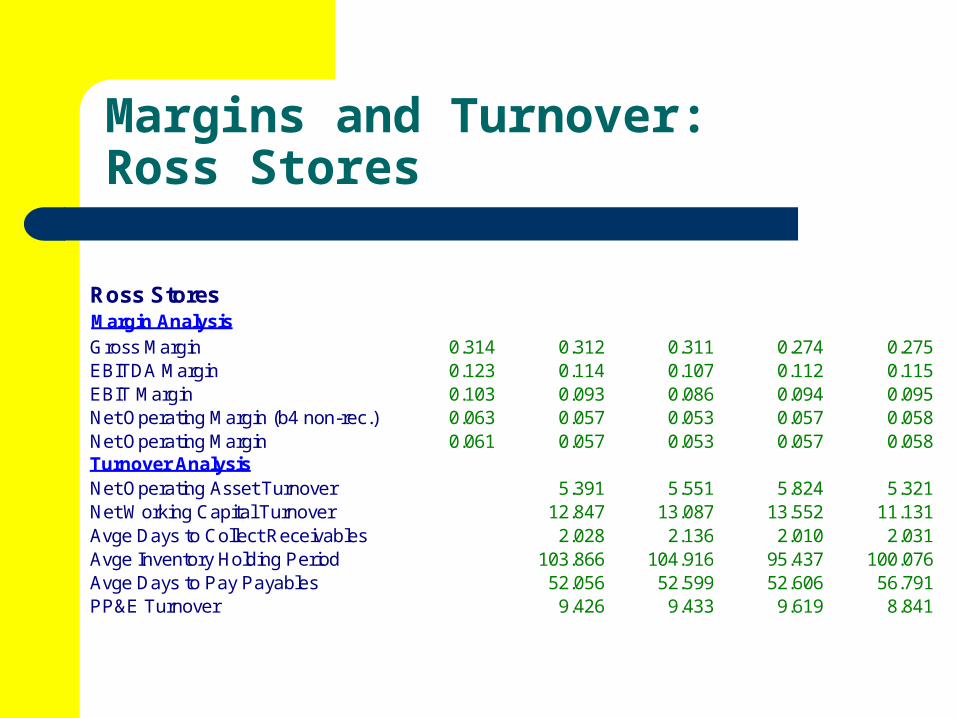
Margins and Turnover:Ross Stores
Ross Stores Margin Analysis Gross Margin 0.314 0.312 0.311 0.274 0.275 EBITDA Margin 0.123 0.114 0.107 0.112 0.115 EBIT Margin 0.103 0.093 0.086 0.094 0.095 Net Operating Margin (b4 non-rec.) 0.063 0.057 0.053 0.057 0.058 Net Operating Margin 0.061 0.057 0.053 0.057 0.058 Turnover Analysis Net Operating Asset Turnover 5.391 5.551 5.824 5.321 Net Working Capital Turnover 12.847 13.087 13.552 11.131 Avge Days to Collect Receivables 2.028 2.136 2.010 2.031 Avge Inventory Holding Period 103.866 104.916 95.437 100.076 Avge Days to Pay Payables 52.056 52.599 52.606 56.791 PP&E Turnover 9.426 9.433 9.619 8.841
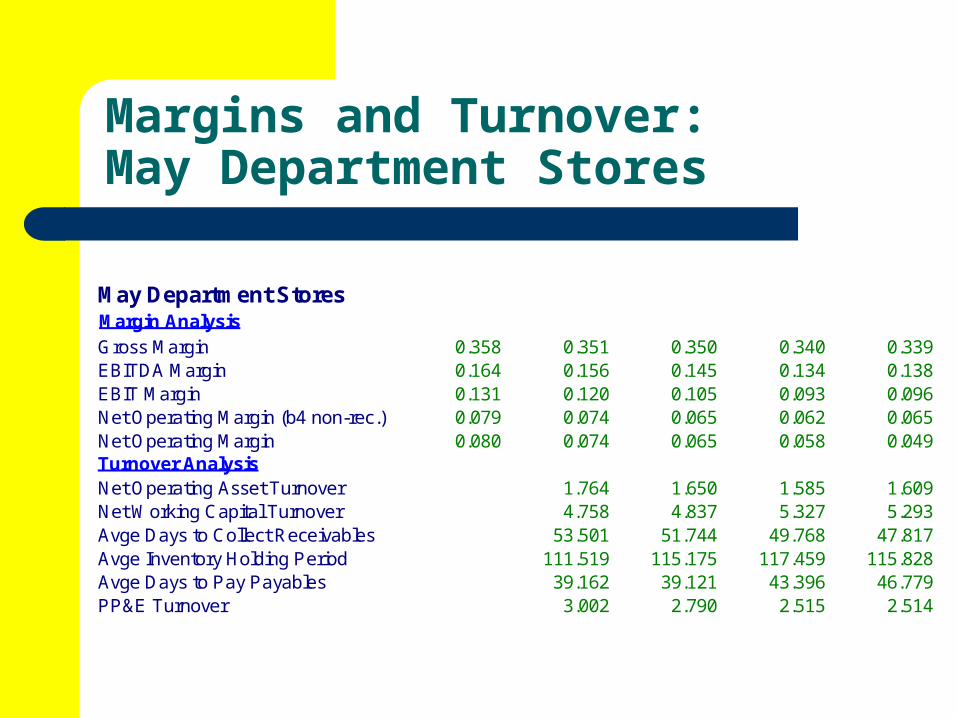
Margins and Turnover:May Department Stores
May Department Stores Margin Analysis Gross Margin 0.358 0.351 0.350 0.340 0.339 EBITDA Margin 0.164 0.156 0.145 0.134 0.138 EBIT Margin 0.131 0.120 0.105 0.093 0.096 Net Operating Margin (b4 non-rec.) 0.079 0.074 0.065 0.062 0.065 Net Operating Margin 0.080 0.074 0.065 0.058 0.049 Turnover Analysis Net Operating Asset Turnover 1.764 1.650 1.585 1.609 Net Working Capital Turnover 4.758 4.837 5.327 5.293 Avge Days to Collect Receivables 53.501 51.744 49.768 47.817 Avge Inventory Holding Period 111.519 115.175 117.459 115.828 Avge Days to Pay Payables 39.162 39.121 43.396 46.779 PP&E Turnover 3.002 2.790 2.515 2.514
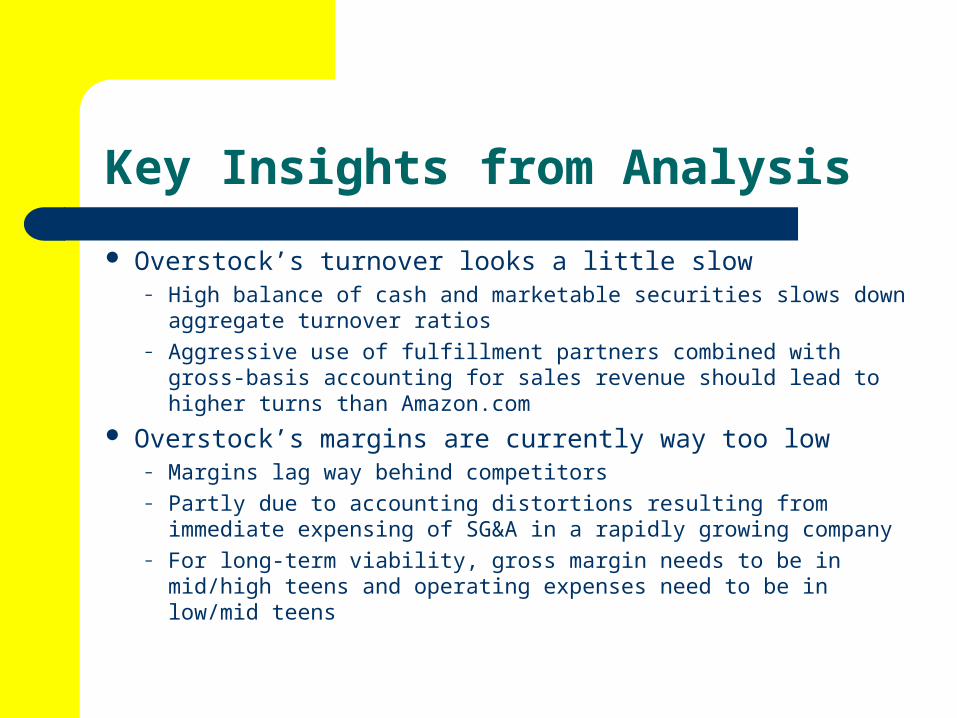
Key Insights from Analysis
Overstock’s turnover looks a little slow– High balance of cash and marketable securities slows down
aggregate turnover ratios– Aggressive use of fulfillment partners combined with gross-basis
accounting for sales revenue should lead to higher turns than Amazon.com
Overstock’s margins are currently way too low– Margins lag way behind competitors– Partly due to accounting distortions resulting from immediate
expensing of SG&A in a rapidly growing company– For long-term viability, gross margin needs to be in mid/high teens
and operating expenses need to be in low/mid teens

Overstock.com:Forecasting Analysis
(Using Q3 2005 – see spreadsheet for details)

Forecasting Overview
Illustrates systematic framework for generating financial statement forecasts
eVal will walk you though this framework moving forward
Starting point is historical financial statements Sales growth, margins, turnover ratios, leverage
Use insights generated from your analysis of the past to modify forecasting assumptions
Business analysis Accounting analysis Financial analysis
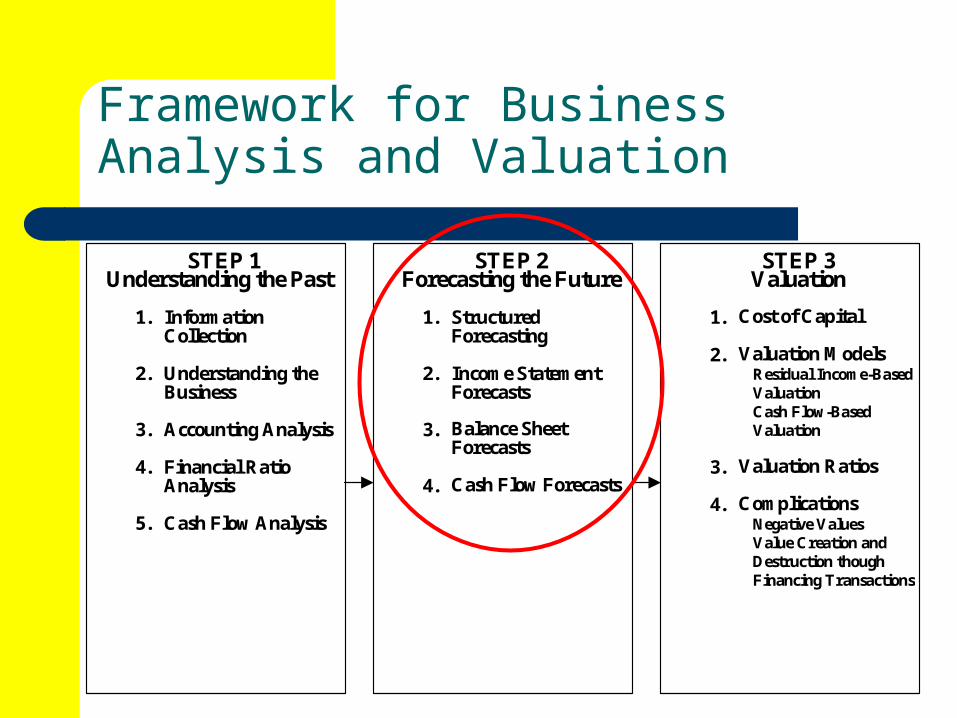
Framework for Business Analysis and Valuation
STEP 1 Understanding the Past
1. Information Collection
2. Understanding the
Business
3. Accounting Analysis
4. Financial Ratio Analysis
5. Cash Flow Analysis
STEP 2 Forecasting the Future
1. Structured
Forecasting 2. Income Statement
Forecasts
3. Balance Sheet Forecasts
4. Cash Flow Forecasts
STEP 3 Valuation
1. Cost of Capital 2. Valuation Models
Residual Income-Based Valuation
Cash Flow-Based Valuation
3. Valuation Ratios
4. Complications
Negative Values Value Creation and
Destruction though Financing Transactions
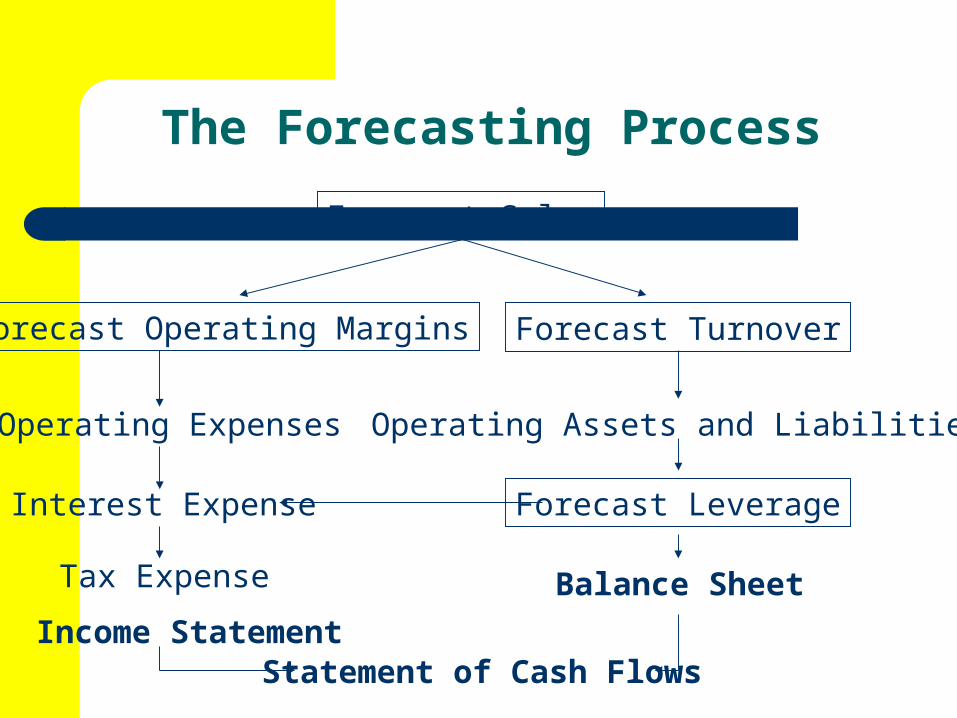
The Forecasting Process
Forecast Sales
Forecast Leverage
Forecast TurnoverForecast Operating Margins
Operating Expenses Operating Assets and Liabilities
Balance Sheet
Interest Expense
Tax Expense
Income StatementStatement of Cash Flows
Sales Growth
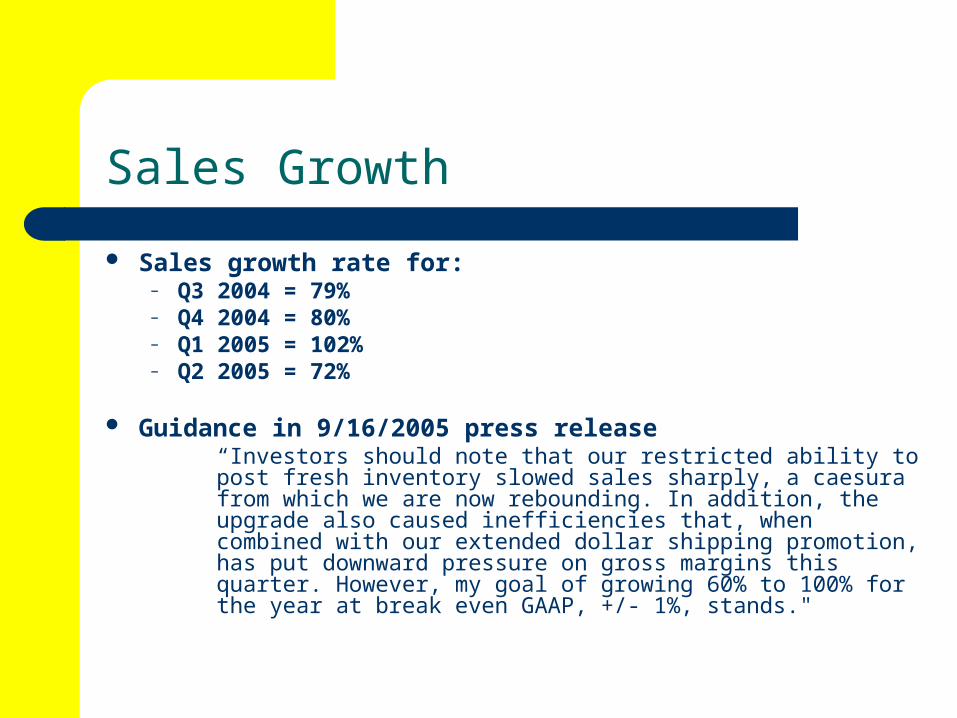
Sales growth rate for:– Q3 2004 = 79%– Q4 2004 = 80%– Q1 2005 = 102%– Q2 2005 = 72%
Guidance in 9/16/2005 press release“Investors should note that our restricted ability to post fresh inventory slowed sales sharply, a caesura from which we are now rebounding. In addition, the upgrade also caused inefficiencies that, when combined with our extended dollar shipping promotion, has put downward pressure on gross margins this quarter. However, my goal of growing 60% to 100% for the year at break even GAAP, +/- 1%, stands."
Margins & Turnover
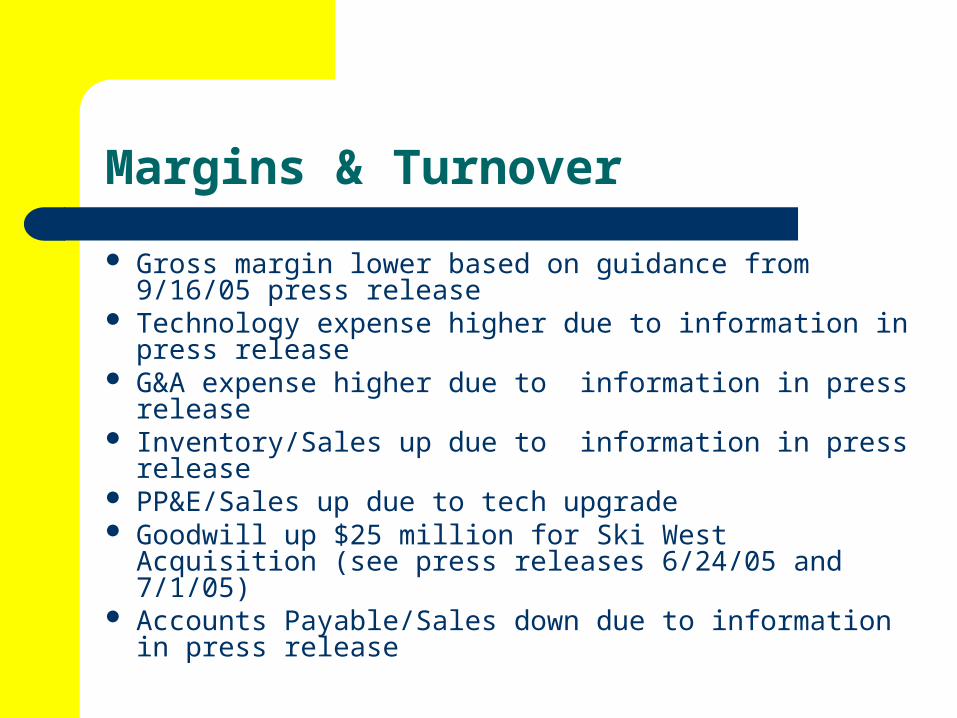
Gross margin lower based on guidance from 9/16/05 press release
Technology expense higher due to information in press release
G&A expense higher due to information in press release
Inventory/Sales up due to information in press release PP&E/Sales up due to tech upgrade Goodwill up $25 million for Ski West Acquisition (see
press releases 6/24/05 and 7/1/05) Accounts Payable/Sales down due to information in
press release

Leverage and the Balance Sheet Plug
No indication that OSTK issued/repurchased any common equity during Q3 ’05
No indication OSTK issued/retired any debt during Q3 ‘05
I assume that OSTK funds cash shortfall for the quarter by selling marketable securities

Overstock.com
WR Hambrecht Valuation Method
Analyst Valuation Method
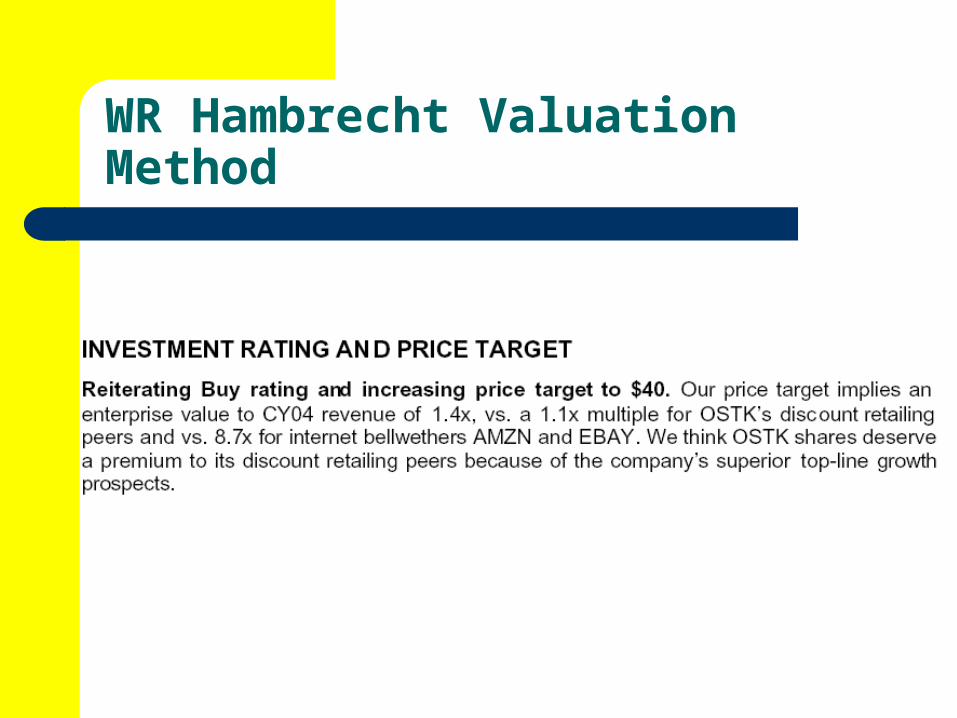
Analyst report uses comparable enterprise value to revenue multiples with ‘discount retailing peers’ and ‘internet bellwethers’ as comparisons
Argues that OSTK deserves a premium because of superior top-line growth prospects
Note that enterprise value equals market value of equity plus book value of debt less cash and short-term investments
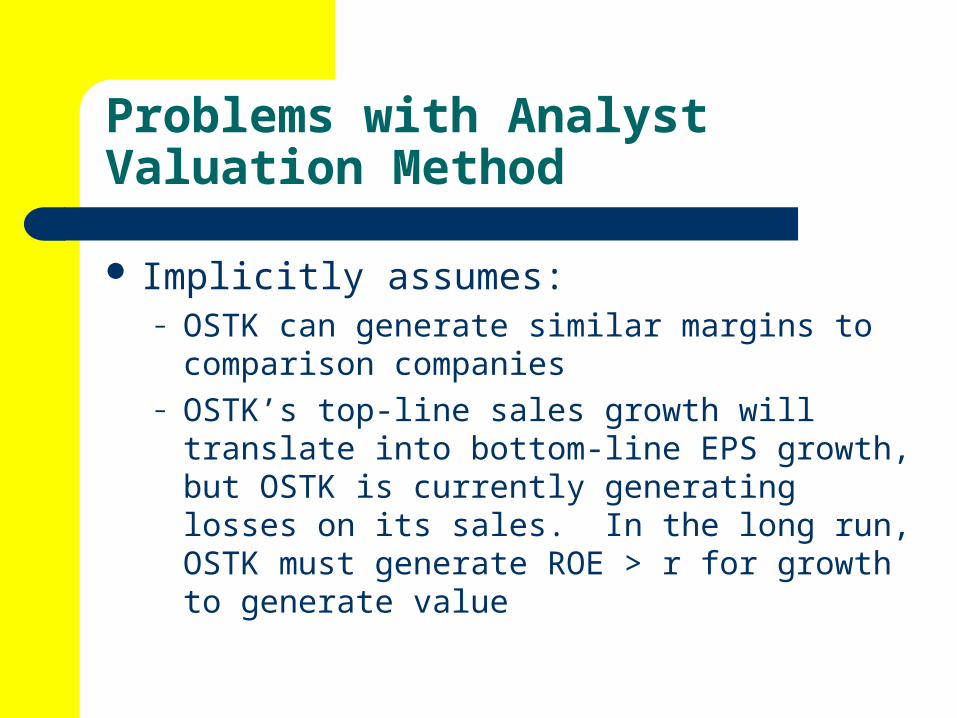
Problems with Analyst Valuation Method
Implicitly assumes:– OSTK can generate similar margins to comparison
companies– OSTK’s top-line sales growth will translate into
bottom-line EPS growth, but OSTK is currently generating losses on its sales. In the long run, OSTK must generate ROE > r for growth to generate value

Gross and Net Margin Comparison for 2003 (data from eVal)
Gross Margin Net Margin
Overstock 11.7% -4.9%
Ross Stores 27.5% 5.8%
Amazon 25.3% 3.1%
eBay 85.3% 20.5%

Default eVal Valuation
Default valuation is less than -$4,000/share! Default valuation extrapolates Overstock’s artificially high
2003 sales growth rate of 160% for 10 years into future Default valuation extrapolates Overstock’s 2003 ROE of
around –25% for the infinite future Default valuation model assumes that Overstock will
continue to lose money forever, but that investors will keep pumping new money into the business to cover these losses! (see cash flow analysis)
In reality, company will either turn to profitability in the not too distant future or go out of business
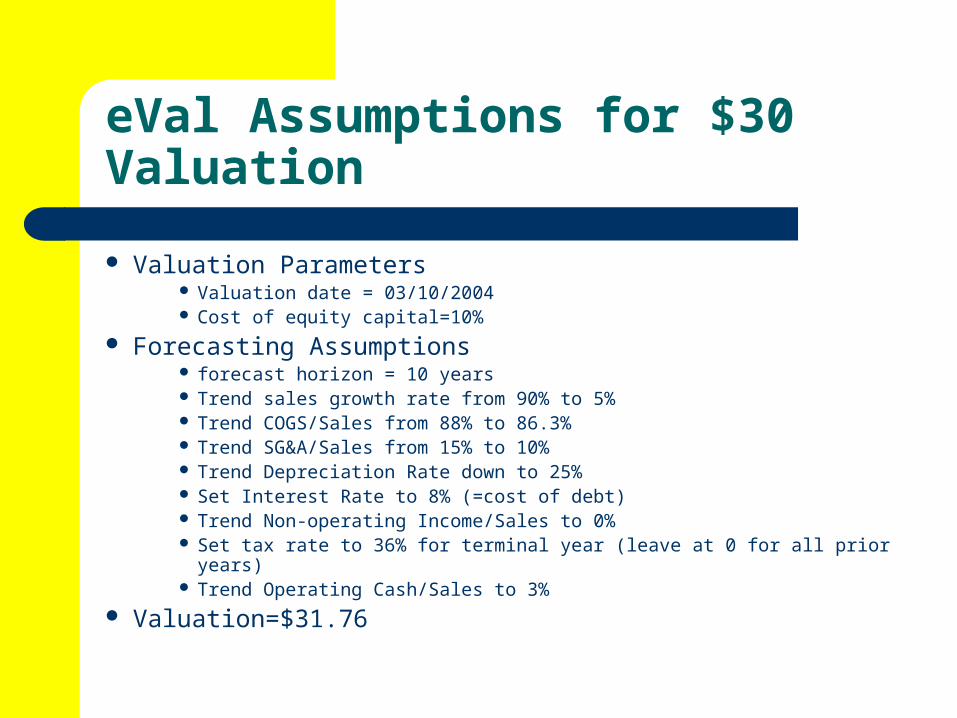
eVal Assumptions for $30 Valuation
Valuation Parameters Valuation date = 03/10/2004 Cost of equity capital=10%
Forecasting Assumptions forecast horizon = 10 years Trend sales growth rate from 90% to 5% Trend COGS/Sales from 88% to 86.3% Trend SG&A/Sales from 15% to 10% Trend Depreciation Rate down to 25% Set Interest Rate to 8% (=cost of debt) Trend Non-operating Income/Sales to 0% Set tax rate to 36% for terminal year (leave at 0 for all prior years) Trend Operating Cash/Sales to 3%
Valuation=$31.76

Company NameForecast HorizonEstimated Price/Share=$31.76
Fiscal Year End Date
Implied Return on Equity
Income Statement AssumptionsSales GrowthCost of Goods Sold/SalesR&D/SalesSG&A/SalesDep&Amort/Avge PP&E and Intang.Interest Expense/Avge DebtNon-Operating Income/SalesEffective Tax RateMinority Interest/After Tax IncomeOther Income/SalesExt. Items & Disc. Ops./SalesPref. Dividends/Avge Pref. Stock
TERMINALYEAR
Forecast Forecast Forecast Forecast Forecast Forecast Forecast Forecast Forecast Forecast Forecast12/31/2004 12/31/2005 12/31/2006 12/31/2007 12/31/2008 12/31/2009 12/31/2010 12/31/2011 12/31/2012 12/31/2013 12/31/2014
(0.236) (0.206) (0.173) (0.137) (0.098) (0.056) (0.008) 0.044 0.103 0.170 0.158
90.0% 81.5% 73.0% 64.5% 56.0% 47.5% 39.0% 30.5% 22.0% 13.5% 5.0%88.0% 87.8% 87.7% 87.5% 87.3% 87.2% 87.0% 86.8% 86.6% 86.5% 86.3%
0.0% 0.0% 0.0% 0.0% 0.0% 0.0% 0.0% 0.0% 0.0% 0.0% 0.0%15.0% 14.5% 14.0% 13.5% 13.0% 12.5% 12.0% 11.5% 11.0% 10.5% 10.0%31.1% 30.5% 29.9% 29.3% 28.7% 28.1% 27.4% 26.8% 26.2% 25.6% 25.0%
8.0% 8.0% 8.0% 8.0% 8.0% 8.0% 8.0% 8.0% 8.0% 8.0% 8.0%0.2% 0.2% 0.2% 0.2% 0.1% 0.1% 0.1% 0.1% 0.0% 0.0% 0.0%0.0% 0.0% 0.0% 0.0% 0.0% 0.0% 0.0% 0.0% 0.0% 0.0% 36.0%0.0% 0.0% 0.0% 0.0% 0.0% 0.0% 0.0% 0.0% 0.0% 0.0% 0.0%0.0% 0.0% 0.0% 0.0% 0.0% 0.0% 0.0% 0.0% 0.0% 0.0% 0.0%0.0% 0.0% 0.0% 0.0% 0.0% 0.0% 0.0% 0.0% 0.0% 0.0% 0.0%0.0% 0.0% 0.0% 0.0% 0.0% 0.0% 0.0% 0.0% 0.0% 0.0% 0.0%

Plausible Valuation Assumptions
Valuation parameters Valuation date = 03/10/2004 Cost of equity capital = 10%
Forecasting Assumptions horizon to 5 years Trend sales growth rate from 90% to 5% Trend COGS/Sales from 88% to 86.3% Trend SG&A/Sales from 15% to 10% Trend Depreciation Rate down to 25% Set Interest Rate to 8% (=cost of debt) Trend Non-operating Income/Sales to 0% Set tax rate to 36% for terminal year Trend Operating Cash/Sales to 3%
Valuation=$9.64
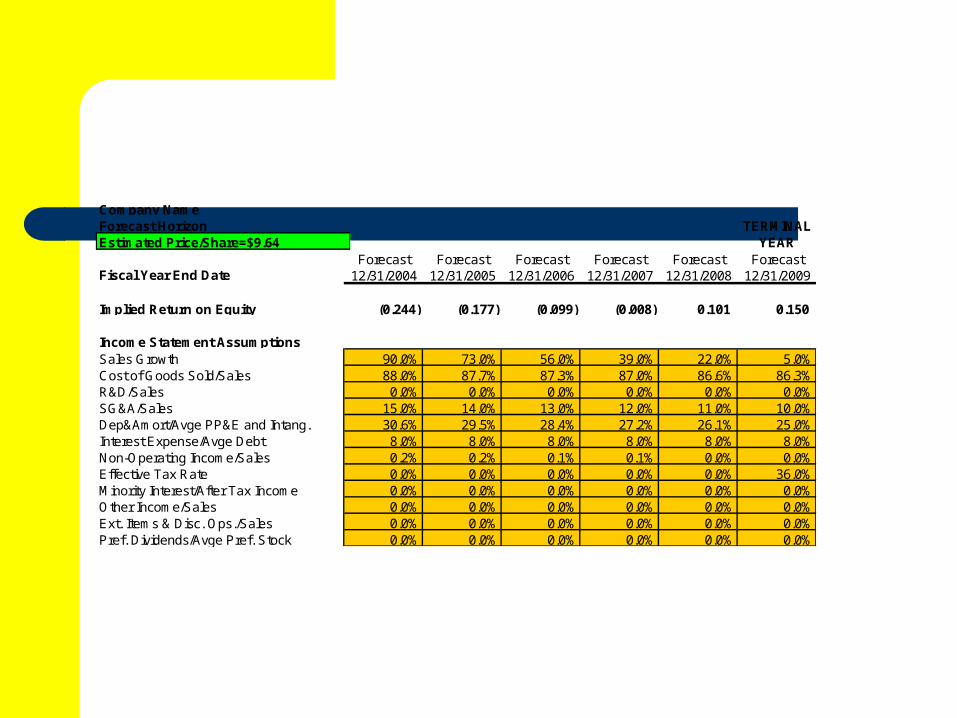
Company NameForecast HorizonEstimated Price/Share=$9.64
Fiscal Year End Date
Implied Return on Equity
Income Statement AssumptionsSales GrowthCost of Goods Sold/SalesR&D/SalesSG&A/SalesDep&Amort/Avge PP&E and Intang.Interest Expense/Avge DebtNon-Operating Income/SalesEffective Tax RateMinority Interest/After Tax IncomeOther Income/SalesExt. Items & Disc. Ops./SalesPref. Dividends/Avge Pref. Stock
TERMINALYEAR
Forecast Forecast Forecast Forecast Forecast Forecast12/31/2004 12/31/2005 12/31/2006 12/31/2007 12/31/2008 12/31/2009
(0.244) (0.177) (0.099) (0.008) 0.101 0.150
90.0% 73.0% 56.0% 39.0% 22.0% 5.0%88.0% 87.7% 87.3% 87.0% 86.6% 86.3%0.0% 0.0% 0.0% 0.0% 0.0% 0.0%
15.0% 14.0% 13.0% 12.0% 11.0% 10.0%30.6% 29.5% 28.4% 27.2% 26.1% 25.0%8.0% 8.0% 8.0% 8.0% 8.0% 8.0%0.2% 0.2% 0.1% 0.1% 0.0% 0.0%0.0% 0.0% 0.0% 0.0% 0.0% 36.0%0.0% 0.0% 0.0% 0.0% 0.0% 0.0%0.0% 0.0% 0.0% 0.0% 0.0% 0.0%0.0% 0.0% 0.0% 0.0% 0.0% 0.0%0.0% 0.0% 0.0% 0.0% 0.0% 0.0%
Key Takeaways
Naïve use of comparable valuation multiples can be used to justify implausible valuations. It is important to understand the implicit assumptions in the use of comparable valuation multiples.
Growth and ROE interact to determine value Terminal ROE must climb above cost of capital for business to be
viable OSTK operates in a highly competitive environment, so terminal
ROE is unlikely to be more than 15% Given a terminal ROE of 15%, the horizon over which OSTK can
continue to grow at abnormally high rates is the key determinant of value