Embed Size (px)
Citation preview

8/10/2019 Overlooked and Undercounted: The Struggle to Make Ends Meet in New York City.
http://slidepdf.com/reader/full/overlooked-and-undercounted-the-struggle-to-make-ends-meet-in-new-york-city 1/108
Overlooked and UndercountedThe Struggle to Make Ends Meet in New York City
Prepared for
Women’s Center for Education and
Career Advancement
With support from The United Way of New York CityThe New York Community TrustCity Harvest

8/10/2019 Overlooked and Undercounted: The Struggle to Make Ends Meet in New York City.
http://slidepdf.com/reader/full/overlooked-and-undercounted-the-struggle-to-make-ends-meet-in-new-york-city 2/108
THE WOMEN’S CENTER FOR EDUCATION AND CAREER ADVANCEMENT (WCECA) is a 44-year-
old nonprofit organization committed to the goal of economic self-sufficiency for all New York City women and
families. Through innovative technology resources, work readiness programs and career services, we educate
and advocate for socially just public policies and opportunities that lead to the empowerment of women. The
Women’s Center targets low-income women with serious barriers to workforce participation and helps them build
competencies and develop strategies for setting and meeting lifetime career and economic goals for themselves
and their families. For further information on WCECA, go to http://www.wceca.org or call (212) 964-8934.
UNITED WAY OF NEW YORK CITY (UWNYC) has been a trusted
partner to government, corporations and community-basedorganizations for over 76 years serving low-income New Yorkers. Our
collective impact approach enables us to diagnose neighborhood
challenges, design solutions to expand education, income, and health
opportunities, deploy resources and volunteers, and drive policy change
guided by measured results. UWNYC envisions caring communities where
all individuals and families have access to quality education and the
opportunity to lead healthy and financially secure lives. Join us in making
New York City work for every New Yorker. For more information, visit
United Way of New York City at unitedwaynyc.org, or call (212) 251-2500.
Since 1924, THE NEW YORK COMMUNITY TRUST has been
the home of charitable New Yorkers who share a passion for the
City and its suburbs—and who are committed to improving them.
The Trust supports an array of effective nonprofits that help make
the City a vital and secure place to live, learn, work, and play,
while building permanent resources for the future. The New York
Community Trust ended 2013 with assets of $2.4 billion in more than
2,000 charitable funds, and made grants totaling $141 million. The
Trust welcomes new donors. Information at nycommunitytrust.org.
Now serving New York City for more than 30 years, CITY HARVEST
(www.cityharvest.org) is the world's first food rescue organization, dedicated to
feeding the city’s hungry men, women and children. This year, City Harvest will
collect 50 million pounds of excess food from all segments of the food industry,
including restaurants, grocers, corporate cafeterias, manufacturers, and farms. This
food is then delivered free of charge to more than 500 community food programs
throughout New York City by a fleet of trucks and bikes. City Harvest helps feed
the nearly two million New Yorkers who face hunger each year.

8/10/2019 Overlooked and Undercounted: The Struggle to Make Ends Meet in New York City.
http://slidepdf.com/reader/full/overlooked-and-undercounted-the-struggle-to-make-ends-meet-in-new-york-city 3/108
OVERLOOKED AND UNDERCOUNTEDTHE STRUGGLE TO MAKE ENDS MEET IN NEW YORK CITY
Diana M. Pearce, Ph.D. * December 2014
Director, Center for Women’s Welfare
School of Social Work, University of Washington
Prepared with Lisa Manzer and Karen Segar at the University of Washington,
School of Social Work, Center for Women’s Welfare.

8/10/2019 Overlooked and Undercounted: The Struggle to Make Ends Meet in New York City.
http://slidepdf.com/reader/full/overlooked-and-undercounted-the-struggle-to-make-ends-meet-in-new-york-city 4/108
OVERLOOKED AND UNDERCOUNTED: THE STRUGGLE TO MAKE ENDS MEET IN NEW YORK CITY
© 2014 Diana Pearce and The Women’s Center for Education and Career Advancement

8/10/2019 Overlooked and Undercounted: The Struggle to Make Ends Meet in New York City.
http://slidepdf.com/reader/full/overlooked-and-undercounted-the-struggle-to-make-ends-meet-in-new-york-city 5/108
PREFACE
For the rst time for New York City, this report combines two series—the Self-Sufciency Standard plus
Overlooked and Undercounted—into one report which provides a new view of how the Great Recession has
impacted the struggle to make ends meet. For the past 14 years, Women’s Center for Education and Career
Advancement (WCECA) has arranged for the update of The Self-Sufciency Standard for New York City
in 2000, 2004, and 2010. The Self-Sufciency Standard for New York City 2014 is the fourth edition. The
Overlooked and Undercounted report series answers the questions of how many households live below the Self-
Sufciency Standard for New York City and what are the characteristics of these households.
The Self-Sufciency Standard for New York City measures how much income a family of a certain composition
in a given place must earn to meet their basic needs. Employers, advocates, and legislators can use it to
evaluate wages, provide career counseling, and create programs that lead to economic self-sufciency for
working families.
As with all Self-Sufciency Standard reports, this one was authored by Dr. Diana M. Pearce and produced by
the Center for Women’s Welfare at the University of Washington. This report, plus tables providing borough
specic information for 152 family types, is available at www.selfsufciencystandard.org or www.wceca.org.

8/10/2019 Overlooked and Undercounted: The Struggle to Make Ends Meet in New York City.
http://slidepdf.com/reader/full/overlooked-and-undercounted-the-struggle-to-make-ends-meet-in-new-york-city 6/108
8/10/2019 Overlooked and Undercounted: The Struggle to Make Ends Meet in New York City.
http://slidepdf.com/reader/full/overlooked-and-undercounted-the-struggle-to-make-ends-meet-in-new-york-city 7/108
EXECUTIVE SUMMARY
More than two in ve New York City households—over 940,000 households—lack enough income to cover
just the necessities, such as food, shelter, health care and child care. Yet as measured by the federal poverty
level (FPL), less than half that number is ofcially designated as “poor.” Moving from statistics to people,
this translates to over 2.7 million men, women, and children struggling to make ends meet in New York City.
Consequently, a large and diverse group of New Yorkers experiencing economic distress is routinely overlooked
and undercounted . Many of these hidden poor are struggling to meet their most basic needs, without the help of
work supports (they earn too much income to qualify for most, but too little to meet their needs). To make things
even worse, their efforts are aggravated by the reality that the costs of housing, health care, and other living
costs continue to rise faster than wages in New York City.
To document these trends, we use the yardstick of the Self-Sufciency Standard. This measure answers the
question as to how much income is needed to meet families’ basic needs at a minimally adequate level, including
the essential costs of working, but without any assistance, public or private. Once these costs are calculated, we
then apply the Standard to determine how many—and which—households lack enough to cover the basics.
Unlike the federal poverty measure, the Standard is varied both geographically and by family composition,
reecting the higher costs facing some families (especially child care for families with young children) and insome places.
This report combines two series—the Self-Sufciency Standard plus Overlooked and Undercounted—into
one to present a more accurate picture of income inadequacy in New York City. The rst section presents the
2014 Self-Sufciency Standard for New York City, documenting how the cost of living at a basic needs level
has increased since 2000. The second section uses the American Community Survey to detail the number and
characteristics of households, focusing on those below the Self-Sufciency Standard. This report addresses
several questions:
How much does it cost to live—at a minimally adequate level—in New York City and how does that vary by•
family type and place in the city?How many individuals and families in New York City are working hard yet unable to meet their basic needs?•
Where do people with inadequate income live and what are the characteristics of their households?•
What are the education, occupation, and employment patterns among those with inadequate income?•
What are the implications of these ndings for policymakers, employers, educators, and service providers?•
We nd that New York City families struggling to make ends meet are neither a small nor a marginal group,
but rather represent a substantial and diverse proportion of the city. Individuals and married couples with
children, households in which adults work full time, and people of all racial and ethnic backgrounds account for
substantial portions of those struggling to make ends meet in New York City.

8/10/2019 Overlooked and Undercounted: The Struggle to Make Ends Meet in New York City.
http://slidepdf.com/reader/full/overlooked-and-undercounted-the-struggle-to-make-ends-meet-in-new-york-city 8/108
THE SELF-SUFFICIENCY STANDARD: A MEASURE OF ADEQUATE INCOME
The Self-Sufciency Standard was developed to provide a more accurate, nuanced, and up-to-date measure
of income adequate for basic needs. The Standard reects the realities faced by today’s working parents and
includes all major budget items faced by working adults: housing, child care, food, health care, transportation,
taxes, and miscellaneous costs plus an emergency savings fund.
The Standard is a “bare bones” budget appropriate to family composition; it does not include any restaurant
or take-out food or credit card or loan payments. The Standard is calculated for 37 states and the District of
Columbia. It uses data that are drawn from scholarly and credible sources such as the U.S. Census Bureau, and
that meet strict criteria of being accurate, regularly updated using standardized and consistent methodology,
and which are age- or geography-specic where appropriate. For New York City, the Standard is calculated
for all boroughs and 152 possible household compositions.
What it takes to become self-sufcient in New York City depends on where a family lives, how many people
are in the family and the number and ages of children. For example, for a family consisting of two adults with a
preschooler and a school-age child, South Manhattan has the highest Self-Sufciency Standard at $98,836 peryear. Northwest Brooklyn comes in a distant second at $79,138, and the least expensive area is the Bronx, with
a Standard of $70,319 for this family type.
Overall, since 2000, for a family with two adults, a preschooler, and school-age child, the Self-Sufciency
Wage has increased on average by 45%, largely due to an average increase in housing costs of 59%. In
contrast, the median earnings of working adults have increased only 17% over the same 14 years.
KEY FINDINGS
With more than two out of ve New York City households lacking enough income to meet their basic needs, the
problem of inadequate income is extensive, affecting families throughout the city, in every racial/ethnic group,
among men, women, and children, in all neighborhoods. Nevertheless, inadequate income is concentrated
disproportionately in some places and groups.
GEOGRAPHICALLY, THE BRONX HAS THE HIGHEST RATE OF INCOME INADEQUACY AND SOUTH
MANHATTAN, NORTHWEST BROOKLYN AND STATEN ISLAND ARE THE LOWEST.
With over half (56%) of all households below the Standard, the Bronx has the highest overall income
inadequacy rate of the ve boroughs. Within the Bronx, there are four districts/neighborhoods with income
inadequacy rates over 75%, and four more with rates above 50%. However, every borough has at least one
district with an income inadequacy rate above 50%, except Staten Island. While Staten Island, Northwest
Brooklyn and South Manhattan have the lowest rates of income inadequacy (29%, 29% and 27%,
respectively), most New Yorkers with incomes below the Standard live in the boroughs with income inadequacy
rates that are near the citywide average: Queens (43%), North Manhattan (45%), and Brooklyn (excluding
Northwest) (49%).
FOUR OUT OF FIVE HOUSEHOLDS WITH INADEQUATE INCOME ARE PEOPLE OF COLOR, WITH LATINOS
BEING THE GROUP MOST AFFECTED.
While all groups experience insufcient income, Latinos have the highest rate of income inadequacy, with 61%
of Latino households having insufcient income, followed by Native American, Alaska Natives, and other races
(51%), Asians and Pacic Islanders (49%), African Americans (48%), and Whites (24%).
8/10/2019 Overlooked and Undercounted: The Struggle to Make Ends Meet in New York City.
http://slidepdf.com/reader/full/overlooked-and-undercounted-the-struggle-to-make-ends-meet-in-new-york-city 9/108
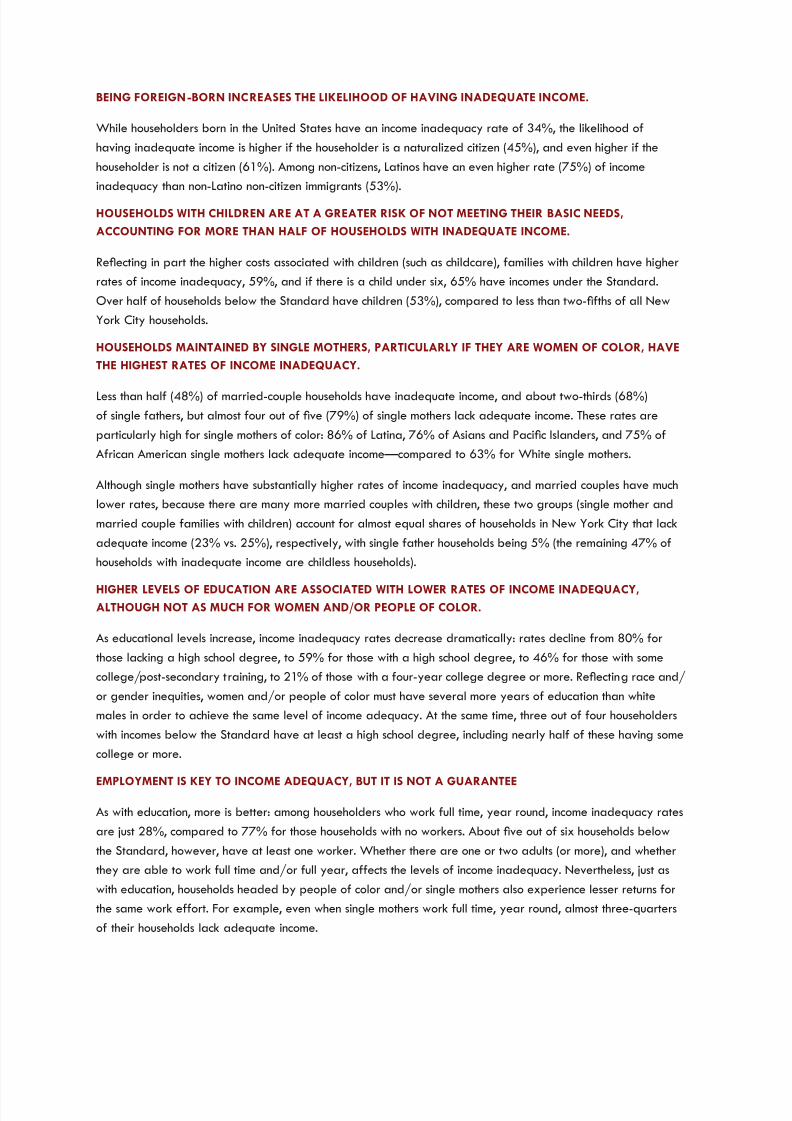
BEING FOREIGN-BORN INCREASES THE LIKELIHOOD OF HAVING INADEQUATE INCOME.
While householders born in the United States have an income inadequacy rate of 34%, the likelihood of
having inadequate income is higher if the householder is a naturalized citizen (45%), and even higher if the
householder is not a citizen (61%). Among non-citizens, Latinos have an even higher rate (75%) of income
inadequacy than non-Latino non-citizen immigrants (53%).
HOUSEHOLDS WITH CHILDREN ARE AT A GREATER RISK OF NOT MEETING THEIR BASIC NEEDS,
ACCOUNTING FOR MORE THAN HALF OF HOUSEHOLDS WITH INADEQUATE INCOME.
Reecting in part the higher costs associated with children (such as childcare), families with children have higher
rates of income inadequacy, 59%, and if there is a child under six, 65% have incomes under the Standard.
Over half of households below the Standard have children (53%), compared to less than two-fths of all New
York City households.
HOUSEHOLDS MAINTAINED BY SINGLE MOTHERS, PARTICULARLY IF THEY ARE WOMEN OF COLOR, HAVE
THE HIGHEST RATES OF INCOME INADEQUACY.
Less than half (48%) of married-couple households have inadequate income, and about two-thirds (68%)
of single fathers, but almost four out of ve (79%) of single mothers lack adequate income. These rates are
particularly high for single mothers of color: 86% of Latina, 76% of Asians and Pacic Islanders, and 75% of
African American single mothers lack adequate income—compared to 63% for White single mothers.
Although single mothers have substantially higher rates of income inadequacy, and married couples have much
lower rates, because there are many more married couples with children, these two groups (single mother and
married couple families with children) account for almost equal shares of households in New York City that lack
adequate income (23% vs. 25%), respectively, with single father households being 5% (the remaining 47% of
households with inadequate income are childless households).
HIGHER LEVELS OF EDUCATION ARE ASSOCIATED WITH LOWER RATES OF INCOME INADEQUACY,ALTHOUGH NOT AS MUCH FOR WOMEN AND/OR PEOPLE OF COLOR.
As educational levels increase, income inadequacy rates decrease dramatically: rates decline from 80% for
those lacking a high school degree, to 59% for those with a high school degree, to 46% for those with some
college/post-secondary training, to 21% of those with a four-year college degree or more. Reecting race and/
or gender inequities, women and/or people of color must have several more years of education than white
males in order to achieve the same level of income adequacy. At the same time, three out of four householders
with incomes below the Standard have at least a high school degree, including nearly half of these having some
college or more.
EMPLOYMENT IS KEY TO INCOME ADEQUACY, BUT IT IS NOT A GUARANTEE
As with education, more is better: among householders who work full time, year round, income inadequacy rates
are just 28%, compared to 77% for those households with no workers. About ve out of six households below
the Standard, however, have at least one worker. Whether there are one or two adults (or more), and whether
they are able to work full time and/or full year, affects the levels of income inadequacy. Nevertheless, just as
with education, households headed by people of color and/or single mothers also experience lesser returns for
the same work effort. For example, even when single mothers work full time, year round, almost three-quarters
of their households lack adequate income.

8/10/2019 Overlooked and Undercounted: The Struggle to Make Ends Meet in New York City.
http://slidepdf.com/reader/full/overlooked-and-undercounted-the-struggle-to-make-ends-meet-in-new-york-city 10/108
The data further demonstrate that the unequal returns to employment efforts are due in part to being
concentrated in just a few occupations. That is, those below the Standard only share six of the “top twenty”
occupations (the occupations with the most workers) with those with incomes above the Standard. Eight of the top
20 occupations have median earnings less than the equivalent of a full-time minimum wage job. These low wage
occupations are largely held by householders trying to support families and are not limited to part-time jobs for
teenagers.
Differences in income adequacy rates are largely not explained by hours worked. While full-time, year-
round work (regardless of the occupation) may help protect against income inadequacy, householders with
incomes above the Standard work only about ve percent more hours on average than those below the
Standard. However, their wage rates vary greatly, with the hourly wages of householders above the Standard
being almost three times as much as those below the Standard ($28.85 per hour versus $10.58 per hour). If
householders with incomes below the Standard increased their work hours to match those with incomes above
the Standard, that would only close about three percent of the wage gap, while earning the higher wage rate
of those above the Standard, with no change in hours worked, would close 92% of the gap.
Thus, families are not poor just because they lack workers or work hours, but because the low wages they earnare inadequate to meet basic expenses.
HOW NEW YORK CITY COMPARES TO OTHER STATES
To date, demographic reports have been done on seven states (California, Colorado, Connecticut, Mississippi,
New Jersey, Pennsylvania, and Washington State), but no other cities in detail. In ve of these states (the
exceptions being Mississippi and California), the proportion of households with inadequate income is strikingly
similar, with about one out of ve (non-elderly, non-disabled) households lacking adequate income. In California
and Mississippi, both states with higher than average minority proportions, about one-third of households fall
below the Standard. At 42%, New York City has a higher rate of income inadequacy than all of these states.
Even compared to other large cities, New York City still has a relatively high rate of income inadequacy.
San Francisco and Denver are at 27% and 26%, respectively. Cities that are more similar to New York,
demographically, such as Pittsburgh (32%) and Philadelphia (42%) show similar patterns of having higher
income inadequacy rates than the states they are located in. Nevertheless, it is striking that when a realistic
measure of basic living costs is used, New York City has an income inadequacy rate that is even higher than that
of Mississippi which consistently has had the highest “poverty” rates.
CONCLUSION
These data show that there are many more people in New York City who lack enough income to meet their
basic needs than our government’s ofcial poverty statistics capture. This lack of sufcient income to meet basic
needs is grossly undercounted largely because most American institutions do not utilize the more accurate metrics
available today that measure what it takes to lead a life of basic dignity.
Not only do we underestimate the number of households struggling to make ends meet, but broadly held
misunderstandings about what those in need look like, what skills and education they hold, and what needs they
have harm the ability of our institutions to respond to the changing realities facing low-income families. New
8/10/2019 Overlooked and Undercounted: The Struggle to Make Ends Meet in New York City.
http://slidepdf.com/reader/full/overlooked-and-undercounted-the-struggle-to-make-ends-meet-in-new-york-city 11/108
York City households with inadequate income reect the city’s diversity: they come from every racial and ethnic
group, reect every household composition, and work hard as part of the mainstream workforce.
Despite recovering from the Great Recession, this is not about a particular economic crisis—for these families,
income inadequacy is an everyday ongoing crisis. It is our hope that through the data and analyses presented
here a better understanding of the difculties faced by struggling individuals and families will emerge, one that
can enable New York City to address these challenges, making it possible for all New York City households to
earn enough to meet their basic needs.
POLICY RECOMMENDATIONS
As the country’s largest city—rich in resources and leaders—New York City must expand the numbers of New
Yorkers living securely above the Self-Sufciency Standard. This report’s recommendations for moving the
greatest number of New Yorkers towards self-sufciency are consistent with the City’s priorities and have been
determined from a similar systematic, cost-effective and evidence-driven framework.1 Our recommendations
acknowledge that the obstacles to self-sufciency are interdependent and to signicantly reduce the number of
people living below the Standard or just above it, solutions must also be coordinated and interconnected.
We call on leaders across all sectors—government, philanthropy, the private sector and the not-for-prot
world—to examine practices, mobilize colleagues, and become part of the solution for making the following
three priorities a reality:
Wages increased to align and keep pace with the costs of living;1.
Employment structured as a pathway to self-sufciency and economic security; and2.
Access to quality, affordable housing, food and child care available to New Yorkers across the income3.
spectrum.
1
New York City’s Center for Economic Opportunity notes that many of the factors that drive poverty here are part of national or even international trends that are difcultto address at the City level. Nonetheless, strategies to reduce poverty and inequality are central to the agenda of Mayor Bill de Blasio and his Administration. NYC Ofce
of the Mayor, “The CEO Poverty Measure 2005-2012,” An Annual Report from the Ofce of the Mayor, April 2014, p. 47, http://www.nyc.gov/html/ceo/downloads/pdf/ceo_poverty_measure_2005_2012.pdf (accessed November 14, 2014).

8/10/2019 Overlooked and Undercounted: The Struggle to Make Ends Meet in New York City.
http://slidepdf.com/reader/full/overlooked-and-undercounted-the-struggle-to-make-ends-meet-in-new-york-city 12/108
CONTENTS
THE BENCHMARK MEASURE:
THE SELF-SUFFICIENCY STANDARD FOR NEW YORK CITY 2014 3
OVERLOOKED AND UNDERCOUNTED 11
GLOSSARY OF KEY TERMS • 12
THE GEOGRAPHIC DISTRIBUTION OF INCOME ADEQUACY • 16
RACE/ETHNICITY, CITIZENSHIP, AND LANGUAGE • 17
EDUCATION • 22
EMPLOYMENT AND WORK PATTERNS • 25
NEW YORK CITY COMPARED TO SELECTED STATES • 37
CONCLUSION • 40
POLICY ANALYSIS & RECOMMENDATIONS 41
APPENDIX A: METHODOLOGY & DATA SOURCES 50
OVERLOOKED & UNDERCOUNTED • 51
THE SELF-SUFFICIENCY STANDARD • 52
OTHER APPROACHES TO MEASURING POVERTY • 60
APPENDIX B: DETAILED DATA TABLES 63
APPENDIX C: PRACTICAL APPLICATIONS 91

8/10/2019 Overlooked and Undercounted: The Struggle to Make Ends Meet in New York City.
http://slidepdf.com/reader/full/overlooked-and-undercounted-the-struggle-to-make-ends-meet-in-new-york-city 13/108
Introduction
This report reveals the dramatic impact that growing income inequality, exacerbated by the Great
Recession, has had on the lives of New York City households. America entered this economic crisisalready experiencing both widening income inequality and the “crunch”—decades of stagnating
wages contrasted with rising costs. Even before the recession, more and more households found their
costs outstripping their incomes, even if they worked as many hours as possible. These trends have
continued during and after the recession as incomes have stagnated or fallen while the costs of the
basics like food and housing have continued to rise.
To document these trends, we use the yardstick of the Self-Sufciency Standard. This measure
answers the question as to how many—and which—households lack enough income to meet their
basic needs at a minimally adequate level, including the essential costs of working. Unlike the federal
poverty measure, the Standard is varied both geographically and by family composition, reectingthe higher cost needs of some families (especially child care for families with young children).
This report has a dual focus: it will describe those who experience inadequate income in 2012 as a
function of the growth of income inequality over the last several decades. But it will also reect the
Great Recession: although it ofcially ended in the summer of 2009, the economic impact continues
to be felt, and so this text reects the common understanding that the economy is still “in recession”
even if ofcially it is “in recovery.”
8/10/2019 Overlooked and Undercounted: The Struggle to Make Ends Meet in New York City.
http://slidepdf.com/reader/full/overlooked-and-undercounted-the-struggle-to-make-ends-meet-in-new-york-city 14/108
The basics of the report are as follows, with more detail in successive sections, as well as
methodology and the practical applications of this material in the Appendices:
1. The baseline measure for this analysis is the Self-Sufciency Standard, a realistic,
geographically specic and family composition-specic measure of income adequacy, and thus a
more accurate alternative to the Federal Poverty Level (FPL). The rst section of this report presents
the 2014 Self-Sufciency Standard for New York City.
2. The second section of the report documents and describes who is above versus below the
Standard. It uses the Standard and data from the 2012 American Community Survey. The method is
straightforward: household incomes are compared to the New York City Self-Sufciency Standard
(as well as the FPL) to determine which households are above or below the Standard (as well as the
FPL). Then, the proportion of households who are above versus below the Standard (and the FPL)
are compared, across a wide range of household characteristics—geographic location, race and
ethnicity, employment patterns, gender, and occupation.
3. The nal section builds from the ndings and detailed data presented in this report as the
New York City Self-Sufciency Standard Committee spells out specic recommendations for theneeds of families struggling to achieve self-sufciency in New York City.

8/10/2019 Overlooked and Undercounted: The Struggle to Make Ends Meet in New York City.
http://slidepdf.com/reader/full/overlooked-and-undercounted-the-struggle-to-make-ends-meet-in-new-york-city 15/108
THE BENCHMARK MEASURE:
THE SELF-SUFFICIENCY STANDARD FORNEW YORK CITY 2014

8/10/2019 Overlooked and Undercounted: The Struggle to Make Ends Meet in New York City.
http://slidepdf.com/reader/full/overlooked-and-undercounted-the-struggle-to-make-ends-meet-in-new-york-city 16/108
Even without job loss or home foreclosure, the Great Recession impacted the lives of American
households across the economy in many ways. The United States entered the economic crisis with
stagnating wages and widening income inequality, and these trends continue. As a result, millionsnd that even with full-time jobs they are unable to stretch their wages to pay for basic necessities.
Indeed, in many places in New York City the gap between income and expenses has continued
to widen as the costs of food, housing, transportation, health care, and other essentials rose even
during the Great Recession.
To properly describe the growing gap between sluggish wages and ever increasing expenses
requires an accurate measure of income adequacy, one that is consistent over time and across
space. The Self-Sufciency Standard represents such a benchmark measure. The Self-Sufciency
Standard calculates the true cost of living facing American families, illuminating the economic
“crunch” experienced by so many families today.1 Moreover, over the last 18 years, calculation of
the Self-Sufciency Standard has documented the continuing increase in the real cost of living, even
during the recession.
The Self-Sufciency Standard for New York City 2014 denes the amount of income necessary tomeet the basic needs of New York City families, differentiated by family type and where they live.
The Standard calculates the cost of six basic needs plus taxes and tax credits. It assumes the full
cost of each need, without help from public subsidies (e.g., public housing, Medicaid, or child care
assistance) or private/informal assistance (e.g., unpaid babysitting by a friend or relative, food from
food banks, or shared housing). Additionally, for the rst time, the 2014 report calculates the cost of
emergency savings.
1 Jared Bernstein, Crunch: Why Do I Feel so Squ eezed (and other Unsolved Economic Mysteries), (San Francisco, CA: Berrett-Koehler Publishers, Inc., 2008).
The Self-Sufciency Standard measures how much income a familyof a certain composition in a given place needs to adequately meettheir basic needs— without public or private assistance.
The Benchmark Measure

8/10/2019 Overlooked and Undercounted: The Struggle to Make Ends Meet in New York City.
http://slidepdf.com/reader/full/overlooked-and-undercounted-the-struggle-to-make-ends-meet-in-new-york-city 17/108
NEW YORK CITY | 5
A REAL-WORLD APPROACH TO
MEASURING NEED
Though innovative for its time, many
researchers and policy analysts have
concluded that the ofcial poverty
measure, developed over four
decades ago by Mollie Orshansky, is
methodologically dated and no longer
an accurate measure of poverty.
Beginning with studies such as Ruggles’
Drawing the Line (1990),2 many have
critiqued the ofcial measure.3 Even
the Census Bureau now characterizes
the federal poverty measure as a
“statistical yardstick rather than acomplete description of what people
and families need to live.”4 Others have
offered alternatives, such as Renwick
and Bergman’s article proposing a
“basic needs budget” (1993).5
These discussions culminated in the
early 1990s with a congressionally
mandated comprehensive study by the
National Academy of Sciences (NAS),
which brought together hundreds of
scientists, and commissioned studies and
papers. These studies were summarized
in the 1995 book, Measuring Poverty:
A New Approach, which included a
set of recommendations for a new
approach. Despite substantial consensus
on a wide range of methodological
issues and the need for new measures,
no changes have been made to the
FPL itself. However, based on the NAS
2 Ruggles, P. (1990). Drawing the line: Alternativepoverty measures and their implications for public
policy. The Urban Ins titute, Washington, D.C.3 Citro, C. & Michael, R. Eds. (1995). Measuring poverty: A
new approach. Washington, DC: N ational Academy Press.4 Dalaker, Poverty in the United States: 2000. (U.S. CensusBureau, Current Population Reports, Series P60-214). U.S.
Government Printing Ofce (Washington, D.C., 2001).5 Bergmann, B. & Renwick, T. (1993). “A budget-baseddenition of poverty: With an application to single-parentfamilies.” The Journal of Human Resources, 28 (1), 1-24.
model, the Census Bureau has developed
alternative measures, put forth rst
as “experimental,” and since 2012
published annually as the Supplemental
Poverty Measure.6 Likewise, in New York
City the Center for Economic Opportunityhas been producing a poverty measure
based on the NAS since 2008 (for more
information see Other Approaches to
Measuring Poverty in Appendix A).
Taking into account the critiques of
the FPL, and drawing on both the
NAS analyses and alternative “basic
needs” budget proposals (such as
that of Renwick), the Self-Sufciency
Standard was developed to provide
a more accurate, nuanced measure of
income adequacy.7 While designed
to address the major shortcomings of
the FPL, the Self-Sufciency Standard
also more substantially reects the
realities faced by today’s working
parents, such as child care and taxes,
which are not addressed in the federal
poverty measure or the Supplemental
Poverty Measure. Moreover, theStandard takes advantage of the
greater accessibility, timeliness, and
6 Designed primarily to track poverty trends over time,the Supplemental Poverty Measure provides a new and
improved statistic to better understand the prevalence ofpoverty in the United States. The SPM is not intended to be
a replacement for the FPL, but it will provide policymakerswith additional data on the extent of poverty and the impact
of public policies. Thesia I. Garner and Kathleen S. Short,
“Creating a Consistent Poverty Measure Over Time UsingNAS Procedures: 1996-2005,” U.S. Department of Labor, BLS
Working Papers, Working Paper 417, April 2008, ht tp://www.bls.gov/osmr/pdf/ec080030.pdf (accessed June 25, 2014).7 The Self-Sufciency Standard was developed in the mid-1990sby Diana Pearce as an alternative performance standard in
the workforce development system to measure more accuratelyand specically what would be required to meet the goal
of “self-sufciency” for each individual participant. Thedevelopment of the Self-Sufciency Standard has also beneted
from other attempts to create alternatives, such as Living Wagecampaigns, the National Academy of S ciences studies, and Trudi
Renwick’s work. See Trudi Renwick and Barbara Bergmann,“A budget-based denition of poverty: With an application
to single-parent families,” The Journal of Human Resources,28(1), (1993) p. 1-24. For a more detailed discussion of the
methodology of the Self-Sufciency Standard see Appendix A
accuracy of current data and software
not in existence ve decades ago.
The major differences between the
Self-Sufciency Standard and the
Federal Poverty Level include:
The Standard is based on all major•
budget items faced by working adults
(age 18-64 years): housing, child care,
food, health care, transportation, and
taxes. In contrast, the FPL is based
on only one item—a 1960s food
budget. Additionally, while the FPL
is updated for ination, there is no
adjustment made for the fact that the
cost of food as a percentage of thehousehold budget has decreased over
the years. In contrast, the Standard
allows different costs to increase at
different rates and does not assume
that any one cost will always be a
xed percentage of the budget.
The Standard reects the changes in•
workforce participation over the past
several decades, particularly among
women. It does this by assuming
that all adults work to support their
families, and thus includes work-related
expenses, such as transportation, taxes
and child care. The FPL continues to
reect—implicitly—a demographic
model of mostly two-parent families
with a stay-at-home wife.
The Standard varies geographically •
and is calculated on a locale-specic basis (usually by county),
while the FPL is calculated the same
regardless of where one lives in
the continental United States.
The Standard varies costs by the age•
of children. This factor is particularly

8/10/2019 Overlooked and Undercounted: The Struggle to Make Ends Meet in New York City.
http://slidepdf.com/reader/full/overlooked-and-undercounted-the-struggle-to-make-ends-meet-in-new-york-city 18/108
6 | OVERLOOKED AND UNDERCOUNTED
important for child care costs, but also
for food and health care costs, which
also vary by age. While the FPL takes
into account the number of adults
and children, there is no variation in
cost based on the ages of children.
The Standard includes the net effect•
of taxes and tax credits, which not
only provides a more accurate
measurement of income adequacy,
but also illuminates the impact of
tax policy on net family income.
Because at the time of its inception
low-income families paid minimal
taxes, and there were no refundable
tax credits (such as the Earned Income
Tax Credit), the FPL does not include
taxes or tax credits, even implicitly.
The resulting Self-Sufciency Standards8
are basic needs, no-frills budgets created
for all family types in each county in
a given state. For example, the food
budget contains no restaurant or take-
out food, even though Americans spend
an average of over 41% of their foodbudget on take-out and restaurant food.9
The Standard does not include retirement
savings, education expenses, or debt
repayment, nor does the Standard
address “asset-building” strategies.
However, for the rst time, the Standard
now includes emergency savings.
THE SELF-SUFFICIENCY STANDARD
BUDGET
Figure A shows an example of the Self-
Sufciency Standard, with each monthly
8 The Self-Sufciency Standard has been calculatedfor 37 states plus the District of Columbia.9 U.S. Department of Labor, Bureau of Labor
Statistics, “Consumer Expenditures in 2012,” EconomicNews Release, http://www.bls.gov/news.release/
cesan.nr0.htm (accessed June 7, 2014).
expense included as a proportion
of the total income necessary for a
family with two adults, one preschooler,
and one school-age child in Brooklyn
(excluding Northwest Brooklyn).
By far, housing and child care•
combined are the most expensive
costs for families. Families with
children (when one is under school-age) generally spend about
half their income on housing and
child care expenses alone.
Food costs for this family are•
14% of total income, much lower
than the 33% assumed by the
methodology of the FPL.
Taxes are 21% of the family•
budget; however, after accounting
for tax credits the net tax burden
decreases to 16% of the total costs.
Health care accounts for 10% of the•
family budget, including both the
employees’ share of the health care
premium and out-of-pocket costs.
Transportation costs account for•
4% of total monthly costs. The
Standard for Brooklyn, as well as all
other boroughs in New York City, is
HOUSING, 22%
CHILD CARE, 25%
FOOD, 14%
TRANSPORTATION, 4%
HEALTH CARE, 10%
MISCELLANEOUS, 7%
TAXES-NET*, 16%
EMERGENCY SAVINGS, 2%
FIGURE A Basic Needs as a Proportion of the StandardTwo Adults, One Preschooler, and One School-Age Child: Brooklyn(Kings County, Excluding Northwest Brooklyn), NYC 2014
* The actual percentage of income needed for taxes without the inclusion of tax credits is 21%. However, with taxcredits included, as in the Standard, the family receives money back, and the amount owed in taxes is reduced to
16%. The Self-Sufciency Standard is $6,013 per month and the emergency savings fund for is $126 per month.
THE SELF-SUFFICIENCY STANDARD PLUS EMERGENCY SAVINGS
IS $6,139 MONTHLY

8/10/2019 Overlooked and Undercounted: The Struggle to Make Ends Meet in New York City.
http://slidepdf.com/reader/full/overlooked-and-undercounted-the-struggle-to-make-ends-meet-in-new-york-city 19/108
NEW YORK CITY | 7
ANNUAL SELF-SUFFICIENCY WAGE
$0
$20,000
$40,000
$60,000
$80,000
Adult One Adult
One PreschoolerOne Adult
One Preschooler
One School-Age Child
FPL =
$11,670
FPL =
$15,730
FPL =
$19,790
FPL =
$23,850
$59,502
$71,878$73,673
$32,432
Two Adults
One Preschooler
One School-Age Child
FIGURE B The Self-Sufciency Standard and Federal Poverty Measure forSelect Family Types, Queens, NYC 2014
calculated assuming workers use public
transportation to get to and from
work, child care, and for other trips.
The monthly addition to the•
emergency savings fund is
2% of the family budget.
Miscellaneous items (such as clothing•
and household items) make up
7% of household costs. Note that
miscellaneous expenses are calculated
as 10% of basic costs before taxes
and tax credits. As demonstrated in
Figure A, after including taxes and
tax credits into the calculation of the
Self-Sufciency Wage, miscellaneousexpenses make up a smaller
proportion of the total budget needed.
See Appendix A for specic
details on how the Self-Sufciency
Standard is calculated.
FAMILY COMPOSITION VARIATION IN
THE SELF-SUFFICIENCY STANDARD
The amount of money families need to
be economically self-sufcient varies
drastically depending on family size and
the geographic region of residence. For
example, Figure B shows that in Queens
the Self-Sufciency Standard varies
substantially depending on family type:
A single adult needs to earn•
$32,432 annually to be able to
meet his or her basic needs.
One parent caring for a preschool-•
aged child needs $59,502 per
year to be self-sufcient.
One parent with two children—a•
preschooler and school-age
child—needs $71,878 to meet
her family’s basic needs.
EMERGENCY SAVINGS
The Self-Sufciency Standard
for New York City 2014 includes
a calculation for an emergency
savings fund. For all families,
having savings to meet unexpected
emergencies is a necessary
step towards economic security.
Whether it is an accident,
unemployment, an unexpected loss
of a family member, the unforeseen
happens, and is likely to have a
greater nancial impact on low-
income families.
Emergency savings are intended
to cover the basic living expenses
included in the Standard during
a period of unemployment. The
emergency savings fund is the
amount needed to do so, net of the
amount expected to be received in
unemployment benets. The amount
calculated takes into account the
average tenure on a job of New
York workers (ve years) and the
average length of the job loss
period (4.33 months).
In two adult households, it is
assumed that the second adult
continues to be employed, so that
the savings only need to cover half
of the family’s basic living expenses
over the job loss period. Since
the monthly emergency savings
contribution requires additional
earnings, the estimate includes the
calculation of taxes that would be
needed for the additional earnings,
using the applicable tax rates atcurrent earnings levels, that is, at
the Self-Sufciency Standard level.
See Appendix A for more
information on the methodology
and data sources for calculating
the Emergency Savings Fund
amounts.

8/10/2019 Overlooked and Undercounted: The Struggle to Make Ends Meet in New York City.
http://slidepdf.com/reader/full/overlooked-and-undercounted-the-struggle-to-make-ends-meet-in-new-york-city 20/108
8 | OVERLOOKED AND UNDERCOUNTED
therefore does not adequately account
for the real costs of meeting basic needs.
GEOGRAPHIC VARIATION IN THE
SELF-SUFFICIENCY STANDARD
In addition to varying by family
composition, the Self-Sufciency
Standard also varies by geographic
location. Table 1 shows the variation
in the monthly cost of each basic
need and the Self-Sufciency Wage
for one adult and one preschooler
in each borough. The map in Figure
C visually displays the geographic
variation in the Standard across NewYork City’s boroughs for families with
one adult and one preschooler.
Two parents with one preschooler•
and one school-age child need to
earn $73,673 annually to meet
their family’s basic needs.
As mentioned above, the most signicant
shortcoming of the federal poverty
measure is that for most families, in most
places, the poverty level is simply too low .
Figure B, demonstrates that for various
family types in Queens the income
needed to meet basic needs is far above
the FPL. While the Standard changes by
family type to account for the increase
in costs specic to the type of family
member—whether this person is an adult
or child, and for children, by age—the
FPL increases by a constant $4,060 for
each additional family member and
The 2014 Self-Sufciency Standard for
one parent with one preschooler ranges
from $52,776 to $81,434 annually.
South Manhattan has the highest•
Self-Sufciency Standard for this
family type, at $81,434 a year.
Table 1 demonstrates that South
Manhattan’s housing costs are by
far the most expensive in the city.
Northwest Brooklyn and Queens are•
the next most expensive places in New
York City with annual Standards of
$62,385 and $59,502, respectively,
for one adult and one preschooler.
The Self-Sufciency Standard for•
this family type in Staten Island
and Brooklyn (excluding the
TABLE 1. The Self-Sufciency Standard for New York City, NYC SSS 2014 One Adult and One Preschooler, All Boroughs
MONTHLY COSTS THE BRONXNORTHWEST
BROOKLYN1
BROOKLYN
(EXCLUDING
NORTHWEST)
NORTH
MANHATTAN2
SOUTH
MANHATTAN2QUEENS
STATEN
ISLAND
Housing $1,214 $1,693 $1,340 $1,125 $2,394 $1,554 $1,328
Child Care $960 $960 $960 $960 $960 $960 $960
Food $431 $415 $415 $558 $558 $415 $442
Transportation $112 $112 $112 $112 $112 $112 $112
Health Care $521 $521 $521 $521 $521 $521 $521
Miscellaneous $324 $370 $335 $328 $454 $356 $336
Taxes $969 $1,261 $1,039 $994 $1,920 $1,173 $1,048
Earned Income Tax Credit (-) $0 $0 $0 $0 $0 $0 $0
Child Care Tax Credit (-) ($50) ($50) ($50) ($50) ($50) ($50) ($50)
Child Tax Credit (-) ($83) ($83) ($83) ($83) ($83) ($83) ($83)
SELF-SUFFICIENCY WAGE
Hourly $24.99 $29.54 $26.07 $25.37 $38.56 $28.17 $26.22
Monthly $4,398 $5,199 $4,588 $4,464 $6,786 $4,958 $4,614
Annual $52,776 $62,385 $55,059 $53,571 $81,434 $59,502 $55,370
EMERGENCY SAVINGS $179 $203 $185 $181 $245 $196 $186
1 Northwest Brooklyn includes the following sub-boroughs: Williamsburg/Greenpoint, Brooklyn Heights/Fort Greene, and Park Slope/Carroll Gardens.2 North Manhattan includes the following sub-boroughs: Morningside Heights/Hamilton Heights, Central Harlem, East Harlem, and Washington Heights/Inwood.
South Manhattan sub-boroughs: Greenwich Village/Financial District, Lower East Side/Chinatown, Chelsea/Clinton/Midtown, Stuyvesant Town/Turtle Bay, Upper West Side, andUpper East Side.

8/10/2019 Overlooked and Undercounted: The Struggle to Make Ends Meet in New York City.
http://slidepdf.com/reader/full/overlooked-and-undercounted-the-struggle-to-make-ends-meet-in-new-york-city 21/108
NEW YORK CITY | 9
TABLE 2. The Self-Sufciency Standard by Borough and NYC Median Earnings Over Time:One Adult, One Preschooler, and One School-Age Child in 2000, 2004, 2010, and 2014
BOROUGH 2000 2004 2010 2014% INCREASE:
2000 TO 2014
THE BRONX $44,212 $49,874 $60,934 $65,411 48%
BROOKLYN $44,594 $51,567 $63,166 - -
NORTHWEST BROOKLYN* - - - $75,115 68%
BROOKLYN(EXCLUDING NORTHWEST BROOKLYN)*
- - - $67,427 51%
NORTH MANHATTAN $48,051 $48,995 $57,831 $67,444 40%
SOUTH MANHATTAN $74,231 $77,957 $91,552 $96,414 30%QUEENS $46,840 $54,961 $65,943 $71,878 53%
STATEN ISLAND $46,734 $53,874 $65,695 $67,989 45%
BOROUGH AVERAGE 48%
NYC MEDIAN EARNINGS** $29,079 $30,448 $33,809 $34,019 17%
* 2014 is the rst year that Brooklyn has been calculated for two areas.
** U.S. Census Bureau, American Community Survey (ACS). 2000, 2004, 2008, 2010, and 2012.Detailed Tables. B20002. Median earnings in the past 12 months by sex forthe population 16 years and over with earnings in the past 12 months. Retrieved from http://factnder.census.gov/. 2012 data is the latest available and is updated using theConsumer Price Index for the New York metropolitan region.
northwest communities) are both
just over $55,000 annually.
The two least expensive places•
in this comparison have annual
Self-Sufciency Standards below
$55,000 for one adult and one
preschooler: $52,776 in the Bronx
and $53,571 in North Manhattan.
HOW HAS THE SELF-SUFFICIENCY
WAGE CHANGED OVER TIME?
In order to illustrate changes in the
cost of living over time, this section
compares the Self-Sufciency Wages
for all four editions of the New York
City Standard using one parent with
one preschooler and one school-age
child as the sample family type.
The increase in the Self-Sufciency
Wage over the last 14 years is
attributed to a rise in costs for nearly
all basic needs. Some costs grew at
FIGURE C The Self-Sufciency Standard for New York City, One Adult and One Preschooler, 2014
The Bronx
Queens
Brooklyn
Staten Island
North Manhattan
South Manhattan
$53,571
$55,059
$59,502
$81,434
$52,776
$55,370
Northwest Brooklyn
$62,385
8/10/2019 Overlooked and Undercounted: The Struggle to Make Ends Meet in New York City.
http://slidepdf.com/reader/full/overlooked-and-undercounted-the-struggle-to-make-ends-meet-in-new-york-city 22/108
10 | OVERLOOKED AND UNDERCOUNTED
a similar rate for all boroughs while
other costs increased at varying rates.
Transportation increased by 78%•
in New York City between 2000
and 2014. The cost of an unlimited
ride metro card increased from
$63 in 2000 to $112 in 2014.
Housing costs increased at varying•
rates in each place since 2000,
increasing on average by 59%
(excluding Brooklyn). Housing costs
increased in Queens by 73%, in
the Bronx and North Manhattan
by 64%, by 50% in Staten Island,
and by 45% in South Manhattan. If
Brooklyn had not been split for the
2014 Standard, housing costs would
have increased 71% since 2000.
On average, food costs have increased•
across New York City boroughs by
59% between 2000 and 2014.
Food costs increased in Queens by
42%, in Brooklyn by 43%, in the
Bronx by 48%, in Staten Island by
52%, and in Manhattan by 92%.
In 2000, the cost of health insurance•
was much higher in Manhattan
than all other boroughs. However,
health insurance no longer varies by
THE SELF-SUFFICIENCY WAGE FOR AN ADULT WITH ONE PRESCHOOLER AND ONE SCHOOL-AGE CHILD
HAS INCREASED ON AVERAGE BY 48% ACROSS BOROUGHS. IN CONTRAST, MEDIAN EARNINGS OF
WORKING ADULTS INCREASED BY 17%
borough in the 2014 Standard. As
a result, health costs in Manhattan
decreased by 5% while the other
boroughs increased by 82% to 84%.
Child care costs increased•
by 25% for this family type
between 2000 and 2014.
Overall, since the rst calculation of the
New York City Standard in 2000, the
Self-Sufciency Wage for an adult with
one preschooler and one school-age
child has increased on average by 48%
across boroughs. In contrast, median
earnings of working adults increased
by 17% (from $29,079 to $34,019).
8/10/2019 Overlooked and Undercounted: The Struggle to Make Ends Meet in New York City.
http://slidepdf.com/reader/full/overlooked-and-undercounted-the-struggle-to-make-ends-meet-in-new-york-city 23/108
8/10/2019 Overlooked and Undercounted: The Struggle to Make Ends Meet in New York City.
http://slidepdf.com/reader/full/overlooked-and-undercounted-the-struggle-to-make-ends-meet-in-new-york-city 24/108
GLOSSARY OF KEY TERMSAMERICAN COMMUNITY SURVEY (ACS). The ACS isa sample survey of over three million addressesadministered by the Census Bureau. The ACSpublishes social, housing, and economic characteristicsfor demographic groups covering a broad spectrumof geographic areas with populations of 65,000 ormore in the United States and Puerto Rico.
API. The acronym API is used in some of the tablesand gures in this report for Asian and PacicIslander.
FAMILY HOUSEHOLD. A household in which thereare two or more persons (one of whom is thehouseholder) residing together and who are relatedby birth, marriage or adoption.
FEDERAL POVERTY LEVEL (FPL). When this study uses FPLin reference to the number of households in poverty,
we are referring to the thresholds calculated eachyear by the Census Bureau to determine the numberof people in poverty for the previous year. When thisreport uses the FPL in terms of programs or policy,we are referring to the federal poverty guidelines,developed by the Department of Health and HumanServices, used by federal and state programs todetermine eligibility and calculate benets.
HOUSEHOLD. The sample unit used in this study is thehousehold. When appropriate, the characteristicsof the householder are reported (e.g. citizenship,educational attainment, occupation). When a
variable is reported based on the householder itmay not reect the entire household. For example,in a household with a non-citizen householder othermembers of the household may be citizens.
HOUSEHOLDER. The householder is the person (or oneof the persons) in whose name the housing unit isowned or rented or, if there is no such person, anyadult member, excluding roomers, boarders, or paidemployees.
INCOME INADEQUACY. The term income inadequacyrefers to an income that is too low to meet basic
needs as measured by the Self-Sufciency Standard.Other terms used interchangeably in this reportthat refer to inadequate income include: “below theStandard,” “lacking sufcient (or adequate) income,”and “income that is not sufcient (or adequate) tomeet basic needs.”
LATINO. Latino refers to Hispanic/Latino ethnicity,regardless of race. Therefore all other racial/ethnicgroups used in this report are non-Hispanic/Latino.
NON-FAMILY HOUSEHOLD. A household that consistsof a person living alone or with one or morenonrelatives.
PERSON OF COLOR. Due to the small sample sizesof some racial/ethnic groups, some analyses inthis report compares White non-Hispanic/Latinohouseholders with non-White householders. The
text uses the terms non-White and people of colorinterchangeably to refer to households in which thehouseholder is not White.
SELF-SUFFICIENCY STANDARD (SSS). The SSS measureshow much income is needed for a family of acertain composition in a given county to adequatelymeet their basic needs—without public or privateassistance.
SINGLE FATHER/SINGLE MOTHER. For simplicity, a malemaintaining a household with no spouse present butwith children is referred to as a single father in the
text. Likewise, a woman maintaining a household withno spouse present but with children is referred to as asingle mother. Note that in some cases the child maybe a grandchild, niece/nephew or unrelated child(such as a foster child).
8/10/2019 Overlooked and Undercounted: The Struggle to Make Ends Meet in New York City.
http://slidepdf.com/reader/full/overlooked-and-undercounted-the-struggle-to-make-ends-meet-in-new-york-city 25/108
Who Lacks Income Adequate
to Meet Basic Needs?Now that we have dened what is adequate income we can ask the question: How many New
Yorkers have household incomes that are insufcient to meet their basic needs? Overall, using theSelf-Sufciency Standard and applying it to working-age households (excluding the elderly and
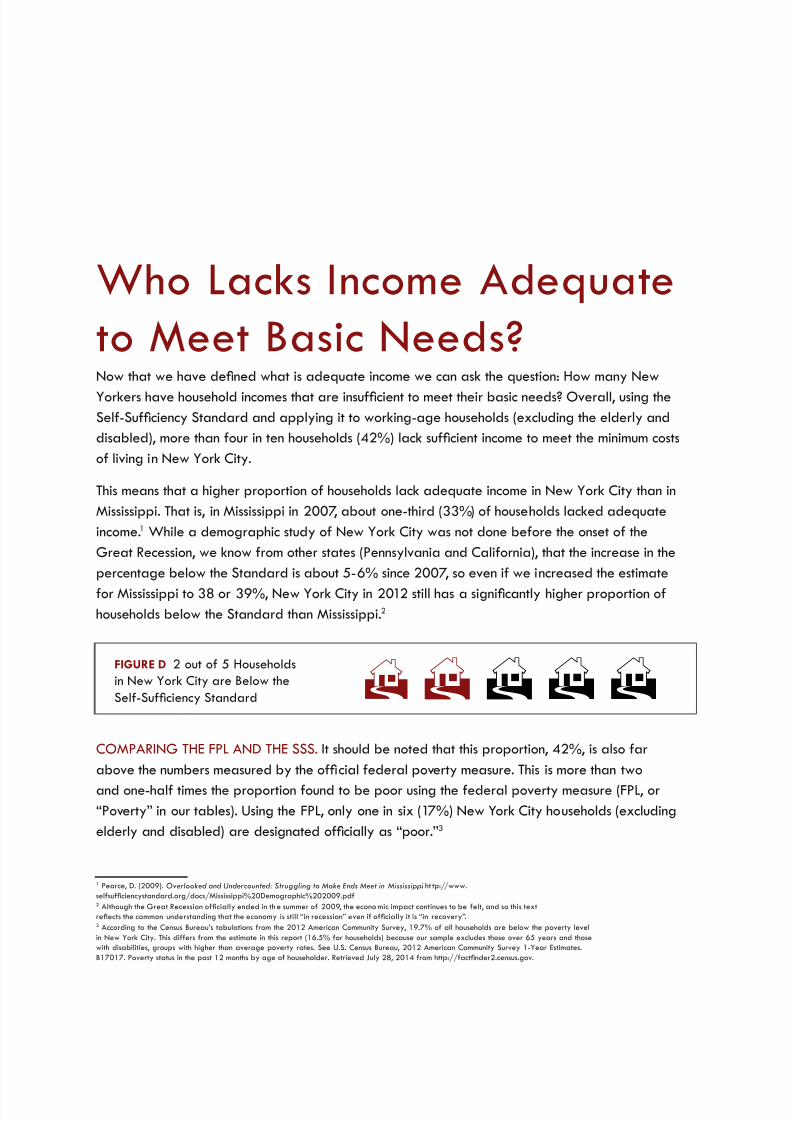
disabled), more than four in ten households (42%) lack sufcient income to meet the minimum costs
of living in New York City.
This means that a higher proportion of households lack adequate income in New York City than in
Mississippi. That is, in Mississippi in 2007, about one-third (33%) of households lacked adequate
income.1 While a demographic study of New York City was not done before the onset of the
Great Recession, we know from other states (Pennsylvania and California), that the increase in the
percentage below the Standard is about 5-6% since 2007, so even if we increased the estimate
for Mississippi to 38 or 39%, New York City in 2012 still has a signicantly higher proportion ofhouseholds below the Standard than Mississippi.2
COMPARING THE FPL AND THE SSS. It should be noted that this proportion, 42%, is also far
above the numbers measured by the ofcial federal poverty measure. This is more than two
and one-half times the proportion found to be poor using the federal poverty measure (FPL, or
“Poverty” in our tables). Using the FPL, only one in six (17%) New York City households (excluding
elderly and disabled) are designated ofcially as “poor.”3
1 Pearce, D. (2009). Overlooked and Undercounted: Struggling to Make Ends Meet in Mississippi. ht tp://www.
selfsufciencystandard.org/docs/Mississippi%20Demographic%202009.pdf2 Although the Great Recession ofcially ended in th e summer of 2009, the econo mic impact continues to be felt, and so this textreects the common understanding that the economy is still “in recession” even if ofcially it is “in recovery”.3 According to the Census Bureau’s tabulations from the 2012 American Community Survey, 19.7% of all households are below the poverty level
in New York City. This differs from the estimate in this report (16.5% for households) because our sample excludes those over 65 years and thosewith disabilities, groups with higher than average poverty rates. See U.S. Census Bureau, 2012 American Community Survey 1-Year Estimates.
B17017. Poverty status in the past 12 months by age of householder. Retrieved July 28, 2014 from http://factnder2.census.gov.
H H H H HFIGURE D 2 out of 5 Householdsin New York City are Below the
Self-Sufciency Standard

8/10/2019 Overlooked and Undercounted: The Struggle to Make Ends Meet in New York City.
http://slidepdf.com/reader/full/overlooked-and-undercounted-the-struggle-to-make-ends-meet-in-new-york-city 26/108
This means that while the FPL identies 367,776 households as “poor,” almost three times as many,
nearly a million households (941,856) lack enough income to meet their basic needs.4 Moving from
statistics to people, that translates to over 2.7 million men, women, and children struggling to make
ends meet in New York City. Using the ofcial poverty thresholds results in 60% of these New York
City households being overlooked and undercounted .
The 42% of households routinely overlooked and undercounted represent the diversity of New York
City households (see Figure E). While the likelihood of experiencing inadequate income in New
York City is concentrated among certain families by gender, race/ethnicity, education, and location,
families with inadequate income are remarkably diverse.
In the remainder of this report, we will delve deeper into these numbers to answer the question
of who lacks adequate income and what might be some of the reasons. We will examine the
demographic characteristics to see which groups bear disproportionate burdens of inadequate
income, such as race, gender, family composition. We will then look at education and employment
issues, such as workforce participation patterns, educational levels and occupations.
4 The Center for E conomic Opportunity (CEO) measure, which is an alternative to the FPL similar to the federal SPM (Supplementary Poverty Measure), ndsthat 21.4% of New Yorkers are poor in 2012. It also found that 45.6% of New Yorkers are below 150% of the CEO thresholds. However, note that these countsinclude the elderly and disabled, and although the C EO measure uses thresholds that are similar to that of th e FPL, it has a different measure of resources than
gross income, and other methodological differences (see Appendix A, Other Approaches to Me asuring Poverty for more details). Christine D’Onofrio, MarkLevitan, Daniel Scheer, John Krampner, and Vicky Virgin, New York City Ofce of the Mayor, “The CEO Poverty Measure, 2005-2012: An Annual Report from The
Ofce of the Mayor,” April 2014, http://www.nyc.gov/html/ceo/downloads/pdf/ceo_poverty_measure_2005_2012.pdf (accessed September 15, 2014).

8/10/2019 Overlooked and Undercounted: The Struggle to Make Ends Meet in New York City.
http://slidepdf.com/reader/full/overlooked-and-undercounted-the-struggle-to-make-ends-meet-in-new-york-city 27/108
NEW YORK CITY | 15
FIGURE E Prole of Households with Inadequate Income: New York City 2012
Each image represents the 941,856 households and 2.7 million individuals living below the Self-Sufciency Standard in NYC.
18-24 25-34 35-44 45-54 55-64
TWO +ONENONE
Number of Employed Workers
17% of households below the Standard in NYC have no workers,
55% have one worker, and 28% have two or more workers.
Educational Attainment
Among NYC households below the Standard, 26% lack a high school
degree, 27% have a high school degree, 25% have some college or
associates degree, and 22% have a bachelor’s degree or higher.
NO CHILDREN MARRIED
W/CHILDREN
SINGLE
FATHER
SINGLE
MOTHER
Household Type
Of the households below the Standard in NYC, 25% are
married-couple households with children, 23% are single-women
households with children, 5% are single-male households with children,
and the remaining 47% are households without children.
LESS THAN
HIGH SCHOOL
HIGH
SCHOOL
SOME
COLLEGEBACHELOR’S
OR HIGHER
HOUSING <30%
OF INCOMEHOUSING >30%
OF INCOME
OTHER
Age of Householder
In NYC, only 6% of households below the Standard are headed by
adults under 24 years of age. 22% are between 25-24, 27% are
35-44, 25% are 45-54, and 19% are 55-64.
ASIAN BLACK LATINO WHITE
Race/Ethnicity
36% of households in NYC with inadequate income are Latino, 25%
are Black, 22% are White, and 16% are Asian/Pacific Islander, and
1% are Other Race (including Native American and Alaskan Native).
YES NO
Citizenship
U.S. Citizens head 71% of the households below the Self-Sufficiency
Standard. Non-citizens head 29% of households without sufficiency
income in NYC.
YESNO
Health Insurance
Of NYC households below the Standard, more than one in four (25%)
did not have health insurance coverage in 2012.
NO YES
Public Assistance (TANF)
Only 6% of households with inadequate income receive cash assistance.
In NYC, 94% of households below the Standard do not receive TANF.
NO YES
Food Assistance (SNAP)
Over one in three (34%) households below the Standard participated
in the Supplemental Nutrition Assistance Program (SNAP, formerly food
stamps).
Housing Burdern81% of NYC households below the Standard spend more than 30%of their income on housing.
8/10/2019 Overlooked and Undercounted: The Struggle to Make Ends Meet in New York City.
http://slidepdf.com/reader/full/overlooked-and-undercounted-the-struggle-to-make-ends-meet-in-new-york-city 28/108
16 | OVERLOOKED AND UNDERCOUNTED
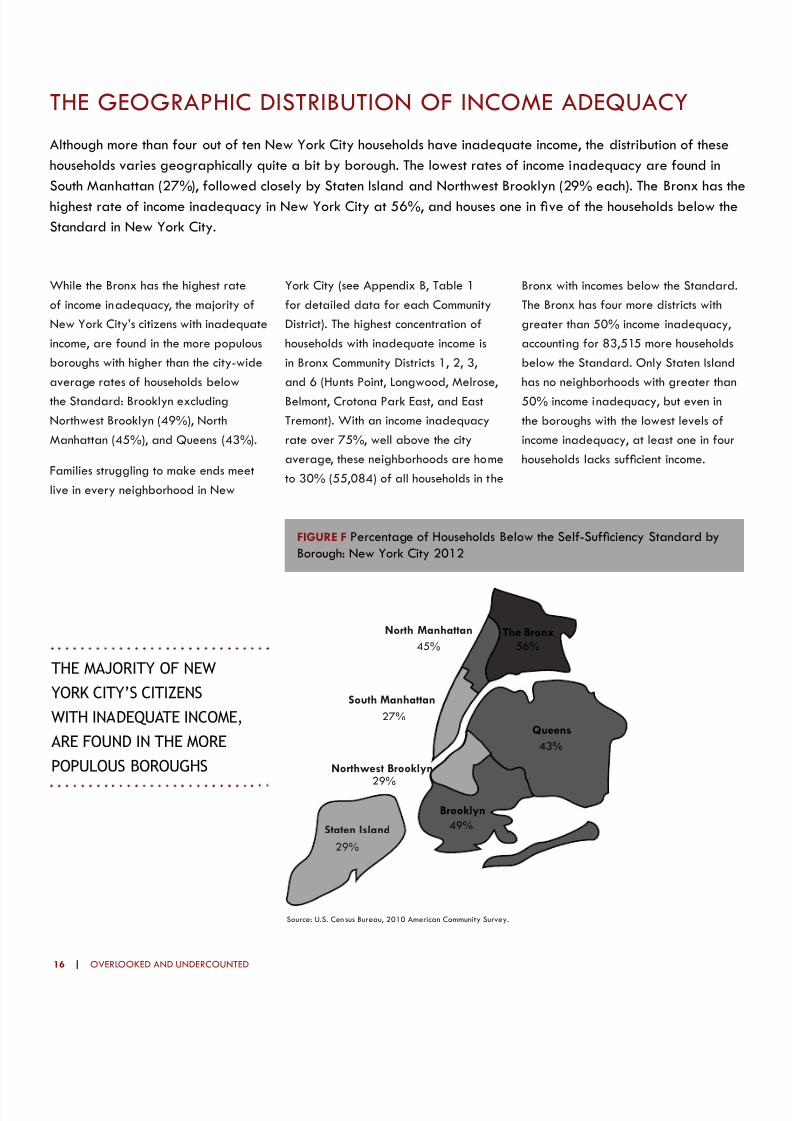
THE GEOGRAPHIC DISTRIBUTION OF INCOME ADEQUACY
While the Bronx has the highest rate
of income inadequacy, the majority of
New York City’s citizens with inadequate
income, are found in the more populous
boroughs with higher than the city-wide
average rates of households below
the Standard: Brooklyn excluding
Northwest Brooklyn (49%), North
Manhattan (45%), and Queens (43%).
Families struggling to make ends meet
live in every neighborhood in New
York City (see Appendix B, Table 1
for detailed data for each Community
District). The highest concentration of
households with inadequate income is
in Bronx Community Districts 1, 2, 3,
and 6 (Hunts Point, Longwood, Melrose,
Belmont, Crotona Park East, and East
Tremont). With an income inadequacy
rate over 75%, well above the city
average, these neighborhoods are home
to 30% (55,084) of all households in the
Bronx with incomes below the Standard.
The Bronx has four more districts with
greater than 50% income inadequacy,
accounting for 83,515 more households
below the Standard. Only Staten Island
has no neighborhoods with greater than
50% income inadequacy, but even in
the boroughs with the lowest levels of
income inadequacy, at least one in four
households lacks sufcient income.
The Bronx
Queens
Brooklyn
Staten Island
North Manhattan
South Manhattan
45%
49%
43%
27%
56%
29%
Northwest Brooklyn 29%
FIGURE F Percentage of Households Below the Self-Sufciency Standard byBorough: New York City 2012
Source: U.S. Cen sus Bureau, 2010 American Community Survey.
Although more than four out of ten New York City households have inadequate income, the distribution of these
households varies geographically quite a bit by borough. The lowest rates of income inadequacy are found in
South Manhattan (27%), followed closely by Staten Island and Northwest Brooklyn (29% each). The Bronx has the
highest rate of income inadequacy in New York City at 56%, and houses one in ve of the households below the
Standard in New York City.
THE MAJORITY OF NEW
YORK CITY’S CITIZENS
WITH INADEQUATE INCOME,
ARE FOUND IN THE MORE
POPULOUS BOROUGHS

8/10/2019 Overlooked and Undercounted: The Struggle to Make Ends Meet in New York City.
http://slidepdf.com/reader/full/overlooked-and-undercounted-the-struggle-to-make-ends-meet-in-new-york-city 29/108
NEW YORK CITY | 17
The widening income inequality that characterizes American society is found in New York City as well. It is
especially apparent when examining income inadequacy by race/ethnicity. Not surprisingly, people of color are
disproportionately likely to have inadequate incomes, particularly Latinos. In addition, nativity/citizenship further
divides the city: foreign-born householders have higher income inadequacy rates than U.S.-born householders,
especially when Latino, and especially if they are not citizens.
RACE/ETHNICITY, CITIZENSHIP, AND LANGUAGE
RACE AND ETHNICITY
While considerable percentages
of New York City households in all
racial/ethnic groups have income
below the Self-Sufciency Standard,
people of color have the highest rates
below the Standard (Figure G).
The group with the highest rate of•
income inadequacy are Latinos,
with more than three out of ve
households (61%) having insufcient
income.5 Asian, Black and Other Race
households have the next highest
rates of income inadequacy at 49%,
48%, and 51%, respectively. (Note
that Other Race includes Native
Americans and Alaska Natives.)
Only 24% of White households in•New York City have incomes below the
Standard. As a result of these quite
different rates, people of color account
for almost four out of ve households
with inadequate income, and almost
half of these are Latino (see Figure H).
5 Note that data for race/ethnicity, citizenship status,and language, reect that of the householder and
not necessarily that of the entire household.
Specically, while Latino households (of•
any race) constitute only about 25%
of New York City households, 36% of
all households in the city with incomes
below the Standard are Latino. In
contrast, White households represent
38% of New York City’s households,
but only constitute 22% of the total
households with incomes below the
Standard in the New York City.
Black and Asian households are similar•
in terms of their overall percentage in
the city compared to their proportion
of those with inadequate incomes.
Thus Asian households are 14% of
New York City households, and are
16% of those below the Standard;
Source: U.S. Cen sus Bureau, 2012 American Commu nity Survey.
FIGURE G Percent of HouseholdsBelow the Standard by Race/Ethnicity of Householder: NYC 2012
49% of Asian & Pacific Islander Households
47% of Black Households
61% of Latino Households
24% of White Households
METHODOLOGY NOTE
This study combines the Census Bureau’s separate racial and ethnic classicationsinto a single set of categories. In the American Community Survey questionnaire,individuals identify if they are of Hispanic, Latino, or Spanish origin and identifytheir race/races (they can indicate more than one race). Those who indicate theyare of Hispanic, Latino, or Spanish origin (either alone or in addition to otherrace categories) are coded as Latino in this study, regardless of race (Latinosmay be of any race), while all other categories are non-Latino The result is vemutually exclusive racial and ethnic groups:
Asian, Native Hawaiian, and Other Pacic Islander (referred to as Asian and1.
Pacic Islander or API),Black or African-American (referred to as Black),2.
Latino or Hispanic (referred to as Latino),3.
White, and;4.
American Indian, Alaska Native, and Some Other Race (referred to as5.
Other). Individuals identied as American Indian or Alaska Native arecombined with Other races due to the small population sizes in the sample.

8/10/2019 Overlooked and Undercounted: The Struggle to Make Ends Meet in New York City.
http://slidepdf.com/reader/full/overlooked-and-undercounted-the-struggle-to-make-ends-meet-in-new-york-city 30/108
18 | OVERLOOKED AND UNDERCOUNTED
likewise, Black households are 22%
of all households in New York City,
and comprise 25% of households in
New York City below the Standard.
Altogether, people of color comprise
62% of New York City households,
but account for 78% of households
with incomes below the Standard.
CITIZENSHIP STATUS
Being a citizen reduces the likelihood of
having inadequate income, especially for
Latinos, but also for non-Latinos (Table
3). Thus the rate of income inadequacy
for non-Latino householders increasesfrom 30% for U.S.-born householders,
to 39% for those who are naturalized
citizens, to 53% for non-citizens.
The same differentials by citizenship
status hold for Latinos, only at higher
levels. Among Latinos, those who are
householders born in the U.S. have the
lowest rate of income insufciency,
which at 51% is close to the rate for
non-Latino non-citizens (53%). For
foreign-born Latinos, rates are even
higher: three-fths of naturalized citizenLatino householders lack adequate
income (60%), and over three-fourths
of non-citizen Latino householders
lack adequate income (75%).
Note that if we break down New
York City’s U.S.-born Latinos into
Puerto Ricans and all other Latinos,
Puerto Ricans have a higher rate
(54%) of income insufciency than
other U.S.-born Latinos (44%).
Because of these high rates of
income inadequacy for immigrants,
foreign-born New Yorkers account
for almost six of ten New York City
households with inadequate income.
FIGURE H People of ColorDisproportionately haveInadequate Income: NYC 2012
Total Households
in New York City
Total Households
Below Standard
in New York City
0%
20%
40%
60%
80%
100%
PERCENTAGE OF HOUSEHOLDS
Black
Latino
White
API
API
Black
Latino
White
Source: U.S. Census Bureau, 2012 American Community Survey.
LANGUAGE
About one-fth (22%) of New York City’s
householders report speaking English
“less than very well.” The rates of income
inadequacy among this group are almost
twice as high as those who speak English
“very well” (66% vs. 35%) (Table 3).
Among households where the•
language spoken at home is English,
32% are below the Standard, while
54% of those who report speaking
a “language other than English at
home” are below the Standard.
The highest rate of income•
inadequacy, 62%, is among
households where Spanish is the
primary language spoken at home.
Altogether, income inadequacy is highest
among Latinos, particularly non-citizens,
and those who live in households in which
English is not the primary language.
TABLE 3 Poverty and Income Inadequacy Rates by Citizenship Status andLanguage of Householder,1 New York City 2012
Below
Poverty
Below
Standard
Below
Poverty
Below
Standard
CITIZENSHIP STATUS
U.S. BORN 14% 34% NATURALIZED C ITIZEN 15% 45%
Not Latino 11% 30% Not Latino 12% 39%
Latino2 24% 51% Latino 23% 60%
Puerto Rican 27% 54% NOT A CITIZEN 25% 61%
Other Latino Origin 17% 44% Not Latino 22% 53%
Latino 30% 75%
ENGLISH SPEAKING ABILITY LANGUAGE SPOKEN AT HOME
VERY WELL 13% 35% ENGLISH 12% 32%
LESS THAN VERY WELL 27% 66%LANGUAGE OTHERTHAN ENGLISH
22% 54%
Spanish 25% 62%
Language other thanSpanish
14% 36%
1 The househ older is the person (or one of the perso ns) in whose name the h ousing unit is owned or rented or, if there is no suc h
person, any adult mem ber, excluding roomers, boarders, or paid employees.
2 Latino refers to Hispanic/Latino ethn icity, regardless of race. Therefore all other racial/ethnic groups are non-H ispanic/Latino.
Source: U.S. Cen sus Bureau, 2012 American Commu nity Survey.
8/10/2019 Overlooked and Undercounted: The Struggle to Make Ends Meet in New York City.
http://slidepdf.com/reader/full/overlooked-and-undercounted-the-struggle-to-make-ends-meet-in-new-york-city 31/108
NEW YORK CITY | 19
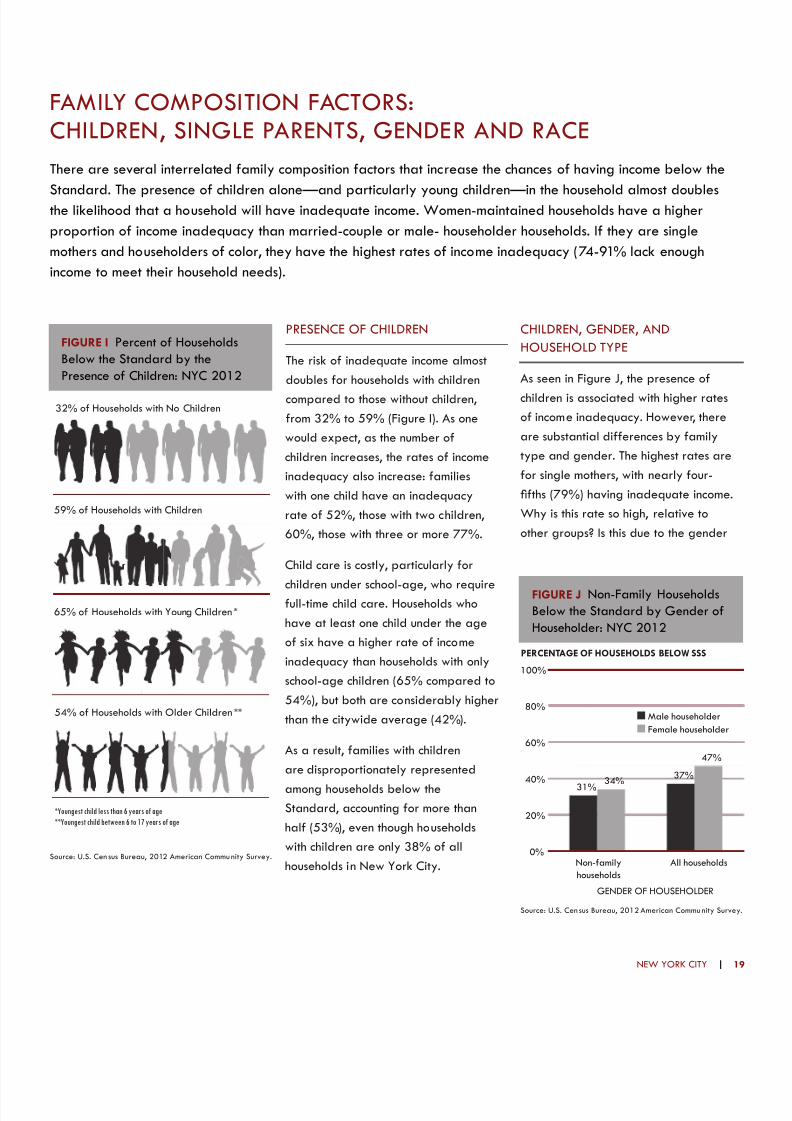
FAMILY COMPOSITION FACTORS:CHILDREN, SINGLE PARENTS, GENDER AND RACE
There are several interrelated family composition factors that increase the chances of having income below the
Standard. The presence of children alone—and particularly young children—in the household almost doublesthe likelihood that a household will have inadequate income. Women-maintained households have a higher
proportion of income inadequacy than married-couple or male- householder households. If they are single
mothers and householders of color, they have the highest rates of income inadequacy (74-91% lack enough
income to meet their household needs).
PRESENCE OF CHILDREN
The risk of inadequate income almost
doubles for households with children
compared to those without children,
from 32% to 59% (Figure I). As one
would expect, as the number of
children increases, the rates of income
inadequacy also increase: families
with one child have an inadequacy
rate of 52%, those with two children,
60%, those with three or more 77%.
Child care is costly, particularly for
children under school-age, who requirefull-time child care. Households who
have at least one child under the age
of six have a higher rate of income
inadequacy than households with only
school-age children (65% compared to
54%), but both are considerably higher
than the citywide average (42%).
As a result, families with children
are disproportionately represented
among households below the
Standard, accounting for more than
half (53%), even though households
with children are only 38% of all
households in New York City.
CHILDREN, GENDER, AND
HOUSEHOLD TYPE
As seen in Figure J, the presence of
children is associated with higher rates
of income inadequacy. However, there
are substantial differences by family
type and gender. The highest rates are
for single mothers, with nearly four-
fths (79%) having inadequate income.
Why is this rate so high, relative to
other groups? Is this due to the gender
32% of Households with No Children
59% of Households with Children
65% of Households with Young Children*
54% of Households with Older Children**
*Youngest child less than 6 years of age
**Youngest child between 6 to 17 years of age
FIGURE I Percent of HouseholdsBelow the Standard by thePresence of Children: NYC 2012
Source: U.S. Cen sus Bureau, 2012 American Commu nity Survey.
FIGURE J Non-Family HouseholdsBelow the Standard by Gender ofHouseholder: NYC 2012
Male householder
Female householder
PERCENTAGE OF HOUSEHOLDS BELOW SSS
GENDER OF HOUSEHOLDER
31%
37%34%
47%
0%
20%
40%
60%
80%
100%
Non-family
households
All households
Source: U.S. Cen sus Bureau, 2012 American Commu nity Survey

8/10/2019 Overlooked and Undercounted: The Struggle to Make Ends Meet in New York City.
http://slidepdf.com/reader/full/overlooked-and-undercounted-the-struggle-to-make-ends-meet-in-new-york-city 32/108
20 | OVERLOOKED AND UNDERCOUNTED
of the householder, the presence of
children, or some other factors?
This high rate is probably not due to
gender alone. If we look at non-family
households (which are mostly single
persons living alone), we see that the
rate of income inadequacy is 31%
for male householders versus 34% for
female householders (see Figure J). In
other words, men and women living
alone, or in a few cases, with non-
relatives, have very similar, and relatively
low, rates of inadequate income.6
However, when we examine family
households by family type and gender,we see substantial differences. For
this analysis, we divide households
into three types: married couple, male
householder (no spouse) and female
householder (no spouse). As can be seen
in Figure K, married couples have the
lowest rates of income inadequacy at
38%, with male householders at 51%,
and female householders the highest
at 67%. For each household type,if we further divide them into those
households with and without children,
those with children have considerably
higher rates of income inadequacy
than those without. Again, married-
couple households with children are
the lowest, at 47%, while single-father
households are higher at 68%.7 Single-
mother households have the highest
rate of with an income inadequacy
rate of 79%, that is, almost four out
of ve single mothers lack income
adequate to meet their basic needs.
6 Four-fths of non-family households are one person households.7 Households with children maintained by a malehouseholder with no spouse present are referred to as
single-father households. Likewise, households with childrenmaintained by a female householder with no spousepresent are referred to as single-mother households.
Altogether, parents experience higher
levels of income inadequacy than
non-parents, and this is especially true
for single parents. The higher rates of
income inadequacy for single mothers
compared to single fathers suggeststhat a combination of gender and
the presence of children—being a
woman with children—is associated
with the highest rates of income
inadequacy. The causes of these
high levels of income inadequacy
are many, including pay inequity
and gender based discrimination, as
well as the expenses associated with
children, particularly child care.
Not only are single-mother households
disproportionately more likely to lack
adequate income than single-father
households, there are nearly ve times as
many single-mother households in New
York City as single-father households.
Single-mother households with children
comprise over 12% of all New York City
households compared to less than 3%
for single-father households. Amonghouseholds with children in New York
City who are below the Standard,
47% are married-couple households,
44% are single-mother households and
9% are single-father households.
CHILDREN, HOUSEHOLD TYPE, AND
RACE/ETHNICITY
The combination of being a woman,having children, and solo parenting are
associated with some of the highest rates
of income inadequacy. At the same time,
as we have seen above, rates of income
inadequacy are quite high among some
race/ethnic groups. When we look at
family composition factors (including
FAMILY HOUSEHOLDS WITH CHILDREN
MarriedCouple
Male householder,No spouse
PERCENTAGE OF FAMILY HOUSEHOLDS BELOW SSS
Female householder,No spouse
FAMILY HOUSEHOLDS WITHOUT CHILDREN
ALL FAMILY HOUSEHOLDS
MarriedCouple
Male householder,No spouse
Female householder,No spouse
MarriedCouple
Male householder,No spouse
Female householder,No spouse
47%
24%
38%
68%
32%
51%
79%
45%
67%
FIGURE K Households Below theStandard by Family Type andPresence of Children: NYC 2012
Source: U.S. Census Bureau, 2012 American Community
Survey
gender and children) by race/ethnicity,
there is an even greater disparity
between groups in rates of income
adequacy. That is, within racial groups,
household-type differences persist, with
single-mother households consistently
having the highest rates of incomeinadequacy within each racial group.
At the same time, within household-type
groups, racial and ethnic differences also
persist, with Latinos consistently having
the highest rates of income inadequacy
for each household type (see Figure L).

8/10/2019 Overlooked and Undercounted: The Struggle to Make Ends Meet in New York City.
http://slidepdf.com/reader/full/overlooked-and-undercounted-the-struggle-to-make-ends-meet-in-new-york-city 33/108
NEW YORK CITY | 2
Household types without children:•
the proportion of married-couple
households in New York City with
insufcient incomes ranges from 15%
for White households to 40% for
Asian/Pacic Islander households.Male householder households
(no spouse present) have slightly
higher rates, ranging from 21%
for White households to 44% for
Latino households. Consistently
higher rates are found for women-
maintained households, ranging from
26% for White women-maintained
households to 53% for Latina
women-maintained households.
Household types with children:•
married-couple households have rates
of income insufciency that range
from 29% among White households
to 66% among Latino households.
Among single-father households, the
rates are somewhat higher, ranging
from 35% for White single-father
households to 75% for Latino single
fathers. For single-mother households,the rates are much higher: the
proportion of income inadequacy
starts at 63% for White households
up to 86% for Latina households. Put
another way, within each racial/ethnic
group, single-mother households have
income inadequacy rates that are
12 to 34 percentage points higher
than married-couple households with
children of the same race/ethnicity,
and 10 to 28 percentage points
higher than single-father households.
Combining analysis by household
type with analysis by race/ethnicity
leads to some striking comparisons
that point out the importance of race/
ethnicity and gender/household type.
Even though the presence of•
children generally raises rates
of income inadequacy, Latino
married-couple families without
children have signicantly higher
rates of income inadequacy
(37%) than White married-couplefamilies with children (29%).
Single-mother households have•
consistently very high rates of
income inadequacy, across all race/
ethnicities, ranging from 63% to
86%, rates that are four to almost six
times that of White married-couple
households without children (15%).
Female householder, No spouse
White
Latino
Black
API
NO CHILDREN
PERCENTAGE OF HOUSEHOLDS BELOW SSS
40%
36%
38%
19%
40%
41%
37%
44%
53%
15%
21%
26%
63%
56%
76%
45%
65%
75%
66%
75%
86%
29%
35%
63%
White
Latino
Black
API
White
Latino
Black
API
White
Latino
Black
API
White
Latino
Black
API
White
Latino
Black
API
Male householder, No spouse
Married couple
Female householder, No spouse
WITH CHILDREN
Male householder, No spouse
Married couple
All households
Source: U.S. Cen sus Bureau, 2012 American Commu nity Survey.API = Asian and Pacic Islander
FIGURE L Households Below theStandard by Race/Ethnicity ofHouseholder and Household Type:NYC 2012

8/10/2019 Overlooked and Undercounted: The Struggle to Make Ends Meet in New York City.
http://slidepdf.com/reader/full/overlooked-and-undercounted-the-struggle-to-make-ends-meet-in-new-york-city 34/108
22 | OVERLOOKED AND UNDERCOUNTED
EDUCATION
As education levels increase, income
inadequacy rates decrease dramatically.
Of householders in New York City with
less than a high school education, 80%
have inadequate incomes, while 59%
of those with a high school degree or
its equivalent, 46% of those with some
college, and only 21% of those with a
college degree or more have inadequate
incomes (see Table 4). Nonetheless, only
14% of all householders in New York
City, and 26% of the total households
with incomes below the Standard, lack
a high school degree. The remaining
74% of New York City householders
below the Standard have a high school
degree or more, including nearly half(47%) who have some college or more.
Although increased education raises
income adequacy levels for all race and
gender groups in New York City, when
we examine the impact of education
broken down by race and gender, there
are four ndings of note (see Figure M):
Although increased education is1.
associated with substantially lowerrates of income inadequacy for all
groups, this is even truer of women,
especially women of color. In fact,
when the educational attainment of
the householder increases from a
high school degree to a bachelor’s
degree or higher, income inadequacy
levels fall from 70% to 30% for
women of color, and from 48% to
18% for White women. In contrast,
men of color had income inadequacy
rates that fell from 58% for those
with a high school education to 25%
for those with a bachelor’s degree
or more, while for White men, the
decrease was from 39% to 14%.
As educational levels increase, the2.
differences in income inadequacy
rates between men and women of the
same race/ethnicity narrow. Thus for
Whites, 72% of White women with
less than a high school degree haveinadequate income compared to 57%
of White men with less than a high
school degree, a difference of fteen
percentage points. This gap decreases
as education increases, so that the
difference in income inadequacy
rates between White women and men
declines to only about four percentage
points for those who hold a bachelor’s
degree or higher (18% vs 14%). For
people of color, the pattern is almost
identical: the gap between women
and men of color declines as education
increases, from a 13 percentage-point
gap between non-White female and
male householders with less than
This study nds that householders with more education experience lower rates of inadequate income, with
substantial differences by education level. However, women and people of color must have considerably more
education than their male/White counterparts to achieve the same levels of self-sufciency. For example, women
of color with a bachelor’s degree or more have only a slightly lower rate of inadequate incomes than White
males with only some college/post-secondary training.
TABLE 4 Poverty and IncomeInadequacy Rates by EducationalAttainment of Householder,1 NYC 2012
Below
Poverty
Below
Standard
EDUCATIONAL ATTAINMENT
Less than High School 40% 80%
High School Diploma or GED 23% 59%
Some College or Associate'sDegree
16% 46%
Bachelor's Degree or Higher 6% 21%
1 The householder is the person (or one of the persons) in whosename the housin g unit is owned or rented or, if there is no such
person, any adult member, excluding roomers, boarders, orpaid employees.
Source: U.S. Cen sus Bureau, 2012 American Commu nity Survey
high school degree (88% vs. 75%)
to only a 5 percentage point gap
for non-White male and female
householders with a Bachelor’s
degree or higher (30% vs. 25%).
For both men and women, White3.
householders have lower rates of
income inadequacy than non-White
householders. However, the race/
ethnicity gap does not narrow
as education increases for either
gender, as the gender gap did as
shown above. For those with less than
a high school education, for both
women and men of color, the income

8/10/2019 Overlooked and Undercounted: The Struggle to Make Ends Meet in New York City.
http://slidepdf.com/reader/full/overlooked-and-undercounted-the-struggle-to-make-ends-meet-in-new-york-city 35/108
NEW YORK CITY | 23
inadequacy rate is 16-17 percentage
points higher than for Whites. At the
high school degree level, the race/
ethnicity based difference increases
to 19 percentage points for men of
color, and 22 percentage points for
women of color. At higher levels, the
gap does decrease: for those with
some college but no degree, the gap
decreases with men of color having
income inadequacy rates that are
9 percentage points higher than
White men, and women of color
with inadequacy rates that are 13
percentage points higher than their
White female counterparts. For those
with a bachelor’s degree or higher,
the difference by race/ethnicity
actually increases again for men,
to 12 percentage points, while for
women it stays about the same as
Less than High School High School Diploma
or GED
Some Colloge or
Associate’s Degree
Bachelor’s Degree+
PERCENTAGE OF HOUSEHOLDS BELOW SSS
Male: White
Male: Non-White
Female: White
Female: Non-White
57%
39%
33%
14%
75%
58%
41%
25%
72%
47%
42%
88%
70%
55%
0%
20%
40%
60%
80%
100%
18%
30%
FIGURE M Households Below the Standard by Education, Race/Ethnicity, andGender of Householder: NYC 2012
Source: U.S. Cen sus Bureau, 2012 American Commu nity Survey.
some college, at 12 percentage points
higher for women of color with the
highest level of educational attainment.
The disadvantages experienced by4.
women and people of color are
such that these groups need more
education to achieve the same level
of economic self-sufciency as White
males. While 57% of White males
with less than a high school diploma
are below the Standard, a similar
percentage of women of color with
some college have inadequate income
(55%). Overall, as the gure shows, ateducational level, women of color
have income inadequacy rates that
are substantially higher than White
men: 31 percentage points higher for
those with a high school degree or
less, 23 points higher for those with
some college, and 16 points higher
for those with a bachelor’s degree.
Put another way, both women and
people of color, especially women
of color, must achieve higher levels
of education than White malesin order to achieve comparable
levels of income adequacy.
The distribution of education by race/
ethnicity contributes somewhat to
differences in income adequacy rates
by race/ethnic groups. That is, among
all householders in New York City, while
just 3% of White householders lack a
high school degree, 20% of non-White
householders lack a high school degree.
Among New York City householders
below the Standard, 7% of White
householders but 31% of non-White
householders lack a high school degree;
thus among those below the Standard,
in addition to substantially different
returns to education, people of color as
a whole are much more likely to lack
education, so that both factors, racially-impacted returns to education, and
the distribution of education by race,
contribute to the higher rates of income
inadequacy of people of color in New
York City. The ip of this is also true:
overall, almost two-thirds (66%) of New
York City’s White householders have a
bachelor’s degree or more, compared
to less than a third (30%) of people of
color. Among householders below theStandard, 43% of White householders
have a bachelor’s degree or more,
compared to just 16% of people of color
The distribution of educational
attainment by gender, however, is almost
identical, for both all New Yorkers,

8/10/2019 Overlooked and Undercounted: The Struggle to Make Ends Meet in New York City.
http://slidepdf.com/reader/full/overlooked-and-undercounted-the-struggle-to-make-ends-meet-in-new-york-city 36/108
24 | OVERLOOKED AND UNDERCOUNTED
and for those below the Standard.
About 14% of both men and women
householders in New York City lack a
high school degree, while about 44% of
both men and women have a bachelor’s
degree or more. Likewise, about 27% ofmen and 25% of women householders
AS EDUCATION LEVELS INCREASE, INCOME ADEQUACY RATES INCREASE MORE DRAMATICALLY FOR
WOMEN THAN FOR MEN, ESPECIALLY WOMEN OF COLOR
with incomes below the Standard lack a
high school degree. That is, because men
and women are obtaining education at
about the same rates, the differences
in income adequacy by gender are not
likely due to lower level of educationamong women. Instead, the higher rates
of income adequacy experienced by
women (and especially women who
are single mothers) overwhelmingly
reects the lower levels of returns
to education for women compared
to men with the same education.
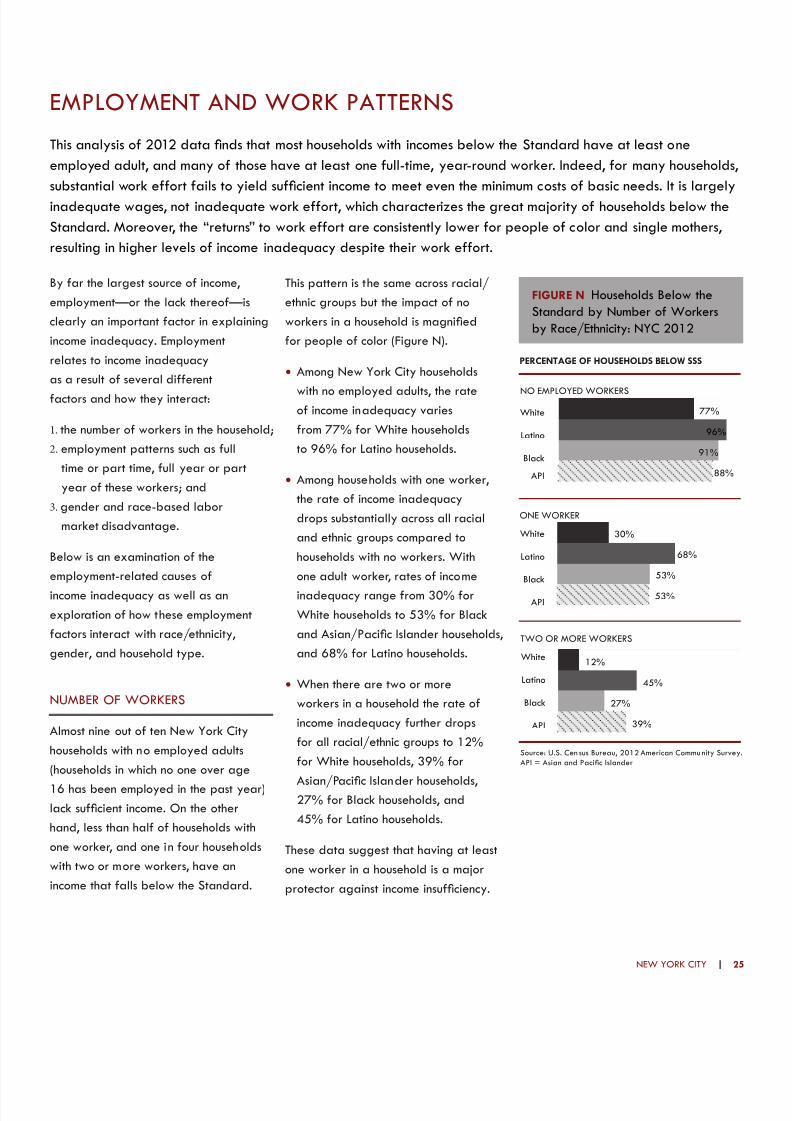
8/10/2019 Overlooked and Undercounted: The Struggle to Make Ends Meet in New York City.
http://slidepdf.com/reader/full/overlooked-and-undercounted-the-struggle-to-make-ends-meet-in-new-york-city 37/108
NEW YORK CITY | 25
By far the largest source of income,
employment—or the lack thereof—is
clearly an important factor in explaining
income inadequacy. Employment
relates to income inadequacy
as a result of several different
factors and how they interact:
the number of workers in the household;1.
employment patterns such as full2.
time or part time, full year or part
year of these workers; and
gender and race-based labor3.
market disadvantage.
Below is an examination of the
employment-related causes of
income inadequacy as well as an
exploration of how these employment
factors interact with race/ethnicity,
gender, and household type.
NUMBER OF WORKERS
Almost nine out of ten New York City
households with no employed adults
(households in which no one over age
16 has been employed in the past year)
lack sufcient income. On the other
hand, less than half of households with
one worker, and one in four households
with two or more workers, have an
income that falls below the Standard.
This pattern is the same across racial/
ethnic groups but the impact of no
workers in a household is magnied
for people of color (Figure N).
Among New York City households•
with no employed adults, the rateof income inadequacy varies
from 77% for White households
to 96% for Latino households.
Among households with one worker,•
the rate of income inadequacy
drops substantially across all racial
and ethnic groups compared to
households with no workers. With
one adult worker, rates of income
inadequacy range from 30% for
White households to 53% for Black
and Asian/Pacic Islander households,
and 68% for Latino households.
When there are two or more•
workers in a household the rate of
income inadequacy further drops
for all racial/ethnic groups to 12%
for White households, 39% for
Asian/Pacic Islander households,27% for Black households, and
45% for Latino households.
These data suggest that having at least
one worker in a household is a major
protector against income insufciency.
EMPLOYMENT AND WORK PATTERNS
Source: U.S. Cen sus Bureau, 2012 American Commu nity SurveyAPI = Asian and Pacic Islander
FIGURE N Households Below theStandard by Number of Workersby Race/Ethnicity: NYC 2012
NO EMPLOYED WORKERS
ONE WORKER
TWO OR MORE WORKERS
White
Latino
Black
API
White
Latino
Black
API
White
Latino
Black
API
PERCENTAGE OF HOUSEHOLDS BELOW SSS
88%
53%
39%
91%
53%
27%
96%
68%
45%
77%
30%
12%
This analysis of 2012 data nds that most households with incomes below the Standard have at least one
employed adult, and many of those have at least one full-time, year-round worker. Indeed, for many households,
substantial work effort fails to yield sufcient income to meet even the minimum costs of basic needs. It is largely
inadequate wages, not inadequate work effort, which characterizes the great majority of households below the
Standard. Moreover, the “returns” to work effort are consistently lower for people of color and single mothers,
resulting in higher levels of income inadequacy despite their work effort.

8/10/2019 Overlooked and Undercounted: The Struggle to Make Ends Meet in New York City.
http://slidepdf.com/reader/full/overlooked-and-undercounted-the-struggle-to-make-ends-meet-in-new-york-city 38/108
26 | OVERLOOKED AND UNDERCOUNTED
TABLE 5 Poverty and Income Inadequacy Rates by Work Status of Adults1,
New York City 2012Below
Poverty
Below
Standard
Below
Poverty
Below
Standard
WORK STATUS OF ADULTS
ONE ADULT IN HOUSEHOLD 22% 46%TWO OR MORE ADULTS INHOUSEHOLD
13% 40%
Work full time, year round 4% 27% All adults work 3% 22%
Work full time, part year 23% 54%All workers full time,year round
1% 9%
Work part t ime, year round 36% 75%Some workers part timeand/or part year2 2% 28%
Work part time, part year 56% 86%All workers part time and/or part year
20% 60%
Not working 70% 88% Some adults work 21% 59%
All workers full time,year round
14% 54%
All workers part time and/or part year
54% 85%
Not working 8% 50%
No adults work 81% 92%
1 All workers over age 16 are included in the calculation of nu mber of workers in household. A worker is dened as on e whoworked at least one week over the previous year.2 This category can also include households with full-time workers.Source: U.S. Census Bureau, 2012 American Community Survey.
However, only 8% of all households
in New York City have no employed
adults in them at all in 2012. Even
among New York City (non-elderly,
non-disabled) households with incomes
below the Standard, only one in sixhouseholds lack any employed adults,
while nearly ve out of six households
with insufcient income have at least
one employed worker. As the great
majority of households with incomes
below the Standard have employed
adults, in most instances, these data
suggest that lack of adequate income
is not due to the lack of any work at
all, but primarily to inadequate workhours or inadequate wages, or both.8
8 See Cauthen, N. K. and Hsien-Hen L. (2003). Living at the
edge, Research Brief 1: Employment alone is not enough forAmerica’s low-income families. New York City: Columbia
University, National Center for Children in Poverty.
EMPLOYMENT PATTERNS
A key characteristic of employment is
the work schedule, specically whether
the workers are full time (dened as 35
hours or more per week) or part time
(less than 35 hours) and/or whether
workers are year round (dened as 50
or more weeks per year) or part year
(less than 50 weeks).9 Not surprisingly,
rates of income inadequacy depend not
only on the number of workers but also
these workers’ work schedules. Briey, as
the number of work hours per household
falls, income inadequacy levels rise
(see Table 5). This trend is similar for
one-adult and two-adult households.
Among one-adult households, obtaining
full-time, year-round employment is key
to higher levels of economic well-being:
9 This is consistent with denitions used by AmericanCommunity S urvey. U.S. Census B ureau. 2012 American
Community Survey. 2012 Subject Denitions. RetrievedAugust 6, 2014, from http://www.census.gov/acs/
www/data_documentation/documentation_main/
If the one adult works full time, year•
round, only about one-fourth (27%) of
these households lack sufcient income.
If the one adult works full time•
but only part of the year, the
proportion lacking adequate income
rises to 54%; if part time but for
the full year, it rises to 75%.
If the one adult works only part time•
and only part of the year, income
inadequacy rises to 86%, almost
the same as if she/he were not
employed at all, when the level of
income inadequacy reaches 88%.
Among households with two or more
adults (most households in this category
have just two adults, so we will refer
to these as two-adult households),10
it is the combinations of the number
of adults working and their work
schedules are associated with varying
rates of income insufciency:
When both adults work full time,•
year round, the rate of incomeinadequacy is only 9%.
When both adults are working, but•
only one works full time, year round,
regardless of schedule, 28% of these
households lack sufcient income.
However, if both of these employed•
adults work, but neither full time,
year round, then among such
households the proportion withincome below the Standard increases
quite substantially to 60%.
10 Households with more than two adults have been grouped
together with two-adult households because there arerelatively few households with three or more adults. Amonghouseholds with more than one adult, 80% have two adults.

8/10/2019 Overlooked and Undercounted: The Struggle to Make Ends Meet in New York City.
http://slidepdf.com/reader/full/overlooked-and-undercounted-the-struggle-to-make-ends-meet-in-new-york-city 39/108
NEW YORK CITY | 27
Furthermore, if at least one adult is•
not employed at all, while the other
adult works full time, year round, the
income inadequacy rate is 54%, and
if the other, working adult(s) only work
part time and/or part year, 85% ofthese households experience income
inadequacy. Note that this rate (85%)
is very similar to that of the one-adult
household with just one part-time, part-
year worker (86%), suggesting that it
is not just the number of adults, but the
work schedule that is key to the level
of the household’s income adequacy.
HOUSEHOLD TYPE
As previously shown in this report, if a
household is maintained by a woman
alone or has children in it, levels of
income inadequacy are consistently
higher than those of childless or married-
couple/male-householder households.
As discussed above, these higher rates
of income inadequacy in part reect
the greater income requirements of
families with children (such as child
care), as well as gender discrimination
and inequality in the labor market.
However, since less than 3% of New York
City households with children have no
employed adults at all, these higher rates
of income inadequacy may also reect
the number of employed adults and
their work schedules, resulting in fewer
total work hours among some types of
households. Controlling for numbers of
workers and work schedules is revealing:
consistently, single-mother households
have higher rates of income inadequacy
than married couple or single-father
households with similar work effort.
Among households with children which•
have two or more workers, married-
couple households have a rate of
income insufciency that is 35%, but
among single-father households the
rate is 54%, and among single-mother
households it is 59% (see Table 6).
Among households with children,•
where there is just one worker, even
though he/she works full time, year
round, income inadequacy rates
are high, regardless of family type:
among married-couple households,
the income inadequacy rate is 63%,
among single-father households it
is 69% and among single mothers,
74% lack sufcient income.
If there is only one worker who is•
employed less than full time, year
round, among married-couple
households 89% lack sufcient
income and 95% of single mothers
lack adequate income.
Thus, in households with children, even
when “controlling” for the numbers of
workers/work hours at the household
TABLE 6 Poverty and Income Inadequacy Rates by Number of Workers1 byHousehold Type, New York City 2012
Below
Poverty
Below
Standard
Below
Poverty
Below
Standard
NUMBER OF WORKERS BY HOUSEHOLD TYPE
HOUSEHOLDS WITHOUTCHILDREN 12% 32% HOUSEHOLDS WITHCHILDREN 24% 59%
Married couple 7% 24% Married couple 15% 47%
Two or more workers 2% 15% Two or more workers 6% 35%
One worker full time,year round
7% 33%One worker full time,year round
20% 63%
One worker part time and/or part year
39% 68%One worker part timeand/or part year
63% 89%
No employed workers 52% 77% No employed workers 85% 90%
Male householder2,no spouse present
12% 32%Male householder, nospouse present
22% 66%
Two or more workers 2% 16% Two or more workers 3% 54%
One worker full time,
year round2% 21%
One worker full time,
year round20% 69%
One worker part timeand/or part year
25% 58%One worker part timeand/or part year
68% 93%
No employed workers 61% 83% No employed workers 99% 100%
Female householder,no spouse present
15% 37%Female householder,no spouse present
41% 79%
Two or more workers 4% 23% Two or more workers 14% 59%
One worker full time,year round
3% 23%One worker full time,year round
20% 74%
One worker part time and/or part year
29% 67%One worker part timeand/or part year
70% 95%
No employed workers 71% 87% No employed workers 92% 99%
1 All workers over age 16 are included in the calculation of number of workers in household. A worker is dened as on e whoworked at least one week over the previous year.
2 The householder is t he person (or one of the person s) in whose name the ho using unit is owned or rented or, if there is no suc h
person, any adult me mber, excluding roomers, boarders, or paid employees.
Source: U.S. Cen sus Bureau, 2012 American Commu nity Survey.
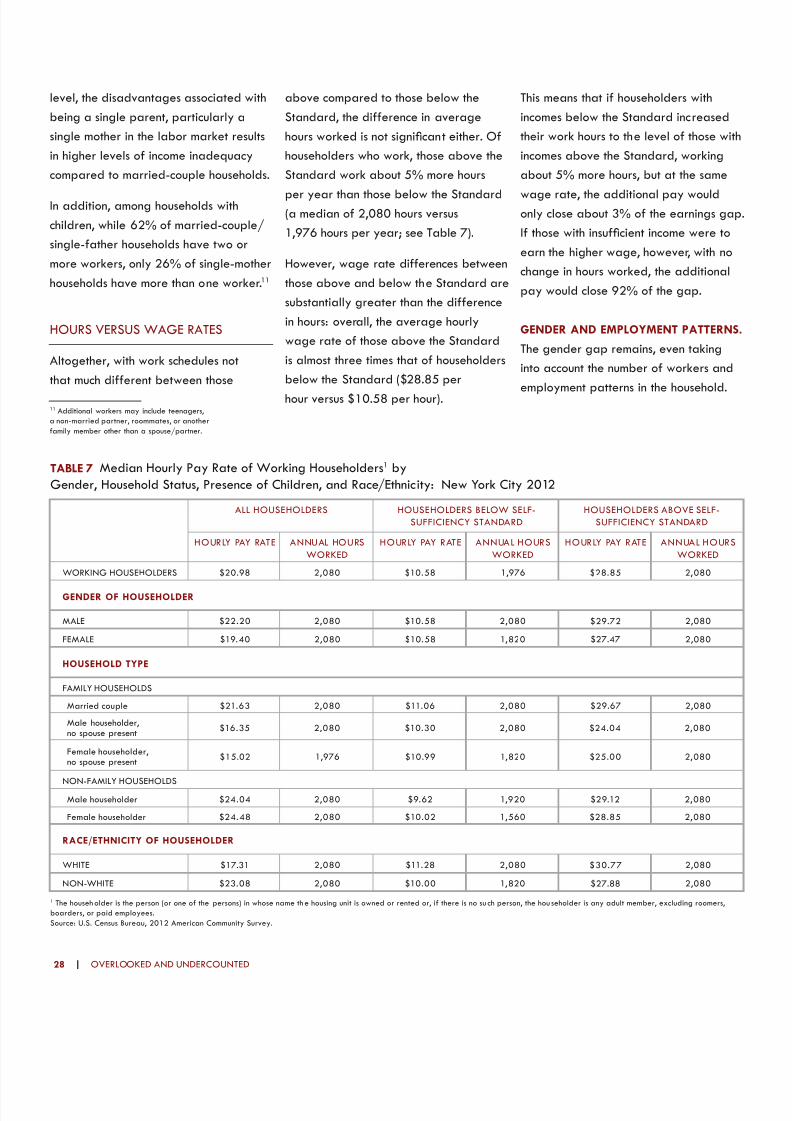
8/10/2019 Overlooked and Undercounted: The Struggle to Make Ends Meet in New York City.
http://slidepdf.com/reader/full/overlooked-and-undercounted-the-struggle-to-make-ends-meet-in-new-york-city 40/108
28 | OVERLOOKED AND UNDERCOUNTED
level, the disadvantages associated with
being a single parent, particularly a
single mother in the labor market results
in higher levels of income inadequacy
compared to married-couple households.
In addition, among households with
children, while 62% of married-couple/
single-father households have two or
more workers, only 26% of single-mother
households have more than one worker.11
HOURS VERSUS WAGE RATES
Altogether, with work schedules not
that much different between those
11 Additional workers may include teenagers,a non-married partner, roommates, or another
family member other than a spouse/partner.
above compared to those below the
Standard, the difference in average
hours worked is not signicant either. Of
householders who work, those above the
Standard work about 5% more hours
per year than those below the Standard(a median of 2,080 hours versus
1,976 hours per year; see Table 7).
However, wage rate differences between
those above and below the Standard are
substantially greater than the difference
in hours: overall, the average hourly
wage rate of those above the Standard
is almost three times that of householders
below the Standard ($28.85 per
hour versus $10.58 per hour).
TABLE 7 Median Hourly Pay Rate of Working Householders1 byGender, Household Status, Presence of Children, and Race/Ethnicity: New York City 2012
ALL HOUSEHOLDERS HOUSEHOLDERS BELOW SELF-
SUFFICIENCY STANDARD
HOUSEHOLDERS ABOVE SELF-
SUFFICIENCY STANDARD
HOURLY PAY RATE ANNUAL HOURS
WORKED
HOURLY PAY RATE ANNUAL HOURS
WORKED
HOURLY PAY RATE ANNUAL HOURS
WORKED
WORKING HOUSEHOLDERS $20.98 2,080 $10.58 1,976 $28.85 2,080
GENDER OF HOUSEHOLDER
MALE $22.20 2,080 $10.58 2,080 $29.72 2,080
FEMALE $19.40 2,080 $10.58 1,820 $27.47 2,080
HOUSEHOLD TYPE
FAMILY HOUSEHOLDS
Married couple $21.63 2,080 $11.06 2,080 $29.67 2,080
Male householder,no spouse present
$16.35 2,080 $10.30 2,080 $24.04 2,080
Female householder,no spouse present
$15.02 1,976 $10.99 1,820 $25.00 2,080
NON-FAMILY HOUSEHOLDSMale householder $24.04 2,080 $9.62 1,920 $29.12 2,080
Female householder $24.48 2,080 $10.02 1,560 $28.85 2,080
RACE/ETHNICITY OF HOUSEHOLDER
WHITE $17.31 2,080 $11.28 2,080 $30.77 2,080
NON-WHITE $23.08 2,080 $10.00 1,820 $27.88 2,080
1 The househ older is the person (or one of the persons) in whose name th e housing unit is owned or rented or, if there is no su ch person, the hou seholder is any adult member, excluding roomers,boarders, or paid employees.
Source: U.S. Census Bureau, 2012 American Community Survey.
This means that if householders with
incomes below the Standard increased
their work hours to the level of those with
incomes above the Standard, working
about 5% more hours, but at the same
wage rate, the additional pay wouldonly close about 3% of the earnings gap
If those with insufcient income were to
earn the higher wage, however, with no
change in hours worked, the additional
pay would close 92% of the gap.
GENDER AND EMPLOYMENT PATTERNS.
The gender gap remains, even taking
into account the number of workers and
employment patterns in the household.
8/10/2019 Overlooked and Undercounted: The Struggle to Make Ends Meet in New York City.
http://slidepdf.com/reader/full/overlooked-and-undercounted-the-struggle-to-make-ends-meet-in-new-york-city 41/108
NEW YORK CITY | 29
In New York City, the median hourly
wage for employed women householders
($19.40 per hour) is 87% of the
median hourly wage for employed
male householders ($22.20 per hour).
However, when comparing the medianwage of just those householders who
are below the Standard, differences
by gender disappear, as women and
men householders earn the same
median wage of $10.58, reecting the
“oor effect” of a minimum wage. In
contrast, women householders above
the Standard earn 92% of the median
wage of male householders above the
Standard. Clearly, with no differencein wage rates between employed men
and women householders below the
Standard, wage rates do not explain the
gender difference in income inadequacy
rates. At the same time, the substantial
difference in wages between those
above and those below the Standard
within gender accounts for much of
the difference in incomes and income
adequacy between these two groups.
That is, for both men and women,
employed householders above the
Standard have wages that on average
are almost three times those of their
counterparts below the Standard.
Thus, of the various wage- and income-
related factors considered here,
gender-based wage differences account
for the least amount of difference in
income adequacy. Because a higher
proportion of households below the
Standard are women-maintained this
contributes to some of the difference
in overall income and therefore income
inadequacy. Most signicantly, it is
the median wage difference (both
overall and by gender) between those
above and those below the Standard
that accounts for the bulk of the
difference in income between those
above and those below the Standard.
RACE AND EMPLOYMENT. There is also
a racial wage gap, with the median
wage of non-White householders being
just 61% of the median wage of White
householders. Among those below the
Standard, the wages are much closer,
with non-White householders having
median wages that are 90% of White
householders. However, as with gender,
the differences in wages betweenthose below and above the Standard,
within race, are far greater: among
White householders, those above have
wages that are almost three times
those below ($32.05 vs. $11.54), while
among non-White householders, those
above have wages about 2.5 times
those below ($25.96 vs. $10.38). And
again, because there are proportionally
more people of color below the
Standard, their lower wages contribute
to higher income inadequacy rates.
This data suggests that addressing
income adequacy through employment
solutions would have a greater impact
if it were focused on increased earnings
rather than increased hours. Increasing
work hours to match that of above-the-
Standard householders would only make
a small dent in the income gap. In short,this analysis shows that for the great
majority of New York City householders
with inadequate income, the problem
is not that they are working too few
hours, but rather that the jobs they do
hold are not paying sufcient wages.
OCCUPATIONS
The analysis to this point suggests
that income inadequacy, even with
equal work effort, is more severe
among households with children,
households maintained by women
alone or households maintained by
people of color. We then explored
the amount of work done by those
with inadequate income. It is hardly
surprising that households with more
workers, or more work hours, experience
less income inadequacy, but this still
leaves unexplained much of the income
inadequacy. For despite more work
resulting in less income inadequacy,
overall there is still substantial work
effort among the many householders
who experience insufcient income.
One possible explanation that we
explore in this section is that householders
who are below the Standard may be
working in occupations that pay wages
insufcient to support their households—
despite strong work effort. Furthermore,these low-wage occupations may be
structured by gender or race/ethnicity-
based occupational segregation.
In Figure O we explore the role of
occupational concentration. This analysis
examines the “top 20” occupations,
that is, the occupations with the most
workers, out of 540 occupations, so they
are quite specic, but still encompass
a large number of workers across
industries. Figure O compares the 20
most frequently held occupations of
householders below the Standard to the
20 most frequently held occupations
of those who are above the Standard.
The rst nding is that householders

8/10/2019 Overlooked and Undercounted: The Struggle to Make Ends Meet in New York City.
http://slidepdf.com/reader/full/overlooked-and-undercounted-the-struggle-to-make-ends-meet-in-new-york-city 42/108
30 | OVERLOOKED AND UNDERCOUNTED
below the Standard are somewhat more
concentrated in a few occupations:
the top 20 occupations cumulatively
account for 48% of all householders
below the Standard, compared to
37% for the top 20 occupationsof those above the Standard.
Secondly, in New York City there is not
much overlap between the occupations
held by those below as opposed to
above the Standard: just six of the
occupations are found in the top 20
of those above as well as those below
the Standard (occupations among
the top 20 which are shared by both
households below and above the
Standard are shown as overlapped in
the gure). These six occupations are:
retail salespersons; rst-line supervisors
of retail salespersons; secretaries and
administrative assistants; janitors and
building cleaners; nursing, psychiatric,
and home health aides; and designers.
For those with jobs in these six commonly
held occupations, it suggests that the
lower income experienced by thosebelow the Standard reects the very
different jobs they hold (e.g. fewer hours,
fewer wages, different industry) worked
within the same occupation, compared
to those above the Standard with the
same occupation. However, the fact that
14 of the top 20 occupations are not
shared suggests that in New York City
there is somewhat of an occupational
concentration experienced by many ofthose with incomes below the Standard.
As shown in Table 8, almost half (48%)
of the occupations held by householders
below the Standard are in the top 20.
Overall, the median earnings of
householders above the Standard are
MEDIAN ANNUAL EARNINGS (Thousands)
TOP OCCUPATIONS OF HOUSEHOLDERS BELOW THE STANDARD ABOVE THE STANDARD
$0 $20 $40 $60 $80 $100+
Waiters and waitresses
Teacher assistants
Taxi drivers and chauffeurs
Social workers
Securities, commodities, andfinancial services sales workers
Secretaries and administrative assistants
Retail salespersons
Registered nurses
Postsecondary teachers
Physicians and surgeons
Personal care aides
Office clerks, general
Nursing, psychiatric,and home health aides
Managers, all other
Maids and housekeeping cleaners
Lawyers
Janitors and building cleaners
General and operations managers
First-line supervisors of retailsales workers
First-line supervisors of officeand administrative workers
Financial managers
Elementary and middle school teachers
Education administrators
Driver/sales workers and truck drivers
Designers
Customer service representatives
Cooks
Construction laborers
Childcare workers
Chief executives
Chefs and head cooks
Cashiers
Accountants and auditors
Security guards andgaming surveillance officers
FIGURE O Median Annual Earnings of Top 20 Occupations1 of HouseholdersAbove and Below the Standard: NYC 2012
1 Detailed occupations are based on the Standard Occupational Classication (SOC). For denitions of these occupations see theBureau of Labor
Statistics Standard Occupation Classications at http://www.bls.gov/soc/soc_majo.htmSource: U.S. Cen sus Bureau, 2012 American Commu nity Survey.
This gure shows the median annual earnings of the most frequently held occupations of householdsabove and below the Standard. Occupations held by householders both above and below theStandard are shown as overlapped in the gure. For example, the median earnings of retailsalespersons below the Standard is $19,400 and for retail salespersons above the Standard it is
$50,000. Accountants are a frequently held occupation of those above the Standard but not forthose below while cashiers are a frequently held occupation of householders below the Standard butnot above.

8/10/2019 Overlooked and Undercounted: The Struggle to Make Ends Meet in New York City.
http://slidepdf.com/reader/full/overlooked-and-undercounted-the-struggle-to-make-ends-meet-in-new-york-city 43/108
NEW YORK CITY | 3
more than three times that of those below
the Standard. Even within the same
commonly held occupations, there is
quite a difference in earnings. The lowest
earnings ratio is found among designers.
Householders who are designers whoare below the Standard earn only 29%
on average of what designers above
the Standard earn. The highest ratio is
among nursing, psychiatric and home
health aides, who still earn just 50% of
what aides above the Standard earn.
If we compare the other 14 top
occupations of householders above
and below the Standard, we can see
that they are sometimes in the same
industry, but in very different jobs, with
very different wages: thus one of the
top 20 occupations for those below
the Standard is teacher’s assistant,
while above the Standard, elementary
and middle school teachers, and post-
secondary teachers are among the
20 most common. Though they may
be working in the same institutions,
the wages of these occupations arequite different: the median wage of
a teacher’s assistant is only about
one-fourth of that of both teachers’
occupations above the Standard.
TABLE 8. Top 20 Occupations1 of Householders2: New York City 2012
BELOW THE SELF-SUFFICIENCY STANDARD ABOVE THE SELF-SUFFICIENCY STANDARD
RANK OCCUPATION Number of
workers
% Cumulative
Percent
Median
Earnings
RANK OCCUPATION Number of
workers
% Cumulative
Percent
Median
Earnings
TOTAL 792,003 $20,000 TOTAL 1,252,315 $62,000
1Nursing, psychiatric, &home health aides
60,174 8% 8% $17,500 1 Managers, all other 42,427 3% 3% $85,000
2Janitors & buildingcleaners
29,039 4% 11% $16,000 2Elementary & middleschool teachers
37,710 3% 6% $70,000
3 Childcare workers 26,765 3% 15% $10,000 3Secretaries &administrative assistants
35,643 3% 9% $50,000
4 Cashiers 23,413 3% 18% $12,500 4 Accountants & auditors 35,605 3% 12% $80,000
5 Maids & house c leaners 21,587 3% 20% $13,300 5 Lawyers 34,285 3% 15% $152,000
6 Retail salespersons 21,432 3% 23% $19,400 6 Registered nurses 27,561 2% 17% $80,000
7 Construction laborers 19,925 3% 26% $20,000 7 Designers 24,283 2% 19% $68,000
8Secretaries &
administrative assistants 19,4702% 28% $22,000 8
Nursing, psychiatric, &
home health aides23,182 2% 21% $35,000
9 Taxi drivers & chauffeurs 18,148 2% 30% $20,000 9 Postsecondary teachers 20,856 2% 22% $66,000
10 Waiters & waitresses 17,141 2% 32% $15,000 10 Physicians & surgeons 20,543 2% 24% $100,000
11 Personal care aides 16,456 2% 35% $17,000 11Janitors & buildingcleaners
20,374 2% 26% $40,500
12 Cooks 14,180 2% 36% $17,000 12 Financial managers 19,875 2% 27% $116,000
13Security guards & gamingsurveillance ofcers
13,839 2% 38% $23,000 13 Chief executives 18,529 1% 29% $150,000
14Driver/sales workers &truck drivers
13,350 2% 40% $23,000 14First-line supervisors ofretail sales workers
17,875 1% 30% $55,000
15First-line supervisors ofretail sales workers
13,226 2% 41% $21,000 15 Retail salespersons 17,377 1% 32% $50,000
16 Teacher ass is tant s 12,997 2% 43% $21,000 16 Social workers 15,739 1% 33% $52,000
17 Ofce clerks, general 11,479 1% 45% $19,000 17 Securities, commodities,& nancial services salesagents
15,461 1% 34% $125,000
18Customer servicerepresentatives
11,083 1% 46% $20,000 18First-line supervisors ofofce & administrativesupport workers
14,443 1% 35% $54,000
19 Chefs & head cooks 10,815 1% 47% $20,800 19General & operationsmanagers
13,570 1% 36% $80,000
20 Designers 8,476 1% 48% $20,000 20 Education administrators 13,359 1% 37% $85,000
1 Detailed occupations are based on the Standard Occupational Classication (SOC) . For denitions of these o ccupations see the Bu reau of Labor
Statistics Standard Occupation Classications at http://www.bls.gov/soc/soc_majo.htm
2 The householder is th e person in whose name th e housing unit is owned or ren ted or, if there is no such person, any adult member, excluding roomers, boarders, or paid employees.
8/10/2019 Overlooked and Undercounted: The Struggle to Make Ends Meet in New York City.
http://slidepdf.com/reader/full/overlooked-and-undercounted-the-struggle-to-make-ends-meet-in-new-york-city 44/108
32 | OVERLOOKED AND UNDERCOUNTED
How much of this occupational
concentration of workers below the
Standard is structured by gender and/
or race/ethnicity? While overall there is
not much overlap between those above
and below the Standard in terms ofoccupations, it is well known that there is
considerable gender-based occupational
segregation, at all levels. Occupations
are deemed gender–dominated if 75%
or more workers are of one gender.
Using this metric, about 40% of women
workers and 44% of men workers are
in gender-dominated occupations.12
Note that segregation of the labor
force, particularly by gender (and toa lesser extent, by race/ethnicity), has
long been shown to have contributed
to gender inequality in wages and
associated rewards of jobs (such as
benets and promotion opportunities).13
Specically, women workers have been
found disproportionately in occupations
that are predominantly female, AND
those occupations tend to be lower
paid. The converse is also true, that
men tend to be somewhat concentrated
in male-dominated jobs, but unlike
female-dominated occupations, these
12 Ariane Hegewisch, Hannah Liepmann, Jeff Hayes, and
Heidi Hartmann, 2010, “Separate and Not Equal? GenderSegregation in the Labor Market and the Gender Wage
Gap,” Institute for Women’s Policy Research, http://www.iwpr.org/publications/pubs/separate-and-not-equal-gender-
segregation-in-the-labor-market-and-the-gender-wage-gap.13
For example, lower compensation is associated with a higherproportion of women within an occupation. See Hertz, T., Tilly,
C., & Massagli, M. P, 2001, “Linking the Multi-city Study’sHousehold and Employer Surveys to Test for Race and Gender
Effects in Hiring and Wage Setting,” Urban Inequality: Evidencefrom Four Cities. Booras, Stephanie and William M. Rodgers III.
2003. “How Does Gender Play a Role in the Earnings Gap? AnUpdate.” Monthly Labor Re- view. 126:3, pp. 9-15. Additionally,
occupational gender segregation is the main determinant ofgender inequality in earnings, despite the effect of globalization
of the U.S. economy. Gauchat, G., Kelly, M., & Wallace, M.,2012, “Occupational gender segregation, globalization, and
gender earnings inequality in US metropolitan areas,” Gender& Society, 0891243212453647. h ttp://gas.sagepub .com/
content/early/2012/08/02/0891243212453647.full.pdf+html
do not have a wage penalty associated
with them.14 Below we explore this
pattern, and how occupational sex
segregation may or may not contribute
to lower wages of those below the
Standard. That is, given that women
householders are disproportionately
more likely to have incomes below
the Standard, one factor behind their
lower income from wages may well
be female-dominated occupations.
As is generally true elsewhere, women
in New York City experience more
occupational concentration than men,
as well as more segregation (see FigureP). The top 20 occupations of women
householders below the Standard
account for almost three-fths (59%)
of employed women householders
below the Standard, and 47% of
employed women householders above
the Standard (compared to 49% of
men householders below, and 37% of
employed men above the Standard).
At the same time, occupational
segregation is high for women in New
York City. Women householders below
the Standard share 10 occupations
with women householders above the
Standard, reecting the overall high
levels of gender segregation in the
economy as a whole. These shared
occupations (of women above and
14 Occupational segregation was at very high levels untilthe 1970s. Over the next two decades, women enteredthe labor force in large numbers, and many occupationsexperienced desegregation, particularly among high-
skilled occupations. However, since the mid-1990s, levels ofoccupational segregation overall have changed very little.
Blau, F. D., Brummund, P., & Liu, A. Y. H. (2013). Trends inoccupational segregation by gender 1970–2009: Adjusting
for the impact of changes in the occupational coding system.Demography, 50(2), 471-492. http://link.springer.com/
article/10.1007/s13524-012-0151-7. This may be due to thechanging mix of occupations: on average, gender composition
of occupations has not changed but occupations that aremore gender-dominated rather than gender-balanced have
increased. Ibid, Institute for Women’s Policy Research.
below the Standard) account for more
than three-fths (62%) of the top 20
occupations of women householders
below the Standard. In contrast,
women below the Standard share only
seven of the top 20 male occupationswith men below the Standard.
Even though there are substantial
numbers of women householders below
the Standard working in the same
occupations as women householders
above the Standard, those below
the Standard have earnings that
average only 43% of those women
householders above the Standard in
the same occupations. As with the “all
householders” comparison above, there
is substantial variation, however, in the
above/below wage ratios. Women
householders below the Standard
who are teachers (elementary and
middle school) earn just 18% of what
women householders earn who are
also teachers and who are above the
Standard.15 At the other end of the
range, women householders below theStandard who are nursing, psychiatric,
and home health aides earn 52%
of what their women counterparts
above the Standard earn, and social
workers earn 61% of the wages of their
counterparts above the Standard.
The shared occupations ratio for women
householders is low, but it is certainly
better than overall, where women
householders below the Standard have
earnings that average just 30% of
women householders above the Standard
15 This difference reects different work levels as 70% ofelementary and middle school teachers above the Standard
work full-time year-round versus 37% of elementary and middleschool teachers below the Standard. Overall, only 11% ofelementary and middle school teachers are below the Standard

8/10/2019 Overlooked and Undercounted: The Struggle to Make Ends Meet in New York City.
http://slidepdf.com/reader/full/overlooked-and-undercounted-the-struggle-to-make-ends-meet-in-new-york-city 45/108
NEW YORK CITY | 33
FEMALE HOUSEHOLDERS MALE HOUSEHOLDERS
BELOW THE STANDARD ABOVE THE STANDARD
TOP OCCUPATIONS OF HOUSEHOLDERS
$0 $20 $40 $60 $80
Waiters and waitresses
Taxi drivers and chauffeurs
Stock clerks and order fillers
Security guards and gaming surveillance officers
Securities, commodities, and
financial services sales agents
Sales representatives, wholesaleand manufacturing
Retail salespersons
Property, real estate, andcommunity association managers
Postsecondary teachers
Police and sheriff'spatrol officers
Physicians and surgeons
Painters, constructionand maintenance
Nursing, psychiatric,and home health aides
Managers, all other
Lawyers
Laborers and freight, stock,and material movers, hand
Janitors and building cleaners
Food preparation workers
First-line supervisors ofretail sales workers
Financial managers
Elementary andmiddle school teachers
Electricians
Driver/sales workersand truck drivers
Designers
Cooks
Construction laborers
Chief executives
Chefs and head cooks
Waiters and waitresses
Teacher assistants
Social workers
Security guards andgaming surveillance officers
Secretaries andadministrative assistants
Retail salespersons
Registered nurses
Receptionists andinformation clerks
Postsecondary teachers
Physicians and surgeons
Personal care aides
Packers and packagers, hand
Office clerks, general
Nursing, psychiatric,and home health aides
Managers, all other
Maids andhousekeeping cleaners
Lawyers
Janitors and building cleaners
Hairdressers, hairstylists,and cosmetologists
First-line supervisors of`retail sales workers
First-line supervisors of officeand administrative support workers
Financial managers
Elementary andmiddle school teachers
Education administrators
Designers
Customer service representatives
Childcare workers
Cashiers
$0 $20 $40 $60 $80+
FIGURE P Median Annual Earnings of Top 20 Occupations1 of Householders Above and Below the Standardby Gender: NYC 2012
1 Detailed occupations are based on the Standard Occupational Classicatio n (SOC). For denitions of th ese occupations see th e Bureau of Labor Statistics Standard Occupation Classications athttp://www.bls.gov/soc/soc_majo.htmSource: U.S. Cen sus Bureau, 2012 American Commu nity Survey.
across all occupations. At the same time,
it suggests that even when they are in
the same occupations, women below the
Standard are concentrated in jobs that
have substantially lower wages than
are paid to women householders whoare above the Standard. Nevertheless,
those above the Standard who are
in shared occupations have median
wages that are 2.3 times those below
the Standard while those above the
Standard who are in different (non-
shared) occupations (among the top
20) have wages that are 4.7 times theaverage of those below the Standard.
That is, even with the higher levels of
gender-based segregation, with women
having more shared occupations, there
is considerable difference in occupations
between women householders above
versus below the Standard, with quite
substantial different wages. At the sametime, shared occupations with their lower
above-below ratios seems to mitigate

8/10/2019 Overlooked and Undercounted: The Struggle to Make Ends Meet in New York City.
http://slidepdf.com/reader/full/overlooked-and-undercounted-the-struggle-to-make-ends-meet-in-new-york-city 46/108
34 | OVERLOOKED AND UNDERCOUNTED
WHITE HOUSEHOLDERS
MEDIAN ANNUAL EARNINGS (Thousands)
$0 $20 $40 $60 $80+
Waiters and waitresses
Teacher assistants
Securities, commodities, andfinancial services sales agents
Secretaries andadministrative assistants
Sales representatives,wholesale and manufacturing
Retail salespersons
Registered nurses
Receptionists andinformation clerks
Real estate brokersand sales agents
Producers and directors
Postsecondary teachers
Physicians and surgeons
Other teachers and instructors
Office clerks, general
Nursing, psychiatric,and home health aides
Managers, all other
Management analysts
Lawyers
Janitors and building cleaners
General andoperations managers
First-line supervisors ofretail sales workers
First-line supervisors ofnon-retail sales workers
Financial managers
Elementary andmiddle school teachers
Education administrators
Editors
Designers
Construction laborers
Childcare workers
Chief executives
Cashiers
Accountants and auditors
Waiters and waitresses
Teacher assistants
Taxi drivers and chauffeurs
Social workers
Security guards andgaming surveillance officers
Secretaries andadministrative assistants
Retail salespersons
Registered nurses
Police and sheriff's patrol officers
Physicians and surgeons
Personal care aides
Office clerks, general
Nursing, psychiatric,and home health aides
Managers, all other
Maids and housekeeping cleaners
Janitors and building cleaners
Hairdressers, hairstylists,and cosmetologists
First-line supervisors ofretail sales workers
First-line supervisors of officeand administrative assistants
Financial managers
Elementary andmiddle school teachers
Driver/sales workersand truck drivers
Customer servicerepresentatives
Cooks
Construction laborers
Childcare workers
Chefs and head cooks
CashiersAccountants and auditors
MEDIAN ANNUAL EARNINGS (Thousands)
$0 $20 $40 $60 $80+
NON-WHITE HOUSEHOLDERS
BELOW THE STANDARD ABOVE THE STANDARDTOP OCCUPATIONS OF HOUSEHOLDERS
FIGURE Q Median Annual Earnings of Top 20 Occupations1 of Householders Above and Below the Standardby Race/Ethnicity: NYC 2012
1 Detailed occupations are based on the Standard Occupational Classi cation (SOC). For denitions of t hese occupations see th e Bureau of Labor Statistics Standard Occupation Classications athttp://www.bls.gov/soc/soc_majo.htm
Source: U.S. Census Bureau, 2012 American Community Survey.

8/10/2019 Overlooked and Undercounted: The Struggle to Make Ends Meet in New York City.
http://slidepdf.com/reader/full/overlooked-and-undercounted-the-struggle-to-make-ends-meet-in-new-york-city 47/108
NEW YORK CITY | 35
the overall wage inequality between
those above versus below the Standard.
There is also the possibility of race/
ethnicity based occupational
segregation, with Whites concentrated in
higher paying occupations and non-
Whites in less well-paid occupations.
Non-White householders are somewhat
less concentrated in a few occupations
than are women: the 20 most frequently
held occupations of non-White
householders below the Standard
account for 42% of this group’s workers,
almost the same as for non-White
householders above the Standard (38%).
In terms of occupational segregation
by race/ethnicity, of the 20 most
frequently held occupations among
non-Whites below the Standard, 11 are
shared with non-White householders
above the Standard, accounting for
over a third (33%) of non-White
householders below the Standard. At
the same time, non-White householders
below the Standard share 11
occupations with White householders
below the Standard, indicating less
segregation by race than gender
among those below the Standard.
Altogether, this suggests that there is
less race/ethnicity-based occupational
segregation experienced by non-White
householders below the Standard than
is true with gender-based occupational
segregation among women householders
Altogether, this suggests several
commonalities across race and
gender in terms of occupations.
When the top 20 occupations for•
householders below the Standard
are compared to the top 20
occupations held by householders
above the Standard, there is
considerable overlap. Particularly
for women householders, there is
more commonality in occupations
between women above and below
the Standard, than between men
and women below the Standard. Put
another way, there is still more gender-
based occupational segregation at all
income levels than there is occupationa
concentration experienced by
householders below the Standard. At
the same time, even for occupationsthat are shared, and more so for
occupations that are not shared, there
are substantial differences in wages.
In short, it is the specic jobs—and the
wages they pay—not the occupations
that yield the low earnings that
contribute to income inadequacy.
For all householders, the earnings of•
those below the Standard average
less than one third of householders
above the Standard. Even within
shared occupations, for those
occupations which are found among
the top 20 for both those above and
below the Standard, earnings of
below the Standard. However, the
consequences are similar, in that earnings
of non-White householders below the
Standard, across all occupations, are
just over a third of those of non-White
householders above the Standard. Even
among shared occupations, average
earnings are only 47% of those non-
White householders who are above the
Standard and in the same occupations.
The ratios of earnings of non-White
householders below to non-Whites above
the Standard in the same occupations
ranges widely from 36% (earnings
of non-White householders below the
Standard to those above) for rst-line
supervisors of retail sales workers to
58% for non-Whites who are security
guards and gaming surveillance ofcers.
In spite of the somewhat lessersegregation by race compared to
gender, the contrast between those
above and below, for non-White
householders, is similar, i.e., non-White
householders above the Standard in
shared occupations have earnings
more than double those of non-White
householders below the Standard in
the same occupation. However the
non-White householders in on-sharedoccupations have earnings that
average almost four times as much as
non-Whites in non-shared occupations
who are below the Standard.
FOR MANY HOUSEHOLDERS WITH INCOMES BELOW THE STANDARD, IT IS NOT THE OCCUPATION
THEY HOLD, BUT RATHER THE SPECIFIC JOBS WITHIN OCCUPATIONS, THAT MOST ACCOUNTS FOR
THEIR INADEQUATE EARNINGS.
8/10/2019 Overlooked and Undercounted: The Struggle to Make Ends Meet in New York City.
http://slidepdf.com/reader/full/overlooked-and-undercounted-the-struggle-to-make-ends-meet-in-new-york-city 48/108
36 | OVERLOOKED AND UNDERCOUNTED
those below averaged 40% of those
above for all householders, 43% for
women, and 47% for non-Whites.
For all householders, across all•
occupations, householders below the
Standard on average have incomes
that meet less than half the cost of their
household’s basic needs as measured
by the Standard (47%) (and even
less for women (42%) and non-White
householders (45%)). In contrast,
householders above the Standard yield
more than double the minimum needed
(less than double for women (1.9 times)
and non-White householders (1.8)).
In the end, given the contrast in earnings,
even among occupations shared by those
above and below the Standard, it must
be concluded that for many householders
with incomes below the Standard, it is not
the occupation they hold, but rather the
specic jobs within occupations, that most
accounts for their inadequate earnings.
While occupational segregation
and occupational concentration are
important, the strongest contrasts inincomes are between those above
compared to those below the Standard.
Overall, this review of employment
patterns reveals that when work is less
than full time, year round, or there is
only one worker (or relatively rarely,
none), income inadequacy rates are high,
especially for single mothers. At the same
time, this should be put in context, for the
larger story is that among households
with incomes below the Standard, more
than four out of ve have at least one
worker (83%), and over three-fourths
have a full-time worker, 78% have a
year-round worker, and 65% have at
least one full-time, year-round worker.
Among households above the Standard,
99% have at least one worker, 97%
have at least one full-time worker, 94%
have a year-round worker, and 92%have at least one full-time, year-round
worker. Although households above
the Standard have higher percentages
of full-time and year-round workers,
households below the Standard also have
substantial full-time and/or year-round
work. The story here is that substantial
work effort fails to yield sufcient income
to meet even the minimum to achieve
adequate income. Put succinctly, it islargely inadequate wages, not inadequate
work effort, which characterizes the
great majority of households with
incomes below the Standard.
8/10/2019 Overlooked and Undercounted: The Struggle to Make Ends Meet in New York City.
http://slidepdf.com/reader/full/overlooked-and-undercounted-the-struggle-to-make-ends-meet-in-new-york-city 49/108
NEW YORK CITY | 37
NEW YORK CITY COMPARED TO SELECTED STATES
Demographic studies using the Self-
Sufciency Standard have been done
in seven states, some more than once.16
Although not all analyses involved all
the same variables, there is substantial
overlap that makes it possible to
compare these seven states to New York
City across all the major demographic
factors (see Figure R). This study of New
York City is the only city analysis and
it is only one of three that have been
done since the Great Recession began.
Demographic studies done prior tothe Great Recession (2007 or earlier)
had one striking nding: across these
very disparate states, the proportion
of households (non-elderly, non-
disabled) that have inadequate income
clusters around 20% (19%–21%)
in ve of these states—Colorado,
Connecticut, New Jersey, Washington,
and Pennsylvania. The two exceptions
were Mississippi and California, in
which 32% and 31%, respectively, of
households had insufcient incomes.
Obviously, the latter two states are very
different from each other in terms of
their geography, size, and economic and
social structures. However, they share one
similarity: each has a “minority” group
that is both a large proportion of the
population and has disproportionately
high rates of income inadequacy. InMississippi, 35% of households are Black,
of which nearly one-half (49%) have
16 Three of these are based on data from the 2000 Census long
form sample (Washington, Colorado, and Connecticut), andthe remainder use data from the American Community Survey
(California–2007 & 2012, New Jersey–2005, Mississippi–2007,Pennsylvania-2007 & 2010, and Washington-2007).
incomes that are below the Standard.
In California, 30% of households are
Latino, and here too, more than half
(52%) have inadequate income. None
of the other states in this comparison
have a racial/ethnic group with relatively
high rates of income inadequacy that
are such a substantial proportion of the
population—in the other ve states,
the proportions of Black or Latino
populations are much lower, ranging
from 3% to 15%. Nor did any of the
racial/ethnic groups in the other states
have income inadequacy rates quiteas high as the rates for these groups
in California and Mississippi: in these
other states, income inadequacy rates
for Latinos range from 41% to 51%,
and for Blacks from 34% to 46%.
Prior to the Great Recession, these
numbers were remarkably stable.
Demographic studies were repeated
twice in two states, California and
Washington, between 2000 and 2007.
In both cases the overall proportions
and the variations by demographic
variables were almost identical in the
years before the Great Recession.
However, with the advent of the Great
Recession, these seemingly stable
numbers changed dramatically. Since
the beginning of the Great Recession,
there have been two states that have
done demographic studies. In each of
these (Pennsylvania 2010 and California
2012), the overall rate of income
inadequacy increased by about 5
percentage points in Pennsylvania, and
about 7 percentage points in California.
It increased even more for some groups,
such as people of color and women-
maintained families, e.g., the income
inadequacy rate is 8 percentage points
higher for single-mother families in
California in 2012 compared to 2007.
How does New York City compare to
these previous studies? First and most
striking, its rate of income inadequacy
is 42%, higher by far than any state
in this comparison, before or after the
recession. This is well above Mississippi
as well as California. Even if we allow
for the fact that Mississippi’s 2007study is pre-recession, and “add” 5-7
percentage points, this still means that
New York City has a higher rate of
income inadequacy, or poverty, than
Mississippi (or California). New York
City does resemble these two states in
that it has substantial proportions of two
groups with disproportionately high rates
of income inadequacy: 22% of New
York City households are Black, with an
income inadequacy rate of 48% (similar
to the rate in Mississippi), and 25%
are Latino, with an income inadequacy
rate of 61% overall (even higher than
the rate in California for Latinos).
One other factor distinguishes New
York City, and that is that it is a city
rather than a state. At the same time,
if we compare it to other large cities,
it is striking that in many cases, citieshave income inadequacy rates that are
only a few percentage points higher or
lower than their states as a whole, or
similar rates. Thus the income inadequacy
rate for San Francisco (with a cost of
living comparable to New York City,
particularly South Manhattan), is 27%,
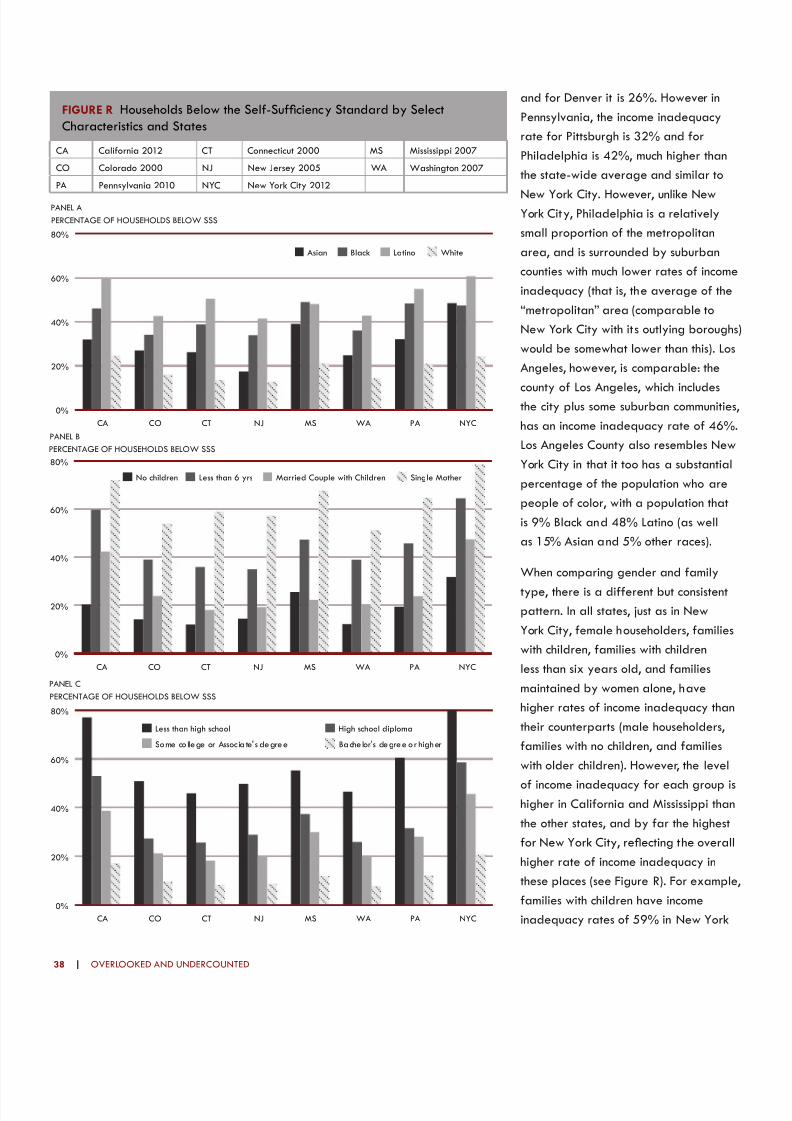
8/10/2019 Overlooked and Undercounted: The Struggle to Make Ends Meet in New York City.
http://slidepdf.com/reader/full/overlooked-and-undercounted-the-struggle-to-make-ends-meet-in-new-york-city 50/108
38 | OVERLOOKED AND UNDERCOUNTED
and for Denver it is 26%. However in
Pennsylvania, the income inadequacy
rate for Pittsburgh is 32% and for
Philadelphia is 42%, much higher than
the state-wide average and similar to
New York City. However, unlike NewYork City, Philadelphia is a relatively
small proportion of the metropolitan
area, and is surrounded by suburban
counties with much lower rates of income
inadequacy (that is, the average of the
“metropolitan” area (comparable to
New York City with its outlying boroughs)
would be somewhat lower than this). Los
Angeles, however, is comparable: the
county of Los Angeles, which includesthe city plus some suburban communities,
has an income inadequacy rate of 46%.
Los Angeles County also resembles New
York City in that it too has a substantial
percentage of the population who are
people of color, with a population that
is 9% Black and 48% Latino (as well
as 15% Asian and 5% other races).
When comparing gender and family
type, there is a different but consistentpattern. In all states, just as in New
York City, female householders, families
with children, families with children
less than six years old, and families
maintained by women alone, have
higher rates of income inadequacy than
their counterparts (male householders,
families with no children, and families
with older children). However, the level
of income inadequacy for each group ishigher in California and Mississippi than
the other states, and by far the highest
for New York City, reecting the overall
higher rate of income inadequacy in
these places (see Figure R). For example,
families with children have income
inadequacy rates of 59% in New York
PERCENTAGE OF HOUSEHOLDS BELOW SSS
Asian Black Latino White
No children Less than 6 yrs Married Couple with Children Single Mother
Less than high school High school diploma
Some co llege or Assoc ia te' s degree Bache lor's degree or higher
PANEL A
PERCENTAGE OF HOUSEHOLDS BELOW SSS
PANEL B
PERCENTAGE OF HOUSEHOLDS BELOW SSS
PANEL C
0%
20%
40%
60%
80%
CA CO CT NJ MS WA PA NYC
0%
20%
40%
60%
80%
CA CO CT NJ MS WA PA NYC
0%
20%
40%
60%
80%
CA CO CT NJ MS WA PA NYC
FIGURE R Households Below the Self-Sufciency Standard by SelectCharacteristics and States
CA California 2012 CT Connecticut 2000 MS Mississippi 2007
CO Colorado 2000 NJ New Jersey 2005 WA Washington 2007
PA Pennsylvania 2010 NYC New York City 2012
8/10/2019 Overlooked and Undercounted: The Struggle to Make Ends Meet in New York City.
http://slidepdf.com/reader/full/overlooked-and-undercounted-the-struggle-to-make-ends-meet-in-new-york-city 51/108
NEW YORK CITY | 39
City, 39% in Mississippi (2007), and
51% in California (2012), while in the
rest of the states the rates of income
inadequacy for families with children
range from 27% to 29% pre-recession
(and 35% in Pennsylvania 2010).
Likewise, families with children less
than six years old have income
inadequacy rates of 65% in New York
City, 47% in Mississippi, and 60% in
California. However the rates range
from 35%–46% in the other states.
Among single-mother families, 79% in
New York City, 72% in California, and
68% in Mississippi have inadequate
income; in the remaining states, the
proportion with inadequate income is
somewhat less, ranging from 52%–65%.
In terms of educational attainment, the
pattern observed above with gender
and family type prevails, with the
proportions with inadequate income at
any given level somewhat higher for
California, Mississippi, and especially
New York City than the other states.
Thus, among householders who lack a
high school degree, 77% in California,
55% in Mississippi, and 80% in NewYork City have inadequate income,
compared to 46%–61% in the other
ve states. This pattern is true at
all educational levels, although the
differences between states decline at
higher levels of educational attainment.
In California 44% of households with
only one worker have insufcient income,
and in Mississippi, 41%, while in New
York City, 47% of households with just
one worker have insufcient income.
In the other ve states the rate of
income inadequacy among households
with one worker is below 32%.
Overall, this comparison indicates that
the patterns of income inadequacy are
similar across states in terms of which
groups are likely to experience the
highest rates of income inadequacy.
At the same time, there are substantial
differences between the states in terms
of the levels of income inadequacyoverall, and for various subgroups,
with California and Mississippi having
consistently higher levels, but New
York City having the highest levels of
income inadequacy for all demographic
groups. There also is a “recession effect,”
which for Pennsylvania is about 3-7
percentage points, depending upon the
subgroup. However, even taking this
into account, New York City in 2012has higher levels of income inadequacy
overall, and for all demographic
subgroups, compared to the sample
of other states presented here.
8/10/2019 Overlooked and Undercounted: The Struggle to Make Ends Meet in New York City.
http://slidepdf.com/reader/full/overlooked-and-undercounted-the-struggle-to-make-ends-meet-in-new-york-city 52/108
8/10/2019 Overlooked and Undercounted: The Struggle to Make Ends Meet in New York City.
http://slidepdf.com/reader/full/overlooked-and-undercounted-the-struggle-to-make-ends-meet-in-new-york-city 53/108
POLICY ANALYSIS &
RECOMMENDATIONS

8/10/2019 Overlooked and Undercounted: The Struggle to Make Ends Meet in New York City.
http://slidepdf.com/reader/full/overlooked-and-undercounted-the-struggle-to-make-ends-meet-in-new-york-city 54/108
8/10/2019 Overlooked and Undercounted: The Struggle to Make Ends Meet in New York City.
http://slidepdf.com/reader/full/overlooked-and-undercounted-the-struggle-to-make-ends-meet-in-new-york-city 55/108
NEW YORK CITY | 43
NEW YORK CITY’S LIVING WAGE LAW.
New York City Mayor Bill de Blasio’s
September 2014 Executive Order
expands the City’s Living Wage Law
from $11.50 per hour to $13.13 an hour
(including $1.63 for health benets).3
ThisLiving Wage Law4 applies to a select
group of workers employed in businesses
or commercial spaces that receive
more than $1 million in city subsidies as
dened by section 6-134 of the City
Administrative Code. The executive
order is projected to expand coverage
of this Living Wage from a current
cohort of 1,200 workers to an estimated
18,000 workers over the next ve years.Beginning in January 2015, this Living
Wage will be adjusted for ination. The
Mayor’s ofce projects that with ination
Brief, Apri l 2014, p. 1, ht tp://www.nelp.org/page/-/Reports/
Low-Wage-Recovery-Industry-Employment-Wages-2014-Report.pdf?nocdn=1 (accessed June 11, 2014).3 The City of New York, Ofce of the Mayor, “Living Wage forCity Economic Development Projects,” http://www1.nyc.gov/
assets/home/downloads/pdf/executive-orders/2014/eo_7.pdf(accessed November 14, 2014).
4 The City’s older Living Wage Law (section 6-109 of theAdministrative Code) covers a limited number of workersproviding care under City government contracts. Enacted in
1996, this living wage covers workers providing day care, headstart, building services, food services, and temporary services,
with coverage extended in 2002 to homecare workers andworkers providing services to persons with cerebral palsy. The
wage level under this living wage law has been $11.50 an hour(including $1.50 for health benets) since 2006, and is not
automatically adjusted for ination.
INCREASE WAGES TO ALIGN WITH
THE COST OF LIVING
The single greatest driver to increase
self-sufciency is higher wages. The
income needed for a household to be
self-sufcient has risen on average by
48% across boroughs since the year
2000, while the median earnings of
working adults have increased only
17%. Consequently, more than two out
of ve working-age households cannot
meet their basic needs while others are
barely breaking even. Although many
New Yorkers work insufcient hours,
more hours would not raise standards of
self-sufciency as substantially as would
an increase in wage rates. In too many
occupations, wages have not kept pace
with the rising cost of living. New York
City’s employment has now surpassed
pre-recession levels yet most of the
net job growth since 2000 has been
concentrated in low-wage sectors, as
opposed to jobs paying moderate- and
middle-income wages.2
2 James A . Parrott, February 27, 2014, “Low-Wage Workers and
the High Cost of Living in New York City,” Testimony Presented tothe New York City Council Committee on Civil Service and Labor,
http://scalpolicy.org/wp-content/uploads/2014/02/FPI-Parrott-testimony-Low-Wage-workers-and-Cost-of-iving-Feb-
27-2014.pdf (accessed November 14, 2014). Also see NationalEmployment Law Project, “The Low-Wage Recovery: Industry
Employment and Wages Four Years into the Recovery,” Data
SELF-SUFFICIENCY WAGE FOR A BRONX FAMILY OF THREE
An hourly wage of $13.13 in New York City yields an annual income of $27,310,
slightly above the Self-Sufciency Standard for a single adult living in the Bronx
($26,951). However, that single person’s neighbors—a married couple with one
infant—would not be self-sufcient even if each parent worked at jobs earning
a $13.13 hourly wage. Indeed, in order to meet their basic needs, each parent
would need to earn $14.66, working full time (totaling $61,965). Five years
later, when their child is old enough for full-day public school their costs will fall
as they would then only need part-time child care. In the unlikely scenario that
there is no increase in living expenses, the Living Wage would then be above
the minimum wage ($12.39 per hour) needed to meet their basic needs.
adjustments, this City Living Wage will
reach $15.22 in 2019.5
The current New York State minimum
wage of $8.00 per hour applies to a
more comprehensive group of workers
across most sectors. Along with 26 other
states and the District of Columbia, New
York State sets a higher minimum wage
level than the current $7.25 federal
minimum wage.6 President Obama has
proposed raising the federal minimum
wage to $10.10 an hour.7 The purchasing
power of the federal minimum wage
has fallen by 22 percent since the late
1960s.8 Moreover, if the minimum wage
had kept pace with overall productivity
growth in the economy, it would be
nearly $19.00 by 2016.9
Under present state law, New York’s
minimum wage will increase to $8.75
on December 31, 2014, and to $9.00
an hour on December 31, 2015.10 It is
not indexed to ination. There is Albany
legislation pending to increase the state
minimum to $10.10, and a separate
5 City of New York, September 30, 2014, “Mayor de BlasioSigns Executive Order to Increase Living Wage and Expand it to
Thousands More Workers,” News, http://www1.nyc.gov/ofce-of-the-mayor/news/459-14/mayor-de-blasio-signs-executive-
order-increase-living-wage-expand-it-thousands-more#/0(accessed November 14, 2014).6 Currently 23 states and the District of Columbia have minimum
wages above the federal minimum wage. Additionally, fouradditional states approved ballot measures in the 2014 election.
National Conference of State Legislatures, “State MinimumWages | 2014 Minimum Wages by State,” http://www.ncsl.org/
research/labor-and-employment/state-minimum-wage-chart.aspx (accessed November 14, 2014).7 The White House, Ofce of the Secretary, “President Barack
Obama’s State of the Union Address,” http://www.whitehouse.gov/the-press-ofce/2014/01/28/president-barack-obamas-state-union-address (accessed November 14, 2014).8 Jared Bernstein & Sharon Parrott, January 7, 2014, “Proposalto Strengthen Minimum Wage Would Help Low-WageWorkers, With Little Impact on Employment,” Center on
Budget and Policy Priorities, Economy, http://www.cbpp.org/cms/?fa=view&id=4075 (accessed November 14, 2014).9 David Cooper, December 19, 2013, “Raising the Federal
Minimum Wage to $10.10 Would Lift Wages for Millions andProvide a Modest Economic Boost,” Economic Policy Institute,
http://www.epi.org/publication/raising-federal-minimum-wage-to-1010/10 New York State, Department of Labor, “Minimum Wages,”
Labor Standards, http://www.labor.ny.gov/workerprotection/laborstandards/workprot/minwage.shtm (accessed November14, 2014).

8/10/2019 Overlooked and Undercounted: The Struggle to Make Ends Meet in New York City.
http://slidepdf.com/reader/full/overlooked-and-undercounted-the-struggle-to-make-ends-meet-in-new-york-city 56/108
44 | OVERLOOKED AND UNDERCOUNTED
measure to give localities the authority
to set a local minimum wage up to 30
percent above the state minimum. If
both proposed laws were enacted, New
York City could set a $13.13 hourly
minimum wage. A growing number oflarge cities, and a few suburban counties,
are establishing higher minimum wage
levels. Seattle, San Diego, San Jose, San
Francisco, and Washington, D.C. already
have established higher minimums, and
Chicago, Los Angeles, and Oakland are
among the cities considering substantially
higher minimum wages in the $12-$15
an hour range. Both Seattle and San
Francisco have acted to raise theirminimum wage levels to $15.00 an hour
in coming years.
The expansion of New York City’s Living
Wage levels to cover more workers at
a higher rate and indexed to ination,
or to establish a signicantly higher
minimum wage are important steps in
providing a more reasonable wage
oor in the job market, enabling more
employed New Yorkers to achieveself-sufciency through work. At the
same time, it is critical to note that even
an hourly wage of $13.13 does not
constitute a self-sufciency wage for
most compositions of New York City
households across the ve boroughs (see
previous page Bronx Family of Three).
It is necessary to broaden living wage
coverage to the City’s large indirect social
service workforce, coupled with better
career advancement supports. Existing
City Living Wage law currently does
not appliy to the tens of thousands of
workers at not-for-prot organizations
providing essential social services
under City contract. New York City
spends $5 billion annually on social
service contracts and, as such, is a
major indirect employer of tens of
thousands of workers at not-for-prot
organizations. Wages in this sector are
among the lowest for all industries. Halfof non-prot social service workers are
paid less than $14 an hour.11 Among
those working in community and social
service occupations, over a third are
in households within 200 percent of
the federal poverty level. A campaign
is underway in which the City would
increase contract funding to establish
a $15 an hour wage oor, coupled
with sector-wide support for greaterprofessional development opportunities
for lower-paid nonprot social service
workers.12
A minimum wage increase to $13.13 an
hour and a $15 an hour wage oor for
social service workers on City contracts
represent considerable progress. Yet,
these critical wage oors should not
be misconstrued as ceilings. These
wage levels would provide a workerwith annual earnings around $25,000-
$30,000. Neither wage rate constitutes
a self-sufciency wage for a substantial
portion of the 780,000 working
households below the Self-Sufciency
Standard.
Raising the wage oor is good for workers
and communities with potential benets
to jobs and businesses. While raising
the minimum wage provokes debate at
the federal, state, or municipal level,
11 See Jennifer Jones-Austin (FPWA) and James Parrott (FPI),
November 5, 2014, “Expanding Opportunities and ImprovingCity Social Service Quality Through a Career Ladder Approach,”
Brieng at Philanthropy New York, www.philanthropynewyork.org/sites/default/les/resources/Presentation_Jones%20
Austin%20and%20Parrott_11.05.2014.pdf12 Ibid.
there is considerable consensus among
economists and social scientists who
have studied the impacts of raising the
minimum wage: raising the minimum
wage has positive workplace impacts
beyond the obvious one of increasingworkers’ earnings, including reduced
turnover (increased job security for
workers), increased employer investment
in training, and improved employee
productivity and morale. Moreover,
it has negligible negative effects on
employment and minimal effects on price
increases.13 For example:
A 2011 study of citywide minimum•
wage increases by the Center
for Economic and Policy Research
examined minimum wage increases
passed in Santa Fe, San Francisco,
and Washington, D.C., and found
that wages rose for low-paid cooks,
servers and workers in fast-food, food
services, retail, and other low-wage
establishments without causing a
statistically signicant decrease in total
employment levels.14
A 2014 study of San Francisco’s•
minimum wage, health care, and paid
sick leave laws, which collectively
raised the compensation of low-wage
people to 80 percent above the
federal minimum wage, found that
these laws raised pay without costing
jobs. From 2004 to 2011, private
sector employment grew by 5.6
13 Arindrajit Dube, T. William Lester and Michael Reich,
“Minimum Wage Effects Across State Borders: E stimatesUsing Contiguous Counties,” Review of Economic and Statistics
(November 2010), available at http://www.irle.berkeley.edu/workingpapers/157-07.pdf; see also NELP Summary, available
at http://nelp.3cdn.net/98b449fce61fca7d43_j1m6iizwd.pdf.14 John Schmitt and David Rosnick, 2011, The Wage andEmployment Impact of Minimu m-Wage Laws in Three Cities,
http://www.cepr.net/index.php/publications/reports/wage-employment-impact-of-min-wage-three-cities (accessed October22, 2014).

8/10/2019 Overlooked and Undercounted: The Struggle to Make Ends Meet in New York City.
http://slidepdf.com/reader/full/overlooked-and-undercounted-the-struggle-to-make-ends-meet-in-new-york-city 57/108
NEW YORK CITY | 45
employers across sectors to do more:
raise wages beyond the oor, index them
to cost of living increases, and ensure
that compensation packages are fair,
equitable and responsive to the need of
employees to meet and move securelybeyond the Self-Sufciency Standard.
STRUCTURE EMPLOYMENT AS A
PATHWAY OUT OF POVERTY TO SELF-
SUFFICIENCY
In New York City, 780,000 households
have at least one working adult, many
of them full time, yet they lack adequate
resources to meet even their most basicneeds.
A critical driver of employment with self-
sufciency wages is education—80% of
the people without a high school degree
are living below the standard of self-
sufciency. At the same time, education
is not a guarantee. Twenty-one percent
of all people with a four-year college
degree still earn inadequate incomes.
The Self-Sufciency Standard report
highlights the persistent gender and
racial inequities around what it takes
to earn a self-sufciency wage. Even
with equal education and equal work
effort, income inadequacy is more severe
among households maintained by women
alone, households maintained by people
of color, and households with children.
For example, women of color with some
college or an associate’s degree have
nearly the same income inadequacy
rate as white males without a high school
diploma or GED (55% compared to
57%). Well into the 21st century, our
low-wage workforce disproportionately
RECOMMENDATIONS: INCREASE WAGES TO ALIGN WITH THE
COST OF LIVING
Increase wage foors.1. Wages that are sufcient to cover living costs is at
base what denes fair compensation. If we are committed to restoring fairness
and countering rising inequality, then a higher City minimum wage oor is
needed and City living wage policies should be expanded, particularly to
encompass the sizable non-prot social service workforce.
The City needs to increase social service contract funding levels to make up
for years of inadequate funding and enable non-prots to improve pay and
advancement opportunities for poorly compensated workers. Philanthropic
grant-making practices could bolster these efforts by funding the full workforce
costs of carrying out projects, including allocating funds to general operating
costs and overhead, and ensuring the adequacy of human resource budgets
and hourly pay rates.
In New York City, raising the wage oor is the most effective single policy for
countering rising inequality.
Index wages.2. Once wage oors are raised to adequate levels they should
be indexed to ination so that workers’ purchasing power is not inadvertently
eroded by increases in the cost of living.
Strengthen Employers’ Policies.3. Investment in a stable and robust
workforce, whether direct or indirect, can improve the quality of products and
services, enhance company reputations, and help build a loyal customer base. It
is also critical for all employers to foster salary parity across gender and racial/
ethnic lines. Employers should evaluate compensation levels and pay scales of
their workforces, including through the lens of equity. Corporations that contract
out service or supply functions to other rms should ensure that contractors fairly
compensate workers. This is good for individual workers and it is good for the
bottom line.
percent in San Francisco, but fell by
4.4 percent in other Bay Area counties
that did not have a higher local wage.
Among food service wage earners,
who are more likely to be affected by
minimum wage laws, employment grew18 percent in San Francisco, faster than
in other Bay Area counties.15
15 Michael Reich, Ken Jacobs, and Miranda Dietz, The Institute
for Research on Labor and Employment, When Mandates Work
INDEXING. Wages across sector should
be indexed to the cost of living. Indexing
is key to maintaining the value of the new
higher wages over time.16
While we look to government to
enforce an equitable oor, we look to
Raising Labor Standards at the Local Level, http://irle.berkeley.edu/publications/when-mandates-work.16 Such indexing since 2000 has resulted in Washington State
by 2014 having the highest statewide minimum wage, $9.32 perhour in the country.

8/10/2019 Overlooked and Undercounted: The Struggle to Make Ends Meet in New York City.
http://slidepdf.com/reader/full/overlooked-and-undercounted-the-struggle-to-make-ends-meet-in-new-york-city 58/108
46 | OVERLOOKED AND UNDERCOUNTED
consists of women, people of color, and
immigrants.
Building access to better employment
requires investment in career ladders,
pathways and apprenticeships with
consistent, systematic and large-scale
opportunities for individual growth
and advancement across sectors and
industries. The surge in well-paying
technology jobs is an example of a
promising direction for more sectors to
follow and should be a pathway for
traditionally less-advantaged individuals
and communities. Investment in high
quality education beginning in early
childhood is also critically important,
as are the supports that place and
keep children on college and career
continuums. New York City’s Universal
pre-kindergarten program is a promising
step and we urge the city to continue this
direction of building an inclusive quality
education system that begins in a child’s
rst three years.
MAKE QUALITY, AFFORDABLE
HOUSING, FOOD, AND CHILD CARE
ACCESSIBLE TO ALL NEW YORKERS
As the family from the Bronx on p. 43
highlights, even an increased Living
Wage of $13.13 per hour still requires
work supports, such as subsidized child
care, in order to cover the costs of
other basic needs. Without child care,
at least one parent would have to stopworking, creating the need for even
more supports—such as food stamps,
emergency food pantries, and the costly
homeless shelter system. When wages
and employment benets’ packages
RECOMMENDATIONS: STRUCTURE EMPLOYMENT AS A PATHWAY OUT OF
POVERTY TO SELF-SUFFICIENCY
Identify and develop structures that consistently highlight and create access4.
to career ladders and pathways for individuals within companies and sectors,
as well as out into other industries. Employers should assess pathways foradvancement in their existing workforce and build opportunities for continued
and advanced employment with better wages, particularly for entry level
workers and populations which have historically worked longer or required more
years of education to achieve the same level of self-sufciency. City government
can lead by example through supporting more systematic professional
development and career advancement opportunities for lower-paid social
service workers employed under City service contracts.
Strengthen policies and practices that improve retention and allow workers5.
to better balance work and family life, such as exible work hours, predictable
scheduling, work-sharing and paid sick leave.
Promote new jobs and emerging industries which provide wages that are6.
at Self-Sufciency Standard levels and support and encourage plans for
workforce retention and advancement by tying incentives and employment
contracts to Self-Sufciency Standards.
Utilize workforce training and development resources for preparing people7.
for higher wage jobs in all sectors, which should include apprenticeships along
with degree and credentialing programs. Fund innovative pilots and promising
practices.
Invest in the workforce required for redressing economic inequities by8.
sufciently funding social and human services. The lower-wage social and human
services workforce consists predominantly of women of color. Appropriate
compensation and intentional career pathways build the expertise and retention
rates of the workforce. Increase funding towards education and skills to build
highly effective staff at all levels and to advance individuals into better-paying
positions.
Invest in effective cradle to college continuums for target populations and9.
communities. Resources commensurate with need must be available to keep
children—particularly those from households and communities below the
Self-Sufciency Standard—on the pathway to higher education or to quality
apprenticeship programs and nontraditional training. Additional support is
required for efforts that ensure timely and affordable completion of degree
programs and higher education.
Fund and support advocacy for broad scale, systemic solutions.10.
8/10/2019 Overlooked and Undercounted: The Struggle to Make Ends Meet in New York City.
http://slidepdf.com/reader/full/overlooked-and-undercounted-the-struggle-to-make-ends-meet-in-new-york-city 59/108
NEW YORK CITY | 47
are not sufcient for people to meet
their basic needs, New Yorkers turn to
public and private charity to ll the
gaps. Each year that wages fall further
behind the cost of living, it increases the
costs to government—and to all of usas taxpayers—as well as straining the
already overburdened private charity
system.
Affordable housing, food, and child care
are essentials to anyone who seeks to
attain and maintain employment. City,
state, federal and philanthropic dollars
go towards programs that provide
access to millions of New Yorkers who
cannot access them on their own. While
these programs are critical lifelines for
individuals and families all around us, at
the current level, these programs do not
support everyone who needs them, nor
do they provide the depth of support
needed for those who have them.
HOUSING. While all basic needs’ costs
have risen, the largest increase has been
in housing, which has risen on average59% between 2000 and 2014. Rising
rental costs make it increasingly difcult
for New Yorkers to hold onto their homes
and remain in their neighborhoods. As
shown in Figure E, Prole of Households
with Inadequate Income, 81% of the
New Yorkers living below the Self-
Sufciency Standard spend more than
30% of their income on housing. Home
ownership—which is one of the most
reliable ways to build assets and upward
mobility—is prohibitive for most New
Yorkers. Rent regulations and specialized
RECOMMENDATIONS: MAKE QUALITY, AFFORDABLE HOUSING, FOOD,
AND CHILD CARE ACCESSIBLE TO ALL NEW YORKERS
For too many, work does not pay enough to afford costly basic necessities.
Ensure that New Yorkers across the income spectrum, from low-to moderate-
income levels, can afford their essentials.
NYC must continue to roll out its ambitious Affordable Housing Plan,11.
harnessing the power of the private market to help build, preserve, and expand
affordable units. Priorities include the following:
Preserve existing affordable housing in private rent-regulated buildings,•
and set standards so that the impact of city-subsidized housing affordability is
not undermined by short-term affordability requirements. These preservation
goals are the most cost-effective way to maintain affordability for the
greatest number of people. For the city-subsided housing, the City must ensure
that stronger standards are in place so that all programs are permanently
affordable. The City should also work closely with neighborhood-based not-for-
prot affordable housing developers, who ensure true permanent affordability.
For the private rent-regulated housing, we call on Albany to repeal the Urstadt
Amendment, ending state control over city rent regulations, and to also repeal
the luxury decontrol threshold. We call on the NYC rent guidelines board to
set yearly rental increases that are appropriate for and in line with interests of
tenants as well as landlords.
Ensure that new housing development result in the maximum amount of•
affordable housing by using multiple approaches and incentive levers:
Mandatory inclusionary zoning so that developers who take advantage•
of increased zoning density are required to build commensurate amounts of
affordable housing.Tax Abatements. The 421A Tax Abatement laws are sun setting and the City•
and State’s response must ensure that public benets from subsidized buildings
are commensurate with the nancial incentive afforded to developers. A
city-wide requirement could ensure that housing built anywhere in NYC includes
affordable units and, moreover, that those units indeed provide public benet
by maximizing the percentage of affordable housing and deepening the level
of affordability so that local neighborhoods are truly stabilized. When the City
provides more than one benet to the private housing sector, benets to the
public must in turn be stacked against each other, rather than combined, so that
benets developers’ receive are commensurate with the benets they provide to
communities.

8/10/2019 Overlooked and Undercounted: The Struggle to Make Ends Meet in New York City.
http://slidepdf.com/reader/full/overlooked-and-undercounted-the-struggle-to-make-ends-meet-in-new-york-city 60/108
48 | OVERLOOKED AND UNDERCOUNTED
rental support programs that restrain
ballooning housing cost increases, are
critical yet are accessible to too few
households.
CHILD CARE. After housing, child care
is the single greatest expense in a
family’s budget for those with young
children. Even with equal work effort,
income inadequacy is more severe
among households with children. Fifty-
three percent of all households below
the Self-Sufciency Standard—more
than half—have children. This reects in
part the signicant expense associated
with raising children and the way that
lack of access to affordable, high
quality child care is a roadblock to
primary caretakers’ careers, educational
advancement, and opportunities for
savings.
FOOD. The cost of food has risen an
average of 59% in NYC since 2000.
Unlike xed costs such as housing
and child care, food is “elastic” and
spending can be reduced when availableincome is less. Households balance
their budgets by foregoing food to
pay rent, by eliminating more nutritious
but costlier fruits and vegetables, and
by turning to government supports
such as the Supplemental Nutrition
Assistance Program (SNAP), school
meals and social hubs with meals, such
as religious or senior centers. New
York City’s emergency food network
of soup kitchens and food pantries
now struggle to serve 1.4 million New
Yorkers annually, who are chronically
uncertain as to where their next meal
will come from. The impact from reduced
RECOMMENDATIONS, CONTINUED: MAKE QUALITY, AFFORDABLE
HOUSING, FOOD, AND CHILD CARE ACCESSIBLE TO ALL NEW YORKERS
Continue to expand access to high quality, affordable early education and12.
afterschool programming:
Successfully implement full-day universal prekindergarten to all four year-olds.•Expand full-day universal prekindergarten to all three year-olds.•
Encourage child care centers and family day care homes to reach a diverse,•
economically integrated population of children by permitting sliding scale tuition
and parent fee requirements and child care subsidies, engaging children from
families across the income spectrum to those who pay market rate.
Expand the capacity of infant and toddler child care provided in licensed,•
regulated child care centers and family day care homes.
Expand the refundable state and local child care tax credits.•
Ensure that parents on public assistance have appropriate and complete•
information on the types of subsidized child care options available as well as
information on available seats in high quality center based and family day carehomes. Besides concrete information and options, also ensure that parents have
sufcient time to secure appropriate and high quality child care.
Successfully implement universal access to middle school afterschool•
programming and expand afterschool and summer programming to elementary
school children and high school students.
Ensure that the early childhood staff and afterschool staff benet from•
adequate compensation, professional development and career ladders.
Ensure that rates of reimbursement allow providers to meet quality standards.•
Overall, ensure that investment is commensurate with need, by fully funding•
quality, affordable, and reliable child care from birth through age ve.
Responses to food insecurity must go beyond emergency food programs to13.
long-term sustainable options:
Decrease the numbers of New Yorkers living in areas with low access to•
fresh food purveyors by providing zoning and nancial incentives to eligible
grocery store operators and developers, incorporating food security priorities
into affordable housing plans, and funding and expanding innovative pilots
designed to increase access.
Support ‘good food/good jobs’ initiatives that partner business,•
philanthropies, and government to bolster employment, foster economic growth,
ght hunger, improve nutrition, cut obesity, and reduce spending on diet-related
health problems by bringing healthier food into low-income neighborhoodsand creating jobs. This includes seed money for food jobs projects, food
processing, expanding community-based technical assistance, investment in
urban aquaculture, and reduced bureaucratic burdens on food-related small
businesses.
8/10/2019 Overlooked and Undercounted: The Struggle to Make Ends Meet in New York City.
http://slidepdf.com/reader/full/overlooked-and-undercounted-the-struggle-to-make-ends-meet-in-new-york-city 61/108
NEW YORK CITY | 49
purchasing power for food goes beyond
individuals and families to food retailers.
This effect was underscored by the 2011
supermarket need index which identied
a widespread shortage of neighborhood
grocery stores and supermarkets. Highneed for fresh food purveyors affects
more than three million New Yorkers, with
the highest need found in low-income
neighborhoods.17
17 City of New York, Ofce of the Mayor, “New York City FoodPolicy: 2013 Food Metrics Report,” http://www.nyc.gov/html/
nycfood/downloads/pdf/ll52-food-metrics-report-2013.pdf.
SAVINGS. Saving is unrealistic for many
New Yorkers because there just is nothing
left at the end of the month. For the rst
time, the 2014 Self-Sufciency Standard
Report calculates emergency savings as
a minimum, required expense, alongsidefood, housing, child care, health care,
transportation and taxes. Emergency
short-term savings address the income
and expense volatility that working
poor households all too regularly face.
Yet as is the case with all calculations
in the Self-Sufciency Standard, the
savings’ estimates are extremely modest.
They only cover short-term, one time
emergencies. Long-term asset building,
such as saving for higher education,
retirement and home buying, thatenables upward mobility and economic
security would require additional
resources beyond Self-Sufciency
Standard level wages and emergency
savings.
RECOMMENDATIONS, CONTINUED: MAKE QUALITY, AFFORDABLE
HOUSING, FOOD, AND CHILD CARE ACCESSIBLE TO ALL NEW YORKERS
Increase utilization and broaden and deepen access to WIC, SNAP, and•
School Meals, and endorse the Federal Child Nutrition Reauthorization Act with
strong guidelines.
Ensure that all households can meet unexpected nancial setbacks,14.
especially those with the fewest resources, by building savings—both foremergencies and for asset building:
Promote the capacity of New Yorkers at all stages of life to save with•
systematic, comprehensible and accessible savings options at their places of
employment.
Increase the l ikelihood that New Yorkers will save by instituting opt out, rather•
than opt in options for long-term savings programs.
Maximize the take-up of tax credits, such as the Earned Income Tax Credit•
and the Child Care Tax Credit, and at the state level deepen and expand tax
credits to more households at or below the Self-Sufciency Standard. Use EITC
and tax credit refunds to expand opportunities to save, both emergency and for
longer-term investments.
Remove disincentives to save. In particular, ensure that eligibility guidelines•
for work supports do not preclude basic and essential needs for building
emergency savings. Individual Development Accounts allow welfare recipients to
save for specics like education, without losing benets.

8/10/2019 Overlooked and Undercounted: The Struggle to Make Ends Meet in New York City.
http://slidepdf.com/reader/full/overlooked-and-undercounted-the-struggle-to-make-ends-meet-in-new-york-city 62/108
APPENDIX A:
METHODOLOGY & DATA SOURCES

8/10/2019 Overlooked and Undercounted: The Struggle to Make Ends Meet in New York City.
http://slidepdf.com/reader/full/overlooked-and-undercounted-the-struggle-to-make-ends-meet-in-new-york-city 63/108
NEW YORK CITY | 5
OVERLOOKED & UNDERCOUNTED
DATA AND SAMPLE
This study uses data from the 2012
American Community Survey by theU.S. Census Bureau. The American
Community Survey (ACS), which shifted
from a demonstration program to the full
sample size and design in 2005, is a new
approach to collecting census data that
eliminated the need for a long form in the
2010 Census. The ACS publishes social,
housing, and economic characteristics
for demographic groups covering a
broad spectrum of geographic areaswith populations of 65,000 or more in
the United States and Puerto Rico.
The 2012 Public Use Microdata
Sample (PUMS) is a set of data les
that contains records of a one-percent
sample of all housing units surveyed.
For determining the PUMS sample size,
the size of the housing unit universe is
the ACS estimate of the total number
of housing units. Nationally, the 2012
PUMS data set contains a one-percent
sample size of 1,340,387 housing unit
records (representing a housing unit
estimate of about 130 million households
nationally); in the state of New York,
the 2012 ACS one-percent sample size
is 81,231 housing units (representing
a housing unit estimate of 8,123,585
New York State households).1
The most detailed geographic level
included in the ACS is Public Use Micro
Data Sample Areas (PUMAs), which are
special, non-overlapping areas that
1 U.S. Census Bureau. PUMS Accuracy of the Data(2012), http://www.census.gov/acs/www/Downloads/data_documentation/pums/Accuracy/2012AccuracyPUMS.pdf
partition a state. Each PUMA, drawn
using the Census 2010 sample PUMS les,
contains a population of about 100,000.
New York City, which has ve counties,
is partitioned into 55 PUMAs, with 2012
ACS estimates reported for each.
Since the Self-Sufciency Standard
assumes that all adult household members
work, the population sample in this report
includes only those households in which
there is at least one adult of age 18-65
who is not disabled. Thus, although the
ACS sample includes households thathave disabled and/or elderly members,
this report excludes disabled/elderly
adults and their income when determining
household composition and income.
Households dened as “group quarters”
are also excluded from the analysis.
In total, 2,235,018 non-disabled, non-
elderly households are included in this
demographic study of New York City.
MEASURES USED: HOUSEHOLD
INCOME, THE FPL AND THE SELF-
SUFFICIENCY STANDARD
INCOME. The ACS/Census income is
determined by calculating the total
income of each person in the household,
excluding seniors and disabled adults.
Income includes money received during
the preceding 12 months by non-disabled/non-elderly adult household
members (or children) from: wages
or salary; farm and non-farm self-
employment; Social Security or railroad
payments; interest on savings or bonds,
dividends, income from estates or
trusts, and net rental income; veterans’
payments or unemployment and worker’s
compensation; public assistance or
welfare payments; private pensions or
government employee pensions; alimony
and child support; regular contributions
from people not living in the household;
and other periodic income. It is assumed
that all income in a household is
equally available to pay all expenses.
Not included in income are: capital
gains; money received from the sale of
property; the value of in-kind income
such as food stamps or public housing
subsidies; tax refunds; money borrowed;or gifts or lump-sum inheritances.
THE FPL. This study uses the 2012 U.S.
Census Bureau poverty thresholds,
which vary by family composition
(number of adults and number of
children) but not place, with each
household coded with its appropriate
federal poverty measure (FPL).
THE SELF-SUFFICIENCY STANDARD.Because the Self-Sufciency Standard
has been calculated for 2010
and 2014, but not 2012 for New
York City, 2012 Standards were
calculated by interpolating between
the 2010 and 2014 Standard for
each family type, and for each
PUMA, depending on its location.
Households are categorized by whether
household income is (1) below the federal
poverty threshold (FPL) as well as below
the Self-Sufciency Standard, (2) above
the poverty threshold but below the
Standard, or (3) above the Standard.
Households whose income is below the
Standard are designated as having
“insufcient” or “inadequate” income.

8/10/2019 Overlooked and Undercounted: The Struggle to Make Ends Meet in New York City.
http://slidepdf.com/reader/full/overlooked-and-undercounted-the-struggle-to-make-ends-meet-in-new-york-city 64/108
52 | OVERLOOKED AND UNDERCOUNTED
THE SELF-SUFFICIENCY STANDARD
family types for each borough in New
York City are included in Appendix B.
The Self-Sufciency Standard assumesadult household members work full
time and therefore includes all major
costs associated with employment for
every adult household member (i.e.,
taxes, transportation, and child care
for families with young children). The
Self-Sufciency Standard does not
calculate costs for adults with disabilities
or elderly household members who
no longer work. It should be notedthat for families with persons with
disabilities or elderly family members
there are costs that the Standard does
not account for, such as increased
transportation and health care costs.
The Standard assumes adults work 8
hours per day for 22 days per month
and 12 months per year. Each cost
component in the Standard is rst
calculated as a monthly cost. Hourlyand annual Self-Sufciency Wages
are calculated based on the monthly
Standard by dividing the monthly Self-
Sufciency Standard by 176 hours per
month to obtain the hourly wage and
multiplying by 12 months per year to
obtain the annual wage. The Standard
therefore assumes a full-time worker
works a total of 2,112 hours per year.
The components of The Self-Sufciency
Standard for New York City 2014
and the assumptions included in the
calculations are described below.
HOUSING
For housing costs, the Standard uses the
most recent Fiscal Year (FY) Fair MarketRents, which are calculated annually by
the U.S. Department of Housing and
Urban Development (HUD) for each
state’s metropolitan and non-metropolitan
areas, and are used to determine the
level of rent for those receiving housing
assistance through the Housing Choice
Voucher Program.2 Housing costs in the
2014 New York City Self-Sufciency
Standard are calculated using the FY2014 HUD Fair Market Rents (FMRs).
The FMRs are based on data from the
1-year and 5-year American Community
Survey estimates, and are updated for
ination using the Consumer Price Index.
The survey sample includes renters who
have rented their unit within the last
two years, excluding new housing (two
years old or less), substandard housing,
and public/subsidized housing. Thus
FMRs, which include utilities (except
telephone and cable), are intended to
reect the cost of housing in the current
market that meets minimum standards
of decency.3 FMRs are typically set at
the 40th percentile, which means that
40% of the housing in a given area is
less expensive than the FMR, and 60%
2
Section 8(c)(1) of the United States Housing Act of 1937requires the Secretary to publish Fair Market Rents (FMRs)periodically, but not less than annually, to be effective on
October 1st of each year. U.S. Department of Housingand Urban Development, “Final Fair Market Rents for
the Housing Choice Voucher Program and ModerateRehabilitation Single Room Occupancy Program Fiscal Year
2014,” Federal Register Vol. 78, No. 192 (October 3, 2013),http://www.huduser.org/portal/datasets/fmr/fmr2014f/
FY2014_FR_Preamble.pdf (accessed May 12, 2014).3 U.S. Housing and Urban Development, “Fair MarketRents for the Section 8 Housing Assistance Payments
Program,” Data Sets, Fair Market Rents: Overview (rev2007), http://www.huduser.org/portal/datasets/fmr/
fmrover_071707R2.doc (accessed May 12, 2014).
Making the Self-Sufciency Standard as
consistent and accurate as possible, yet
varied by geography and the ages of
children, requires meeting several criteria.
To the extent possible, the data used
in the Self-Sufciency Standard are:
collected or calculated using•
standardized or equivalent
methodology nationwide;
obtained from scholarly or credible•
sources such as the U.S. Census Bureau;
updated regularly; and,•
geographically- and age-•
specic, as appropriate.
Costs that vary substantially by place,
such as housing and child care, are
calculated at the most geographically-
specic level for which data are
available. Other costs, such as health
care, food, and transportation, are
varied geographically to the extent
there is variation and appropriate data
available. In addition, as improved orstandardized data sources become
available, the methodology used by
the Standard is rened accordingly,
resulting in an improved Standard that is
comparable across place as well as time.
The Self-Sufciency Standard is
calculated for 152 different family types
for each borough (county) in New York
City, as well as separate tables for two
areas of Manhattan and Brooklyn (see
http://www.selfsufciencystandard.
org/pubs.html or http://www.wceca.
org to view the full data tables). The
cost of each basic need and the Self-
Sufciency Wages for eight selected

8/10/2019 Overlooked and Undercounted: The Struggle to Make Ends Meet in New York City.
http://slidepdf.com/reader/full/overlooked-and-undercounted-the-struggle-to-make-ends-meet-in-new-york-city 65/108
NEW YORK CITY | 53
is more expensive. The FMRs for New
York City are set at the 40th percentile.
HUD calculates one set of FMRs for an
entire metropolitan area. Therefore,
all counties in New York City share the
same FMR. In order to differentiate
the cost of housing by county within
New York City, the Standard uses
median gross rent ratios by county
calculated from the U.S. Census
Bureau’s 2012 American Community
Survey (ACS) 1-year estimates.
In addition, housing costs in Manhattan
(New York County) and Brooklyn
(Kings County) are further adjustedfor variation between two geographic
areas of Manhattan and Brooklyn.
The 2011 New York City Housing and
Vacancy Survey median gross rents
for sub-boroughs within Manhattan
were used to adjust housing costs
for what is referred to as “North
Manhattan” and “South Manhattan” in
this report. Note that these areas do
not necessarily align with the commonlyunderstood geographic boundaries of
Lower and Upper Manhattan. The two
areas were determined by grouping
together sub-boroughs with similar
housing costs. The traditional border
of 14th Street for Lower Manhattan
left out high housing cost areas such as
Chelsea, Clinton, Turtle Bay, and the
Upper East and Upper West Side.
The geographic area of North Manhattanfor the purposes of this report includes
the following sub-boroughs: Morningside
Heights/Hamilton Heights, Central
Harlem, East Harlem, and Washington
Heights/Inwood. The sub-boroughs
included in the geographic area of South
Manhattan are: Greenwich Village/
Financial District, Lower East Side/
Chinatown, Chelsea/Clinton/Midtown,
Stuyvesant Town/Turtle Bay, Upper
West Side, and Upper East Side.
Northwest Brooklyn includes the following
sub-boroughs: Williamsburg/Greenpoint,
Brooklyn Heights/Fort Greene, and
Park Slope/Carroll Gardens. The sub-
boroughs included in the remainder of
Brooklyn include: Brownsville/Ocean Hill,
Bedford-Stuyvesant, East New York/
Starrett City, Coney Island, North Crown
Heights/Prospect Heights, Flatlands/
Canarsie, East Flatbush, South Crown
Heights, Sheepshead Bay/Gravesend,
Bensonhurst, Bushwick, Bay Ridge, Sunset
Park, Borough Park, and Flatbush.
To determine the number of bedrooms
required for a family, the Standard
assumes that parents and children do not
share the same bedroom and no more
than two adults or two children share
a bedroom. Therefore, the Standard
assumes that single persons and coupleswithout children have one-bedroom units,
families with one or two children require
two bedrooms, families with three or
four children require three bedrooms,
and families with ve or six children
require four bedrooms. Because there
are few efciencies (studio apartments)
in some areas, and their quality is very
uneven, the Self-Sufciency Standard
uses one-bedroom units for single-adult
and childless-couple households.
DATA SOURCES
HOUSING COST. U.S. Department of
Housing and Urban Development,
“Schedule B: FY 2014 Final Fair
Market Rents for Existing Housing,”
Data Sets, Fair Market Rents, http://
www.huduser.org/portal/datasets/
fmr.html (accessed March 31, 2014).
COUNTY-LEVEL HOUSING COSTS.
U.S. Census Bureau, American
Factnder, “B25064 Median GrossRent,” 2012 American Community
Survey 1-Year Estimates, Detailed
Tables, http://factnder2.census.
gov/ (accessed March 31, 2014).
Sub-borough Area Housing Costs. U.S.
Census Bureau, “2011 New York Housing
and Vacancy Survey,” https://www.
census.gov/housing/nychvs/data/2011/
nychvs11.html (accessed March 31, 2014).
CHILD CARE
The Family Support Act, in effect from
1988 until welfare reform in 1996,
required states to provide child care
assistance at market rate for low-income
families in employment, education or
training. States were also required
to conduct cost surveys biannually to
determine the market rate (dened asthe 75th percentile) by facility type,
age, and geographic location, or set a
statewide rate.4 Many states, including
New York State, have continued to
conduct or commission the surveys as well
as reimburse child care at or close to this
level. In New York City, the market rates
and the maximum reimbursement ceilings
are calculated at the 69th percentile. 5
4 U.S. Government Printing Ofce, “Section 9. ChildCare,” 108th Congress 2004 House Ways and Means
Committee Green Book, http://www.gpo.gov/fdsys/pkg/GPO-CPRT-108WPRT108-6/pdf/GPO-CPRT-
108WPRT108-6 -2-9.pdf (accessed June 7, 2014).5 Starting April 1, 2014, New York City child carereimbursement levels changed from being set at the 75th
percentile to the 69th percentile of the market rate. However,the child care rates included in the Standard continue
to be at the 75th percentile. See New York State Ofceof Children and Family Services, Division of Child Care
Services, Local Commissioners Memoranda, Transmittal14-OCFS-LCM-03. “Child Care Market Rates 2014-2015,”

8/10/2019 Overlooked and Undercounted: The Struggle to Make Ends Meet in New York City.
http://slidepdf.com/reader/full/overlooked-and-undercounted-the-struggle-to-make-ends-meet-in-new-york-city 66/108
54 | OVERLOOKED AND UNDERCOUNTED
Child care costs for the Standard were
calculated at the 75th percentile of child
care costs from responses to the 2013-
2015 market rate survey for each type
of care facility and age group. For the
2014 New York City Standard, infantand preschooler costs were calculated
assuming full-time care and costs for
school-age children were calculated using
part-time rates. Costs were calculated
based on a weighted average of family
child care and center child care. Since
one of the basic assumptions of the
Standard is that it provides the costs
of meeting needs without public or
private subsidies, the “private subsidy”of free or low-cost child care provided
by relatives and others is not assumed.
Note that the New York Child Care
Market Rates calculate children under
one and a half years of age as one
age category and children from one
and a half through two years of age
as another category. For the Standard,
these two age categories have been
combined into one ‘infant’ category by
averaging the rates for both age groups.
For infants, family child care accounts
for 43% of the care and center child
care accounts for 57%. For preschoolers,
family child care accounts for 26% of
the care and center child care accounts
for 74%. For school-age children, family
child care accounts for 46% of the
care and center child care accounts for
54%.6 Note that previous Standards
did not assume a weighted average of
family and center child care. Previously,
http://ocfs.ny.gov/main/policies/external/OCFS_2014/LCMs/14-OCFS-LCM-03%20Child%20Care%20Market%20
Rates%20%202014-2015.pdf (acce ssed May 15, 2014).6 U.S. Census Bureau, Survey of Income and ProgramParticipation (SIPP), 2008 Panel, Wave 8. “Who’s
Minding the Kids? Ch ild Care Arrangements: Spring2011,” http://www.census.gov/hhes/childcare/data/sipp/index.html (accessed July 19, 2013).
infants were assumed to be cared for
in family child care while preschool and
school-age children were assumed to
be cared for in child care centers.
To calculate the monthly cost of child care
for infants and preschoolers, the weekly
New York Child Care Market Rates were
multiplied by 4.3 weeks per month.
Costs for school-age children in the
Standard were calculated as part-day
care at school-age child care facilities
for children between the ages of six and
12. The part-day rates for school-age
children in the New York Child Care
Market Rates were reported as daily
rates; the daily rates were multiplied by
ve days per week and 4.3 weeks per
month to calculate the monthly rates.
The New York Child Care Market Rates
are established in ve geographic
groupings of counties. The rates
established for each group apply to
all counties or districts in the group.
The Group Five region includes all
New York City boroughs, whichshare the same market rates. The
New York Child Care Market Rates
calculate the cost of child care at the
75th percentile for each group.
DATA SOURCES
CHILD CARE COSTS. Craig Sunke, New
York State Ofce of Child and Family
Services, email response to Freedom of
Information Law request, May 2, 2014.
FOOD
Although the Supplemental Nutrition
Assistance Program (SNAP, formerly
the Food Stamp Program) uses the
U.S. Department of Agriculture (USDA)
Thrifty Food Plan to calculate benets,
the Standard uses the Low-Cost Food
Plan for food costs. While both of these
USDA diets were designed to meet
minimum nutritional standards, SNAP
(which is based on the Thrifty Food Plan)is intended to be only a temporary diet.7
Although about 25% more expensive
than the Thrifty Food Plan, the Low-Cost
Food Plan is based on more realistic
assumptions about food preparation
time and consumption patterns, while
still being a very conservative estimate
of food costs. For instance, the Low-
Cost Food Plan also does not allow for
any take-out, fast-food, or restaurant
meals, even though, according to the
Consumer Expenditure Survey, the
average American family spends
about 41% of their food budget on
food prepared away from home.8
The USDA Low-Cost Food Plan costs vary
by month and the USDA does not give
an annual average food cost; therefore,
the Standard typically follows the SNAPprotocol of using June data of the current
year to represent the annual average.
However, due to the timing of this report,
The Self-Sufciency Standard for New
York City 2014 uses data for May 2014.
Both the Low-Cost Food Plan and the
Standard’s budget calculations vary food
costs by the number and ages of children
and the number and gender of adults.
The Standard assumes that in a one-adulthousehold the adult is female and a two-
7 U.S. Department of Agriculture, Center for N utritionPolicy and Promotion, “Thrifty Food Plan, 2006,” http://
www.cnpp.usda.gov/Publications/FoodPlans/MiscPubs/TFP2006Report.pdf (accessed November 5, 2013).8 U.S. Department of Labor, Bureau of Labor
Statistics, “Consumer Expenditures in 2012,” EconomicNews Release, http://www.bls.gov/news.release/cesan.nr0.htm (accessed November 5, 2013).

8/10/2019 Overlooked and Undercounted: The Struggle to Make Ends Meet in New York City.
http://slidepdf.com/reader/full/overlooked-and-undercounted-the-struggle-to-make-ends-meet-in-new-york-city 67/108
NEW YORK CITY | 55
adult household is assumed to include
one adult female and one adult male.
Geographic differences in food costs
within New York City are varied using
Map the Meal Gap data provided by
Feeding America. To establish a relative
price index that allows for comparability
between counties, Nielsen assigns every
sale of UPC-coded food items in a county
to one of the 26 food categories in the
USDA Thrifty Food Plan (TFP). The cost
to purchase a market basket of these
26 categories is then calculated for
each county. Ratios of the county market
basket price to the state average are
then calculated to compare the cost of
food between New York City boroughs.
DATA SOURCES
FOOD COSTS. U.S. Department of
Agriculture, Center for Nutrition
Policy and Promotion, “Ofcial USDA
Food Plans: Cost of Food at Home
at Four Levels, U.S. Average, May
2014,” Low-Cost Food Plan, http://
www.cnpp.usda.gov/Publications/
FoodPlans/2014/CostofFoodMay2014.
pdf (accessed July 8, 2014).
COUNTY-LEVEL FOOD RATIO. Gundersen,
C., E. Engelhard, A. Satoh, & E.
Waxman, Feeding America, “Map the
Meal Gap 2014: Food Insecurity and
Child Food Insecurity Estimates at the
County Level,” received from research@
feedingamerica.org (May 13, 2013).
TRANSPORTATION
If there is an “adequate” public
transportation system in a given area,
it is assumed that workers use public
transportation to get to and from work. A
public transportation system is considered
“adequate” if it is used by a substantial
percentage of the working population.
According to a study done by the Institute
of Urban and Regional Development at
the University of California, if about 7%of the public use public transportation,
then approximately 30% of the low- and
moderate-income working population
uses public transit.9 If 7% or more of the
working population commutes to work
by public transportation, the Standard
assumes public transportation costs. In
New York City, more than 7% of the
working population over the age of 16
in all counties uses public transportationaccording to the American Community
Survey: Bronx (60%), Kings (61%), New
York (59%), Queens (52%), Richmond
(30%).10 The cost of public transportation
is obtained from the Metropolitan Transit
Authority and is calculated using the cost
of a 30-day unlimited ride MetroCard.
DATA SOURCES
PUBLIC TRANSPORTATION. MetropolitanTransit Authority, New York City
Transit, “Fares and MetroCard,” http://
www.mta.info/metrocard/mcgtreng.
htm#unlimited (accessed April 3, 2014).
HEALTH CARE
The Self-Sufciency Standard assumes
that an integral part of a self-sufciency
wage is employer-sponsored health
insurance for workers and their families.
Nationally and in New York, 67% of non-
9 Chris Porter and Elizabeth Deakin, Socioeconomic andJourney-to-Work Data: A Compendium for the 35 Largest
U.S. Metropolitan Areas (Berkeley: Institute of Urban andRegional Development, University of California, 1995).10 U.S. Census Bureau (2011), American Community Survey,
2009-2011 3-Year Estimates, “B08301. Means of transportationto work -universe: workers 16 years and over,” http://
www.factnder.census.gov (accessed July 22, 2013).
elderly individuals in households with at
least one full-time worker have employer-
sponsored health insurance coverage.11
Nationwide, employers pay 79% of the
insurance premium for the employee and
73% of the insurance premium for thefamily on average. In New York, the full-
time worker’s employer pays an average
of 79% of the insurance premium for the
employee and 75% for the family.12
Health care premiums are obtained
from the Insurance Component of the
2012 Medical Expenditure Panel Survey
(MEPS), produced by the Agency for
Healthcare Research and Quality, Center
for Financing, Access, and Cost Trends.
The MEPS health care premiums are
the average employment-based health
premium paid by a state’s residents
for a single adult and for a family. In
New York the average premium paid
by the employee is $104.50 for a
single adult and $357.42 for a family.
Health premium costs are adjusted
for ination using the Medical Care
Services Consumer Price Index.
To vary the state premium costs for
New York City, the Standard uses data
from the New York State Department
of Insurance 2014 Healthy New York
Rates by County. The Standard averages
the premium rates for each available
company in New York City (availability
11 The Henry J. Kaiser Foundation State Health Facts Online,
“New York State: Employer-Sponsored Coverage Ratesfor the Nonelderly by Family Work Status, States (2011-2012), U.S. (2012),” http://statehealthfacts.org/proleind.
jsp?ind=150&cat=3&rgn=34 (accessed March 31, 2014).12 U.S. Department of Health and Human Services, Agency forHealthcare Research and Quality, Center for Financing, Access,
and Cost Trends, “Tables II.C.3 and II.D.3: Percent of TotalPremiums Contributed by Employees Enrolled in Single/Family
Coverage at Private-Sector Establishments that Offer HealthInsurance by Firm Size and State: United States, 2012,” Medical
Expenditure Panel Survey-Insurance Component, http://www.meps.ahrq.gov/mepsweb/data_stats/quick_tables_results.jsp?
component=2&subcomponent=2&year=2012&tableSeries=2&tableSubSeries=CDE&searchText=&searchMethod=1&Action=Search (accessed Marc h 31, 2014). (accessed March 31, 2014).

8/10/2019 Overlooked and Undercounted: The Struggle to Make Ends Meet in New York City.
http://slidepdf.com/reader/full/overlooked-and-undercounted-the-struggle-to-make-ends-meet-in-new-york-city 68/108
56 | OVERLOOKED AND UNDERCOUNTED
was the same for every borough in
New York City) and calculates a ratio
to adjust the state-level MEPS data.
Health care costs also include regional
out-of-pocket costs calculated for
adults, infants, preschoolers, school-
age children, and teenagers. Data
for out-of-pocket health care costs (by
age) are also obtained from the MEPS,
adjusted by Census region using the
MEPS Household Component Analytical
Tool, and adjusted for ination using the
Medical Care Consumer Price Index.
Although the Standard assumes
employer-sponsored healthcoverage, not all workers have
access to affordable health insurance
coverage through employers.
However, as a result of the Patient
Protection and Affordable Care Act of
2010, employers will now be required to
provide health insurance or pay a ne (a
mandate that is now set to be in effect
in 2015). Those who do not have access
to affordable health insurance through
their employers must either purchase
their own coverage or do without health
insurance.13 Those who do not have
access to affordable health insurance
through their employers, and who are
not eligible for the expanded Medicaid
program, must purchase their own
coverage individually or through New
York’s Individual Marketplace or pay a
ne. Individuals who cannot afford health
13 Ofce of the Legislative Counsel, 111th Congress 2nd
Session, Compilation of Patient Protection and AffordableCare Act, “Requirement to Maintain Minimum Essential
Coverage,” Part 1 Individual Responsibility, Section1501, pg 143, http://docs.hou se.gov/energycommerce/ppacacon.pdf (accessed August 31, 2010).
insurance may be eligible for a premium
tax credit or cost-sharing reductions.14
DATA SOURCES
OUT-OF-POCKET COSTS. U.S. Department
of Health and Human Services, Agency
for Healthcare Research and Quality,
Center for Financing, Access, and Cost
Trends, Medical Expenditure Panel
Survey-Household Component Analytical
Tool, “Total Amount Paid by Self/
Family, all Types of Service, 2011,”
MEPSnetHC, http://www.meps.ahrq.
gov/mepsweb/data_stats/MEPSnetHC.
jsp (accessed May 15, 2014).
Premiums. U.S. Department of Health
and Human Services, Agency for
Healthcare Research and Quality,
Center for Financing, Access, and
Cost Trends, “Tables II.C.2 and II.D.2:
Average Total Employee Contribution
(in Dollars) per Enrolled Employee for
Single/Family Coverage at Private-
Sector Establishments that Offer Health
Insurance by Firm Size and State, United
States, 2012,” Medical ExpenditurePanel Survey-Insurance Component,
http://www.meps.ahrq.gov/mepsweb/
data_stats/quick_tables_results.jsp?co
mponent=2&subcomponent=2&year=2
012&tableSeries=2&tableSubSeries=C
DE&searchText=&searchMethod=1&Ac
tion=Search (accessed May 15, 2014).
COUNTY-LEVEL INSURANCE PREMIUM COSTS.
New York State Department of Financial
Services, Healthy NY, “Insurers and
Rates”, http://www.dfs.ny.gov/healthyny/
hny_rates.htm (accessed May 15, 2014).
14 Center on Budget and Policy Priorities, Health Reform:
Beyond the Basics, “Premium Tax Credits: Answers toFrequently Asked Questions,” http://www.cbpp.org/les/QA-on-Premium-Credits.pdf (accessed June 9, 2014).
Ination. U.S. Department of Labor,
Bureau of Labor Statistics, “Consumer
Price Index – All Urban Consumers, U.S.
City Average,” Medical Care Services
(for premiums) and Medical Services
(for out-of-pocket costs), http://www.bls.gov/cpi/ (accessed July 8, 2014).
MISCELLANEOUS
This expense category consists of other
essential items including clothing, shoes,
paper products, diapers, nonprescription
medicines, cleaning products,
household items, personal hygiene
items, and landline telephone service.This does not include entertainment,
recreation, savings, charitable
contributions or debt repayment.
Miscellaneous expenses are calculated
by taking 10% of all other costs except
for taxes and tax credits. This percentage
is a conservative estimate in comparison
to estimates in other basic needs
budgets, which commonly use 15%.15
TAXES
Taxes include federal and state income
tax, payroll taxes, and state and local
sales and use tax where applicable.
Federal payroll taxes for Social Security
and Medicare are calculated at 7.65%
of each dollar earned. Although the
federal income tax rate is higher than
the payroll tax rate, federal exemptionsand deductions are substantial. As
a result, while payroll tax is paid on
every dollar earned, most families will
not owe federal income tax on the
15 Constance F. Citro and Robert T. Michael, eds., Measuring
Poverty: A New Approach (Washington, DC: NationalAcademy Press, 1995), http://www.census.gov/hhes/povmeas/
methodology/nas/report.html (accessed June 7, 2014).

8/10/2019 Overlooked and Undercounted: The Struggle to Make Ends Meet in New York City.
http://slidepdf.com/reader/full/overlooked-and-undercounted-the-struggle-to-make-ends-meet-in-new-york-city 69/108
NEW YORK CITY | 57
rst $10,000 to $15,000 or more, thus
lowering the effective federal tax rate
to about 7% for some family types.
In New York City income tax rates vary
from 2.907% to 3.876% depending
on income and ling status. New York
State income tax rates range from 4%
to 8.82% depending on income level
and ling status. Calculations for sales
tax for New York City include both state
and local sales tax. The total sales tax
for New York City is 8.875% (including
a 4% New York State sales tax, a 4.5%
New York City sales tax and a .375%
metro sales tax). Indirect taxes (e.g.,
property taxes paid by the landlord on
housing) are assumed to be included
in the price of housing passed on by
the landlord to the tenant. Taxes on
gasoline and automobiles are included
as a cost of owning and running a car.
DATA SOURCES
FEDERAL INCOME TAX. Internal Revenue
Service, “1040 Instructions,” http://
www.irs.gov/pub/irs-pdf/i1040gi.
pdf (accessed May 15, 2014);
Internal Revenue Service, “Revenue
Procedure 2013-35,” http://www.
irs.gov/pub/irs-drop/rp-13-35.
pdf (accessed May 15, 2014).
STATE INCOME TAX. New York State
Department of Taxation and Finance,
“Instructions for Form IT-201, Full Year
Resident Income Tax Form Return,”http://www.tax.ny.gov/pdf/2013/inc/
it201i_2013.pdf (accessed April 3, 2014).
STATE AND LOCAL SALES AND USE TAX. New
York State Department of Taxation and
Finance, Publication 78, “New York State
Sales and Use Tax Rates by Jurisdiction,”
Effective February 1, 2014, http://
www.tax.ny.gov/pdf/publications/sales/
pub718.pdf (accessed March 31, 2014).
TAX CREDITS
The Standard includes federal tax credits
(the Earned Income Tax Credit, the Child
Care Tax Credit, and the Child Tax
Credit) and applicable state tax credits.
Federal and state tax credits are shown
as received monthly in the Standard.
The Earned Income Tax Credit (EITC), or
as it is also called, the Earned Income
Credit, is a federal tax refund intended
to offset the loss of income from payrolltaxes owed by low-income working
families. The EITC is a refundable
tax credit, meaning working adults
may receive the tax credit whether
or not they owe any federal taxes.
New York State has a state EITC that
is set at 30% of the federal EITC and
New York City has a city EITC that
is set at 5% of the federal EITC.
The Child Care Tax Credit (CCTC), also
known as the Child and Dependent
Care Tax Credit, is a federal tax credit
that allows working parents to deduct a
percentage of their child care costs from
the federal income taxes they owe. Like
the EITC, the CCTC is deducted from the
total amount of money a family needs
to be self-sufcient. Unlike the EITC, the
federal CCTC is not a refundable federal
tax credit; that is, a family may onlyreceive the CCTC as a credit against
federal income taxes owed. Therefore,
families who owe very little or nothing in
federal income taxes will receive little or
no CCTC. A percentage (which decreases
as income increases) of up to $3,000
in child care costs is deductible for one
qualifying child and up to $6,000 for
two or more qualifying children. New
York State has a state CCTC that is
20% to 110% of the federal CCTC,
depending on income. New York City
has a city CCTC that is up to 75% ofthe state CCTC, depending on income.
The Child Tax Credit (CTC) is a partially
refundable federal tax credit. The CTC
provides parents with a deduction of
$1,000 for each child under 17 years old
or 15% of earned income over $3,000,
whichever is less. New York State has a
state CTC, known as the Empire State
Child Credit, that is the greater of 33%
of the federal CTC or $100 multiplied
by the number of qualifying children.
The New York State and City Household
Credits are non-refundable tax credits
that can be used as credits against
income taxes owed. The New York
State Household Credit is up to a $75
credit for single taxpayers and a $20
to $90 credit plus $5 to $15 more per
exemption claimed on federal tax returnsfor taxpayers who are married or the
head of a household with a qualifying
dependent. The New York City Household
Credit is up to a $15 credit for single
taxpayers and a $10 to $30 credit plus
$10 to $30 more per exemption claimed
on federal tax returns for taxpayers
who are married or the head of a
household with a qualifying dependent.
The New York City School Tax Credit isa refundable tax credit for New York
City residents if the amount is more than
the New York City income tax owed. The
credit is up to $290 for taxpayers who
are married ling jointly or a qualifying

8/10/2019 Overlooked and Undercounted: The Struggle to Make Ends Meet in New York City.
http://slidepdf.com/reader/full/overlooked-and-undercounted-the-struggle-to-make-ends-meet-in-new-york-city 70/108
58 | OVERLOOKED AND UNDERCOUNTED
widower with a dependent child and
is up to $145 for all other taxpayers.
DATA SOURCES
FEDERAL CHILD CARE TAX CREDIT. Internal
Revenue Service, “Publication 503.
Child and Dependent Care Expenses,”
http://www.irs.gov/pub/irs-pdf/p503.
pdf (accessed May 15, 2014).
STATE CHILD CARE TAX CREDIT. New
York State Department of Taxation
and Finance, “Instructions for Form
IT-216 Claim for Child and Dependent
Care Credit,” http://www.tax.
ny.gov/pdf/2013/inc/it216i_2013.pdf (accessed May 15, 2014).
FEDERAL CHILD TAX CREDIT. Internal
Revenue Service, “Publication 972.
Child Tax Credit,” http://www.irs.
gov/uac/Publication-972,-Child-Tax-
Credit-1 (accessed May 15, 2014).
STATE CHILD TAX CREDIT. New York State
Department of Taxation and Finance,
“Claim for Empire State Child Credit,”
Form IT-213, http://www.tax.ny.gov/
pdf/2013/llin/inc/it213_2013_ll_
in.pdf (accessed May 15, 2014).
FEDERAL EARNED INCOME TAX CREDIT.
Internal Revenue Service, “Publication
596. Earned Income Credit,” http://
www.irs.gov/uac/Publication-596,-
Earned-Income-Credit-(EIC) (accessed
October 17, 2013). Internal Revenue
Service, “Revised Procedures 2013-15,
Section 2. 2013 Adjusted Items,” http://
www.irs.gov/pub/irs-drop/rp-13-15.
pdf (accessed May 15, 2014).
STATE EARNED INCOME CREDIT. New York
State Department of Taxation and
Finance, Instructions for Form IT-215,
“Claim for Earned Income Credit” http://
www.tax.ny.gov/pdf/2013/llin/inc/
it215_2013_ll_in.pdf and ht tp://www.
tax.ny.gov/pdf/2013/inc/it215i_2013.
pdf (accessed April 3, 2014).
OTHER STATE CREDITS. New York State
Department of Taxation and Finance,
“Instructions for Form IT-201, Full Year
Resident Income Tax Form Return,”
http://www.tax.ny.gov/pdf/2013/inc/
it201i_2013.pdf (accessed April 3, 2014).
EMERGENCY SAVINGS FUND
The Self-Sufciency Standards are
basic needs, no-frills budgets created
for all family types in each county in a
given state. As such, the Standard does
not allow for anything extra beyond
daily needs, such as retirement savings,
education expenses, or emergencies.
Of course, without question families
need more resources if they are to
maintain economic security and be
able to weather any unexpected
income loss. Therefore, new to this
Self-Sufciency Standard update is the
calculation of savings for emergencies.
Once basic needs are met at the
Self-Sufciency Standard level, an
emergency savings fund is essential
for maintaining economic security.
The emergency savings amount is
calculated to make up for the earnings
of one adult becoming unemployed
over the average job loss period, less
the amount expected to be receivedin unemployment benets. In two-adult
households, it is assumed that the second
adult continues to be employed, so that
the savings only need to cover half of the
family’s basic living expenses over the
job loss period. Since the median length
of job tenure among New York workers
is ve years, it is assumed that workers
save for job loss over a course of ve
years and have enough savings to cover
expenses for 4.33 months, the average
unemployment duration in New York.
To determine the amount of resources
needed, this estimate uses the average
period of unemployment and assumes
that the minimal cost of basic needs
will stay the same, i.e., the family’s
Self-Sufciency Standard. Since the
monthly emergency savings contribution
requires additional earnings, the estimate
includes the calculation of taxes and
tax credits of current earnings (at the
Self-Sufciency Standard). Savings are
assumed to have accumulated based on
average savings account interest rates.
The emergency savings calculation is
based on all current expenses in the
Self-Sufciency Standard.16 The adult
may not be commuting to work ve
days a week; however the overall
transportation expenses may not change
signicantly. A weekly shopping tripis still a necessity, as is driving young
children to child care. Actively seeking
employment requires being available for
job interviews, attending job fairs, and
engaging in networking opportunities, in
addition to the time spent looking for and
applying for positions. Therefore, saving
enough to cover the cost of continuing
child care if unemployed is important for
supporting active job seeking as well as
the benet of keeping children in their
normal routine during a time of crisis.
16 This amount excludes taxes and tax credits (which
are in the Standard), as the family would be livingon savings, on which taxes/tax credits have alreadybeen paid when earned, as described above.

8/10/2019 Overlooked and Undercounted: The Struggle to Make Ends Meet in New York City.
http://slidepdf.com/reader/full/overlooked-and-undercounted-the-struggle-to-make-ends-meet-in-new-york-city 71/108
NEW YORK CITY | 59
In addition to the income needed to
cover the costs of housing, food, child
care and transportation, families need
health insurance. The Self-Sufciency
Standard assumes that adults work full
time and in jobs that provide employer-sponsored health insurance. In households
with two adults, it is assumed that if one
adult loses employment the spouse’s
health insurance will provide coverage
for the entire family at no additional
cost. In a one-adult household, it is
assumed coverage will be provided
through the state-operated Affordable
Insurance Exchanges under the Patient
Protection and Affordable Care Act, atapproximately the same cost as when
employed.17 In some cases, children, or
17 Patient Protection and Affordable Care Act (ACA).
Affordable Insurance Exchanges opened in 2014, and healthinsurance tax credits are available to offset monthly premium
costs for those enrolled in the Exchanges with income up to400% FPL. Centers for Medicare & Medicaid Services, Fact
Sheets, “Affordable Insurance Exchanges: Seamless Access
the whole family, may be covered under
state Medicaid or New York’s Child
Health Plus, depending upon income,
resources, and eligibility requirements in
effect at the time, which would decrease
health care costs below these estimates.18
DATA SOURCES
JOB TENURE. U.S. Census Bureau, Current
Population Survey, “New York: Median
Years of Tenure with Current Employer,
all workers” http://dataferrett.census.
gov/(accessed May 15, 2014).
to Affordable Coverage,” http://www.cms.gov/Newsroom/MediaReleaseDatabase/Fact-Sheets/2011-Fact-Sheets-
Items/2011-08-125.html (acces sed July 23, 2014).18 Children are eligible for coverage under New York’s ChildHealth Plus program if family income is less than 400% of the
FPL. Department of Health, C hild Health Plus, “Eligibility andCost,” https://www.health.ny.gov/health_care/child_health_ plus/eligibility_and_cost.htm (accessed May 16, 2014).
UNEMPLOYMENT DURATION. U.S.
Department of Labor, Employment and
Training Administration, “Unemployment
Insurance Data Summary,” http://
www.workforcesecurity.doleta.
gov/unemploy/content/data.asp (accessed May 15, 2014).
UNEMPLOYMENT INSURANCE. New
York State Department of Labor,
“Unemployment Insurance: A
Claimant Handbook,” http://labor.
ny.gov/formsdocs/ui/TC318.3e.
pdf (accessed May 15, 2014).
SAVINGS RATE. Federal Deposit
Insurance Corporation. “WeeklyNational Rates” http://www.fdic.gov/
regulations/resources/rates/previous.
html (accessed May 15, 2014).
8/10/2019 Overlooked and Undercounted: The Struggle to Make Ends Meet in New York City.
http://slidepdf.com/reader/full/overlooked-and-undercounted-the-struggle-to-make-ends-meet-in-new-york-city 72/108
60 | OVERLOOKED AND UNDERCOUNTED
OTHER APPROACHES TO MEASURING POVERTY
The ofcial federal poverty measure,
often known as the Federal Poverty
Level (FPL), was developed over ve
decades ago and today has become
increasingly problematic and outdated
as a measure of income adequacy.1
Indeed, the Census Bureau itself states,
“the ofcial poverty measure should
be interpreted as a statistical yardstick
rather than as a complete description
of what people and families need to
live.”2 Despite the many limitations of the
federal poverty measure, it is still used
to calculate eligibility for a number of
poverty and work support programs.
The most signicant shortcoming of
the federal poverty measure is that
1 There are two federal measurements of poverty. A detailedmatrix of poverty thresholds is calculated each year by the U.S.
Census Bureau, which varies by the number of adults and thenumber of children in the household, and by age for one- and
two-adult households. The threshold is used to calculate thenumber of people in poverty for the previous year. The other
form of the poverty measure is called the “federal povertyguidelines” or the “Federal Poverty Level” (FPG/FPL). The FPL
is calculated by the U.S. Department of Health and HumanServices each February and is primarily used by federal and
state programs to determine eligibility and/or calculate benets,such as for SNAP (formerly the Food Stamps Program). The FPL
only varies by family size, regardless of composition; the 2014FPL for a family of three is $19,790. The Standard referencesthe FPL in this report. For more information about the federal
poverty measurements, see http://aspe.hhs.gov/poverty/faq.cfm and http://aspe.hhs.gov/poverty/14poverty.cfm.2 Carmen DeNavas-Walt, Bernadette Proctor, and
Jessica C. Smith, “I ncome, Poverty, and Health InsuranceCoverage in the U.S.: 2012,” U.S. Census Bureau, Current
Population Reports, Series P60-245, Washington, D.C.(U.S. Government Printing Ofce), http://www.census.gov/
prod/2013pubs/p60-245.pdf (accessed June 24, 2014).
for most families, in most places, the
poverty level is simply too low .
However, simply raising the poverty level,or using a multiple of the FPL, cannot
solve the structural problems inherent in
the ofcial poverty measure. In addition
to the fundamental problem of being
too low, there are basic methodological
problems with the federal poverty
measure (see text, The Benchmark
Measure, for a listing of these issues).
For these and other reasons, many
researchers and analysts have proposedrevising the federal poverty measure.
Suggested changes would reect
twenty-rst century needs, incorporate
geographically based differences in
costs, and respond to changes over time.
THE SUPPLEMENTAL POVERTY
MEASURE (SPM)
Besides the Self-Sufciency Standard, the
other major proposed alternative to the
federal poverty measure is a measure
based on recommendations from the
National Academy of Sciences (NAS),
contained in their 1995 report, Measuring
Poverty.3 Subsequent to that report,
the Census Bureau produced poverty
estimates based on various combinations
of the NAS recommendations, designating
them as Experimental Poverty measures.4
The new Supplemental Poverty Measure
3 Constance Citro and Robert Michael, Eds., Measuring
Poverty: A New Approach, Washington, D.C.: NationalAcademy Press, http://www.nap.edu/openbook.
php?record_id=4759 (accessed June 25, 2014).4 Thesia I. Garner and Kathleen S. Short, “Creating aConsistent Poverty Measure Over Time Using NAS Procedures:
1996-2005,” U.S. Department of Labor, BLS WorkingPapers, Working Paper 417, April 2008, ht tp://www.bls.gov/osmr/pdf/ec080030.pdf (accessed June 25, 2014).
(SPM) was developed by the Obama
Administration in 2010 based on the
NAS methodology, with some revisions,
and reecting the earlier work by the
Census Bureau analysts and others.5
The rst data were rst released
November 2011, and are now released
annually in the fall, along with the
traditional federal poverty measure.
Designed primarily to track poverty
trends over time, the Supplemental
Poverty Measure provides an alternative
statistic to better understand the natureand prevalence of poverty in the United
States. The primary differences from the
FPL are three: rst, the thresholds are
based on expenditures (on certain core
items) at the 33rd percentile, so it rises
not just with ination, but as expenditures
increase (see Table 1). That is, it tracks
living standards, making the SPM a
relative measure. Second, the SPM uses
a broader measure of resources, beyond
cash income, including the value of
some benets (those that offset the core
elements of the SPM, i.e., food, housing
and utilities). Third, the SPM takes account
of “necessary” expenditures (such as
health care and child care) by deducting
estimates of actual expenditures on
these items from income. The SPM is not
intended to be a replacement for the
FPL, but it will provide policymakers
with additional data on the extent
5 U.S. Department of Comm erce, U.S. Census Bureau, Poverty
– Experimental Measure s, Supplemental Poverty MeasureMethodology, “Observations from the Interagency Technical
Working Group on Developing a Supplemental PovertyMeasure,” March 2010, https://www.census.gov/hhes/www/
poverty/SPM_TWGObservations.pdf (accessed June 25, 2014).U.S. Department of Commerce, U.S. Census Bureau, “Webinar:
Supplemental Poverty Measure Research,” http://www.census.gov/newsroom/releases/archives/news_conferences/2011-11-04_spm_webinar.html (accessed November 10, 2011).
THE MOST SIGNIFICANT
SHORTCOMING OF THE FEDERAL
POVERTY MEASURE IS THAT
FOR MOST FAMILIES, IN MOST
PLACES, THE POVERTY LEVEL IS
SIMPLY TOO LOW.
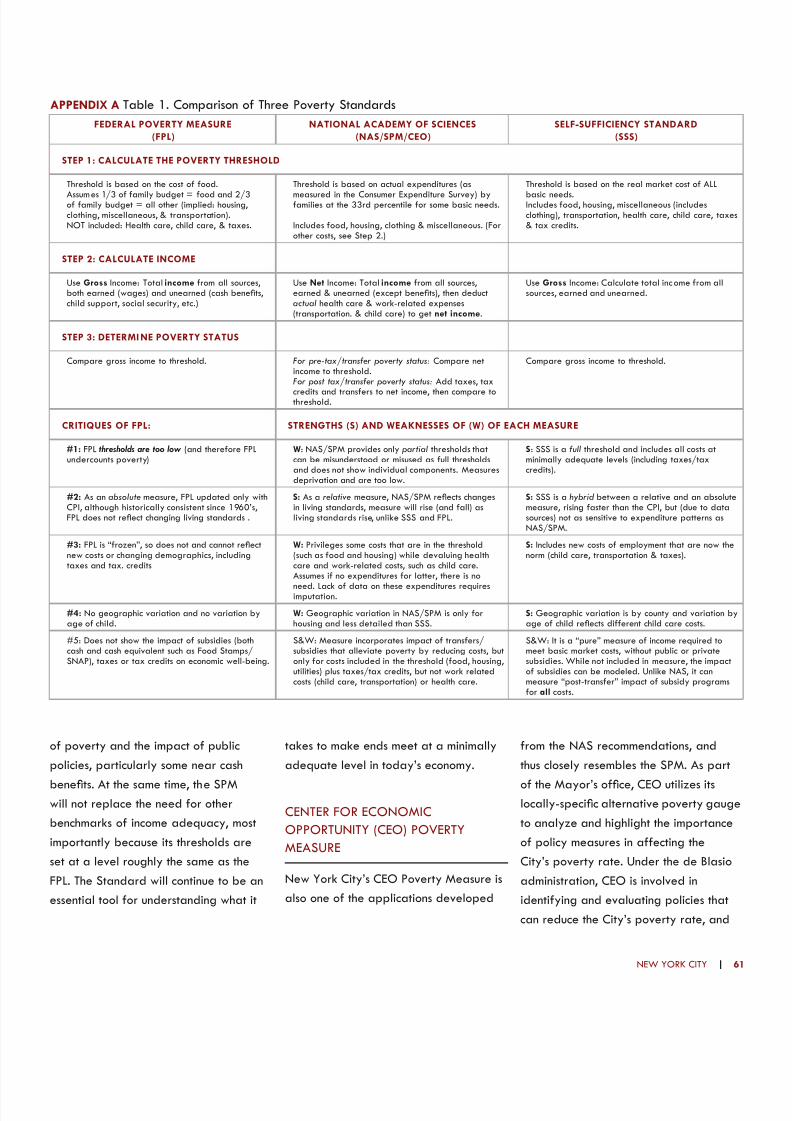
8/10/2019 Overlooked and Undercounted: The Struggle to Make Ends Meet in New York City.
http://slidepdf.com/reader/full/overlooked-and-undercounted-the-struggle-to-make-ends-meet-in-new-york-city 73/108
NEW YORK CITY | 6
of poverty and the impact of public
policies, particularly some near cash
benets. At the same time, the SPMwill not replace the need for other
benchmarks of income adequacy, most
importantly because its thresholds are
set at a level roughly the same as the
FPL. The Standard will continue to be an
essential tool for understanding what it
takes to make ends meet at a minimally
adequate level in today’s economy.
CENTER FOR ECONOMIC
OPPORTUNITY (CEO) POVERTY
MEASURE
New York City’s CEO Poverty Measure is
also one of the applications developed
from the NAS recommendations, and
thus closely resembles the SPM. As part
of the Mayor’s ofce, CEO utilizes itslocally-specic alternative poverty gauge
to analyze and highlight the importance
of policy measures in affecting the
City’s poverty rate. Under the de Blasio
administration, CEO is involved in
identifying and evaluating policies that
can reduce the City’s poverty rate, and
APPENDIX A Table 1. Comparison of Three Poverty Standards
FEDERAL POVERTY MEASURE
(FPL)
NATIONAL ACADEMY OF SCIENCES
(NAS/SPM/CEO)
SELF-SUFFICIENCY STANDARD
(SSS)
STEP 1: CALCULATE THE POVERTY THRESHOLD
Threshold is based on the cost of food.
Assumes 1/3 of family budget = food and 2/3of family budget = all other (implied: housing,clothing, miscellaneous, & transportation).NOT included: Health care, child care, & taxes.
Threshold is based on actual expenditures (as
measured in the Consumer Expenditure Survey) byfamilies at the 33rd percentile for some basic needs.
Includes food, housing, clothing & miscellaneous. (Forother costs, see Step 2.)
Threshold is based on the real market cost of ALL
basic needs.Includes food, housing, miscellaneous (includesclothing), transportation, health care, child care, taxes& tax credits.
STEP 2: CALCULATE INCOME
Use Gross Income: Total income from all sources,both earned (wages) and unearned (cash benets,child support, social security, etc.)
Use Net Income: Total income from all sources,earned & unearned (except benets), then deductactual health care & work-related expenses(transportation. & child care) to get net income.
Use Gross Income: Calculate total income from allsources, earned and unearned.
STEP 3: DETERMI NE POVERTY STATUS
Compare gross income to threshold. For pre-tax/transfer poverty status: Compare netincome to threshold.For post tax/transfer poverty status: Add taxes, tax
credits and transfers to net income, then compare tothreshold.
Compare gross income to threshold.
CRITIQUES OF FPL: STRENGTHS (S) AND WEAKNESSES OF (W) OF EACH MEASURE
#1: FPL thresholds are too low (and therefore FPLundercounts poverty)
W: NAS/SPM provides only partial thresholds thatcan be misunderstood or misused as full thresholdsand does not show individual components. Measuresdeprivation and are too low.
S: SSS is a full threshold and includes all costs atminimally adequate levels (including taxes/taxcredits).
#2: As an absolute measure, FPL updated only withCPI, although historically consistent since 1960’s,FPL does not reect changing living standards .
S: As a relative measure, NAS/SPM reects changesin living standards, measure will rise (and fall) asliving standards rise, unlike SSS and FPL.
S: SSS is a hybrid between a relative and an absolutemeasure, rising faster than the CPI, but (due to datasources) not as sensitive to expenditure patterns asNAS/SPM.
#3: FPL is “frozen”, so does not and cannot reectnew costs or changing demographics, includingtaxes and tax. credits
W: Privileges some costs that are in the threshold(such as food and housing) while devaluing healthcare and work-related costs, such as child care.Assumes if no expenditures for latter, there is no
need. Lack of data on these expenditures requiresimputation.
S: Includes new costs of employment that are now thenorm (child care, transportation & taxes).
#4: No geographic variation and no variation byage of child.
W: Geographic variation in NAS/SPM is only forhousing and less detailed than SSS.
S: Geographic variation is by county and variation byage of child reects different child care costs.
#5: Does not show the impact of subsidies (bothcash and cash equivalent such as Food Stamps/SNAP), taxes or tax credits on economic well-being.
S&W: Measure incorporates impact of transfers/subsidies that alleviate poverty by reducing costs, butonly for costs included in the threshold (food, housing,utilities) plus taxes/tax credits, but not work relatedcosts (child care, transportation) or health care.
S&W: It is a “pure” measure of income required tomeet basic market costs, without public or privatesubsidies. While not included in measure, the impactof subsidies can be modeled. Unlike NAS, it canmeasure “post-transfer” impact of subsidy programsfor all costs.
8/10/2019 Overlooked and Undercounted: The Struggle to Make Ends Meet in New York City.
http://slidepdf.com/reader/full/overlooked-and-undercounted-the-struggle-to-make-ends-meet-in-new-york-city 74/108
62 | OVERLOOKED AND UNDERCOUNTED
it utilizes its alternative poverty measure
as a benchmark in those efforts.6
According to the NYC CEO Poverty
Measure, a family of one adult and two
children needs to earn at least $25,763
per year in 2012 to cover the costs of
housing, food, and clothing.7 Measuring
poverty with the CEO (or SPM) is a little
more complicated than with the FPL or
SSS; in the case of the FPL or the SSS,
a household’s gross income (including
cash benets but not noncash benets)
is compared to the FPL or SSS threshold.
In contrast, determining poverty status
with the CEO or the SPM is a several
step process. To determine whether a
family would be considered poor using
the CEO or SPM Poverty Measure, rst
the value of benets that offset the cost
of core expenses (housing, utilities, and
food), such as Food Stamps (SNAP) or
housing assistance, is added to income.
Second, health care and work-related
6 New York City Ofce of the Mayor, “The CEO Poverty
Measure, 2005-2012: An Annual Report from The Ofceof the Mayor,” April 2014, p. 47, http://www.nyc.gov/html/ceo/downloads/pdf/ceo_poverty_measure_2005_2012.
pdf (accessed September 15, 2014).7 New York City Ofce of the Mayor, “The CEO PovertyMeasure, 2005-2012: An Annual Report from The Ofceof the Mayor,” April 2014, http://www.nyc.gov/html/
ceo/downloads/pdf/ceo_poverty_measure_2005_2012.pdf (accessed September 15, 2014).
expenses are deducted from the family’s
total income. The resulting “net ” income
(that is, after adding the value of some
benets, and subtracting outlays for
health care and work-related expenses)
is compared to the threshold. Forexample, if a family earns $27,000 per
year, and receives $2,000 in housing
assistance (reduced rent), and spends
$5,000 annually on health care and
work-related costs such as child care,
their net income available for shelter,
food, and clothing is $24,000 per year
($27,000 + $2000 - $5000). Because
this is less than the CEO threshold, the
family would be considered poor usingthe CEO or SPM Poverty Measure.
The proportion of households below the
Self-Sufciency Standard is signicantly
higher than the CEO measure of poverty
in New York City. As described above,
both the CEO and SPM differ from the
traditional federal poverty measure (FPL)
mainly in how resources are counted, and
the treatment of health care and work-
related expenses. Both use thresholdsthat are only slightly higher than the
traditional federal poverty measure,
but expand the resources measure
substantially. By taking into account the
value of noncash benets received, such
as food stamps or housing subsidies, and
by deducting actual expenditures on such
costs as health care and child care from
income, the result is a similar count of thepoor, but a shifting of the composition
of the poor. (The number of families with
children who are counted as poor under
this measure decreases, while the count
of elderly poor increases.) At the same
time, because benets such as SNAP
(food stamps) and housing assistance do
not reach a signicant number in need,
and because expenditures on health
care and work-related costs such as childcare fall short for those with low income
of what is needed to meet these needs
adequately, these adjustments do not
fully account for the extent of inadequate
income. In the end, however, despite the
improvements that have been added,
both the CEO measure and the SPM
are similar to the FPL, in that they too
undercount and overlook a substantial
number of families whose incomes are
insufcient to meet their basic needs.

8/10/2019 Overlooked and Undercounted: The Struggle to Make Ends Meet in New York City.
http://slidepdf.com/reader/full/overlooked-and-undercounted-the-struggle-to-make-ends-meet-in-new-york-city 75/108
APPENDIX B:DETAILED DATA TABLES
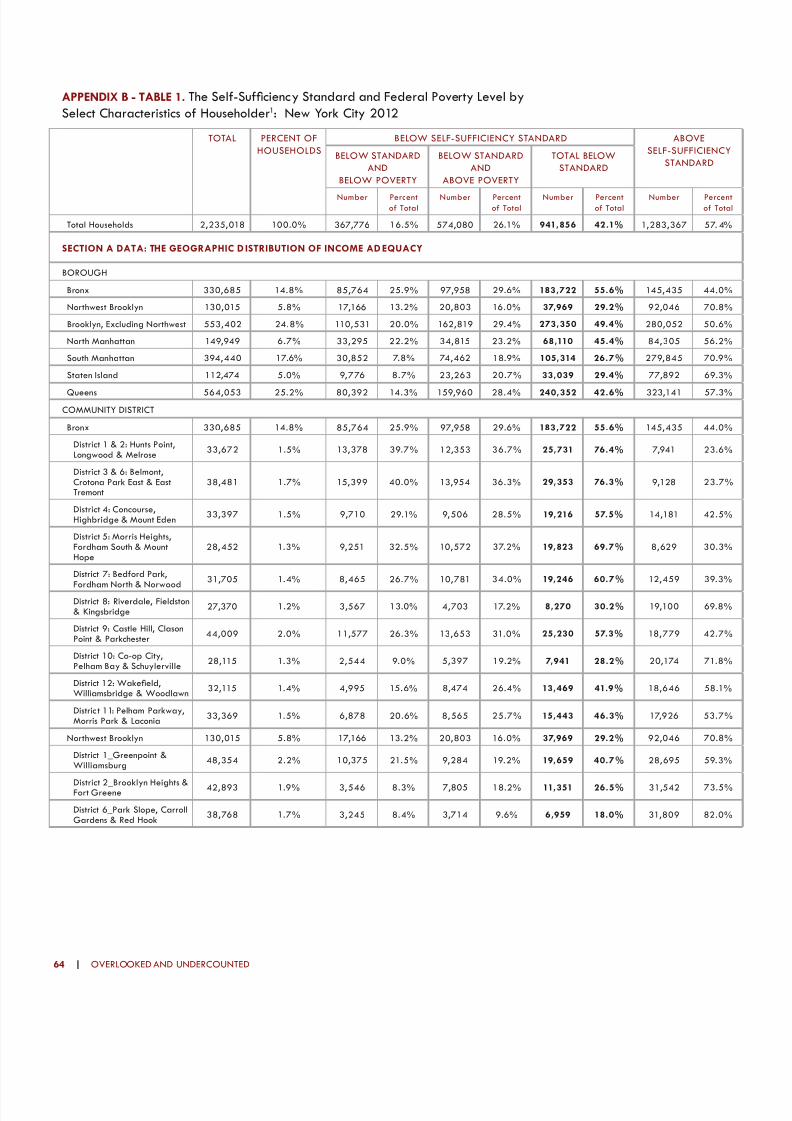
8/10/2019 Overlooked and Undercounted: The Struggle to Make Ends Meet in New York City.
http://slidepdf.com/reader/full/overlooked-and-undercounted-the-struggle-to-make-ends-meet-in-new-york-city 76/108
64 | OVERLOOKED AND UNDERCOUNTED
APPENDIX B - TABLE 1. The Self-Sufciency Standard and Federal Poverty Level by Select Characteristics of Householder1: New York City 2012
TOTAL PERCENT OF
HOUSEHOLDS
BELOW SELF-SUFFICIENCY STANDARD ABOVE
SELF-SUFFICIENCY
STANDARDBELOW STANDARD
AND
BELOW POVERTY
BELOW STANDARD
AND
ABOVE POVERTY
TOTAL BELOW
STANDARD
Number Percentof Total
Number Percentof Total
Number Percentof Total
Number Percentof Total
Total Households 2,235,018 100.0% 367,776 16.5% 574,080 26.1% 941,856 42.1% 1,283,367 57. 4%
SECTION A DATA: THE GEOGRAPHIC D ISTRIBUTION OF INCOME ADEQUACY
BOROUGH
Bronx 330,685 14.8% 85,764 25.9% 97,958 29.6% 183,722 55.6% 145,435 44.0%
Northwest Brooklyn 130,015 5.8% 17,166 13.2% 20,803 16.0% 37,969 29.2% 92,046 70.8%
Brooklyn, Excluding Northwest 553,402 24.8% 110,531 20.0% 162,819 29.4% 273,350 49.4% 280,052 50.6%
North Manhattan 149,949 6.7% 33,295 22.2% 34,815 23.2% 68,110 45.4% 84,305 56.2%
South Manhattan 394,440 17.6% 30,852 7.8% 74,462 18.9% 105,314 26.7% 279,845 70.9%
Staten Island 112,474 5.0% 9,776 8.7% 23,263 20.7% 33,039 29.4% 77,892 69.3%
Queens 564,053 25.2% 80,392 14.3% 159,960 28.4% 240,352 42.6% 323,141 57.3%
COMMUNITY DISTRICT
Bronx 330,685 14.8% 85,764 25.9% 97,958 29.6% 183,722 55.6% 145,435 44.0%
District 1 & 2: Hunts Point,Longwood & Melrose
33,672 1.5% 13,378 39.7% 12,353 36.7% 25,731 76.4% 7,941 23.6%
District 3 & 6: Belmont,Crotona Park East & EastTremont
38,481 1.7% 15,399 40.0% 13,954 36.3% 29,353 76.3% 9,128 23.7%
District 4: Concourse,Highbridge & Mount Eden
33,397 1.5% 9,710 29.1% 9,506 28.5% 19,216 57.5% 14,181 42.5%
District 5: Morris Heights,Fordham South & MountHope
28,452 1.3% 9,251 32.5% 10,572 37.2% 19,823 69.7% 8,629 30.3%
District 7: Bedford Park,
Fordham North & Norwood
31,705 1.4% 8,465 26.7% 10,781 34.0% 19,246 60.7% 12,459 39.3%
District 8: Riverdale, Fieldston& Kingsbridge
27,370 1.2% 3,567 13.0% 4,703 17.2% 8,270 30.2% 19,100 69.8%
District 9: Castle Hill, ClasonPoint & Parkchester
44,009 2.0% 11,577 26.3% 13,653 31.0% 25,230 57.3% 18,779 42.7%
District 10: Co-op City,Pelham Bay & Schuylerville
28,115 1.3% 2,544 9.0% 5,397 19.2% 7,941 28.2% 20,174 71.8%
District 12: Wakeeld,Williamsbridge & Woodlawn
32,115 1.4% 4,995 15.6% 8,474 26.4% 13,469 41.9% 18,646 58.1%
Distric t 11: Pelham Parkway,Morris Park & Laconia
33,369 1.5% 6,878 20.6% 8,565 25.7% 15,443 46.3% 17,926 53.7%
Northwest Brooklyn 130,015 5.8% 17,166 13.2% 20,803 16.0% 37,969 29.2% 92,046 70.8%
District 1_Greenpoint &Williamsburg
48,354 2.2% 10,375 21.5% 9,284 19.2% 19,659 40.7% 28,695 59.3%
District 2_Brooklyn Heights &Fort Greene 42,893 1.9% 3,546 8.3% 7,805 18.2% 11,351 26.5% 31,542 73.5%
District 6_Park Slope, CarrollGardens & Red Hook
38,768 1.7% 3,245 8.4% 3,714 9.6% 6,959 18.0% 31,809 82.0%
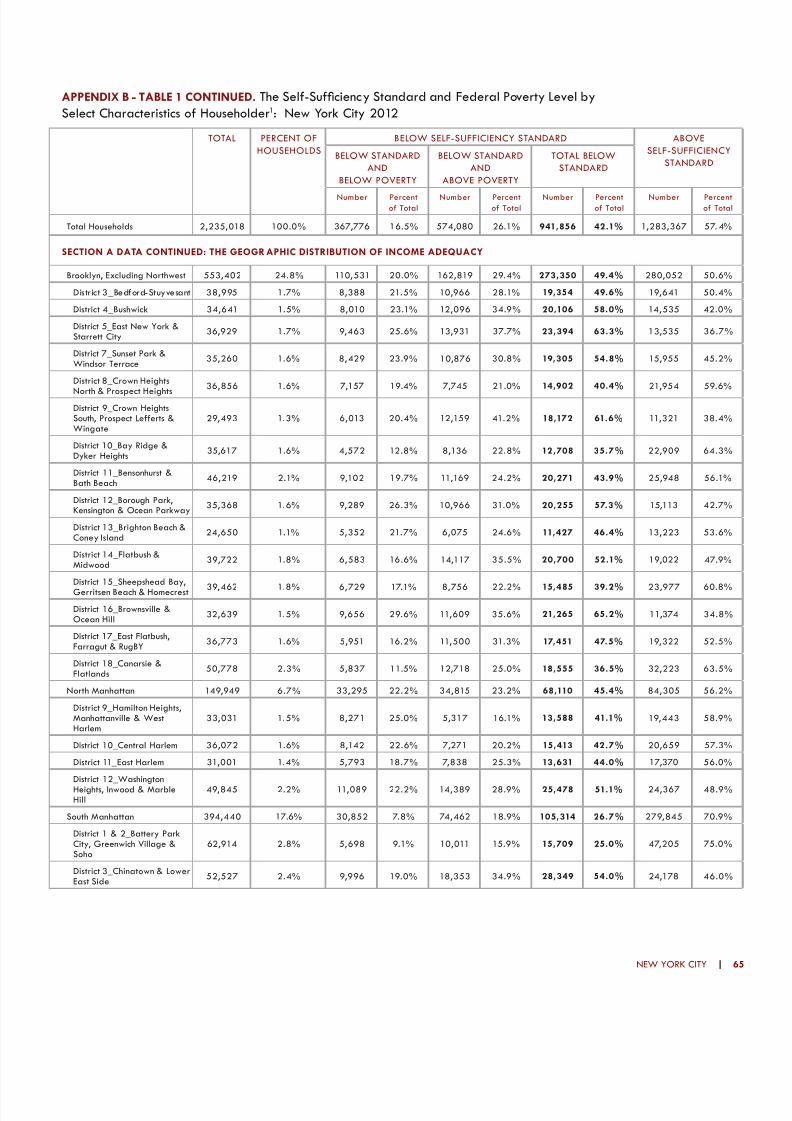
8/10/2019 Overlooked and Undercounted: The Struggle to Make Ends Meet in New York City.
http://slidepdf.com/reader/full/overlooked-and-undercounted-the-struggle-to-make-ends-meet-in-new-york-city 77/108
NEW YORK CITY | 65
APPENDIX B - TABLE 1 CONTINUED. The Self-Sufciency Standard and Federal Poverty Level by Select Characteristics of Householder1: New York City 2012
TOTAL PERCENT OF
HOUSEHOLDS
BELOW SELF-SUFFICIENCY STANDARD ABOVE
SELF-SUFFICIENCY
STANDARDBELOW STANDARD
AND
BELOW POVERTY
BELOW STANDARD
AND
ABOVE POVERTY
TOTAL BELOW
STANDARD
Number Percentof Total
Number Percentof Total
Number Percentof Total
Number Percentof Total
Total Households 2,235,018 100.0% 367,776 16.5% 574,080 26.1% 941,856 42.1% 1,283,367 57. 4%
SECTION A DATA CONTINUED: THE GEOGR APHIC DISTRIBUTION OF INCOME ADEQUACY
Brooklyn, Excluding Northwest 553,402 24.8% 110,531 20.0% 162,819 29.4% 273,350 49.4% 280,052 50.6%
District 3_Bedford-Stuyvesant 38,995 1.7% 8,388 21.5% 10,966 28.1% 19,354 49.6% 19,641 50.4%
District 4_Bushwick 34,641 1.5% 8,010 23.1% 12,096 34.9% 20,106 58.0% 14,535 42.0%
District 5_East New York &Starrett City
36,929 1.7% 9,463 25.6% 13,931 37.7% 23,394 63.3% 13,535 36.7%
District 7_Sunset Park &Windsor Terrace
35,260 1.6% 8,429 23.9% 10,876 30.8% 19,305 54.8% 15,955 45.2%
District 8_Crown Heights
North & Prospect Heights36,856 1.6% 7,157 19.4% 7,745 21.0% 14,902 40.4% 21,954 59.6%
District 9_Crown HeightsSouth, Prospect Lefferts &Wingate
29,493 1.3% 6,013 20.4% 12,159 41.2% 18,172 61.6% 11,321 38.4%
District 10_Bay Ridge &Dyker Heights
35,617 1.6% 4,572 12.8% 8,136 22.8% 12,708 35.7% 22,909 64.3%
District 11_Bensonhurst &Bath Beach
46,219 2.1% 9,102 19.7% 11,169 24.2% 20,271 43.9% 25,948 56.1%
District 12_Borough Park,Kensington & Ocean Parkway
35,368 1.6% 9,289 26.3% 10,966 31.0% 20,255 57.3% 15,113 42.7%
District 13_Brighton Beach &Coney Island
24,650 1.1% 5,352 21.7% 6,075 24.6% 11,427 46.4% 13,223 53.6%
District 14_Flatbush &Midwood
39,722 1.8% 6,583 16.6% 14,117 35.5% 20,700 52.1% 19,022 47.9%
District 15_Sheepshead Bay,
Gerritsen Beach & Homecrest 39,462 1.8% 6,729 17.1% 8,756 22.2% 15,485 39.2% 23,977 60.8%
District 16_Brownsville &Ocean Hill
32,639 1.5% 9,656 29.6% 11,609 35.6% 21,265 65.2% 11,374 34.8%
District 17_East Flatbush,Farragut & RugBY
36,773 1.6% 5,951 16.2% 11,500 31.3% 17,451 47.5% 19,322 52.5%
District 18_Canarsie &Flatlands
50,778 2.3% 5,837 11.5% 12,718 25.0% 18,555 36.5% 32,223 63.5%
North Manhattan 149,949 6.7% 33,295 22.2% 34,815 23.2% 68,110 45.4% 84,305 56.2%
District 9_Hamilton Heights,Manhattanville & WestHarlem
33,031 1.5% 8,271 25.0% 5,317 16.1% 13,588 41.1% 19,443 58.9%
District 10_Central Harlem 36,072 1.6% 8,142 22.6% 7,271 20.2% 15,413 42.7% 20,659 57.3%
District 11_East Harlem 31,001 1.4% 5,793 18.7% 7,838 25.3% 13,631 44.0% 17,370 56.0%
District 12_WashingtonHeights, Inwood & MarbleHill
49,845 2.2% 11,089 22.2% 14,389 28.9% 25,478 51.1% 24,367 48.9%
South Manhattan 394,440 17.6% 30,852 7.8% 74,462 18.9% 105,314 26.7% 279,845 70.9%
District 1 & 2_Battery ParkCity, Greenwich Village &Soho
62,914 2.8% 5,698 9.1% 10,011 15.9% 15,709 25.0% 47,205 75.0%
District 3_Chinatown & LowerEast Side
52,527 2.4% 9,996 19.0% 18,353 34.9% 28,349 54.0% 24,178 46.0%

8/10/2019 Overlooked and Undercounted: The Struggle to Make Ends Meet in New York City.
http://slidepdf.com/reader/full/overlooked-and-undercounted-the-struggle-to-make-ends-meet-in-new-york-city 78/108
66 | OVERLOOKED AND UNDERCOUNTED
APPENDIX B - TABLE 1 CONTINUED. The Self-Sufciency Standard and Federal Poverty Level by Select Characteristics of Householder1: New York City 2012
TOTAL PERCENT OF
HOUSEHOLDS
BELOW SELF-SUFFICIENCY STANDARD ABOVE
SELF-SUFFICIENCY
STANDARDBELOW STANDARD
AND
BELOW POVERTY
BELOW STANDARD
AND
ABOVE POVERTY
TOTAL BELOW
STANDARD
Number Percentof Total
Number Percentof Total
Number Percentof Total
Number Percentof Total
Total Households 2,235,018 100.0% 367,776 16.5% 574,080 26.1% 941,856 42.1% 1,283,367 57. 4%
SECTION A DATA CONTINUED: THE GEOGR APHIC DISTRIBUTION OF INCOME ADEQUACY
District 4 & 5_Chelsea,Clinton & Midtown BusinessDistrict
66,134 3.0% 3,762 5.7% 14,703 22.2% 18,465 27.9% 47,669 72.1%
District 6_Murray Hill,Gramercy & Stuyvesant Town
59,848 2.7% 2,660 4.4% 8,751 14.6% 11,411 19.1% 48,437 80.9%
District 7_Upper West Side &West Side
69,197 3.1% 4,443 6.4% 11,626 16.8% 16,069 23.2% 53,128 76.8%
District 8_Upper East Side 83,820 3.8% 4,293 5.1% 11,018 13.1% 15,311 18.3% 68,509 81.7%
Staten Island 112,474 5.0% 9,776 8.7% 23,263 20.7% 33,039 29.4% 77,892 69.3%
District 1: Port Richmond,Stapleton & Mariner's Harbor
43,592 2.0% 6,381 14.6% 11,647 26.7% 18,028 41.4% 25,564 58.6%
District 2: New Springville &South Beach
32,249 1.4% 1,783 5.5% 7,242 22.5% 9,025 28.0% 23,224 72.0%
District 3: Tottenville, GreatKills & Annadale
36,633 1.6% 1,612 4.4% 4,374 11.9% 5,986 16.3% 30,647 83.7%
Queens 564,053 25.2% 80,392 14.3% 159,960 28.4% 240,352 42.6% 323,141 57.3%
District 1: Astoria & LongIsland City
52,091 2.3% 6,309 12.1% 11,107 21.3% 17,416 33.4% 34,675 66.6%
District 2: Sunnyside &Woodside
43,978 2.0% 7,645 17.4% 13,950 31.7% 21,595 49.1% 22,383 50.9%
District 3: Jackson Heights &North Corona
42,313 1.9% 7,786 18.4% 17,652 41.7% 25,438 60.1% 16,875 39.9%
District 4: Elmhurst & South
Corona35,191 1.6% 7,327 20.8% 13,935 39.6% 21,262 60.4% 13,929 39.6%
District 5: Ridgewood,Glendale & Middle Village
45,347 2.0% 7,649 16.9% 10,500 23.2% 18,149 40.0% 27,198 60.0%
District 6: Forest Hills & RegoPark
38,045 1.7% 3,623 9.5% 4,552 12.0% 8,175 21.5% 29,870 78.5%
District 7: Flushing, MurrayHill & Whitestone
60,032 2.7% 7,786 13.0% 19,691 32.8% 27,477 45.8% 32,555 54.2%
District 8: Briarwood, FreshMeadows & Hillcrest
39,152 1.8% 6,980 17.8% 6,910 17.6% 13,890 35.5% 25,262 64.5%
District 9: Richmond Hill &Woodhaven
31,368 1.4% 4,415 14.1% 10,292 32.8% 14,707 46.9% 16,661 53.1%
District 10: Howard Beach &Ozone Park
29,412 1.3% 3,829 13.0% 9,280 31.6% 13,109 44.6% 16,303 55.4%
District 11: Bayside,Douglaston & Little Neck
31,519 1.4% 2,129 6.8% 7,616 24.2% 9,745 30.9% 21,774 69.1%
District 12: Jamaica, Hollis &St. Albans
47,571 2.1% 7,130 15.0% 15,072 31.7% 22,202 46.7% 25,369 53.3%
District 13: Queens Village,Cambria Heights & Rosedale
40,894 1.8% 3,529 8.6% 10,421 25.5% 13,950 34.1% 26,944 65.9%
District 14: Far Rockaway,Breezy Point & BroadChannel
27,140 1.2% 4,255 15.7% 8,982 33.1% 13,237 48.8% 13,903 51.2%
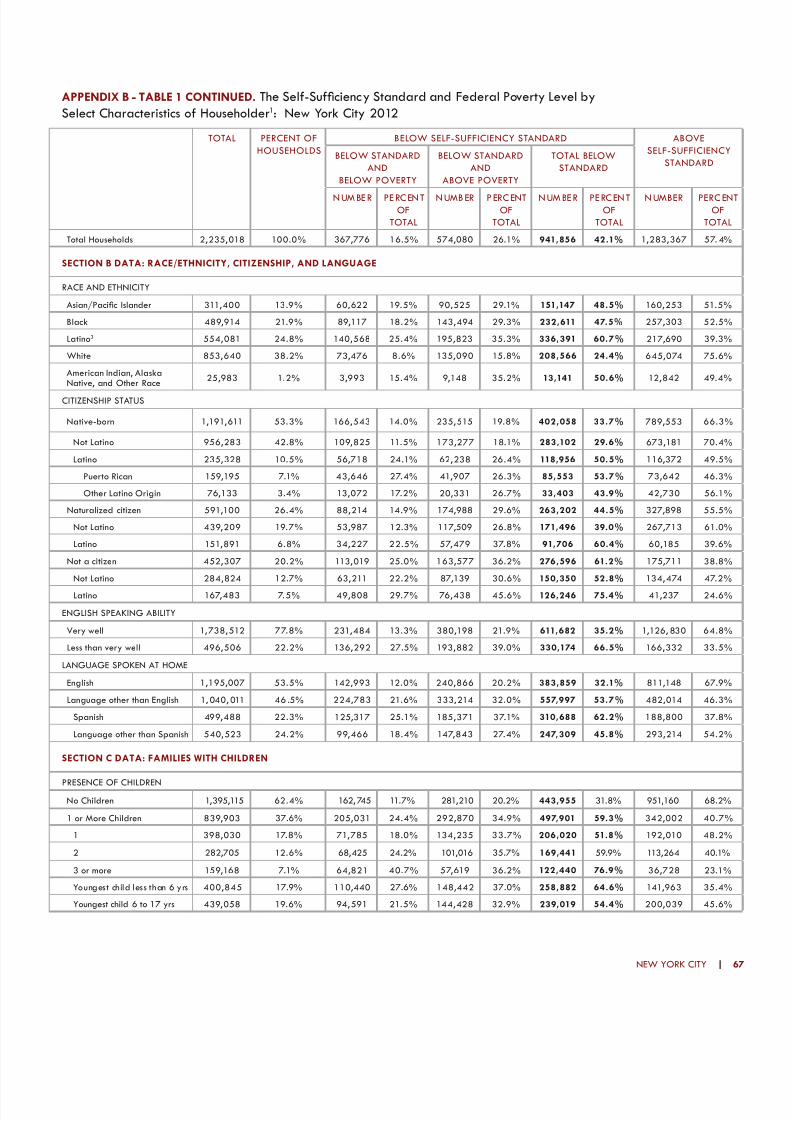
8/10/2019 Overlooked and Undercounted: The Struggle to Make Ends Meet in New York City.
http://slidepdf.com/reader/full/overlooked-and-undercounted-the-struggle-to-make-ends-meet-in-new-york-city 79/108
NEW YORK CITY | 67
APPENDIX B - TABLE 1 CONTINUED. The Self-Sufciency Standard and Federal Poverty Level by Select Characteristics of Householder1: New York City 2012
TOTAL PERCENT OF
HOUSEHOLDS
BELOW SELF-SUFFICIENCY STANDARD ABOVE
SELF-SUFFICIENCY
STANDARDBELOW STANDARD
AND
BELOW POVERTY
BELOW STANDARD
AND
ABOVE POVERTY
TOTAL BELOW
STANDARD
NUMBE R PE RC ENTOF
TOTAL
NUMBER PERC ENTOF
TOTAL
NUMBE R PE RC ENTOF
TOTAL
N UMBER PERC ENTOF
TOTAL
Total Households 2,235,018 100.0% 367,776 16.5% 574,080 26.1% 941,856 42.1% 1,283,367 57. 4%
SECTION B DATA: RACE/ETHNICITY, CITIZENSHIP, AND LANGUAGE
RACE AND ETHNICITY
Asian/Pacic Islander 311,400 13.9% 60,622 19.5% 90,525 29.1% 151,147 48.5% 160,253 51.5%
Black 489,914 21.9% 89,117 18.2% 143,494 29.3% 232,611 47.5% 257,303 52.5%
Latino3 554,081 24.8% 140,568 25.4% 195,823 35.3% 336,391 60.7% 217,690 39.3%
White 853,640 38.2% 73,476 8.6% 135,090 15.8% 208,566 24.4% 645,074 75.6%
American Indian, AlaskaNative, and Other Race
25,983 1.2% 3,993 15.4% 9,148 35.2% 13,141 50.6% 12,842 49.4%
CITIZENSHIP STATUS
Native-born 1,191,611 53.3% 166,543 14.0% 235,515 19.8% 402,058 33.7% 789,553 66.3%
Not Latino 956,283 42.8% 109,825 11.5% 173,277 18.1% 283,102 29.6% 673,181 70.4%
Latino 235,328 10.5% 56,718 24.1% 62,238 26.4% 118,956 50.5% 116,372 49.5%
Puerto Rican 159,195 7.1% 43,646 27.4% 41,907 26.3% 85,553 53.7% 73,642 46.3%
Other Latino Origin 76,133 3.4% 13,072 17.2% 20,331 26.7% 33,403 43.9% 42,730 56.1%
Naturalized citizen 591,100 26.4% 88,214 14.9% 174,988 29.6% 263,202 44.5% 327,898 55.5%
Not Latino 439,209 19.7% 53,987 12.3% 117,509 26.8% 171,496 39.0% 267,713 61.0%
Latino 151,891 6.8% 34,227 22.5% 57,479 37.8% 91,706 60.4% 60,185 39.6%
Not a citizen 452,307 20.2% 113,019 25.0% 163,577 36.2% 276,596 61.2% 175,711 38.8%
Not Latino 284,824 12.7% 63,211 22.2% 87,139 30.6% 150,350 52.8% 134,474 47.2%
Latino 167,483 7.5% 49,808 29.7% 76,438 45.6% 126,246 75.4% 41,237 24.6%
ENGLISH SPEAKING ABILITY
Very well 1,738,512 77.8% 231,484 13.3% 380,198 21.9% 611,682 35.2% 1,126, 830 64.8%
Less than very well 496,506 22.2% 136,292 27.5% 193,882 39.0% 330,174 66.5% 166,332 33.5%
LANGUAGE SPOKEN AT HOME
English 1,195,007 53.5% 142,993 12.0% 240,866 20.2% 383,859 32.1% 811,148 67.9%
Language other than English 1, 040, 011 46 .5% 224,783 21.6% 333,214 32.0% 557,997 53.7% 482,014 46.3%
Spanish 499,488 22.3% 125,317 25.1% 185,371 37.1% 310,688 62.2% 188,800 37.8%
Language other than Spanish 540,523 24.2% 99,466 18.4% 147,843 27.4% 247,309 45.8% 293,214 54.2%
SECTION C DATA: FAMILIES WITH CHILDREN
PRESENCE OF CHILDRENNo Children 1,395,115 62.4% 162, 745 11.7% 281,210 20.2% 443,955 31.8% 951,160 68.2%
1 or More Children 839,903 37.6% 205,031 24.4% 292,870 34.9% 497,901 59.3% 342,002 40.7%
1 398,030 17.8% 71,785 18.0% 134,235 33.7% 206,020 51.8% 192,010 48.2%
2 282,705 12.6% 68,425 24.2% 101,016 35.7% 169,441 59.9% 113,264 40.1%
3 or more 159,168 7.1% 64,821 40.7% 57,619 36.2% 122,440 76.9% 36,728 23.1%
Youngest child less than 6 yrs 400,845 17.9% 110,440 27.6% 148,442 37.0% 258,882 64.6% 141,963 35.4%
Youngest child 6 to 17 yrs 439,058 19.6% 94,591 21.5% 144,428 32.9% 239,019 54.4% 200,039 45.6%

8/10/2019 Overlooked and Undercounted: The Struggle to Make Ends Meet in New York City.
http://slidepdf.com/reader/full/overlooked-and-undercounted-the-struggle-to-make-ends-meet-in-new-york-city 80/108
68 | OVERLOOKED AND UNDERCOUNTED
APPENDIX B - TABLE 1 CONTINUED. The Self-Sufciency Standard and Federal Poverty Level by Select Characteristics of Householder1: New York City 2012
TOTAL PERCENT OF
HOUSEHOLDS
BELOW SELF-SUFFICIENCY STANDARD ABOVE
SELF-SUFFICIENCY
STANDARDBELOW STANDARD
AND
BELOW POVERTY
BELOW STANDARD
AND
ABOVE POVERTY
TOTAL BELOW
STANDARD
NUMBE R PE RC ENTOF
TOTAL
NUMBER PERC ENTOF
TOTAL
NUMBE R PE RC ENTOF
TOTAL
N UMBER PERC ENTOF
TOTAL
Total Households 2,235,018 100.0% 367,776 16.5% 574,080 26.1% 941,856 42.1% 1,283,367 57. 4%
SECTION C DATA: FAMILIES WITH CHILDREN CONTINUED
SEX OF HOUSEHOLDER
Male 1,092,923 48.9% 134,009 12.3% 272,349 24.9% 406, 358 37.18% 686,565 62.8%
Female 1,142,095 51.1% 233,767 20.5% 301,731 26.4% 535,498 46.9% 606,597 53.1%
HOUSEHOLD TYPE AND PRESENCE OF CHILDREN
Non-family3 household 815,907 36.5% 107,606 13.2% 156,274 19.2% 263,880 32.3% 552,027 67.7%
Male householder 412,292 18.4% 46,917 11.4% 79,447 19.3% 126,364 30.6% 285,928 69.4%
Female householder 403,615 18.1% 60,689 15.0% 76,827 19.0% 137,516 34.1% 266,099 65.9%
Family household4 1,419,111 63.5% 260,170 18.3% 417,806 29.4% 677,976 47.8% 741,135 52.2%
Married couple 855,229 38.3% 101,485 11.9% 221,408 25.9% 322,893 37.8% 532,336 62.2%
No children 359,795 16.1% 25,906 7.2% 61,881 17.2% 87,787 24.4% 272,008 75.6%
1 or more 495,434 22.2% 75,579 15.3% 159,527 32.2% 235,106 47.5% 260,328 52.5%
1 216,151 9.7% 22,895 10.6% 59,480 27.5% 82,375 38.1% 133,776 61.9%
2 180,735 8.1% 24,296 13.4% 62,219 34.4% 86,515 47.9% 94,220 52.1%
3 or more 98,548 4.4% 28,388 28.8% 37,828 38.4% 66,216 67.2% 32,332 32.8%
Male householder, no spousepresent
140,376 6.3% 24,307 17.3% 47,506 33.8% 71,813 51.2% 68,563 48.8%
No children 75,052 3.4% 9,563 12.7% 17,884 23.8% 27,447 36.6% 47,605 63.4%
1 or more 65,324 2.9% 14,744 22.6% 29,622 45.3% 44,366 67.9% 20,958 32.1%
1 37,658 1.7% 6,184 16.4% 16,574 44.0% 22,758 60.4% 14,900 39.6%
2 18,067 0.8% 4,660 25.8% 8,434 46.7% 13,094 72.5% 4,973 27.5%
3 or more 9,599 0.4% 3,900 40.6% 4,614 48.1% 8,514 88.7% 1,085 11.3%
Female householder, nospouse present
423,506 18.9% 134,378 31.7% 148,892 35.2% 283,270 66.9% 140,236 33.1%
No children 147,465 6.6% 19,997 13.6% 45,796 31.1% 65,793 44.6% 81,672 55.4%
1 or more 276,041 12.4% 114,381 41.4% 103,096 37.3% 217,477 78.8% 58,564 21.2%
1 141,763 6.3% 42,637 30.1% 57,710 40.7% 100,347 70.8% 41,416 29.2%
2 83,448 3.7% 39,211 47.0% 30,209 36.2% 69,420 83.2% 14,028 16.8%
3 or more 50,830 2.3% 32,533 64.0% 15,177 29.9% 47,710 93.9% 3,120 6.1%
PRESENCE OF CHILDREN BY HOUSEHOLD TYPE AND RACE/ETHNICITY
No Children 1,395,115 62.4% 162, 745 11. 7% 281,210 20.2% 443,955 31.8% 951,160 68.2%
Married couple 359,795 16.1% 25,906 7.2% 61,881 17.2% 87,787 24.4% 272,008 75.6%
Asian/Pacic Islander 70,634 3.2% 8,357 11.8% 19,783 28.0% 28,140 39.8% 42,494 60.2%
Black 47,621 2.1% 2,305 4.8% 6,612 13.9% 8,917 18.7% 38,704 81.3%
Latino 66,751 3.0% 6,735 10.1% 17,798 26.7% 24,533 36.8% 42,218 63.2%
White 171,177 7.7% 8,241 4.8% 16,746 9.8% 24,987 14.6% 146,190 85.4%
American Indian, AlaskaNative, and Other Race
3,612 0.2% * * * * 1,210 33.5% 2,402 66.5%

8/10/2019 Overlooked and Undercounted: The Struggle to Make Ends Meet in New York City.
http://slidepdf.com/reader/full/overlooked-and-undercounted-the-struggle-to-make-ends-meet-in-new-york-city 81/108
NEW YORK CITY | 69
APPENDIX B - TABLE 1 CONTINUED. The Self-Sufciency Standard and Federal Poverty Level by Select Characteristics of Householder1: New York City 2012
TOTAL PERCENT OF
HOUSEHOLDS
BELOW SELF-SUFFICIENCY STANDARD ABOVE
SELF-SUFFICIENCY
STANDARDBELOW STANDARD
AND
BELOW POVERTY
BELOW STANDARD
AND
ABOVE POVERTY
TOTAL BELOW
STANDARD
Number Percentof Total
Number Percentof Total
Number Percentof Total
Number Percentof Total
Total Households 2,235,018 100.0% 367,776 16.5% 574,080 26.1% 941,856 42.1% 1,283,367 57. 4%
SECTION C DATA: FAMILIES WITH CHILDREN CONTINUED
Male householder, no spousepresent
485,418 21.7% 56,480 11.6% 97,177 20.0% 153,657 31.7% 331,761 68.3%
Asian/Pacic Islander 55, 799 2.5% 8,421 15.1% 11,769 21.1% 20,190 36.2% 35,609 63.8%
Black 98,676 4.4% 15,580 15.8% 24,106 24.4% 39,686 40.2% 58,990 59.8%
Latino 101,385 4.5% 14,867 14.7% 29,280 28.9% 44,147 43.5% 57,238 56.5%
White 224,186 10.0% 17,034 7.6% 30,535 13.6% 47,569 21.2% 176,617 78.8%
American Indian, AlaskaNative, and Other Race
5,372 0.2% * * 1,487 27.7% 2,065 38.4% 3,307 61.6%
Female householder,no spouse present
549,902 24.6% 80,359 14.6% 122,152 22.2% 202,511 36.8% 347,391 63.2%
Asian/Pacic Islander 63,155 2.8% 12,253 19.4% 12,059 19.1% 24,312 38.5% 38,843 61.5%
Black 138,451 6.2% 22,906 16.5% 33,592 24.3% 56,498 40.8% 81,953 59.2%
Latina 111,602 5.0% 25,211 22.6% 34,360 30.8% 59,571 53.4% 52,031 46.6%
White 231,241 10.3% 19,118 8.3% 40,836 17.7% 59,954 25.9% 171,287 74.1%
American Indian, AlaskaNative, and Other Race
5,453 0.2% * * 1,305 23.9% 2,176 39.9% 3,277 60.1%
1 or More Children 839,903 37.6% 205,031 24.4% 292,870 34.9% 497,901 59.3% 342,002 40.7%
Married couple 495,434 22.2% 75,579 15.3% 159,527 32.2% 235,106 47.5% 260,328 52.5%
Asian/Pacic Islander 101,686 4.5% 24,165 23.8% 40,235 39.6% 64,400 63.3% 37,286 36.7%
Black 80,131 3.6% 7,603 9.5% 28,277 35.3% 35,880 44.8% 44,251 55.2%
Latino 117,582 5.3% 22,800 19.4% 54,290 46.2%77,090 65.6%
40,492 34.4%White 189,598 8.5% 20,435 10.8% 34,307 18.1% 54,742 28.9% 134,856 71.1%
American Indian, AlaskaNative, and Other Race
6,437 0.3% * * 2,418 37.6% 2,994 46.5% 3,443 53.5%
Male householder, no spousepresent
67,250 3.0% 14,744 21.9% 29,776 44.3% 44,520 66.2% 22,730 33.8%
Asian/Pacic Islander 5,626 0.3% 571 10.1% 2,555 45.4% 3,126 55.6% 2,500 44.4%
Black 16,883 0.8% 3,915 23.2% 6,983 41.4% 10,898 64.6% 5,985 35.4%
Latino 36,476 1.6% 8,619 23.6% 18,698 51.3% 27,317 74.9% 9,159 25.1%
White 7,766 0.3% 1,387 17.9% 1,293 16.6% 2,680 34.5% 5,086 65.5%
American Indian, AlaskaNative, and Other Race
* * * * * * * * * *
Female householder,no spouse present
277,219 12.4% 114,708 41.4% 103,567 37.4% 218,275 78.7% 58,944 21.3%
Asian/Pacic Islander 14,500 0.6% 6,855 47.3% 4,124 28.4% 10,979 75.7% 3,521 24.3%
Black 108,152 4.8% 36,808 34.0% 43,924 40.6% 80,732 74.6% 27,420 25.4%
Latina 120,285 5.4% 62,336 51.8% 41,397 34.4% 103,733 86.2% 16,552 13.8%
White 29,672 1.3% 7,261 24.5% 11,373 38.3% 18,634 62.8% 11,038 37.2%
American Indian, AlaskaNative, and Other Race
4,610 0.2% 1,448 31.4% 2,749 59.6% 4,197 91.0% * *

8/10/2019 Overlooked and Undercounted: The Struggle to Make Ends Meet in New York City.
http://slidepdf.com/reader/full/overlooked-and-undercounted-the-struggle-to-make-ends-meet-in-new-york-city 82/108
70 | OVERLOOKED AND UNDERCOUNTED
APPENDIX B - TABLE 1 CONTINUED. The Self-Sufciency Standard and Federal Poverty Level by Select Characteristics of Householder1: New York City 2012
TOTAL PERCENT OF
HOUSEHOLDS
BELOW SELF-SUFFICIENCY STANDARD ABOVE
SELF-SUFFICIENCY
STANDARDBELOW STANDARD
AND
BELOW POVERTY
BELOW STANDARD
AND
ABOVE POVERTY
TOTAL BELOW
STANDARD
Number Percentof Total
Number Percentof Total
Number Percentof Total
Number Percentof Total
Total Households 2,235,018 100.0% 367,776 16.5% 574,080 26.1% 941,856 42.1% 1,283,367 57. 4%
SECTION D DATA: EDUCATION CONTINUE D
Less than High School 307,213 13.7% 121,883 39.7% 124,148 40.4% 246,031 80.1% 61,182 19.9%
Male 151,231 6.8% 44,209 29.2% 66,279 43.8% 110,488 73.1% 40,743 26.9%
White 15,670 0.7% 4,323 27.6% 4,635 29.6% 8,958 57.2% 6,712 42.8%
Non-White 135,561 6.1% 39,886 29.4% 61,644 45.5% 101,530 74.9% 34,031 25.1%
Female 155,982 7.0% 77,674 49.8% 57,869 37.1% 135,543 86.9% 20,439 13.1%
White 9,237 0.4% 3,059 33.1% 3,562 38.6% 6,621 71.7% 2,616 28.3%
Non-White 146,745 6.6% 74,615 50.8% 54,307 37.0% 128,922 87.9% 17,823 12.1%
High Schoo l D iploma or GED 440,551 19.7% 102,657 23.3% 155,519 35.3% 258,176 58.6% 182,375 41.4%
Male 222,689 10.0% 38,150 17.1% 78,555 35.3% 116,705 52.4% 105,984 47.6%
White 61,936 2.8% 9,682 15.6% 14,213 22.9% 23,895 38.6% 38,041 61.4%
Non-White 160,753 7.2% 28,468 17.7% 64,342 40.0% 92,810 57.7% 67,943 42.3%
Female 217,862 9.7% 64,507 29.6% 76,964 35.3% 141,471 64.9% 76,391 35.1%
White 49,471 2.2% 10,487 21.2% 13,059 26.4% 23,546 47.6% 25,925 52.4%
Non-White 168,391 7.5% 54,020 32.1% 63,905 38.0% 117,925 70.0% 50,466 30.0%
Some College or Associate’sDegree
514,024 23.0% 83,628 16.3% 150,948 29.4% 234,576 45.6% 279,448 54.4%
Male 239,989 10.7% 27,410 11.4% 64,514 26.9% 91,924 38.3% 148,065 61.7%
White 82,231 3.7% 9,709 11.8% 17,052 20.7% 26,761 32.5% 55,470 67.5%
Non-White 157,758 7.1% 17,701 11.2% 47,462 30.1% 65,163 41.3% 92,595 58.7%
Female 274,035 12.3% 56,218 20.5% 86,434 31.5% 142,652 52.1% 131,383 47.9%
White 69,655 3.1% 11,203 16.1% 18,368 26.4% 29,571 42.5% 40,084 57.5%
Non-White 204,380 9.1% 45,015 22.0% 68,066 33.3% 113,081 55.3% 91,299 44.7%
Bachelor’s Degreeor Higher
973,230 43.5% 59,608 6.1% 143,465 14.7% 203,073 20.9% 770,157 79.1%
Male 479,014 21.4% 24,240 5.1% 63,001 13.2% 87,241 18.2% 391,773 81.8%
White 292,506 13.1% 12,361 4.2% 27,427 9.4% 39,788 13.6% 252,718 86.4%
Non-White 186,508 8.3% 11,879 6.4% 35,574 19.1% 47,453 25.4% 139,055 74.6%
Female 494,216 22.1% 35,368 7.2% 80,464 16.3% 115,832 23.4% 378,384 76.6%
White 272,934 12.2% 12,652 4.6% 36,774 13.5% 49,426 18.1% 223,508 81.9%
Non-White 221,282 9.9% 22,716 10.3% 43,690 19.7% 66,406 30.0% 154,876 70.0%

8/10/2019 Overlooked and Undercounted: The Struggle to Make Ends Meet in New York City.
http://slidepdf.com/reader/full/overlooked-and-undercounted-the-struggle-to-make-ends-meet-in-new-york-city 83/108
NEW YORK CITY | 71
APPENDIX B - TABLE 1 CONTINUED. The Self-Sufciency Standard and Federal Poverty Level by Select Characteristics of Householder1: New York City 2012
TOTAL PERCENT OF
HOUSEHOLDS
BELOW SELF-SUFFICIENCY STANDARD ABOVE
SELF-SUFFICIENCY
STANDARDBELOW STANDARD
AND
BELOW POVERTY
BELOW STANDARD
AND
ABOVE POVERTY
TOTAL BELOW
STANDARD
Number Percentof Total
Number Percentof Total
Number Percentof Total
Number Percentof Total
Total Households 2,235,018 100.0% 367,776 16.5% 574,080 26.1% 941,856 42.1% 1,283,367 57. 4%
SECTION E DATA: EMPLOYMENT AND WORK PATTERNS
NUMBER OF WORKERS IN HOUSEHOLD BY RACE/ETHNICITY AND NATIVITY
No Workers 182,414 8.2% 132,844 72.8% 28,898 15.8% 161,742 88.7% 20,672 11.3%
Race and Hispanic Origin
Asian/Pacic Islander 21, 786 1.0% 16,804 77.1% 2,315 10.6% 19,119 87.8% 2,667 12.2%
Black 54,055 2.4% 40,500 74.9% 8,856 16.4% 49,356 91.3% 4,699 8.7%
Latino 57,428 2.6% 47,756 83.2% 7,211 12.6% 54,967 95.7% 2,461 4.3%
White 47,031 2.1% 26,296 55.9% 10,087 21.4% 36,383 77.4% 10,648 22.6%
American Indian, AlaskaNative, and Other Race
2,114 0.1% 1,488 70.4% * * 1,917 90.7% * *
Nativity
Native 115,082 5.1% 80,211 69.7% 19,950 17.3% 100,161 87.0% 14,921 13.0%
Not Native 67,332 3.0% 52,633 78.2% 8,948 13.3% 61,581 91.5% 5,751 8.5%
One Worker 1,087,546 48.7% 191,382 17.6% 322,136 29.6% 513,518 47.2% 574,028 52.8%
Race and Hispanic Origin
Asian/Pacic Islander 141,056 6.3% 33,004 23.4% 41,308 29.3% 74,312 52.7% 66,744 47.3%
Black 254,141 11.4% 41,655 16.4% 93,215 36.7% 134,870 53.1% 119,271 46.9%
Latino 256,296 11.5% 76,913 30.0% 96,142 37.5% 173,055 67.5% 83,241 32.5%
White 425,600 19.0% 37,666 8.9% 88,070 20.7% 125,736 29.5% 299,864 70.5%
American Indian, AlaskaNative, and Other Race
10,453 0.5% 2,144 20.5% 3,401 32.5% 5,545 53.0% 4,908 47.0%
Nativity
Native 607,119 27.2% 72,989 12.0% 156,048 25.7% 229,037 37.7% 378,082 62.3%
Not Native 480,427 21.5% 118,393 24.6% 166,088 34.6% 284,481 59.2% 195,946 40.8%
Two or More Workers 965,058 43.2% 43,550 4.5% 223,046 23.1% 266,596 27.6% 698,462 72.4%
Race and Hispanic Origin
Asian/Pacic Islander 148,558 6.6% 10,814 7.3% 46,902 31.6% 57,716 38.9% 90,842 61.1%
Black 181,718 8.1% 6,962 3.8% 41,423 22.8% 48,385 26.6% 133,333 73.4%
Latino 240,357 10.8% 15,899 6.6% 92,470 38.5% 108,369 45.1% 131,988 54.9%
White 381,009 17.0% 9,514 2.5% 36,933 9.7% 46,447 12.2% 334,562 87.8%
American Indian, AlaskaNative, and Other Race
13,416 0.6% * * 5,318 39.6% 5,679 42.3% 7,737 57.7%
Nativity
Native 469,410 21.0% 13,343 2.8% 59,517 12.7% 72,860 15.5% 396,550 84.5%
Not Native 495,648 22.2% 30,207 6.1% 163,529 33.0% 193,736 39.1% 301,912 60.9%
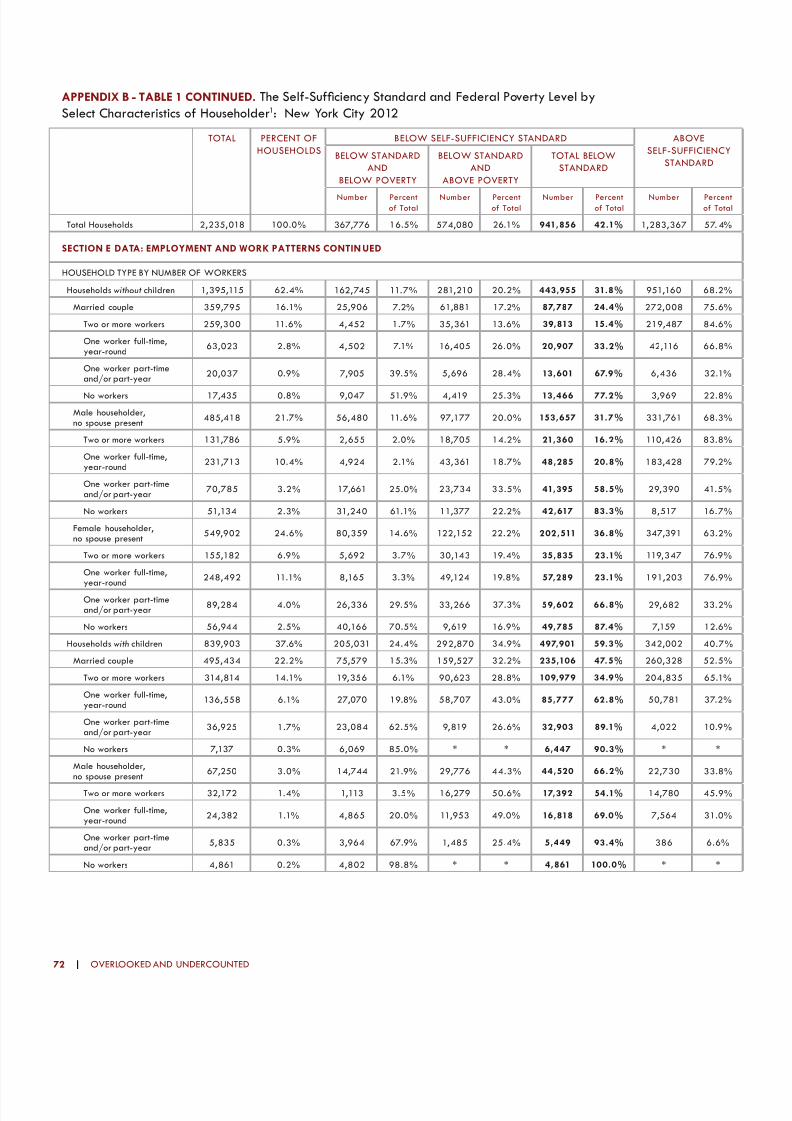
8/10/2019 Overlooked and Undercounted: The Struggle to Make Ends Meet in New York City.
http://slidepdf.com/reader/full/overlooked-and-undercounted-the-struggle-to-make-ends-meet-in-new-york-city 84/108
72 | OVERLOOKED AND UNDERCOUNTED
APPENDIX B - TABLE 1 CONTINUED. The Self-Sufciency Standard and Federal Poverty Level by Select Characteristics of Householder1: New York City 2012
TOTAL PERCENT OF
HOUSEHOLDS
BELOW SELF-SUFFICIENCY STANDARD ABOVE
SELF-SUFFICIENCY
STANDARDBELOW STANDARD
AND
BELOW POVERTY
BELOW STANDARD
AND
ABOVE POVERTY
TOTAL BELOW
STANDARD
Number Percentof Total
Number Percentof Total
Number Percentof Total
Number Percentof Total
Total Households 2,235,018 100.0% 367,776 16.5% 574,080 26.1% 941,856 42.1% 1,283,367 57. 4%
SECTION E DATA: EMPLOYMENT AND WORK PATTERNS CONTINUED
HOUSEHOLD TYPE BY NUMBER OF WORKERS
Households without children 1,395,115 62.4% 162,745 11.7% 281,210 20.2% 443,955 31.8% 951,160 68.2%
Married couple 359,795 16.1% 25,906 7.2% 61,881 17.2% 87,787 24.4% 272,008 75.6%
Two or more workers 259,300 11.6% 4,452 1.7% 35,361 13.6% 39,813 15.4% 219,487 84.6%
One worker full-time,year-round
63,023 2.8% 4,502 7.1% 16,405 26.0% 20,907 33.2% 42,116 66.8%
One worker part-timeand/or part-year
20,037 0.9% 7,905 39.5% 5,696 28.4% 13,601 67.9% 6,436 32.1%
No workers 17,435 0.8% 9,047 51.9% 4,419 25.3% 13,466 77.2% 3,969 22.8%
Male householder,no spouse present
485,418 21.7% 56,480 11.6% 97,177 20.0% 153,657 31.7% 331,761 68.3%
Two or more workers 131,786 5.9% 2,655 2.0% 18,705 14.2% 21,360 16.2% 110,426 83.8%
One worker full-time,year-round
231,713 10.4% 4,924 2.1% 43,361 18.7% 48,285 20.8% 183,428 79.2%
One worker part-timeand/or part-year
70,785 3.2% 17,661 25.0% 23,734 33.5% 41,395 58.5% 29,390 41.5%
No workers 51,134 2.3% 31,240 61.1% 11,377 22.2% 42,617 83.3% 8,517 16.7%
Female householder,no spouse present
549,902 24.6% 80,359 14.6% 122,152 22.2% 202,511 36.8% 347,391 63.2%
Two or more workers 155,182 6.9% 5,692 3.7% 30,143 19.4% 35,835 23.1% 119,347 76.9%
One worker full-time,year-round
248,492 11.1% 8,165 3.3% 49,124 19.8% 57,289 23.1% 191,203 76.9%
One worker part-timeand/or part-year
89,284 4.0% 26,336 29.5% 33,266 37.3% 59,602 66.8% 29,682 33.2%
No workers 56,944 2.5% 40,166 70.5% 9,619 16.9% 49,785 87.4% 7,159 12.6%
Households with children 839,903 37.6% 205,031 24.4% 292,870 34.9% 497,901 59.3% 342,002 40.7%
Married couple 495,434 22.2% 75,579 15.3% 159,527 32.2% 235,106 47.5% 260,328 52.5%
Two or more workers 314,814 14.1% 19,356 6.1% 90,623 28.8% 109,979 34.9% 204,835 65.1%
One worker full-time,year-round
136,558 6.1% 27,070 19.8% 58,707 43.0% 85,777 62.8% 50,781 37.2%
One worker part-timeand/or part-year
36,925 1.7% 23,084 62.5% 9,819 26.6% 32,903 89.1% 4,022 10.9%
No workers 7,137 0.3% 6,069 85.0% * * 6,447 90.3% * *
Male householder,no spouse present
67,250 3.0% 14,744 21.9% 29,776 44.3% 44,520 66.2% 22,730 33.8%
Two or more workers 32,172 1.4% 1,113 3.5% 16,279 50.6% 17,392 54.1% 14,780 45.9%
One worker full-time,year-round
24,382 1.1% 4,865 20.0% 11,953 49.0% 16,818 69.0% 7,564 31.0%
One worker part-timeand/or part-year
5,835 0.3% 3,964 67.9% 1,485 25.4% 5,449 93.4% 386 6.6%
No workers 4,861 0.2% 4,802 98.8% * * 4,861 100.0% * *

8/10/2019 Overlooked and Undercounted: The Struggle to Make Ends Meet in New York City.
http://slidepdf.com/reader/full/overlooked-and-undercounted-the-struggle-to-make-ends-meet-in-new-york-city 85/108
NEW YORK CITY | 73
APPENDIX B - TABLE 1 CONTINUED. The Self-Sufciency Standard and Federal Poverty Level by Select Characteristics of Householder1: New York City 2012
TOTAL PERCENT OF
HOUSEHOLDS
BELOW SELF-SUFFICIENCY STANDARD ABOVE
SELF-SUFFICIENCY
STANDARDBELOW STANDARD
AND
BELOW POVERTY
BELOW STANDARD
AND
ABOVE POVERTY
TOTAL BELOW
STANDARD
Number Percentof Total
Number Percentof Total
Number Percentof Total
Number Percentof Total
Total Households 2,235,018 100.0% 367,776 16.5% 574,080 26.1% 941,856 42.1% 1,283,367 57. 4%
SECTION E DATA: EMPLOYMENT AND WORK PATTERNS CONTINUED
Female householder,no spouse present
277,219 12.4% 114,708 41.4% 103,567 37.4% 218,275 78.7% 58,944 21.3%
Two or more workers 71,804 3.2% 10,282 14.3% 31,935 44.5% 42,217 58.8% 29,587 41.2%
One worker full time,year round
99,362 4.4% 19,988 20.1% 53,392 53.7% 73,380 73.9% 25,982 26.1%
One worker part timeand/or part year
61,150 2.7% 42,918 70.2% 15,194 24.8% 58,112 95.0% 3,038 5.0%
No workers 44,903 2.0% 41,520 92.5% 3,046 6.8% 44,566 99.2% * *
WORK STATUS OF HOUSEHOLDERFull time, year round 1,422,499 63.6% 69,930 4.9% 326,297 22.9% 396,227 27.9% 1,026,272 72.1%
Full time, part year 200,500 9.0% 38,189 19.0% 62,147 31.0% 100,336 50.0% 100,164 50.0%
less than 26 weeks 62,288 2.8% 19,878 31.9% 21,297 34.2% 41,175 66.1% 21,113 33.9%
26 weeks to 49 weeks 138,212 6.2% 18,311 13.2% 40,850 29.6% 59,161 42.8% 79,051 57.2%
Part time, year round 162,628 7.3% 44,480 27.4% 63,833 39.3% 108,313 66.6% 54,315 33.4%
Part time, part year 117,708 5.3% 46,792 39.8% 35,315 30.0% 82,107 69.8% 35,601 30.2%
less than 26 weeks 52,977 2.4% 28,184 53.2% 13,875 26.2% 42,059 79.4% 10,918 20.6%
26 weeks to 49 weeks 64,731 2.9% 18,608 28.7% 21,440 33.1% 40,048 61.9% 24,683 38.1%
Not working 331,683 14.8% 168,385 50.8% 86,488 26.1% 254,873 76.8% 76,810 23.2%
WORK STATUS OF ADULTS
One Adult in Household 857,098 38.3% 187,062 21.8% 205,696 24.0% 392,758 45.8% 464,340 54.2%
Full time, year round 530,001 23.7% 23,311 4.4% 118,559 22.4% 141,870 26.8% 388,131 73.2%
Full time, part year 79,657 3.6% 18,211 22.9% 25,003 31.4% 43,214 54.3% 36,443 45.7%
Part time, year round 63,606 2.8% 22,958 36.1% 24,539 38.6% 47,497 74.7% 16,109 25.3%
Part time, part year 46,764 2.1% 26,304 56.2% 13,865 29.6% 40,169 85.9% 6,595 14.1%
Not working 137,070 6.1% 96,278 70.2% 23,730 17.3% 120,008 87.6% 17,062 12.4%
Two or More Adults inHousehold
1,377,920 61.7% 180,714 13.1% 368,384 26.7% 549,098 39.8% 828,822 60.2%
All adults work 759,259 34.0% 23,515 3.1% 142,792 18.8% 166,307 21.9% 592,952 78.1%
All workers full time,year round
361,760 16.2% 1,926 0.5% 30,581 8.5% 32,507 9.0% 329,253 91.0%
Some workers part timeand/or part year5 323,296 14.5% 7,088 2.2% 82,131 25.4% 89,219 27.6% 234,077 72.4%
All workers part time and/
or part year 74,203 3.3% 14,501 19.5% 30,080 40.5% 44,581 60.1% 29,622 39.9%
Some adults work 572,388 25.6% 119,754 20.9% 220,374 38.5% 340,128 59.4% 232,260 40.6%
All workers full time,year round
357,897 16.0% 49,392 13.8% 142,302 39.8% 191,694 53.6% 166,203 46.4%
All workers part time and/or part year
117,664 5.3% 63,055 53.6% 37,193 31.6% 100,248 85.2% 17,416 14.8%
Not working 96,827 4.3% 7,307 7.5% 40,879 42.2% 48,186 49.8% 48,641 50.2%
No adults work 46,273 2.1% 37,445 80.9% 5,218 11.3% 42,663 92.2% 3,610 7.8%
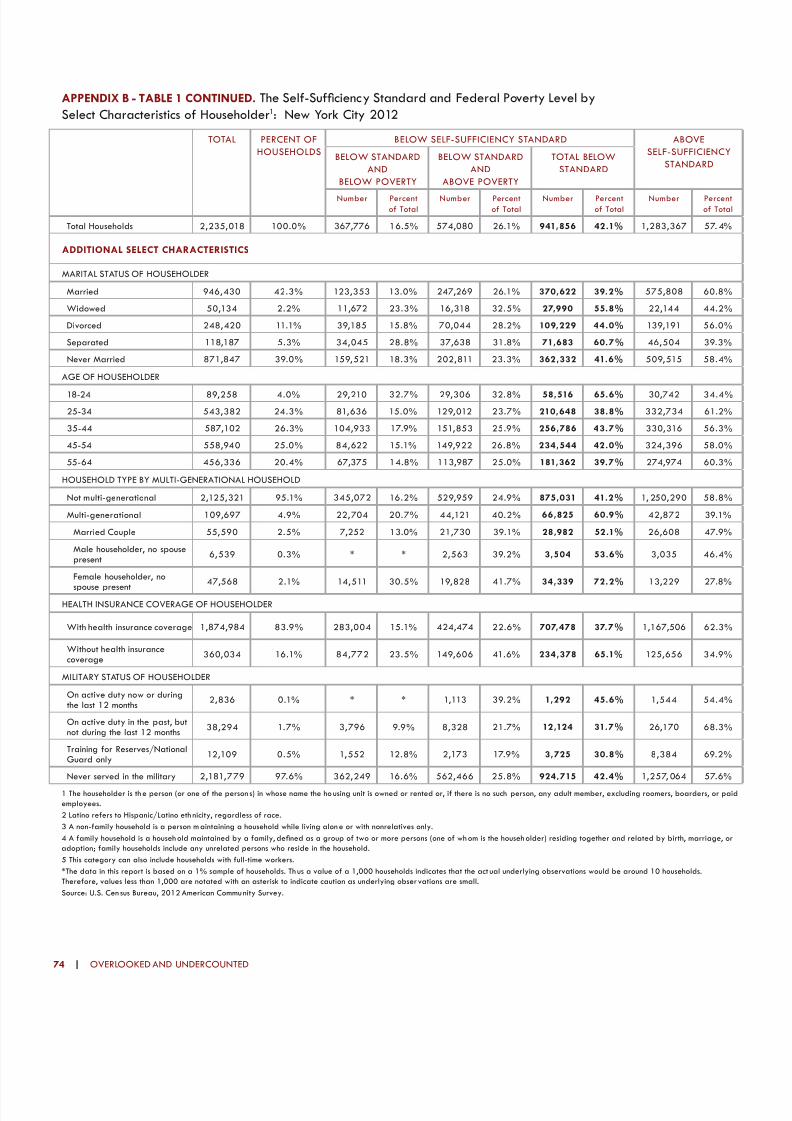
8/10/2019 Overlooked and Undercounted: The Struggle to Make Ends Meet in New York City.
http://slidepdf.com/reader/full/overlooked-and-undercounted-the-struggle-to-make-ends-meet-in-new-york-city 86/108
74 | OVERLOOKED AND UNDERCOUNTED
APPENDIX B - TABLE 1 CONTINUED. The Self-Sufciency Standard and Federal Poverty Level by Select Characteristics of Householder1: New York City 2012
TOTAL PERCENT OF
HOUSEHOLDS
BELOW SELF-SUFFICIENCY STANDARD ABOVE
SELF-SUFFICIENCY
STANDARDBELOW STANDARD
AND
BELOW POVERTY
BELOW STANDARD
AND
ABOVE POVERTY
TOTAL BELOW
STANDARD
Number Percentof Total
Number Percentof Total
Number Percentof Total
Number Percentof Total
Total Households 2,235,018 100.0% 367,776 16.5% 574,080 26.1% 941,856 42.1% 1,283,367 57. 4%
ADDITIONAL SELECT CHARACTERISTICS
MARITAL STATUS OF HOUSEHOLDER
Married 946,430 42.3% 123,353 13.0% 247,269 26.1% 370,622 39.2% 575,808 60.8%
Widowed 50,134 2.2% 11,672 23.3% 16,318 32.5% 27,990 55.8% 22,144 44.2%
Divorced 248,420 11.1% 39,185 15.8% 70,044 28.2% 109,229 44.0% 139,191 56.0%
Separated 118,187 5.3% 34,045 28.8% 37,638 31.8% 71,683 60.7% 46,504 39.3%
Never Married 871,847 39.0% 159,521 18.3% 202,811 23.3% 362,332 41.6% 509,515 58.4%
AGE OF HOUSEHOLDER
18-24 89,258 4.0% 29,210 32.7% 29,306 32.8% 58,516 65.6% 30,742 34.4%
25-34 543,382 24.3% 81,636 15.0% 129,012 23.7% 210,648 38.8% 332,734 61.2%
35-44 587,102 26.3% 104,933 17.9% 151,853 25.9% 256,786 43.7% 330,316 56.3%
45-54 558,940 25.0% 84,622 15.1% 149,922 26.8% 234,544 42.0% 324,396 58.0%
55-64 456,336 20.4% 67,375 14.8% 113,987 25.0% 181,362 39.7% 274,974 60.3%
HOUSEHOLD TYPE BY MULTI-GENERATIONAL HOUSEHOLD
Not multi-generational 2,125,321 95.1% 345,072 16.2% 529,959 24.9% 875,031 41.2% 1, 250,290 58.8%
Multi-generational 109,697 4.9% 22,704 20.7% 44,121 40.2% 66,825 60.9% 42,872 39.1%
Married Couple 55,590 2.5% 7,252 13.0% 21,730 39.1% 28,982 52.1% 26,608 47.9%
Male householder, no spousepresent
6,539 0.3% * * 2,563 39.2% 3,504 53.6% 3,035 46.4%
Female householder, no
spouse present
47,568 2.1% 14,511 30.5% 19,828 41.7% 34,339 72.2% 13,229 27.8%
HEALTH INSURANCE COVERAGE OF HOUSEHOLDER
With health insurance coverage 1,874,984 83.9% 283,004 15.1% 424,474 22.6% 707,478 37.7% 1,167,506 62.3%
Without health insurancecoverage
360,034 16.1% 84,772 23.5% 149,606 41.6% 234,378 65.1% 125,656 34.9%
MILITARY STATUS OF HOUSEHOLDER
On active duty now or duringthe last 12 months
2,836 0.1% * * 1,113 39.2% 1,292 45.6% 1,544 54.4%
On active duty in the past, butnot during the last 12 months
38,294 1.7% 3,796 9.9% 8,328 21.7% 12,124 31.7% 26,170 68.3%
Training for Reserves/NationalGuard only
12,109 0.5% 1,552 12.8% 2,173 17.9% 3,725 30.8% 8,384 69.2%
Never served in the military 2,181,779 97.6% 362,249 16.6% 562,466 25.8% 924,715 42.4% 1,257, 064 57.6%
1 The householder is th e person (or one of the person s) in whose name the ho using unit is owned or rented or, if there is no such person, any adult member, excluding roomers, boarders, or paid
employees.
2 Latino refers to Hispanic/Latino eth nicity, regardless of race.
3 A non-family household is a person m aintaining a household while living alon e or with nonrelatives only.
4 A family household is a househ old maintained by a family, dened as a group of two or more persons (one of wh om is the househ older) residing together and related by birth, marriage, oradoption; family households include any unrelated persons who reside in the household.
5 This category can also include households with full-time workers.
*The data in this report is based on a 1% sample of households. Th us a value of a 1,000 households indicates that the act ual underlying observations would be around 10 households.
Therefore, values less than 1,000 are notated with an asterisk to indicate caution as underlying obser vations are small.
Source: U.S. Cen sus Bureau, 2012 American Commu nity Survey.

8/10/2019 Overlooked and Undercounted: The Struggle to Make Ends Meet in New York City.
http://slidepdf.com/reader/full/overlooked-and-undercounted-the-struggle-to-make-ends-meet-in-new-york-city 87/108
NEW YORK CITY | 75
APPENDIX B - TABLE 2. Top 20 Occupations1 of Householders2: New York City 2012
BELOW THE SELF-SUFFICIENCY STANDARD ABOVE THE SELF-SUFFICIENCY STANDARD
RANK OCCUPATION Total
number of
workers
Pe rc ent Cumulat ive
Percent
Median
Earnings
RANK OCCUPATION Total
number of
workers
Pe rcen t Cumulat ive
Percent
Median
Earnings
Total 792,003 $20,000 TOTAL 1,252,315 $62,000
1 Nursing, psychiatric,and home health aides 60,174 8% 8% $17,500 1 Managers, all ot her 42,427 3% 3% $85,000
2Janitors and buildingcleaners
29,039 4% 11% $16,000 2Elementary and middleschool teachers
37,710 3% 6% $70,000
3 Childcare workers 26,765 3% 15% $10,000 3Secretaries andadministrative assistants
35,643 3% 9% $50,000
4 Cashiers 23,413 3% 18% $12,500 4Accountants andauditors
35,605 3% 12% $80,000
5Maids andhousekeeping cleaners
21,587 3% 20% $13,300 5 Lawyers 34,285 3% 15% $152,000
6 Retail salespersons 21,432 3% 23% $19,400 6 Registered nurses 27,561 2% 17% $80,000
7 Construction laborers 19,925 3% 26% $20,000 7 Designers 24,283 2% 19% $68,000
8Secretaries andadministrative
assistants
19,470 2% 28% $22,000 8Nursing, psychiatric, and
home health aides
23,182 2% 21% $35,000
9Taxi drivers andchauffeurs
18,148 2% 30% $20,000 9 Postsecondary teachers 20,856 2% 22% $66,000
10 Waiters and waitresses 17,141 2% 32% $15,000 10 Physicians and surgeons 20,543 2% 24% $100,000
11 Personal care aides 16,456 2% 35% $17,000 11Janitors and buildingcleaners
20,374 2% 26% $40,500
12 Cooks 14,180 2% 36% $17,000 12 Financial managers 19,875 2% 27% $116,000
13Security guards andgaming surveillanceofcers
13,839 2% 38% $23,000 13 Chief executives 18,529 1% 29% $150,000
14Driver/sales workersand truck drivers
13,350 2% 40% $23,000 14First-line supervisors ofretail sales workers
17,875 1% 30% $55,000
15First-line supervisors ofretail sales workers
13,226 2% 41% $21,000 15 Retail salespersons 17,377 1% 32% $50,000
16 Teacher as si stants 12,997 2% 43% $21,000 16 Social workers 15,739 1% 33% $52,000
17 Ofce clerks, general 11, 479 1% 45% $19,000 17Securities, commodities,and nancial servicessales agents
15,461 1% 34% $125,000
18Customer servicerepresentatives
11,083 1% 46% $20,000 18
First-line supervisorsof ofce andadministrative supportworkers
14,443 1% 35% $54,000
19 Chefs and head cooks 10,815 1% 47% $20,800 19General and operationsmanagers
13,570 1% 36% $80,000
20 Designers 8,476 1% 48% $20,000 20 Education administrators 13,359 1% 37% $85,000
1 Detailed occupations are based on the Standard Occupational Classi cation (SOC). For denitions of th ese occupations see th e Bureau of Labor
Statistics Standard Occu pation Classications at http://www.bls.gov/soc/soc_majo.htm2 The househ older is the person (or one of the perso ns) in whose name the h ousing unit is owned or rented or, if there is no suc h person, any adult member, excluding roomers, boarders, or paid
employees.

8/10/2019 Overlooked and Undercounted: The Struggle to Make Ends Meet in New York City.
http://slidepdf.com/reader/full/overlooked-and-undercounted-the-struggle-to-make-ends-meet-in-new-york-city 88/108
76 | OVERLOOKED AND UNDERCOUNTED
APPENDIX B - TABLE 3. Top 20 Occupations1 of Householders2 by Gender: New York City 2012
BELOW THE SELF-SUFFICIENCY STANDARD
MALE HOUSEHOLDERS FEMALE HOUSEHOLDERS
RANK Occupations Percent Median
Earnings
RANK Occupations Percent Median
Earnings
TOTAL $20,000 TOTAL $18,000
1 Construction laborers 6% $20,000 1 Nursing, psychiatric, and home health aides 13% $18,000
2 Taxi drivers and chauffeurs 5% $20,000 2 Childcare workers 6% $10,000
3 Janitors and building cleaners 5% $19,000 3 Maids and housekeeping cleaners 4% $12,700
4 Driver/sales workers and truck drivers 4% $23,000 4 Secretaries and administrative assistants 4% $23,400
5 Cooks 3% $18,000 5 Cashiers 4% $12,000
6 Retail salespersons 3% $19,000 6 Personal care aides 4% $17,000
7 Chefs and head cooks 3% $20,800 7 Janitors and building cleaners 3% $10,400
8Security guards and gaming surveillanceofcers
2% $24,000 8 Retail salespersons 3% $20,000
9 First-line supervisors of retail sales workers 2% $23,800 9 Teacher assistants 2% $22,000
10 Cashiers 2% $16,800 10 Waiters and waitresses 2% $14,000
11 Waiters and waitresses 2% $16,000 11 Ofce clerks, general 2% $19,000
12 Painters, construction and maintenance 2% $18,000 12 Customer service representatives 2% $20,600
13Laborers and freight, stock, and materialmovers, hand
2% $18,000 13 Receptionists and information clerks 2% $20,000
14 Carpenters 2% $20,000 14 Hairdressers, hairstylists, and cosmetologists 2% $13,000
15 Designers 2% $26,000 15 Social workers 1% $31,500
16 Managers, all other 1% $35,000 16 First-line supervisors of retail sales workers 1% $19,200
17Sales representatives, wholesale andmanufacturing
1% $24,000 17Security guards and gaming surveillanceofcers
1% $22,000
18 Food preparation workers 1% $16,600 18 Elementary and middle school teachers 1% $12,600
19 Nursing, psychiatric, and home health aides 1% $13,000 19 Bookkeeping, accounting, and auditing clerks 1% $24,000
20 Stock clerks and order llers 1% $20,000 20 Packers and packagers, hand 1% $21,000
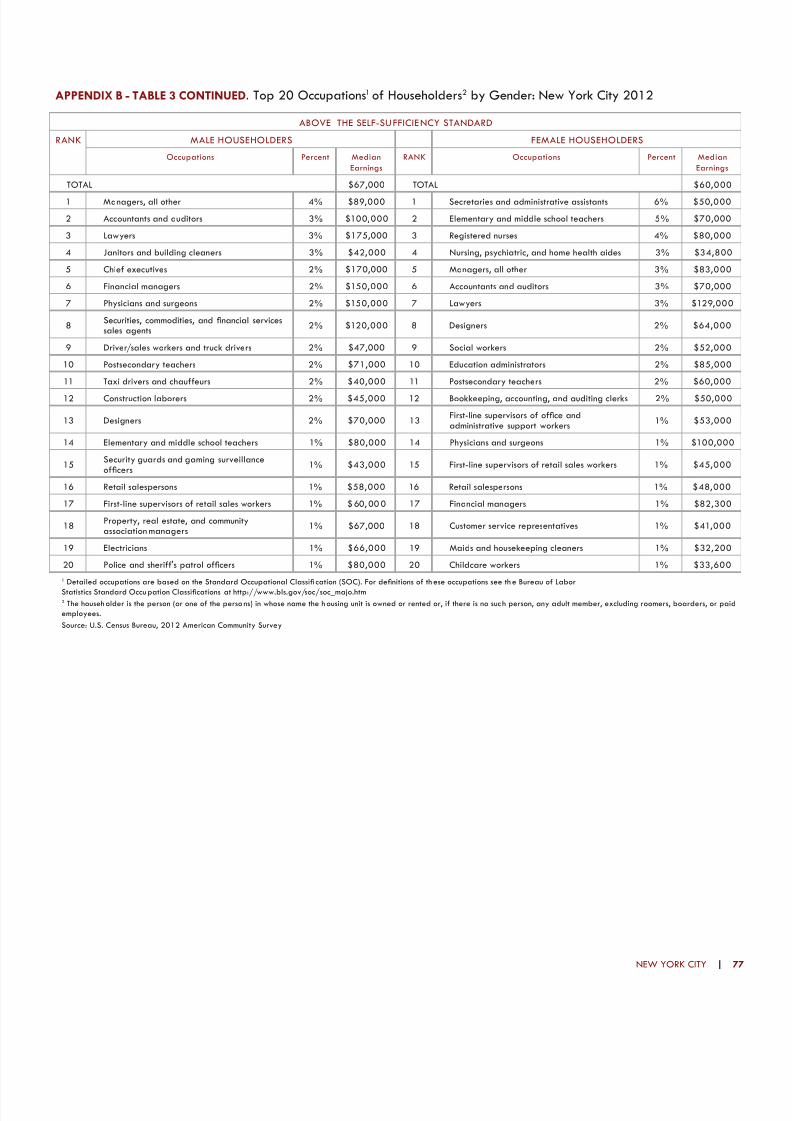
8/10/2019 Overlooked and Undercounted: The Struggle to Make Ends Meet in New York City.
http://slidepdf.com/reader/full/overlooked-and-undercounted-the-struggle-to-make-ends-meet-in-new-york-city 89/108
NEW YORK CITY | 77
APPENDIX B - TABLE 3 CONTINUED. Top 20 Occupations1 of Householders2 by Gender: New York City 2012
ABOVE THE SELF-SU FFICIE NCY STANDARD
RANK MALE HOUSEHOLDERS FEMALE HOUSEHOLDERS
Occupations Percent Median
Earnings
RANK Occupations Percent Median
Earnings
TOTAL $67,000 TOTAL $60,000
1 Managers, all other 4% $89,000 1 Secretaries and administrative assistants 6% $50,000
2 Accountants and auditors 3% $100,000 2 Elementary and middle school teachers 5% $70,000
3 Lawyers 3% $175,000 3 Registered nurses 4% $80,000
4 Janitors and building cleaners 3% $42,000 4 Nursing, psychiatric, and home health aides 3% $34,800
5 Chief executives 2% $170,000 5 Managers, all other 3% $83,000
6 Financial managers 2% $150,000 6 Accountants and auditors 3% $70,000
7 Physicians and surgeons 2% $150,000 7 Lawyers 3% $129,000
8Securities, commodities, and nancial servicessales agents
2% $120,000 8 Designers 2% $64,000
9 Driver/sales workers and truck drivers 2% $47,000 9 Social workers 2% $52,000
10 Postsecondary teachers 2% $71,000 10 Education administrators 2% $85,000
11 Taxi drivers and chauffeurs 2% $40,000 11 Postsecondary teachers 2% $60,000
12 Construction laborers 2% $45,000 12 Bookkeeping, accounting, and auditing clerks 2% $50,000
13 Designers 2% $70,000 13First-line supervisors of ofce andadministrative support workers
1% $53,000
14 Elementary and middle school teachers 1% $80,000 14 Physicians and surgeons 1% $100,000
15Security guards and gaming surveillanceofcers
1% $43,000 15 First-line supervisors of retail sales workers 1% $45,000
16 Retail salespersons 1% $58,000 16 Retail salespersons 1% $48,000
17 First-line supervisors of retail sales workers 1% $ 60, 00 0 17 Financial managers 1% $82,300
18Property, real estate, and communityassociation managers
1% $67,000 18 Customer service representatives 1% $41,000
19 Electricians 1% $66,000 19 Maids and housekeeping cleaners 1% $32,200
20 Police and sheriff's patrol ofcers 1% $80,000 20 Childcare workers 1% $33,600
1 Detailed occupations are based on the Standard Occupational Classi cation (SOC). For denitions of th ese occupations see th e Bureau of Labor
Statistics Standard Occu pation Classications at http://www.bls.gov/soc/soc_majo.htm2 The househ older is the person (or one of the perso ns) in whose name the h ousing unit is owned or rented or, if there is no suc h person, any adult member, excluding roomers, boarders, or paidemployees.
Source: U.S. Census Bureau, 2012 American Community Survey

8/10/2019 Overlooked and Undercounted: The Struggle to Make Ends Meet in New York City.
http://slidepdf.com/reader/full/overlooked-and-undercounted-the-struggle-to-make-ends-meet-in-new-york-city 90/108
78 | OVERLOOKED AND UNDERCOUNTED
APPENDIX B - TABLE 4. Top 20 Occupations1 of Householders2 by Race/Ethnicity: New York City 2012
BELOW THE SELF-SUFFICIENCY STANDARD
RANK WHITE HOUSEHOLDERS RANK NON-WHITE HOUSEHOLDERS
Occupations Percent Median
Earnings
Occupations Percent Median
Earnings
TOTAL $20,000 TOTAL $19,000
1 Secretaries and administrative assistants 4% $17,000 1 Nursing, psychiatric, and home health aides 4% $17,000
2 Nursing, psychiatric, and home health aides 3% $19,200 2 Janitors and building cleaners 4% $16,000
3 Retail salespersons 3% $28,600 3 Childcare workers 3% $9,400
4 Designers 2% $21,000 4 Cashiers 3% $12,000
5 Elementary and middle school teachers 2% $13,200 5 Maids and housekeeping cleaners 3% $13,300
6 Teacher assistants 2% $14,000 6 Taxi drivers and chauffeurs 3% $20,000
7 Waiters and waitresses 2% $14,000 7 Construction laborers 2% $20,000
8 Ofce clerks, general 2% $18,000 8 Retail salespersons 2% $18,000
9 Other teachers and instructors 2% $17,000 9 Personal care aides 2% $17,900
10 Construction laborers 2% $15,000 10 Waiters and waitresses 2% $15,000
11 First-line supervisors of retail sales workers 2% $32,000 11 Cooks 2% $17,000
12 Cashiers 2% $19,500 12 Secretaries and administrative assistants 2% $24,30013 Real estate brokers and sales agents 2% $25,000 13 Driver/sales workers and truck drivers 2% $23,000
14Sales representatives, wholesale andmanufacturing
2% $30,000 14Security guards and gaming surveillanceofcers
2% $23,000
15 Childcare workers 2% $13,000 15 First-line supervisors of retail sales workers 1% $19,200
16 Janitors and building cleaners 2% $13,200 16 Chefs and head cooks 1% $20,800
17 Managers, all other 2% $23,000 17 Customer service representatives 1% $18,600
18 Lawyers 1% $26,200 18 Teacher assistants 1% $22,800
19 Postsecondary teachers 1% $20,000 19 Ofce clerks, general 1% $19,000
20 Receptionists and information clerks 1% $18,000 20 Hairdressers, hairstylists, and cosmetologists 1% $13,000

8/10/2019 Overlooked and Undercounted: The Struggle to Make Ends Meet in New York City.
http://slidepdf.com/reader/full/overlooked-and-undercounted-the-struggle-to-make-ends-meet-in-new-york-city 91/108
NEW YORK CITY | 79
APPENDIX B - TABLE 4 CONTINUED. Top 20 Occupations1 of Householders2 by Race/Ethnicity: New York City 2012
ABOVE THE SELF-SUFFICIENCY STANDARD
RANK WHITE HOUSEHOLDERS RANK NON-WHITE HOUSEHOLDERS
Occupations Percent Median
Earnings
Occupations Percent Median
Earnings
TOTAL $74,000 TOTAL $55,000
1 Managers, all other 4% $88,000 1 Nursing, psychiatric, and home health aides 19,961 $35,000
2 Lawyers 4% $160,000 2 Registered nurses 19,054 $80,000
3 Elementary and middle school teachers 3% $70,000 3 Secretaries and administrative assistants 18, 618 $47,000
4 Accountants and auditors 3% $96,000 4 Accountants and auditors 17,157 $70,000
5 Secretaries and administrative assistants 3% $55,000 5 Elementary and middle school teachers 16,456 $71,000
6 Designers 3% $68,000 6 Managers, all other 15,048 $72,000
7 Postsecondary teachers 2% $68,000 7 Janitors and building cleaners 14,736 $40,000
8 Chief executives 2% $140,000 8 Social workers 10,924 $50,000
9 Financial managers 2% $166,000 9 Physicians and surgeons 10,035 $80,000
10Securities, commodities, and nancial servicessales agents
2% $125,000 10Security guards and gaming surveillanceofcers
9,844 $40,000
11 Physicians and surgeons 2% $150,000 11 Taxi drivers and chauffeurs 9,755 $40,000
12 Editors 2% $80,000 12 First-line supervisors of retail sales workers 9,153 $52,000
13 Management analysts 2% $121,000 13First-line supervisors of ofce andadministrative support workers
9,069 $52,000
14 Retail salespersons 2% $58,000 14 Driver/sales workers and truck drivers 9,015 $43,100
15 First-line supervisors of retail sales workers 1% $58,000 15 Financial managers 8,982 $85,000
16 Producers and directors 1% $70,000 16 Police and sheriff's patrol ofcers 8,501 $76,000
17 Registered nurses 1% $80,000 17 Customer service representatives 8,152 $36,000
18 General and operations managers 1% $81,000 18 Retail salespersons 8,006 $37,600
19 Education administrators 1% $92,000 19 Construction laborers 7,899 $43,200
20 First-line supervisors of non-retail sales workers 1% $10 0, 00 0 20 Maids and housekeeping cleaners 7,691 $37,000
1 Detailed occupations are based on the Standard Occupational Classication (SOC) . For denitions of these occupations see the B ureau of Labor
Statistics Standard Occu pation Classications at http://www.bls.gov/soc/soc_majo.htm2 The househ older is the person (or one of the perso ns) in whose name the h ousing unit is owned or rented or, if there is no suc h person, any adult member, excluding roomers, boarders, or paid
employees.
Source: U.S. Cen sus Bureau, 2012 American Commu nity Survey.

8/10/2019 Overlooked and Undercounted: The Struggle to Make Ends Meet in New York City.
http://slidepdf.com/reader/full/overlooked-and-undercounted-the-struggle-to-make-ends-meet-in-new-york-city 92/108
80 | OVERLOOKED AND UNDERCOUNTED
APPENDIX B - TABLE 5. Median Hourly Pay Rate of Working Householders1 byGender, Household Status, Presence of Children, and Race/Ethnicity: New York City 2012
TOTAL HOUSEHOLDS TOTAL BELOW SELF-SUFFICIENCY
STANDARD
TOTAL ABOVE SELF-SUFFICIENCY
STANDARD
Median Median Median
Number Missing2 Hourly
PayRate
Annual
HoursWorked
Number Missing2 Hourly
PayRate
Annual
HoursWorked
Number Missing2 Hourly
PayRate
Annual
HoursWorked
All Householders 2,235,018 -- -- -- 941,856 -- -- -- 1,283,367 -- -- --
Working Householders 1,903,335 331, 683 $20.98 2,080 686,983 254,873 $10.58 1,976 1,216,352 76,810 $28.85 2,080
GENDER
MALE 976,535 116,388 $22.20 2,080 322,384 83,974 $10.58 2,080 654,151 32,414 $29.72 2,080
FEMALE 926,800 215,295 $19.40 2,080 364,599 170,899 $10.58 1,820 562,201 44,396 $27.47 2,080
HOUSEHOLD TYPE
FAMILY HOUSEHOLDS
Married couple 73 7, 259 117,970 $21.63 2,080 249,440 73,453 $11.06 2,080 487,819 44,517 $29.67 2,080
Male householder,no spouse present 119,468 20,908 $16.35 2,080 56,024 15,789 $10.30 2,080 63,444 5,119 $24.04 2,080
Female householder,no spouse present
333,008 90,498 $15.02 1,976 200,494 82,776 $10.99 1,820 132,514 7,722 $25.00 2,080
NON-FAMILY HOUSEHOLDS
Male householder 361,352 50,940 $24.04 2,080 85,386 40,978 $9.62 1,920 275,966 9,962 $29.12 2,080
Female householder 352, 248 51,367 $24.48 2,080 95,639 41,877 $10.02 1,560 256,609 9,490 $28.85 2,080
CHILDREN
CHILDREN PRESENT 702, 731 137,172 $17. 31 2,080 383,613 114,288 $11.28 2,080 319,118 22,884 $30.77 2,080
NO CHILDREN PRESENT 1, 20 0, 604 194, 511 $23. 08 2, 080 303,370 140,585 $10.00 1,820 897,234 53,926 $27.88 2,080
RACE/ETHNICITY
WHITE 759,663 93,977 $27.78 2,080 151, 543 57,023 $11.54 1,760 608,120 36,954 $32.05 2,080
NON-WHITE 1,143 ,672 23 7, 70 6 $17. 03 2,080 535,440 197,850 $10.38 2,080 608,232 39,856 $25.96 2,080
1 The house holder is the person (or one of th e persons) in whose name th e housing unit is owned or rented or, if there is no su ch person, the hou seholder is any adult member, excluding roomers,boarders, or paid employees.2 Missing indicates the n umber of non-working hous eholders excluded from the calculation of median hourly pay rate.
Source: U.S. Cen sus Bureau, 2012 American Commu nity Survey.

8/10/2019 Overlooked and Undercounted: The Struggle to Make Ends Meet in New York City.
http://slidepdf.com/reader/full/overlooked-and-undercounted-the-struggle-to-make-ends-meet-in-new-york-city 93/108
NEW YORK CITY | 8
APPENDIX B - TABLE 6. Total and Percent of Households or Householders with Incomes Below theSelf-Sufciency Standard in Seven States1
HOUSEHOLD TYPE
CALIFORNIA 2012 COLORADO 2000 CONNECTICUT 2000 MISSISSIPPI 2007
Total Below
Standard
% Below
Standard
Total Below
Standard
% Below
Standard
Total Below
Standard
% Below
Standard
Total Below
Standard
% Below
Standard
TOTAL HOUSEHOLDS IN STATE 3,485,951 38.3% 252,850 20.5% 167,632 19.0% 236,215 31.8%
RACE AND ETHNICITY OF HOUSEHOLDER2
Asian 440,810 31.9% 7,551 27.1% 6,067 26.3% 3,034 39.1%
Black 271,433 46.1% 15,811 34.2% 29,263 38.8% 128,953 49.0%
Latino3 1,706,986 59.5% 63,657 42.7% 33,455 50.5% 5,773 48.2%
White 1,028,558 24.7% 159,856 16.1% 96,958 13.6% 97,049 21.3%
Other4 38,164 41.0% ** ** ** ** 1,406 29.7%
CITIZENSHIP STATUS OF HOUSEHOLDER
Native-born 1,447,508 46.1% 213,207 18.8% 139,143 18.0% 229,171 31.5%
Foreign born 1,421,315 23.2% 39,643 40.2% 28,489 27.0% 7,044 43.0%
ENGLISH SPEAKING ABILITY
Very well 2,249,867 30.9% ** ** 141,463 17.0% ** **
Less than very well 1,236,084 68.1% ** ** 26,169 45.0% ** **
EDUCATIONAL ATTAINMENT
Less than high school 973,454 77.1% 53,145 50.8% 40,510 45.9% 58,507 55.3%
High school diploma 791,058 53.0% 65,438 27.4% 56,215 25.6% 85,561 37.3%
Some college or Associate’s degree 1,141,760 38.8% 88,672 21.2% 43,039 18.2% 72,364 29.9%
Bachelor’s degree or higher 579,679 17.1% 45,595 9.6% 27,868 8.3% 19,783 11.9%
GENDER OF HOUSEHOLDER
Male 1,666,064 33. 4% 141,755 16.6% 79,499 14.0% 86,542 21.6%
Female 1,819,887 44.3% 111,095 29.4% 88,133 29.0% 149,673 43.6%
NUMBER OF CHILDREN IN HOUSEHOLD
No children 1,386,495 27.9% 101,615 14.2% 60,152 12.0% 98,688 25.5%
1 or more 2,099,456 51.0% 151,235 29.2% 107,480 27.0% 137,527 38.5%AGE OF YOUNGEST CHILD
Less than 6 yrs 1,136,228 59.8% 92,946 39.0% 64,280 36.0% 76,543 47.3%
6 to 17 yrs 963,228 43.4% 58,289 20.9% 43,200 20.0% 60,984 31.2%
HOUSEHOLD TYPE AND NUMBER OF CHILDREN
Married couple5 1,536,348 32.9% 162,033 17.1% 64,390 12.7% 69,777 18.3%
No children 357,173 18.9% 60,015 11.5% 11,747 5.5% 22,517 13.4%
1 or more 1,179,175 42.4% 102,018 23.9% 52,643 18.1% 47,260 22.3%
Male householder, no spouse present 726,471 37.0% ** ** 8,984 27.8% 47,014 32.4%
No children 484,715 31.0% ** ** 1,886 14.0% 35,689 30.6%
1 or more 241,756 60.8% ** ** 7,098 37.7% 11,325 39.7%
Female househo lder, no spouse present 1,223,132 49.7% 90,817 31.8% 52,072 48.6% 119,424 54.7%
No children 544,607 35.8% 41,600 21.4% 5,081 18.4% 40,482 39.8%
1 or more 678,525 72.0% 49,217 54.1% 46,991 59.1% 78,942 67.8%
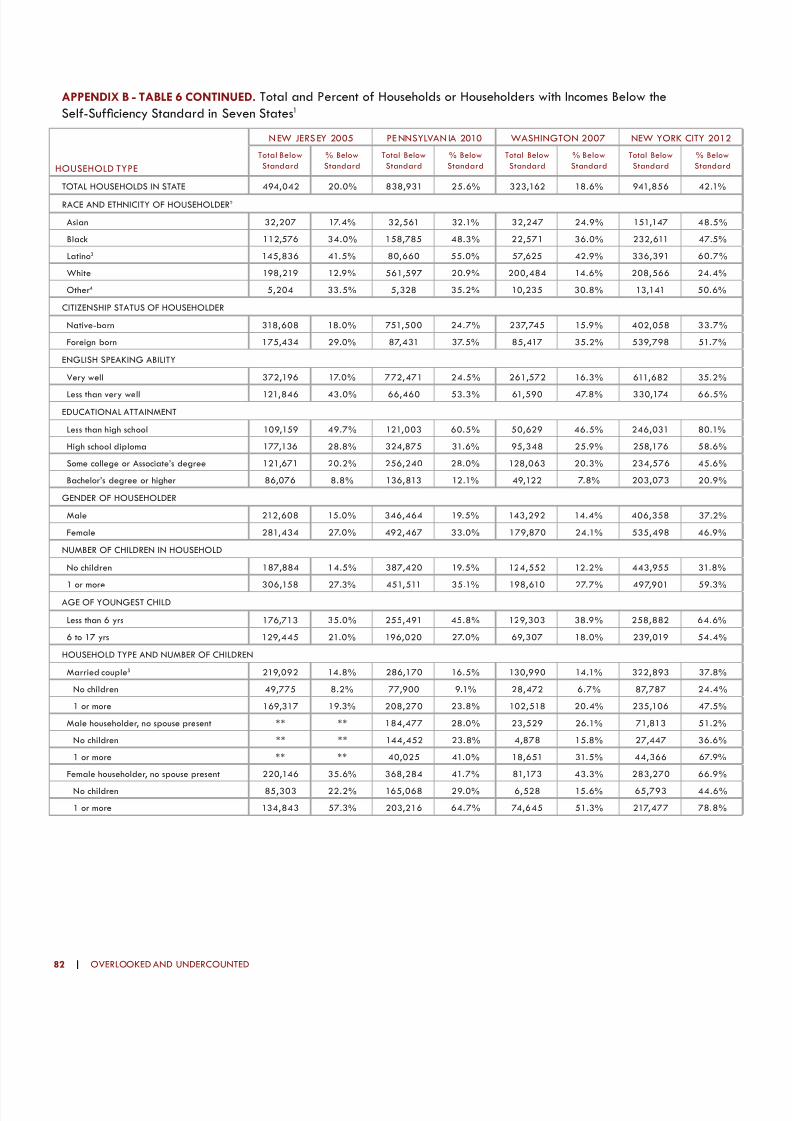
8/10/2019 Overlooked and Undercounted: The Struggle to Make Ends Meet in New York City.
http://slidepdf.com/reader/full/overlooked-and-undercounted-the-struggle-to-make-ends-meet-in-new-york-city 94/108
82 | OVERLOOKED AND UNDERCOUNTED
APPENDIX B - TABLE 6 CONTINUED. Total and Percent of Households or Householders with Incomes Below theSelf-Sufciency Standard in Seven States1
HOUSEHOLD TYPE
N EW JERS EY 2005 PE NNSYLVAN IA 2010 WASHINGTON 2007 NEW YORK CITY 2012
Total Below
Standard
% Below
Standard
Total Below
Standard
% Below
Standard
Total Below
Standard
% Below
Standard
Total Below
Standard
% Below
Standard
TOTAL HOUSEHOLDS IN STATE 494,042 20.0% 838,931 25.6% 323,162 18.6% 941,856 42.1%
RACE AND ETHNICITY OF HOUSEHOLDER2
Asian 32,207 17.4% 32,561 32.1% 32,247 24.9% 151,147 48.5%
Black 112,576 34.0% 158,785 48.3% 22,571 36.0% 232,611 47.5%
Latino3 145,836 41.5% 80,660 55.0% 57,625 42.9% 336,391 60.7%
White 198,219 12.9% 561,597 20.9% 200,484 14.6% 208,566 24.4%
Other4 5,204 33.5% 5,328 35.2% 10,235 30.8% 13,141 50.6%
CITIZENSHIP STATUS OF HOUSEHOLDER
Native-born 318,608 18.0% 751,500 24.7% 237,745 15.9% 402,058 33.7%
Foreign born 175,434 29.0% 87,431 37.5% 85,417 35.2% 539,798 51.7%
ENGLISH SPEAKING ABILITY
Very well 372,196 17.0% 772,471 24.5% 261,572 16.3% 611,682 35.2%
Less than very well 121,846 43.0% 66,460 53.3% 61,590 47.8% 330,174 66.5%
EDUCATIONAL ATTAINMENT
Less than high school 109,159 49.7% 121,003 60.5% 50,629 46.5% 246,031 80.1%
High school diploma 177,136 28.8% 324,875 31.6% 95,348 25.9% 258,176 58.6%
Some college or Associate’s degree 121,671 20.2% 256,240 28.0% 128,063 20.3% 234,576 45.6%
Bachelor’s degree or higher 86,076 8.8% 136,813 12.1% 49,122 7.8% 203,073 20.9%
GENDER OF HOUSEHOLDER
Male 212,608 15.0% 346,464 19.5% 143,292 14.4% 406,358 37.2%
Female 281,434 27.0% 492,467 33.0% 179,870 24.1% 535,498 46.9%
NUMBER OF CHILDREN IN HOUSEHOLD
No children 187,884 14.5% 387,420 19.5% 124,552 12.2% 443,955 31.8%
1 or more 306,158 27.3% 451,511 35.1% 198,610 27.7% 497,901 59.3%AGE OF YOUNGEST CHILD
Less than 6 yrs 176,713 35.0% 255,491 45.8% 129,303 38.9% 258,882 64.6%
6 to 17 yrs 129,445 21.0% 196,020 27.0% 69,307 18.0% 239,019 54.4%
HOUSEHOLD TYPE AND NUMBER OF CHILDREN
Married couple5 219,092 14.8% 286,170 16.5% 130,990 14.1% 322,893 37.8%
No children 49,775 8.2% 77,900 9.1% 28,472 6.7% 87,787 24.4%
1 or more 169,317 19.3% 208,270 23.8% 102,518 20.4% 235,106 47.5%
Male householder, no spouse present ** ** 184,477 28.0% 23,529 26.1% 71,813 51.2%
No children ** ** 144,452 23.8% 4,878 15.8% 27,447 36.6%
1 or more ** ** 40,025 41.0% 18,651 31.5% 44,366 67.9%
Female householder, no spouse present 220,146 35.6% 368,284 41.7% 81,173 43.3% 283,270 66.9%
No children 85,303 22.2% 165,068 29.0% 6,528 15.6% 65,793 44.6%
1 or more 134,843 57.3% 203,216 64.7% 74,645 51.3% 217,477 78.8%

8/10/2019 Overlooked and Undercounted: The Struggle to Make Ends Meet in New York City.
http://slidepdf.com/reader/full/overlooked-and-undercounted-the-struggle-to-make-ends-meet-in-new-york-city 95/108
NEW YORK CITY | 83
APPENDIX B - TABLE 6 CONTINUED. Total and Percent of Households or Householders with Incomes Below theSelf-Sufciency Standard in Seven States1
HOUSEHOLD TYPE
CALIFORNIA 2012 COLORADO 2000 CONNECTICUT 2000 MISSISSIPPI 2007
Total Below
Standard
% Below
Standard
Total Below
Standard
% Below
Standard
Total Below
Standard
% Below
Standard
Total Below
Standard
% Below
Standard
TOTAL HOUSEHOLDS IN STATE 2,868,823 31.0% 252,850 20.5% 167,632 19.0% 236,215 31.8%
HOUSEHOLD TYPE BY RACE AND ETHNICITY6
Households without children 1,386 ,495 27.9% 101,615 14.2% 60,152 12.3% 98,688 25.5%
Married couple ormale householder, no spouse present
841,888 24.4% 60,015 11.5% 33,123 9.5% 58,206 20.4%
Asian/Pacic Islander 130,992 24.8% 1,780 15.8% 2,007 21.4% ** **
Black 59,911 31.3% 2,543 17.0% 4,256 21.4% 24,602 32.9%
Latino 290,133 37.6% 10,144 22.9% 4,447 26.4% ** **
White 351,530 18.3% 43,777 9.9% 21,839 7.3% 30,854 15.3%
Native American ** ** 1,335 22.5% ** ** ** **
Other 9,322 24.6% ** ** ** ** 2,750 29.8%
Female householder, no spouse present 544,607 35.8% 41,600 21.4% 27,029 19.0% 40,482 39.8%
Asian/Pacic Islander 82,731 35.5% 1,405 36.3% 1,079 34.8% ** **
Black 66,676 45.0% 2,048 25.5% 4,178 26.3% 22,527 50.1%
Latina 142,767 46.6% 5,741 34.5% 3,979 46.9% ** **
White 245,226 30.1% 31,490 19.4% 17,545 15.4% 16,738 31.1%
Native American ** ** 787 30.1% ** ** ** **
Other 7,207 42.1% ** ** ** ** 1,217 41.2%
Households with children 2,099,456 51.0% 151,235 29.2% 107,480 27.4% 137,527 38.5%
Married couple ormale householder, no spouse present
1,420,931 44.7% 102,018 23.9% 60,306 19.3% 58,585 24.3%
Asian/Pacic Islander 172,807 32.7% 3,270 29.4% 2,698 27.0% ** **
Black 57,936 43.6% 4,847 34.5% 6,783 35.2% 22,849 35.2%
Latino 879,453 66.5% 33,952 49.0% 10,895 46.8% ** **
White 297,849 25.5% 57,770 17.7% 39,196 15.2% 31,162 18.8%
Native American ** ** 1,717 39.6% ** ** ** **
Other 12,886 48.7% ** ** ** ** 4,574 47.8%
Female householder, no spouse present 678,525 72.0% 49,217 54.1% 47,174 58.9% 78,942 67.8%
Asian/Pacic Islander 54,280 59.5% 1,096 67.0% 283 42.7% ** **
Black 86,910 75.0% 6,373 70.0% 14,046 69.2% 58,975 75.3%
Latina 394,633 84.0% 13,820 72.8% 14,134 80.2% ** **
White 133,953 52.8% 26,819 45.2% 18,378 45.3% 18,295 51.6%
Native American ** ** 925 56.8% ** ** ** **
Other 8,749 75.4% ** ** ** ** 1,672 61.0%
NUMBER OF WORKERS IN HOUSEHOLD
Two or more workers 1,319,884 28.4% 82,656 12.1% 47,291 9.5% 64,403 17.3%
One worker 1,671,247 43.6% 133,363 26.9% 84,119 24.8% 132,571 40.8%
No workers 494,820 79.8% 36,831 68.1% 36,222 77.6% 39,241 83.3%

8/10/2019 Overlooked and Undercounted: The Struggle to Make Ends Meet in New York City.
http://slidepdf.com/reader/full/overlooked-and-undercounted-the-struggle-to-make-ends-meet-in-new-york-city 96/108
84 | OVERLOOKED AND UNDERCOUNTED
APPENDIX B - TABLE 6 CONTINUED. Total and Percent of Households or Householders with Incomes Below theSelf-Sufciency Standard in Seven States1
HOUSEHOLD TYPE
NEW JERSEY 2005 WASHINGTON 2007 PENNSYLVANIA 2010 NEW YORK CITY 2012
Total Below
Standard
% Below
Standard
Total Below
Standard
% Below
Standard
Total Below
Standard
% Below
Standard
Total Below
Standard
% Below
Standard
TOTAL HOUSEHOLDS IN STATE 494,042 20.0% 323,162 18.6% 838,931 25.6% 941,856 42.1%
HOUSEHOLD TYPE BY RACE AND ETHNICITY6
Households without children 187,884 14.5% 124,552 12.2% 387,420 19.5% 443,955 31.8%
Married couple ormale householder, no spouse present
49,775 8.2% 75,121 10.0% 222,352 15.7% 241,444 28.6%
Asian/Pacic Islander 4,813 8.5% 6,842 13.5% 11,048 26.5% 48,330 38.2%
Black 5,071 9.9% 5,331 21.8% 28,496 29.9% 48,603 33.2%
Latino 11,724 19.2% 7,678 18.3% 12,176 31.6% 68,680 40.8%
White 27,399 6.3% 52,963 8.6% 169,330 13.7% 72,556 18.4%
Native American ** ** ** ** ** ** ** **
Other ** ** 2,307 18.4% 1,302 15.5% 3,275 36.5%
Female householder, no spouse present 85,303 22.2% 49,431 18.1% 165,068 29.0% 202,511 36.8%
Asian/Pacic Islander 4,143 23.9% 6,413 32.7% 5,291 40.2% 24,312 38.5%
Black 22,982 32.0% 1,945 22.8% 37,311 43.9% 56,498 40.8%
Latina 16,864 35.7% 2,539 21.0% 11,699 54.8% 59,571 53.4%
White 40,555 16.5% 37,135 16.4% 109,058 24.4% 59,954 25.9%
Native American ** ** ** ** ** ** ** **
Other ** ** 1,399 22.9% 1,709 60.9% 2,176 39.9%
Households with children 306 ,158 27.3% 198,610 27.7% 451,511 35.1% 497,901 59.3%
Married couple ormale householder, no spouse present
169,317 19.3% 122,436 21.5% 248,295 25.6% 279,626 49.7%
Asian/Pacic Islander 17,796 19.9% 13,638 27.0% 12,022 30.3% 67,526 62.9%
Black 20,028 24.7% 6,175 38.9% 23,733 38.0% 46,778 48.2%
Latino 61,379 43.2% 33,062 54.1% 27,003 52.5% 104,407 67.8%
White 68,174 12.2% 66,596 15.4% 184,744 22.7% 57,422 29.1%
Native American ** ** ** ** ** ** ** **
Other ** ** 2,965 31.8% 793 33.7% ** **
Female householder, no spouse present 134,843 57.3% 76,174 51.5% 203,216 64.7% 218,275 78.7%
Asian/Pacic Islander 1,329 25.4% 5,354 59.8% 4,200 60.8% 10,979 75.7%
Black 53,020 65.1% 9,120 66.0% 69,245 80.8% 80,732 74.6%
Latina 43,453 70.4% 14,346 74.1% 29,782 84.6% 103,733 86.2%
White 35,503 42.0% 43,790 43.5% 98,465 53.4% 18,634 62.8%
Native American ** ** ** ** ** **
Other ** ** 3,564 68.8% 1,524 96.4% 4,197 91.0%
NUMBER OF WORKERS IN HOUSEHOLD
Two or more workers 157,114 11.6% 106,934 11.5% 229,173 13.7% 266,596 27.6%
One worker 263,926 27.3% 182,003 24.4% 436,228 31.9% 513,518 47.2%No workers 73,002 72.3% 34,225 55.4% 173,530 74.2% 161,742 88.7%
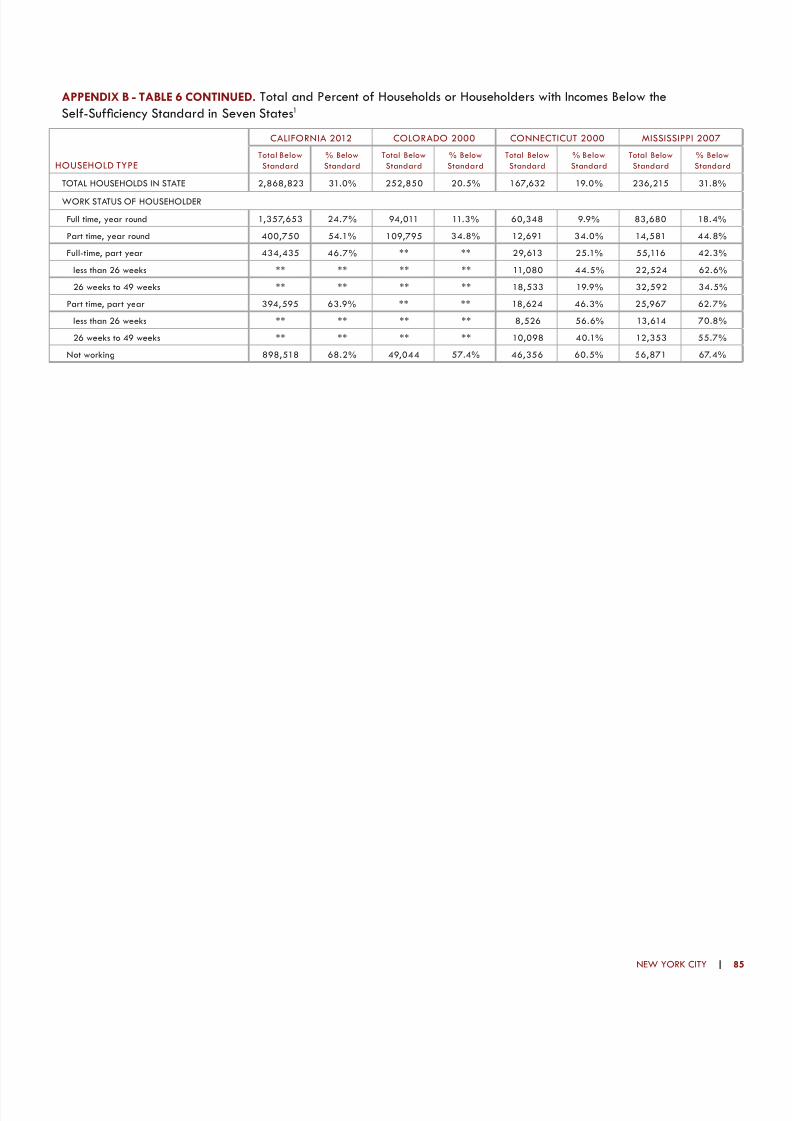
8/10/2019 Overlooked and Undercounted: The Struggle to Make Ends Meet in New York City.
http://slidepdf.com/reader/full/overlooked-and-undercounted-the-struggle-to-make-ends-meet-in-new-york-city 97/108
NEW YORK CITY | 85
APPENDIX B - TABLE 6 CONTINUED. Total and Percent of Households or Householders with Incomes Below theSelf-Sufciency Standard in Seven States1
HOUSEHOLD TYPE
CALIFORNIA 2012 COLORADO 2000 CONNECTICUT 2000 MISSISSIPPI 2007
Total Below
Standard
% Below
Standard
Total Below
Standard
% Below
Standard
Total Below
Standard
% Below
Standard
Total Below
Standard
% Below
Standard
TOTAL HOUSEHOLDS IN STATE 2,868,823 31.0% 252,850 20.5% 167,632 19.0% 236,215 31.8%
WORK STATUS OF HOUSEHOLDER
Full time, year round 1,357,653 24.7% 94,011 11.3% 60,348 9.9% 83,680 18.4%
Part time, year round 400,750 54.1% 109,795 34.8% 12,691 34.0% 14,581 44.8%
Full-time, part year 434,435 46.7% ** ** 29,613 25.1% 55,116 42.3%
less than 26 weeks ** ** ** ** 11,080 44.5% 22,524 62.6%
26 weeks to 49 weeks ** ** ** ** 18,533 19.9% 32,592 34.5%
Part time, part year 394,595 63.9% ** ** 18,624 46.3% 25,967 62.7%
less than 26 weeks ** ** ** ** 8,526 56.6% 13,614 70.8%
26 weeks to 49 weeks ** ** ** ** 10,098 40.1% 12,353 55.7%
Not working 898,518 68.2% 49,044 57.4% 46,356 60.5% 56,871 67.4%

8/10/2019 Overlooked and Undercounted: The Struggle to Make Ends Meet in New York City.
http://slidepdf.com/reader/full/overlooked-and-undercounted-the-struggle-to-make-ends-meet-in-new-york-city 98/108
86 | OVERLOOKED AND UNDERCOUNTED
APPENDIX B - TABLE 6 CONTINUED. Total and Percent of Households or Householders with Incomes Below theSelf-Sufciency Standard in Seven States1
NEW JERSEY 2005 WASHINGTON 2007 PENNSYLVANIA 2010 NEW YORK CITY 2012
Total Below
Standard
% Below
Standard
Total Below
Standard
% Below
Standard
Total Below
Standard
% Below
Standard
Total Below
Standard
% Below
Standard
TOTAL HOUSEHOLDS IN STATE 494,042 20.0% 323,162 18.6% 838,931 25.6% 941,856 42.1%
WORK STATUS OF HOUSEHOLDER
Full time, year round 197,052 12.6% 97,202 9.2% 269,982 13.0% 396,227 27.9%
Part time, year round7 38,911 33.8% 28,699 26.8% 95,474 42.5% 108,313 66.6%
Full-time, part year 93,844 24.5% 75,818 25.3% 116,534 32.0% 100,336 50.0%
less than 26 weeks 33,803 42.5% 30,364 45.8% 52,811 44.9% 41,175 66.1%
26 weeks to 49 weeks 60,041 19.8% 45,454 19.4% 63,723 25.8% 59,161 42.8%
Part time, part year 51,939 41.8% 60,321 46.0% 109,204 56.2% 82,107 69.8%
less than 26 weeks 24,924 51.5% 26,790 55.4% 56,874 63.4% 42,059 79.4%
26 weeks to 49 weeks 27,015 35.6% 33,531 40.5% 52,330 50.1% 40,048 61.9%
Not working 112,296 48.3% 61,122 42.1% 247,737 58.8% 254,873 76.8%
1 Sources: U.S. Census Bureau, 2012 American Community Survey; U.S. Census Bureau, 2007 American Community Survey; U.S. Census Bureau, 2005 American Community Sur vey; U.S. Census
Bureau, 5% Census Data, 2000.
2 The househ older is the person (or one of the pers ons) in whose name the housing unit is owned or rented or, if there is no suc h person, any adult member, excluding roomers, boarders, or paidemployees.3 Latino refers to H ispanic/Latino ethnicity, regardless of race. Therefore all other racial/ethnic groups are no n-Hispanic/Latino.
4 Other race data is missing for Connecticut
5 For Colorado, New Jersey, and Washington male hous eholders with no spouse present are combined with married couples due to low sample sizes for this variable.
6 The Race/ Ethnicity category of “Ot her” is calculated but not shown in th is table for some of these states as the categories are too small.
7 For Colorado and Washingto n, the part-time/year-round and part-time/part-year are calculated together.
8 All workers over age 16 are included in the calculation of nu mber of workers in the total househ old.
9 For Colorado and Washington the set of variables for househo lds without children combines married cou ple/male householder and female householder into the sam e category.
** No data for this variable in this state.

8/10/2019 Overlooked and Undercounted: The Struggle to Make Ends Meet in New York City.
http://slidepdf.com/reader/full/overlooked-and-undercounted-the-struggle-to-make-ends-meet-in-new-york-city 99/108
NEW YORK CITY | 87
APPENDIX B - TABLE 7. The Self-Sufciency Standard for Select Family Types,New York City, NY 2014
MONTHLY COSTS
Adult +
Adult + Adult + Adult + Adult + infant + 2 Adults + 2 Adults +
Adult + infant + infant + preschooler + school-age + preschooler + infant + preschooler +
Adult preschooler preschooler school-age school-age teenager school-age preschooler school-age
THE SELF-SUFFIC IENCY STANDARD FOR THE BRONX (BRONX COUNTY)
Housing $1,024 $1,214 $1, 214 $1,214 $1, 214 $1,214 $1, 561 $1,214 $1, 214
Child Care $0 $960 $2,071 $1,689 $1,538 $578 $2,649 $2,071 $1,538
Food $284 $431 $565 $641 $650 $752 $766 $811 $892
Transportation $112 $112 $ 112 $112 $112 $112 $112 $224 $224
Health Care $190 $521 $534 $543 $540 $570 $553 $592 $598
Miscellaneous $161 $324 $450 $420 $405 $323 $564 $491 $447
Taxes $474 $969 $1,604 $1,378 $1,258 $784 $2,293 $1,500 $1,215
Earned Income Tax Credit (-) $0 $0 $0 $0 $0 $0 $0 $0 $0
Child Care Tax Credit (-) $0 ($50) ($100) ($100) ($100) ($50) ($100) ($100) ($100)
Child Tax Credit (-) $0 ($83) ($167) ($167) ($167) ($167) ($250) ($167) ($167)SELF-SUFFICI ENCY WAGE
Hourly $12.76 $24.99 $35.70 $32.56 $30.97 $23.39 $46.29 $18.85 $16.65
per adult per adult
Monthly $2,246 $4,398 $6,283 $5,730 $5,451 $4,116 $8,147 $6,636 $5,860
Annual $26,951 $52,776 $75,394 $68,761 $65,411 $49,391 $97,769 $79,631 $70,319
EMERGENCY SAVINGS FUND(MONTHLY CONTRIBUTION)
$88 $179 $247 $232 $225 $181 $307 $135 $123
MONTHLY COSTS
Adult +
Adult + Adult + Adult + Adult + infant + 2 Adults + 2 Adults +
Adult + infant + infant + preschooler + school-age + preschooler + infant + preschooler +
Adult preschooler preschooler school-age school-age teenager school-age preschooler school-age
THE SELF-SUFFIC IENCY STANDARD FOR NORTHWEST BROOKLYN (KINGS COUNTY)
Housing $1,428 $1,693 $1,693 $1,693 $1,693 $1,693 $2,177 $1,693 $1,693
Child Care $0 $960 $2,071 $1,689 $1,538 $578 $2,649 $2,071 $1,538
Food $274 $415 $54 4 $618 $626 $724 $737 $781 $859
Transportation $112 $112 $ 112 $112 $112 $112 $112 $224 $224
Health Care $190 $521 $534 $543 $540 $570 $553 $592 $598
Miscellaneous $200 $370 $495 $465 $451 $ 368 $ 623 $536 $491
Taxes $691 $1,261 $1,987 $1,736 $1,566 $1,066 $2,785 $1,746 $1,459
Earned Income Tax Credit (-) $0 $0 $0 $0 $0 $0 $0 $0 $0
Child Care Tax Credit (-) $0 ($50) ($100) ($100) ($100) ($50) ($100) ($100) ($100)
Child Tax Credit (-) $0 ($83) ($167) ($167) ($167) ($167) ($250) ($167) ($167)
SELF-SUFFICI ENCY WAGE
Hourly $16.45 $29.54 $40.74 $37.43 $35.57 $27.81 $52.76 $20.95 $18.74
per adult per adult
Monthly $2,896 $5,199 $7,170 $6,588 $6,260 $4,894 $9,286 $7,376 $6,595
Annual $34,746 $62,385 $86,040 $79,061 $75,115 $58,726 $111,428 $88,508 $79,138
EMERGENCY SAVINGS FUND(MONTHLY CONTRIBUTION)
$108 $203 $270 $255 $248 $205 $336 $148 $135
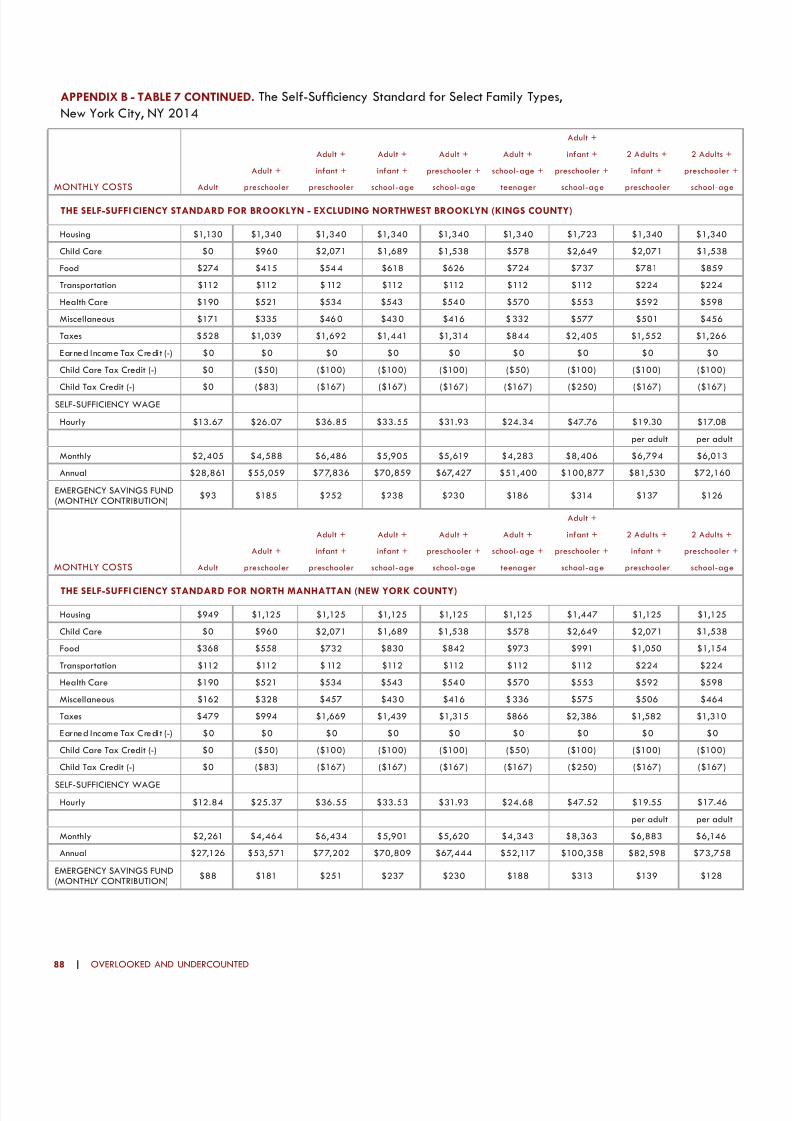
8/10/2019 Overlooked and Undercounted: The Struggle to Make Ends Meet in New York City.
http://slidepdf.com/reader/full/overlooked-and-undercounted-the-struggle-to-make-ends-meet-in-new-york-city 100/108
88 | OVERLOOKED AND UNDERCOUNTED
APPENDIX B - TABLE 7 CONTINUED. The Self-Sufciency Standard for Select Family Types,New York City, NY 2014
MONTHLY COSTS
Adult +
Adult + Adult + Adult + Adult + infant + 2 Adults + 2 Adults +
Adult + infant + infant + preschooler + school-age + preschooler + infant + preschooler +
Adult preschooler preschooler school-age school-age teenager school-age preschooler school-age
THE SELF-SUFFI CIENCY STANDARD FOR BROOKLYN - EXCLUDING NORTHWEST BROOKLYN (KINGS COUNTY)
Housing $1,130 $1,340 $1,340 $1,340 $1,340 $1,340 $1,723 $1,340 $1,340
Child Care $0 $960 $2,071 $1,689 $1,538 $578 $2,649 $2,071 $1,538
Food $274 $415 $54 4 $618 $626 $724 $737 $781 $859
Transportation $112 $112 $ 112 $112 $112 $112 $112 $224 $224
Health Care $190 $521 $534 $543 $540 $570 $553 $592 $598
Miscellaneous $171 $335 $460 $430 $416 $332 $577 $501 $456
Taxes $528 $1,039 $1,692 $1,441 $1,314 $844 $2,405 $1,552 $1,266
Earned Income Tax Credit (-) $0 $0 $0 $0 $0 $0 $0 $0 $0
Child Care Tax Credit (-) $0 ($50) ($100) ($100) ($100) ($50) ($100) ($100) ($100)
Child Tax Credit (-) $0 ($83) ($167) ($167) ($167) ($167) ($250) ($167) ($167)
SELF-SUFFICIENCY WAGE
Hourly $13.67 $26.07 $36.85 $33.55 $31.93 $24.34 $47.76 $19.30 $17.08
per adult per adult
Monthly $2,405 $4,588 $6,486 $5,905 $5,619 $4,283 $8,406 $6,794 $6,013
Annual $28,861 $55,059 $77,836 $70,859 $67,427 $51,400 $100,877 $81,530 $72,160
EMERGENCY SAVINGS FUND(MONTHLY CONTRIBUTION)
$93 $185 $252 $238 $230 $186 $314 $137 $126
MONTHLY COSTS
Adult +
Adult + Adult + Adult + Adult + infant + 2 Adults + 2 Adults +
Adult + infant + infant + preschooler + school-age + preschooler + infant + preschooler +
Adult preschooler preschooler school-age school-age teenager school-age preschooler school-age
THE SELF-SUFFI CIENCY STANDARD FOR NORTH MANHATTAN (NEW YORK COUNTY)
Housing $949 $1,125 $1,125 $1,125 $1,125 $1,125 $1,447 $1,125 $1,125
Child Care $0 $960 $2,071 $1,689 $1,538 $578 $2,649 $2,071 $1,538
Food $368 $558 $732 $830 $842 $973 $991 $1,050 $1,154
Transportation $112 $112 $ 112 $112 $112 $112 $112 $224 $224
Health Care $190 $521 $534 $543 $540 $570 $553 $592 $598
Miscellaneous $162 $328 $457 $430 $416 $336 $575 $506 $464
Taxes $479 $994 $1,669 $1,439 $1,315 $866 $2,386 $1,582 $1,310
Earned Income Tax Credit (-) $0 $0 $0 $0 $0 $0 $0 $0 $0
Child Care Tax Credit (-) $0 ($50) ($100) ($100) ($100) ($50) ($100) ($100) ($100)
Child Tax Credit (-) $0 ($83) ($167) ($167) ($167) ($167) ($250) ($167) ($167)
SELF-SUFFICIENCY WAGE
Hourly $12.84 $25.37 $36.55 $33.53 $31.93 $24.68 $47.52 $19.55 $17.46
per adult per adult
Monthly $2,261 $4,464 $6,434 $5,901 $5,620 $4,343 $8,363 $6,883 $6,146
Annual $27,126 $53,571 $77,202 $70,809 $67,444 $52,117 $100,358 $82,598 $73,758
EMERGENCY SAVINGS FUND(MONTHLY CONTRIBUTION)
$88 $181 $251 $237 $230 $188 $313 $139 $128
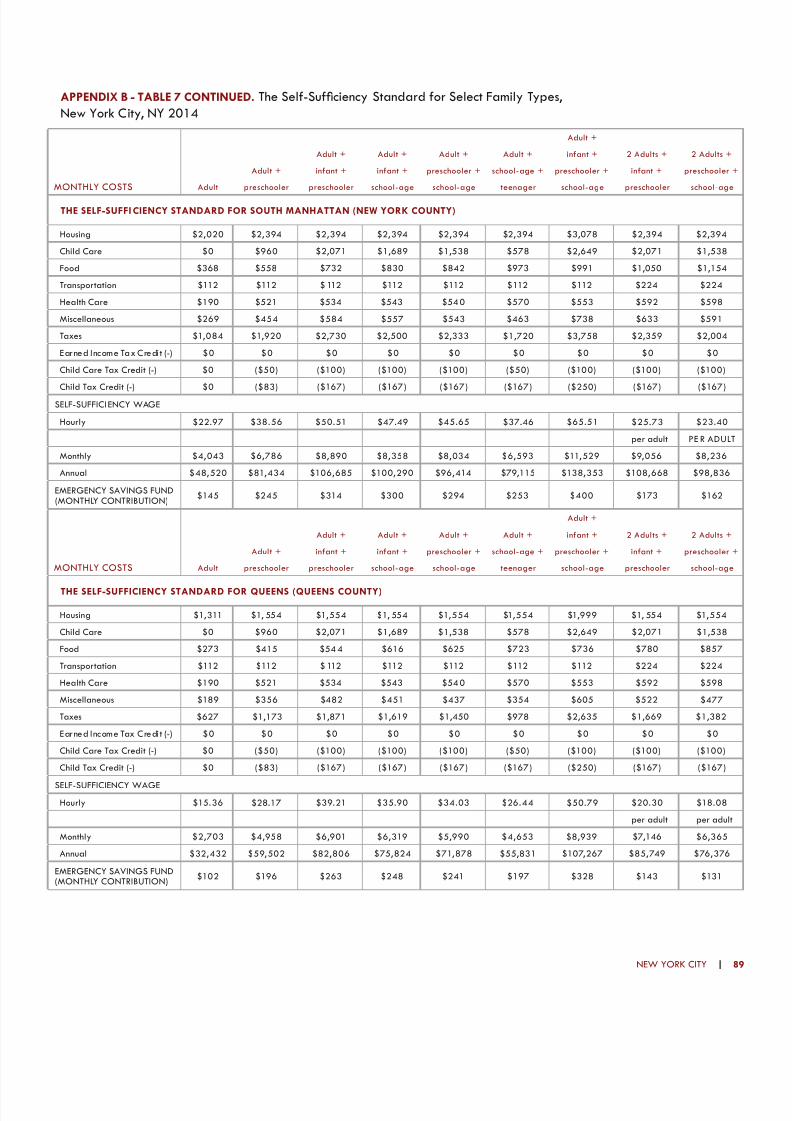
8/10/2019 Overlooked and Undercounted: The Struggle to Make Ends Meet in New York City.
http://slidepdf.com/reader/full/overlooked-and-undercounted-the-struggle-to-make-ends-meet-in-new-york-city 101/108
NEW YORK CITY | 89
APPENDIX B - TABLE 7 CONTINUED. The Self-Sufciency Standard for Select Family Types,New York City, NY 2014
MONTHLY COSTS
Adult +
Adult + Adult + Adult + Adult + infant + 2 Adults + 2 Adults +
Adult + infant + infant + preschooler + school-age + preschooler + infant + preschooler +
Adult preschooler preschooler school-age school-age teenager school-age preschooler school-age
THE SELF-SUFFI CIENCY STANDARD FOR SOUTH MANHATTAN (NEW YORK COUNTY)
Housing $2,020 $2,394 $2,394 $2,394 $2,394 $2,394 $3,078 $2,394 $2,394
Child Care $0 $960 $2,071 $1,689 $1,538 $578 $2,649 $2,071 $1,538
Food $368 $558 $732 $830 $842 $973 $991 $1,050 $1,154
Transportation $112 $112 $ 112 $112 $112 $112 $112 $224 $224
Health Care $190 $521 $534 $543 $540 $570 $553 $592 $598
Miscellaneous $269 $454 $584 $557 $543 $463 $738 $633 $591
Taxes $1,084 $1,920 $2,730 $2,500 $2,333 $1,720 $3,758 $2,359 $2,004
Earned Income Tax Credit (-) $0 $0 $0 $0 $0 $0 $0 $0 $0
Child Care Tax Credit (-) $0 ($50) ($100) ($100) ($100) ($50) ($100) ($100) ($100)
Child Tax Credit (-) $0 ($83) ($167) ($167) ($167) ($167) ($250) ($167) ($167)
SELF-SUFFICI ENCY WAGE
Hourly $22.97 $38.56 $50.51 $47.49 $45.65 $37.46 $65.51 $25.73 $23.40
per adult PE R ADULT
Monthly $4,043 $6,786 $8,890 $8,358 $8,034 $6,593 $11,529 $9,056 $8,236
Annual $48,520 $81,434 $106,685 $100,290 $96,414 $79,115 $138,353 $108,668 $98,836
EMERGENCY SAVINGS FUND(MONTHLY CONTRIBUTION)
$145 $245 $314 $300 $294 $253 $400 $173 $162
MONTHLY COSTS
Adult +
Adult + Adult + Adult + Adult + infant + 2 Adults + 2 Adults +
Adult + infant + infant + preschooler + school-age + preschooler + infant + preschooler +
Adult preschooler preschooler school-age school-age teenager school-age preschooler school-age
THE SELF-SUFFICIENCY STANDARD FOR QUEENS (QUEENS COUNTY)
Housing $1,311 $1, 554 $1,554 $1, 554 $1,554 $1,554 $1,999 $1, 554 $1,554
Child Care $0 $960 $2,071 $1,689 $1,538 $578 $2,649 $2,071 $1,538
Food $273 $415 $54 4 $616 $625 $723 $736 $780 $857
Transportation $112 $112 $ 112 $112 $112 $112 $112 $224 $224
Health Care $190 $521 $534 $543 $540 $570 $553 $592 $598
Miscellaneous $189 $356 $482 $451 $437 $354 $605 $522 $477
Taxes $627 $1,173 $1,871 $1,619 $1,450 $978 $2,635 $1,669 $1,382
Earned Income Tax Credit (-) $0 $0 $0 $0 $0 $0 $0 $0 $0
Child Care Tax Credit (-) $0 ($50) ($100) ($100) ($100) ($50) ($100) ($100) ($100)
Child Tax Credit (-) $0 ($83) ($167) ($167) ($167) ($167) ($250) ($167) ($167)
SELF-SUFFICIENCY WAGE
Hourly $15.36 $28.17 $39.21 $35.90 $34.03 $26.44 $50.79 $20.30 $18.08
per adult per adult
Monthly $2,703 $4,958 $6,901 $6,319 $5,990 $4,653 $8,939 $7,146 $6,365
Annual $32,432 $59,502 $82,806 $75,824 $71,878 $55,831 $107,267 $85,749 $76,376
EMERGENCY SAVINGS FUND(MONTHLY CONTRIBUTION)
$102 $196 $263 $248 $241 $197 $328 $143 $131

8/10/2019 Overlooked and Undercounted: The Struggle to Make Ends Meet in New York City.
http://slidepdf.com/reader/full/overlooked-and-undercounted-the-struggle-to-make-ends-meet-in-new-york-city 102/108

8/10/2019 Overlooked and Undercounted: The Struggle to Make Ends Meet in New York City.
http://slidepdf.com/reader/full/overlooked-and-undercounted-the-struggle-to-make-ends-meet-in-new-york-city 103/108
APPENDIX C:
PRACTICAL APPLICATIONS

8/10/2019 Overlooked and Undercounted: The Struggle to Make Ends Meet in New York City.
http://slidepdf.com/reader/full/overlooked-and-undercounted-the-struggle-to-make-ends-meet-in-new-york-city 104/108
While the Self-Sufciency Standard is an
alternative measure of income adequacy
that is more accurate, up-to-date, and
geographically specic, it is more than
an improved measure. The Standard is
also a tool that can be used across a
wide array of settings to benchmark,
evaluate, educate, and illuminate. Below
we briey outline some of these uses.
POLICY ANALYSIS. The Self-Sufciency
Standard has been used as a tool to
evaluate the impact of current and
proposed policy changes. The Standardcan be used to evaluate the impact of
a variety of work supports (SNAP/Food
Stamp Program, Medicaid) on a family’s
budget. Likewise, the Standard can be
used to evaluate policy options such as
changes in child care co-payments or tax
schedules as they impact family incomes
of low income families in particular.
EVALUATIONS OF ECONOMIC
DEVELOPMENT PROPOSALS. The Self-Sufciency Standard has been used to
help determine if businesses seeking tax
breaks or other government subsidies
will, or will not, create jobs that pay
“living wages.” If not, employees may
need public work supports to be able
to meet their basic needs, essentially
providing a “double subsidy” for
businesses. Communities can use
the Standard to evaluate economicdevelopment proposals and their net
positive or negative effect on the local
economy, as well as the impact on the
well-being of potential workers and their
families.
EMPLOYMENT PROGRAMS. The Self-
Sufciency Standard has been used
in employment programs to determine
which individuals are eligible and/or
to target those most in need of specic
support or training services, as well as, to
determine training and counseling needs,
and to measure the effectiveness of
employment programs.
For example, the Self-Sufciency
Standard has been used to target job
training resources. Using a “targeted
jobs strategy,” the Standard helps tomatch job seekers with employment that
pays Self-Sufciency Wages. Through
an evaluation of the local labor market
and available job training and education
infrastructure, job seekers are matched
to employment with family-sustaining
wages. Through this analysis it is possible
to determine the jobs and sectors on
which to target training and education
resources.
Additionally, as a counseling tool
the Self-Sufciency Standard helps
participants in work and training
programs access benets and develop
strategies to become self-sufcient.
Computer-based counseling tools allow
users to determine what their needed
wages are, and then, using information
on available programs and work
supports, devise strategies that best meet
their own costs and needs. These tools
integrate a wide variety of data not
usually brought together, allowing clients
to access information about the benets
of various programs and work supports
that can move them towards economic
self-sufciency.
Finally, the Self-Sufciency Standard
can be used to evaluate outcomes
for clients in a range of employment
programs, from short-term job search
and placement programs, to programs
providing extensive education or job
training. By evaluating wage outcomes
in terms of the Standard, programs are
using a measure of true effectiveness.
Such evaluations can help redirect
resources to approaches that result in
improved outcomes for participants.
HOW THE STANDARD HAS BEEN USED
CASE HIGHLIGHT
The Self-Sufciency Calculator for New York City was developed by theWomen’s Center with the support of the United Way of New York City andenhanced with the support of the Robin Hood Foundation, to help workingadults or adults just reentering the labor market get the work supports theyneed to stay in the workforce. The Calculator is a computer-based tool that:
screens income eligibility for a variety of work supports and tax credits•
estimates benet amount for work supports•
gives individuals information on how to access these supports•
calculates how well a given wage meets a working individual’s real expenses•
screens immigrant eligibility•
For more information on the Calculator go to http://www.wceca.org./self_ sufciency.php.

8/10/2019 Overlooked and Undercounted: The Struggle to Make Ends Meet in New York City.
http://slidepdf.com/reader/full/overlooked-and-undercounted-the-struggle-to-make-ends-meet-in-new-york-city 105/108
NOTES

8/10/2019 Overlooked and Undercounted: The Struggle to Make Ends Meet in New York City.
http://slidepdf.com/reader/full/overlooked-and-undercounted-the-struggle-to-make-ends-meet-in-new-york-city 106/108
NOTES

8/10/2019 Overlooked and Undercounted: The Struggle to Make Ends Meet in New York City.
http://slidepdf.com/reader/full/overlooked-and-undercounted-the-struggle-to-make-ends-meet-in-new-york-city 107/108
ABOUT THE AUTHOR
Diana M. Pearce, PhD teaches at the School of Social Work, University of Washington in Seattle, Washington,
and is Director of the Center for Women’s Welfare. Recognized for coining the phrase “the feminization of
poverty,” Dr. Pearce founded and directed the Women and Poverty Project at Wider Opportunities for Women
(WOW). She has written and spoken widely on women’s poverty and economic inequality, including testimony
before Congress and the President’s Working Group on Welfare Reform. While at WOW, Dr. Pearce conceived
and developed the methodology for the Self-Sufciency Standard and rst published results in 1996 for Iowa
and California. Her areas of expertise include low-wage and part-time employment, unemployment insurance,
homelessness, and welfare reform as they impact women. Dr. Pearce has helped found and lead several
coalitions, including the Women, Work and Welfare Coalition and the Women and Job Training Coalition. She
received her PhD degree in Sociology and Social Work from the University of Michigan.
ABOUT THE CENTER FOR WOMEN’S WELFAREThe Center for Women’s Welfare at the University of Washington School of Social Work is devoted to
furthering the goal of economic justice for women and their families. The main work of the Center focuses on the
development of the Self-Sufciency Standard. Under the direction of Dr. Diana Pearce, the Center partners with
a range of government, non-prot, women’s, children’s, and community-based groups to:
research and evaluate public policy related to income adequacy;•
create tools to assess and establish income adequacy; and•
develop programs and policies that strengthen public investment in low-income women, children,•
and families.
For more information about the Center’s programs, or work related to the Self-Sufciency Standard, call
(206) 685-5264. This report and more can be viewed at www.selfsufciencystandard.org.
Center for Women’s Welfare…advancing economic justice through researchand the Sel f -Suciency Standard

8/10/2019 Overlooked and Undercounted: The Struggle to Make Ends Meet in New York City.
http://slidepdf.com/reader/full/overlooked-and-undercounted-the-struggle-to-make-ends-meet-in-new-york-city 108/108