Embed Size (px)
Citation preview

13
Overlap Operations and Raster Graphics
A.L. Thomas'
AbStrnct This paper outlines the development of a volume and surfaces modelling system for use with raster graphic displays. The ideas are presented in a historical frame- work to make the reasoning behind the design deci- sions clear and to indicate the main inffuences which have guided the work. There are two outcomes of importance: a language form for defining volumes and surfaces; and hardware to convert this representation directly into a display. The hardware provides hidden- line or hidden-area removal as a display primitive which, in an appropriate implementation, can be fast enough to support a range of real-time display applica- tions. Linked to this hidden-line, hidden-area removal facility is an ability to provide interference tests for objects that are being moved around in a scene. Again there appears to be a hierarchy of applications ranging in complexity from interactive volume editing to robot control and vision systems. The new facilities complement existing point and line based display operations, on which most current displays' hardware is based. A good case is emerging for integrating the two approaches into a single hardware implementation for CAD workstations and for simulator display sys- tems.
1. Introduction and Background Graphics is an important enough form of communica- tion for the development of computer graphics, in some form, to have been an inevitable step. There appear to have been two distinct lines of early development. The first where people used output equipment not intended for graphics to create simple forms of display. The second based on the construc- tion of special display hardware such as line plotters and digitally controlled CRTs giving more sophisti- cated forms of display. The analysis and presentation of geographical, statistical results using line printer maps is an example of the first approach; the design and display of car-bodies using automated draughting
School of Engineering & Applied Sciencs, The University of Sussu FalmCI Brighton SusSa United Kingdom
facilities in the motor industry an example of the second.
The work presented in this paper, although its objective in part is state of the art, specialised, display-units, owes part of its philosophy to experience gained using early line printer mapping systems, such as SYMAP and GRIDS. What was attractive about these systems, in retrospect, was the close link which existed between the programming language facilities used and the way a display was defined. A map was the symbolic counterpart to an array of point values or grid cell values used to model a spatial distribution. Not only did this make it convenient to model a spa- tial distribution in this way. It meant that many spa- tial operations could be worked with a-spatially, because instructions of the form:
for all points in the grid: carry out the following task ..,
automatically handled the geometry in an implicit way. This convenience of apparently being able to ignore the geometry of spatial operations was clearly limited in its scope. This will be vouched for by those who sat for hours digitising frameworks for this kind of mapping system. However as far as it went this was a property that seemed desirable to retain and extend.
A more general but similar facility can be pro- vided by a hierarchical system. In such a system a user can if he wishes name objects and regions in a display space and operate on them at a level well above their detailed geometrical properties. Hierarchical systems became necessary as soon as two and three dimen- sional distributions were processed which employed sufficient spatial detail to create a storage problem when using grid data. The data compression, which was available from using boundary or edges models, made it possible to define much larger study areas using the same memory space. The cost was either greater processing time - to decompose this structured model back into an array to carry out existing spatial operations - or a greater complexity in the alternative algorithms needed to implement the operations in new ways.
The move to line generated displays was a major advance, but included a retrograde step: the introduction of one or more levels of indirection between the programming language used and the com-
North-Holland Computer Graphics Forum 5 (1986) 13-32

14 A.L. Thomas f Overlap Operations and Raster Graphics
mon low-level spatial operations such as testing for Point-in-polygon, Line-clipping or canying Out Polygon-overlay merges. Generally, property opera- tions were catered for at a Werent level to related geometric operations. It was the recurring need to extract zones defined by Werent combinations of pro- perties, working on GIMMS (Geographic Information Management and Mapping System’ ) which high- lighted this inequality between equally important basic operations. What was nezesary was some way of car- rying out common spatial and display operations at the same level as the other general operations provided in high level programming languages. There seemed to be a need for new fonns of hardware to do this, par- ticularly for overlap operations.
2. Line Interpolation and Point Transformations Specialised line display systems were under develop ment quite a long time before they became available to the average user. In 1963 the SKETCHPAD system [a] was already using line sepents represented by their end-point coordinates. This meant that each line had to be filled in by interpolation before it could be used in a display. However, implementing the interpolation function in a fast enough form, allowed this system to make the interactive construction and editing of line images a technical possibility. The entry and subse- quent relocation of points using a light-pen, when used with display time interpolation, provided the facility of “rubber banding” which with “objects dragging” formed the basis for the “pointing” languages used in most subsequent interactive systems. The related development from the same period representing points by homogeneous coordinates allowed a single matrix multiplication to provide rotation, translation, scaling and projection transformations as an identical opera- tion on point coordinates. The importance of this development was that it made it practical to build spe- cial purpose hardware for matrix multiplication so providing point transformations as system primitives. Combining this circuitry with that required by fast interpolation meant the real-time movement of com- plex line images, under computer control, was an attainable goal almost two decades before it became a generally available facility..
The display list used in this kind of line display system consisted of a collection of line segments represented as an appropriately ordered list of point coordinates. This arrangement corresponded fairly closely to the way a draughtsman might describe the preparation of a drawing, and so formed a fairly natural and comfortable way to provide information to an automated draughting system. The approach was supported by technical drawing conventions which had
evolved historically to give fast and efficient modelling systems based on the use of cheap, generally available drawing equipment such as pens, pencils, compasses and rulers. In contrast, alternative aerial display tech- niques were ditlicult and time consuming and were generally considered to require the greater skills of an artist. Tradi t iody such methods were only justi6ed where there was tin! and money to carry out the presentation work of painting a picture or setting up physical models for photography, and so were less well structured for automation.
3. Solid Models Although technical drawings evolved as an efficient way to communicate spatial information, and automating the drawing process was a natural fist step in the use of computing facilities in this area, they did not appear necesady to give the best foundation for the long trim use of the computer in design work. It was both a possible and a more versatile approach for example, to create three dimensional models of three diinensional objects, and to then generate what- ever drawings were required from these models as they were needed. Three dimensional wireframe models could be created with draughting systems merely by using three dimensional coordinates. However, although simple wireframe models were adequate for visualisation, they exhibited serious short-comings when they started to be used to represent solid objects. The kind of problem encountered is illustrated by the well known example shown in figure 1. Without further information this simple line model is ambigu- ous. The diagram illustrates a further problem yhich
Fig. 1. Ambiguous.Modcls
?
\ a

15 A.L. Thomas / Overlap Operations and Raster Graphics
is that unless the hidden-lines are removed the drawing as well as the model is ambiguous. It shows also, that as a wireframe drawing becomes more complex, it quickly becomes incomprehensible. The removal of hidden-lines is essential but requires more information than is provided by a simple line model. It is also a computationally intensive operation which loses the system response ncceSSary for interactive work and therefore loses much of the advantage gained from using fast point transformation and line interpolation hardware.
In order to provide sufficient information for solid modelling and for display purposes it was neces- sary to define the surfaces of objects. This could be done implicitly by structuring the lists of coordinate points in the line model in an appropriate way to imply some accepted form of interpolation or it could be done explicitly by giving a functional definition for each face of an object. In both approaches there were difficulties maintaining the self consistency or accuracy of a model: usually at the volume building stage of work and during editing procedures. The main prob- lems were found with curved surface or sculptured sur- face models, but even simplified polyhedral approxi- mations were not without their difficulties.
4. Hidden Line Removal One way of including more information in a line based polyhedral model was to use the line segments to d e h e the polygonal boundaries of the object’s facets. Hidden-line removal could then be Carried out as a modification to the more general operation of polygon overlay. Polygon facets could be projected onto the display plane by vertex transformation and then tested for overlap. The first stage of this process was to locate boundary intersection points. The second was to select the polygons which lay in front of other polygons, and clip the others which lay behind.
- Fig. 2. Polygon Overlay Worst Case
The difficulty with testing a set of boundary lines for intersection points, in .this process, was that
worst case examples could have a complexity of o(n2). However on one hand most realistic scenes are made up from simpler units than this and on the other the hidden-line removal problem often does not require all intersection points to be determined. Where a large polygon obscures many small overlapping polygons, for example, work can be saved. To take advantage of these kinds of properties algorithms were developed which depended on the coherent structure of the objects in a scene to reduce the work of removing hid- den lines. J.E. Warnock’s divide and conquer algo- rithm (1969) adopted one of several possible approaches to this problem.2 By recursively subdivid- ing the display screen into quadrants and pruning the display list for each quadrant to only include polygons that occur in that quadrant, this approach was able to avoide many of the UM~C~SS~UY tests in the basic O(n2) process.
5. TbeDuaiNamingofEdges Modelling polyhedra by a set of polygonal facet boun- daries helped with many difficulties, but did not solve them all. Data integrity could still be a problem because of the way edges were duplicated in this approach. Whenever a polygon facet had to be modified it was ncceSSary to locate all adjacent facets and update them as well. A solution to this difficulty was found by extending the approach to labelling edges that was employed in the DIME system3 and in GIMME.’ If each edge was coded once only in the form A/B:1/2, where the first two labels referenced adjacent facets separated by the edge and the second pair of labels referenced the end points of the edge, then much of the cross referencing work in operations such as polygon-overlay became simpler to implement.
The step which implied many problems was the realisation that the dual naming of edges could be incorporated into a graph-matrix representation of a wireframe model of an object. This gave a single data- structure capable of modelling the object as a solid in the same way that the boundary-list model of a polygon modelled its interior in a consistent way, depending on the order of vertices in the list! An example of this form of representation is given in figure 3 for a cube. The symmetrical nature of the edgenaming allows two matrices to be formed: one the dual of the other. In the first the facet names are used to index cells in the matrix and in the second the vertex names are used to index cells in the matrix. Because these matrices become very sparse as objects grew in complexity, a simple array bascd implementa-
,tion proved inadequate. As a conceptual structure however they were invaluable. Several different ways of implementing them were explored and a linked list

16 A.L. Thomas f Overlap Operations and Raster Graphics
sparse matrix representation produced a structure similar to the winged edge models of Baumgart?
A B C D E F
C 1 2 6 5 D 6 5 . 8 7
I I “ I ! I
Fig. 3. Graph Matrix Models
Although these object models solved many problems, one important ditsculty remained. In interactive work it was ntceSSary to move objects around in a scene for objects construction or editing purposes. In this process it was easy, unintentionally, to make objects overlap in the work Space. The cow- quence of this “placement” problem was that simple hidden-line removal strategies ceased to work. It became necessary to carry out a form of interference test as part of the hidden-line removal algorithm. If two objects overlapped it was necessary to generate the edges where the surfaces of the two objects intersected to give a correct display. Whether this result was treated as an error or not, if effectively required the union of the two objects to be created as a model. It was the attempt to resolve this problem which led to the use of Boolean operators as volume generators in their own right.6
6. Volume Model Construction Two main approaches to volume model building emerged from this work. The first was based on a set
of homogeneous vertex coordinates ( X y , z , w ) , the second on a set of facet, plane-equations coe5Qents (a ,b ,c ,d). The vertex based approaches in essence con- sisted of dSerent ways of setting up triangulated net- works. Its justification was that shape modification could be achieved by transforming vertex coordinates alone, linear interpolation completing facets and edges in a consistent way. One way of implementing this approach was to set up and add together the graph- matrices of tetrahedra. Such a process required three matrix operations. In the first a new tetrahedron is generated so that one of its facets is identical with an existing triangular facet. Depending on the geometry, the new volume is then either subtracted or. added to the existing volume. In this process four new rows and columns are added to the existing volume model to represent the facets of the new tetrahedron and then two rows and columns are detected for the facets lost in the join. The second and third operations are simi- lar but handle the addition or subtraction of a tetrahedron where two or three facets of the new volume are made to coincide with Wristing facets of the established volume in the joining process? A variation of this approach resulted in a model consisting of a hierarchy of convex hulls.
The second method grew out of the work on Boolean operations. The facets of the target volume were represented by plane equations set up as half- spaces. These planes partitioned the object space into a set of convex blocks and the required volume was defined by writing down the Boolean expression which selected the appropriate collection of convex blocks. This expression model could be automatidly con- verted into the appropriate graph-matrix or convex hull model when required. The justification for this approach was that shape modification was achieved by transforming only the surface plane equations. Both the vertex and the plane transformations could be car- ried out using the same matrix operations. But the effect of modifying the vertices and the facets in this was Werent and gave complementary volume build-
Target volume:
Component: C = a b ;
Volumes: E = e . r . ( I + m + ! ( k + j ) + n +s);
Voluma: D = t.uv;
Expanding:
Recording:
Raraming Convex
T = C.d ( !E + f ) . D ;
Y = ab.d ( ! ( ex (1 +m +!(k + j ) + n +s))+f). t .uv;
V = ub.dr.uv. ( !e +!r +f +(!l !m !n. !s. (k +j) ) ) ;
coU&Ons: ( A ( B ( c ( D ))))
Fig. 4 Boolean Expression Model Standard Fom

A.L. Thomas 1 Overlap Operations and Raster Graphics
ing facilities. The Boolean expression model also allowed new objects to be defined as functions of exist- ing objects. The way in which such an object definition can be automatically converted into a graph-matrix or convex hull model is outlined in figures 4 to 8.
If an object description is entered into the com- puter system in the form shown in figure 4, defined as the interaction of a sequence of sub-models, the first step is to expand the definition, until it is geometrically totally defined. This operation can be carried out using the tree structures which result from parsing the input expressions. Once the expanded expression tree has been generated then a re-ordering and a readjustment of levels to take complement operations down from sub-expressions to the level of half-space names, pro- duces a tree model in a standardised form. At each node in h s tree there can be free half-spaces. In the case shown these collections are: (ub.dl.tLV), ( ! e + ! r + / ) , (!l . !m !n. !s) and (k + j ) . Each of these groups defines a convex solid or void depending on the level at which it is found in the tree. Renaming these convex units results in an object defined as A. (B +(C. (D))) or A ,(B,(C,(D))), where the units interact in the hierarchical way illustrated in figure 5.
A
Fig. 5. Hierarchy in Boolean Models
This form of the sxpression model provides a standard starting point for constructing a graph-matrix model. Simple convex objects are created as graph- matrices by using the cutting plane operation summar- ised in figure 6. First of all, the graph matrix of a large cube is set up to act as a working space large enough to contain the new volume. Each half-space in the convex collection of facets is then taken in turn and used to cut off a section of this cube as a matrix operation. This is continued until only the required convex object model remains” as a correctly formed graph-matrix.
Once the convex components of an object have been set up in this way the next step depends on a second algebraic manipulation of the expression model. Take as an example the triangular object (A.B.C). It is natural to define the boundary of this
‘40 ’
a.b.c.d
\ Y . 0 ‘ 4 . N
Fig. 6. Cutting Plane Generation of Conva: Objects
object - expressed as @(A.B.C) - as made up from the three sides of the triangle. The 6rst side will be the boundary of the half-space A , @A where it lies inside (B.C), the second @B.A.C and the third @C.A.B,
@(A.B.C) -+ @[email protected][email protected].
Extending tbis idea the boundary of a triangular hole becomes:
giving
@(Z+E+C) -+ @ZB.C [email protected] [email protected]
If this boundary expansion is applied to the model in figure 5 the result will be the boundary segments shown in figure 7 as B1, B2, B3 and B4.
@(A.(B+(C.(D)) ) ) + @A.(B+(C.(D)) )
+ @ ( B + ( C . ( D ) ) ) A
@ ( B + (C. ( D ))I + @B. (cm) + @(C.(D)) .B
@(C.(D)) + @C.D [email protected]
so that:

18 A. L. Thomas Overlap Operotions and Raster Graphics
B 1 :=@A. [B +(C. (D))] B 2 : =@B. [A. (C+(B))] B3 : =@C. [ A . g D ]
B4 : =@D. [ A . g C ]
84
Fig. 7. Boundary Operator.
Each phrase in the boundary expansion contains a convex surface, denoted by the prefix @, intersected with a Boolean expression duived from the original volume model. This expression acts as a clipping func- tion which converts the convex surface into a convex boundary patch of the required volume. If the graph- matrix for each of the convex elements is clipped by cutting and retaining only the edge line segments which lie inside the appropriate clipping expression, the result will be an incomplete matrix model of the form shown in figure 8 for the Union of two tetrahe- dra:
A.B.C.D + W.X.Y.Z. However it is possible to add the incomplete matrices together for a l l the surface patches, and then deduce the missing entries from the formal properties of the matrix model itself. In figure 8 the starting point will be two convex tetrahedra created using cutting plane. The boundary expansion of the volume will be:
@ (A.B. C.D).[ m] + @ ( W.X. Y. Z ) . [ A m ]
If the boundary element of each phrase is taken to be a matrix model then the clipping expressions in the square brackets can be used to cut the edges in the matrix. For example edge A/B:1/2 will be clipped and a new end point d be substituted for 1, where the edge is cut by the half-space Y. The reference to d will
replace the reference to 1 in the 6rst matrix where it is indexed by A and B. Similarly the new points ef,a,b, and c will replace existing points in the iritial matrices. Each corresponding row and column of a complete matrix model will contain the same set d references though in a Merent order. The result of the clipping is that the modified matrices no longer represent complete volumes, and even when they are added together to give the new volume model, new entries have to be made to define the new edges where the tetrahedra cut each other. This can be achieved in several ways. The simplest is shown in figure 8. The new point d occus where A/B is cut by Y. Position [A,B] contains d therefore [B,Y] and [YA] taking thesc facets in cyclic order, must also contain d The geometric part of this algorithm is based on tests between line segments and plane half-spaces grouped together as convex solids or convex voids.
The vertex based modelling approach initially appeared to offer the greater possibilities. However when the “placement” problem was encountered it became clear that overlap testing would have to be an inherent part of the display process and the alternative approach started to appear more attractive. An added attraction was that the Boolean expression models could form the core of a volume and area modelling language. The initial difiiculty was that to get a %lay required two fairly major computational steps. Firstly the Boolean expression had to be converted into an edge based model and then this model had to be processad to remove hidden lines. The beginning of a solution to this problem was found in 1972.6 By reverting to a grid or raster display format, a primitive algorithm was found which would interpret simple Boolean expressions directly into a raster image. The input consisted of a set of half-space dehitions fol- lowed by a volume definition and a display command. Once a set of half-spaces had been defined Merent Boolean expressions would compose them into merent sane as required.
7. Raster Displays
Once it was possible to generate raster images fast enough to use television displays it became possible to produce full colour acrid images. The task of generat- ing realistic images fast enough to drive a television had been undertaken by the General El-tric corpora- tion in the late sixties in work for NASA. The aim was to develop electronic displays for pilot training simulators, which synthesised their images rather than televised them from scale models.7 Work started in the State University of Utah, about the same time, on a symmetric study of raster graphic methods. For this work to succeed it was necessafy to find faster and

A.L. Thomas / Overlap Opemtions and Raster Graphics
4 B 3 e d c
2 4 c 3
f 3 2 D b e ~
19
Fig. 8. Boundary Expausion Used to Generate Matrix Mod&.
more efficient ways of structuring the large amount of calculation needed to give a raster image which was of a high enough resdlution to be acceptable. Alterna- tively it was necessary to design specialised display hardware that would reduce the display work carried out by the computer, in the way that speckkd inter- polation facilities succeeded in doing for refresh line displays.
The first step in this direction was the develop m a t of the frame store. Memory as it became cheaper and packaged in larger volumes finally became fast enough and compact enough to permit a total TV image to be stored in a digital form, in a practical way. This ihformation wuld then be accessed and con- verted into an analogue video signal at the rate required to drive a television. Work in the CAD cen- tre in Cambridge produced the “Bug Store”, a two port block of memory which allowed information to be written to it from a computer while maintaining a constant output at video refresh rates to a TV moni- tor.
+
f 6 X 5 b
b 7 6 c Z
8. HiddenAreaRemovd The hidden area removal algorithm of Newell, Newd and Sancha* was designed to take advantage of this memory based @lay hardware. Working with polygon facet models this approach employed the overwriting of memory to model the way that nearer object facets obscured more distant objects facets, by entering more distant facets 6rst. This required two supporting software procedures. The first was the depth ordering of polygons and the second was a form of polygon shading or polygon fill required to deter- mine which memory locations to overwrite. This approach was beautifully simple, but had one draw- back if speed was the ultimate objective. Every polygon had to be painted into memory so for a com- plat scene every memory all could expect to be accesstd more than once. Memory ~cctss time pro- vides one of the limiting constraints on the resolution of displays. Since greater resolution can confidently be seen to be a continuing demand until wall sized displays have bem achieved - taking the mural as the

20 A.L. Thomas 1 Overhp Operations and Raster Graphics
architype - it seemed unlikely that this approach in its simplest form could ever be the ultimate solution, par- ticularly where real-time editing facilities and moving synthetic displays are the goal. For such an objective greater speed in generating images had to be sought. This appeared possible in one of two related ways. Polygon data being entered into the memory either had to be processed in parallel in some way or some preprocessing of polygon boundaries to remove hidden zones had to be carried out so that the average number of accesses to a pixel storage location could be effectively reduced to one per refresh cycle.
Polygon-facets can at times be impossible to sort into a simple order, and more importantly they can intersect each other, particularly after editing work. A simply hardware solution to this problem, though it sti l l suffered from the multiple pixel accessing diKiculties, was provided by the depth buffer. Any new polygon being painted into display memory was only entered at a particular pixel position if its depth value at that position was less than the depth value of the polygon already stored at the point. This approach was an ideal solution for the preparation of static displays, because no restriction was placed on the way that the new depth and property values were gen- erated. It permitted the results from a large variety of different object modelling systems to be merged, what- ever the speed and the order in which the new data was generated.
Line displays could be entered into this kind of system, once the resolution was high enough to give an acceptable result. Once this was possible then most line based procedures could also be used, in particular many of the existing hidden-line removal algorithms. If only polygon edges were entered as lines into a frame- store then a great reduction in the number of memory accesses could be achieved. Edges could be treated as switching points while scanning memory for output where the colour of one polygon was changed to the colow of a neighbouring polygon. The advantages of this approach was that the amount of data which had to be entered into the memory was much less than in aerial methods and this made the speed of real-time editing with hidden-line removal a more accessible tar- get.
9. R e d - T i Hiwen Area Removal In 1970 G.S. Watkins presented a real-time raster based system that worked on a polygon, facet- boundary model? Even though raster based, this sys- tem owed a substantial amount to previous line bascd systems. Edges were created by interpolation between polygon vertices on to the raster grid; the movement of edges was achieved by transforming vertex coordi-
nates before interpolating. Polygons were tested for overlap by comparing raster line polygon cross- sections. These polygon section lines were generated by linking together the corresponding boundary points on a raster-line from the same polygon boundary. This comparison process was made efficient by ordering the polygon boundary line segments into an order suitable for raster scan processing. A list was then set up which held the active edges cut by the current raster line. As each raster line was completed, this active list could be updated alopg with an associated list of polygon cross sections. The end points of these cross sections were updated by interpolation along the active polygon edges to give the new cross sections for the next raster line.
Hidden area removal was accomplished by selecting the nearest polygon segment point at each pixel position. This process was based on a binary subdivision of each polygon segment, designed to pro- vide the required depth selection quickly. Segments were compared in a pair-wise manner in an ordered traversal of a raster line to give an ordered list of change points between visible sections of polygon facets. Where two segments intersected then their crossing point had to be found. This could be deter- mined to the nearest pixel position by the same selec- tion process. The two nearer sections of each of the intersecting polygon segments could then be presented for display. This approach solved the placement prob- lem in the same way that the depth buffer algorithms did by displaying the union of the two overlapping objects. It was by extending this relationship that a way was found to generate a display directly from the Boolean expression volume models described above.6.4
If selecting the nearest surface to the screen defined the union of two objects in a display then selecting the furthest surface could be arranged to create the intersection of two objects in the display. The difsculty with using plane half-spaces in such a process was that intersecting the raster-plane - the plane which passe through the eye and a raster line - with a facet, created a segment which spanned the whole display screen. However, the front surface of an intersection volume could be dehed by following the furthest front facing surface from a collection of inter- secting plane half-spaces. In the same way the back surface of the same volume could be defined by fol- lowing the nearest back facing plane from the same collection. Although these two surfaces spanned the display screen the object only existed where its front surface lay in front of its back surface. These relation- ships are summarised in figure 9. One apparent advantage of having the surfaces spanning the whole %lay screen was that the binary subdivision process could be applied to all the plane half-spaces in a scene

A. L. oma as 1 Overlap Operations and Raster Graphics 21
CONVEX SOLID
A. B. C. MAX
FRONT SURFACE
E'. F'. G' MIN
BACK SURFACE
A. B. C. E'. F'. G' (F<B)
VISIBLE SURFACE
CONVEX VOID
A+B+C MIN
FRONT SURFACE
E '+ F '+G ' MAX
BACK SURFACE
A+B+C+E'+F'+G' (F>B)
VISIBLE SURFACE
Fig. 9. Boolean Model Viewing Ray Opcratiom

22 A. L. Thomas / Overlap Operations and Raster Graphics
using the same sub-division framework rather than splitting each polygon segment individually.
I LM
I RM
Fig. 10. Raster Section: Binary Subdivision
Consider the two objects shown in figure 10. If the front surfaces and the back surfaces of the two objects are taken - a linear process - along with the orientation of each surface at the mergin positions LM and RM then the objects can be deduced to exist in the direction of the arrows. If the same information is then evaluated at the centre line CC the result will indicate that the object A lies to the left of the centre and object B lies to its right. A recursive subdivison of the raster line will sort objects into order along the raster line in the manner of a quicksort, and will sup- port a divide and conquer hidden-area removal algo- rithm. This process is based on selecting tests made by comparing viewing ray distanm to half-spaces from a sampled sequence of pixel positions taken along the raster line.
10. Viewing Ray Depth Calculations
The perspective transformation for plane (4 ,b ,c ,d) can be given by the matrix transformation in the equation:
11 0 - x 2 01 [ x l l
10 0 -1 1J 1 1 J
where ( x Iry 1s 1,l) defines the pixel position and (x2ry2s2,l) dehes the eye’s position in the object space. If the eye is taken to be at the origin and the direction of viewing is taken along the z axis then the display space can be taken to be the cube shown in section in figure 11: assuming the two x and y axes coincide.
Z
(0. 0, 1 )
T Fig. 1 1. Display Space Cross Section
DISPLAY SPACE \ - +x
Y \
A plane ( a b , c , d ) in the object space gives a new plane (A,B,C,D) in the display space. This means that if the plane is transformed into the display space then the depth value at a pixel position (X,Y) is given by the equation:
Z = ( A . X + B . Y + D ) / ( - C )
Where Z is measured perpendicular to the display scrccxl.
11. Point in Volume operatioas An alternative distance which is important in many algorithms is the distance K from a pixel position to a plane measured perpendicular to the plane itself:
K = ( A . X + B . Y + D )
(Pixels lie on plane Z=O)
The sign of the value of K indicates on which side of the plane the pixel points lie. If the sign bits for all the values of K calculated for all the half-spaces in a volume model are treated as logical variables they can be combined together using the Boolean operators in the model to determine whether the point is inside the volume being modelled or not. This test applied to all the pixel positions in the display screen will give a cross sectional image if an object cuts the displays screen plane, in the way illustrated in Plates l.G and l.H.
Any plane in the object space which passes through the eye’s positon will be transformed into a plane in the display space which is perpendicular to the @lay screen. Planes which are perpendicular to the display screen or nearly so can not be represented by a depth value Z so they have to be represented by the value K. It is possible to represent a set of polygon facets as a series of planes each clipped by a pyramid volume centred on the eye. The base of each of these pyramids will be a facet and the sides will be planes
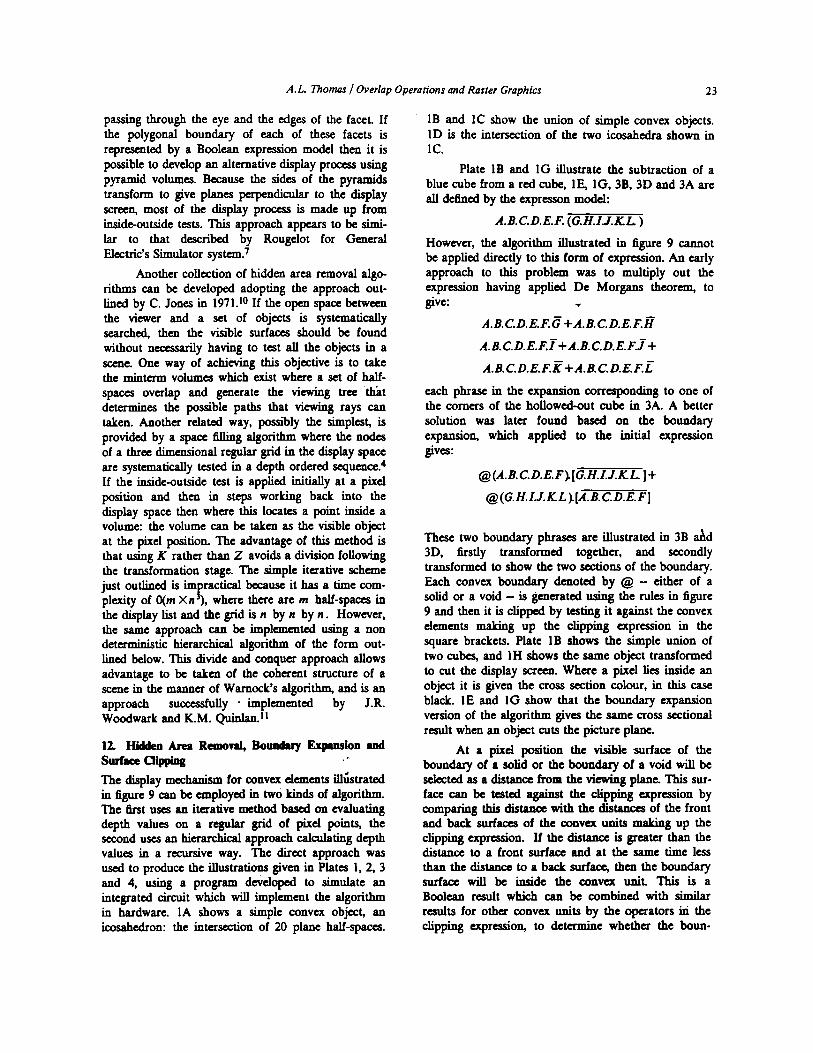
A. L. Thomas Overlap Operations and Raster Graphics 23
passing through the eye and the edges of the facet. If the polygonal boundary of each of these facets is represented by a Boolean expression model then it is possible to develop an alternative display process using pyramid volumes. Because the sides of the pyramids
screen, most of the display process is made up from insideoutside tests. This approach appears to be simi- lar to that described by Rougelot for General Electric's Simulator system.7
Another collection of hidden area removal algo- r i thms can be developed adopting the approach out- lined by C. Jones in 1971.10 If the open space between the viewer and a set of objects is systematically searched, then the visible surfaces should be found without necessarily having to test all the objects in a scene. One way of achieving this objective is to take the minterm volumes which exist where a set of half- spaces overlap and generate the viewing tree that determines the possible paths that viewing rays can taken. Another related way, possibly the simplest, is provided by a space filling algorithm where the nodes of a three dimensional regular grid in the display space are systematically tested in a depth ordered sequence! If the inside-outside test is applied initially at a pixel position and then in steps working back into the display space then where this locates a point inside a volume: the volume can be taken as the visible object at the pixel position. The advantage of this method is that using K rather than 2 avoids a division following the transformation stage. The simple iterative scheme just outlined is impractical because it has a time com- plexity of q m Xn3), where there are m half-spaces in the display list and the grid is n by n by n. However, the same approach can be implemented using a non deterministic hierarchical algorithm of the form out- lined below. This divide and conquer approach allows advantage to be taken of the coherent structure of a scene in the manner of Wamock's algorithm, and is an approach successfully . implemented by J.R. Woodwark and K.M. Qumlan.ll
transform to give planes perpendicular to the dlsplay
12. Hiddea h Removal, Bollllduy Expansion and
The *lay mechanism for convex elements i l lha ted
The 6rst uses an iterative method based on evaluating depth values on a regular grid of pixel points, the second uses an hierarchical approach calculating depth values in a recursive way. The direct approach was used to produce the illustrations given in Plates 1.2.3 and 4, using a program developed to simulate an integrated circuit which will implement the algorithm in hardware. 1A shows a simple convex object, an icosahedron: the intersection of 20 plane half-spaces.
surfre clipping
in figure 9 can be employed in two kinds of algorithm.
1B and 1C show the union of simple convex objects. 1D is the intersection of the two icosahedra shown in 1 c.
Plate 1B and 1G illustrate the subtraction of a blue cube from a red cube, 1 5 lG, 3B, 3D and 3A are all de6ncd by the expresson model:
A.B.C.D.E.F.(G.H.IJ.KL)
However, the algorithm illustrated in figure 9 cannot be applied directly to this form of expression. An early approach to this problem was to multiply out the expression having applied De Morgans theorem, to give: v
A.B.c.D.E.F.F+A.B.c.D.E.F.R
A.B.C.D.E.F.R+A.B.C.D.E.F.L each phrase in the expansion corresponding to one of the comers of the hollowedsut cube in 3A. A better solution was later found based on the boundary expansion, which applied to the initial expression
@(A. B. C. D. E. F j [ G . H.Z. J . L L ] + @(G.H.Z.J.KL j[A.B.C.D.E.F]
These two boundary phrases are illustrated in 3B ahd 3D, firstly transformed together, and secondly transformed to show the two sections of the boundary. Each convex boundary denoted by (@ - either of a solid or a void - is generated using the rules in figure 9 and then it is clipped by testing it against the convex elements making up the clipping expression in the square brackets. Plate 1B shows the Simple union of two cubes, and 1H shows the same object transformed to cut the @lay screen. Where a pixel lies inside an object it is given the cross scction colour, in this case black. 1E and 1G show that the boundary expansion version of the algorithm gives the same cross sectional result when an object cuts the picture plane.
At a pixel position the visible surface of the boundary of a solid or the boundary of a void will be selected as a distance from the viewing plane. This sur- face can be tested against the clipping expression by comparing this distance with the distances of the front and back surfaces of the convex units making up the clipping expression. If the distance is greater than the distance to a front surface and at the same time less than the distance to a back surface, then the boundary surface will be inside the convcx unit. This is a Boolean result which can be combined with similar results for other convcx units by the operators in the clipping expression, to determine whether the boun-

24 A. L Thomas 1 Overlap Operations and Raster Graphics
PLATE I

A. L. Thorns / Overlap Operations and Raster Graphics 25
PLATE 2

26 A.L. Thorns 1 Overlap Operations and Raster Graphics
PLATE 3

A.L. Thomas 1 Overlap Operations and Raster Graphics 21
PLATE 4

28 A. L. Thomas Overlap Operations and Raster Graphics
SOLID \ F FI
CLIPPING SOLID
Fig. 12. Surface Clipping
dary surface exists at the pixel position being pro- cessed. The intersection between a surface element and a clipping expression is demonstrated in figure 12.
13. Moving Displays and Transformations
The selection of front surfaces and back surfaces for a convex object is a simple linear task requiring one pass through the display list, but it is neceSSary to hold two temporary values - in separate registers -- during the process. The first value being the nearest back surface encountered so far, the second being the further front surface encountered up to that point in the processing. The depth comparisons employed in the clipping tests can also be Wried out as a linear operator, only the binary inside-outside evaluation requires a stack, and then only one bit wide. If the display list is pre- ordered so that within a c h convex volume phrase, all front surfaces are encountered before any back sur- face, the intermediate depth value for the back sur- faces can be dispensed with. At the scene transforma- tion stage of the display process this pre-ordering is relatively easy to implement, as long as the length of each convex phrase is held explicitly in the data. A new block of memory with the correct size for the next convex unit is allocated and then as the planes are transformed and reclassified as front or back surfaces they are entered into either the beghnhg or the end of the block respectively. Plate 2 shows a sequence of frames where this reclassification and reordering was being tested between each frame.
14. Patterns and Shadows Once clipping phrases could be processed a series of related operations became possible using the same basic facilities. In the simple implementation a pro- perty such as a colour was associated with each plane half-space, and this was selected for display where the half-space was visible. If colours and other propaties are allowed to be associated with clipping volumes, it becomes possible to paint patterns onto surfaces in a very simple way. Examples of this process are shown in Plate 4. The flag is defined by a single plane which
VOID
\B t
CLIPPING VOID
is cut by the clipping expression into regions of different colours. The pattern tile can be transformed as a unit in the way shown in 4.B. In the case of a single unclosed surface, if the pattern is allowed to cut the display plane a shadow of the clipping expression is created in the way shown in 4.D. This is a property of the *lay algorithm used to give cross section displays. The solution is to take the boundary expan- sion of a plane defined by A.!A
@A. [I] + @Z[A ] The second phrase as a back-facet can be pruned, to give @ A D ] . This version where the complement of the surface is included in the clipping expression gives the required result shown in 4.C.
The clipping expression allows cast shadows to be generated in a relatively direct way. A simple sha- dow volume generated by a triangular object is illus- trated in Plate 4.E. When the object' moves or when the light source moves then this volume must be transformed. To make this a task which can be car- ried out in real-time appears to require an edge model of the object to exist. The shadow volume is a projec- tion of an object's silhouette centred on the light source. The simplest way of defining this volume so far found is to take the union of the shadow volumes gen- erated by the individual facets of the object. Starting with a simple Boolean expression model edges have to be generated by applying the boundary expansion. Taking a cube A.B.C.D.E.F as an example each facet will be defined by a phrase of the form @A.B.C.D.E.F. However this is not very efficient. Where there are n planes in a volume definition the list of facets generated in this way will be n2 long. his is a problem which it is expected can be resolved by the divide and conquer hardware described below.
Once an edge model has been created, shadow volumes can be generated with very little extra compu- tation. The ideal edge model in this context appears not to be the vertex based model but the minimiscrl version of the boundary expansion described above. In the example given this will be the facet @A.B.C.D.E

29 A.L. Thomas Overlap Operations and Raster Graphics
where F is the facet opposite A . The shadow volume for this facet will be:
where the elements of the form ( A / B ) p represent planes through the point p - the light source - which are linear combination of the planes labelled in the brackets. It is necessary to calculate h in the equation:
I =4
~(ul.A+b,.(l-A)).pl = 0 1 = I
in order to obtain the required plane. This is an opera- tion which can be carried out by the transformation hardware, and can therefore potentially be carried out in real-time.
Shadows as clipping volume create an extra requirement when multiple light sources are con- sidered. Plate 4.H illustrates the result of two light sources being used to cast shadows. The problem is how to handle the area where the shadows overlap. Given a set of light sources, a point on a surface can be illuminated by any combination from the set, and it is necessary to extend the way that property data is processed by @e display algorithm. One solution is to reserve a bit positon for each light source in an illumi- nation property code. If the property value is 24 bits long then it is possible to represent the interaction of 24 light sources. The appropriate light source code is then associated with each shadow volume. When a surface point lies outside a given shadow volume then the shadow’s code is or-ed with the illumination code being generated for the surface point. A point on a surface which is in the full illumination of all the light sources in a scene will have all the bit positions set in its illumination code. This information can then be used to calculate the umbra and pen-umbra effects of multiple and extended light sources, as required.
display processing speed. In practical terms it is necessary to take advantage of scene coherence, but a divide and conquer approach is recursive and requires a greater overhead when comparing time complexity estimates than the simpler deterministic approach. It was therefore felt that if the problems could be resolved for an arbitrary subsection of a display screen in a deterministic way, then the more efficient divide and conquer approach could be used to reduce the size of a large problem to the point where it became efficient to use the direct deterministic method. This is a similar strategy to that employed in several fast sort- ing programs. Whether it would be necessary to imple- ment the divide and conquer algorithm in hardware or software was unclear at the outset.
Two basic display mechanisms had been found which could be used with Boolean expression models. The fist was based on inside-outside tests, the second on viewing ray priority tests. In the first, distances were calculated from points, perpendicular to plane half-spaces. In the second the distances were calculated from points on the display screen to the plane half- spaces, the distances being taken perpendicular to the display screen. If the display space is considered to be a cube lying behind the display screen, there are two forms of hierarchical subdivision which can be used with these display tests. The first is the oct-tree divi- sion where the cube is divided into eight identical sub-cubes. The second is the quad-tree subdivision where the display screen is divided into four identical sub-squares. Projected into three dimensions these squares generate prisms which penetrate the full depth of the display space. The oct-tree subdivision can be used with the inside-outside tests, the quad-tree subdi- vision with both the inside-outside tests and the view- ing ray priority tests. Scan line binary subdivision can also be considered a third slightly less efficient form.
15. Scene Coherence, Quad-Tree and Oct-Tree SUM- vision There were two approaches which could be taken to the design of a hidden-area-removal algorithm for Boolean expression models. The first was iterative and a deterministic approach, where every object in a Scene was compared with every other object in the same scene. The second was hierarchical and structured to take advantage of the coherence in a scene. This approach could potentially save much of the unneces- sary work carried out by the former approach. How- ever, most of the initial exploratory work has been done using the iterative approach because it was so much easier to analyse the problems in these terms. It also provided a very good starting point for designing hardware that employed parallel processing to increase
9
Fig. 13. Oct-3 and Quad-3 Subdivision.
The subdivision is based on a recursive appica- tion of binary splitting because of the simplicity of the resulting calailations. If the depth values are known

30 A.L. Thomas 1 Overlap Operations and Raster Graphics
DATA BASE
for the corners of the original quadrant or octant in figure 13, then the values for the comers of each of the subdivisions can be calculated in the following ways:
a = (a + a ) / 2 : b = (a + c ) / 2 ;
d = ( a + e ) / 2 ; f = ( a + g ) / 2 ;
or in general terms:
DIVIDE
CONQUER SYSTEM
AND -
-
o u , i ] := ( a [ k , n ] + a [ k , i ] ) / 2
ILLUMINA- TlON
PROCESSOR
where a is a two dimensional list of the four comer points of quadrants or the eight corner points of octants generated recursively. j is the index of the new subdivision, k is the index of the old subdivision. i is the index of the comers as they are processed, and n is the index of the comer associated with the new sub- division.
Given the ability to calculate the necessary dis- tance on the two hierarchical grids in the same basic way, it was then simple enough to apply the inside- outside tests or the viewing ray priority tests to the grid nodes. For this hierafchical subdivision to be use- ful it is necessary to have a way of subdividing the display list corresponding to the spatial units which make up a Boolean expression model in its standard form. The scan line test which can be used to prune a display list was shown in figure 10. The equivalent quadrant and octant based tests depend on being able to tell whether a convex volume lies inside a quadrant or octant or not. One way in which this is being done is to take each convez unit and expand it geometrically so that if it initially just touched the corner of the test cell then on expansion it would just cover the centre point of the test cell. If an expanded convex unit is found not to exist at the centre of a test cell then it can be pruned from the display list for that cell.
The mechanism for expanding a convex unit is shown in figure 14 for a single plane half-space. The point P lies outside AA, in other words the distance from A4 is positive. (Outside is given the value false
DISPLAY -
nn
so the sign bit of the distance is made 0.) To expand AA we need to move it to the otha side of P.
\
* \ Fig. 14. Convex Object Expansion
For simplicity consider AA to be perpendicular to the paper because this allows AA to be processed as a line represented by k =ux +by +c . The value of k evaluated for the point P will be the distance from AA to P.. If we move in a positive direction along the x axis, the value of k will reduce. If we move in a positive direction along they axis the value of K will also be reduced. If the sign bits for the x andy direc- tion increments of k are read as a number they will be 11 for AA or in other words binary 3. This number can be used to select a corner of the cell which is shown labelled 0.1,3,2 in cyclic order. This is done because the value of k at the comer selected in this way will be the value of k required for the expanded object.
In this way a minimum of five values in the case of quad-tree processing and nine values in the case of oct-tree processing are available for each plane surface, for each subdivision carried out during the hierarchical processing. The expanded centre-value is used to prune convex elemenis and related sub-trees in a Boolean model. the comer values are used to test each convex element in the model to see if it totally envelopes or
Fig. 15. System Data Flows

A.L. Thomas / Overlap Operations and Raster Graphics 31
covers the subdivision cell. There are a variety of ways in which this information can be used in display and
of Woodwark and Quinlan, achieves the same objec- tive and at the same time saves the extra arithmetic
HOST COMPUTER
POINT COORDINATES OR
PLANE COEFFl Cl ENTS PROPERTY
clz dlw
1 V WORKSTATION I
- - -
a h bly
_ _ - - - - - TRANSFORMATION I ENGINE
I c 7 I
_ _ _ - DISPLAY PROCESSOR _ _ - - _ - - - -
INTERPOLATOR
DEPTH DATA COLOUR DATA TEXTUREDATA SHADOW I LLUMlNATlON I DATA
\ I
TO ILLUMINATION PROCESSOR AND DISPLAY
Fig. 16. System Components

32 A.L. Thomas 1 Overlap Operations and Rasrer Graphics
directly compatible with results from conventional point and line display operations. The important aspect of both the oct-tree and quad-trec is that t h y can be implemented to use identical Specialid hardware, and the algorithms used um be imple- mented as micro-programs. For example, it is clear that a very simple oct-tree algorithm cau be prepared
boundary-expansions to define facets to give mlnlrmsed for shadow casting. For this reason decisions on algo- rithm choice at this stage in the system development are being kept open, the goal being a general geometric array processor that wi l l perform a variety of tasks, from quad and oct-tree coding to area and volume calculations. The data flow in the system order investigation has the general form shown in figure 15.
. . .
16. Conclusions The real-time interaction with line and point displays has been a facility available for some time, based on the work of SutherlandI2 and his successors. The work presented above takes several further steps towards providing the same interactive capability with area and volume primitives. As in the former case the results depend on specialised hardware providing gen- eral purpose primitives which can be used as buildmg blocks at the lowest level in a hierarchical system. The general system framework under development is shown in figure 16.
References
1. T.C. Waugh and A.L. Thomas, Geographic Information Managemenr and Mapping System (GIMMS), System manual. June 1970. J.E. Warnock, “Hidden Line Problem and the Use of Half-Tone Displays,” in Pertinent Con- cepts in Computer Graphics, ed. M . Faiman and J. Nievergelf , University of Illinios (1969). D.F. Cooke and W.H. M d e l d , “The Develop ment of a Geographic Base File and its use for
2.
3.
4.
5.
6.
7.
8.
9.
10.
11.
12.
13.
Mapping,” in Proceedings, (Urban and Regional Systems Association). A.L. Thomas, “Spatial models in Computer Based Information Systems,” in PhD. Thesis, Edinburgh University, (April 1976). B.G. Baumgart, Winged Edge Pofyhedron Representation. 1972. A.L. Thomas, “The Application of Computer Graphics to Planning,” in British Council/Lotin American Planners Seminar, Department of Urban Design and Regional Planning, Univer- sity of Edinburgh (August 1972). R.S. Rougelot, “The General Electric Computed Colour Display,” in Pertinent Concepts in Com- puter Graphics, ed. M. Faiman and J. Nievergelt, , University of Illinois (1969). M.E. Newell, RG. Newell, and T.L. Sancha, “A New Approach to the Shaded Picture Problem,” in Proceedings, A CM National Conference , (1 972). G.S. Wallins, “A Real Time Visible Surface Algorithm,” UTECH-CSc-70-101, University of Utah (June 1970). Thesis Computer science Department C. Jones, “A New Approach to the Hidden Line Problem,” Computer Journal l4(3)(August 197 1). J.R. Woodwark and K.M. Quinlan. “The Derivation of Graphics from Volume Models by Recursive Subdivision of the Object Space,” in Proceedings, Computer Graphics’BO Conference, (1 980). I.E. Sutherland, “SKETCHPAD: A Man- Macbine Graphical Communication System,” in Spartan Books, , Baltimore (1 963). A.L. Thomas, “Geometric Modelling and *lay Primitives, Towards S@alisea Hardware,” Computer Graphics 17(3)(July 1983: ACM SIGGRAPH Proceedings).