Embed Size (px)
Citation preview

Overheating Prediction and Management of Lithium-Ion
Batteries
by
Rui Zhao
A thesis submitted to the Faculty of Graduate and Postdoctoral
Affairs in partial fulfillment of the requirements for the degree of
Doctor of Philosophy
in
Mechanical Engineering
Carleton University
Ottawa, Ontario
© 2018
Rui Zhao

ii
Abstract
Lithium-ion (Li-ion) batteries have been widely used in portable devices and electric
vehicles as power sources due to their high energy density, long lifespan, no memory effect,
and low self-discharge rate. However, when overheating occurs, the performance,
reliability, durability, and safety of Li-ion batteries can be seriously deteriorated.
Overheating of Li-ion batteries typically takes place during normal high-rate
discharges and abnormal discharges such as short circuits. For high-rate discharges, the
parasitic heat generation of Li-ion batteries can accelerate the capacity fading. In abnormal
discharges, the overheating issue becomes more severe, and the battery temperature could
even reach the threshold for exothermic reactions and trigger thermal runaway.
In this thesis, phase change material (PCM)-based and heat pipe-based battery thermal
management (BTM) systems were designed to dissipate the heat generated by cylindrical
and prismatic batteries respectively during normal discharges. The proposed PCM-based
BTM system was developed through innovatively embedding PCM cores in the cylindrical
battery centers. Compared to conventional PCM-based BTM systems using PCM
externally to batteries, the proposed design consumes less PCM while achieves better
cooling effects. For prismatic batteries, ultra-thin heat pipes were sandwiched between the
batteries to manage their temperature rises. The implementation of heat pipes notably
alleviates the heat accumulation in battery packs, and the cooling performance can be
further enhanced when an evaporative cooling strategy is applied to dissipate the heat.
Regarding the more severe overheating issues caused by abnormal discharges,
internal and external short circuit experiments were performed on Li-ion batteries, and a
modified electrochemical-thermal coupling model was developed to simulate the short
circuits. Good correlations were found between experimental and numerical results for
non-thermal runaway batteries. For batteries with thermal runaways, the model can predict
whether and when the thermal runaway will occur. Besides, strategies that can hinder
thermal runaway and its propagation in battery packs were also investigated and verified
through experiments.

iii
Acknowledgments
First and foremost, I would like to express my deepest gratitude to my supervisors,
Dr. LIU Jie and GU Junjie, for their enthusiastic supervision and patient guidance. This
work could not have been accomplished without their knowledge, support, and
encouragement.
I would like to express my great appreciation to my PhD committee members, Dr.
Xianguo Li (University of Waterloo), Dr. Yuu Ono, Dr. Fidel Khouli, Dr. Steve Ulrich,
and Dr. Patrick Dumond (University of Ottawa), for their instructive suggestions and help.
I would like to thank the technical support provided by Mr. Alex Proctor and Mr.
David Raude during my experiment setup.
Many thanks to my friends, Chengchao Liang, Zicheng Wei, Long Zhai, Doma
Slaman, Menggu He, Kun Zhuang, Yu Ji, Yu Zhang, Zelig Li, Qianyue Qian, Qingfeng
Lou, and many others for their friendship and help.
I am indebted, forever, to my parents and my wife’s family for their endless
understanding, support, and encouragement. I would also like to deeply thank my my wife,
Sijie, for her tremendous support and love. I would finally thank my daughter, Annie. I
hope you can enjoy your life and be happy. I will love Sijie and Annie forever.
iv
Table of Contents
Abstract.......................................................................................................... ii
Acknowledgments ........................................................................................ iii
List of Figures ............................................................................................. vii
List of Tables ................................................................................................ xi
Nomenclature .............................................................................................. xii
Chapter 1. Introduction ............................................................................. 1
1.1 Overview and Related Issues ............................................................................ 1
1.2 Objectives ......................................................................................................... 4
1.3 Thesis Outline and Contributions ..................................................................... 5
Chapter 2. Background and Literature Review ...................................... 7
2.1 Introduction to lithium-ion (Li-ion) Battery ..................................................... 7
2.2 Energy Balance in Li-ion Battery ..................................................................... 9
2.2.1 Heat Dissipation ........................................................................................ 9
2.2.2 Heat Generation....................................................................................... 10
2.3 Thermal Management of Normally Discharged Batteries .............................. 12
2.3.1 Overheating Issues of Normally Discharged Batteries ........................... 12
2.3.2 Battery Thermal Management Systems .................................................. 13
2.3.2.1 Air Cooling ......................................................................................... 13
2.3.2.2 Liquid Cooling ................................................................................... 15
2.3.2.3 Heat Pipe Cooling .............................................................................. 16
2.3.2.4 Phase Change Material (PCM) Cooling ............................................. 18
2.4 Research on Abnormally Discharged Batteries .............................................. 24
2.4.1 Overheating Issues of Abnormally Discharged Batteries ....................... 24
2.4.2 Studies on Abnormally Discharged Batteries ......................................... 25
Chapter 3. Development of a PCM-Based BTM System for Normally
Discharged Cylindrical Li-ion Batteries ....................................................27
3.1 Overview ........................................................................................................ 27
3.2 Battery and Battery Pack Designs .................................................................. 27
v
3.3 Experiment and Thermal Model ..................................................................... 31
3.4 Results and Discussion ................................................................................... 36
3.4.1 TTC Tests for Model Validation ............................................................. 36
3.4.2 Simulations on a Single 18650 Li-ion Battery ........................................ 39
3.4.3 Solidification of the PCM Core ............................................................... 43
3.4.4 Core Cooling vs. External Cooling ......................................................... 46
3.5 Summary ......................................................................................................... 48
Chapter 4. Optimization of the PCM-Based BTM System on Li-ion
Battery Packs ...............................................................................................50
4.1. Overview ........................................................................................................ 50
4.2. Battery Pack Description ................................................................................ 50
4.3. Model Setup .................................................................................................... 52
4.4. Results and Discussion ................................................................................... 52
4.4.1 Battery Performance Index...................................................................... 52
4.4.2 PCM Core Size ........................................................................................ 53
4.4.3 PCM Core Size Distribution ................................................................... 55
4.4.4 Hybrid Cooling System ........................................................................... 60
4.4.5 Space Utilization in Battery Modules ..................................................... 63
4.5. Summary ......................................................................................................... 64
Chapter 5. Development of a Heat Pipe-Based BTM System for
Normally Discharged Prismatic Li-ion Batteries .....................................66
5.1 Overview ........................................................................................................ 66
5.2 Experimental Setup......................................................................................... 66
5.3 Results and Discussion ................................................................................... 71
5.3.1 Temperature Control ............................................................................... 71
5.3.2 Temperature Difference .......................................................................... 73
5.3.3 Large Battery Pack Cooling .................................................................... 76
5.4 Summary ......................................................................................................... 79

vi
Chapter 6. Development of a Numerical Model for Simulating
Abnormally Discharged Batteries ..............................................................80
6.1 Overview ........................................................................................................ 80
6.2 Experimental Setup......................................................................................... 80
6.3 Model Description .......................................................................................... 81
6.3.1 Electrochemical Model ........................................................................... 82
6.3.2 Thermal Model ........................................................................................ 86
6.4 Results and Discussion ................................................................................... 89
6.4.1 External Short Circuit.............................................................................. 89
6.4.2 Nail Penetration ....................................................................................... 91
6.5 Summary ......................................................................................................... 97
Chapter 7. A Comprehensive Study on Li-ion Battery Nail Penetrations
and the Possible Solutions ...........................................................................99
7.1 Overview ........................................................................................................ 99
7.2 Experiments .................................................................................................... 99
7.3 Results and Discussion ................................................................................. 102
7.3.1 Simulations on Batteries of Difference Capacities ............................... 102
7.3.2 Effects of Battery Resistance and Nail Diameter .................................. 105
7.3.3 Comparison of Strategies to Prevent Thermal Runaway ...................... 107
7.3.3.1 Decrease State of Charge ................................................................. 107
7.3.3.2 Improve Heat Dissipation................................................................. 110
7.3.3.3 Increase Contact Resistance ............................................................. 115
7.4 Summary ....................................................................................................... 117
Chapter 8. Conclusions and Future Work ...........................................119
8.1 Conclusions .................................................................................................. 119
8.2 Future Work .................................................................................................. 121
Bibliography ...............................................................................................122

vii
List of Figures
Figure 2.1. Internal structures of a) a prismatic battery and b) a cylindrical battery. ......... 8
Figure 2.2. Schematic illustrations of a) an electrochemical reaction cell, b) a prismatic
battery, and c) a cylindrical battery. .................................................................................... 8
Figure 2.3. Selected characteristics and recent research interests in PCM-based BTM
system for Li-ion battery. .................................................................................................. 19
Figure 3.1. 4-layer battery packs equipped with a) the proposed internal PCM-based BTM
system, and b) the conventional external PCM-based system. ......................................... 28
Figure 3.2. Pictures of a disassembled 18650 Li-ion battery and a schematic of the PCM
core cooling design. .......................................................................................................... 29
Figure 3.3. Photographs of the thermal test cell and its components, as well as the test setup.
........................................................................................................................................... 32
Figure 3.4. Comparisons of the experimental and simulated temperatures during the TTC
tests at heating powers of a) 1.43 W and b) 3.27 W. ........................................................ 38
Figure 3.5. Simulation results of the single 18650 Li-ion battery: temperature contours of
a) the original battery and b) the battery with a 1.25 mm PCM core at the end of the 2.5 A
discharges; temperature curves of the battery embedding PCM core of different sizes
during discharges at currents of c) 2.5 A and d) 5 A. ....................................................... 40
Figure 3.6. A plot of the capacity ratio against the PCM core radius. .............................. 41
Figure 3.7. The comparison of the temperature curves of a single Li-ion battery embedding
pure PCM and PCM/EG composite cores during a 2.5 A discharge. ............................... 42
Figure 3.8. The liquid fractions of a) pure PCM and b) PCM/EG composite at the assigned
times during the 2.5 A discharge. ..................................................................................... 43
Figure 3.9. Experimentally recorded PCM core temperature curves of the TTC filled with
a) n-octadecane and b) n-eicosane during the 3.27 W tests under different cooling
conditions. ......................................................................................................................... 45
Figure 3.10. Cycle tests of the n-eicosane filled TTC under heating powers of a) 1.43 W
and b) 3.27 W. ................................................................................................................... 46
Figure 3.11. Maximum temperature and temperature difference curves of the 4-layer
battery pack equipped with internal and external BTM systems. ..................................... 47
viii
Figure 4.1. a) Schematic illustration of a passively cooled 40-cell battery pack; b)
Schematic illustration of a hybrid cooling design for the battery pack. ........................... 51
Figure 4.2. Maximum temperature profiles of the battery pack embedded with PCM cores
of different sizes during a) 0.96 C and b) 1.92 C discharges. ........................................... 54
Figure 4.3. Plots of the maximum and minimum temperatures, as well as the temperature
differences of the batteries embedded with PCM cores of different sizes at the end of a 1.92
C discharge........................................................................................................................ 55
Figure 4.4. Temperature contours of the battery pack using different core size combinations
at the end of a 1.92 C discharge under natural convection condition. .............................. 56
Figure 4.5. a) The PCM volume ratio of different core size combinations to the combination
with uniform 3.8 mm cores; The temperature difference curves between points A and B in
the battery pack using different core size combinations during the 5 A discharge under
convective cooling with h of b) 1 W m-2 K-1, and c) 10 W m-2 K-1. ................................. 58
Figure 4.6. The liquid fraction of PCM cores (2.8 mm & 4.8 mm combination) at the end
of a 1.92 C discharge under natural convection condition................................................ 59
Figure 4.7. The maximum temperature and temperature difference profiles of the modified
battery pack during a 1.92 C discharge during forced convective cooling conditions. .... 60
Figure 4.8. Comparisons of the temperature and temperature difference profiles of the
original battery pack and the PCM-embedded battery pack cooled by air. ...................... 61
Figure 4.9. The temperature contours of the cells in a) the original battery pack and d) the
modified battery pack; The temperature contours of the air in b) the original battery pack
and e) the modified battery pack; The velocity contours of the air in c) the original battery
pack and f) the modified battery pack. .............................................................................. 62
Figure 4.10. Temperature profiles of the battery pack cooled by the hybrid cooling system
during a 1.92 C discharge. ................................................................................................ 63
Figure 5.1. Photographs of the a) heat pipe 2 and b) its internal structure. ...................... 67
Figure 5.2. a) Schematic illustration of a battery pack sandwiched by heat pipes; b)
Locations where the battery temperatures were measured. .............................................. 69
Figure 5.3. Schematic illustrations of four heat pipe-based BTM systems, a) horizontal heat
pipes with cooling fan; b) vertical heat pipes with cooling fan; c) heat pipes in a thermostat
water bath and d) horizontal heat pipes with wet cooling. ............................................... 70

ix
Figure 5.4. Temperature curves of the 3 Ah battery pack cooled by different approaches
during the 3 C discharges. ................................................................................................. 72
Figure 5.5. Temperature rises of the 3 Ah battery pack cooled through different approaches
at the assigned discharge rates. ......................................................................................... 73
Figure 5.6. Temperature difference curves of the 3 Ah battery pack cooled through different
approaches during the 3 C discharges. .............................................................................. 74
Figure 5.7. Temperature difference curves of the inner battery in the 3 Ah battery pack
cooled through different approaches during the 3 C discharges. ...................................... 75
Figure 5.8. The maximum and minimum temperature curves of the 8 Ah battery pack
cooled through natural convection and wet cooling approach during 10 A discharges. .. 76
Figure 5.9. a) Pack-level and b) battery-level temperature difference curves of the 8 Ah
battery pack cooled through natural convection and wet cooling approach during 10 A
discharges. ......................................................................................................................... 77
Figure 5.10. Temperature curves of the 8Ah battery cooled through a) natural convection
and b) wet cooling approaches during cycle tests. ............................................................ 78
Figure 6.1. Schematics of the nail penetration model: a) A thermal model that includes heat
sources from both the battery and the nail location; b) A pseudo-2D electrochemical model.
........................................................................................................................................... 82
Figure 6.2. Photograph of nailed batteries used for determining nail site resistances. ..... 88
Figure 6.3. Temperature and voltage curves of a) 0.65 Ah and b) 1.2 Ah batteries externally
shorted in ambient conditions. .......................................................................................... 90
Figure 6.4. Simulated temperature curves of the externally shorted 0.65 Ah battery. ..... 91
Figure 6.5. Comparison of the experimental and simulated temperature curves of the nailed
0.65 Ah battery.................................................................................................................. 92
Figure 6.6. The simulated electrode current density of the nailed 0.65 Ah battery. ......... 92
Figure 6.7. The temperature contours of the nailed 0.65 Ah battery at different times after
penetration......................................................................................................................... 93
Figure 6.8. Experimentally recorded temperature and voltage curves of the 1.2 Ah batteries
that a) did not experience and b) experienced thermal runaway during nail tests. ........... 94
Figure 6.9. Simulated temperature and voltage curves of the nailed 1.2 Ah battery. ....... 95

x
Figure 6.10. Temperature and voltage curves of the 5 Ah batteries during nail penetration
tests: thick electrode battery (battery No. 3) in a) experiment and b) simulation, and thin
electrode battery (battery No. 4) in c) experiment and d) simulation. .............................. 96
Figure 7.1. A plot of contact resistance Rn vs. contact area between nail and battery. .. 101
Figure 7.2. Comparison of the a) temperature, b) battery heat source, and c) boundary heat
source curves of the three batteries during the 1.8 mm-nail penetration simulations. .... 104
Figure 7.3. The maximum temperature contours of the a) 3 Ah and b) 5 Ah batteries in
penetration simulations using different nail diameters and battery internal resistance. . 106
Figure 7.4. a) The maximum temperatures of the 3 Ah and 5 Ah batteries with different
SOCs during the 1.8 mm-nail penetration simulations; The boundary heat sources of the b)
3 Ah, and c) 5 Ah batteries at different SOCs. ............................................................... 109
Figure 7.5. Plots of the maximum and surface temperatures of the 3 Ah and 5 Ah batteries
under different cooling conditions during 1.8-mm nail penetration simulations. ........... 111
Figure 7.6. Temperature and voltage curves of the a) 0.65 Ah, b) 1.2 Ah, and c) 5 Ah
batteries during nail penetration tests in a hydrogel-based BTM system. ...................... 112
Figure 7.7. Photographs of the 3 Ah battery pack a) before and b) after thermal runaway
propagation test. .............................................................................................................. 113
Figure 7.8. Temperature and voltage curves of a) the 3 Ah battery pack nailed in ambient
and b) the 8 Ah battery pack nailed in a hydrogel-based BTM system. ......................... 114
Figure 7.9. a) The maximum temperatures of the 3 Ah and 5 Ah batteries in penetrations
using different contact resistances; The b) temperature, c) voltage, and d) C-rate curves of
the 3 Ah battery during penetrations using different contact resistances. ...................... 117
xi
List of Tables
Table 2.1. Summary of the innovative heat pipe-based BTM system for Li-ion batteries.
........................................................................................................................................... 17
Table 2.2. Paraffin with suitable melting temperatures for Li-ion battery thermal
management. ..................................................................................................................... 20
Table 2.3. Summary of research on PCM-based BTM systems. ...................................... 23
Table 2.4. A few notable Li-ion battery induced accidents in recent years. ..................... 24
Table 3.1. Physical properties of n-octadecane, n-eicosane, and PCM/EG composite [107,
109, 140]. .......................................................................................................................... 30
Table 3.2. Specifications and physical properties of the thermal test cell. ....................... 31
Table 3.3. Specifications and parameters of the Samsung 18650 LiCoO2 battery. .......... 34
Table 3.4. Summary of the experimental results and the calculated heat generations of the
18650-type battery. ........................................................................................................... 35
Table 3.5. Comparisons of the performance indicators of core and external cooling systems.
........................................................................................................................................... 48
Table 4.1. Summary of the battery performance data of selected battery packs. ............. 64
Table 5.1. Specifications of the 3 Ah and 8 Ah batteries. ................................................ 68
Table 5.2. Specifications of heat pipes and thermal pads. ................................................ 68
Table 5.3. Summary of the experimental results of the 3 Ah battery pack....................... 75
Table 6.1. Specifications of batteries used in short circuit tests. ...................................... 81
Table 6.2. Electrochemical and thermal parameters of the batteries used in the simulation.
........................................................................................................................................... 85
Table 6.3. Battery parameters used in the nail penetration model. ................................... 88
Table 7.1. Specifications of LiCoO2 batteries used in short circuit simulations or tests*.
......................................................................................................................................... 101
Table 7.2. The stoichiometry of 3 Ah and 5 Ah batteries at the assigned SOCs. ........... 108

xii
Nomenclature
as
A
c
cs,max
cs,0
cp
D
𝐸act𝛹
F
h
h
hf
I
i
jLi
k
k
la
lc
ln
active surface area per electrode unit volume, m2 m-3
area, m2
volume-averaged concentration of lithium in a phase, mol m-3
maximum concentration of lithium in solid phase, mol m-3
initial concentration of lithium in solid phase, mol m-3
specific heat capacity of component inside cell, J kg-1 K-1
diffusion coefficient of lithium species, m2 s
Activiation energy, J mol-1
Faraday’s constant, 96487 C mol-1
height, m
convective heat transfer coefficient, W m-2 K-1
latent heat, kJ kg-1
current, A
current density, A m-3
reaction current density, A m-3
conductivity of different components inside cell, W m-1 K-1
ionic conductivity, S m-1
thickness of aluminum foil, m
thickness of copper foil, m
thickness of negative electrode, m

xiii
ls
lp
l
m
P
Q
q
qr
qe
qj
qn
r
R
Rb
Rn
Rs
t
𝑡+0
T
U
Uref
V
thickness of separator, m
thickness of positive electrode, m
thickness of electrochemical cell, m
battery mass, g
Average heat generation rate, W
Overall heat generation, J
volumetric heat generation rate, W m-3
volumetric reaction heat generation rate, W m-3
volumetric reversible heat generation rate, W m-3
volumetric ohmic heat generation rate, W m-3
volumetric nail location heat generation rate, W m-3
radius or radial coordinate, m
universal gas constant, 8.3143 J mol-1 K-1
bulk resistance of battery, mΩ
nail location resistance, mΩ
radius of solid particles, m
time, s
transference number of lithium-ion with respect to the velocity of solvent
temperature, K
open circuit potential, V
reference open-circuit potential of an electrode reaction, V
volume, m3
xiv
V
x
x
y
working voltage, V
x coordinate
negative electrode solid phase stoichiometry
positive electrode solid phase stoichiometry
Greek symbols
α
ε
ε
η
κ
σ
σ
ρ
θ
γ
Φ
Ψ
volumetric battery capacity, mAh m-3
volume fraction or porosity of a phase
emissivity
surface over-potential of an electrode reaction, V
reaction rate constant
conductivity of solid active materials in an electrode, S cm-1
Stefan-Boltzmann constant, 5.67 × 10⁻⁸ W m-2 K-4
density of the battery, kg m-3
capacity ratio
liquid fraction
Space utilization ratio
electrical potential in a phase, V
A general property
Subscripts
amb ambient
xv
c
dis
e
f
l
m
o
p
ref
s
s
coolant
discharge
electrolyte phase
conductive filler additive
liquid phase
melting point
initial state
polymer phase or in parallel
with respect to a reference state
solid phase or in series
solid state or solidification
Superscripts
eff
Acronyms
ARC
BTM
DSC
EG
EV
NSE
effective value
accelerating rate calorimetry
battery thermal management
differential scanning calorimetry
expanded graphite
electric vehicle
normalized specific energy

xvi
PAAS
PCM
PCS
PHEV
SE
SEI
SOC
TTC
sodium polyacrylate
phase change material
phase change sludge
plug-in hybrid electric vehicle
specific energy
solid electrolyte interface
state of charge
thermal test cell

1
Chapter 1. Introduction
1.1 Overview and Related Issues
The currently available battery electric vehicles (EV) in North America have one thing
in common, they employ the lithium-ion (Li-ion) batteries as their power sources. Since
the first commercialization in 1991, Li-ion battery technology has shown continuously
increasing market share and has attracted a significant amount of research interests in
producing batteries with higher energy density, longer life, and lower costs [1]. Although
a large amount of power can be supplied from a compact Li-ion battery system, the parasitic
heat generation at high discharge rates and the heat surge during short circuits can degrade
battery performance and even lead to thermal runaway.
Generally, an operating temperature range between 15oC and 35oC and a temperature
difference within 5oC are essential for Li-ion batterires to perform soundly and to have a
long service life [2]. However, the heat generation of Li-ion batteries, especially at high
rates, can significantly accelerate the temperature elevation and aggravate the temperature
nonuniformity of batteries, and the situation is made more severe when the batteries are
compactly packed, which may significantly shorten the lifespan of batteries [3, 4]. To
control the temperature rise and temperature gradient of batteries within allowable ranges,
thus improving the stability and electrochemical performance of the battery system, the
battery thermal management (BTM) system is an indispensable component.
Over the past several years, many BTM approaches have been proposed and studied
[5]. They can be classified into two categories: active and passive BTM systems. Active
BTM systems are typically achieved by using fans or pumps to circulate cooling mediums,
such as air [6-10] and liquid [11, 12] so that the heat can be extracted from the battery
packs. Passive cooling systems make good use of the physical properties of various cooling
mediums implemented between neighboring batteries to absorb the heat released during
operation, thereby keeping the battery temperature at a relatively low level. The present
passive cooling systems mainly rely on water [13-15] or phase change materials (PCM)
[16-20] for heat absorption.

2
Each BTM system has its advantages in coexistence with disadvantages. For instance,
because of the strengths such as the direct access, low viscosity, and light weight of air, as
well as the simplicity and low cost of the BTM system, air cooling is one of the most
commonly adopted BTM systems in our daily life. However, it still has potential
weaknesses including blocked cooling channels or inlets, intake of debris, malfunction of
the cooling fan, relatively large temperature gradient during aggressive discharges, etc.
Current research on air cooled systems is mainly focused on the optimization of the battery
layout and flow configuration to achieve better cooling performance, with less emphasis
on the space utilization (energy density) of the entire battery module, which in fact is of
great importance for applications with rigorous space constraints.
Another active BTM system, the heat pipe-based BTM system, is also extensively
studied in these years. It can be classified into air-cooled [21, 22] and water-cooled [23]
systems, according to the cooling strategies applied at the condenser side of the heat pipe.
Compared to direct air or water cooling, the heat pipe-based BTM system avoids the direct
contact between batteries and cooling mediums, and its high thermal conductivity can
ensure even temperature distributions inside battery packs. However, its average cooling
potential and relatively high cost make this cooling design less competitive compared to
other BTM systems.
As for passive BTM systems, the PCM-based BTM system is extensively studied. It
manages the heat generated from batteries by using the latent heat of the PCM stored at the
solid-liquid phase transition stage. Compared to the active BTM system, the PCM-based
BTM system is simple in structural design and has no parasitic power consumption, but it
will add extra weight to the energy storage system. Therefore, the PCM cooling system
should be designed using a minimal amount of PCM to manage the temperature of a battery
system in an allowable range. Initially, PCM was directly used to envelop batteries in BTM
systems [16]. However, several works revealed that the low thermal conductivity of PCM
could substantially constrain the thorough exertion of its cooling potential. Thus, expanded
graphite (EG) was produced as matrices to contain the PCM to increase the thermal
conductivity of entire cooling systems [24, 25]. One merit of this composite is that the
liquid state PCM could be immobilized inside the matrix with the strong capillary force
3
generated by the EG matrix, thus avoiding leaking problems. In practice, this strategy has
several limitations. For examples, it was found that at least 30 wt.% EG is required to
maintain leakage at a low level, which substantially reduces the latent heat of the PCM
cooling system [26, 27]. Also, the manufacturing process and the potential fracture of the
PCM composite could increase initial and maintenance costs of the BTM system.
The above mentioned BTM systems can generally handle the overheating of battery
packs during normal charges/discharges. However, in more severe overheating conditions,
such as during abnormal discharges typical of short circuits, most of the BTM systems are
incapable of suppressing the rapid-released heat. Short circuits happen when positive and
negative electrodes are electrically contacted due to mechanical abuse, manufacturing
defect, or other reasons, and a great amount of heat can be generated in a very short time.
If the heat is not dissipated efficiently, the battery temperature will exceed a critical point,
above which the electrolyte, active materials, and solid electrolyte interface film can
exothermically decompose, eventually leading to thermal runaway and even fire.
To date, the research on battery short circuits mainly includes safety experiments
and/or simulations of the electrochemical and thermal behaviors of Li-ion batteries during
short circuits [28-34]. It was found that among various abuses such as crushing, external
short circuit, internal short circuit (nail penetration), exposure to heat, etc., the nail
penetration is one of the most dangerous scenarios for Li-ion batteries due to the
concentrated heat generation at the short circuit location, which could initiate the
exothermic reactions of active materials and electrolyte, and eventually lead to thermal
runaway [5]. In general, experiments can be used to validate the simulation results and are
useful for revealing the causes of defects, but they are dangerous to perform and money
consuming, and the results vary with types of Li-ion batteries used. Consequently, reliable
numerical models can be used as a tool to provide detailed analyses of Li-ion batteries in
abnormal discharges. To date, many numerical simulations have been carried out to study
the behavior of Li-ion batteries in abusive conditions [35-39], a part of which are focused
on Li-ion battery nail penetration [40-43]. An electrochemical-thermal coupling model [44]
is generally employed to simulate the penetration process, which is helpful in interpreting
the physics of Li-ion batteries by giving a detailed interrelation of the electrochemical

4
processes and thermal responses. For example, the thermal behaviors of a 5.25 Ah Li-ion
battery using a 3 mm steel nail penetration were simulated with the coupling model [42],
in which a positive electrode boundary condition was manually set to produce the localized
heat at the nailed region. Although the model provided accurate temperature profiles of the
penetrated battery, it is unable to capture short circuit scenarios of Li-ion batteries of
different capacities. Furthermore, to our knowledge, current research that can provide
solutions to suppress thermal runaway and/or prevent thermal runaway propagation in
battery packs during nail penetrations is scare. Efforts are needed to be put into
comprehending the causes of thermal runaway and developing advanced techniques to
make Li-ion battery safer.
1.2 Objectives
In the previous section, overheating issues of Li-ion battery in normal and abnormal
discharges, as well as current research works and their limitations were briefly discussed.
To tackle the related issues, in this thesis, two advanced BTM systems and a
comprehensive model are developed to improve the thermal performance and safety of Li-
ion batteries during normal and abnormal operations, respectively. The specific strategies
are summarized as follows:
1) To develop a practical BTM system for cylindrical Li-ion batteries. Due to their
high energy density, cylindrical Li-ion batteries are more commonly used in pure EVs, in
which the batteries are discharged at relatively low rates. The emphasis is placed on
simplifying the cooling process and reducing the weight and cost of a phase change
material (PCM)-based passive BTM system.
2) To develop a robust BTM system for prismatic Li-ion batteries. Hybrid electric
vehicles and electric racing vehicles are mainly equipped with prismatic Li-ion batteries
due to their high power density. The batteries are more frequently charged and discharged
at high rates. Thus, a heat pipe-based active BTM system is developed to handle the heat
generation.

5
3) To develop an electrochemical-thermal coupling model for simulating short circuits
of Li-ion batteries. Possible strategies that can prevent thermal runaway of Li-ion batteries
are also investigated based on the coupling model.
1.3 Thesis Outline and Contributions
A version of Chapter 2 has been published in Journal of Power Sources [Zhao R,
Zhang S, Liu J, Gu J. A review of thermal performance improving methods of lithium ion
battery: Electrode modification and thermal management system. Journal of Power
Sources 2015; 299: 557-577.], which provided a brief introduction of Li-ion battery
technology, as well as a state of the art review of Li-ion battery modeling, thermal
management, and short circuit research.
A version of Chapter 3 has been published in International Journal of Energy Research
[Zhao R, Gu J, Liu J. Performance assessment of a passive core cooling design for
cylindrical lithium-ion batteries. International Journal of Energy Research 2018; 42: 2728-
2740.], which elaborated the design of a novel PCM-based internal BTM system for
cylindrical batteries. In particular, a thermal test cell was first fabricated in the paper, and
it was used to verify the cooling effectiveness of the proposed design and to validate a
thermal model. Simulations were then conducted based on the validated model to study the
cooling effects of the proposed BTM system on authentic batteries. Compared to the
conventional PCM-based external BTM system, the proposed system is simple in design,
and it uses less PCM and achieves a better cooling effect for cylindrical Li-ion batteries.
A version of Chapter 4 has been published in Energy [Zhao R, Gu J, Liu J.
Optimization of a phase change material based internal cooling system for cylindrical Li-
ion battery pack and a hybrid cooling design. Energy 2017; 135: 811-822.], which
optimized the PCM-based internal BTM system proposed in Chapter 3. Specifically, a 40-
cell battery pack was optimized in both passive and active cooling modes. A uniform
temperature distribution can be obtained in the battery pack when relatively thicker PCM
cores are embedded in the interior batteries. In addition, without changing the battery
appearance, the PCM-embedded batteries can be assembled in battery packs with cooling
channels between battery rows to enjoy both the PCM cooling and air cooling.

6
A version of Chapter 5 has been published in Journal of Power Sources [Zhao R, Gu
J, Liu J. An experimental study of heat pipe thermal management system with wet cooling
method for lithium ion batteries. Journal of Power Sources 2015; 273: 1089-1097.]. In this
Chapter, ultrathin flat heat pipes were used to sandwich prismatic batteries to manage their
heat generation. A heat pipe-wet cooling combined active BTM design was proposed,
which was found to be effective in maintaining the battery temperature at a low level even
during high-rate discharges.
A version of Chapter 6 has been published in Applied Energy [Zhao R, Liu J, Gu J.
Simulation and experimental study on lithium ion battery short circuit. Applied Energy
2016; 173: 29-39.], in which an electrochemical-thermal coupling model was developed to
simulate Li-ion battery external and internal short circuits. The coupling model can
simulate the temperature changes of non-thermal runaway batteries, and it can provide
good predictions of the likelihood of thermal runaway and its occurrence time of unsafe
batteries.
A version of Chapter 7 has been published in Energy [Zhao R, Liu J, Gu J. A
comprehensive study on Li-ion battery nail penetrations and the possible solutions. Energy
2017; 123: 392-401], which gave a comprehensive study on battery nail penetration due to
its dangerous character. The effects of several parameters, such as battery resistance, size,
and capacity, as well as nail size, on the thermal behaviors of internally shorted batteries
were obtained, and the possible solutions in suppressing the thermal runaway and
preventing thermal runaway propagation were achieved.
Finally, the concluding remarks and some future research works are summarized in
Chapter 8.
7
Chapter 2. Background and Literature Review
2.1 Introduction to lithium-ion (Li-ion) Battery
Batteries are often classified as primary (non-rechargeable) or secondary
(rechargeable) depending on their capability of being electrically recharged, and this is
determined mainly by the reversibility of the anodic and cathodic electrode reactions. In
1991, while solving various problems and improving the performance of Li-ion battery,
Sony first commercialized the Li-ion battery. Nowadays, Li-ion batteries have emerged as
the most promising energy storage technology in recent years due to their higher energy
density, lighter weight, no memory effect, and lower self-discharge rate, when compared
to other rechargeable battery technologies, such as nickel-cadmium and nickel-metal
hydride batteries [1].
To have a better understanding of the working mechanism and to simulate the
charging and discharging processes of a Li-ion battery, the internal structure and each
component inside the Li-ion battery should be well understood. Fig. 2.1 shows the internal
structure of disassembled prismatic and cylindrical Li-ion batteries, in which the white
plastics are the separators, and the black ones are either current collectors with positive
electrodes (cathode) or negative electrodes (anode). It is seen that a Li-ion battery is
composed of many layers of electrochemical cells. In Fig. 2.2, the schematic illustration of
an electrochemical reaction cell inside Li-ion battery is drawn. The reaction cell consists
of layers of copper current collector, negative electrode, separator, positive electrode and
aluminum current collector from left to right, and the electrolyte permeates the positive
and negative electrodes and the separator and acts as a medium to transfer the ions during
electrochemical reactions. During discharges, equal numbers of lithium ions and electrons
are generated at the interface of the anode and electrolyte. The lithium ions transfer through
the electrolyte solution and separator to react with the electrons that flow through the
electrodes, conductive additives, current collectors, and the external circuit. As an example,
the reaction of a LixMn2O4 battery during the discharge process is given:
Negative electrode: LiyC6 = C6 + yLi+ + ye-
Positive electrode: Lix-yMn2O4 + yLi+ + ye- = LixMn2O4

8
Overall reaction: Lix-yMn2O4 + LiyC6 = LixMn2O4 + C6
With the electrochemical reaction cells stacked or coiled, prismatic (Fig. 2.2b) or
cylindrical (Fig. 2.2c) Li-ion batteries can be manufactured, respectively.
Figure 2.1. Internal structures of a) a prismatic battery and b) a cylindrical battery.
Figure 2.2. Schematic illustrations of a) an electrochemical reaction cell, b) a prismatic
battery, and c) a cylindrical battery.

9
2.2 Energy Balance in Li-ion Battery
The energy balance equation, which guides the determination of temperature change
in a Li-ion battery, has a general form of [21]:
𝜌𝑐𝑝
𝑑𝑇
𝑑𝑡= ∇ ∙ (k∇𝑇) + 𝑞 (2.1)
where cp, T, t, k, and q indicate battery density, specific heat, temperature, time, thermal
conductivity, and battery volumetric heat generation, respectively. The term on the left-
hand side represents the heat stored inside the battery. The first term on the right-hand side
is the three-dimensional heat conduction term, and it can be represented in a 2D in
Cartesian or cylindrical coordinate if the temperature gradient in one direction is ignored
[45, 46].
2.2.1 Heat Dissipation
When the Li-ion battery is cooled by air, the boundary condition correlated to the heat
conduction term in the x-direction can be written as (similar for the other directions if the
same boundary condition is applied):
−k
𝜕𝑇
𝜕𝑥= ℎ(𝑇 − 𝑇amb) + εσ(𝑇
4 − 𝑇amb4) (2.2)
where the first term on the right-hand side represents the convective heat transfer, followed
by the radiation heat transfer term, which is sometimes omitted for simulation at low
temperature. The terms h, , and Tamb are the convective heat transfer coefficient,
emissivity, Boltzmann Constant, and ambient temperature, respectively.
When the battery is directly contacted by coolant (liquid or solid) without phase
change, the heat flux across the boundary of the battery and coolant will be same, which
gives:
k𝜕𝑇
𝜕𝑥= k𝑐
𝜕𝑇𝑐𝜕𝑥
(2.3)
and the energy conservation equation in the coolant is:

10
𝜌𝑐𝑐𝑝𝑐
𝜕𝑇𝑐𝜕𝑡
= ∇ ∙ (k𝑐∇𝑇𝑐) (2.4)
where the subscript c indicates the properties of the coolant. At the exterior surfaces of the
coolant, the convective and radiative cooling boundary conditions are the same as (2.2).
If the coolant experiences phase change during the heat absorption, the apparent heat
capacity method can be used to calculate the temperature variation [47]:
ρ𝑐𝑝,𝑃𝐶𝑀
𝜕𝑇
𝜕𝑡= ∇ ∙ (k∇𝑇) (2.5)
where
c𝑝,𝑃𝐶𝑀 =
{
𝑐𝑝,s 𝑇 < 𝑇s Solid phase
(1 − 𝛾)𝑐𝑝,s + 𝛾𝑐𝑝,l +ℎ𝑓
𝑇l − 𝑇s 𝑇s < 𝑇 < 𝑇l Solid/liquid phase
𝑐𝑝,l 𝑇 > 𝑇l Liquid phase }
(2.6)
wherein, hf is the latent heat of solid-liquid phase change, cp,s and cp,l indicate the specific
heats of solid and liquid PCM, respectively. γ is the liquid fraction of the PCM, which is
given by:
𝛾 =
𝑇 − 𝑇s𝑇l − 𝑇s
, 𝑇s < 𝑇 < 𝑇l (2.7)
where Ts and Tl are the lower and upper bounds of the PCM melting range.
2.2.2 Heat Generation
Different forms of the heat generation term 𝑞 have been examined by Bandhauer et
al. for Li-ion battery discharged under normal conditions [48]. In this section, two most
frequently used expressions that are obtained from the thermodynamic energy balance and
the electrochemical model are introduced as follows.
The most prevalent heat generation form is estimated by Bernardi et al. [49] and its
simple form yields [50]:
𝑞 = 𝐼(𝑈 − 𝑉) − 𝐼 (𝑇
𝜕𝑈
𝜕𝑇) (2.8)

11
The first term on the right-hand side is the overall contribution of the ohmic loss inside
battery cell, the charge transfer overpotential at the interface, and the mass transfer
limitations, where U and V are the open circuit potential and cell operating potential,
respectively. The second term is the entropy heat generation term or reversible heat term,
which is occasionally neglected in high rate discharges. The significance of entropy heat
in total heat generation has been explored in Refs. [51, 52].
Another widely used set of heat generation formulas are functions of parameters
obtained from an electrochemical-thermal coupling model. From an electrochemistry
perspective, by coupling a thermal model, more details about localized reactions and
thermal behaviors can be clearly acquired since many electrochemical parameters vary
with location and temperature. Compared to (2.8), the computational cost using the
coupling model is significantly higher, but such expense is necessary when the heat
distribution on an electrochemical cell is of interest, such as during the design of electrodes.
The heat generation calculated from the coupling model has three sources, which are
reaction heat, entropy heat, and ohmic heat (or Joule heat) [53]:
𝑞𝑟 =∫ 𝑗𝐿𝑖(Ф𝑠 −Ф𝑒 − 𝑈)𝑑𝑥𝑙𝑛+𝑙𝑠+𝑙𝑝0
𝑙 (2.9)
𝑞𝑒 =∫ 𝑗𝐿𝑖𝑇
𝜕𝑈𝜕𝑇
𝑑𝑥𝑙𝑛+𝑙𝑠+𝑙𝑝0
𝑙 (2.10)
𝑞𝑗 =
∫ [𝜎eff (𝜕Ф𝑠
𝜕𝑥)2
+ 𝑘eff (𝜕Ф𝑒
𝜕𝑥)2
+ 𝑘𝐷eff 𝜕(𝑙𝑛 𝑐𝑒)
𝜕𝑥𝜕Ф𝑒
𝜕𝑥] 𝑑𝑥
𝑙𝑛+𝑙𝑠+𝑙𝑝0
𝑙
(2.11)
In the electrochemical cell, since only the electrodes and separator (negative electrode, ln;
separator, ls; positive electrode, lp, as shown in Fig. 2.2a) are the heat generation
components, the volumetric heat generation rate of the entire cell is averaged over the entire
thickness (𝑙) of the electrochemical cell. In (2.9), jLi denotes the reaction current density in
the electrochemical model; Ф𝑠 , Ф𝑒 , and U are the electrical potentials of solid active
material, electrolyte, and a reference potential, respectively. For the joule heating (2.11),
the first term of the integrand refers to the ohmic heat generated in the solid electrode, and

12
the last two terms describe the heat from charge transfer in the liquid electrolyte. The terms
𝜎eff , keff, 𝑘𝐷eff , ce are conductivities of electrode and electrolyte, electrolyte diffusional
conductivity, and electrolyte concentration, respectively.
With substituting the heat dissipation term and heat generation term into the energy
balance equation, the temperature data of the Li-ion battery can be calculated in finite
element solvers.
During abnormal discharges, Li-ion batteries may also have the localized heat
generation in addition to the discharge heat generation. In [42], a localized short circuit
heat generation rate per unit area was proposed:
𝑆scsurf =
1
2𝑟nail𝑆sc (2.12)
where 𝑆scsurf is the localized heat generation per unit area at the short circuit region, 𝑟nail is
the radius of the nail, and 𝑆sc is the battery heat generation rate calculated from (2.8) with
setting a cathode boundary condition of:
Ф𝑠,𝑝 = 0.5exp (−0.07𝑡) (2.13)
where Ф𝑠,𝑝 is the potential of the positive electrode and t is the time after short circuits.
2.3 Thermal Management of Normally Discharged Batteries
2.3.1 Overheating Issues of Normally Discharged Batteries
A high operating temperature can result in several side effects on Li-ion batteries,
such as short lifespan, reduced capacity and power with cycling, and even thermal runaway
in some extreme conditions. The capacity fading and power loss of Li-ion battery have
been reviewed by Vetter et al. [54]. Solid electrolyte interface (SEI) is a passivation layer
formed on electrode active materials during the cycling of Li-ions, which will consume
active Li-ions and electrolyte. They summarized that the development of solid electrolyte
interface (SEI) and SEI dissolution on the carbonaceous anode, the crystal structure
instability, active material dissolution, and SEI formation on the cathode [55-58] are all
factors that give rise to the depletion of running Li ions and active materials and the

13
increase of internal resistance, which finally induce capacity fading and power reduction
of Li-ion batteries. At high temperatures, these processes can be accelerated and cause
severe loss of available energy [59, 60].
Provided that available lithium ion loss and active material decline are the two origins
of capacity fading [61], Santhanagopalan et al. [62] tested LiCoO2/C battery at 5 different
initial temperatures: 5oC, 15oC, 25oC, 35oC, 45oC and compared the changes of the two
factors from the calculated active material weight and non-dimensional lithium
concentration inside the electrodes. It was found that at low temperature (5oC), the active
material loss only accounted for 1% of the total capacity loss. Conversely this was the
predominate factor as the temperature exceeded 35oC. Some other research related to the
fading mechanisms of LiMn2O4 and LiFePO4 batteries are also available in Refs. [60, 63].
Although several experiments have shown that the high-temperature performance of Li-
ion batteries could be improved by coating or doping cathode materials [64-66], higher
capacity fading rates were still observed as the operating temperature increased.
2.3.2 Battery Thermal Management Systems
To ensure long lifespans and smooth operations of Li-ion batteries, battery thermal
management (BTM) systems that can create suitable temperature ranges for batteries to
charge and discharge are indispensable components. Generally, the BTM system consists
of either air cooling, liquid cooling, heat pipe cooling, or PCM cooling. Different BTM
systems have both their advantages and disadvantages, and a BTM system should be
properly selected for batteries used in different applications. These four categories of BTM
systems will be introduced in the following sections:
2.3.2.1 Air Cooling
Air cooling can be classified into two categories, natural convection and forced
convection, depending on whether a cooling fan assists with the cooling process. Forced
convection attracts more research interest due to its high convective heat transfer
coefficient and satisfying effectiveness in cooling.

14
Because of the advantages such as direct access, low viscosity, and light weight of air,
and the simple configuration, low cost, and easy maintenance of the cooling system, air
cooling is one of the most commonly adopted cooling strategies in our daily life, widely
used in electronics and vehicles [6-10]. Since the specific heat capacity of air is much lower
than many other cooling mediums, this method is normally applied to batteries with low to
moderate heat generation rates. The development of the air-based BTM system is mainly
focused on the optimization of the 1) air flow rate, 2) battery layout, and 3) flow path [67-
74].
1) In Ref. [68], the cooling performance of different air cooling designs for cylindrical
cell battery pack are investigated through both numerical and analytical analyses. Different
inlet Reynolds (Re) numbers were employed and compared, and it was found that a higher
Re number could lead to a lower maximum temperature but a relatively uneven temperature
distribution. The ratio between the cooling channel size and the battery pack size was also
characterized as an important factor that could affect the average temperature of the battery
pack.
2) Research on advancing the cell layout aims at designing battery pack with an
optimal cell arrangement and spacing to achieve a better cooling effect and a lower energy
consumption. In Ref. [67], the temperature distributions in an 8-cell prismatic battery pack
with different cell spacings and air flow rates were simulated. It was found that the peak
temperature increases but the temperature uniformity improves as the cell gap widened at
a constant flow rate, and an unequal spacing is favorable because it offers a relatively
unblocked cooling environment for the center cells. The arrangement of cylindrical Li-ion
batteries has also been explored [8, 9]. Yang et al. [8] studied the thermal behaviors of
aligned and staggered 6 × 10 battery packs during discharges with air cooling and claimed
that the aligned battery pack with specific longitudinal and transverse intervals excelled
over the staggered layout.
3) In applications that require a fixed battery layout, the cooling performance can be
improved by changing the flow paths or the structures of the inlet and outlet [69-72]. Noting
that the continuous cooling in one direction can lead to a higher temperature at the outlet,
the non-uniformity can be resolved by switching the air flow direction after a certain time
15
interval. For example, a reciprocating air cooling design attains a 72% drop in temperature
difference with a switching time interval of 120 s [69]. In Ref. [71], battery packs with
different flow channel configurations were simulated. It was found that the use of a Z-type
channel and tapered cooling ducts lowered the maximum temperature and temperature
gradient inside the battery pack, and the assembly of orifices at the closed end of the lower
duct further promoted the cooling effect by lessening the pressure.
2.3.2.2 Liquid Cooling
When a compact battery pack discharges at a high-rate, both natural and forced air
convection will be unable to manage the battery temperature within an allowable range.
Having a much higher convective heat transfer coefficient, liquid-based BTM systems
could achieve a better performance than air cooling [75], but it generally requires more
complicated configurations to achieve.
The liquid cooling can also be categorized into active [76-82] and passive [13-15, 83-
84] modes depending on whether the liquid is compelled to circulate during the cooling
process. The active liquid cooling method is more efficient than the passive one in
controlling the temperature of batteries thanks to the continuous cooling of the coolant in
the condenser, but this type of system is more complex and has a higher technical
requirement on the overall circulatory system. In comparison, the passive mode cools down
the battery by using the energy storage ability of liquids, and the corresponding BTM
systems are relatively easy to construct, operate, and oversee throughout operations. The
following text presents a brief review of the progress in both active and passive liquid-
based BTM systems.
Active liquid-based BTM systems have been investigated in many studies with
various focuses. For example, Karimi and Dehghan [85] compared the performance of two
mediums, silicon oil and air, in the flow network cooling circulations for Li-ion battery
packs. Recently, the cold plate has emerged as a popular tool to achieve the active liquid
cooling due to its compactness [77-80]. The cold plate cooling method relies on the
circulation of liquid inside the mini-channels that are closely arranged in the plate. When
the fluid cools down in the condenser, the cold plate can continuously offer excellent
16
performance in dissipating the heat [77]. A three-dimensional thermal model was
developed in Ref. [11] to examine the performance of the cold plate with water as the
medium. By adjusting the number of channels, the flow rate, and the flow directions inside
the channels, the optimal parameters were obtained. The effect of the channel geometry
was also test in another study by looking at the temperature uniformity, mean temperature,
and pressure drop in different serpentine-channel designs [79].
Attempts have also been made to advance passive liquid-based BTM systems. Boiling
liquid cooling is one of passive liquid cooling methods that take advantage of the
evaporation of the low boiling point liquids to absorb heat. For example, hydrofluoroether
liquid (NovecTM 7000) is an environmentally friendly inflammable liquid with a high
electric resistance, and it has a boiling temperature of 34oC. In Ref. [83], Hirano et al.
experimentally tested the performance of NovecTM 7000 as the medium in a battery pack.
It was found that the maximum temperature of the battery pack (ten 1Ah battery cells in
series) was able to be kept at around 35oC even at a high discharge rate of 20 C (20 C
means the battery is fully discharged in 1/20 hours).
2.3.2.3 Heat Pipe Cooling
A typical heat pipe is composed of a sealed pipe and its compatible working fluid that
is kept at the saturation pressure of the fluid at the corresponding fluid temperature. During
heat transfer, the fluid boils at the hot surface and condenses at the cold surface. The
movement of the fluid can quickly transfer the thermal energy between the evaporator and
condenser of the heat pipe. Owing to high thermal conductivity, heat pipes have been
widely used in electrical devices, e.g., laptops, to transfer heat from the heat source to the
condenser side for dissipation. For usage on Li-ion batteries, the capillary-based heat pipes
patented by General Motors [86] are commonly used because of their compactness and
flexibility, which can accommodate different battery geometries. The latest research on
heat pipe-based BTM systems is summarized in Table 2.1.

17
Table 2.1. Summary of the innovative heat pipe-based BTM system for Li-ion batteries.
Heat pipe type Method Heat Source Cooling source Battery pack Variables Authors
Ultra-thin flat heat
pipe
Experiment Battery pack Natural convection
Forced convection
Water bath
Wet cooling
4S1P 3Ah
4S1P 8Ah
Pouch batteries
Angle of heat pipe
Cooling source
Spray frequency
Zhao et al. [87]
Flat heat pipe Experiment Electric heater Natural convection
Forced convection
- Wind speed
Heat sink vs. heat pipe + heat sink
Tran et al. [22]
- Experiment
Simulation
One cell Natural convection
Forced convection
12 Ah cylindrical
battery
Natural convection vs. heat pipe Wu et al. [21]
Tube heat pipe with
flat condenser
Experiment Electric heater Thermostat bath - Heating power
Angle of heat pipe
Rao et al. [23]
Oscillating heat pipe Experiment Electric heater Thermostat bath - Heating power
Angle of heat pipe
Rao et al. [88]
Tube heat pipe Experiment Electric heater Adiabatic
Forced convection
- Fan inlet area
Air flow direction
Angle of heat pipe
Heating power
Tran et al. [89]
Tube heat pipe with
flat condenser
Experiment Simulated battery
container
Liquid box - Heating power
Heat pipe cold exposure temperature
Wang et al. [90]
Pulsating heat pipe Experiment Heating cartridges Forced convection - Heating power
Working fluid
Air velocity and temperature
Angle of heat pipe
Burban et al.
[91]
Tube heat pipe Analytical and
numerical
simulation
Constant heat
source, q = 240
kW m-3
Constant T
Forced convection
Equivalent 20 Ah
battery at 100 A
discharge rate
Simulation model
Cooling solution
Greco et al. [92]

18
For heat pipe-based BTM systems, optimization of the contact between pipe and heat
sources, as well as the improvement of cooling at the condenser side are the two main
approaches to enhance the cooling performance. Tran et al. [22] investigated the flat heat
pipe-based BTM system by applying constant heat fluxes to the evaporation side of heat
pipes instead of using real battery packs. In the experimental tests, a heat pipes-heat sinks
combined system was shown to be more effective in controlling the temperature than the
system using heat pipes alone.
Tube heat pipes are also of great interest to researchers [88-92]. However, because the
geometry of tube pipes limits their contact with batteries, tube heat pipes are usually welded
or attached to a copper/aluminum plate, or pre-manufactured with a flattened evaporation
section, so as to enlarge the contact area with the batteries [90]. Four working fluids: water,
acetone, methanol, and n-pentane, were investigated with different heating powers and
inclination angles, and it was demonstrated that acetone and n-pentane were suitable for
low powers and low air temperatures (e.g., below 100 W and 30oC, respectively) while the
other two fluids were good for relatively higher heating powers and air temperatures [91].
A theoretical and computational study was also conducted on the heat pipe-based BTM
system in Ref. [92], wherein a one-dimensional battery model was built and connected with
a thermal circuit network of heat pipes. It was found that the results from the one-
dimensional model showed good consistency with that of the analytical model and the
three-dimensional model [92].
2.3.2.4 Phase Change Material (PCM) Cooling
PCM was initially exploited to store thermal energy for buildings, where plenty of
research has been conducted [93-97]. PCM-based BTM systems were firstly introduced by
Al-Hallaj and Selman for a 18650 Li-ion battery pack, and the paraffin mixture of
pentacosane and hexacosane was used as the PCM [16]. As a branch of the passive BTM
system, the PCM-based system has many advantages, such as being compact, low cost, and
no need of a circulatory network, which has made PCM-based BTM systems of particular
research interest over the past few years. Nevertheless, there are several drawbacks with

19
this BTM system, which are summarized in Fig. 2.3 together with potential solving
strategies.
Figure 2.3. Selected characteristics and recent research interests in PCM-based BTM system
for Li-ion battery.
All the works reviewed in this section on PCM-based BTM systems only include the
materials that experience solid-liquid phase change. The most widely researched PCM for
Li-ion battery thermal management is paraffin wax, which is the mixture of various
hydrocarbon groups and exhibits the following superiorities: a hard-to-decompose
character, a widely acceptable unit price, and a broad range of phase change temperatures
varying with the number of main chain carbon atoms. In Table 2.2, the paraffin with
suitable phase change temperatures for Li-ion battery thermal management is listed.
Different PCMs can be chosen from the list for Li-ion batteries used for different tasks.
The PCM-based BTM system can be classified into systems that use 1) PCM only, 2) PCM
with metal foam or expanded graphite (EG), 3) PCM with conductive fillers, and 4) hybrid
cooling.

20
Table 2.2. Paraffin with suitable melting temperatures for Li-ion battery thermal
management.
Name of
straight chains
No. of carbon
atoms
Melting point
(oC)
Latent heat of
fusion (kJ kg-1)
Density
(kg m-3)
Octadecane 18 28.0 – 30.0 244 777
Nonadecane 19 32.0 – 34.0 222 786
Eicosane 20 36.7 246 789
Heneicosane 21 40.5 200 792
Docosane 22 42.0 249 778
Tricosane 23 48.0 – 50.0 232 797
Tetracosane 24 52.0 255 797
Pentacosane 25 54.0 238 801
1) PCM only
Since its first use in Li-ion batteries, PCM-based BTM systems have gained
widespread attention. In 2002, Al-Hallaj and Selman discussed the advantages of PCM-
based BTM systems over an active BTM system for Li-ion battery cooling [98]. The work
in Ref. [99] incorporates mixtures of PCMs into a BTM system. Four kinds of phase change
substances were employed in simulations: capric acid, eicosane, Na2(SO4)·10H2O, and
Zn(NO3)2·6H2O. In the conditions of combining capric acid with either one of the other
three materials, the capacities of the double-shell PCM cooling system were compared with
the single shell one. The results indicated that the double-shell design had higher exergy
efficiency than the single-shell system in most cases.
2) PCM with metal foams/EG
The main disadvantage of PCMs is their low thermal conductivity (below 0.5 W m-1
K-1), which makes their response tard to the heat surge of a discharged battery pack,
especially when a thick layer of PCM is used. Therefore, composite matrices were
introduced and studied to increase the overall thermal conductivity of BTM systems.

21
The PCM/metal foam matrix can raise the thermal conductivity by one order (~ 3–10
W m-1 K-1). Khateeb et al. [100] proposed a PCM/Al foam matrix for cooling a battery
pack in scooters, in which the foam used was the Duocel aluminum foam with a porosity
of 90–92% and had 40 pores per inch. The testing results showed that the use of the Al
foam can decrease the temperature rise and flatten the temperature distribution. The
PCM/copper foam cooling matrix has also been studied [101], and a low porosity was
recommended due to the preferable heat conduction. Both the PCM/Al and PCM/copper
matrices have also been numerically studied [102, 103].
Although metal foams can improve the heat transfer of PCM-based BTM systems,
proper sealing strategies need to be carried out to handle leakage of melted PCM. Mills et
al. first proposed an expanded graphite (EG) matrix to address this issue, and the
production method of EG was elaborated in Ref. [18]. Their findings showed that the
average thermal conductivity of the PCM composite could be increased to 16.6 W m-1 K-1
after integrating the EG matrix, which is almost 2 orders greater than that of the pure PCM
used (RT 42 paraffin with a thermal conductivity of 0.2 W m-1 K-1). A merit of this
PCM/EG composite was that the liquid state PCM could be immobilized inside the matrix
with capillary force, thus avoiding leakage. In practices, this strategy has several limitations.
For examples, it was found that at least 30 wt.% EG is required to maintain leakage at a
low level, which substantially lowers the latent heat of the PCM-based BTM system [26,
27]. Also, the manufacture and potential fracture of the PCM composite could increase the
initial and maintenance costs on the BTM system.
3) PCM with conductive fillers
Conductive fillers, such as graphene, carbon fiber, and carbon nanotube, have also
been utilized to enhance the thermal conductivity of PCMs in previous research [104, 105].
For instance, Goli et al. [104] found that the thermal conductivity of the PCM could reach
above 10 W m-1 K-1 with 1 wt.% graphene added. In Ref. [105], four types of carbon fibers
were prepared with the average lengths of 2, 3, 5, and 8 mm and were composited with the
PCM for testing. It was observed that the PCM with 2 mm long carbon fibers at a mass
fraction of 0.46 % could achieve the smallest temperature gradient in the battery pack.

22
4) PCM integrated hybrid cooling
Since PCM-based BTM systems manage battery temperature by relying on the high
latent heat of PCM, the cooling effect of the BTM system degrades dramatically as all the
PCM melts. Thus, for high-rate continuous cycle operations, an active cooling system
could be integrated to ensure the enduring cooling effectiveness of the PCM-based BTM
system [25, 106].
In Ref. [107], a battery pack equipped with PCM-based BTM system was tested in a
wind tunnel. The results showed that a sole PCM matrix was unable to cool the battery
pack during a high-current continuous charging and discharging test. When tested in the
wind tunnel with an air flow velocity of 3 m s-1, the maximum temperature of the battery
pack decreased significantly, and the battery pack operated safely in the cycling test. A
thermodynamic assessment of an active cooling/heating system using phase change slurry
(PCS) was studied in Ref. [17]. The PCS was made up of encapsulated PCM (1–20 μm)
and water or a water/glycol solution. Two PCMs, octadecane (Tmelting = 28oC) and
pentadecane (Tmelting = 10oC), were employed as the cooling and heating mediums in the
PCS, respectively, and the air in the vehicle cabin acted as the cooling/heating source.
These designs are effective in managing battery temperature, but they require special
structural designs and add complexity to the BTM system.
A summary of the state-of-the-art PCM-based BTM systems is provided in Table 2.3,
which can be combined with Fig. 2.3 to give a whole picture of the research trends on the
PCM-based BTM system.

23
Table 2.3. Summary of research on PCM-based BTM systems.
PCM cooling
system
Research
method
Phase change
material
Thermal conductivity
(W m-1 K-1)
Latent heat
(kJ kg-1)
Melting
point (oC)
Specific heat capacity
(kJ kg-1 K-1)
Density (kg
m-3)
Authors
PCM Simulation Pentacosane &
hexacosane
0.29 (solid)
0.21 (liquid)
195 56 1.77 910 (solid)
822 (liquid)
Al-Hallaj,
Selman [16]
PCM Experiment Paraffin wax (RT28
HC)
- 245 28 - - Hemery et al.
[108]
PCM Simulation n-octadecane 0.358 (solid)
0.152 (liquid)
225 28 – 30 2.15 (solid)
2.18 (liquid)
814 (solid)
724 (liquid)
Javani et al.
[109]
PCM
Simulation
Caprid acid 2 153 31.4 2.09 884
Ramandi et al.
[99]
Eicosane 0.27 241 36.7 1.90 778
Na2(SO4)·10H2O 0.544 254 32.3 1.93 1485
Zn(NO3)2·6H2O 0.31 147 36.3 1.34 2065
PCM/Al foam Experiment
Simulation
Pentacosane &
hexacosane
k = kAlε + kpcm(1 - ε)* - 40 - 44 - ρ = ρAlε +
ρpcm(1 - ε)*
Khateeb et al.
[100]
PCM/Copper
foam
Experiment Paraffin wax (RT44
HC)
0.8 – 11.33 (varying
with porosity and
pore density)
270.7
(PCM)
44 2.25 (PCM) 810 (PCM) Li et al. [101]
PCM/EG Experiment Paraffin wax (RT42
HC)
16.6 185 42 1.98 789 Mills et al. [18]
PCM/EG Simulation Paraffin wax (RT42
HC)
16.6 127 42 1.98 789 Mills and Al-
Hallaj [110]
PCM/EG Simulation
(thermal
runaway)
Paraffin wax (RT42
HC)
16.6 185 42 1.98 789 Kizilel et al.
[111]
PCM/EG +
graphite sheet
Experiment
Simulation
Paraffin 3.95 132.6 21.6 – 25.5 2.39 842 Lin et al. [112]
PCM/graphene Experiment
Simulation
Paraffin wax (IGI -
1260)
15 – 45 (varying with
mass ratio of
graphene)
- 70 2.5 900 Goli et al. [104]
PCM/carbon
fiber
Experiment Paraffin mixture 0.21 (PCM) 242 42 – 49 - 912 Babapoor et al.
[105]
PCM/EG + Air
cooling
Experiment
Simulation
Paraffin wax (RT44
HC)
7.85 181 44 2.5 714 Ling et al. [107]

24
2.4 Research on Abnormally Discharged Batteries
2.4.1 Overheating Issues of Abnormally Discharged Batteries
Safety is the priority for all energy storage systems. In a Li-ion battery cell, oxidizer
(cathode) and fuel (anode) are kept in a sealed container. In normal operating conditions,
anodes and cathodes are unable to be electrically contacted, and the chemical energy can
be smoothly transferred to electrical energy. However, as the temperature of the cell
reaches the threshold of thermal runaway, typically between 130oC and 200oC [113], the
cell may experience a series of exothermic chemical reactions and generate a great amount
of heat and gas, which may further cause shrinkage of the separator and lead to more
extensive heat release processes, with the maximum temperature soaring to as high as
500oC.
Routine use of Li-ion batteries usually cannot bring about thermal runaway, even at
high rate discharge conditions. However, improper charge and discharge [114-116] and
short circuit during operations [30, 117, 118] may give rise to this danger. A few notable
Li-ion battery safety accidents in recent years are listed in Table 2.4.
Table 2.4. A few notable Li-ion battery induced accidents in recent years.
Date Accident Causes
May 2018
March 2018
March 2017
October 2013
Tesla Model S caught fire
Tesla Model S caught fire
Tesla Model S caught fire
Tesla Model S caught fire
Vehicle hit a crash barrier
Vehicle crashed with cars
Charging
Vehicle hit metal debris
January 2013 Boeing 787 emergency landing Battery overcharge
May 2012 BYD e6 caught fire Collision accident
June 2011
June 2011
EV bus caught fire
Chevrolet Volt caught fire
Li-ion battery overheated
Crash testing
September
2010
Boeing 747-400F cargo plane caught
fire
Auto-ignition of cargo pallet
with Li-ion batteries
April 2010 Acer recalled 2700 laptop batteries Potential overheating and
fire hazards
25
Despite the relatively low probability of thermal abuse, Li-ion battery systems should
be well designed and be able to overcome the dramatic heat release in case it happens. In
recent years, improved electrolytes [119-122], electrolyte additives [123-128], separators
[129-132], as well as BTM systems [15, 111] have been continuously introduced and
investigated to address this thermal issue of Li-ion batteries with the utilization of chemical
(end reactions) and physical (fast absorption of heat) mechanisms.
2.4.2 Studies on Abnormally Discharged Batteries
Pretend that Li-ion batteries are equipped with suitable BTM systems during charges
and discharges, short circuits will be the most likely causes of the Li-ion battery-related
accidents. For example, during EV crashes, the batteries may be damaged and shorted.
Significant amount of heat will be generated and generally cannot be controlled by the
original BTM systems. Therefore, research needs to be done to better understand the short
circuit behaviors of Li-ion batteries, which is imperative to the research on battery thermal
runaway prediction and management. To date, much research has been done on Li-ion
battery short circuits [113, 133, 134-137]. Three main categories, material analyses, battery
tests, and numerical simulations, were mainly explored.
In terms of material analyses, accelerating rate calorimetry (ARC), differential
scanning calorimetry (DSC), and heating reactor are generally used to test the exothermic
behaviors of a whole battery or battery materials [31, 113, 133, 138]. For instance, Doughty
and Roth published a general discussion on Li-ion battery safety [113], in which a summary
of variables, such as cathode/anode materials, overcharge limit, and state of charge (SOC),
on the battery safety performance was given based on ARC and DSC testing results. In Ref.
[133], the onset, transition, and peak temperatures of three popular Li-ion batteries
(LiNiMnCoO2, LiCoO2, and LiFePO4) were recorded through heating Li-ion batteries in a
reactor. The testing results are significantly valuable for research regarding battery
modeling and safety.
Meanwhile, experiments such as the nail penetration test, pinch test, internal nail test,
were performed on Li-ion batteries and packs [30, 31, 41, 117, 118] to simulate the
damaged batteries in accidents. For example, Cai et al. did pinch tests on several Li-ion
26
batteries with different parameters, and it was found that the increase of battery voltage
and capacity can dramatically stimulate the occurrence of thermal runaway [118].
Regarding safety tests on battery pack level, thermal runaway propagation is of particular
interest, and relevant research has been conducted [30-32]. For instance, Lamb et al. at
Sandia National Laboratories investigated the thermal runaway propagation in 18650-type
and pouch-type battery packs with different electrical configurations [30]. It was found that
the parallel configuration is more dangerous for Li-ion battery packs due to the continuous
delivery of energy from the other batteries in the battery pack to the shorted battery.
Simulations also play an important role in battery short circuit research [35-42, 138].
Hatchard et al. first developed a 1D thermal model with a chemical heat generation
component [35], and the model was proved accurate in simulating the temperature of a Li-
ion battery in an oven test. The model was then reproduced and extended by Kim et al. [37]
to a 3D model to consider the geometry features. Subsequently, several comprehensive
models considering battery state, electrochemical reactions, and battery shape changes
were developed to capture the battery statuses after short circuits. For example, in Ref. [42],
nail penetration of a 5.25 Ah Li-ion battery was simulated by combining an electrochemical
model with a reaction model. At the nail site, the localized heat source was created by
setting a boundary condition for the positive electrode, and the heat generated by the battery
bulk was calculated with the reaction functions based on Arrhenius-type equation sets.
Zhang et al. developed a mechanical-electrical-thermal coupling model to predict a Li-ion
battery under mechanical abuse [36]. The model is successful in predicting the onset of
mechanical crush induced short circuits, and in giving the subsequent voltage and
temperature evolutions.
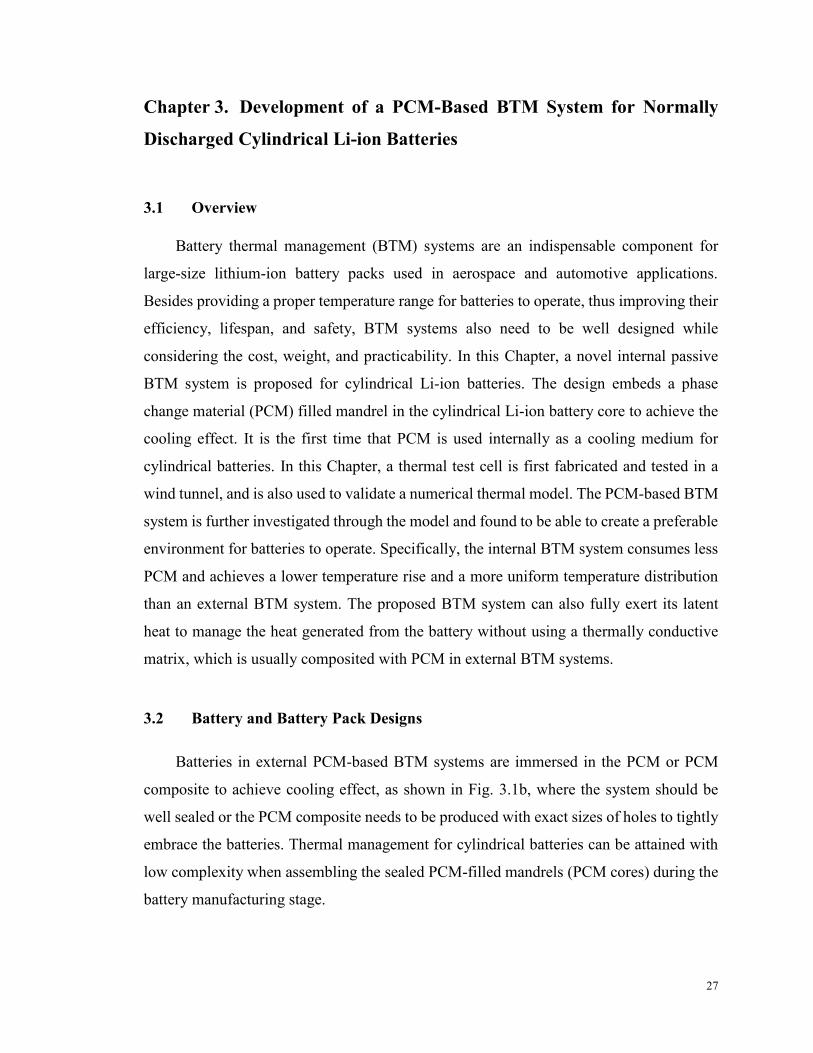
27
Chapter 3. Development of a PCM-Based BTM System for Normally
Discharged Cylindrical Li-ion Batteries
3.1 Overview
Battery thermal management (BTM) systems are an indispensable component for
large-size lithium-ion battery packs used in aerospace and automotive applications.
Besides providing a proper temperature range for batteries to operate, thus improving their
efficiency, lifespan, and safety, BTM systems also need to be well designed while
considering the cost, weight, and practicability. In this Chapter, a novel internal passive
BTM system is proposed for cylindrical Li-ion batteries. The design embeds a phase
change material (PCM) filled mandrel in the cylindrical Li-ion battery core to achieve the
cooling effect. It is the first time that PCM is used internally as a cooling medium for
cylindrical batteries. In this Chapter, a thermal test cell is first fabricated and tested in a
wind tunnel, and is also used to validate a numerical thermal model. The PCM-based BTM
system is further investigated through the model and found to be able to create a preferable
environment for batteries to operate. Specifically, the internal BTM system consumes less
PCM and achieves a lower temperature rise and a more uniform temperature distribution
than an external BTM system. The proposed BTM system can also fully exert its latent
heat to manage the heat generated from the battery without using a thermally conductive
matrix, which is usually composited with PCM in external BTM systems.
3.2 Battery and Battery Pack Designs
Batteries in external PCM-based BTM systems are immersed in the PCM or PCM
composite to achieve cooling effect, as shown in Fig. 3.1b, where the system should be
well sealed or the PCM composite needs to be produced with exact sizes of holes to tightly
embrace the batteries. Thermal management for cylindrical batteries can be attained with
low complexity when assembling the sealed PCM-filled mandrels (PCM cores) during the
battery manufacturing stage.
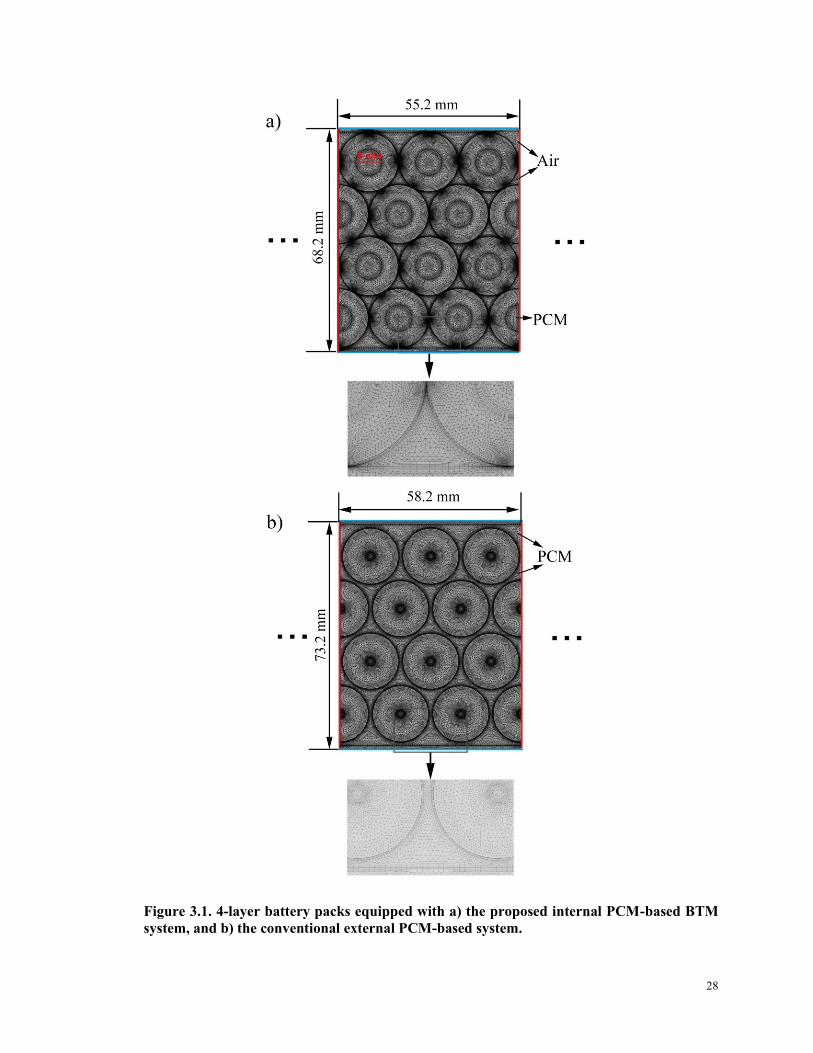
28
Figure 3.1. 4-layer battery packs equipped with a) the proposed internal PCM-based BTM
system, and b) the conventional external PCM-based system.
29
Photos of a disassembled 18650 Li-ion battery are provided on the left plot of Fig. 3.2.
It is seen that the Li-ion cell is wrapped on a hollow mandrel (rm = 1.25 mm), which is
designed for electrolyte injection and gas emission during thermal runaway. For the
internal BTM system, the hollow mandrel is replaced by a PCM core, which acts as a heat
sink to absorb the heat generated from the battery, as shown on the right plot of Fig. 3.2.
At the manufacturing stage, the liquid PCM can be injected and sealed in a thin wall
mandrel to avoid leaking issues, and a groove can be machined on the mandrel to ensure
electrolyte injection and gas release.
Figure 3.2. Pictures of a disassembled 18650 Li-ion battery and a schematic of the PCM core
cooling design.
In Fig. 3.1a and b, schematics of 4-layer battery packs equipped with the internal and
external BTM systems are given, respectively. The schematics are the meshed geometries
of two BTM systems obtained in Comsol Multiphysics, which will be explained in Section
3.3.2. Since the battery pack can have a large dimension in the horizontal direction,
repeating units with a 3-battery width are selected for this study to reduce the
computational cost. Correspondingly, an adiabatic boundary condition is applied on the
left and right sides of the packs, as indicated by the red lines in Fig. 3.1a and b, while on
the top and bottom surfaces, indicated by the blue lines, a natural convection boundary
condition is used. In the internal BTM design, PCM cores with 4 mm radius are embedded
in the batteries, and all the batteries are closely packed. For the external cooling design,

30
original batteries are used in the pack with 1 mm spaces left between batteries for
accommodating the PCM. For both battery packs, aluminum frames are used to wrap the
batteries, and the dimensions of both packs are shown in the figures.
Two PCMs, n-octadecane and n-eicosane, with a purity of 99% from Sigma-Aldrich
were used in this work, and their physical properties are listed in Table 3.1. In general,
paraffin wax has a lower density at liquid state than the solid state; it will thus experience
expansion during the melting stage. Therefore, liquid state PCM was injected into the
mandrel before sealing, which eliminated the PCM expansion issue. To ensure the design
is safe, we sealed a PCM-filled aluminum pipe (wall thickness of 0.2 mm, 1 mm deep
groove on its side) with thermoplastic glue and polyurethane adhesive, as shown in the
bottom center of Fig. 3.3. The pipe underwent 10 heating/cooling cycles in an oven (70oC)
and ambient (23oC). During the test, no leakage was observed, and the outer diameter of
the pipe remained constant during the test. In practical designs, stainless steel lids may be
used to seal the pipes.
Table 3.1. Physical properties of n-octadecane, n-eicosane, and PCM/EG composite [107, 109,
139].
Property n-octadecane n-eicosane PCM/EG
Specific heat, solid (J kg-1 K-1) 2150 2150 1864
Specific heat, liquid (J kg-1 K-1) 2180 2275 1964
Thermal conductivity, solid (W m-1 K-1) 0.358 0.425 7.85
Thermal conductivity, liquid (W m-1 K-1) 0.152 0.152 7.85
Density, solid (kg m-3) 814 814 714
Density, liquid (kg m-3) 724 771 714
Latent heat (kJ kg-1) 244 247 181
Melting temperature range (oC) 28.0-30.0 35.7-37.1 -

31
3.3 Experiment and Thermal Model
3.3.1 Fabrication of a Thermal Test Cell (TTC)
Considering the high level of complexity of both the material and equipment
requirements in assembling a Li-ion battery, a TTC is usually fabricated in research to
simulate the heat generation of a battery [140]. Fig. 3.3 shows the components in a TTC
and the setup of the experiment. In the TTC, the stainless steel foil tape (3MTM) acts as the
heating component, which has a length of 2400 mm and width of 60 mm, and the
thicknesses of the stainless steel layer and acrylic adhesive layer are 51 μm and 35 μm,
respectively. The thicknesses were measured at different locations of the tape and they are
uniform along the tape. The aluminum vial is used to contain the PCM. It was machined
on a lathe with inner and outer radii of 3.5 and 3.95 mm, respectively. To fabricate the TTC,
the foil tape was cleaned and dried with ethanol and tightly wrapped around the vial. The
acrylic adhesive layer can ensure a minimal amount of air exists in between layers and
prevent the stainless steel from short-circuiting itself. The detailed specification and
physical properties of the TTC and its components are listed in Table 3.2.
Table 3.2. Specifications and physical properties of the thermal test cell.
Parameters Value Parameters Value
St. steel thickness (μm) 51 St. steel specific heat (J kg-1 K-1) 502
Adhesive thickness (μm) 35 St. steel thermal conductivity (W m-1 K-1) 16.3
Foil length (mm) 2400 Adhesive specific heat (J kg-1 K-1) 1470
Foil width (mm) 60.0 Adhesive thermal conductivity (W m-1 K-1) 0.178
Foil weight (g) 61.4 Al specific heat (J kg-1 K-1) 900
Vial outer diameter (mm) 7.9 Al thermal conductivity (W m-1 K-1) 201
Vial inner diameter (mm) 7.0 Al density (kg m-3) 2700
Vial weight (g) 2.2 PCM volume (ml) 2.3
Cell outer diameter (mm) 18.6 Input power (W) 1.43, 3.27
Average density (kg m-3)
Average specific heat (J kg-1 K-1)
Radial thermal conductivity (W m-1 K-1)
4597
896
0.431
Volumetric heat generation (W m-3)
Axial thermal conductivity (W m-1 K-1)
107019,
244723
9.74
Two groups of tests were performed on the TTC: a control group with an empty vial

32
and a group with the vial filled with PCM. To validate the cooling effectiveness of the
internal BTM system and accuracy of the numerical model, two heating powers, 1.43 W
and 3.27 W, were applied on the TTC through a power supply. Two k-type thermocouples
were connected with a Pico-08 data logger to record the temperatures at a frequency of 1
Hz, and the layout is shown on the bottom left corner of Fig. 3.3, where Ts and Tc indicate
the surface and center temperatures, respectively. To eliminate the temperature fluctuation
due to air flow, Ts was taken at the layer adjacent to the surface layer. All the thermocouples
were calibrated in ice water. The accuracy and resolution of the k-type thermocouples are
±0.5oC and 0.025oC, respectively.
For the TTC filled with PCM, a study of the PCM solidification time was also carried
out using two PCMs, n-octadecane and n-eicosane under different convective cooling
conditions (different air velocities). All of the tests were performed in a low-speed wind
tunnel, which can provide a stable air flow with wind velocity up to 10 m s-1.
Figure 3.3. Photographs of the thermal test cell and its components, as well as the test setup.

33
The role of the TTC tests is to verify the effectiveness of the PCM-based internal
cooling system and the accuracy of the model. Although the TTC and real battery (jelly
roll) are different in their thermal properties, they are same in exterior geometries and both
generate the heat through the roll. If the experimental results of the TTC tests agree well
with the numerical results in different heating powers and cooling conditions, the model is
credible to solve the energy balancing process that involve heat generation, phase change,
and convection for batteries with different thermal properties. This is because the model is
implemented to calculate the thermal-related equations explained in Section 3.3.2 using a
set of known data for the meshed domains. If it can correct solve the equations with one
set of data from the TTC, it is able to provide correct results with another set of data from
the batteries.
3.3.2 Battery Heat Generation
The heat generation inside a Li-ion battery is a complicated process that involves
electrochemical reaction heat, Joule heat, and reversible heat [51]. With detailed battery
parameters, a delicate electrochemical and thermal coupling model could provide an
accurate prediction of battery temperatures during discharges. Nevertheless, a constant heat
generation rate is generally used during the design of a BTM system for simplicity [6, 9,
141], and it can be used for adequately examining the cooling performance of a BTM
system.
In this work, a commercial cylindrical Li-ion battery was implemented to develop the
model, and its physical parameters and heat generation rates were used in the model setup.
Table 3.3 tabulates the specifications of the Li-ion battery. Prior to acquiring heat
generation rates, the cylindrical battery was prerun at 24oC by cycling five times using a
battery analyzer (PCBA 5010-4) with a cut-off voltage of 3 V and 4.2 V for discharging
and charging, respectively. The constant charging and discharging currents were set to 1.3
A with a cut-off current of 50 mA at the potentiostatic stage.

34
Table 3.3. Specifications and parameters of the Samsung 18650 LiCoO2 battery.
Parameter Value Parameter Value
Nominal capacity (mAh) 2600 Cathode thickness (μm) 66.0
Nominal voltage (V) 3.63 Separator thickness (μm) 20.0
Height (mm) 65.0 Steel case thickness (mm) 0.300
Diameter (mm) 18.4 Radial thermal conductivity (W m-1 K-1) 1.97
Weight (g) 44.0 Axial thermal conductivity (W m-1 K-1) 28.1
Maximum discharge current (mA) 5200 Average cell specific heat (J kg-1 K-1) 830[35]
Discharge operating temperature (oC) -20 – 60 Average jelly roll density (kg m-3) 2580[35]
Steel rod diameter (mm) 2.50 Steel thermal conductivity (W m-1 K-1) 16.3
Jelly roll height (mm) 60.0 Steel specific heat (J kg-1 K-1) 502
Jelly roll length (mm) 650 Steel density (kg m-3) 7861
Cu foil thickness (μm) 10.0 Frame thermal conductivity (W m-1 K-1) 201
Al foil thickness (μm) 18.0 Frame specific heat (J kg-1 K-1) 900
Anode thickness (μm) 72.0 Frame density (kg m-3) 2700
To calculate the battery heat generation rates, the Samsung 18650 battery was
insulated by wrapping air bubble insulating layers and discharged at currents of 2.5 A (0.96
C), and 5 A (1.92 C). A temperature logger (Pico TC-08) with K-type thermocouples was
used to log battery surface temperature at a 1 Hz frequency, which was then combined with
the energy balance equation to calculate the average heat generation rate:
𝑃 =
𝑄
∆𝑡=𝑐𝑝𝑚∆𝑇
∆𝑡 (3.1)
where cp and m indicate the average specific heat and mass of the battery, respectively; Q
is the total heat generated from the battery; ∆t and ∆T are the battery discharge time and
battery temperature change during the discharge, respectively. An assumption made here
is that the heat loss during discharge from the insulating layers is negligible.
The volumetric heat generation rate, q, is calculated by dividing the heat generation
rate P with the volume of the jelly roll (Li-ion battery reaction cell):
V = h𝑗(𝜋𝑟22 − 𝜋𝑟𝑚
2) (3.2)
where hj indicates the height of the jelly roll, r2 and rm represent the outer radii of the jelly

35
roll and steel mandrel, respectively. Table 3.4 summarizes the experimental results and the
corresponding volumetric heat generation rates at the assigned discharge rates.
Table 3.4. Summary of the experimental results and the calculated heat generations of the
18650-type battery.
I (A) ΔT (oC) Q (J) Δt (s) P (W) q (W m-3)
2.5 (0.96 C) 18.83 687.7 3750 0.1834 12527
5 (1.92 C) 44.87 1639 1890 0.8672 59235
3.3.1 Thermal Model
The thermal model is governed by the energy conservation equation [21] given below
for the Li-ion battery and TTC:
𝜌𝑐𝑝
𝑑𝑇
𝑑𝑡= ∇ ∙ (k∇𝑇) + 𝑞 (3.3)
where the first term is the heat stored in the battery/cell, k represents the thermal
conductivity, and q indicates the volumetric heat generation rate.
In the equation, the thermal conductivities of the Li-ion battery and TTC in radial and
axial directions are calculated through equations (3.4) and (3.5), respectively:
k𝑠 =
∑ 𝑙𝑖𝑖
∑𝑙𝑖k𝑖𝑖
(3.4)
k𝑝 =∑
𝑙𝑖𝑙k𝑖
𝑖 (3.5)
where the subscripts s and p indicate the properties in series and parallel directions,
respectively. li is the thicknesses of different components in the cell, i.e., anode, cathode,
separator, current collectors. l is the total thickness of the electrochemical reaction cell.
For the PCM region, the equations used in the simulation are given in Section 2.2.1
from (2.5) to (2.7).

36
The energy conservation equation of the steel case, hollow mandrel, and aluminum
frame can be expressed the same as (3.3), but without the heat source term. As tested in
Section 3.2, a 0.2 mm thick aluminum pipe can well handle the phase change of the PCM,
the thickness can be further reduced in the future through advanced manufacturing
processes on high mechanical strength stainless steel pipes. To simplify the simulation
process, especially the meshing step for the thin pipe layer, PCM is directly embedded in
the battery center in all the battery geometries used in the simulations.
For simulations involving convection cooling at battery or battery pack surface, the
cooling is described by [21]:
k𝜕𝑇
𝜕𝑥= ℎ(𝑇 − 𝑇𝑎𝑚𝑏) (3.6)
A finite element solver, COMSOL Multiphysics, was used to solve the temperature
variations of the battery, TTC, and battery packs. A Solid Heat Transfer Model was
selected to simulate the heat transfer and phase change processes in batteries and battery
packs. The model solves the processes like a black box. With all the physical properties
and meshed geometries, it can solve the time and spatial related equations given above. To
discretize the geometry, extremely fine free triangular meshes were generated on the
geometries. At the interfaces between the PCM (or air) and Li-ion battery, PCM (or air)
and battery case, as well as PCM (or air) and aluminum frames, 10 inflation layers were
generated to refine the interface meshes, as shown in the zoomed figures of Fig. 3.1a and
b. Convergence studies were performed on all simulations to ensure that the grid sizes had
no effect on the simulation results.
3.4 Results and Discussion
3.4.1 TTC Tests for Model Validation
In the tests, the TTC was heated for 1500 s and 1000 s under the heating powers of
1.43 W and 3.27 W, respectively. To create a similar environment as in a battery pack,
where batteries are not directly exposed to ambient air for natural convection cooling, the
TTC was placed inside a sealed cylindrical container during the test. The convective heat

37
transfer coefficient was determined by comparing the cooling curve of the TTC with the
simulation, and a value of 9 W m-2 K-1 was obtained and used in the simulations. The
convective heat transfer coefficient obtained is only related to the geometry of the heat
source and its surface cooling condition, which is not affected by the physical properties
of the heat source. In Fig. 3.4, the temperature curves of the TTC with and without the
PCM added are obtained from experiments and simulations for comparison, where the dots
indicate the experimental data (due to the high frequency of data acquisition, the dots turn
to black solid lines) and the lines in other colors are the simulation results. In the figures,
Ts and Tc represent the experimentally obtained surface and center temperatures of the TTC,
while in simulations, T1, T2, and T3 were recorded, and they are the temperatures at the
center of the cooling core, at the corner of the cooling core, and at the TTC surface,
respectively, and the corresponding positions are shown in the inset of Fig. 3.4a, which is
the temperature contour of the PCM-filled TTC at the end of the 1.43 W heating test.
In the upper plots of Fig. 3.4a and b, the surface temperature curves of the TTC with
and without PCM under the heating powers of 1.43 W and 3.27 W are plotted. It is seen
that the simulation results agree well with the experiments for both heating powers. For the
temperature curves in the TTC core, as shown in the lower plots of Fig. 3.4a and b, the
simulation results (T1) match well with the experiment (Tc) when the mandrel is empty,
while discrepancy is observed at the phase transition stage in the PCM filled TTC, as shown
in the inset of Fig. 3.4a bottom plot. This is because the buoyancy of the melted PCM may
affect the location of the thermocouple. Consequently, Tc falls in between the core center
temperature (T1) and the core corner temperature (T2).

38
Figure 3.4. Comparisons of the experimental and simulated temperatures during the TTC
tests at heating powers of a) 1.43 W and b) 3.27 W.
When comparing the temperature curves of the PCM embedded group and the blank
control group, it is seen that the addition of PCM can decrease the maximum temperature
by 8oC and 9oC under the heating powers of 1.43 W and 3.27 W, respectively. Compared
to the TTC, the real Li-ion battery has a relatively low heat storage term, i.e., the Cp term
of the real battery is about half that of the TTC, which will make the real battery more
sensitive to the cooling capacity of the PCM in the mandrel. In addition, the real battery is
more thermally conductive on both axial and radial directions than the TTC, as shown in
Table 3.2 and 3.3, thus it is more effective in dissipating heat at the battery surface.
Consequently, the reduction in the maximum temperature will be more notable for Li-ion
batteries. The relevant numerical studies are carried out in Section 3.4.2. Furthermore, it is
noticed that the PCM embedded TTC takes longer to cool after the heating tests compared
to the blank control group due to the solidification of the PCM. This issue will be discussed
and addressed in Section 3.4.3.
39
3.4.2 Simulations on a Single 18650 Li-ion Battery
With the validated model, simulations are then performed on a single battery. Fig.
3.5a and b show the temperature contours of the battery at the end of the 2.5 A discharge
with the original design and the core cooling design. For both cases, the adiabatic boundary
condition is applied to clearly view the cooling effect of the PCM on the battery. As can
be seen, when replacing the hollow mandrel of the Li-ion battery with a PCM core, the
maximum temperature has a slight drop of 1.46oC. The cooling capability of the PCM-
based internal BTM system can be further improved by increasing the core size. The
corresponding simulations are carried out on the battery by varying the radius of the PCM
core from 2 to 5 mm, and the obtained temperature profiles during the 2.5 A and 5 A
discharges are given in Fig. 3.5c and d, respectively. It is seen that as the discharge rate
increases, more PCM is needed to maintain the battery temperature at a low level, and the
cooling capability of the internal BTM system improves as the radius of PCM core
increases. However, the improvement of cooling performance is achieved with a sacrifice
to the battery capacity. To investigate this effect, the capacity ratio () of the modified
battery to the original battery described by (3.7) is plotted against the PCM core radius in
Fig. 3.6.
𝜃 =𝛼𝜋(𝑟𝑐𝑒𝑙𝑙
2 − 𝑟𝑐𝑜𝑟𝑒2 )
𝛼𝜋(𝑟𝑐𝑒𝑙𝑙2 − 𝑟𝑚2)
(3.7)
where α is the volumetric battery capacity, rcell, rcore, and rm are the radiuses of the battery,
PCM core, and mandrel, respectively.
As can be seen, the capacity ratio ranges from 100% to 70% as the PCM radius
increases from 1.25 mm to 5 mm. Nevertheless, the space and weight saved in the
compactly packed core cooling batteries will offset the sacrificed capacity at the pack level.
In Section 3.4.4, the internal PCM-based BTM system will be further compared with the
external PCM-based BTM system in their specific energies (energy per unit mass).

40
Figure 3.5. Simulation results of the single 18650 Li-ion battery: temperature contours of a)
the original battery and b) the battery with a 1.25 mm PCM core at the end of the 2.5 A
discharges; temperature curves of the battery embedding PCM core of different sizes during
discharges at currents of c) 2.5 A and d) 5 A.
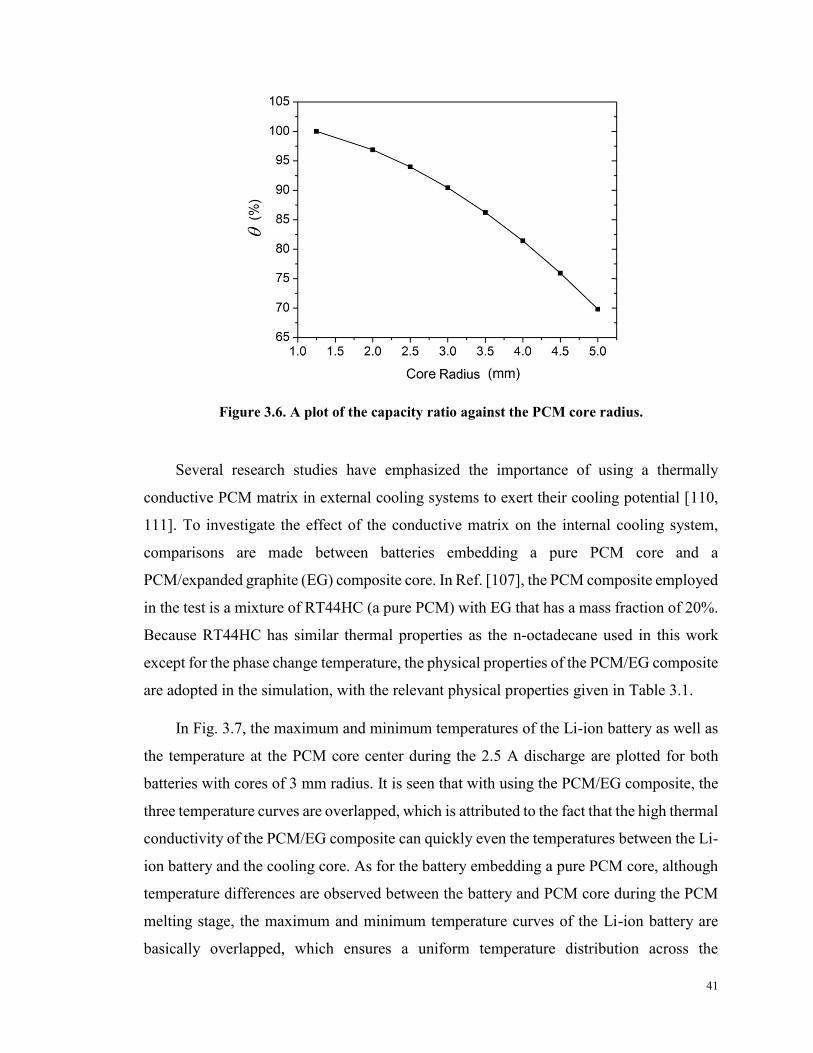
41
Figure 3.6. A plot of the capacity ratio against the PCM core radius.
Several research studies have emphasized the importance of using a thermally
conductive PCM matrix in external cooling systems to exert their cooling potential [110,
111]. To investigate the effect of the conductive matrix on the internal cooling system,
comparisons are made between batteries embedding a pure PCM core and a
PCM/expanded graphite (EG) composite core. In Ref. [107], the PCM composite employed
in the test is a mixture of RT44HC (a pure PCM) with EG that has a mass fraction of 20%.
Because RT44HC has similar thermal properties as the n-octadecane used in this work
except for the phase change temperature, the physical properties of the PCM/EG composite
are adopted in the simulation, with the relevant physical properties given in Table 3.1.
In Fig. 3.7, the maximum and minimum temperatures of the Li-ion battery as well as
the temperature at the PCM core center during the 2.5 A discharge are plotted for both
batteries with cores of 3 mm radius. It is seen that with using the PCM/EG composite, the
three temperature curves are overlapped, which is attributed to the fact that the high thermal
conductivity of the PCM/EG composite can quickly even the temperatures between the Li-
ion battery and the cooling core. As for the battery embedding a pure PCM core, although
temperature differences are observed between the battery and PCM core during the PCM
melting stage, the maximum and minimum temperature curves of the Li-ion battery are
basically overlapped, which ensures a uniform temperature distribution across the

42
electrochemical cell. Interestingly, it is seen that the use of the high conductive PCM
composite does not reduce the maximum temperature, and contrarily has a bigger
temperature change than the pure PCM filled battery, with peak temperatures of 35.2oC
and 32.3oC, respectively. This is because the addition of the conductive matrix will reduce
the proportion of PCM, thus lowering the latent heat of the BTM system.
Figure 3.7. The comparison of the temperature curves of a single Li-ion battery embedding
pure PCM and PCM/EG composite cores during a 2.5 A discharge.
In Fig. 3.8a and b, the liquid fractions of the pure PCM core and the PCM/EG
composite core at the assigned times are shown. It is seen that the PCM in the composite
core is fully melted at 2400 s, which is much shorter than the pure PCM (at 3300 s) due to
its lower PCM content. To conclude, the conductive matrix is unsuitable for the core
cooling system because the PCM core is thin, and the short heat transfer length ensures that
the PCM can respond timely to the heat surge. Also, the use of a thermally conductive
matrix will reduce the latent heat potential of the BTM system and will not play a positive
role. In applications, pure PCM can be directly used to fill mandrels and used as cooling
cores for cylindrical Li-ion batteries, which will eliminate the manufacturing cost of the
thermally conductive matrix.

43
Figure 3.8. The liquid fractions of a) pure PCM and b) PCM/EG composite at the assigned
times during the 2.5 A discharge.
3.4.3 Solidification of the PCM Core
Besides keeping the battery temperature at a low level, the BTM system should also
be able to be restored to its initial state as quickly as possible after discharging to ensure a
proper operation in the following cycles. To investigate the solidification process of the
PCM in the internal BTM system, the TTC was tested in a low-speed wind tunnel under
different wind velocities, and the temperature at the PCM core center was recorded for
comparison, as shown in Fig. 3.9a, where the wind velocity was measured by a hot-wire
anemometer. It is seen that the time spent for cooling was significantly reduced as natural
convection turned to forced convection. At a wind velocity of 3 m s-1, it only took 2330 s
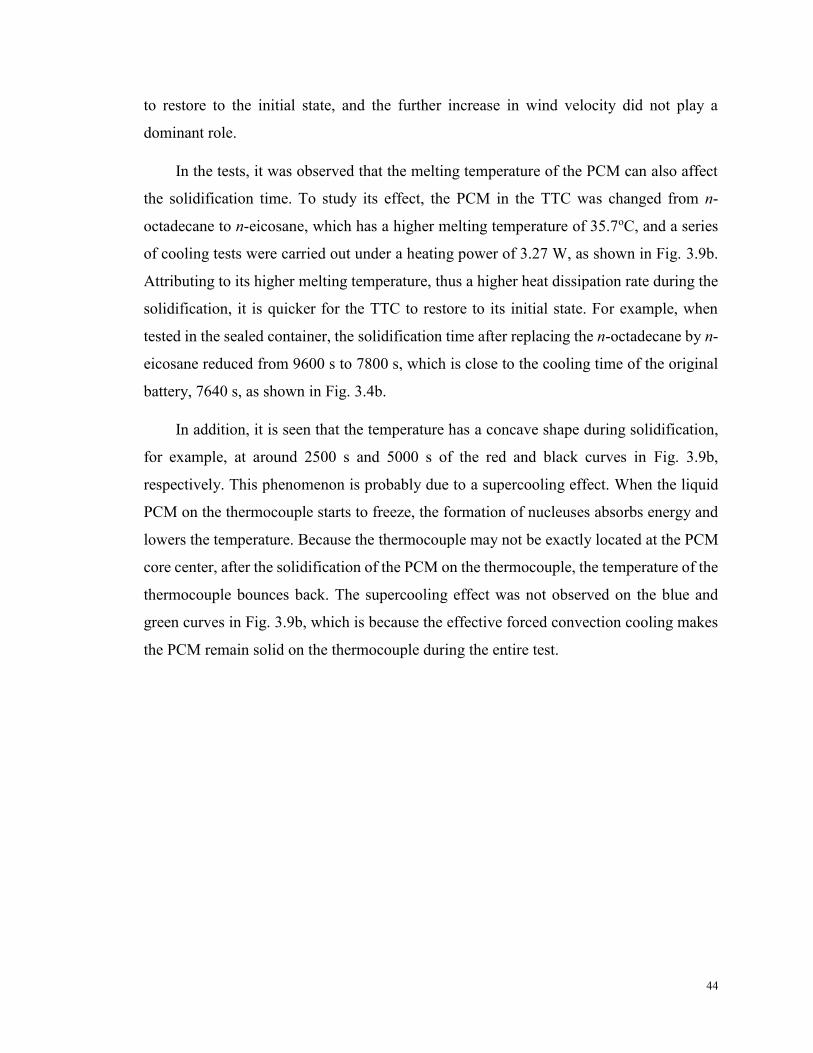
44
to restore to the initial state, and the further increase in wind velocity did not play a
dominant role.
In the tests, it was observed that the melting temperature of the PCM can also affect
the solidification time. To study its effect, the PCM in the TTC was changed from n-
octadecane to n-eicosane, which has a higher melting temperature of 35.7oC, and a series
of cooling tests were carried out under a heating power of 3.27 W, as shown in Fig. 3.9b.
Attributing to its higher melting temperature, thus a higher heat dissipation rate during the
solidification, it is quicker for the TTC to restore to its initial state. For example, when
tested in the sealed container, the solidification time after replacing the n-octadecane by n-
eicosane reduced from 9600 s to 7800 s, which is close to the cooling time of the original
battery, 7640 s, as shown in Fig. 3.4b.
In addition, it is seen that the temperature has a concave shape during solidification,
for example, at around 2500 s and 5000 s of the red and black curves in Fig. 3.9b,
respectively. This phenomenon is probably due to a supercooling effect. When the liquid
PCM on the thermocouple starts to freeze, the formation of nucleuses absorbs energy and
lowers the temperature. Because the thermocouple may not be exactly located at the PCM
core center, after the solidification of the PCM on the thermocouple, the temperature of the
thermocouple bounces back. The supercooling effect was not observed on the blue and
green curves in Fig. 3.9b, which is because the effective forced convection cooling makes
the PCM remain solid on the thermocouple during the entire test.
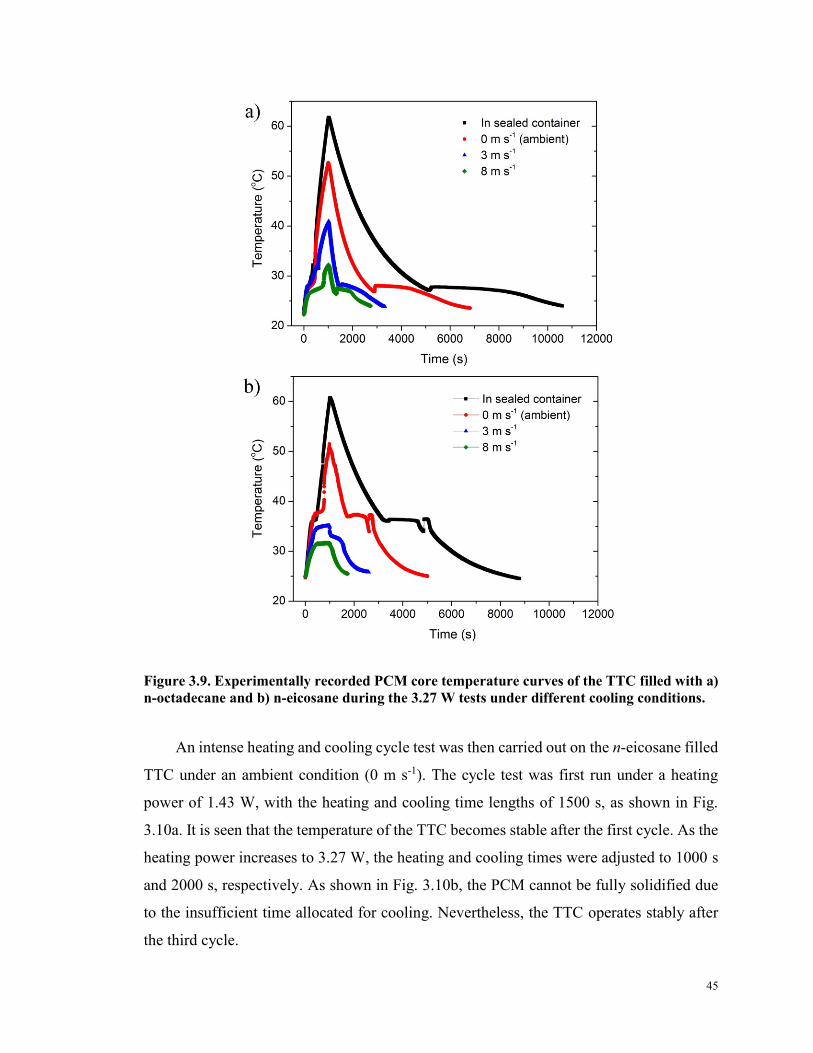
45
Figure 3.9. Experimentally recorded PCM core temperature curves of the TTC filled with a)
n-octadecane and b) n-eicosane during the 3.27 W tests under different cooling conditions.
An intense heating and cooling cycle test was then carried out on the n-eicosane filled
TTC under an ambient condition (0 m s-1). The cycle test was first run under a heating
power of 1.43 W, with the heating and cooling time lengths of 1500 s, as shown in Fig.
3.10a. It is seen that the temperature of the TTC becomes stable after the first cycle. As the
heating power increases to 3.27 W, the heating and cooling times were adjusted to 1000 s
and 2000 s, respectively. As shown in Fig. 3.10b, the PCM cannot be fully solidified due
to the insufficient time allocated for cooling. Nevertheless, the TTC operates stably after
the third cycle.

46
Figure 3.10. Cycle tests of the n-eicosane filled TTC under heating powers of a) 1.43 W and
b) 3.27 W.
3.4.4 Core Cooling vs. External Cooling
An effective PCM-based BTM system should also have the capability of maintaining
the temperature and temperature difference of battery packs at a low level while using the
minimal amount of PCM. In this section, the internal and external BTM systems are
compared on a 4-layer battery pack, as shown in Fig. 3.1. For the external BTM system,
both the pure PCM and PCM/EG composite are studied. In simulations, both battery packs

47
are discharged at a rate of 5 A with a natural convection boundary condition (h = 10 W m-
2 K-1) applied on the top and bottom surfaces of the packs.
In Fig. 3.11, the maximum temperature and temperature difference curves of the 4-
layer battery pack under internal and external cooling conditions are shown. Among three
cooling designs, the battery pack equipped with the internal BTM system has the lowest
peak temperature, which is 0.42oC and 2.57oC lower than the external cooling systems that
employ pure PCM and PCM/EG composite, respectively. In the bottom plot of Fig. 3.11,
it is seen that the use of PCM/EG reduces the temperature difference in the external system.
Among the three cooling designs, the internal BTM system provides the most uniform
temperature distribution for the battery pack, with the maximum temperature difference
below 3oC.
Figure 3.11. Maximum temperature and temperature difference curves of the 4-layer battery
pack equipped with internal and external BTM systems.
Finally, PCM usage and the normalized specific energy of the battery pack equipped
with three BTM systems are compared in Table 3.5, in which the PCM amount is calculated
based on the PCM area, and the normalized specific energy (NSE) is calculated by dividing
48
the specific energy of the battery pack equipped with BTM systems by that of the original
battery pack, which can be expressed by the following equation:
𝑁𝑆𝐸 = 𝑆𝐸𝑤𝑆𝐸𝑜
=
𝛼𝐴𝑐𝑒𝑙𝑙,𝑤𝐴𝑃𝐶𝑀𝜌𝑃𝐶𝑀,𝑙 + 𝐴𝑐𝑒𝑙𝑙,𝑤𝜌𝑐𝑒𝑙𝑙
𝛼𝐴𝑐𝑒𝑙𝑙,𝑜𝐴𝑐𝑒𝑙𝑙,𝑜𝜌𝑐𝑒𝑙𝑙
=1
1 +𝜌𝑃𝐶𝑀,𝑙𝜌𝑐𝑒𝑙𝑙
𝐴𝑃𝐶𝑀𝐴𝑐𝑒𝑙𝑙,𝑤
(3.8)
where SE is the specific energy, A indicates the area, α represents the volumetric battery
capacity. The subscript w, o, and l mean battery packs with BTM systems, the original
battery pack, and the liquid state PCM, respectively.
Table 3.5. Comparisons of the performance indicators of core and external cooling systems.
BTM systems PCM amount
(mm2) NSE
Peak
temperature (oC)
Peak temperature
difference (oC)
Core (rPCM = 4 mm) 603 0.930 44.3 2.84
External (pure PCM) 953 0.911 44.7 5.69
External (PCM/EG) 953 0.917 46.9 5.10
Among three cooling designs, the core BTM system consumes the least amount of
PCM. Meanwhile, owing to its efficient use of the PCM, the core cooling system has a
higher NSE value than that of the other two external cooling designs, indicating that the
core cooling design is the most lightweight design. To sum up, the proposed PCM-based
core BTM system is a lightweight design that uses the least amount of PCM and is able to
control the temperature rise and difference of the battery pack at low levels.
3.5 Summary
A PCM-based internal BTM system is proposed in this Chapter for cylindrical Li-ion
batteries. Both experiments and simulations are performed to verify the effectiveness of
the design in cooling and its strengths over the PCM-based external BTM systems. The
concluding remarks of this design are summarized as follows:

49
1) The PCM-based internal BTM system is safe and feasible for cylindrical battery
applications.
2) The addition of a PCM core can effectively alleviate the temperature rise and
achieve a uniform temperature in both batteries and battery packs.
3) An appropriate PCM is helpful in reducing the solidification time and ensuring a
safe operation in continuous cycles.
4) Battery packs equipped with PCM cores consume less PCM and have higher
specific energy, lower temperature rise, and more uniform temperature distribution than
packs equipped with PCM-based external BTM systems.
5) The internal BTM system is simple in design and can directly employ pure PCMs
as its cooling medium, which reduces the complexity of the system and the relevant cost.

50
Chapter 4. Optimization of the PCM-Based BTM System on Li-ion
Battery Packs
4.1. Overview
An effective and compact thermal management system is essential for modern
lithium-ion (Li-ion) battery-powered vehicles, which involve rigorous constraints on
weight and volume. In this Chapter, the PCM-based internal battery thermal management
(BTM) system introduced in Chapter 3 is numerically studied on a Li-ion battery
submodule consisting of 40 cylindrical batteries. Variables including PCM core size and
PCM core size distribution are optimized in the BTM system to achieve a better cooling
performance. The results show that the PCM cores can effectively alleviate the temperature
rise inside the battery pack, and a uniform temperature distribution can be obtained when
thicker PCM cores are embedded in the interior batteries. A battery pack compactness
study indicates that the internal BTM system is a space-saving design that facilitates the
achievement of a high energy density in the battery pack. Finally, an air cooling system is
integrated with the PCM-embedded battery pack to form a hybrid cooling system, and its
cooling performance is examined in a conjugate heat transfer model.
4.2. Battery Pack Description
Fig. 4.1a gives the geometry of a submodule with 40 cells assembled in parallel. Four
rows of cells are closely arranged in the battery pack to achieve a high energy density. A 2
mm thick aluminum frame physically retains the cells, and it also serves as the outer surface
for convection cooling. The vacancies in the upper-left and lower-right corners of the
battery pack are left for wiring and fixation intents. The “o” and “i” in the schematic
indicate the locations of the cells in the module and will be discussed in Section 4.4 for
BTM system optimization purposes. In Fig. 4.1b, a hybrid cooling design is introduced
into the battery pack by integrating air cooling. The red line on the left of the pack indicates
the inlet, while the blue line on the right represents the outlet. For these two battery packs,
all relevant dimensions are shown in the figure. Simulations are also carried out on the

51
battery pack consisting of original batteries for comparison, and the battery layouts are kept
the same with the battery pack shown in Fig. 4.1a & b.
Figure 4.1. a) Schematic illustration of a passively cooled 40-cell battery pack; b) Schematic
illustration of a hybrid cooling design for the battery pack.
The proposed PCM-based internal BTM system has the following advantages versus
the external passive BTM system: 1) the battery roll can be directly wrapped on the cooling
52
core during the battery manufacturing stage, which is simpler than external PCM matrix
designs; 2) instead of using PCM/metal foam or PCM/EG matrix, pure PCM can be directly
used as the cooling material in the core due to the short heat transfer length, which ensures
a high latent heat and low cost; 3) the BTM system is a compact design and once built, no
maintenance would be required; 4) the modified battery has the same appearance as the
original battery, which improves the flexibility of integrating other BTM systems, such as
forced air or liquid cooling systems, into the battery module.
4.3. Model Setup
The Solid Heat Tranfer Model described in Chapter 3 is used in this Chapter to
simulate the thermal responses of the battery packs and phase changes in the cores. When
considering the forced air cooling, a 2D conjugate heat transfer model is employed. The
model includes a fluid zone and solid zone to model the cooling air and batteries. The
Reynolds stress and renormalization group turbulent model, k- model, was employed to
obtain the flow field of cooling air between batteries. The boundary conditions are velocity
inlet (u = 1 m s-1, Tin = 24oC), pressure outlet (0 gauge static pressure), no-slip at wall
surfaces, and insulated top and bottom walls. For the simulations, the initial condition is:
𝑇 = 𝑇0 = 24℃ (4.1)
When generating the meshes, the same inflation layers as in Chapter 3 were also
created at the interfaces. Grid sensitivity studies were carried out to ensure the simulation
results are independent of the grid size. Sample meshes are shown in Fig. 4.1a and b, and
a total number of 186,477 and 254,316 grids were generated for these two designs,
respectively.
4.4. Results and Discussion
4.4.1 Battery Performance Index
The cooling performance of a BTM system can be evaluated by using the following
indices: Tpeak, ΔT, ts, and , which mean the peak temperature during discharge, the

53
maximum temperature difference among batteries, the PCM solidification time, the space
utilization ratio (the battery volume over the battery pack volume), and the capacity ratio
(the volumetric capacity of the battery pack equipped with the BTM system over the
original battery pack), respectively. The first three parameters need to be minimized while
the last two should be maximized in the BTM system. Sections 4.4.2 to 4.4.3 discuss the
optimization of the passive cooling design (Fig. 4.1a). The simulation results of the hybrid
cooling design (Fig. 4.1b) are given in Section 4.4.4. The space utilization of different
designs is discussed and compared with previous works in Section 4.4.5.
4.4.2 PCM Core Size
For PCM-embedded batteries, although the increase of the PCM core size can enhance
the cooling capacity of the system, overloaded PCM will lower the overall energy density
of the battery system. The design criteria provided by the industrial partner for this project
is to manage the peak temperature of the battery pack below 50oC under an unfavorable
cooling condition (h = 1 W m-2 K-1) during a 1.92 C discharge.
The maximum temperature profiles of the battery pack loaded with different amounts
of PCM during 0.96 C and 1.92 C discharges are compared in Fig. 4.2a and b, respectively.
It is seen that for the 0.96 C discharge, the peak temperature becomes stable at 36oC as the
PCM radius increases to 2.5 mm. For the 1.92 C discharge, the peak temperature can be
maintained below 50oC as the PCM radius reaches 3.8 mm. For both discharge rates,
significant temperature drops can be observed after incorporating the PCM cores into the
battery pack.
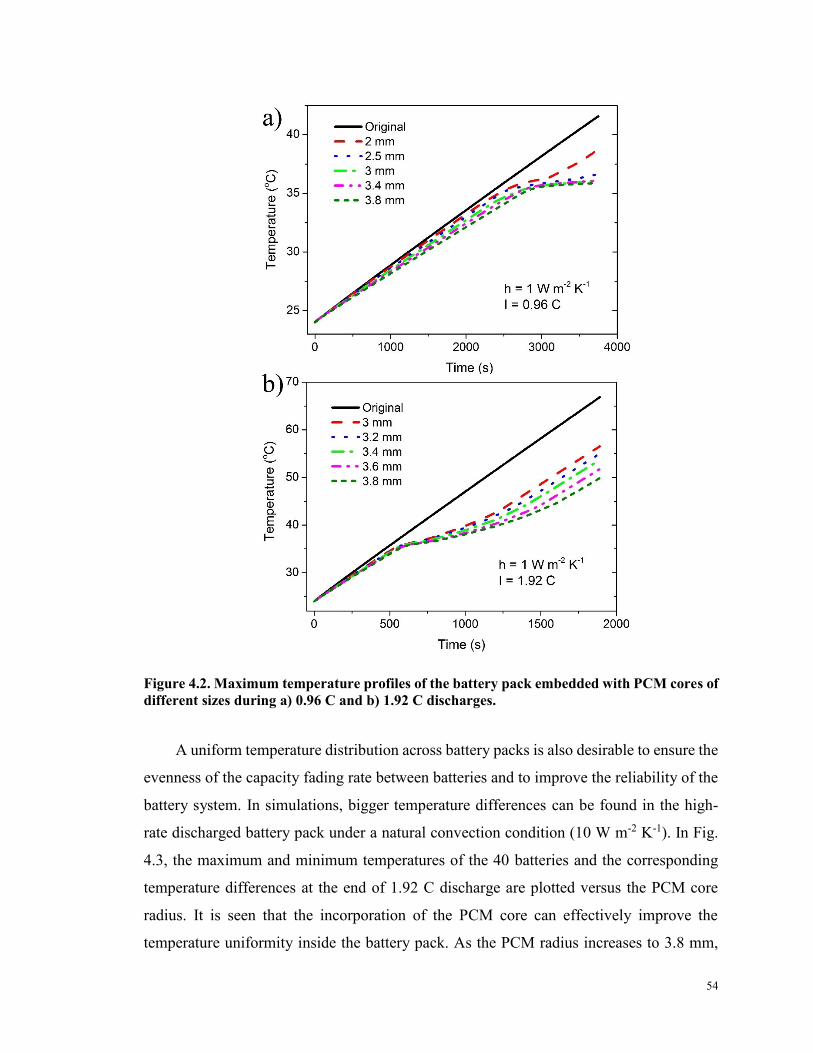
54
Figure 4.2. Maximum temperature profiles of the battery pack embedded with PCM cores of
different sizes during a) 0.96 C and b) 1.92 C discharges.
A uniform temperature distribution across battery packs is also desirable to ensure the
evenness of the capacity fading rate between batteries and to improve the reliability of the
battery system. In simulations, bigger temperature differences can be found in the high-
rate discharged battery pack under a natural convection condition (10 W m-2 K-1). In Fig.
4.3, the maximum and minimum temperatures of the 40 batteries and the corresponding
temperature differences at the end of 1.92 C discharge are plotted versus the PCM core
radius. It is seen that the incorporation of the PCM core can effectively improve the
temperature uniformity inside the battery pack. As the PCM radius increases to 3.8 mm,

55
the maximum temperature difference reduces to 3.24oC, which is 1.23oC lower than the
original battery pack. Compared to the original battery pack, the PCM cores in the modified
battery pack can provide an additional cooling source for the battery pack besides the
natural convection and are helpful in alleviating the heat accumulation.
Figure 4.3. Plots of the maximum and minimum temperatures, as well as the temperature
differences of the batteries embedded with PCM cores of different sizes at the end of a 1.92 C
discharge.
4.4.3 PCM Core Size Distribution
In previous simulations, all the cells in the battery pack have the same PCM core size.
Though it shows significant improvements compared to the original battery pack, the
temperature uniformity within the battery pack can be further improved if the PCM core
size for different batteries could be determined based on their heat dissipation
environments. Fig. 4.4a shows the temperature contour of the battery pack using uniform
3.8 mm PCM cores. Higher temperatures can be observed in batteries located at the pack
center. Thus, the batteries are divided into two groups, “i” and “o” as shown in Fig. 4.1a,
which represent the batteries that only contact with batteries and the batteries that also
contact with the pack case, respectively. In total, there are 18 “i” cells and 22 “o” cells.

56
Figure 4.4. Temperature contours of the battery pack using different core size combinations
at the end of a 1.92 C discharge under natural convection condition.
To fully exert the cooling potential of the PCM cores and even the temperature
distribution inside the battery pack, thicker PCM cores are embedded in the “i” batteries,
57
while thinner cores are incorporated in the “o” batteries. With the change of the core sizes,
the total PCM volume varies slightly. Fig. 4.5a shows the PCM volume ratio of different
combinations to the pack with uniform 3.8 mm PCM cores. It is seen that the combination
3 (ro = 3.4 mm & ri = 4.2 mm) consumes the least PCM while the combination 6 (ro = 2.8
mm & ri = 4.8 mm) uses the most PCM. Six sets of combinations were simulated in this
work. More combinations of inner and outer cores will be studied in the future work.
In Fig. 4.5b and c, the temperature differences between points A (marked in Fig. 4.1a,
battery pack center) and B (battery pack corner) of the battery pack when using different
PCM core size combinations during a 1.92 C discharge are plotted for comparison. Under
the natural convection condition, it is found that the increase of PCM core size in the “i”
batteries is effective in reducing the temperature difference. However, when h equals to 1
W m-2 K-1, too thick PCM cores in the “i” batteries lead to a lower temperature at the battery
pack center than the corner and eventually make the temperature difference bigger.
The temperature contours of the selected three combinations (3.8 mm, 3.4 mm & 4.2
mm, and 2.8 mm & 4.8 mm) at the end of a 1.92 C discharge under natural convection are
shown in Fig. 4.4a, b & c, respectively. It is seen that the rearrangement of the PCM size
can effectively alleviate the heat accumulation at the battery pack center. Particularly, the
combination of 3.4 mm and 4.2 mm cores achieves a highly uniform temperature
distribution across the entire battery pack with the maximum temperature difference
between jelly rolls within 2oC. Meanwhile, at the end of the discharge, the PCM is fully
melted while having a close temperature to the jelly rolls. This further proves that the pure
PCM can be directly used to fill the cooling core with an excellent performance, which
makes the design feasible, cost-effective, and competitive.

58
Figure 4.5. a) The PCM volume ratio of different core size combinations to the combination
with uniform 3.8 mm cores; The temperature difference curves between points A and B in
the battery pack using different core size combinations during the 5 A discharge under
convective cooling with h of b) 1 W m-2 K-1, and c) 10 W m-2 K-1.

59
Although thicker PCM cores can mitigate the heat accumulation at the battery pack
center, too thick PCM cores (e.g., r = 4.8 mm) are not suggested for the “i” batteries, which
is due to the following reasons: more PCM is consumed in the BTM system; it leads to
bigger temperature differences at low h values; and it does not fully utilize the latent heat
of the PCM, as shown in Fig. 4.6. It is seen that the PCM in the “i” batteries is not fully
melted at the end of a 1.92 C discharge.
Figure 4.6. The liquid fraction of PCM cores (2.8 mm & 4.8 mm combination) at the end of a
1.92 C discharge under natural convection condition.
The optimized battery pack with embeded 3.4 mm & 4.2 mm PCM cores then undergo
simulations with higher h values to study the corresponding thermal responses. In Fig. 4.7,
the maximum temperature and temperature difference curves during a 1.92 C discharge are
plotted. It is seen that as the h value increases to 30 and 50 W m-2 K-1, the maximum
temperature difference increases to 4.79oC and 5.55oC, the peak temperature decreases to
41.67oC and 39.71oC and the time spent for the battery module to restore to the initial state
reduces to 8130 s and 4940 s, respectively.

60
Figure 4.7. The maximum temperature and temperature difference profiles of the modified
battery pack during a 1.92 C discharge during forced convective cooling conditions.
4.4.4 Hybrid Cooling System
One merit of the core cooling design is that it does not alter the appearance of
cylindrical batteries, which facilitates the integration of additional cooling systems to
improve the robustness of the BTM system to overcome the overheating issues of the
battery system during high-intensity discharge scenarios. In this section, a forced air
cooling system is introduced and combined with the PCM-based internal BTM system to
form a hybrid BTM system, as shown in Fig. 4.1b. Simulations are carried out on both the
original battery pack and the PCM-embedded battery pack for comparison.
In Fig. 4.8, both battery packs are compared in terms of their temperature and
temperature difference profiles under a forced-air cooling condition with an inlet air
velocity of 1 m s-1. It is seen that after replacing the original cells with PCM-embedded
cells, the thermal performance of the battery packs is remarkably improved. The peak
temperature drops from 47.4oC to 39.38oC and the maximum temperature difference
reduces from 10.8oC to 4.7oC.

61
Figure 4.8. Comparisons of the temperature and temperature difference profiles of the
original battery pack and the PCM-embedded battery pack cooled by air.
Figure 4.9a and d compares the temperature contours of the cells in two battery packs
at the end of a 1.92 C discharge. It is seen that after replacing the original cells with the
modified cells, the temperature distribution within the battery pack becomes more uniform.
Due to the higher battery temperature, the cooling air along the channel in the original
battery pack is more heated than the modified battery pack, as shown in Fig. 4.9b and e,
which finally causes an insufficient cooling of the batteries close to the exit. Figure 4.9c
and f show the velocity contours of the two battery packs. Since the batteries are the same
in appearance, the velocity distributions inside these two battery packs are almost identical.
The maximum velocity in the original battery pack is slightly larger due to the higher air
temperature.
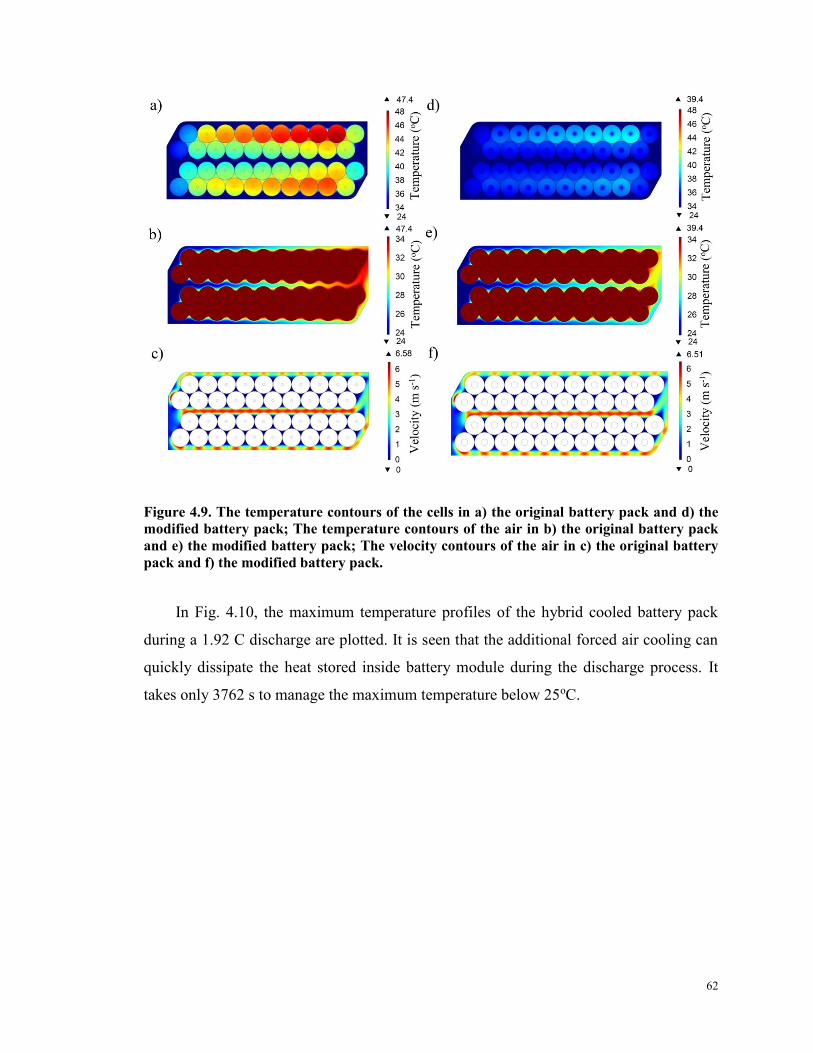
62
Figure 4.9. The temperature contours of the cells in a) the original battery pack and d) the
modified battery pack; The temperature contours of the air in b) the original battery pack
and e) the modified battery pack; The velocity contours of the air in c) the original battery
pack and f) the modified battery pack.
In Fig. 4.10, the maximum temperature profiles of the hybrid cooled battery pack
during a 1.92 C discharge are plotted. It is seen that the additional forced air cooling can
quickly dissipate the heat stored inside battery module during the discharge process. It
takes only 3762 s to manage the maximum temperature below 25oC.
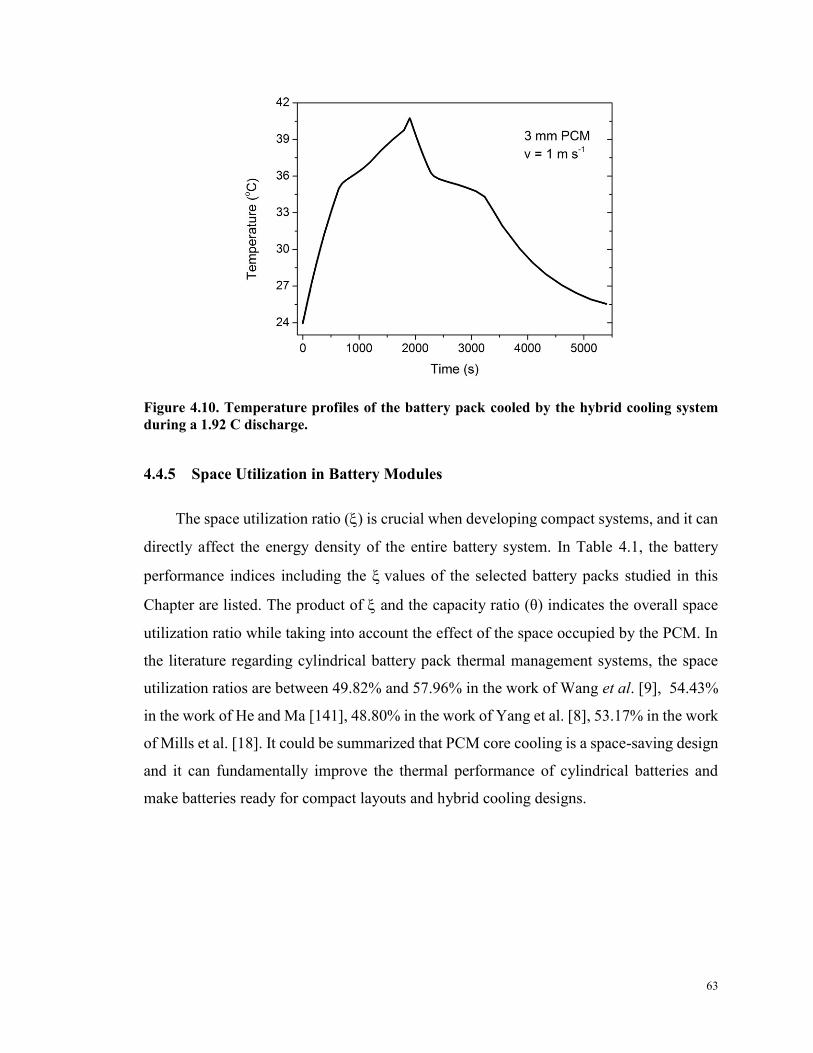
63
Figure 4.10. Temperature profiles of the battery pack cooled by the hybrid cooling system
during a 1.92 C discharge.
4.4.5 Space Utilization in Battery Modules
The space utilization ratio () is crucial when developing compact systems, and it can
directly affect the energy density of the entire battery system. In Table 4.1, the battery
performance indices including the values of the selected battery packs studied in this
Chapter are listed. The product of and the capacity ratio (θ) indicates the overall space
utilization ratio while taking into account the effect of the space occupied by the PCM. In
the literature regarding cylindrical battery pack thermal management systems, the space
utilization ratios are between 49.82% and 57.96% in the work of Wang et al. [9], 54.43%
in the work of He and Ma [141], 48.80% in the work of Yang et al. [8], 53.17% in the work
of Mills et al. [18]. It could be summarized that PCM core cooling is a space-saving design
and it can fundamentally improve the thermal performance of cylindrical batteries and
make batteries ready for compact layouts and hybrid cooling designs.
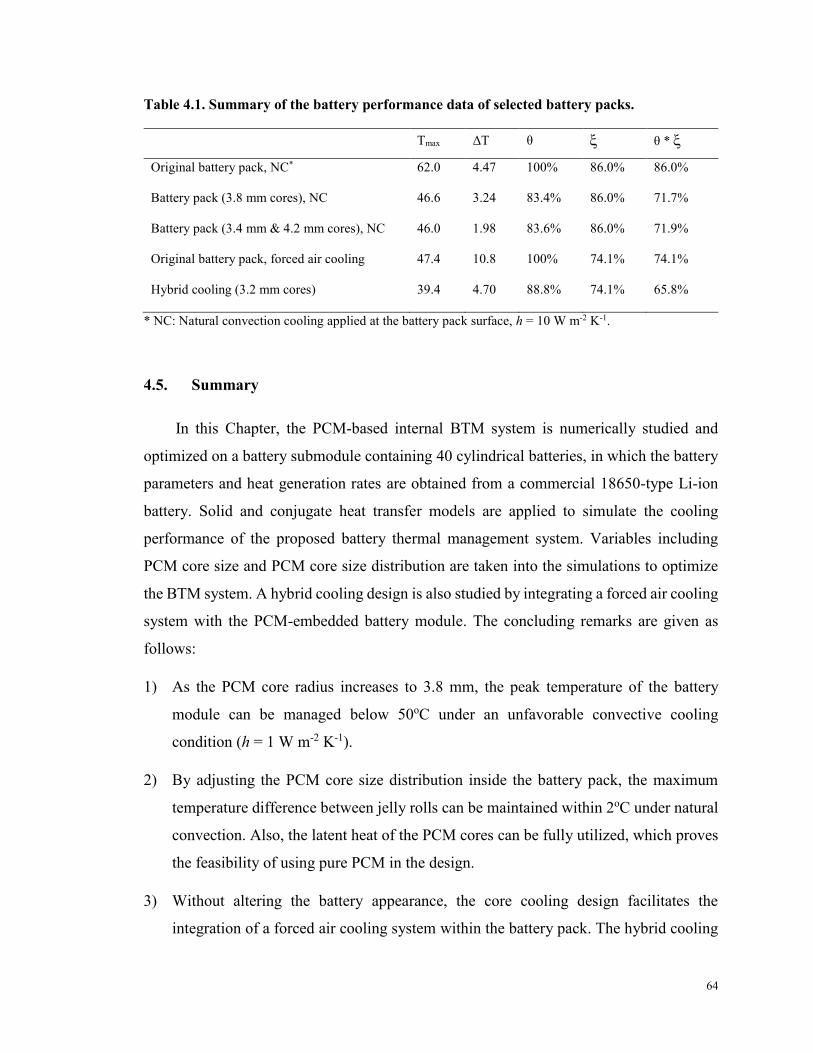
64
Table 4.1. Summary of the battery performance data of selected battery packs.
Tmax ΔT θ θ *
Original battery pack, NC* 62.0 4.47 100% 86.0% 86.0%
Battery pack (3.8 mm cores), NC 46.6 3.24 83.4% 86.0% 71.7%
Battery pack (3.4 mm & 4.2 mm cores), NC 46.0 1.98 83.6% 86.0% 71.9%
Original battery pack, forced air cooling 47.4 10.8 100% 74.1% 74.1%
Hybrid cooling (3.2 mm cores) 39.4 4.70 88.8% 74.1% 65.8%
* NC: Natural convection cooling applied at the battery pack surface, h = 10 W m-2 K-1.
4.5. Summary
In this Chapter, the PCM-based internal BTM system is numerically studied and
optimized on a battery submodule containing 40 cylindrical batteries, in which the battery
parameters and heat generation rates are obtained from a commercial 18650-type Li-ion
battery. Solid and conjugate heat transfer models are applied to simulate the cooling
performance of the proposed battery thermal management system. Variables including
PCM core size and PCM core size distribution are taken into the simulations to optimize
the BTM system. A hybrid cooling design is also studied by integrating a forced air cooling
system with the PCM-embedded battery module. The concluding remarks are given as
follows:
1) As the PCM core radius increases to 3.8 mm, the peak temperature of the battery
module can be managed below 50oC under an unfavorable convective cooling
condition (h = 1 W m-2 K-1).
2) By adjusting the PCM core size distribution inside the battery pack, the maximum
temperature difference between jelly rolls can be maintained within 2oC under natural
convection. Also, the latent heat of the PCM cores can be fully utilized, which proves
the feasibility of using pure PCM in the design.
3) Without altering the battery appearance, the core cooling design facilitates the
integration of a forced air cooling system within the battery pack. The hybrid cooling

65
design with a 1 m s-1 inlet air velocity and 3.2 mm PCM cores can effectively manage
the battery temperature below 40oC and the temperature difference within 5oC.
As a final note, while providing an internal cooling option, the PCM-embedded
batteries in the battery pack can be arranged in a more compact layout than previous works,
which can notably enhance the energy density of the entire battery system.

66
Chapter 5. Development of a Heat Pipe-Based BTM System for
Normally Discharged Prismatic Li-ion Batteries
5.1 Overview
Due to their higher power density, prismatic Li-ion batteries are generally equipped on
hybrid electric vehicles and electric racing vehicles and frequently charged and discharged
at high rates. In this Chapter, an ultrathin heat pipe and wet cooling combined active BTM
system is developed to handle the thermal surge of prismatic Li-ion batteries during high-
rate discharges. The BTM system utilizes the high thermal conductivity of ultrathin heat
pipes to transfer the heat from the battery side to the condenser side, where wet cooling is
carried out to dissipate the heat. The heat pipe-wet cooling combined design is for the first
time applied to battery cooling. Two battery packs, 3 Ah and 8 Ah, with different condenser
lengths are used and tested through a series of high-intensity discharges to examine the
cooling effects of the proposed BTM system. Different cooling strategies are also
implemented on the condenser side of the heat pipes to investigate their effect, and
comparisons were also made between them and the natural convection. The experimental
results show that the novel heat pipe-wet cooling combined BTM system has significantly
improved cooling ability than other heat pipe-based BTM system. The proposed BTM
system can be further equipped on electric racing cars for competitions. The water
consumed due to evaporation could be refilled during pit stops.
5.2 Experimental Setup
Two battery packs, four series-connected 3 Ah batteries and four series-connected 8
Ah batteries, were used in the experiments. The specifications of the batteries in the two
battery packs are listed in Table 5.1. Depending on whether heat pipes are involved in the
BTM system, the BTM systems used in the tests are classified as two main groups: pack
without heat pipes (natural convection) and pack with heat pipes. For natural convection
condition, all the battery packs were tested as received, where the batteries were closely
attached to each other. While in the heat pipe-based BTM system, heat pipes were

67
sandwiched between the batteries, and the condensers were exposed externally to the packs.
Heat pipes of different dimensions were selected to match the sizes of the battery packs.
Thermally conductive silicone pads were also placed between the batteries and heat pipes
to increase their thermal contact. The specifications of the heat pipes and thermal pads are
given in Table 5.2. The selection of battery packs and heat pipes was also due to their
availability. The heat pipes were chosen to have close widths as the batteries. After
assembly, the condenser lengths (the lengths of the exposed heat pipe sections) were 125
mm and 70 mm in the 3 Ah and 8 Ah battery packs, respectively.
Ultrathin heat pipes have been widely used for electronic cooling due to their
compactness [142]. Fig. 5.1 shows the heat pipe 2 used in the work. The ultrathin heat pipe
is made of aluminum and consists of arrays of hollow channels filled with acetone staying
at vapor and liquid coexisting phases. Once heated by the batteries, the acetone boils at the
evaporator side and flows to the condenser side for condensation. The movement of the
acetone can quickly transfer the thermal energy between the evaporator and condenser of
the heat pipes and can alleviate the temperature increase of the sandwiched batteries.
Figure 5.1. Photographs of the a) heat pipe 2 and b) its internal structure.

68
Table 5.1. Specifications of the 3 Ah and 8 Ah batteries.
Battery 1 Battery 2
Length (mm)
Width (mm)
Height (mm)
Weight (g)
Nominal voltage (V)
Nominal capacity (mAh)
Maximum charge rate (C)
Maximum discharge rate (C)
Working temperature range (oC)
125
40
5.5
70
3.7
3000
5
25
-20 – 60
180
45
9
185
3.7
8000
5
25
-20 – 60
Table 5.2. Specifications of heat pipes and thermal pads.
Heat pipe 1 Heat pipe 2 Thermal pad 1 (2)
Length (mm)
Width (mm)
Thickness (mm)
Weight (g)
Material
Wick structure
Working fluid
Working temperature (oC)
Thermal conductivity (W m -1 K-1)
250
40
2
25
Aluminum
Groove
Acetone
-50 – 125
-
250
50
2.5
40
Aluminum
Groove
Acetone
-50 – 125
-
125 (175)
40 (45)
0.5
4 (6.5)
Silicone compound
-
-
-40 – 200
3.2
The schematic illustration of the heat pipe sandwiched 8 Ah battery pack is shown in
Fig. 5.2a. This schematic is similar to the 3 Ah battery pack except for their difference in
battery dimensions. Fig. 5.2b shows the locations where K-type thermocouples were used
to record the battery temperatures. Through comparing the recorded temperatures from T1
to T6, the temperature difference in the battery pack level can be obtained. Similarly, the
battery level temperature uniformity can be found by comparing the temperatures from Ta
to Te.

69
Figure 5.2. a) Schematic illustration of a battery pack sandwiched by heat pipes; b) Locations
where the battery temperatures were measured.
For the heat pipe-based BTM system, five cooling strategies were applied on the
condenser: 1) condenser cooled by ambient air (named as ‘heat pipes in ambient’ in figure
legends), 2) condenser cooled by a horizontal fan (hori-pipe with fan), 3) condenser cooled
by a vertical fan (verti-pipe with fan), 4) condenser cooled by thermostat water bath (heat
pipe in water bath), and 5) condenser cooled through wet cooling (hori-pipe with wet
cooling). The schematic illustrations of methods 2) – 4) are shown in Fig. 5.3. In the
systems involving a cooling fan, the distance between the fan and the heat pipes was kept
at 5 cm, and the radius and rotation speed of the fan were 4 cm and 1500 rpm, respectively.
The temperature of the water in the thermostat bath was 25oC. For wet cooling strategy,
the water volume per spray was 0.7 ml, and the frequencies of spray was 1 min-1 and 0.5
min-1 for the 3 Ah and 8 Ah battery packs, respectively. These two spray frequencies were
selected because the water evaporation rates on the condensers matched well with the water

70
supply rates, i.e., the condensers were kept moist and there was no water dripping from the
condensers during the cooling stage. To improve the adhesion of water to the condensers,
thin layers of water absorbent fibers were wrapped around the condenser.
The relative humidity is related to the evaporation rate of water and the energy that
can be taken away from the condensers of heat pipes. With a higher relative humidity, the
evaporation rate will be reduced, and the cooling performance of the heat pipe-wet cooling
combined BTM will be degraded. For all the tests were done, the relative humidity was
within the range between 30% and 35%.
Figure 5.3. Schematic illustrations of four heat pipe-based BTM systems, a) horizontal heat
pipes with cooling fan; b) vertical heat pipes with cooling fan; c) heat pipes in a thermostat
water bath and d) horizontal heat pipes with wet cooling.
To ensure the comparability of the cooling results and to avoid the difference between
battery packs, one battery pack for each capacity was used for all the tests with equipping
different BTM systems. The capacity fading of the battery packs during the tests can be
neglected since all the Li-ion batteries were labeled with a cycle life of 1000 retaining 80%
of their total capacities. To reduce the uncertainties, such as air flow, all the tests were
taken in a 0 m s-1 closed wind tunnel. Other uncertainties, such as accuracy of the
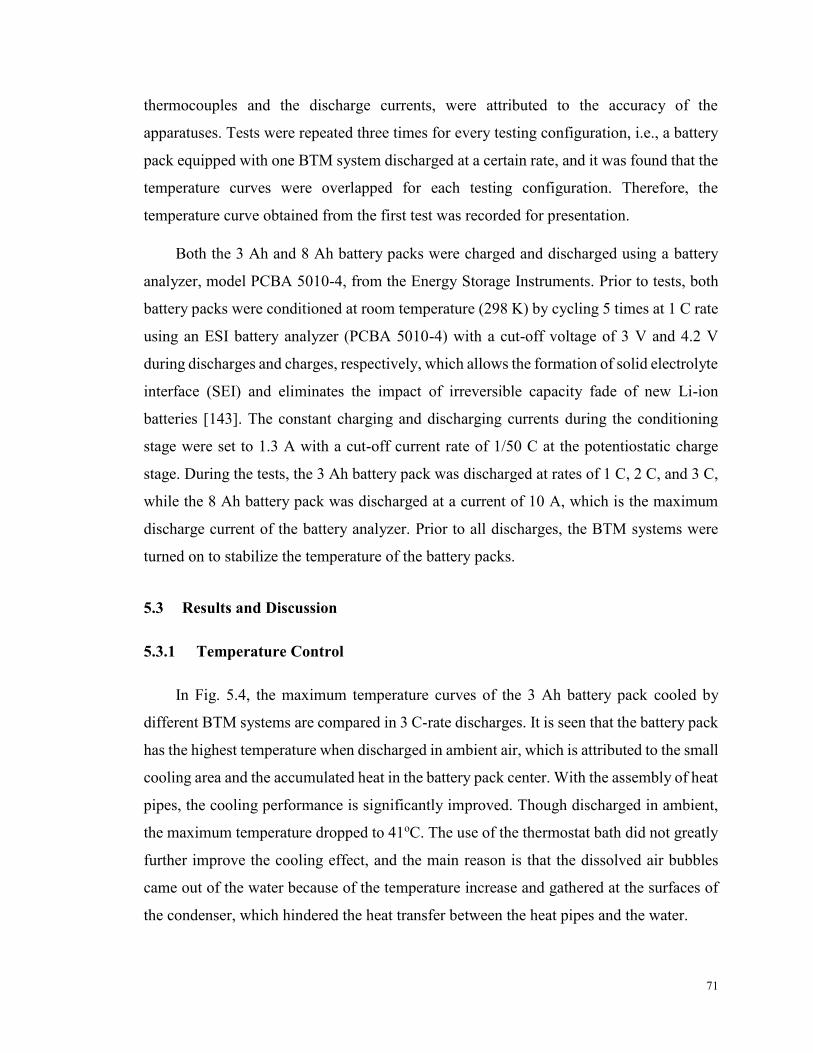
71
thermocouples and the discharge currents, were attributed to the accuracy of the
apparatuses. Tests were repeated three times for every testing configuration, i.e., a battery
pack equipped with one BTM system discharged at a certain rate, and it was found that the
temperature curves were overlapped for each testing configuration. Therefore, the
temperature curve obtained from the first test was recorded for presentation.
Both the 3 Ah and 8 Ah battery packs were charged and discharged using a battery
analyzer, model PCBA 5010-4, from the Energy Storage Instruments. Prior to tests, both
battery packs were conditioned at room temperature (298 K) by cycling 5 times at 1 C rate
using an ESI battery analyzer (PCBA 5010-4) with a cut-off voltage of 3 V and 4.2 V
during discharges and charges, respectively, which allows the formation of solid electrolyte
interface (SEI) and eliminates the impact of irreversible capacity fade of new Li-ion
batteries [143]. The constant charging and discharging currents during the conditioning
stage were set to 1.3 A with a cut-off current rate of 1/50 C at the potentiostatic charge
stage. During the tests, the 3 Ah battery pack was discharged at rates of 1 C, 2 C, and 3 C,
while the 8 Ah battery pack was discharged at a current of 10 A, which is the maximum
discharge current of the battery analyzer. Prior to all discharges, the BTM systems were
turned on to stabilize the temperature of the battery packs.
5.3 Results and Discussion
5.3.1 Temperature Control
In Fig. 5.4, the maximum temperature curves of the 3 Ah battery pack cooled by
different BTM systems are compared in 3 C-rate discharges. It is seen that the battery pack
has the highest temperature when discharged in ambient air, which is attributed to the small
cooling area and the accumulated heat in the battery pack center. With the assembly of heat
pipes, the cooling performance is significantly improved. Though discharged in ambient,
the maximum temperature dropped to 41oC. The use of the thermostat bath did not greatly
further improve the cooling effect, and the main reason is that the dissolved air bubbles
came out of the water because of the temperature increase and gathered at the surfaces of
the condenser, which hindered the heat transfer between the heat pipes and the water.

72
A comparison is then made between the fan cooling on the battery pack equipped with
heat pipes of different inclination angles. Although previous researchers observed that heat
pipes had different performance at different inclination angles, the micro-channeled heat
pipes perform similarly in different inclination angles. In the ultra-thin heat pipe, the gas
and liquid inside the microchannel are discontinuously connected. When there exists a
temperature difference between the evaporator and condenser of the heat pipes, the coolant
can circulate inside the channel to dissipate the heat generated by the battery pack. The
capillary force also minimizes the effect of the gravity on the coolant.
For the wet cooling approach, the battery pack had the lowest initial temperature due
to the evaporation of water reduced the temperature of the battery pack. In comparison, it
is seen that the heat pipe and wet cooling combined BTM system is the most effective
method in managing the temperature rise of batteries among all the methods, with the
maximum temperature of 21oC at the end of the 3C discharge.
Figure 5.4. Temperature curves of the 3 Ah battery pack cooled by different approaches
during the 3 C discharges.
Besides the 3 C rate discharge, 1 C and 2 C discharges were also carried out. Due to
the overlap of the temperature profiles of the BTM system with different pipe inclination
angles, as well as the unsatisfactory cooling performance of the thermostat water bath, 1 C
and 2 C discharges were only performed on the 3 Ah battery packs equipped with the other
73
four cooling approaches: ambient, heat pipes in ambient, horizontal pipes with fan cooling,
and horizontal pipe with wet cooling. The temperature rises of the four cooling approaches
are summarized in the bar chart as shown in Fig. 5.5. The fan cooling and wet cooling
outperform the other cooling approaches. Particularly, the wet cooling approach achieves
the lowest temperature rises for all discharge rates, which demonstrates its superiority over
other cooling approaches in managing the heat generated from Li-ion batteries.
Figure 5.5. Temperature rises of the 3 Ah battery pack cooled through different approaches
at the assigned discharge rates.
5.3.2 Temperature Difference
Temperature uniformity in a Li-ion battery system is an important factor that can
affect its long-term performance. A nonuniform temperature in the battery level and the
pack level can lead to different capacity fading rates and unbalanced voltages between
batteries.
Fig. 5.6 shows the temperature difference profiles of the 3 Ah battery pack cooled
through different approaches during the 3 C discharge. As can be seen, the temperature
difference of the battery pack discharged in ambient experiences a dramatic rise as
discharge proceeds, and at the end of discharge, the temperature difference reaches 6.8oC.

74
The big temperature difference is attributed to the heat accumulation in the battery pack
center. In comparison, the maximum temperature differences are all within 3oC in the heat
pipes-sandwiched battery packs, and the maximum temperature difference is even lower
than 1.5oC when the wet cooling approach is applied on the condenser side of the heat
pipes. Compared with natural convection, the improved temperature uniformity in the heat
pipe-equipped battery pack is due to the fact that the heat pipes can efficiently transfer the
heat from the center of the battery pack to the condenser for dissipation, thus alleviating
the heat accumulation.
Figure 5.6. Temperature difference curves of the 3 Ah battery pack cooled through different
approaches during the 3 C discharges.
The temperature difference curves of the inner battery cooled through different
approaches are plotted in Fig. 5.7. As shown, the trends of the battery-level temperature
difference curves are similar to that of the pack-level, but the temperature differences are
much smaller and are below 2.5oC, which is because the inner battery has a simpler and a
more uniform surrounding for heat transfer than the battery pack. In Table 5.3, the
experimental results of the 3 Ah battery are summarized. In the table, Tmax and Trise indicate
the maximum temperature and the maximum temperature rise of the battery pack during
discharges, respectively. ΔTpack and ΔTcell mean the maximum temperature differences in
the battery pack and battery cell during discharges, respectively.

75
Figure 5.7. Temperature difference curves of the inner battery in the 3 Ah battery pack cooled
through different approaches during the 3 C discharges.
Table 5.3. Summary of the experimental results of the 3 Ah battery pack.
Cooling methods C rate Tmax (oC) Trise (oC) ΔTpack (oC) ΔTcell (oC)
Ambient
1 C
2 C
3 C
37.2
45
48.8
12.2
20.1
23.6
–
–
6.8
–
–
2.1
Heat pipes in ambient
1 C
2 C
3 C
30.7
38
41.1
5.7
13
16.1
–
–
2.9
–
–
0.8
Horizontal pipes with fan
1 C
2 C
3 C
27.5
29.6
31.8
2.5
4.6
6.7
–
–
2.2
–
–
0.7
Vertical pipes with fan 3 C 31.8 6.8 2.2 0.7
Heat pipes in water bath 3 C 38.2 13.2 6.2 1.5
Horizontal pipe with wet cooling
1 C
2 C
3 C
20.5
21
21.5
1.5
1.9
2.5
–
–
1.2
–
–
0.5

76
5.3.3 Large Battery Pack Cooling
A compact battery pack is necessary for some mission-critical applications, and the
space occupied by the BTM system should be reduced. To examine the heat pipe and wet
cooling combined BTM system in cooling a large-size battery pack with a reduced cooling
area, an 8 Ah battery pack is used, and the length of the heat pipe condenser is shortened
from 12 cm in the 3 Ah battery pack to 6.5 cm. Meanwhile, the spraying frequency is
decreased from 1 spray per minute to 0.5 sprays per minute.
Figure 5.8. The maximum and minimum temperature curves of the 8 Ah battery pack cooled
through natural convection and wet cooling approach during 10 A discharges.
In Fig. 5.8, the maximum and minimum temperature curves of the 8 Ah battery pack
cooled through natural convection and wet cooling are given. The heat pipe and wet cooling
combined BTM system outperforms the natural convection in control of the battery pack
temperature. Although the cooling performance of the combined system is slightly
degraded compared to that equipped on the 3 Ah battery pack, the battery temperature is
much lower than that of the upper limit of the optimum temperature range, and there is a
lot of room to make the BTM system more compact. The pack-level and battery-level
temperature difference curves of the 8 Ah battery pack cooled through natural convection
and wet cooling are given in in Fig. 5.9a and b, respectively. When natural convection was
applied, the pack-level and battery-level temperature differences reach as high as 9.3oC and

77
3.5oC at the end of the 10 A discharge, respectively. While for the heat pipe and wet cooling
combined system, the pack-level and battery-level temperature differences of the battery
pack are managed to 1.1oC and 0.4oC, respectively, which ensures a uniform capacity
fading rate for all batteries and guarantees a high energy output and long lifespan.
Figure 5.9. a) Pack-level and b) battery-level temperature difference curves of the 8 Ah
battery pack cooled through natural convection and wet cooling approach during 10 A
discharges.
Cycle tests were then carried out on the 8 Ah battery pack cooled through natural
convection and wet cooling approach. During the tests, the charging and the discharging
currents were set to 10 A, and the cut-off current at the potentiostatic charging stage was
set to 160 mA. In Fig. 5.10, the temperatures at points 1 and 4 are plotted for both systems,

78
and the temperature difference curves are given on the bottom of each figure. As shown,
when the battery pack is discharged in ambient, the maximum temperature reaches 51.5oC
at the end of the 2nd and 3rd cycles, having a maximum temperature difference of 12.4oC.
It also takes 3 cycles for the battery pack to operate under stable conditions (same initial
temperature prior to discharging). In comparison, the battery pack equipped with the heat
pipe and wet cooling combined BTM system returned to its initial temperature after the
first cycle, and the maximum temperature during the test was as low as 26oC. Meanwhile,
the pack-level temperature difference was the same for both cycles with a maximum value
of 1oC.
Figure 5.10. Temperature curves of the 8Ah battery cooled through a) natural convection and
b) wet cooling approaches during cycle tests.

79
5.4 Summary
In this Chapter, a heat pipe-based BTM system was experimentally studied on
prismatic Li-ion batteries. Different cooling strategies were implemented on the condenser
side of the heat pipes to investigate their effect, and comparisons were also made between
them and natural convection.
For tests on the 3 Ah battery pack, natural convection is insufficient to cool down the
battery pack discharged at high rates, and it also leads to a large temperature gradient inside
the battery pack. After embedding the heat pipes, an improved temperature uniformity and
a relatively alleviated temperature rise was found in the battery pack discharged in ambient.
The use of a cooling fan further improved the cooling capability of the heat pipe-based
BTM system. By evaporating water on the heat pipe condenser, wet cooling managed the
battery heat more effectively than all the other implemented cooling strategies. It could
maintain the battery temperature and temperature difference at much lower levels. Even
with a reduced condenser length and water spraying frequency, the heat pipe and wet
cooling combined BTM system performed outstandingly in managing the temperature of
an 8 Ah battery pack.
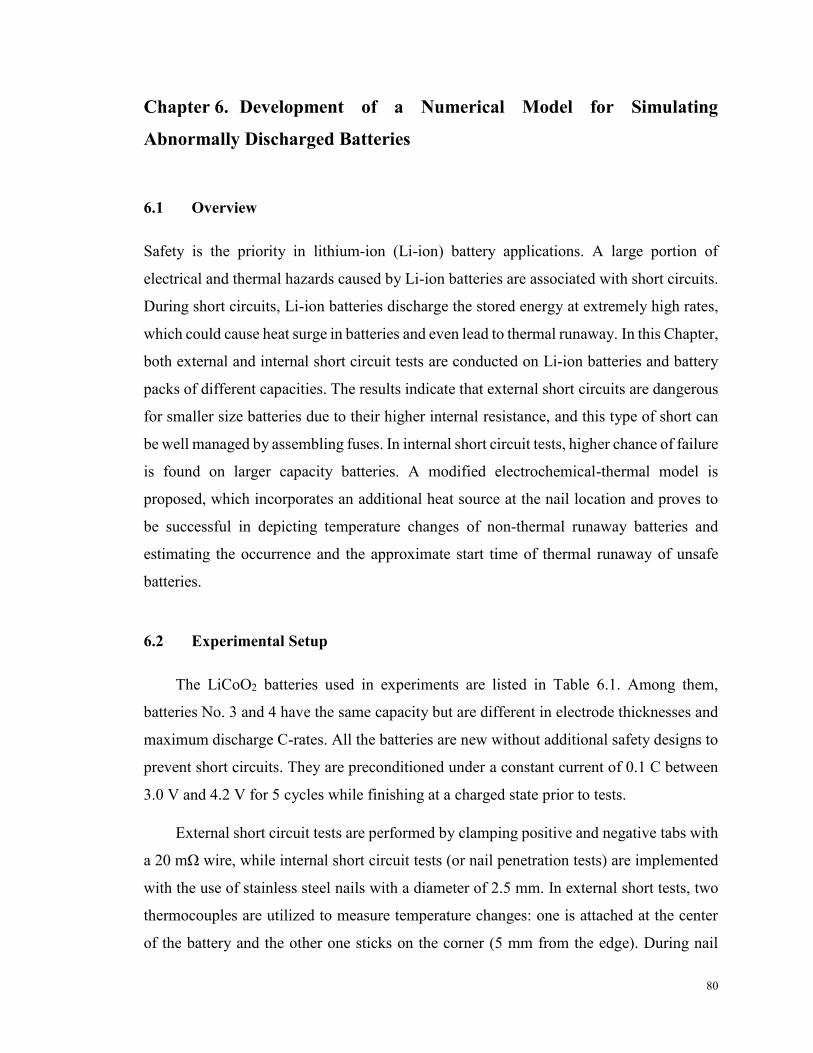
80
Chapter 6. Development of a Numerical Model for Simulating
Abnormally Discharged Batteries
6.1 Overview
Safety is the priority in lithium-ion (Li-ion) battery applications. A large portion of
electrical and thermal hazards caused by Li-ion batteries are associated with short circuits.
During short circuits, Li-ion batteries discharge the stored energy at extremely high rates,
which could cause heat surge in batteries and even lead to thermal runaway. In this Chapter,
both external and internal short circuit tests are conducted on Li-ion batteries and battery
packs of different capacities. The results indicate that external short circuits are dangerous
for smaller size batteries due to their higher internal resistance, and this type of short can
be well managed by assembling fuses. In internal short circuit tests, higher chance of failure
is found on larger capacity batteries. A modified electrochemical-thermal model is
proposed, which incorporates an additional heat source at the nail location and proves to
be successful in depicting temperature changes of non-thermal runaway batteries and
estimating the occurrence and the approximate start time of thermal runaway of unsafe
batteries.
6.2 Experimental Setup
The LiCoO2 batteries used in experiments are listed in Table 6.1. Among them,
batteries No. 3 and 4 have the same capacity but are different in electrode thicknesses and
maximum discharge C-rates. All the batteries are new without additional safety designs to
prevent short circuits. They are preconditioned under a constant current of 0.1 C between
3.0 V and 4.2 V for 5 cycles while finishing at a charged state prior to tests.
External short circuit tests are performed by clamping positive and negative tabs with
a 20 mΩ wire, while internal short circuit tests (or nail penetration tests) are implemented
with the use of stainless steel nails with a diameter of 2.5 mm. In external short tests, two
thermocouples are utilized to measure temperature changes: one is attached at the center
of the battery and the other one sticks on the corner (5 mm from the edge). During nail

81
tests, one more thermocouple is attached to the nail (5 mm from the battery surface), and
the thermocouple located at the battery center is 5 mm apart from the nail site. Besides
temperatures, the voltages of batteries and battery packs are also recorded in all tests.
Table 6.1. Specifications of batteries used in short circuit tests.
Battery type No. 1 2 3 4
Thickness [mm]
Width [mm]
Length [mm]
Initial voltage [V]
Nominal capacity [mAh]
Maximum discharge rate [C]
3.8
30
52
4.19
650
5
4.5
28
82
4.19
1200
25
8.2
45
133
4.19
5000
25
8.5
45
133
4.19
5000
65
6.3 Model Description
An electrochemical-thermal coupling model is modified and employed in this study
[144]. In the coupling model, the heat generated from the electrochemical part is applied
to the transient thermal part as a portion of the battery heat source, while the temperature
obtained by the transient thermal model is, in turn, input to the electrochemical model. The
schematic illustration for the pseudo-2D electrochemical model of a Li-ion cell is given in
Fig. 6.1b. The electrode region consists of a mixture of active insertion material particles,
electrolyte, binder, and conductive filler, while the separator consists of polymer and
electrolyte. LixCoO2 and LiyC6 are used as the positive and negative active materials in this
study, respectively. LiPF6 salt in a non-aqueous liquid mixture of 1:2 v/v ethylene and
dimethyl carbonate is employed as the binary electrolyte, which permeates in both the
separator and the electrodes. Since the total number of current collectors in the battery is
half of the number of electrodes and separators, and electrochemical reactions take place
on both sides of a current collector, the thicknesses of the current collectors of the cell used
in the thermal analysis are half that of the actual current collectors.
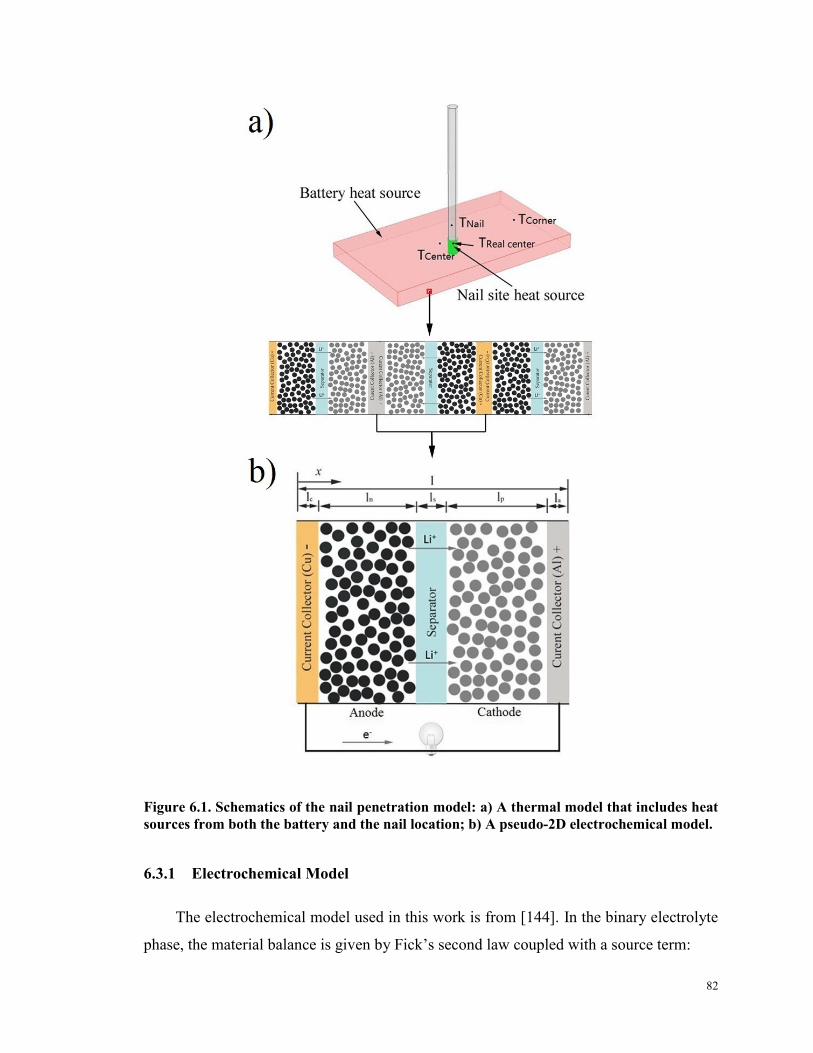
82
Figure 6.1. Schematics of the nail penetration model: a) A thermal model that includes heat
sources from both the battery and the nail location; b) A pseudo-2D electrochemical model.
6.3.1 Electrochemical Model
The electrochemical model used in this work is from [144]. In the binary electrolyte
phase, the material balance is given by Fick’s second law coupled with a source term:

83
𝜀𝑒𝜕𝑐𝑒𝜕𝑡
=𝜕
𝜕𝑥(𝐷
𝜕𝑐𝑒𝜕𝑥) +
(1 − 𝑡+0)
𝐹𝑗𝐿𝑖 (6.1)
Since no mass flux of lithium ions exists at the boundary of the electrode/current
collector, the boundary condition for these sites yields:
−𝐷
𝜕𝑐𝑒𝜕𝑥
|𝑥=0 = −𝐷𝜕𝑐𝑒𝜕𝑥
|𝑥=ln+ls+lp = 0 (6.2)
At the interfaces between anode and separator, as well as separator and cathode, the
concentration of the electrolyte is continuous, that is:
𝑐𝑒|𝑥=ln− = 𝑐𝑒|𝑥=ln+ (6.3)
𝑐𝑒|𝑥=(ln+ls)− = 𝑐𝑒|𝑥=(ln+ls)+ (6.4)
The charge balance in the electrolyte phase based on Ohm’s law is given by:
−(𝑘eff
𝜕Ф𝑒
𝜕𝑥) +
2𝑅𝑇(1 − 𝑡+0)
𝐹(𝑘eff
𝜕(𝑙𝑛 𝑐𝑒)
𝜕𝑥) = ie (6.5)
where the effective ionic conductivity keff, calculated by 𝑘eff = 𝑘𝜀𝑒1.5, is the Bruggeman
correction for the tortuosity effect. The value of 𝑘 is given by [144]:
𝑘 = 15.8𝑐𝑒 exp(−13472𝑐𝑒1.4) (6.6)
A zero gradient boundary condition restricts the solution of (6.5) at the two
electrode/current collector interfaces:
𝑘eff
𝜕Ф𝑒
𝜕𝑥|𝑥=0 = 𝑘eff
𝜕Ф𝑒
𝜕𝑥|𝑥=𝑙𝑛+𝑙𝑠+𝑙𝑝 = 0 (6.7)
In the solid phase of electrodes, the material and charge balances are given by:
𝜕𝑐𝑠𝜕𝑡
=𝐷𝑠𝑟2
𝜕
𝜕𝑟(𝑟2
𝜕𝑐𝑠𝜕𝑟) (6.8)
and
−𝜎eff
𝜕Ф𝑠
𝜕𝑥= is (6.9)
where the effective conductivity is determined by 𝜎eff = 𝜀𝑠𝜎, where s refers to the positive
84
and negative electrodes. The boundary conditions for the solid electrode particle are:
𝜕𝑐𝑠𝜕𝑟
|𝑟=0 = 0 (6.10)
−𝐷𝑠
𝜕𝑐𝑠𝜕𝑟
|𝑟=𝑅𝑠 =𝑗𝐿𝑖
𝑎𝑠𝐹 (6.11)
where as denotes the solid electrode surface area per unit volume, which is calculated by:
𝑎𝑠 = (
3
𝑅𝑠) (1 − 𝜀𝑒 − 𝜀𝑝 − 𝜀𝑓) (6.12)
At the interface of current collector/electrode, the charge flux is the same as the
current density applied on the electrode:
−𝜎eff,n
𝜕Ф𝑠,𝑛
𝜕𝑥|𝑥=0 = 𝜎eff,p
𝜕Ф𝑠,𝑝
𝜕𝑥|𝑥=ln+ls+lp =
𝐼𝑎𝑝𝑝
𝐴 (6.13)
While for the interfaces between the separator and electrodes, no charge flux exists:
𝜎eff,n
𝜕Ф𝑠,𝑛
𝜕𝑥|𝑥=ln = 𝜎
eff,p𝜕Ф𝑠,𝑝
𝜕𝑥|𝑥=ln+ls = 0 (6.14)
The reaction current density jLi in the above equations is determined by the Bulter-
Volmer equation:
𝑗𝐿𝑖 = 𝑎𝑠𝑖0 [𝑒𝑥𝑝 (
0.5𝐹
𝑅𝑇𝜂) − 𝑒𝑥𝑝 (−
0.5𝐹
𝑅𝑇𝜂)] (6.15)
The over-potential of the intercalation reaction, 𝜂, is defined as:
𝜂 = Ф𝑠 −Ф𝑒 − 𝑈 (6.16)
where U is the open circuit potential, which is given below for anode and cathode,
respectively:
Uref,− = 8.0023 + 5.0647x − 12.578x0.5 − 8.6322 × 10⁻⁴x−1
+ 2.1765 × 10−5x1.5 − 0.4602exp [15(0.06 − x)]− 0.5536exp [(−2.4326(x − 0.92))]
(6.17)
Uref,+ = 85.681y6 − 357.7y5 + 613.89y4 − 555.65y3 + 281.06y2
− 76.648y − 0.30987 exp(5.657y115) + 13.1983 (6.18)

85
The positive electrode reference potential given above is for batteries 1 and 2, while for
batteries 3 and 4, the cathode reference potential is adopted from Ref. [145]. All the
parameters used in the electrochemical model are given in Table 6.2. An Arrhenius
equation defines the temperature dependence of the properties, including exchange current
density, solid and electrolyte phase diffusion coefficients, and electrolyte phase
conductivity. A general form can be expressed as:
𝛹 = 𝛹refexp [
𝐸act𝛹
𝑅(1
𝑇ref−1
𝑇)] (6.19)
where 𝛹ref is a general property value at a reference temperature of 25oC. The property
values at other temperatures are controlled by the activation energy 𝐸act𝛹 , which have values
of 3 × 10⁴, 4 × 10³, 2 × 10⁴, 1 × 10⁴, 2 × 10⁴ J mol-1 for the exchange current density,
negative solid phase diffusion coefficient, positive solid phase diffusion coefficient,
electrolyte phase diffusion coefficient, and electrolyte phase conductivity, respectively.
Table 6.2. Electrochemical and thermal parameters of the batteries used in the simulation.
Parameter Cu foil Negative electrode Separator Positive electrode Al foil
lbattery 1 (μm)
lbattery 2 (μm)
lbattery 3 (μm)
lbattery 4 (μm)
Rs (μm)
Ds (m2 s-1)
εe
εs
cs,max (mol m-3)
cs,0battery 1, 2 (mol m-3)
cs,0battery 3, 4 (mol m-3)
ce (mol m-3)
𝜎 (S cm-1)
𝑡+0
k (W m-1 K-1)
ρ (kg m-3)
Cp (J kg-1 K-1)
15
14
12
10
-
-
-
-
-
-
-
-
-
-
398
8930
385
71
50
38
27
1
3.9×10⁻¹⁴
0.332
0.58
31858
22300
25486
2000
1
0.363
5
2500
700
18
18
18
18
-
-
0.5
-
-
-
-
2000
-
0.363
0.334
1009
1978
49
40
27
20
1
1×10-13
0.3
0.6
49943
15982
20976
2000
0.06
0.363
5
1500
700
17
16
16
14
-
-
-
-
-
-
-
-
-
-
238
2702
903

86
6.3.2 Thermal Model
The thermal model is governed by the energy conservation equation given in Chapter
2. In the equation, the density and specific heat capacity of Li-ion battery cell are calculated
by averaging the values of each component inside the cell on a volume basis, while the
thermal conductivity in series and parallel directions are calculated differently through
equations (6.20) and (6.21), respectively. The parameters used in the coupling model are
listed in Table 6.2.
k𝑠 =
∑ 𝑙𝑖𝑖
∑𝑙𝑖k𝑖𝑖
(6.20)
k𝑝 =∑
𝑙𝑖𝑙k𝑖
𝑖 (6.21)
The first term on the right-hand side of the energy conservation equation (2.1)
describes the heat dissipation, which consists of two main sources in this study: convective
heat and radiative heat, which can be expressed as follows in the x-direction:
−k
𝜕𝑇
𝜕𝑥= ℎ(𝑇 − 𝑇𝑎𝑚𝑏) + εσ(𝑇
4 − 𝑇𝑎𝑚𝑏4) (6.22)
The values of the convective coefficient ℎ, surface emissivity ε, and ambient temperature
𝑇𝑎𝑚𝑏 are set at 7.9 W m-2 K-1, 0.9, and 298.15 K, respectively. Similar equations can also
be built in the y and z directions.
Compared to an external short circuit model and a conventional discharge model, the
nail penetration model has one more source of heat generation contributing to the term “𝑞”:
the heat generated from the nail region due to localized resistance. Fig. 6.1a illustrates the
nail penetration of a 0.65 Ah battery. Four probes represented as black dots in the figure
are used to record temperature variations during simulation. Two origins of heat sources
are indicated: battery heat source (red part) due to high rate discharge and nail location heat
source (green part) due to joule heating, as detailed below:
1) Battery heat source:
87
𝑞𝑟𝑙 = ∫ 𝑗𝐿𝑖(Ф𝑠 −Ф𝑒 − 𝑈)𝑑𝑥
𝑙𝑛+𝑙𝑠+𝑙𝑝
0
(6.23)
𝑞𝑗𝑙 = ∫ [𝜎eff (
𝜕Ф𝑠
𝜕𝑥)2
+ 𝑘eff (𝜕Ф𝑒
𝜕𝑥)2𝑙𝑛+𝑙𝑠+𝑙𝑝
0
+2𝑘eff𝑅𝑇
𝐹(1 − 𝑡+
0)𝜕(ln 𝑐𝑒)
𝜕𝑥
𝜕Ф𝑒
𝜕𝑥]𝑑𝑥
(6.24)
The battery heat sources are obtained from the electrochemical model, and they consist
of two parts: reaction heat (𝑞𝑟, (6.23)) due to reaction overpotential and ohmic heat (𝑞𝑗,
(6.24)) produced by charge transport in electrodes and electrolyte. Another part, reversible
heat (or entropy heat), is ignored in simulations because it was proved to be negligible at
high rate discharges in our previous work [51]. The term 𝑙 in the equations indicates the
overall thickness of a single electrochemical cell using half thickness current collectors.
2) Nail region heat source:
𝑞𝑛 =
𝐼𝑑𝑖𝑠2 𝑅𝑛𝑉
(6.25)
In the equation, 𝐼𝑑𝑖𝑠 is the current during the nail penetration process, which is
automatically updated in the coupling model when the nail site resistance, 𝑅𝑛, is input as
the initial condition. The denominator 𝑉 is the volume of the penetrated nail and can be
calculated with πD2t/4, where D is the diameter of the nail, and t is the thickness of nailed
battery. To obtain the resistance at the nail site, batteries were first discharged to “dead”
using an external circuit and then penetrated. Batteries’ resistances were measured by an
analyzer after penetration, which are taken as nail location resistances and utilized in the
model. A summary of the resistance information of different batteries is given in Table 6.3,
and a photograph of the “dead” batteries with nails is presented in Fig. 6.2.
To select a suitable time step for the simulations, time steps of 10 s, 1 s, and 0.1 s were
first used to compare their effect on a 0.65 Ah battery nail penetration process. From the
tests, it was found that a 10 s time step is not adequate to capture the quick temperature
variations of the battery and lead to discrepancy from the other two time steps, while the
0.1 s time step is more computationally expensive (a solving time of 24420 s) than the 1 s
time step (a solving time of 4966 s), identical temperature curves were obtained.

88
Consequently, a 1 s time step is selected in this work. For each time step, both the
electrochemical and thermal model will re-evaluate their relevant parameters, e.g., current
density, temperature, heat source, etc., prior to computation.
Table 6.3. Battery parameters used in the nail penetration model.
Battery No. 1 2 3 4
Layers of the electrochemical cells 23 40 72 102
1 C current density (A m-2) 18.8 13.3 11.6 8.2
Internal resistance (mΩ) ~ 102 ~ 54 ~ 10 ~ 6
Nail site resistance (mΩ) ~ 100 ~ 50 ~ 10 ~ 10
Figure 6.2. Photograph of nailed batteries used for determining nail site resistances.
This study places a special emphasis on predicting the occurrence of thermal runaway
through examining temperature changes prior to thermal runaway. The chemical reactions
and corresponding heat generations after thermal runaway taking place will not be
calculated. As stated in Refs. [113, 133], the transition temperature or onset temperature
for self-heating of the LiCoO2 battery is at about 200oC to 210oC. In this study, if the
maximum temperature (Treal center in Fig. 6.1a) exceeds 210oC during simulation, the battery
is considered at a great risk of thermal runaway. The method developed in this work can

89
also be applied to other types of batteries by changing the transition temperature according
to the battery chemistry.
6.4 Results and Discussion
6.4.1 External Short Circuit
External short circuit tests were carried out on all batteries. The temperature and
voltage curves of batteries No. 1 and 2 are plotted in Fig. 6.3. As can be seen, the
connection of electrode tabs induces a dramatic drop in battery voltage. Meanwhile, the
temperatures of the batteries increase significantly with maximum values of 115oC and
103oC observed at about 70 s at the centers of batteries No. 1 and 2, respectively. The inset
shows that the temperature at the corner increases faster than the center temperature at the
initial stage due to the earlier acquisition of current on the electrode tabs. Afterwards,
because of the better heat dissipation environment at the battery corner, the temperature at
the battery corner becomes relatively lower than the center temperature. Overall, the
temperatures at different locations of the externally shorted batteries increase at a similar
rate because of the evenly distributed heat generation in the battery.
The external short circuit simulation is then performed by setting the obtained voltage
data as the cathode boundary condition in the coupling model. Only the heat generated
from the battery itself, including ohmic heat and reaction heat, is considered in the thermal
model. The simulation results of battery No. 1 and No. 2 are shown in Fig. 6.4a and b,
respectively. As can be seen, the simulated temperatures are well consistent with the
experimental results for the 0.65 Ah battery. For the 1.2 Ah battery, the simulated
temperature is relatively lower than the experiment. This is because as the battery capacity
increases and internal resistance decreases, the short circuit current becomes higher and
more heat is generated on the external circuit, especially on the battery tabs after clamping
the wire. During tests, it was found that the contact region between the clamps and 1.2 Ah
battery tabs became red and hot for several seconds after the short. In simulation, the heat
transferred from external heat sources was not considered, which can slightly increase the
battery temperature.

90
Figure 6.3. Temperature and voltage curves of a) 0.65 Ah and b) 1.2 Ah batteries externally
shorted in ambient conditions.
During the external short circuit tests, a portion of heat is generated on the 20 mΩ
connecting wire. As the battery capacity increases, the internal resistance of batteries No.
3 and 4 drop to 10 mΩ and 6 mΩ, respectively, causing a more considerable heat production
on the external wire. As a result, the contact regions between the clamps and positive tabs
(aluminum) of batteries No. 3 and 4 were broken during the tests. Thus, it can be concluded
that the external short circuit has a greater impact on low capacity batteries due to their
high internal resistance, and in real life applications, the external short circuit can be
hindered with the use of fuses, which can automatically cut off the discharge process when
the current exceeds a pre-set limit.

91
Figure 6.4. Simulated temperature curves of the externally shorted a) 0.65 Ah battery and b)
1.2 Ah battery.
6.4.2 Nail Penetration
Nail tests and simulations were first conducted on 0.65 Ah batteries. The
experimentally obtained temperature and voltage curves are compared with simulation
results in Fig. 6.5, and the electrode current density during the simulation is plotted in Fig.
6.6. It is seen that the simulation results agree well with the experimental data, and both
have a maximum temperature of 118oC. The peak temperature of the nail is higher than
that of the other recorded locations on the battery because the high thermal conductivity of
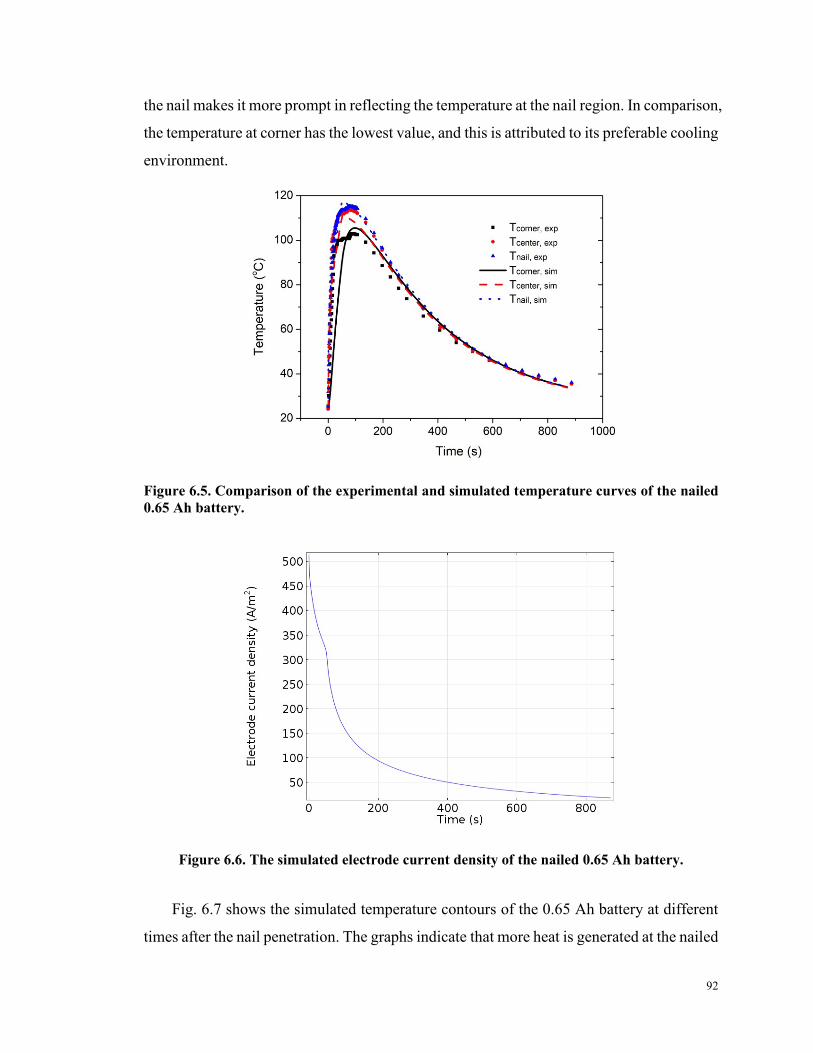
92
the nail makes it more prompt in reflecting the temperature at the nail region. In comparison,
the temperature at corner has the lowest value, and this is attributed to its preferable cooling
environment.
Figure 6.5. Comparison of the experimental and simulated temperature curves of the nailed
0.65 Ah battery.
Figure 6.6. The simulated electrode current density of the nailed 0.65 Ah battery.
Fig. 6.7 shows the simulated temperature contours of the 0.65 Ah battery at different
times after the nail penetration. The graphs indicate that more heat is generated at the nailed

93
region and the heat produced in that region quickly distributes to the whole cell. The
maximum temperature, 405.23 K (132.08oC), is reached at 50 s at the center of the nailed
battery.
Figure 6.7. The temperature contours of the nailed 0.65 Ah battery at different times after
penetration.
Three 1.2 Ah batteries were then penetrated and one of them experienced thermal
runaway. Fig. 6.8a & b show the temperature and voltage curves of non-thermal runaway
and thermal runaway batteries, respectively.
Similar to the case of the 0.65 Ah battery, the highest temperature of the non-thermal
runaway battery is found at the nail, as shown in Fig. 6.8a, with a value of 183oC, and the
lowest temperature is observed at the corner. Compared to the 0.65 Ah battery, a bigger
temperature difference between the battery center and corner is found on the 1.2 Ah battery.
This is due to the fact that the increase of battery capacity leads to a smaller internal

94
resistance and a larger battery size, which means more heat is generated at the nail location
and a longer time is required to transfer the heat to the battery edges.
Figure 6.8. Experimentally recorded temperature and voltage curves of the 1.2 Ah batteries
that a) did not experience and b) experienced thermal runaway during nail tests.
The 1.2 Ah battery shown in Fig. 6.8b experiences thermal runaway at 100 s. The heat
accumulated at the nail location increases the internal temperature and triggers chemical
reactions in the LiCoO2 battery. To explain why the 1.2 Ah batteries have different
temperature responses after being penetrated, a penetration simulation is performed and
the results are plotted in Fig. 6.9. Besides the temperatures at the three sampling points, the
temperature at the real center of the nail location is also presented, which has the highest
value but is unable to be recorded during experiments. As can be seen, the temperatures at
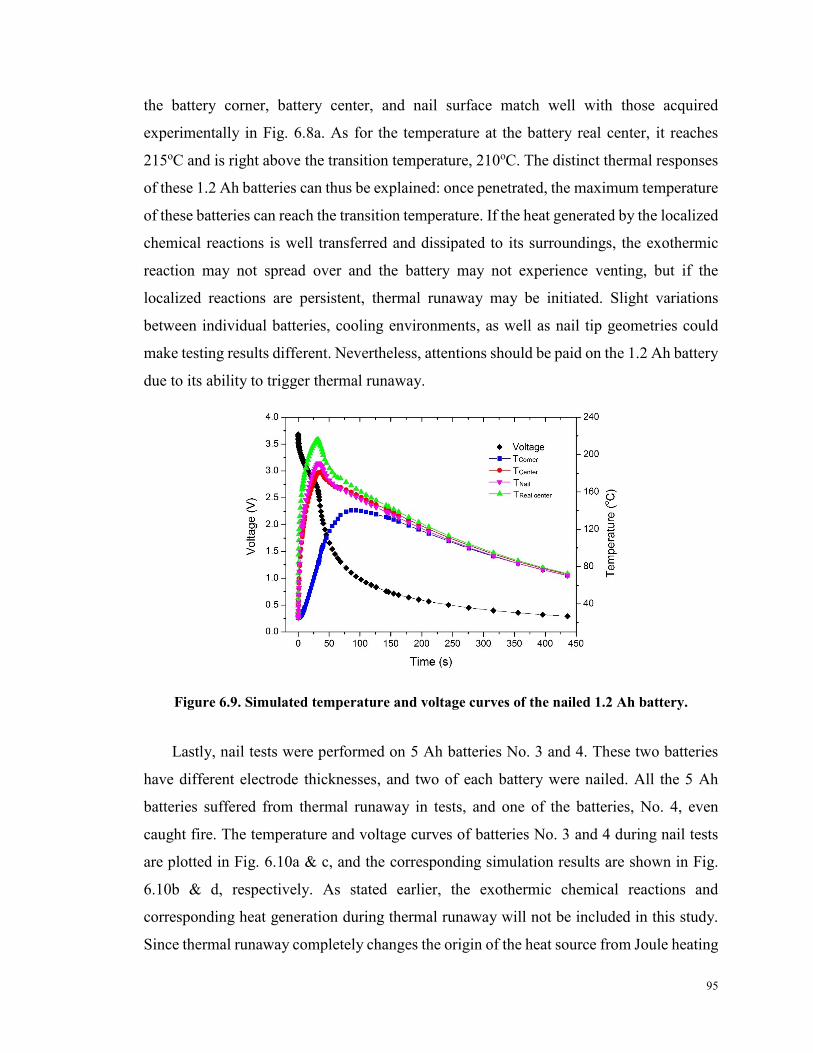
95
the battery corner, battery center, and nail surface match well with those acquired
experimentally in Fig. 6.8a. As for the temperature at the battery real center, it reaches
215oC and is right above the transition temperature, 210oC. The distinct thermal responses
of these 1.2 Ah batteries can thus be explained: once penetrated, the maximum temperature
of these batteries can reach the transition temperature. If the heat generated by the localized
chemical reactions is well transferred and dissipated to its surroundings, the exothermic
reaction may not spread over and the battery may not experience venting, but if the
localized reactions are persistent, thermal runaway may be initiated. Slight variations
between individual batteries, cooling environments, as well as nail tip geometries could
make testing results different. Nevertheless, attentions should be paid on the 1.2 Ah battery
due to its ability to trigger thermal runaway.
Figure 6.9. Simulated temperature and voltage curves of the nailed 1.2 Ah battery.
Lastly, nail tests were performed on 5 Ah batteries No. 3 and 4. These two batteries
have different electrode thicknesses, and two of each battery were nailed. All the 5 Ah
batteries suffered from thermal runaway in tests, and one of the batteries, No. 4, even
caught fire. The temperature and voltage curves of batteries No. 3 and 4 during nail tests
are plotted in Fig. 6.10a & c, and the corresponding simulation results are shown in Fig.
6.10b & d, respectively. As stated earlier, the exothermic chemical reactions and
corresponding heat generation during thermal runaway will not be included in this study.
Since thermal runaway completely changes the origin of the heat source from Joule heating

96
to chemical reaction heating and from the nail region to the entire battery, the temperature
profiles obtained experimentally and numerically are different.
Nevertheless, the model accurately predicts the occurrences of thermal runaway and
their approximate start times. During experiments, battery No. 3 and 4 went into thermal
runaway at 3 s and 2 s, respectively. To clearly compare the simulation and experimental
data, horizontal lines of T = 215oC are plotted in Fig. 6.10b and d to indicate the transition
temperature, which is modified on the basis of the earlier nail tests on the 1.2 Ah batteries.
In Fig. 6.10b and d, batteries No. 3 and 4 reach the transition temperature at 2.5 s and 0.6
s, respectively, which are close to the occurrence times of the thermal runaways in the nail
experiments. The time of thermal runaway in experiments is a bit longer than the
simulations, which is probably because it would take some time to trigger the thermal
runaway after the batteries reach the onset temperature.
Figure 6.10. Temperature and voltage curves of the 5 Ah batteries during nail penetration
tests: thick electrode battery (battery No. 3) in a) experiment and b) simulation, and thin
electrode battery (battery No. 4) in c) experiment and d) simulation.
97
The impact of electrode thickness on the performance of nailed batteries can be
determined by comparing Fig. 6.10b and d. When having the same capacity, the thin
electrode battery has a lower internal resistance and a larger short circuit current than the
thick electrode battery. Therefore, the thin electrode battery releases all the energy quicker
and reaches a higher temperature during nail tests. As shown in Fig. 6.10b and d, battery
No. 4 reaches its peak temperature of 328.2oC in only 18 s, while it takes 27 s for battery
No. 3 to reach its peak temperature of 277.6oC. The low internal resistance is an advantage
of the thin electrode battery during normal charges and discharges, but special attention
should be paid to safety issues of the battery.
During the design process of Li-ion batteries, technicians and engineers can implement
the coupling model developed in this work to evaluate the safety performance of the
batteries. Through understanding the electrode chemistry of batteries, measuring their
internal parameters, and testing the resistance at the nail location, the safety and the thermal
responses of the batteries during internal short circuits can be determined with the model.
One should also consider the effects of states of charge and cooling environments while
performing the evaluation.
6.5 Summary
In this Chapter, external short circuit tests and nail penetration tests were performed
on batteries of different capacities. In external short tests, 0.65 Ah and 1.2 Ah batteries
experienced a dramatic temperature rise and voltage drop, which is attributed to their high
internal resistance. As for larger capacity batteries that have lower internal resistances,
more heat was concentrated at the contact region between the clamp and battery tabs,
resulting in the automatic shutdown of the external short processes. In contrast, during the
nail penetration tests, as the battery capacity increases, a higher current flow was generated
at the nailed region and triggered the accumulated heat generation, which finally led to the
occurrence of thermal runaway.
A modified electrochemical-thermal coupling model was also developed to simulate
the short circuits. Simulated temperature curves of the externally shorted battery are in
good consistence with the experiment when the battery voltage is set as the cathode

98
boundary condition. In simulating the nail penetrations, a Joule heat source from the nail
region is added to the model. The model has been proved reliable in predicting the
temperature changes of non-thermal runaway batteries and estimating the occurrence and
approximate start time of thermal runaway of unsafe batteries.
99
Chapter 7. A Comprehensive Study on Li-ion Battery Nail Penetrations
and the Possible Solutions
7.1 Overview
Li-ion batteries are the state-of-the-art power sources for portable electronics, electric
vehicles, and aerospace applications. Safety issues regarding Li-ion batteries have aroused
particular attention lately after several accidents reported in recent years. As can be
revealed from Chapter 6, external short circuits can be managed with the use of fuses, while
the internal short circuits cannot be blocked due to the short circuit loop is inside the battery.
Nail penetration test is typically taken to simulate the internal short circuits of Li-ion
batteries, and it is one of the most dangerous abuse conditions for Li-ion batteries due to
the accumulated heat generation, which could give rise to thermal runaway and could
damage the entire energy storage system. This type of abuse condition can be correlated to
the damaged Li-ion batteries equipped on EVs during crashes. In this Chapter, the
electrochemical-thermal coupling model developed in Chapter 6 is implemented to study
the nail penetration process of Li-ion batteries. A comprehensive parametric study is
carried out to investigate the effects of battery capacity, internal resistance, and nail
diameter on the electrochemical and thermal behaviors of Li-ion batteries during the
penetration process. Three possible solutions including decreasing the state of charge,
improving the heat dissipation, and increasing the contact resistance, are numerically
studied in preventing thermal runaway. In addition, the effectiveness of a hydrogel-based
BTM system in suppressing thermal runaway and preventing thermal runaway propagation
is experimentally verified on Li-ion batteries and battery packs.
7.2 Experiments
The experiments consist of two parts: contact resistance tests, and nail tests. In the
contact resistance tests, a total of 40 batteries were used, which include twenty 0.65 Ah
batteries, ten 3 Ah batteries, and ten 5 Ah batteries, and their specifications are summarized
in Table 7.1. During the tests, the batteries were discharged to “dead” using an external

100
circuit and penetrated by polished steel nails with different diameters. A multimeter (HP
4263B LCR Meter) was then used to measure the resistance between two electrode tabs,
which is taken as the contact resistance at the short circuit region. After the tests, the
recorded contact resistances were plotted vs. the contact area between nail and battery (πDt,
where D is the nail diameter, and t is the battery thickness) in Fig. 7.1. The expression, 16.3
mΩ/A, given in Ref. [43], is found to have derivations from the obtained data, which is
because the specific contact resistance of 16.3 mΩ cm2 is from estimations. In real
conditions, some factors could affect the results, for example, the penetration of the nail
will push a part of the battery pouch in and might alter the contact between the nail and
electrochemical cells. A logistic fit on OriginPro was used to express the experimental data
as follows:
𝑅𝑛 = 6.75 +
546
1 + (𝐴8.77)
2.69 (7.1)
where Rn is the contact resistance, in mΩ, and A is the contact area between the nail and
battery, in mm2. The R-squared value of this logistic fit is 0.906, which is closest fit that
can be obtained from the given options in the OriginPro, such as linear fit and polynomial
fit.
The systematic uncertainty during the resistance measurement is mainly due to the
accuracy of the multimeter, while the random uncertainties consists of the contact
resistance between the terminals of the multimeter and the batteries, as well as the
difference between the geometry of the nail tips and the surface roughness of the nails. The
multimeter was operated strictly according to the manual, and the multimeter has an
accuracy of ± (0.85 +12
𝑅𝑛+
𝑅𝑛
2.8×10⁸)%. To minimize the contact resistance, bolts were used
to fasten the battery tabs and the multimeter terminals. To reduce the differences between
nails, smooth finishing nails with the same tip geometry were used in the tests. Meanwhile,
the nails were cleaned with ethanol and dried with fibre cloth prior to use.

101
Table 7.1. Specifications of LiCoO2 batteries used in short circuit simulations or tests*.
Battery No. 1 2 3 4 5
Thickness [mm]
Width [mm]
Length [mm]
Initial voltage [V]
Nominal capacity [Ah]
3.8
30
52
4.19
0.65
4.5
28
82
4.19
1.2
5 (20)
45
133
4.19 (16.78)
3
8.5
45
133
4.19
5
41
45
175
16.78
8
Internal resistance at 25oC [mΩ]
Layers of electrochemical cells
100
23
54
40
14
44
6
102
-
-
* Battery 1, 3, and 4 are numerically studied; All batteries undergo nail tests.
Figure 7.1. A plot of contact resistance Rn vs. contact area between nail and battery.
To validate one of the solutions, improve heat dissipation, in preventing thermal
runaway and its propagation in battery pack, nail tests were carried out on the batteries and
battery packs with and without a hydrogel BTM system. Hydrogel is made of more than
99 wt. % of water and high-molecular weight polymers that can retain the water in solid
state. The hydrogel BTM system has been studied by Zhang et al. [13] in managing the
heat of Li-ion batteries during normal high-rate discharges. Since water can absorb a

102
significant amount of heat during evaporation, the hydrogel-based BTM system was
considered to manage the heat generated by batteries during battery nail penetrations.
The nail implemented during the tests is stainless-steel nails with a diameter of 2.5
mm. For tests on battery packs, only the top battery in the battery pack was penetrated to
investigate the thermal runaway propagation phenomena. In the tests, two thermocouples
were utilized to measure the battery temperature: one was attached at the center of the
battery and the other thermocouple was located at the battery corner, and one more
thermocouple was used to measure of nail temperature. During nail tests on battery packs,
thermocouples were placed at the center of each battery. Besides temperatures, the voltages
of batteries and battery packs were also recorded in all tests.
The hydrogel thermal management system used in this study was obtained by directly
injecting deionized water into containers where batteries were placed in the center and
sodium polyacrylate (PAAS) particles were evenly spread. The containers have similar
lengths and widths as the batteries but are twice as thick. The mass fraction of PAAS in the
hydrogel was 1%.
7.3 Results and Discussion
7.3.1 Simulations on Batteries of Difference Capacities
With the validated model, the thermal responses of Battery 1, 3 and 4 listed in Table
7.1 are simulated and compared in the nail penetration tests using 1.8 mm nails. The 1.8
mm nails were used in the simulations because they could cause the most severe
temperature increase, as explained in Section 7.3.2. Fig. 7.2a-c show the temperature,
battery heat source, and boundary (nail region) heat source curves of the three batteries as
a function of time.
In Fig. 7.2a, the hollow symbols represent the maximum temperatures inside the
batteries, and the solid symbols indicate the temperatures at the battery surface center. It is
seen that among the three batteries, the 0.65 Ah battery has the lowest temperatures in both
locations. The explanations are given from both the battery level and the electrochemical

103
cell level. From the battery level, the 0.65 Ah battery has the highest internal resistance
and contact resistance of 100 mΩ and 52 mΩ, respectively. Since a battery penetration can
be treated as a high-rate discharge process, and the discharge current is dependent on the
sum of the battery and contact resistances. Thus, with the same initial electric potential of
4.2 V, the 0.65 Ah battery will generate the lowest short-circuit current. Meanwhile, a
relatively low capacity is also helpful in reducing the total heat generation. On the
electrochemical cell level, the 0.65 Ah battery has the thickest electrodes among the three
batteries, as given in Table 6.2. The thick electrodes could lead to severe diffusion
limitation, concentration overpotential, and finally restrain the nail penetration process [53].
In comparison, both the 3 Ah and 5 Ah batteries experience dramatic temperature rises
after penetrations, with the maximum temperature soaring up to 439oC and 492oC,
respectively, which have already exceeded the transition temperature, 215oC, and which
give rise to thermal runaway. With using thinner electrodes, both the 3 Ah and 5 Ah
batteries have significantly lower internal resistance as compared to the 0.65 Ah battery.
Furthermore, both of the batteries are thicker than the 0.65 Ah battery, thus leading to low
contact resistances of 29.18 mΩ and 12.3 mΩ for the 3 Ah and 5 Ah batteries, respectively.
As a result, high short-circuit currents are produced during penetrations and give rise to the
rapid temperature rise.
Besides the maximum temperatures, the temperature distributions on the three
batteries are very different. As shown in Fig. 7.2a, the difference between the maximum
and surface temperatures becomes bigger as the battery capacity increases. For the 0.65 Ah
battery, the battery resistance is higher than the contact resistance, which will generate
more heat on the battery instead of at the nail location. Consequently, a more uniform
temperature distribution will be achieved. In contrast, the internal resistances of the 3 Ah
and 5 Ah batteries are 14 mΩ and 6 mΩ, respectively. These values are much smaller than
the contact resistances, which will engender concentrated heat generation at the nail
location instead of an even battery heat generation. Fig. 7.2b and c compare the heat
generation rates of the battery level and at the contact region. It can be seen that the 0.65
Ah battery generates more heat at the battery level due to its thicker electrodes and higher
internal resistance, while the 3 Ah and 5 Ah batteries have much higher localized heat
generation due to the higher short-circuit currents.

104
Figure 7.2. Comparison of the a) temperature, b) battery heat source, and c) boundary heat
source curves of the three batteries during the 1.8 mm-nail penetration simulations.

105
It is thus concluded that in battery penetrations, thick electrodes will be helpful in
hindering thermal runaway, and a battery level heat generation is preferable than localized
heat generation in improving battery safety.
7.3.2 Effects of Battery Resistance and Nail Diameter
After comparing the simulation results of the three batteries, it is seen that both the 3
Ah and 5 Ah batteries experience strong thermal responses due to the accumulated heat
generation at the nail region, which is found to be closely related to their internal resistance
and the contact resistance (a function of nail diameter).
In order to investigate the effects of the internal resistance and nail diameter on the
thermal behaviors of Li-ion batteries during nail penetrations, the internal resistances of
the 3 Ah and 5 Ah batteries, as well as the nail diameter are adjusted in appropriate ranges
in simulations, 5-60 mΩ for the 3 Ah battery, 2.5-40 mΩ for the 5 Ah battery, and 0.5-3.6
mm for the nail diameter. One can also regard the change of battery resistance as the
battery’s aging effect. With the change in battery resistance, (6.23) and (6.24) will be
unable to accurately simulate the battery heat source. As a result, a battery heat source from
Ref. [13, 50] is used, which takes into account the effect of battery resistance, and can give
more reasonable solutions.
𝑄 = 𝐼(𝑈 − 𝑉) − 𝐼 (𝑇
𝑑𝑈
𝑑𝑇) ≈ 𝐼Rb
2 (7.2)
where Q is the total heat generation. The first term on the right-hand side of Q includes the
ohmic loss inside battery, charge transfer overpotential at the interface, and the mass
transfer limitations, where U and V are the open circuit potential and battery operating
potential, respectively. The second term is the reversible heat and is neglected due to the
high discharge current. Because the overpotential, diffusion limitation, and the ohmic loss
can be reflected in the battery internal resistance, the rightmost term is capable of giving
an accurate battery heat source.
Fig. 7.3a and b show the maximum temperature contours of the 3 Ah and 5 Ah
batteries, respectively. 72 simulations were carried out for each battery using different
battery resistance and nail diameter combinations, and the maximum temperature from

106
each simulation was taken and used to generate the contour. It is seen that for battery
penetrations with a specific nail diameter, the decrease of battery internal resistance yields
higher maximum temperatures. This is because as the battery resistance becomes lower a
higher short circuit current will be produced to generate more heat in the nail region.
Afterward, the effect of nail size on the simulation results is studied. From the projection
diagram of the 3 Ah battery, it is seen that the peaks of parabolas are shifting from 1.75
mm to 1 mm nail as the battery resistance increases from 5 mΩ to 55 mΩ, which indicates
that a low internal resistance battery is more dangerous with thicker nails. A similar trend
is also observed with the 5 Ah battery.
Figure 7.3. The maximum temperature contours of the a) 3 Ah and b) 5 Ah batteries in
penetration simulations using different nail diameters and battery internal resistance.
107
In both contours, the lowest temperature regions are located at the bottom left,
penetrations of high internal resistance batteries using thick nails. In this region, due to the
low contact resistance and high battery resistance, most of the heat will be generated on
the battery, which eliminates the concentrated heat and favors heat dissipation. However,
in real cases, the combination of high battery resistance and thick nails cannot totally
guarantee batteries are free of thermal runaway. Because the nail penetration is a process
where the contact area changes from small to large, i.e., contact resistance varies from high
to low, which is not considered in the simulations, different results may be obtained as the
penetration speed changes.
7.3.3 Comparison of Strategies to Prevent Thermal Runaway
Although current Li-ion batteries have been assembled with advanced separators that
can automatically close the porous membrane at high temperatures to prevent the ion
transfer and thus to shut down the electrochemical reactions [146], the temperature inside
the nailed battery will soar up and exceed the transition temperature of thermal runaway
before the closure of all separators. As a result, a series of exothermic chemical reactions
will take place in the region close to the nail and propagate to the entire battery.
Three possible solutions: decreasing state of charge (SOC), improving heat
dissipation, and increasing contact resistance, are investigated on the 3 Ah and 5 Ah
batteries during the 1.8 mm-nail penetration simulations, and the feasibility of each strategy
is discussed in detail.
7.3.3.1 Decrease State of Charge
The state of charge is an indication of the available capacity stored in a Li-ion battery
as a percentage of the rated capacity. For both batteries, the SOC is 100% at 4.2 V, and 0%
at 3 V. Table 7.2 lists the anode and cathode stoichiometry of the 3 Ah and 5 Ah batteries
at the assigned SOCs used in simulations. In Fig. 7.4a, the maximum temperatures of both
nailed batteries at different SOCs are plotted. As can be seen, the maximum temperature
drops as the SOC decreases. However, at the selected SOCs, only the fully discharged

108
batteries, SOC = 0%, have a maximum temperature below the thermal runaway transition
temperature. Fig. 7.4b and c compare the boundary heat sources of the 3 Ah and 5 Ah
batteries at different SOCs, respectively. With a higher SOC, more energy is produced at
the nail region, as represented by the area below the heat generation rate curve. It is also
seen that the initial heat generation rates are similar at different SOCs, which is due to the
high voltage of the Li-ion batteries. As a result, the available energy in the battery is rapidly
converted to heat at the nail region before the heat is efficiently dissipated through
convection and radiation. Therefore, decreasing the SOC is not a feasible approach to
prevent Li-ion batteries from thermal runaway in nail penetrations.
Table 7.2. The stoichiometry of 3 Ah and 5 Ah batteries at the assigned SOCs.
SOC 100% 80% 60% 40% 20% 0%
3 Ah
battery
Anode stoichiometry 0.8 0.678 0.556 0.434 0.312 0.19
Cathode stoichiometry 0.42 0.526 0.632 0.738 0.844 0.95
5 Ah
battery
Anode stoichiometry 0.8 0.674 0.548 0.422 0.296 0.17
Cathode stoichiometry 0.42 0.523 0.627 0.730 0.834 0.937

109
Figure 7.4. a) The maximum temperatures of the 3 Ah and 5 Ah batteries with different SOCs
during the 1.8 mm-nail penetration simulations; The boundary heat sources of the b) 3 Ah,
and c) 5 Ah batteries at different SOCs.

110
7.3.3.2 Improve Heat Dissipation
According to the energy conservation equation, the heat dissipation term can affect
the temperature change of the Li-ion batteries. In this section, the convective heat transfer
coefficient is adjusted in a range from 1 to 200 W m-2 K-1 to study the thermal responses
of the Li-ion batteries under different cooling conditions. A cooling environment with a
convective heat transfer coefficient of 1 W m-2 K-1 is similar to the condition where a
battery is enveloped by insulating materials, and the heat transfer with a coefficient of 200
W m-2 K-1 can represent an effective liquid cooling condition.
Fig. 7.5 plots the maximum and surface temperatures of the 3 Ah and 5 Ah batteries
under different cooling conditions. For the 3 Ah battery, the maximum temperature
experiences a 32.3oC drop from 438.5oC to 406.2oC as the h value increases from 1 to 200
W m-2 K-1, which is about half the value of the surface temperature changes, from 284.8oC
to 208.7oC. In comparison, the change of the maximum temperature of the 5 Ah battery is
much smaller than the surface temperature drop, with values of 2.7oC vs. 56.9oC,
respectively. Having a larger thickness, 8.5 mm vs. 5 mm, the reduction in the maximum
temperature of the 5 Ah battery is much smaller than that of the 3 Ah battery. Because Li-
ion batteries have a very low thermal conductivity in the thickness direction, as calculated
from (6.20), the thicker the battery is, the longer time it will spend transferring the
concentrated heat from the battery center to the surface for dissipation. Overall, it can be
seen that the increase of heat dissipation at the battery surface has an insignificant effect
on decreasing the maximum temperature, especially for thicker batteries. Nevertheless,
effective cooling can lower the battery surface temperature, thus can hinder the propagation
of thermal runaway in Li-ion battery packs. The relevant experimental results are given
below.

111
Figure 7.5. Plots of the maximum and surface temperatures of the 3 Ah and 5 Ah batteries
under different cooling conditions during 1.8-mm nail penetration simulations.
Nail tests were first conducted on single batteries surrounded with hydrogel. The
temperature and voltage data of Battery No. 1, 2, and 4 during tests are shown in Fig. 7.6
a, b and c, respectively. During the tests, thermal runaway did not occur on the 0.65 Ah
(Battery 1) and 1.2 Ah (Battery 2) batteries, whereas the 5A (Battery 4) battery vented after
penetration. Owing to the excellent ability of hydrogel in absorbing heat during evaporation,
the maximum surface temperature of the batteries were maintained below 100oC. The
battery safety is significantly improved when compared to the vented 1.2 Ah battery and
afire 5 Ah battery tested in Chapter 6.

112
Figure 7.6. Temperature and voltage curves of the a) 0.65 Ah, b) 1.2 Ah, and c) 5 Ah batteries
during nail penetration tests in a hydrogel-based BTM system.
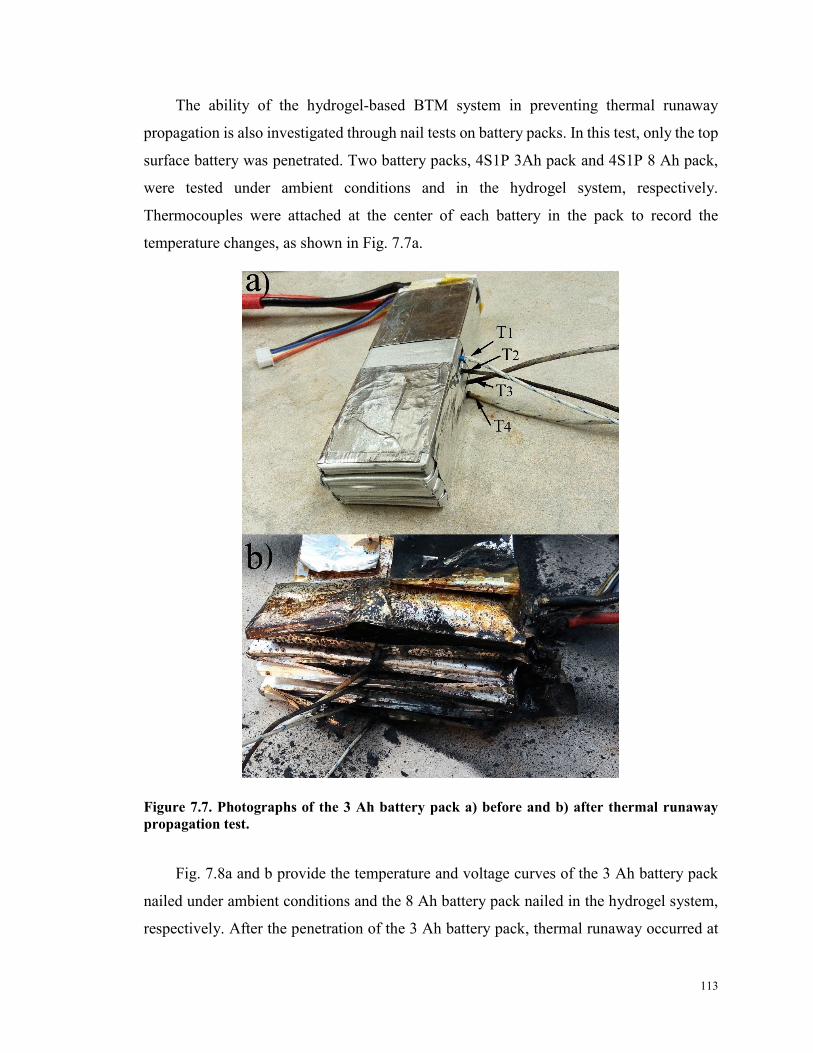
113
The ability of the hydrogel-based BTM system in preventing thermal runaway
propagation is also investigated through nail tests on battery packs. In this test, only the top
surface battery was penetrated. Two battery packs, 4S1P 3Ah pack and 4S1P 8 Ah pack,
were tested under ambient conditions and in the hydrogel system, respectively.
Thermocouples were attached at the center of each battery in the pack to record the
temperature changes, as shown in Fig. 7.7a.
Figure 7.7. Photographs of the 3 Ah battery pack a) before and b) after thermal runaway
propagation test.
Fig. 7.8a and b provide the temperature and voltage curves of the 3 Ah battery pack
nailed under ambient conditions and the 8 Ah battery pack nailed in the hydrogel system,
respectively. After the penetration of the 3 Ah battery pack, thermal runaway occurred at

114
the surface battery, and its temperature dramatically increased to as high as 344oC. Due to
the close contact between the batteries, the heat generated from the first battery was
effectively transferred to the second battery and gave rise to its thermal runaway, and the
temperature of the second battery soared to 627oC. One after another, all the batteries in
the 3 Ah pack went into thermal runaway. A photograph of the 3 Ah battery pack after the
thermal runaway propagation is shown in Fig. 7.7b.
Figure 7.8. Temperature and voltage curves of a) the 3 Ah battery pack nailed in ambient
and b) the 8 Ah battery pack nailed in a hydrogel-based BTM system.
115
The hydrogel-based BTM system effectively prevented the nailed 8 Ah battery pack
from thermal runaway propagation. During the test, only the surface battery underwent
thermal runaway, and the maximum surface temperature was maintained below 100oC, as
shown in Fig. 7.8b. Not only are the safety concerns addressed by the proposed BTM
system, the reliability of the entire battery system is improved. The battery pack nailed in
the hydrogel retained a higher voltage of 12.58 V after penetration compared to a voltage
of 0 V in the 3 Ah battery pack.
In real life applications, retaining moisture in the hydrogel is probably the most critical
prerequisite for the BTM system to function properly. To address the evaporation issue, an
open structure or a closed structure can be employed. The open structure is designed with
a refilling inlet and a venting outlet in the hydrogel system. The inlet enables the hydrogel
system to be periodically refilled with water while the outlet allows vapor to vent directly
outside, thereby reducing humidity around battery tabs and alleviating relevant safety
concerns. In practice, the use of the open structure calls for several important
considerations such as hydrogel amount monitoring, determination of refilling frequency,
and optimization of size and shape of the inlet and outlet. The complexity involved in
implementing such a structure makes it more suitable for large and stationary battery
systems, wherein fully automated online supervision systems can be built. As for small-
scale and/or mobile applications, a closed structure rather than an open one is more
preferred. As the name implies, in a closed structure, the batteries packed with hydrogel
cooling systems are completely sealed, excluding the battery tabs left outside.
7.3.3.3 Increase Contact Resistance
In previous simulations, the most abusive conditions were studied, in which polished
steel nails were used to induce the internal short circuit. Consequently, high short-circuit
currents were produced to generate the concentrated heat at the nail region and finally lead
to thermal runaway. In order to prevent thermal runaway, some safety measures could be
implemented to create imperfection or bad contact between the nail and electrochemical
cells, and thus hindering the current flow. The feasible ways to partially insulate the
electrical contact between the nail and electrochemical cells include using flexible

116
separators or high viscosity protection films. In this section, by proportionally increasing
the contact resistance in the penetration model, the feasibility of this method is studied.
Fig. 7.9a shows the maximum temperatures of the 3 Ah and 5 Ah batteries in
penetrations using different contact resistances. Rn is the original contact resistance, 29.18
mΩ for 3 Ah battery and 12.3 mΩ for 5 Ah battery, and Rn’ represents the modified contact
resistance. In the simulations, the value of Rn’/ Rn was adjusted from 1 to 200. As can be
seen, for both batteries, the increase of the contact resistance can effectively reduce the
maximum temperature, for example, a temperature drop from 492oC to 147oC is observed
in the 5 Ah battery as the contact resistance increases to 1.459 Ω (50 times the original
contact resistance).
Fig. 7.9b-d compares the temperature, voltage, and C-rate curves of the 3 Ah battery
in simulations using different contact resistances. As shown in Fig. 7.9c, the voltage has a
dramatic drop in the original penetration scenario due to the low contact resistance.
Consequently, a high short-circuit current is produced, as can be seen from the black curve
in Fig. 7.9d. As a result, all of the battery energy is quickly released, which gives rise to
the significant temperature elevation in a very short time. With the increase of the nail
contact resistance, the penetration process behaves more like a normal discharge, and the
energy stored in the battery can be gradually released at the nail location. For instance,
when Rn’/ Rn increases to 50, the short-circuit current stays at around 1 C, as shown in Fig.
7.9d. Consequently, the 3 Ah battery can be prevented from thermal runaway, with the
maximum temperature kept below 100oC.

117
Figure 7.9. a) The maximum temperatures of the 3 Ah and 5 Ah batteries in penetrations
using different contact resistances; The b) temperature, c) voltage, and d) C-rate curves of
the 3 Ah battery during penetrations using different contact resistances.
7.4 Summary
In this Chapter, the thermal responses of Li-ion batteries in different nail penetration
scenarios are studied. An electrochemical-thermal coupling model that incorporates the
localized boundary joule heat is employed for simulations.
By adjusting the parameters in the coupling model, simulations are carried out on
three commercial Li-ion batteries with capacities of 0.65 Ah, 3 Ah, and 5 Ah. It is found
that thermal runaway is prone to occur on high capacity batteries due to the accumulated
heat generation at nail locations. It is also observed that the battery internal resistance and
the nail diameter have significant influences on the thermal behaviors of Li-ion batteries
during nail penetrations. In penetrations with a specific nail size, a lower battery resistance
will cause a more severe thermal response. In comparison, penetration of high resistance

118
batteries with thick nails can shift the accumulated boundary heat generation to a uniform
battery heat generation, which is beneficial to battery safety.
Three possible solutions in preventing thermal runaway are also investigated.
Although decreasing SOC can reduce the energy stored in the battery, it is unable to
eliminate thermal runway due to the rapid heat generation induced by high voltage. An
effective heat dissipation is helpful in cooling the battery surfaces, but it is insufficient to
prevent thermal runaway. Nevertheless, an efficient heat transfer can inhibit thermal
runaway propagation, as verified experimentally in a hydrogel-based BTM system. Among
the solutions, increasing contact resistance is the most effective way in preventing thermal
runaway. A high contact resistance can ensure the battery energy slowly releases at the nail
region.

119
Chapter 8. Conclusions and Future Work
8.1 Conclusions
Lithium-ion (Li-ion) batteries have emerged as an important power source for portable
devices and electric vehicles due to their excellence over other energy storage technologies.
Due to the temperature sensitivity of Li-ion batteries, a uniform temperature distribution
and an appropriate operating temperature range are essential for Li-ion batteries to operate
properly. Otherwise, the batteries may experience faster capacity fading and even safety
issues.
The overheating issues exist in Li-ion batteries during both normal and abnormal
discharges. During normal discharges, the battery temperature can be generally maintained
within the safe operating temperature range when charge and discharge properly. However,
higher operating temperatures within the safe range could shorten the lifespan of Li-ion
batteries. For abnormal discharges, the overheating issues are more severe, and the battery
temperature can far exceed the safe range, which could give rise to several safety concerns,
such as thermal runaway and fire.
The theme of this thesis is to develop robust battery thermal management (BTM)
systems to maintain the temperature of both prismatic and cylindrical Li-ion batteries at
low levels, as well as to provide techniques to improve the Li-ion battery safety under
abnormal operating conditions.
Cylindrical Li-ion batteries are commonly used in pure electric vehicles due to their
high energy density, and they tend to operate at low rates. To manage the heat of cylindrical
Li-ion batteries, a passive phase change material (PCM)-based internal BTM system is
developed. The proposed BTM system embeds a PCM filled core inside the battery to
achieve the cooling effect. It is simple in design, and pure PCMs can be directly used in
the core, which increases the latent heat of the system and reduces the relevant cost of
preparing thermally conductive matrices, which are generally used in PCM-based external
BTM systems. Results based on simulation results on 4-layer battery packs showed that
the PCM-based internal BTM system consumes less PCM (36.7 % less) and achieves a
120
lower temperature rise (2.57oC lower) and temperature difference (2.26oC lower) than an
external PCM/EG-based BTM system.
The PCM-based internal BTM system can be further improved for better cooling
effects. It is found that lower temperature differences can be obtained in battery packs when
embedding relatively thicker PCM cores in the interior batteries. Furthermore, the PCM-
embedded cylindrical Li-ion batteries have the same external geometry as the original
batteries. They can be further integrated with active BTM systems and are ready for
operation under some extreme conditions. Simulation results showed that the cooling
performance of the hybrid cooling design is significantly improved when compared to an
air cooling design, having an 8oC lower peak temperature and 6.1oC lower temperature
difference.
Comparatively, prismatic Li-ion batteries are commonly used in hybrid electric
vehicles and racing electric vehicles due to their high power density, and they tend to
operate at higher rates. In this regard, an active heat pipe-wet cooling combined BTM
system is developed for prismatic Li-ion batteries. By attaching ultrathin heat pipes
between batteries, the heat generated from the batteries can be efficiently transferred to the
condenser side, where water evaporation can quickly dissipate the heat. The proposed BTM
system has dramatically improved cooling ability compared to other BTM systems tested.
For example, during 3 C rate discharges on a 3 Ah battery pack, the heat pipe-wet cooling
combined BTM system achieved 10.3oC and 1.0oC lower peak temperature and
temperature difference, respectively, than the heat pipe BTM system cooled by fan only.
Lastly, the overheating issues of abnormally discharged batteries are studied. An
electrochemical-thermal coupling model that incorporates localized Joule heating is
developed to simulate the thermal responses of Li-ion batteries during short circuits. A
contact resistance-contact area plot was obtained experimentally, which can facilitate the
process of calculating an accurate localized Joule heat when the battery thickness and nail
size is known. The model is proved reliable in predicting the temperature changes of non-
thermal runaway batteries and estimating the occurrence and approximate start time of
thermal runaway of unsafe batteries.
121
Among various short circuits, nail penetration is extremely dangerous for Li-ion
batteries due to the accumulated heat generation at the nailed region. It is found that thermal
runaway is prone to occur on large capacity batteries during nail tests. Besides, the internal
resistances of batteries and nail sizes can affect the thermal behaviors of Li-ion batteries
during nail penetrations. To suppress thermal runaway and its propagation in battery packs,
a hydrogel-based cooling system can be equipped, and the increase of the battery-nail
contact resistance is also found to be a feasible approach.
8.2 Future Work
Future work should be conducted on the following subjects:
1) The PCM-based internal BTM system should be manufactured inside authentic Li-
ion batteries to test their cooling effectiveness.
2) The cooling performance of the PCM-based internal BTM system should be tested
during abnormal discharge scenarios.
3) The core size distribution of the PCM-based internal BTM system should be further
optimized through multi-valued decision diagrams.
4) The wet cooling process of the heat pipe-based BTM system can be achieved by
using automatically controlled water pipes for convenience.
5) The effects of relative humidity on the cooling performance of the heat pipe-wet
cooling combined BTM system should be studied.
6) A numerical model should be developed to simulate the heat pipe-based BTM
system, and it should be used to find optimized battery and heat pipe size combinations.
7) The developed coupling model should be further modified to simulate more short
circuit scenarios, such as pinch tests and crash tests.
8) Flexible separators and battery protection films that can form insulation layers
between the battery and nail during nail penetrations should be researched.

122
Bibliography
[1] Etcheri V, Marom R, Elazari R, Salitra G, Aurbach D. Challenges in the
development of advanced Li-ion batteries: a review. Energy Environ Sci 2011; 4:
3243-3262.
[2] Pesaran A, Keyser M, Kim GH, Santhanagopalan S, Smith K. Tools for designing
thermal management of batteries in electric drive vehicles. In Proceedings of
Advanced Automotive Battery Conference. 2013. Pasadena, CA.
[3] Samadani E, Mastali M, Farhad S, Fraser RA, Fowler M. Li-ion battery
performance and degradation in electric vehicles under different usage scenarios.
Int J Energy Res 2016; 40: 379-392.
[4] Leng F, Tan CM, Pecht M. Effect of temperature on the aging rate of Li-ion battery
operating above room temperature. Sci Rep 2015; 5: 12967.
[5] Zhao R, Zhang S, Liu J, Gu J. A review of thermal performance improving methods
of lithium ion battery: Electrode modification and thermal management system. J
Power Sources 2015; 299: 557-577.
[6] Park H. A design of air flow configuration for cooling lithium ion battery in hybrid
electric vehicles. J Power Sources 2013; 239: 30-36
[7] Shah K, Drake SJ, Wetz DA, Ostanek JK, Miller SP, Heinzel JM, Jain A. Modeling
of steady-state convective cooling of cylindrical Li-ion cells. J Power Sources 2014;
258: 374-381.
[8] Yang N, Zhang X, Li G, Hua D. Assessment of the forced air-cooling performance
for cylindrical lithium-ion battery packs: A comparative analysis between aligned
and staggered cell arrangements. Appl Therm Eng 2015; 80: 55-65.
[9] Wang T, Tseng KJ, Zhao J, Wei Z. Thermal investigation of lithium-ion battery
module with different cell arrangement structures and forced air-cooling strategies.
Appl Energy 2014; 134: 229-238.
[10] Li X, He F, Ma L. Thermal management of cylindrical batteries investigated using

123
wind tunnel testing and computational fluid dynamics simulation. J Power Sources
2013; 238: 395-402.
[11] Huo Y, Rao Z, Liu X, Zhao J. Investigation of power battery thermal management
by using mini-channel cold plate. Energ Convers Manage 2015; 89: 387-395.
[12] Wang C, Zhang G, Meng L, Li X, Situ W, Lv Y, Rao M. Liquid cooling based on
thermal silica plate for battery thermal management system. Int J Energy Res. 2017;
41: 2468-2479.
[13] Zhang S, Zhao R, Liu J, Gu J. Investigation on a hydrogel based passive thermal
management system for lithium ion batteries. Energy 2014: 68: 854-861.
[14] Chen K, Li X. Accurate determination of battery discharge characteristics – A
comparison between two battery temperature control methods. J Power Sources
2014; 247: 961-966.
[15] Zhao R, Zhang S, Gu J, Liu J, Carkner S, Lanoue E. An experimental study of
lithium ion battery thermal management using flexible hydrogel films. J Power
Sources 2014; 255: 29-36.
[16] Al-Hallaj S, Selman JR. A novel thermal management system for electric vehicle
batteries using phase-change material. J Electrochem Soc 2000; 147: 3231-3236.
[17] Zhang X, Kong X, Li G, Li J. Thermodynamic assessment of active cooling/heating
methods for lithium-ion batteries of electric vehicles in extreme conditions. Energy
2014; 64: 1092-1101.
[18] Mills A, Farid M, Selman JR, Al-Hallaj S. Thermal conductivity enhancement of
phase change materials using a graphite matrix. Appl Therm Eng 2006; 26: 1652-
1661.
[19] Wang Z, Zhang Z, Li J, Yang L. Paraffin and paraffin/aluminum foam composite
phase change material heat storage experimental study based on thermal
management of Li-ion battery. Appl Therm Eng 2015; 78: 428-436.
[20] Samimi F, Babapoor A, Azizi M, Karimi G. Thermal management analysis of a Li-
124
ion battery cell using phase change material loaded with carbon fibers. Energy 2016;
96: 355-371.
[21] Wu MS, Liu KH, Wang YY, Wan CC. Heat dissipation design for lithium-ion
batteries. J Power Sources 2002; 109: 160-166.
[22] Tran TH, Harmand S, Desmet B, Filangi S. Experimental investigation on the
feasibility of heat pipe cooling for HEV/EV lithium-ion battery. Appl Therm Eng
2014; 63: 551-558.
[23] Rao Z, Wang S, Wu M, Lin Z, Li F. Experimental investigation on thermal
management of electric vehicle battery with heat pipe. Energy Convers Manage
2013; 65: 92-97.
[24] Malik M, Dincer I, Rosen M, Fowler M. Experimental investigation of a new
passive thermal management system for a Li-ion battery pack using phase change
composite material. Electrochim. Acta 2017; 257: 345-355.
[25] Xie Y, Tang J, Shi S, Xing Y, Wu H, Hu Z, Wen D. Experimental and numerical
investigation on integrated thermal management for lithium-ion battery pack with
composite phase change materials. Energy Convers Manag 2017; 154: 562-575.
[26] Kim D, Jung J, Kim Y, Lee M, Seo J, Khan SB. Structure and thermal properties
of octadecane/expanded graphite composites as shape-stabilized phase change
materials. Int J Heat Mass Transfer 2016; 96: 735-741.
[27] Jiang G, Huang J, Fu Y, Cao M, Liu M. Thermal optimization of composite phase
change material/expanded graphite for Li-ion battery thermal management. Appl
Therm Eng 2016; 108: 1119-1125.
[28] Wu MS, Chiang PCJ, Lin JC, Jan YS. Correlation between electrochemical
characteristics and thermal stability of advanced lithium-ion batteries in abuse tests-
short-circuit tests. Electrochim Acta 2004; 49: 1803-12.
[29] Lamb J, Orendorff CJ. Evaluation of mechanical abuse techniques in lithium ion
batteries. J Power Sources 2014; 247: 189-96.

125
[30] Lamb J, Orendorff CJ, Steele LAM, Spangler SW. Failure propagation in multi-cell
lithium ion batteries. J Power Sources 2015; 283: 517-23.
[31] Feng X, He X, Ouyang M, Lu L, Wu P, Kulp C, Prasser S. Thermal runaway
propagation model for designing a safer battery pack with 25 Ah LiNixCoyMnzO2
large format lithium ion battery. Appl Energy 2015; 154: 74-91.
[32] Feng X, Lu L, Ouyang M, Li J, He X. A 3D thermal runaway propagation model
for a large format lithium ion battery module. Energy 2016; 115: 194-208.
[33] Liu YH, Okano M, Mukai T, Inoue K, Yanagida M, Sakai T. Improvement of
thermal stability and safety of lithium ion battery using SiO anode material. J Power
Sources 2016; 304: 9-14.
[34] Matsumoto K, Inoue K, Utsugi K. A highly safe battery with non-flammable
triethyl-phosphate-based electrolyte. J Power Sources 2015; 273: 954-8.
[35] Hatchard TD, MacNeil DD, Basu A, Dahn JR. Thermal model of cylindrical and
prismatic lithium-ion cells. J Electrochem Soc 2001; 148: A755-61.
[36] Zhang C, Santhanagopalan S, Sprague MA, Pesaran AA. Coupled mechanical-
electrical-thermal modeling for short-circuit prediction in a lithium-ion cell under
mechanical abuse. J Power Sources 2015; 290: 102-13.
[37] Kim GH, Pesaran AA, Spotnitz RM. A three-dimensional thermal abuse model for
lithium-ion cells. J Power Sources 2007; 170: 476-89.
[38] Guo G, Long B, Cheng B, Zhou S, Xu P, Cao B. Three-dimensional thermal finite
element modeling of lithium-ion battery in thermal abuse application. J Power
Sources 2010; 195: 2393-8.
[39] Spotnitz RM, Weaver J, Yeduvaka G, Doughty DH, Roth EP. Simulation of abuse
tolerance of lithium-ion battery packs. J Power Sources 2007; 163: 1080-6.
[40] Zhao R, Liu J, Gu J. Simulation and experimental study on lithium ion battery short
circuit. Appl Energy 2016; 173: 29-39.
[41] Zavalis TG, Behm M, Lindbergh G. Investigation of short-circuit scenarios in a
126
lithium-ion battery cell. J Electrochem Soc 2012; 159: A848-59.
[42] Chiu KC, Lin CH, Yeh SF, Lin YH, Chen KC. An electrochemical modeling of
lithium-ion battery nail penetration. J Power Sources 2014; 251: 254-63.
[43] Zhao W, Luo G, Wang CY. Modeling nail penetration process in large-format Li-
ion cells. J Electrochem Soc 2015; 162: A207-17.
[44] Xu M, Zhang Z, Wang X, Jia L, Yang L. A pseudo three-dimensional
electrochemical-thermal model of a prismatic LiFePO4 battery during discharge
process. Energy 2015; 80: 303-317.
[45] Xu M, Zhang Z, Wang X, Jia L, Yang L. Two-dimensional electrochemical-thermal
coupled modeling of cylindrical LiFePO4 batteries. J Power Sources 2014; 256:
233-243.
[46] Inui Y, Kobayashi Y, Watanabe Y, Watase Y, Kitamura Y. Simulation of
temperature distribution in cylindrical and prismatic lithium ion secondary batteries.
Energy Convers Manage 2007; 48: 2103-2109.
[47] Hu H, Argyroropoulos SA. Mathematical modeling of solidification and melting: a
review. Model Simul Mater Eng 1996; 4: 371-396.
[48] Bandhauer TM, Garimella S, Fuller TF. A critical review of thermal issues in
lithium-ion batteries. J Electrochem Soc 2011; 158: R1-R25.
[49] Bernardi D, Pawlikowski E, Newman J. A general energy balance for battery
systems. J Electrochem Soc 1985; 132: 5-12.
[50] Gu WB, Wang CY, Thermal-electrochemical modeling of battery systems. J
Electrochem Soc 2000; 147: 2910-2922.
[51] Zhao R, Gu J, Liu J. An investigation on the significance of reversible heat to the
thermal behavior of lithium ion battery through simulations. J Power Sources 2014;
266: 422-432.
[52] Srinivasan V, Wang CY. Analysis of electrochemical and thermal behavior of Li-
ion cells. J Electrochem Soc 2003; 150: A98-A106.
127
[53] Zhao R, Liu J, Gu J. The effects of electrode thickness on the electrochemical and
thermal characteristics of lithium ion battery. Appl Energy 2015; 139: 220-229
[54] Vetter J, Novak P, Wagner MR, Veit C, Moller KC, Besenhard JO, Winter M,
Wohlfahrt-Mehrens M, Vogler C, Hammouche A. Ageing mechanisms in lithium-
ion batteries. J Power Sources 2005; 147: 269-281.
[55] Kim JH, Pieczonka NPW, Li Z, Wu Y, Harris S, Powell BR. Understanding the
capacity fading mechanism in LiNi0.5Mn1.5O4/graphite Li-ion batteries.
Electrochimica Acta 2013; 90: 556-562.
[56] Markovsky B, Rodkin A, Cohen YS, Palchik O, Levi E, Aurbach D, Kim HJ,
Schmidt M. The study of capacity fading processes of Li-ion batteries: major
factors that play a role. J Power Sources 2003; 119: 504-510.
[57] Goers D, Spahr ME, Leone A, Markle W, Novak P. The influence of the local
current density on the electrochemical exfoliation of graphite in lithium-ion battery
negative electrodes. Electrochimica Acta 2011; 56: 3799-3808.
[58] Liu P, Wang J, Hicks-Garner J, Sherman E, Soukiazian S, Verbrugge M, Tataria H,
Musser J, Finamore P. Ageing mechanisms of LiFePO4 batteries deduced by
electrochemical and structural analyses. J Electrochem Soc 2010; 157: A499- A507.
[59] Shim J, Kostecki R, Richardson T, Song X, Striebel KA. Electrochemical analysis
for cycle performance and capacity fading of a lithium-ion battery cycled at
elevated temperatures. J Power Sources 2002; 112: 222-230.
[60] Tan L, Zhang L, Sun Q, Shen M, Qu Q, Zheng H. Capacity loss induced by lithium
deposition at graphite anode for LiFePO4/graphite cell cycling at different
temperatures. Electrochimica Acta 2013; 111: 802-808.
[61] Ramadass P, Haran B, White RE, Popov BN. Mathematical modeling of the
capacity fade of Li-ion cells. J Power Sources 2003; 123: 230-240.
[62] Santhanagopalan S, Zhang Q, Kumaresan K, White RE. Parameter estimation and
life modeling of lithium-ion cells. J Electrochem Soc 2008; 155: A345-A353.
128
[63] Doi T, Inaba M, Tsuchiya H, Jeong SK, Iriyama Y, Abe T, Ogumi Z.
Electrochemical AFM study of LiMn2O4 thin film electrodes exposed to elevated
temperatures. J Power Sources 2008; 180: 539-545.
[64] Zhao J, Wang Y. Atomic layer deposition of epitaxial ZrO2 coating on LiMn2O4
nanoparticles for high-rate lithium ion batteries at elevated temperature. Nano
Energy 2013; 2: 882-889.
[65] Chang HH, Chang CC, Su CY, Wu HC, Yang MH, Wu NL. Effects of TiO2 coating
on high-temperature cycle performance of LiFePO4-based lithium-ion batteries. J
Power Sources 2008; 185: 466-472.
[66] Deng B, Nakamura H, Yoshio M. Capacity fading with oxygen loss for manganese
spinels upon cycling at elevated temperatures. J Power Sources 2008; 180: 864-868.
[67] Fan L, Khodadadi JM, Pesaran A. A parametric study on thermal management of
an air-cooled lithium-ion battery module for plug-in hybrid electric vehicles. J
Power Sources 2013; 238: 301-312.
[68] Xun J, Liu R, Jiao K. Numerical and analytical modeling of lithium ion battery
thermal behaviors with different cooling designs. J Power Sources 2013; 233: 47-
61.
[69] Mahamud R, Park C. Reciprocating air flow for Li-ion battery thermal management
to improve temperature uniformity. J Power Sources 2011; 196: 5685-5696.
[70] Yu K, Yang X, Cheng Y, Li C. Thermal analysis and two-dimensional air flow
thermal management for lithium-ion battery pack. J Power Sources 2014; 270: 193-
200.
[71] Sun H, Dixon R. Development of cooling strategy for an air-cooled lithium-ion
battery pack. J Power Sources 2014; 272: 404-414.
[72] Liu Z, Wang Y, Zhang J, Liu Z. Shortcut computation for the thermal management
of a large air-cooled battery pack. Appl Therm Eng 2014; 66: 445-452.
[73] Xu XM, He R. Research on the heat dissipation performance of battery pack based

129
on forced air cooling. J Power Sources 2013; 240: 33-41.
[74] Giuliano MR, Prasad AK, Advani SG. Experimental study of an air-cooled thermal
management system for high capacity lithium-titanate batteries. J Power Sources
2012; 2016: 345-352.
[75] Pesaran AA. Battery thermal management in EVs and HEVs: Issues and Solutions.
Advanced Automotive Battery Conference. 2001. Las Vegas, Nevada.
[76] Zhang T, Gao C, Gao Q, Wang G, Liu M, Guo Y, Xiao C, Yan YY. Status and
development of electric vehicle integrated thermal management from BTM to
HVAC. Appl Therm Eng 2015; 88: 398-409.
[77] Jin LW, Lee PS, Kong XX, Fan Y, Chou SK. Ultra-thin mini-channel LCP for EV
battery thermal management. Appl Energy 2014; 113: 1786-1794.
[78] Jarrett A, Kim IY. Influence of operating conditions on the optimum design of
electric vehicle battery cooling plates. J Power Sources 2014; 245: 644-655.
[79] Jarrett A, Kim IY. Design optimization of electric vehicle battery cooling plates for
thermal performance. J Power Sources 2011; 196: 10359-10368.
[80] Bandhauer TM, Garimella S. Passive, internal thermal management system for
batteries using microscale liquid-vapor phase change. Appl Therm Eng 2013; 61:
756-769.
[81] Tong W, Somasundaram K, Birgersson E, Mujumdar AS, Yap C. Numerical
investigation of water cooling for a lithium-ion bipolar battery pack. Int J Therm
Sci 2015; 94: 259-269.
[82] Nieto N, Diaz L, Gastelurrutia J, Blanco F, Ramos JC, Rivas A. Novel thermal
management system design methodology for power lithium-ion battery. J Power
Sources 2014; 272: 291-302.
[83] Hirano H, Tajima T, Hasegawa T, Hasegawa T, Sekiguchi T, Uchino M. Boiling
liquid battery cooling for electric vehicle. ITEC Asia-Pacific. 2014. Beijing.
[84] van Gils RW, Danilov D, Notten PHL, Speetjens MFM, Nijmeijer H. Battery

130
thermal management by boiling heat-transfer. Energ Convers Manage 2014; 79: 9-
17.
[85] Karimi G, Dehghan AR. Thermal management analysis of a lithium-ion battery
pack using flow network approach. Int J Mech Eng Mechatron 2012; 1: 88-94.
[86] Gaugler RS. Heat transfer device. 1944. US2350348A.
[87] Zhao R, Gu J, Liu J. An experimental study of heat pipe thermal management
system with wet cooling method for lithium ion batteries. J Power Sources 2015;
273: 1089-1097.
[88] Rao Z, Huo Y, Liu X. Experimental study of an OHP-cooled thermal management
system for electric vehicle power battery. Exp Therm Fluid Sci 2014; 57: 20-26.
[89] Tran TH, Harmand S, Sahut B. Experimental investigation on heat pipe for hybrid
electric vehicle and electric vehicle lithium-ion battery. J Power Sources 2014; 265:
262-272.
[90] Wang Q, Jiang B, Xue QF, Sun HL, Li B, Zou HM, Yan YY. Experimental
investigation on EV battery cooling and heating by heat pipes. Appl Therm Eng
2015; 88: 54-60.
[91] Burban G, Ayel V, Alexandre A, Lagonotte P, Bertin Y, Romestant C.
Experimental investigation of a pulsating heat pipe for hybrid vehicle applications.
Appl Therm Eng 2013; 50: 94-103.
[92] Greco A, Cao D, Jiang X, Yang H. A theoretical and computational study of
lithium-ion battery thermal management for electric vehicles using heat pipes. J
Power Sources 2014; 257: 344-355.
[93] Zalba B, Marin JM, Cabeza LF, Mehling H. Review on thermal energy storage with
phase change: materials, heat transfer analysis and applications. Appl Therm Eng
2003; 23: 251-283.
[94] Sharma A, Tyagi VV, Chen CR, Buddhi D. Review on thermal energy storage with
phase change materials and applications. Renew Sust Energ Rev 2009; 13: 318-345.
131
[95] Zhou D, Zhao CY, Tian Y. Review on thermal energy storage with phase change
materials (PCMs) in building applications. Appl Energy 2012; 92: 593-605.
[96] Waqas A, Din Zu. phase change material (PCM) storage for free cooling of
buildings-A review Renew Sust Energ Rev 2013; 18: 607-625.
[97] Khudhair AM, Farid MM. A review on energy conservation in building
applications with thermal storage by latent heat using phase change materials.
Energ Convers Manage 2004; 45: 263-275.
[98] Al-Hallaj S, Selman JR. Thermal modeling of secondary lithium batteries for
electric vehicle/hybrid electric vehicle applications. J Power Sources 2002; 110:
341-348.
[99] Ramandi MY, Dincer I, Naterer GF. Heat transfer and thermal management of
electric vehicle batteries with phase change materials. Heat Mass Transfer 2011; 47:
777-788.
[100] Khateeb SA, Amiruddin S, Farid MM, Selman JR, Al-Hallaj S. Thermal
management of Li-ion battery with phase change material for electric scooters:
experimental validation. J Power Sources 2005; 142: 345-353.
[101] Li WQ, Qu ZG, He YL, Tao YB. Experimental study of a passive thermal
management system for high-powered lithium ion batteries using porous metal
foam saturated with phase change materials. J Power Sources 2014; 255: 9-15.
[102] Khateeb SA, Farid MM, Selman JR, Al-Hallaj S. Design and simulation of a
lithium-ion battery with a phase change material thermal management system for
an electric scooter. J Power Sources 2004; 128: 292-307.
[103] Qu ZG, Li WQ, Tao WQ. Numerical model of the passive thermal management
system for high-power lithium ion battery by using porous metal foam saturated
with phase change material. Int J Hydrogen Energy 2014; 39: 3904-3913.
[104] Goli P, Legedza S, Dhar A, Salgado R, Renteria J, Balandin AA. Graphene-
enhanced hybrid phase change materials for thermal management of Li-ion
batteries. J Power Sources 2014; 248: 37-43.

132
[105] Babapoor A, Azizi M, Karimi G. Thermal management of a Li-ion battery using
carbon biber-PCM composites. Appl Therm Eng 2015; 82: 281-290.
[106] Jiang G, Huang J, Liu M, Cao M. Experiment and simulation of thermal
management for a tube-shell Li-ion battery pack with composite phase change
material. Appl Therm Eng 2017; 120: 1-9.
[107] Ling Z, Wang F, Fang X, Gao X, Zhang Z. A hybrid thermal management system
for lithium ion batteries combining phase change materials with forced-air cooling.
Appl Energy 2015; 148: 403-409.
[108] Hemery CV, Par F, Robin JF, Marty P. Experimental performances of a battery
thermal management system using a phase change material. J Power Sources 2014;
270: 349-358.
[109] Javani N, Dincer I, Naterer GF, Yilbas BS. Heat transfer and thermal management
with PCMs in a Li-ion battery cell for electric vehicles. Int J Heat Mass Transfer
2014; 72: 690-703.
[110] Mills A, Al-Hallaj S. Simulation of passive thermal management system for
lithium-ion battery packs. J Power Sources 2005; 141: 307-315.
[111] Kizilel R, Sabbah R, Selman JR, Al-Hallaj S. An alternative cooling system to
enhance the safety of Li-ion battery packs. J Power Sources 2009; 194: 1105-1112.
[112] Lin C, Xu S, Chang G, Liu J. Experiment and simulation of a LiFePO4 battery pack
with a passive thermal management system using composite phase change material
and graphite sheets. J Power Sources 2015; 275: 742-749.
[113] Doughty D, Roth EP. A general discussion of Li-ion battery safety. Electrochem
Soc Interface 2012; 21: 37-44.
[114] Kitoh K, Nemoto H. 100 Wh Large size Li-ion batteries and safety tests. J Power
Sources 1999; 81-82: 887-890.
[115] Zeng Y, Wu K, Wang D, Wang Z, Chen L. Overcharge investigation of lithium-ion
polymer batteries. J Power Sources 2006; 160: 1302-1307.

133
[116] Leising RA, Palazzo MJ, Takeuchi ES, Takeuchi KJ. A study of the overcharge
reaction of lithium-ion batteries. J Power Sources 2001; 97-98: 681-683.
[117] Maleki H, Howard JN. Internal short circuit in Li-ion cells. J Power Sources 2009;
191: 568-574.
[118] Cai W, Wang H, Maleki H, Howard JN, Lara-Curzio E. Experimental simulation
of internal short circuit in Li-ion and Li-ion-polymer cells. J Power Sources 2011;
196: 7779-7783.
[119] Matsumoto K, Martinez M, Gutel T, Mailley S, De vito E, Patoux S, Inoue K,
Utsugi K. Stability of trimethyl phosphate non-flammable based electrolyte on the
high voltage cathode (LiNi0.5Mn1.5O4). J Power Sources 2015; 273: 1084-1088.
[120] Lombardo L, Brutti S, Navarra MA, Panero S, Reale P. Mixtures of ionic liquid –
alkylcarbonates as electrolytes for safe lithium-ion batteries. J Power Sources 2013;
227: 8-14.
[121] Matsumoto K, Inoue K, Utsugi K. A highly safe battery with a non-flammable
triethyl-phosphate-based electrolyte. J Power Sources 2015; 273: 954-958.
[122] Benmayza A, Lu W, Ramani V, Prakash J. Electrochemical and Thermal Studies
of LiNi0.8Co0.15Al0.015O2 under Fluorinated Electrolytes. Electrochimica Acta 2014;
123: 7-13.
[123] Feng J, Lu L. A novel bifunctional additive for safer lithium ion batteries. J Power
Sources 2013; 243: 29-32.
[124] Belov DG, Shieh DT. A study of tetrabromobisphenol A (TBBA) as a flame
retardant additive for Li-ion battery electrolytes. J Power Sources 2014; 247: 865-
875.
[125] Wu B, Pei F, Wu Y, Mao R, Ai X, Yang H, Cao Y. An electrochemically
compatible and flame-retardant electrolyte additive for safe lithium ion batteries. J
Power Sources 2013; 227: 106-110.
[126] Zeng Z, Jiang X, Wu B, Xiao L, Ai X, Yang H, Cao Y. Bis(2,2,2-trifluoroethyl)
134
methylphosphonate: An Novel Flame-retardant Additive for Safe Lithium-ion
Battery. Elctrochimica Acta 2014; 129: 300-304.
[127] Feng J, Ma P, Yang H, Lu L. Understanding the interactions of phosphonate-based
flame-retarding additives with graphitic anode for lithium ion batteries.
Electrochimica Acta 2013; 114: 688-692.
[128] Chen YS, Hu CC, Li YY. The importance of heat evolution during the overcharge
process and the protection mechanism of electrolyte additives for prismatic lithium
ion batteries. J Power Sources 2008; 181: 69-73.
[129] Kim CS, Yoo JS, Jeong KM, Kim K, Yi CW. Investigation on internal short circuits
of lithium polymer batteries with a ceramic-coated separator during nail penetration.
J Power Sources 2015; 289: 41-49.
[130] Kim M, Park JH. Inorganic thin layer coated porous separator with high thermal
stability for safety reinforced Li-ion battery. J Power Sources 2012; 212: 22-27.
[131] Woo JJ, Nam SH, Seo SJ, Yun SH, Kim WB, Xu T, Moon SH. A flame retarding
separator with improved thermal stability for safe lithium-ion batteries.
Electrochem Commun 2013; 35: 68-71.
[132] Yeon D, Lee Y, Ryou MH, Lee YM. New flame-retardant composite separators
based on metal hydroxides for lithium-ion batteries. Electrochimica Acta 2015; 157:
282-289.
[133] Golubkov AW, Fuchs D, Wagner J, Wiltsche H, Stangl C, Fauler G, Voitic G,
Thaler A, Hacker V. Thermal-runaway experiments on consumer Li-ion batteries
with metal-oxide and olivin-type cathodes. RSC Advances 2014; 4: 3633-3642.
[134] Jhu CY, Wang YW, Wen CY, Shu CM. Thermal runaway potential of LiCoO2 and
Li(Ni1/3Co1/3Mn1/3)O2 batteries determined with adiabatic calorimetry
methodology. Appl Energy 2012; 100: 127-131.
[135] Gnanaraj JS, Zinigrad E, Asraf L, Gottlieb HE, Sprecher M, Schmidt M, Geissler
W, Aurbach D. A detailed investigation of the thermal reactions of LiPF6 solution
in organic carbonates using ARC and DSC. J Electrochem Soc 2003; 150: A1533-

135
A1537.
[136] Roth EP, Doughty DH. Thermal abuse performance of high-power 18650 Li-ion
cells. J Power Sources 2004; 128: 308-318.
[137] Roth EP. Abuse Response of 18650 Li-Ion Cells with Different Cathodes Using
EC:EMC/LiPF6 and EC:PC:DMC/LiPF6 Electrolytes. ECS Transactions 2008; 11:
19-41.
[138] Mendoza-Hernandez OS, Ishikawa H, Nishikawa Y, Maruyama Y, Umeda M.
Cathode material comparison of thermal runaway behavior of Li-ion cells at
different state of charges including over charge. J Power Sources 2015; 280: 499-
504.
[139] Vélez C, Khayet M, Ortiz de Zárate JM. Temperature-dependent thermal properties
of solid/liquid phase change even-numbered n-alkanes: n-Hexadecane, n-
octadecane and n-eicosane. Appl. Energy 2015; 143: 383-394.
[140] Shah K, Mckee C, Chalise D, Jain A. Experimental and numerical investigation of
core cooling of Li-ion cells using heat pipes. Energy 2016; 113: 852-860.
[141] He F, Ma L. Thermal management of batteries employing active temperature
control and reciprocating cooling flow. Int J Heat Mass Transfer 2015; 83: 164-172.
[142] Tang H, Tang Y, Wan Z, Li J, Yuan W, Lu L, Li Y, Tang K. Review of applications
and developments of ultra-thin micro heat pipes for electronic cooling. Appl Energy
2018; 223: 383-400.
[143] Hong JS, Maleki H, Al-Hallaj S, Redey L, Selman JR. Electrochemical‐
calorimetric studies of lithium‐ion cells. J Electrochem Soc 1998; 145: 1489-1501.
[144] Smith K, Wang CY. Power and thermal characterization of a lithium-ion battery
pack for hybrid-electric vehicles. J Power Sources 2006; 160: 662-673.
[145] Kumaresan K, Sikha G, White RE. Thermal model for a Li-ion cell. J Electrochem
Soc 2008; 155: A164-A171.
[146] Hennige V, Hying C, Hoerpel G. Lithium battery separator having a shutdown

136
function. 2002. US7691529B2.