Embed Size (px)
Citation preview

OVERCOMING THE CHALLENGES
OF BUILDING HERITAGE PROJECTS:
IMPROVEMENTS TO TIME, SCOPE
AND COST PERFORMANCE
Submitted in fulfilment of the requirements for the degree of
Doctor of Philosophy
Miljenka Perovic
Bachelor
Engineer in Architecture and Urbanism
School of Civil Engineering and Built Environment
Science and Engineering Faculty
Queensland University of Technology
2015


OVERCOMING THE CHALLENGES OF BUILDING HERITAGE PROJECTS: IMPROVEMENTS TO TIME, SCOPE AND COST PERFORMANCE i
Keywords
Heritage places, heritage retention, social value of the place, management of
design and scope definition, project performance, project delivery, project success,
overrun causes, over budget causes, challenges of the multiple stakeholder
involvement

OVERCOMING THE CHALLENGES OF BUILDING HERITAGE PROJECTS: IMPROVEMENTS TO TIME, SCOPE AND COST PERFORMANCE ii

OVERCOMING THE CHALLENGES OF BUILDING HERITAGE PROJECTS: IMPROVEMENTS TO TIME, SCOPE AND COST PERFORMANCE iii
Abstract
The movement to protect the heritage of national buildings has grown
enormously in many countries since the World Heritage Centre and the World
Heritage list within UNECSO were both established in 1972. Many heritage
organisations have since been founded with the aim to protect and manage cultural
heritage, and numerous studies have supported the importance of preserving and
protecting built heritage. Today, the idea of heritage building protection incorporates
the protection of many cultural attributes globally.
Managing heritage-listed building projects has been seen as a sensitive issue,
sometimes facing criticism due to such projects often running over time and, as a
result of such delays, over budget. Various research studies have been conducted to
identify solutions to improve the management of the restoration and refurbishment of
heritage projects. Despite the development of principles, policies and guidance, many
problems still exist that affect the management of heritage projects.
The aim of this research is to investigate the general and specific factors that
affect the project performance and delivery of heritage building projects. The
objective of the study is to determine and analyse the causes of project delays during
the planning/design and execution/construction phases, while also analysing the
management of multiple stakeholder relationships and the influence of technical
factors during the construction phases of heritage projects. Further, the study
investigates the current policies, procedures and practices and their constraints
impact the project performance and delivery.
This research project attempts to address the omissions of certain critical
elements in the current management of the planning/design phase of the project
lifecycle of heritage buildings, which negatively impact on the subsequent
execution/construction phase and causes, or significantly contribute to, project cost
overruns and time delays. Better stakeholder management is particularly important to
facilitate interaction by, and gain involvement and approbation from, or at least
prevent the negative influence of, different stakeholders. Furthermore, technical
issues/factors arising from interviewed respondents have been taken into account,
which needed to be further acknowledged and examined.

OVERCOMING THE CHALLENGES OF BUILDING HERITAGE PROJECTS: IMPROVEMENTS TO TIME, SCOPE AND COST PERFORMANCE iv
The original research propositions were confirmed by the research study. In
particular, the study determines that the ability to influence cost savings is
substantially higher at the beginning of a project. Although not a new finding, it is
proven in this study to be of very high significance to the ultimate success of heritage
projects. Therefore, a heavier investment in the planning/design stage of heritage
projects will ultimately cost the project owner less than advancing with unresolved
critical issues still encapsulated in the project. Once the on-site operation starts, the
inclusion of changes such as dealing with latent conditions would cost the owner
considerably more than would have been envisaged in the budget that was used to
gain approvals for works and as the basis to let contracts.
This research used both case studies and surveys for the data collection
purposes. The data collection techniques consisted of a questionnaire, interviews,
document analysis, observation and focus groups as a validation of the findings.
Only Queensland heritage-listed building projects were used for the case study
purposes and this might considered as a limitation. Despite that limitation, the cross-
case study analysis provides an overview of the existing problems in managing
heritage-listed projects within a specific region (Queensland) that appear to be
transferable to other parts of Australia and outside. The survey questionnaire was
widely distributed all over Australia. Therefore, data on the existing challenges in
different states and territories was collected. The quantitative data was analysed
using statistical analysis techniques SPSS Statistics 21 and Stata 2013 software
packages, and NVivo 10 software was used to code and facilitate analysis of the
qualitative data. Use of this mixed-methods approach resulted in good data
triangulation of the results ensured that the research objectives were reached and the
research questions answered.
The study proposes “call for action” guidance, which was developed on the
basis of the research findings reported in this thesis and validated by experts with
more than 20 years’ experience each in heritage building projects in Australia. The
proposed guidance is designed to ensure that realistic cost targets and delivery
timeframes are set in future heritage projects. The evaluation of the results through
an expert focus group discussion generated the final recommended actions to be
included as part of the research recommendations. The need for urgent action related
to the delivery of current and future heritage projects is clear, and significant

OVERCOMING THE CHALLENGES OF BUILDING HERITAGE PROJECTS: IMPROVEMENTS TO TIME, SCOPE AND COST PERFORMANCE v
improvements in current practices are needed to overcome the problems of cost and
time overruns in future heritage projects. The conclusions in the thesis answer the
following research questions:
RQ1. What are the main challenges that form the key reasons and make the
decision on retaining existing heritage places?
RQ2. What are the challenges (and their causes) in complying with policies
and procedures that affect the management and delivery of heritage projects?
RQ3. How can the project management process be improved for more effective
management in the operation and delivery of heritage building projects?
This research project summarises the current status of practices related to the
research problem area, as well as detailing implications for theory and practice and
offering suggestions for the future improvement around the identified issues and
problem area, as well as potential directions for further research.

OVERCOMING THE CHALLENGES OF BUILDING HERITAGE PROJECTS: IMPROVEMENTS TO TIME, SCOPE AND COST PERFORMANCE vi

OVERCOMING THE CHALLENGES OF BUILDING HERITAGE PROJECTS: IMPROVEMENTS TO TIME, SCOPE AND COST PERFORMANCE vii
Table of Contents
Keywords ...................................................................................................................... i
Abstract ....................................................................................................................... iii
Table of Contents ....................................................................................................... vii
List of Tables ............................................................................................................. xv
List of Figures .......................................................................................................... xvii
List of Abbreviations ................................................................................................ xxi
Statement of Original Authorship ........................................................................... xxiii
Acknowledgments .................................................................................................... xxv
CHAPTER 1: BACKGROUND OF THE RESEARCH ........................................ 1
1.1 Research Background ........................................................................................... 1
1.2 Research Problem ................................................................................................. 3
1.3 Research Aim and Objectives ................................................................................ 3
1.4 Research Propositions/Hypothesis ........................................................................ 4
1.5 Research Limitations............................................................................................. 5
1.6 Research Significance and Contribution to Body of Knowledge ......................... 5
1.7 Thesis Structure..................................................................................................... 6
CHAPTER 2: LITERATURE REVIEW ................................................................. 7
2.1 Introduction ........................................................................................................... 7
2.2 The ‘treasure’ of heritage places ........................................................................... 7
2.2.1 What is heritage? .................................................................................. 7
2.2.2 What is the importance of preserving heritage places? ........................ 8
2.3 Heritage organisations and institutions ................................................................. 9
2.4 How are important ‘heritage places’ identified and protected in Australia? ...... 11

OVERCOMING THE CHALLENGES OF BUILDING HERITAGE PROJECTS: IMPROVEMENTS TO TIME, SCOPE AND COST PERFORMANCE viii
2.4.1 Identification ....................................................................................... 11
2.4.2 Listing ................................................................................................. 12
2.4.3 Protection – Heritage laws in Australia .............................................. 14
2.5 Australian Strategy – public involvement ........................................................... 16
2.5.1 Queensland’s heritage strategy ........................................................... 16
2.5.2 Different types of actions and projects for heritage buildings ............ 19
2.5.3 Economic benefits of heritage sites .................................................... 21
2.6 Challenges to maintaining heritage-listed buildings ........................................... 23
2.7 Project management ............................................................................................ 24
2.7.1 Project success and project success measures .................................... 25
2.7.2 Factors affecting project success ........................................................ 28
2.8 Stakeholder management .................................................................................... 30
2.8.1 Stakeholder influence on project ....................................................... 30
2.8.2 Managing multiple stakeholders ........................................................ 32
2.8.3 Australia – Needs for stakeholders’ expertise .................................... 34
2.9 Discussion ........................................................................................................... 36
2.10 Summary ............................................................................................................ 37
CHAPTER 3: RESEARCH DESIGN AND METHOD ........................................ 39
3.1 Introduction ....................................................................................................... 39
3.2 Research Paradigm and Philosophy ................................................................. 39
3.3 Research context – literature ............................................................................. 41
3.4 The mixed-methods approaches ....................................................................... 43
3.4.1 Benefits of applying qualitative research approach ............................ 45
3.4.2 Benefits of applying a quantitative research approach ....................... 46
3.5 The mixed-method approach enriched by use of an architectural research
sense .................................................................................................................. 47

OVERCOMING THE CHALLENGES OF BUILDING HERITAGE PROJECTS: IMPROVEMENTS TO TIME, SCOPE AND COST PERFORMANCE ix
3.6 Research Methods ............................................................................................. 48
3.6.1 Rationale and design of the survey ..................................................... 51
3.6.2 Rationale and design of the case study ............................................... 52
3.6.3 Rationale and design of the focus group ............................................ 58
3.7 Summary of Chapter ......................................................................................... 59
CHAPTER 4: OPERATIONALISING THE RESEARCH ................................ 61
4.1 Introduction ...................................................................................................... 61
4.2 Phase I – Literature review and preparation .................................................... 63
4.3 Phase II, IV– Qualitative data collection (case study) ..................................... 67
4.4 Phase III – Quantitative Data Collection (survey) ............................................ 71
4.5 Phase V – Data analysis tools used to analyse qualitative and quantitative
data .................................................................................................................... 71
4.5.1 Relationship propositions Model 1 ..................................................... 72
4.5.2 Relationship propositions Model 2 ..................................................... 73
4.5.3 Development of the Survey Questionnaire ......................................... 75
4.5.4 Questionnaire scales ........................................................................... 79
4.5.5 Sample size ......................................................................................... 80
4.5.6 Preliminary data analysis .................................................................... 80
4.5.7 Coding data ......................................................................................... 80
4.5.8 Screening the missing values/data ...................................................... 80
4.5.9 Screening the outliers ......................................................................... 81
4.5.10 Normality distribution ........................................................................ 81
4.5.11 Reliability of the established measures .............................................. 82
4.5.12 Descriptive analysis ............................................................................ 83
4.5.13 Correlation .......................................................................................... 83
4.5.14 Confirmatory factor analysis .............................................................. 84

OVERCOMING THE CHALLENGES OF BUILDING HERITAGE PROJECTS: IMPROVEMENTS TO TIME, SCOPE AND COST PERFORMANCE x
4.5.15 Structural Equation Modelling ........................................................... 84
4.5.16 Unpredictable environmental factors .................................................. 88
4.5.17 Qualitative tool ................................................................................... 88
4.5.18 Data triangulation ............................................................................... 88
4.6 Phase VI – Theoretical propositions (validation of guidance by the
focus group) ...................................................................................................... 89
4.7 Summary ........................................................................................................... 91
CHAPTER 5: PROJECT MANAGEMENT CHALLENGES – CASE STUDY 93
5.1 Introduction .................................................................................................... 93
5.2 Selection of case studies ................................................................................ 93
5.3 Stakeholder interviews identification ............................................................. 95
5.4 Data Coding for Interviews ............................................................................ 95
5.5 Case Study 1: Old Government House .......................................................... 98
5.5.1 Introduction ....................................................................................... 98
5.5.2 OGH Restoration Project 2007–2009 ............................................... 101
5.5.3 Stakeholder Interviews ..................................................................... 101
5.5.4 Archived documentation ................................................................... 108
5.5.5 Summary of Case Study 1 ................................................................ 112
5.6 Case Study 2: QUT Precinct 2, “Gona Barracks” ....................................... 114
5.6.1 Introduction ..................................................................................... 114
5.6.2 QUT Precinct 2 Project 2013–2015 .................................................. 117
5.6.3 Stakeholder Interviews ..................................................................... 117
5.6.4 Observation ...................................................................................... 123
5.6.5 Summary of Case Study 2 ................................................................ 133
5.7 Case Study 3: Anzac Square ........................................................................ 134
5.7.1 Introduction ..................................................................................... 134

OVERCOMING THE CHALLENGES OF BUILDING HERITAGE PROJECTS: IMPROVEMENTS TO TIME, SCOPE AND COST PERFORMANCE xi
5.7.2 Anzac Square Restoration Project Phase One (2013–2015)
and Phase 2 (2016) ........................................................................... 136
5.7.3 Stakeholder Interviews ..................................................................... 137
5.7.4 Observation....................................................................................... 142
5.7.5 Summary of Case Study 3 ................................................................ 150
5.8 Cross-Case Study Analysis .......................................................................... 151
CHAPTER 6: PROJECT MANAGEMENT CHALLENGES – SURVEY ..... 153
6.1 Introduction .................................................................................................. 153
6.2 Preliminary Results ..................................................................................... 154
6.3 Coding Data .................................................................................................. 160
6.4 Missing Values ............................................................................................. 160
6.5 Outliers ........................................................................................................ 160
6.6 Normality of Distribution ............................................................................. 160
6.7 Reliability of the Data ................................................................................. 163
6.8 Descriptive Statistical Analysis .................................................................... 163
6.9 Correlation within the Constructs ................................................................ 168
6.10 Confirmatory Factor Analysis ..................................................................... 170
6.10.1 Assessment of standardised CFA Model_Heritage Retention_
Key Reasons (KR)_Main Challenges (MC) ..................................... 170
6.10.2 Assessment of standardised CFA Model_Planning/Design (PD) ..... 173
6.10.3 Assessment of standardised CFA Model_Execution/Construction
(EC) .................................................................................................. 176
6.10.4 Assessment of standardised CFA Model_Technical factors
(Technical) ........................................................................................ 179

OVERCOMING THE CHALLENGES OF BUILDING HERITAGE PROJECTS: IMPROVEMENTS TO TIME, SCOPE AND COST PERFORMANCE xii
6.10.5 Assessment of standardised CFA Model_
Multiple Stakeholders (M_stake) ..................................................... 183
6.11 Assessment of standardised SEM Model_Project Performance (PP) .............. 186
6.12 Summary .......................................................................................................... 191
CHAPTER 7: FOCUS GROUP DISCUSSION AND VALIDATION
OF RESULTS ................................................................................ 193
7.1 Introduction ................................................................................................. 193
7.2 Project Performance and Delivery Challenges ............................................. 193
7.2.1 Challenges in the planning/design phase ............................................. 194
7.2.2 Challenges in the execution/construction phase .................................. 195
7.2.3 Challenges in the management of multiple stakeholders ................... 195
7.2.4 Challenges in the management of technical issues ............................. 197
7.3 Validation focus group method .................................................................... 197
7.3.1 Focus group insights into the heritage project management process .. 199
7.3.2 Validation of the project performance and delivery challenges .......... 199
7.4 Summary ...................................................................................................... 207
CHAPTER 8: CONCLUSION ............................................................................. 209
8.1 Introduction .................................................................................................. 209
8.2 Background .................................................................................................. 209
8.3 Conclusions .................................................................................................. 211
8.4 Research objectives reached and research questions addressed ................... 215
8.5 Summary ..................................................................................................... 220
8.6 Limitations of the Study ............................................................................... 221
8.7 Contribution of the Study and Directions in Future Research. .................... 221

OVERCOMING THE CHALLENGES OF BUILDING HERITAGE PROJECTS: IMPROVEMENTS TO TIME, SCOPE AND COST PERFORMANCE xiii
REFERENCES ...................................................................................................... 225
APPENDICES ........................................................................................................ 241
APPENDIX A: SURVEY QUESTIONNAIRE .................................................. 241
APPENDIX B: SEMI-STRUCTURED INTERVIEWS ..................................... 263
APPENDIX C: DATA CODING ......................................................................... 265
Appendix C-1: Key Reasons for Heritage Retention ............................................... 266
Appendix C-2: Main Challenges of Heritage Retention .......................................... 266
Appendix C-3: Planning/Design Phase .................................................................... 267
Appendix C-4: Execution/Construction Phase ........................................................ 268
Appendix C-5: Technical Factors ............................................................................ 269
Appendix C-6: Multiple Stakeholders’ Factors ....................................................... 269
APPENDIX D: PRELIMINARY DATA ANALYSIS ....................................... 271
Appendix D-1: Normality ........................................................................................ 272
Appendix D-1-1: Normality Test – Heritage Retention Construct:
Key Reasons and Main Challenges ................................... 272
Appendix D-1-2: Normality Test – Project Performance Construct:
Planning/Design, Execution/Construction,
Technical Factors and Multiple Stakeholders’ Factors ..... 272
Appendix D-2: Reliability Test of Measures in the Questionnaire .......................... 274
Appendix D-2-1: Reliability Test – Key Reasons for Heritage Retention ..... 274
Appendix D-2-2: Reliability Test – Main Challenges of Heritage Retention 274
Appendix D-2-3: Reliability Test – Planning/Design Phase ......................... 275
Appendix D-2-4: Reliability Test – Execution/Construction Phase .............. 276
Appendix D-2-5: Reliability Test – Technical Factors ................................... 277
Appendix D-2-6: Reliability Test – Multiple Stakeholders’ Factors.............. 278
Appendix D-3: Descriptive Statistics by Frequencies Test ...................................... 280

OVERCOMING THE CHALLENGES OF BUILDING HERITAGE PROJECTS: IMPROVEMENTS TO TIME, SCOPE AND COST PERFORMANCE xiv
Appendix D-3-1: Frequencies Test – Key Reasons and Main Challenges .... 280
Appendix D-3-2: Frequencies Test – Project Performance Challenges ......... 281
Appendix D-4: Correlation by Bonferroni Test ....................................................... 282
Appendix D-4-1: Bonferroni Test – Key Reasons ......................................... 282
Appendix D-4-2: Bonferroni Test – Main Challenges .................................. 284
Appendix D-4-3: Bonferroni Test – Planning/Design Phase .......................... 284
Appendix D-4-4: Bonferroni Test – Execution/Construction Phase .............. 286
Appendix D-4-5: Bonferroni Test – Technical Factors .................................. 288
Appendix D-4-6: Bonferroni Test – Multiple Stakeholders’ Factors ............. 289
APPENDIX E: CONFIRMATORY FACTOR ANALYSIS .............................. 291
Appendix E-1: Confirmatory Factor Analysis - Key Reasons and
Main Challenges ............................................................................. 292
Appendix E-2: Confirmatory Factor Analysis – Planning/Design Phase ................ 295
Appendix E-3: Confirmatory Factor Analysis – Execution/Construction Phase ..... 297
Appendix E-4: Confirmatory Factor Analysis – Technical Factors ......................... 299
Appendix E-5: Confirmatory Factor Analysis – Multiple Stakeholders’ Factors .... 301
APPENDIX F: STRUCTURAL EQUATION MODELLING .......................... 303
Appendix F-1: Structural Equation Modelling - Project Performance Model ........ 304
APPENDIX G: HERITAGE LEGISLATION SUMMARY .............................. 307
APPENDIX H: ADDITIONAL SURVEY RESULTS ........................................ 313

OVERCOMING THE CHALLENGES OF BUILDING HERITAGE PROJECTS: IMPROVEMENTS TO TIME, SCOPE AND COST PERFORMANCE xv
List of Tables
Table 2.1: Principal heritage legislation..................................................................... 15
Table 2.2: Stakeholder degrees of influence .............................................................. 32
Table 3.1: Research paradigms .................................................................................. 41
Table 3.2: Strengths and weaknesses of qualitative research .................................... 46
Table 3.3: Strengths and weaknesses of quantitative research .................................. 47
Table 4.1: Advantages and disadvantages of the probability sampling designs ........ 65
Table 4.2: Numerical methods of testing normality................................................... 82
Table 4.3: Reliability level considerations ................................................................. 83
Table 4.4: Assessment of measurement model .......................................................... 85
Table 4.5: Criteria for multi-fit indices for defining the structural model fit ............ 87
Table 5.1: Application of criteria to selected projects for case studies in this
research ...................................................................................................... 94
Table 5.2: Stakeholder interview identification ......................................................... 95
Table 5.3: Characteristics of OGH ........................................................................... 101
Table 5.4: OGH case study stakeholder interviews ................................................. 102
Table 5.5: Characteristics of Gona Barracks ............................................................ 116
Table 5.6: QUT Precinct 2, Gona Barracks case study stakeholder interviews ....... 117
Table 5.7: Characteristics of Anzac Square ............................................................. 135
Table 5.8: Anzac Square case study stakeholder interviews.................................... 137
Table 5.9: Cross-case study analysis – highlighted issues and causes ..................... 152
Table 6.1: Values that were not normally distributed .............................................. 161
Table 6.2: Cronbach’s alpha results ......................................................................... 163
Table 6.3: Key reasons (KR) .................................................................................... 164
Table 6.4: Main challenges (MC) ............................................................................ 164

OVERCOMING THE CHALLENGES OF BUILDING HERITAGE PROJECTS: IMPROVEMENTS TO TIME, SCOPE AND COST PERFORMANCE xvi
Table 6.5: Planning/Design (PD) ............................................................................. 165
Table 6.6: Execution/Construction (EC) .................................................................. 166
Table 6.7: Technical factors (Technical) .................................................................. 166
Table 6.8: Multiple stakeholder factors (M_stake) .................................................. 167
Table 6.9: Level of fit for the heritage retention model ........................................... 172
Table 6.10: CFA top three reasons for heritage retention ....................................... 172
Table 6.11: CFA top three challenges for heritage retention ................................... 173
Table 6.12: Level of fit for the CFA planning/design model ................................... 175
Table 6.13: CFA challenges for PD ......................................................................... 175
Table 6.14: Level of fit for the CFA execution/construction model ........................ 178
Table 6.15: CFA challenges for EC ......................................................................... 178
Table 6.16: Level of fit for the CFA technical model .............................................. 181
Table 6.17: CFA factors for Technical ..................................................................... 181
Table 6.18: Level of fit for the CFA multiple stakeholders model .......................... 184
Table 6.19: CFA top three factors for M_stake ....................................................... 185
Table 6.20: Level of fit for the SEM Project Management Model ......................... 187
Table 6.21: SEM_main challenges for PM .............................................................. 188
Table 6.22: SEM_main challenges for EC ............................................................... 189
Table 6.23: SEM_main factors for technical ........................................................... 190
Table 6.24: SEM_main factors for M_stake ............................................................ 191
Table 7.1: Application of criteria to select the focus group panel ........................... 198
Table 7.2: Summary of the validated findings – conclusions and
recommended actions .............................................................................. 204

OVERCOMING THE CHALLENGES OF BUILDING HERITAGE PROJECTS: IMPROVEMENTS TO TIME, SCOPE AND COST PERFORMANCE xvii
List of Figures
Figure 2.1: Model criteria for identifying heritage places in Australia...................... 11
Figure 2.2: Levels of heritage listing ......................................................................... 13
Figure 2.3: Use of policies ......................................................................................... 18
Figure 2.4: Model of decision making process in adaptive reuse .............................. 22
Figure 2.5: Specific project success measures ........................................................... 26
Figure 2.6: Causes of project failures ........................................................................ 29
Figure 2.7: Stakeholder map ...................................................................................... 31
Figure 2.8: Multiple stakeholder models in conservation projects ............................ 33
Figure 2.9: Historic heritage, lack of skills and expertise .......................................... 35
Figure 3.1: Scheme for analysing assumptions reflected in the paradigms ............... 40
Figure 3.2: Estimate activity resources – Literature Review –
Input, Tools & Techniques, and Outputs ................................................ 42
Figure 3.3: Form of research question matching the appropriate method ................. 43
Figure 3.4: Research approaches ............................................................................... 44
Figure 3.5: Overall diagrammatic of an architectural research project ...................... 48
Figure 3.6: Research design ....................................................................................... 50
Figure 3.7: Estimate activity resources – Survey –
Input, Tools & Techniques, and Outputs ................................................ 51
Figure 3.8: Estimate activity resources – Case Study –
Inputs, Tools & Techniques, and Outputs .............................................. 52
Figure 3.9: Convergence and no convergence of multiple sources of evidence ........ 53
Figure 3.10: Strengths and weaknesses of six sources of evidence ........................... 54
Figure 3.11: Estimate activity resources – Focus Group –
Inputs, Tools & Techniques, and Outputs ............................................... 58

OVERCOMING THE CHALLENGES OF BUILDING HERITAGE PROJECTS: IMPROVEMENTS TO TIME, SCOPE AND COST PERFORMANCE xviii
Figure 3.12: Summary of estimated activity resources – Research Project –
Inputs, Tools & Techniques, and Outputs ............................................... 60
Figure 4.1: Research outline ....................................................................................... 62
Figure 4.2: Types of sampling design ........................................................................ 64
Figure 4.3: Sampling in the multiple stages ............................................................... 66
Figure 4.4: Case study method ................................................................................... 68
Figure 4.5: Model 1 – Heritage retention model ........................................................ 72
Figure 4.6: Targeted project management process indicators .................................... 73
Figure 4.7: Model 2 – Conceptual project performance model ................................. 74
Figure 4.8: Project performance structural equation model ....................................... 78
Figure 4.9: Test for judging the research quality ....................................................... 90
Figure 5.1: Tree nodes in case study data .................................................................. 96
Figure 5.2: Old Government House ........................................................................... 98
Figure 5.3: Design symmetry in the ground floor plan and main entrance
of the building ......................................................................................... 99
Figure 5.4: The Old Government House garden ...................................................... 100
Figure 5.5: Photo-documentation of the building condition 1 ................................. 107
Figure 5.6: Photo-documentation of the building condition 2 ................................. 108
Figure 5.7: Australian Army Services Corps drill hall and wagon shed,
plans and elevations, 1915 ..................................................................... 115
Figure 5.8: Map of items and its locations ............................................................... 124
Figure 5.9: Anzac Square, 1930 ............................................................................... 134
Figure 5.10: Anzac Square ....................................................................................... 136
Figure 5.11: Anzac Square restoration project map of items and their locations .... 142
Figure 6.1: Heritage retention CFA Model_KR_MC_20 ........................................ 171
Figure 6.2: Planning design CFA Model_PD_16 .................................................... 174

OVERCOMING THE CHALLENGES OF BUILDING HERITAGE PROJECTS: IMPROVEMENTS TO TIME, SCOPE AND COST PERFORMANCE xix
Figure 6.3: Execution/construction CFA Model_EC_15 ......................................... 177
Figure 6.4: Technical factor CFA Model_Technical_8 ........................................... 180
Figure 6.5: Multiple stakeholders CFA Model_M_stake_12 .................................. 183
Figure 6.6: Structural equation model Project Performance (PP) ............................ 186
Figure 8.1: Targeted project stages and research questions ..................................... 211
Figure 8.2: Intervention points in the project chain of challenges and causes ......... 222

OVERCOMING THE CHALLENGES OF BUILDING HERITAGE PROJECTS: IMPROVEMENTS TO TIME, SCOPE AND COST PERFORMANCE xx

OVERCOMING THE CHALLENGES OF BUILDING HERITAGE PROJECTS: IMPROVEMENTS TO TIME, SCOPE AND COST PERFORMANCE xxi
List of Abbreviations
ADF Asymptotic distribution free
AGFI Adjusted goodness-of-fit index
AMOS Analysis of moment structures
CFA Confirmatory factor analysis
CFI Comparative fit index
CMIN/DF Chi-square/ Degree of freedom
CR Critical ratio
EC Execution/construction
EFA Exploratory factor analysis
GFI Goodness of fit index
HR Heritage retention
ICOMOS International Council on Monuments and Sites
KMO Kaiser-Mayer-Olkin
KR Key reasons
MC Main challenges
ML Maximum likelihood
MVML Maximum likelihood with missing values
M_stake Multiple stakeholders
NFI Normed fit index
OGH Old Government House
PD Planning/design
PM Project management
PP Project performance
QML Quasi maximum likelihood

OVERCOMING THE CHALLENGES OF BUILDING HERITAGE PROJECTS: IMPROVEMENTS TO TIME, SCOPE AND COST PERFORMANCE xxii
R Interviewed Respondent
RMSEA Root mean square error of approximation
SEM Structural equation modelling
Technical Technical factors
TLI Tucker-Lewis index
WLS Weighted least squares

QUT Verified Signature

OVERCOMING THE CHALLENGES OF BUILDING HERITAGE PROJECTS: IMPROVEMENTS TO TIME, SCOPE AND COST PERFORMANCE xxiv

OVERCOMING THE CHALLENGES OF BUILDING HERITAGE PROJECTS: IMPROVEMENTS TO TIME, SCOPE AND COST PERFORMANCE xxv
Acknowledgements
PSALM IX
I will give thanks unto thee,
O Lord, with my whole heart;
I will speak of all thy marvellous works.
PSALM CXVIII
Blessed be he that cometh in the name of the Lord.
PSALM CXLIV
Blessed be the Lord my strength :
who teacheth my hands to war,
and my fingers to fight;
My hope and my fortress,
my castle and deliverer,
my defender in whom I trust.
The Psalms of David from the Book of Common Prayer (1841)
As your servant, dear God, you brought me here to serve this country with this work and other works according to your will.
Those who are coming in your name, blessed by you dear God, have made your will manifest. Grant all those who contributed in different ways to this work gifts that hardly could be imagined by human desire.
Strengthen me for the new battles to protect the future life of heritage places that have witnessed the past. We should never forget the past that has formed us; we should bring it to glory.

OVERCOMING THE CHALLENGES OF BUILDING HERITAGE PROJECTS: IMPROVEMENTS TO TIME, SCOPE AND COST PERFORMANCE xxvi

Chapter 1: Background of the Research 1
Chapter 1
BACKGROUND OF THE RESEARCH
Many of us will not visit any of the sites on the World Heritage List. But we would feel impoverished to know of the loss of such sites, and feel enriched by their continuing existence, even if we never visit them.
Ismail Serageldin (1999, p. 241)
1.1. Research Background
The movement to protect historical and old buildings that are regarded as forming
part of a country’s national heritage has grown enormously since the World Heritage
Centre and the World Heritage list were both established in 1972 (UNESCO 1972).
The significance of historic sites has been recognised globally and discussed by
many researchers (Araoz 2011; Brand 1995; Forster and Kayan 2009; Orbagli 2008;
Rypkema 2003). Many heritage organisations have since been founded with the aim
of protecting and managing cultural heritage, and numerous studies have supported
the importance of preserving and protecting heritage architecture. In his annual
lecture to the Royal Institute of British Architects, His Royal Highness The Prince of
Wales (2009) said ‘Surely architects flock in such numbers to live in these lovely old
houses – many from the 18th Century, often in the last remaining conservation areas
of our towns and cities that haven’t yet been destroyed – because, deep down, they
do respond to the natural patterns and rhythms I have been talking about, and feel
more comfortable in such harmonious surroundings.’ The need to preserve the
aesthetic quality of heritage buildings and their outstanding universal value is
emerging as a task of high importance for governments and the professional
disciplines that run heritage projects (i.e. heritage consultants, architects, engineers
and project managers) (Mason 2005; Provins et al. 2008; Roders and Oers 2011).
Managing heritage-listed building projects has been seen as a sensitive issue,
sometimes facing significant criticism (Reyers and Mansfield 2001). Today, there is

Chapter 1: Background of the Research 2
growing acceptance that heritage conservation provides cultural, economic and social
benefits to urban communities. Moreover, heritage buildings are seen as an important
element of Australia’s social capital (Bullen and Love 2011). The Australian State of
the Environment Committee (2011) highlighted the importance of taking action to
protect heritage places from further development pressure in order to retain their
values.
Heritage projects are problematic in terms of meeting time and cost impositions; this
underpins the need for investigation of current project management
systems/processes to assure better outcomes in heritage projects (especially as a
recognition that conventional project management frameworks are failing to deliver
in other types of projects as well).
Better stakeholder management is also particularly important to facilitate interaction
by, and gain involvement and approbation from, or at least prevent negative
influence of, different stakeholders. This will greatly help and enhance the
stakeholders’ contribution and add value to the project outcomes of renewal projects,
in which interested parties are many and varied. The complexity of the conservation
process and the often large numbers of stakeholders engaged usually leads to there
being several different objectives and requirements, which brings about conflicts
(Alallafa and Torreb 2010).
The present research attempts to address the omissions of certain critical elements in
the current management of the planning/design phase of the project lifecycle of
heritage buildings, which currently negatively impacts on the subsequent
execution/construction phase and causes, or significantly contributes to, project cost
overruns and time delays. Although supporting principles, policies and guidance to
improve heritage project outcomes have been developed, many problems still exist
that seriously affect the management of heritage projects.
A fresh and current look at the project performance and delivery of heritage projects
is needed, because few studies have been conducted to explore the specific project
management and stakeholder issues that contribute to failed elements (time and cost)
in heritage projects.

Chapter 1: Background of the Research 3
1.2. Research Problem
Despite the results from previous research that have been utilised to provide
solutions to improve the delivery of heritage projects, many such projects are in fact
still running over time and therefore over budget. Shenhar and Dvir (2007, p.6)
explain that projects are thought to fail because of poor planning, lack of
communication or inadequate resources; however, “as the evidence suggests, failure
is often found even in well-managed projects that are run by experienced managers
and supported by highly regarded organizations”. After fifteen years of collecting
data, Shenhar and Dvir (2007) came up with the astonishing result that 85 percent of
all construction projects have failed to meet time and budget goals. If heritage
projects are already problematic in terms of meeting time and cost impositions, then
the fact that conventional project management frameworks are also failing to deliver
successful time and cost outcomes in other types of projects underpins the need for a
fresh look at current systems/procedures and for the development of specific
recommendations/guidance to assure better outcomes in heritage projects. As a result
of this, one of the major areas to be researched in relation to the successful delivery
of heritage-listed building projects is the application of existing project management
practices, especially as they relate to heritage projects. This research sits well within
current interests as issues with existing project management methodologies are
currently being addressed and criticised by the research community (Zwikael and
Smyrk 2011, p. 11).
1.3. Research Aim and Objectives
The aim of this study is to investigate the general and specific factors that affect the
project performance and delivery of heritage building projects. Therefore, this
research focuses on the two phases in the project lifecycle where stakeholder
engagement can play the most significant role in adding upstream value, namely, the
planning/design and execution/construction phases. The research target was to
identify factors that have the most effect on the integral processes in these stages.
The essential objective of the research is to investigate ‘how’ different factors in each
of targeted stages influence the overall project performance and delivery, and to
determine their impact levels. Moreover, the research focuses attention on finding the
causes of the recurrent challenges that influence the time and cost overruns that
appear to be prevalent in many heritage-listed building projects and to conceptualise

Chapter 1: Background of the Research 4
and develop a new “call for action” guidance to assist in reducing the future
occurrence of such issues.
In summary, the aim of this research is to determine project performance challenges
and analyse causes during the planning/design and execution/construction phases
whilst also analysing the multiple stakeholder management factors that exist in the
environment of heritage building projects and the influence that these have on the
design and construction phases of those projects.
Based on the research problem and the stated aims, the objectives of this research
are:
RO1. To document the values of a heritage-listed building and to address the
main challenges in protecting and maintaining an existing building rather
than constructing a new one.
RO2. To evaluate the current policy and procedures relevant to heritage
projects and identify ongoing project challenges and causes.
RO3. To recognise the challenges in the management process, elaborate its
causes and propose a set of actions to maximise the effectiveness of heritage
project performance.
1.4. Research Propositions / Hypothesis
To answer the three research questions two models were developed and propositions
for each model offered.
To answer the RQ1 the propositions are next:
Proposition 1 – Key reasons (KR) and Main Challenges (MC) are directly related.
“Within the statistical model, there is a significant covariance relationship between
KR and MC. Therefore, a relationship between KR and MC exists.”
Proposition 2 – Minimising MC will improve KR.

Chapter 1: Background of the Research 5
To answer the RQ2 and RQ3 the propositions are:
Proposition 1 – Project performance (PP) success measurement is composed of
Time, Cost and Quality/scope.
Planning/Design (PD) and Execution/Construction (EC) are the two phases in the
project management lifecycle examined in this study; by examining the observed
challenges that characterised each construct, guidance could be developed to improve
the effectiveness of each phase.
Proposition 2 – PD and EC measure project performance (PP).
There is a significant association between planning design, execution/construction
and project performance as measured by the structural equation model.
Proposition 3 – Multiple stakeholders (M_stake) factors measure PP.
Proposition 4 – Technical factors measure PP.
By examining the observed factors that characterise each construct (M-stake and Technical), guidance could be developed to improve the effectiveness of examined constructs.
1.5. Research Limitations
Certain limitations are identified in this research as follows:
In order to gain greater depth of investigation, this research is focused on
heritage projects undertaken in Australia.
Thus, only Queensland heritage-listed building projects were used to provide
data. Similarly, only local project stakeholders were used as the survey
population.
1.6. Research Significance and Contribution to Body of Knowledge
A key task of the research is to investigate how current processes and procedures can
be improved, tailored or even re-developed to better fit the heritage project needs and
ensure the successful project performance and delivery in future.
In addition, the part played by stakeholders, in terms of both engagement and
management in the process, is identified and a determination is undertaken of where

Chapter 1: Background of the Research 6
barriers to good management of projects exist and how these can be overcome for
improvement of project outcomes. By superimposing these processes onto the
processes of planning/design and execution/construction phases of projects, it will be
possible to develop new high-level recommendations/guidance to improve the
project performance and delivery of heritage type construction contracts.
To conclude, the major contribution of this research is in the guidance development,
which is expected to help diminish or avoid delays and cost overruns in future
heritage building projects.
1.7. Thesis Structure
The thesis began with an introduction that presents the background and preface to the
research problem with justification for this research along with the research aims and
objectives. The first chapter further discussed the research limitations and points out
the significance of this research through its contribution to knowledge to the field of
heritage management.
Chapter 2 presents a comprehensive overview and review of the extant literature that
is relevant to the research area. Chapter 3 discusses the research methodologies that
were utilised in the execution of the research. Chapter 4 discusses the
operationalisation of the research methods. Chapter 5 presents the project
management challenges analysed through the three case studies and cross-case
analysis. Chapter 6 presents the project performance challenges identified through an
analysis of the survey results. Chapter 7 presents the focus group discussion and
validation of the results, and Chapter 8 presents the conclusion.

Chapter 2: Literature Review 7
Chapter 2
LITERATURE REVIEW
Social value embraces the qualities for which a place becomes a focus of spiritual, political, national or other cultural sentiment to a majority or minority group.
Australia ICOMOS guidelines to the Burra Charter (in Johnston (1992, p. 1)
2.1. Introduction
This chapter builds the theoretical foundation upon which the research is based, by
reviewing the accumulated knowledge about the research problem and the topics
related to this issue. The literature review opens with an explanation of some global
concepts about the aesthetic, historic, scientific, social and other special values of
heritage places. Acknowledging the stated importance of retaining heritage places for
future generations found in the literature, this review highlights the major issues in
the area of heritage project management, such as extensive delays leading to
exceeding of the allotted time and budget cost. The chapter continues by discussing
the current thinking regarding: the benefits of and barriers to retaining heritage
places; the different project management frameworks in use; the key indicators of
project success; the factors affecting project success; and the stakeholder
management. Following this, the review narrows down and focuses its examination
to Australian, and specifically Queensland, heritage project issues/challenges.
Premised on these discussions, the research identifies gaps in the field of heritage
management research and literature.
2.2. The ‘treasure’ of heritage places
2.2.1. What is heritage?
According to the Commonwealth Department of Sustainability, Environment, Water,
Population and Communities (2012a, p. 2), heritage includes:
“…stories, traditions, languages, events and experiences inherited from the
past: it comprises both natural and cultural places with tangible and

Chapter 2: Literature Review 8
intangible values. More than a legacy from our past, heritage is also a living,
integral part of life today that is constantly renewed and refreshed. Shaped by
nature and history, it gives context to where we are now and where we are
headed as a community.”
2.2.2. What is the importance of preserving heritage places?
The story of a city is told almost always by preserving as many of the heritage
buildings as possible, which contribute to that story. Once an old building has gone,
the significance of a place is lost in the people’s memory (Marquis-Kyle and Walker
1992a; Worthing and Counsell 1999). The duty of the local community and society is
to protect its heritage and to preserve the buildings in their full richness of
authenticity (Pearson and Sullivan 1995; Plevoets and Cleempoel 2011; Williamson
2010). There is a social purpose of retaining heritage buildings as well as tangible
evidence of technical achievement and a chronicle of the development of style
(Spennemann 2006). Nimrud and Ready (2002) revisited the question of the value
and importance of heritage buildings to the communities which live within the
environment in which these artefacts are sited, and noted that several authors were
clearly supportive of the central theme of the value of conservation and preservation
rather than destruction. Tyler et al. (2009), for example, expounded American
society’s appreciation for heritage places in the last few decades and gave a view that
historical sites are irreplaceable. Heritage places have an irreplaceable value for
every community: places tell the stories about who we are and our past that has
formed us (Marquis-Kyle and Walker 1992b). Stemming from the awareness of the
need to protect cultural heritage worldwide, heritage organisations and institutions
have been forming to preserve origins in diverse settings.
Many discussions on the subject of the social and historical value of ‘place’ have
suggested that sentimental attachment to the past is essential for any community.
People seek physical reminders from the past as a social identification of place and
their communities. In addition, aesthetic values, quality design, craftsmanship and
historic materials all serve to indicate the significance of historic places and the
diversity of the cultures in which they were built (Lawerance Douglas County
Metropolitan Planning Office 2011). This view has been further supported by

Chapter 2: Literature Review 9
Johnston (1992) who noted that places where people gather and act together as a
community become the “private environment”.
2.3. Heritage organisations and institutions
The preservation of historic buildings has important environmental, cultural, social,
aesthetic/architectural and spiritual values (Johnston 1992), and heritage
organisations and institutions have been established globally to protect and manage
cultural resources. Many of these bodies have established policies and guidelines to
protect and manage the heritage buildings and sites within their areas and spans of
control. Some of the major instruments (listed and described chronologically) are:
1931 The Athens Charter, the Restoration of Historic Monuments
In 1931, at the IV International Congress of Modern Architecture, the Athens Charter introduced the concept of international heritage. The Charter has been accepted as a set of basic principles.
1964 The Venice Charter, the Conservation and Restoration of Monuments and Sites
In 1964, at the second Congress of Architects and Specialist of Historic Buildings meeting in Venice, the Venice Charter was approved: “It was agreed that the Charter should be laid down on an international basis, with each country responsible for applying the plan within the framework of its own culture and traditions” (cited in Heritage Perth (2014).
1965 The International Council on Monuments and Sites
The International Council on Monuments and Sites (ICOMOS) was established to protect and manage cultural resources. It was founded in 1965, in Warsaw, as a result of the Venice Charter.
In 1977, Australia ICOMOS reviewed the Venice Charter in regard to Australian practice and in 1979 the Charter was adopted as the guidelines for the Conservation of the Places of Cultural Significance. The Burra Charter (Australia ICOMOS 1979 cited in Dann et al. (1999, p.143)) defines conservation as being “all of the processes of looking after a place so as to retain cultural significance”. This original publication was revised in 1981, 1988 and 1999(Australia ICOMOS 1999) and the latest revision in 2013 has been incorporated into a workbook developed by the Australian Heritage Commission and Commonwealth Department of the Environment and Heritage (Smith 2005, p.102).

Chapter 2: Literature Review 10
1972 The United Nations Educational, Scientific and Cultural Organisation
In 1972, the United Nations Educational, Scientific and Cultural Organisation (UNESCO) defined heritage based on three main elements: (i) monuments: architectural works, works of monumental sculpture and painting, including cave dwellings and inscriptions, and elements, groups of elements or structures of special value from the point of view of archaeology, history, art or science; (ii) groups of buildings: groups of separate or connected buildings which, because of their architecture, their homogeneity or their place in the landscape, are of special value from the point of view of history, art or science; and (iii) sites: topographical areas, the combined works of man and of nature, which are of special value by reason of their beauty or their interest from the archaeological, historical, ethnological or anthropological points of view (UNESCO 1972).
1972 The World Heritage Convention
In 1972, UNESCO adopted the ‘Convention Concerning the Protection of the World Cultural and Natural Heritage’, known as the World Heritage Convention (WHC). This was drafted to provide a procedural, legal and financial framework for enabling nations to protect and preserve their cultural and national sites of outstanding universal value (Slatyer 1983).
Australia became one of the first countries to ratify the WHC in 1974. This resulted in the adoption of general policy and integration of the protection of the cultural and natural heritage into comprehensive planning programs in this country (Department of Sustainability Environment Water Population and Communities 2012b).
1987 The Washington Charter 1987
The Charter for the Conservation of Historic Towns and Urban Areas was adopted by the ICOMOS General Assembly in Washington 1987. Planning for conservation of historic towns and sites in urban areas is to ensure the harmonious relationship between past and present (ICOMOS 1987).
1993 Organisation of World Heritage Cities
The Organisation of World Heritage Cities (OWHC) was established in 1993 and was founded on an aspiration from the 1991 ‘First International Symposium of World Heritage Cities’, which instigated that a body be set up to assist cities to improve the existing management methods in relation to the particular needs of developing heritage sites (OWHC 2012).
Various countries have incorporated and modified these instruments into their own
national and localised regulations and laws to provide better protection for places of
significance in their locations of control. Commenting on the responsibilities of the
government, Jokilehto (2011, p. 61) states that “the duty of ensuring the

Chapter 2: Literature Review 11
identification, protection, conservation, presentation and transmission to future
generations of such heritage belongs, in the first place, to the state of whose territory
it is located”.
2.4. How are important ‘heritage places’ identified and protected in
Australia?
Economic growth involves changes, which could contribute to the loss of the values
of significant places through inappropriate change (Australian State of the
Environment Committee 2011).
2.4.1. Identification
Not every place has heritage value. Figure 2.1 presents the Australian model criteria
for recognising whether a heritage place or site has intrinsic value.
Figure 2.1: Model criteria for identifying heritage places in Australia (Department of Environment, Water, Heritage and the Arts (2008, p. 2)

Chapter 2: Literature Review 12
A heritage place can be identified based on meeting one or more of these criteria.
After identification, the appropriate level of listing would be applied.
2.4.2. Listing
In order to celebrate the building/place special history and architectural value, the
listing helps to protect those building/places. In order to maintain heritage places in
the most appropriate way, different levels of heritage listing have been determined in
Australia—with responsibilities allocated to different levels of government
accordingly—as follows (Strategy 2008):
World heritage
Australian/National heritage
State/Territory heritage
Local heritage.
The concept and context of heritage work varies at all levels. In addition, some
places can be identified at more than one level; therefore, several levels of
government will share responsibilities of that place. Figure 2.2 presents the different
levels of government related to heritage listing, together with their responsibilities.
Each of the different levels of heritage listing is discussed in more detail below.

Chapter 2: Literature Review 13
Figure 2.2: Levels of heritage listing (Department of Environment, Water, Heritage and the Arts (2008, p. 4)

Chapter 2: Literature Review 14
International (world) heritage listing is given to a place that has outstanding universal
value to a particular nation and could be maintained by the UNESCO World Heritage
Centre. Such places are listed on Australia’s World Heritage List. National heritage
refers to indigenous and historic sites of outstanding heritage value to the nation.
Such places are listed on the National and Commonwealth Heritage List.
Places listed as Commonwealth heritage are controlled by the Australian
Government and have significant heritage value. Those places are listed on the
National and Commonwealth Heritage List.
State and Territory heritage listing is given to places of special interest, importance
and significance to the state or territory, and is inscribed to the relevant State and
Territory Heritage Register. Local heritage listing is given to important and
significant places to the local community. Those places reflect the socio-economical
history of a local area. Each state has its own inventory and mechanisms in its
planning scheme. Those places are listed on the Local Government List.
In addition, some of the professional organisations, such as the National Trust in the
most states and territories, the Royal Australian Institute of Architects and
Engineering Heritage Australia, maintain lists of special places which are recognised
by their fields of expertise but without providing legal protection. Key heritage
legislation and the establishment dates of the National Trust 1945–2011, prepared by
Vines (2012), are attached in Appendix H as a more detailed summary of heritage
legislation.
2.4.3. Protection - Heritage laws in Australia
The principal heritage legislation that guides Australian heritage projects in
preserving cultural heritage is shown in Table 2.1.

Chapter 2: Literature Review 15
Table 2.1: Principal heritage legislation (Australian Government Productivity Commission 2006, p.56-57)
State Natural Indigenous Historic heritage Movable Shipwrecks Heritage
Council State/Territory National Trust
Cwth Environment Protection and Biodiversity Conservation Act 1999
Environment Protection andBiodiversity Conservation Act 1999
Environment Protection and Biodiversity Conservation Act 1999
Protection of Movable Cultural Heritage Act 1986
Historic Shipwrecks Act 1976
Australian Heritage Council Act 2003
n/a
NSW National Parks and Wildlife Act 1974
Heritage Act 1977 Heritage Act
1977 Historic Houses Act 1971
Heritage Act 1977 Heritage Act
1977 Heritage Act 1977 National
Trust of Australia (NSW) Act 1990
Vic National Parks Act 1975 Parks Victoria Act 1998
Archaeological and Aboriginal Relics Preservation Act 1972
Heritage Act 1995 Heritage Act
1995 Heritage Act 1995 Heritage Act
1995 n/a
Qld Nature Conservation Act 1992
Aboriginal Cultural Heritage Act 2003
Queensland Heritage Act 1992
Queensland Heritage Act 1992
Queensland Heritage Act 1992
Queensland Heritage Act 1992
National Trust of Queensland Act 1963
WA Conservation and Land Management Act 1984
Heritage of Western Australia Act 1990
Heritage of Western Australia Act 1990
Heritage of Western Australia Act 1990
Maritime Archaeology Act 1973
Heritage of Western Australia Act 1990
National trust of Australia (WA) Act 1964
SA Native Vegetation Act 1991
The Aboriginal Heritage Act 1988
Heritage Act 1993 Heritage Act
1993 Historic Shipwrecks Act 1981
Heritage Act 1993 National
trust of South Australia Act 1953
Tas Nature Conservation Act 2002
Aboriginal Relics Act 1975
Historic Cultural Heritage Act 1995
Historic Cultural Heritage Act 1995
Historic Cultural Heritage Act 1995
Historic Cultural Heritage Act 1995
National trust of Australia (Tasmania) Act 1975
NT Territory Parks and Wildlife Conservation Act
Northern Territory Aboriginal Sacred Sites Act 1989
Heritage Conservation Act 1991
Heritage Conservation Act 1991
Heritage Conservation Act 1991
Heritage Conservation Act 1991
National Trust (Northern Territory) Act 1976
ACT Nature Conservation Act 1980
Heritage Act 2004 Heritage Act
2004 Heritage Act 2004 Heritage Act
2004 Heritage Act 2004 n/a
The most important set of guidelines and the best standard for establishment of
overriding policies and principles for good conservation in any Australian territory is
the Burra Charter (Australia ICOMOS 1999), most recently revised in 2013.

Chapter 2: Literature Review 16
2.5. Australian Strategy – public involvement
In 2011, the Australian Government called for public input to help develop a national
heritage strategy for Australia’s heritage for the next 10 years (Strategy 2011). The
latest Australian ‘State of the Environment’ (SoE) report was released in December
2011 for public feedback and was specifically designed to inform and guide a wide
range of stakeholders, including members of the public and policy-makers, on
heritage issues and the value of heritage protection. Australian leadership in heritage
management, particularly in taking action to protect heritage places, is recognised
internationally (Australian State of the Environment Committee 2011). The latest call
from government for ‘A new vision for Australia’s heritage’ notes that “the
Australian Government is calling on heritage practitioners and experts across
Australia to come forward with their ideas and suggestions for the Australian
Heritage Strategy” (The Hon. Greg Hunt MP 2013).
Any conservation work on heritage buildings has to meet the Burra Charter standards
for guiding the making of decisions about, and undertaking the works to, places of
cultural significance in the states, territories and Commonwealth of Australia
(Australia ICOMOS 1999). A guide for owners and managers of National Heritage
places has been developed for better understanding of the management requirements
for these places. The guide has been aligned with the Environment Protection and
Biodiversity Conservation Act 1999 (EPBC Act) and its regulations.
2.5.1. Queensland’s heritage strategy
Queensland’s first formal heritage strategy was launched in 2009, as a framework for
managing state heritage places for the next 10 years. The plan identified the
following five key areas (Department of Environment and Heritage Protection and
Queensland Heritage Council (2012):
1. Communicating values – improving the way Queenslanders understand and
value their cultural heritage
2. Strengthening policy – embedding cultural heritage in mainstream policy and
planning
3. Maximising sustainable investment – strengthening Queensland’s investment
in managing and conserving its cultural heritage

Chapter 2: Literature Review 17
4. Building partnerships – leading and partnering with government, community
and industry to conserve Queensland’s cultural heritage
5. Developing capacity – building the capacity of government, community and
industry to conserve Queensland’s cultural heritage.
The two identified areas of “communicating value” and “strengthening policy” are
targets that sit well with the aims of this research project.
How is heritage managed in Queensland?
Heritage in Queensland is maintained using a framework which includes legislation,
policies and guidelines. Under Queensland legislation, the Queensland Heritage Act
1992 sets out a framework for protecting heritage places. Incorporating amendments
subsequently made in 1995, 2003, 2004 and 2005, “this act is the principal legislative
instrument through which places, archaeological objects and archaeological areas of
historical cultural heritage significance are protected in Queensland” (Queensland
Heritage Council (2006, p. 3). The Heritage Council was established by the same
Act. As the state’s peak body on heritage matters, the Heritage Council acts
independently, impartially and in the public interest, with administrative support
from the Department of Environment and Heritage Protection (Queensland Heritage
Council 2014).
The state’s conservation policy identifies what needs to be done to retain the
significance of the place (Department of Environment and Heritage Protection
2014a). Figure 2.3 presents the guidelines when policies are required. Since
December 2013, the state planning policy has been undergoing revision and reforms.
The use of the policy and the constraints that affect project delivery are addressed in
the second research question in the present study.

Chapter 2: Literature Review 18
Figure 2.3: Use of policies (Department of Environment and Heritage Protection (2014a, p. 4)
The Burra Charter, according to many authors, has had a considerable influence on
conservation practice (Marquis-Kyle and Walker 1992b). Local governments and
their conservation bodies link their programs to the Burra Charter’s preferred
methodologies and use these as a measure to facilitate the provision of regulatory
protection (Productivity Commission 2006; Sullivan 2006). Moreover, before any
development can take place, it is required that planners and developers look for
potential impacts of their projects on historical places (Brooks 1992). The Burra
Charter has been recognised and adopted by the Queensland Heritage Council as the
best practice for managing Queensland’s heritage places (Department of
Environment and Heritage Protection 2014b). The Queensland Heritage Council
(2006, p. 12) states that the Burra Charter “provides guidance for management of
places of cultural significance and cultural heritage significance, of a place or object,
including its aesthetic, architectural, historical, scientific, social or technological
significance to the present generation or past or future generations”.
There have been a series of established principles to guide the planning of
preservation, restoration, reconstruction and adaptation projects, for heritage-listed

Chapter 2: Literature Review 19
buildings. Heritage places can be retained in different ways as examined in the
following section.
2.5.2. Different types of actions and projects for heritage buildings
It is necessary to understand the nature of the significance of the place to society so
that appropriate management can occur. The process of determining the value of the
place is known as “the assessment of cultural significance” (Pearson and Sullivan
1995). The concept of ‘significance’ is crucial as this probably has the greatest
impact on whether a heritage building project goes ahead or not, or what form the
project will take in terms of ‘type’ of project and degree of the works undertaken
(time and cost impacting). For example, if the façade of a building is significant there
might be a decision to remove everything else and just embed the façade in the
ground floor elevation (e.g., Charlotte Towers, Charlotte Street, Brisbane) and this
makes construction awkward. Likewise, if any internal parts of a project are
significant then this makes work around the significant part extremely difficult by
way of protecting the works. Therefore, it is the difficulty of retaining the
‘significance’ of a heritage building that has a major effect on the time and cost of
project works.
There are different types of actions and conservation projects that can be undertaken
to preserve those significant places for future generations. “Conservation” in this
context means all the processes that are undertaken to care for the place and to retain
its cultural significance, meaning the historic, scientific, aesthetic, social and spiritual
values of the place.
According to the Burra Charter (1999, p. 2), the different types of processes that can
be applied to preserve heritage places and buildings are:
Maintenance – the continuous protective care of the fabric and setting of a
place (to be distinguished from repair, which involves restoration or
reconstruction)
Preservation – maintaining the fabric of a place in its existing state and
retarding deterioration
Restoration – returning the existing fabric of a place to a known earlier state
by removing accretions or by reassembling existing components without the
introduction of new material

Chapter 2: Literature Review 20
Reconstruction – returning a place to a known earlier state (distinguished
from restoration by the introduction of new material into the fabric)
Adaptation – modifying a place to suit the existing use or a proposed use
Compatible use – use which respects the cultural significance of a place; such
a use involves no, or minimal, impact on cultural significance.
Of these various ways that heritage-listed buildings may be retained, the most
currently accepted way to maintain a heritage-listed building is in adaptive reuse, as
the finding of a new use for a place “brings new life” to the building and attracts
investors.
In addition to those methods, heritage retrofitting is another technique for preserving
and sustaining the future life of heritage-listed buildings. In the UK context, Grogan
(2012, p.2) notes that “heritage says that anything is possible in retrofitting heritage
buildings, as long as it doesn’t leave a permanent scar”. Based on the company’s
experience of more than 10,000 projects around the world repairing, reconstructing,
refurbishing and restoring buildings, John Turzynski (2013), a director of Arup,
stated that “getting more from existing buildings will benefit users, the community,
the environment, business and the bottom line”.
This research explores some of these major guidelines such as the Conservation
Principles, Policies and Guidance (English Heritage 2008), which have helped to set
out a logical approach to making decisions for the sustainable management of the
historic environment and the Local Development Framework (English Heritage
2005) which introduced a new kind of planning system with more focus on
involvement of the community and other stakeholders, flexibility and early decisions
making in the preparation phase of a project. These guidelines were taken into
consideration in establishing a deeper understanding of well-established principles
and policies to facilitate more effective modelling of the “call for action” guidance.

Chapter 2: Literature Review 21
2.5.3. Economic benefits of heritage sites
Maintaining historical places has become crucial (Smith 2005) and historic
preservation has started to play an important role in the overall construction
landscape. Positive global trends towards greater public awareness of, and support
for, heritage-driven developments have been shown in many capital cities including
recently in London. Since 1999, 68% of buildings at risk in London have been saved
(English Heritage 2011).
The public interest in historic building preservation is now highly recognised.
According to Tyler et al. (2009, p.189), ideas are changing; they claim that “there are
currently more projects involving the adaptive use of older buildings than there are
new construction projects”. This supports the growing perception that the relative
cost of preserving a heritage building as a multi-valuable resource is sometimes more
economic and sustainable than engaging in new construction (Maeer and Fawcett
2011; Rypkema 2001; Wilkinson, James and Reed 2009).
Adaptive reuse is “the modification of a heritage place to a new use which conserves
in heritage value” stated by Vine (2012, p.4). Kumarasuriyar and Nielsen (2012)
state that adaptive reuse “allows a heritage property to be used for purposes other
than original designed for”. This view is supported by Bullen and Love (2010) who
note that “adaptive reuse can enable buildings to accommodate the changes that
revolve around shifting economic, environmental and social patterns”. The decision-
making process around adaptive reuse is based on the consideration of four criteria:
environmental, economic, social and governance. The decision-making process is
shown in Figure 2.4 (Bullen and Love 2010).

Chapter 2: Literature Review 22
Figure 2.4: Model of decision making process in adaptive reuse (Bullen and Love (2010, p.222)
Guidelines for the adaptation/adaptive reuse of historic buildings and sites prepared
by NSW Heritage Office and the Australian Institute of Architects (formerly the
Royal Australian Institute of Architects) NSW branch demonstrate a vision of
heritage places in a new context, meaning that now the appropriate use for a heritage
place is recognised as a critical issue (Heritage Council of New South Wales and The
Royal Australian Institute of Architects 2008).

Chapter 2: Literature Review 23
Tourism plays an important role in the Australian economy. According to the
Australian Bureau of Statistics (2015) “Of Australia's 2.8 million international
cultural and heritage visitors in 2012, 58% reported visiting a museum or art gallery
and 57% had visited historical/heritage buildings, sites or monuments.” Furthermore,
the Australian Bureau of Statistics (2013b, p.5) states that “tourism grew faster than
the total of the economy last financial year, contributing over $112 million dollars a
day to the Australian economy”. Following extremely positive statistics in 2012,
2013 recorded further progress in strong tourism growth. Moreover, tourism
outpaced the growth of industries such as agriculture, mining and manufacturing
(Australian Bureau of Statistics 2013a).
In Australia, there is a close relationship between tourism and cultural heritage
management (McKercher, Ho and Cros 2005) and gaining an understanding of
tourist behaviour is an important element in the management of heritage sites (Poria,
Butler and Airey 2003). This relationship is a good reason for utilising better
stakeholder management to ensure that the views of all stakeholders, including
tourists and tour agencies, are incorporated in making decisions on heritage projects.
2.6. Challenges to retaining heritage-listed buildings
Development and redevelopment are an unavoidable necessity within the world’s
heritage cities, and on many occasions significant heritage sites have come under
severe pressure from a number of directions (Rypkema 1990). The World Heritage
Committee (Australia) in its List of World Heritage in Danger identifies
development projects in the first place amongst the three most prevalent threats to
heritage preservation (Department of Sustainability Environment Water Population
and Communities 2012b). The problem is still current, and is seriously affecting the
Australian refurbishment sector.
The Royal Institute of British Architects (RIBA) reported that “any conservation
project over £10,000 was likely to require an extension of time” (cited in Reyes and
Mansfield (2001, p.243). Plans even when developed to the pre-contract stage can
often be re-arranged, particularly in terms of altering specifications, durations and
cost. However, conservation projects have more technical and economic risks than
new build projects and so some authors observe that generally it is poor leadership

Chapter 2: Literature Review 24
and lack of compliance with procedural systems that are amongst the major causes of
unsuccessful building maintenance and refurbishment (Dann and Cantell 2007;
Forster and Kayan 2009; University of the West of England 2003). The lack of
conservation literature in the field of facilities and maintenance management has
been identified as a problem (Dann and Wood 2004). This evidence indicates that
another type of project management needs to be created to ensure successful
achievement for future conservation projects.
Dan and Wood (2004) ascertained that in the maintenance management processes,
there is insufficient recognition that maintenance management has to be organised
differently accordingly to the situation. Zwikael and Smyrk (2011, p.88),
commenting on project execution, observed that “because projects are not repeated,
everyone who is involved faces uncharted territory”.
In the Canadian province of Ontario, hundreds of historical buildings have been
demolished over the past decade. The reason for the destruction of the traditional
urban fabric as argued by owners, bankers and developers is that adapting and
refurbishing the historical buildings would cost considerably more than developing
new constructions (Shipley, Utz and Parsons 2006). Despite the preference for many
members of the 26 to live in older traditional buildings, there are many physical and
administrative complications involved with marketing, developing and implementing
heritage construction projects.
2.7. Project management
The current concept of project management as a professional discipline and as an
operational control system began in the early 1960s, instigated predominantly by
businesses resulting from seeing the perceived advantages of organised work around
projects. From 1960 till the present, there have been numerous modified frameworks
developed to handle projects for various types of buildings. The major ones
identified during the conduct of this research are as follows. The Logical Framework
(LFA) was developed in 1969 for the US Agency for International Development by
Leon J. Rosenberg. LFA methodology operates around several major principles (Sida
Civil Society Center 2006) and one such principle relevant in this research is that
many different stakeholders working together for common goals tend to be essential

Chapter 2: Literature Review 25
in an effective planning process. Projects in a Controlled Environment (PRINCE 2),
now subtitled ‘Towards Managing Successful Projects’ (OGH 2011), is used
extensively by the UK Government on a wide range of publically funded projects.
The Commonwealth Government in Australia and most State Governments have
adopted this system. In Queensland, the government adopted the PRINCE2
methodology to accomplish more effective governance and risk management of its
capital projects (Crawford and Helm 2009). The Project Management Institute (PMI)
published the Project Management Body of Knowledge (PMBOK) (2008) as a
recognised standard for the project management profession, and widely recognised as
good practice.
The construction industry in the UK uses the RIBA Outline Plan of Work as a model
framework for managing projects and basic office procedures (RIBA 2000). In the
UK, the outline plan is widely recognised as a model for managing heritage-listed
projects (RIBA 2013).
2.7.1. Project success and project performance success measures
A popular indicator of the basic dimensions of project performance success measures
is the simple model known as the “iron triangle” in which the criteria for project
performance success are measured by achievements against the benchmarks of time,
cost and quality (Haughey 2012). There are various views on the efficacy of the iron
triangle in the literature. One of the emerging theories is that the triangle creates an
unrealistic view of project performance success (Atkinson 1999; Lipovetsky et al.
2002; Toor and Ogunlana 2010). Authors have different views of what the most
effective measures of success outcomes on projects should be; however, there is a
common perception that to be seen as successful, any management framework must
facilitate the delivery of projects on time, on budget and within specified quality
requirements. Suggestions for the successful management of projects indicate that
there is a need to manage projects in an adoptable, flexible and iterative way to
account for changes to be made according to the project progress and taking into
account the environment in which the project resides (Shenhar and Dvir 2007).
Figure 2.5 presents a comprehensive theoretical model of project success measures.

Chapter 2: Literature Review 26
Figure 2.5: Specific project success measures (Shenhar and Dvir (2007, p.27)
Project success, according to Shenhar and Dvir (2007), is grouped under five
dimensions including various sub-measures. The first dimension is project efficiency
which represents the meeting of planned goals. As the present study investigates
project success in meeting time and cost goals, the first project success dimension is
relevant . The second dimension is impact on the customer, which can be viewed as
representing the major stakeholders whose participation is critical to project success.
These two dimensions are most applicable to heritage project.
The basic principles of cost planning are to set a realistic cost target for all parts of
the project (Smith et al. 2004); however, in certain circumstances where accurate
cost information is difficult to obtain this is often not the case, especially in heritage
projects. Moreover, it is believed that a professionally cost managed project has to be
organised not just based on the accuracy of costing but also on the application of
sound project management principles.
Furthermore, it is interesting to note that quality criteria are usually well met in
conservation projects. There may be several reasons for this including the scrutiny
applied by planners and local and national heritage bodies to both the work processes
and final outcomes of heritage buildings, before capital is released or grants finalised
and paid. However, time and budget constraints are often exceeded sometimes by an
astronomical margin.

Chapter 2: Literature Review 27
The disparity in the points of view on project success is noted by Freeman and Beale
(1992, p.8) who state that “an architect may consider success in terms of aesthetic
appearance, an engineer in terms of technical competence, an accountant in terms of
dollars spent under budget, a human resources manager in terms of employee
satisfaction and chief executive officers rate their success in the stock market”.
Because of this range of differing views, there appears to be considerable merit in
utilising the traditional project management model of success measurement which
uses a simple and objective rationale around what represents project success, and this
research generally follows the more traditional iron triangle key factors as its units of
measurement of project success. Professionally managed projects need to be
measured by established project management principles, so that the stakeholders and
project team members involved can make sense of measuring success or determining
when projects are going wrong. Belassi and Tukel (1996) also share the view that to
be successful, projects must be completed within cost, on time and to the desired
level of quality; however, they also stress the critical importance of client
satisfaction.
There are differences between project success measured by the achievement of basic
project objectives and project management success, specifically gauged against
compliance with time, cost, quality and customer satisfaction, that is, the ‘modified’
iron triangle. Another distinction of importance to be acknowledged is the difference
between success criteria which means a set of measures by which success will be
judged and success factors as project inputs which lead to final project success
(Cooke-Davies 2002). Analysing the schedule delay and cost escalation caused by
different factors and comparing these with the project inputs will create realistic
measures for project success.
Because project performance success is not the same as project success—and
because of the input and impact of multiple stakeholders who have an invested
interest to achieve personal benefits through the project—it is difficult to establish
exactly what success in a project actually looks like. Good front-end project planning
and pre-determination of the project goals in the early stage of the project (project
input) can therefore directly impact the project outcomes (Cooke-Davies 2002). In
order to hold these established goals constant, stakeholder management is important.

Chapter 2: Literature Review 28
The inherent quality of a project thus begins at the inception and planning stages of a
project and can be measured through to execution and handover. It is this
achievement through the whole lifecycle of a project that espouses real project
success (Soetanto, Proverbs and Holt 2001).
2.7.2. Factors affecting project success
Project failures may be perceived differently by different stakeholders and each
stakeholder group is likely to enforce their expectations of success on their view of
the project achievements; thus, the determination of relative project failure may also
be difficult. Zwikael and Smyrk (2011, p.249) state:
“Although all of the parameters for a project are clearly stated in the business
case and project plan, additional constraints on the agreed timeframe and budget can
emerge for either of two reasons: 1. During execution, the dates on which milestones
are achieved start to run late, or expenditures attached to each start to exceed the
budget; 2. The funder has arbitrarily reduced the timeframe and/or budget. In either
event, the project becomes infeasible.”
Cleland and Ireland (2010) have identified several failure factors for all types of
infrastructure and construction projects and some of the same listed causes of project
failure also are applicable to heritage building projects. The major failure factors
according to these authors (ibid 2010) are the overruns of cost and schedule, which
are also the major focus of this research project, Nine other factors identified in this
research are specifically observed to impact on heritage listed building projects.
Therefore the major project failure factors and sub-factors identified by Cleland and
Ireland (2010) have been adopted and extended for the purposes of operationalising
this research. Cleland and Ireland (2010, p.3) have described the factors contributing
to project failure as shown in Figure 2.6.

Chapter 2: Literature Review 29
Figure 2.6: Causes of project failures (Cleland and Ireland (2010, p.3)
Time management is the major factor contributing to a large percentage of project
failures, and many refurbishment and reconstruction projects run well over schedule.
However, due to their interconnection, the two dimensions of time and cost are
usually both highly prevalent in the failure of many heritage projects. Therefore,
there is an urgent need for them to be investigated vigorously in the heritage project
performance context as they continue to affect the decision-making around whether
to actually undertake heritage projects or not.
It is widely accepted that poor scope management is one of the leading causes of
project failure (Dumont, Gibson and Fish (1997, p. 54). Moreover, the poor scope
definition can lead to numerous causal relationships during the project. Managing the
scope of heritage projects that contain so many’ unknowns’ is often difficult or even
impossible and so focusing on strategies to ensure the right scope from the beginning
of the project is the major target of this research.
Project Failure – Factors
The project has overrun cost and schedule goals.
The project does not have an appropriate fit with the customer’s mission, objectives, and goals.
The project has failed to meet its technical performance expectations.
The project was permitted to run beyond the point where its results were needed to support the customer’s expectations.
Inadequate management processes were carried out on the project.
A faulty design of the project’s technical performance standards was conducted.
The project stakeholders were unhappy with the progress on the project and/or the results that were obtained.
Top management failed to periodically review and support the project.
Unqualified people served on the project team.
The project met the initial requirements, but did not solve the longer-range business need.

Chapter 2: Literature Review 30
2.8. Stakeholder management
The importance of stakeholders to the planning, developing and executing of
successful projects is well identified by many authors (Bourne and Walker 2005;
Freeman and McVea 2001; Frooman 2010; Newcombe 2003).
Since the emergence of the earliest project management theories and methodologies,
the concept of the ‘project stakeholder’ arose out of the results of pioneering work
undertaken at the Stanford Research Institute (today SRI International). Since then,
the definition of stakeholders has been revised in both orientation and definition
many times since it was first introduced (Freeman and McVea 2001). Currently, the
process of stakeholder management is applied to the briefing and planning stages of
most large-scale or complex building projects. An important part of stakeholder
management is stakeholder analysis that, since its inception, has increased the project
manager’s ability to anticipate and properly identify problems emanating from the
actions of, and that will impact on, involved stakeholders while it is still early
enough to intervene, and review and change plans (Jepsen and Eskerod 2009).
Bourne (2005) notes that effectively focused stakeholder management aims at
improving the perception of project success and involves identifying the key
stakeholders of the project and developing appropriate stakeholder communication
through the vehicle of the project management team.
2.8.1. Stakeholder influence on project
The stakeholder involvement in, and impact on, a project can be of differing
intensity, ranking from the informative level to the decision making level. The
stakeholders of highest influence and highest interest on the project are most critical
to the project success; however, the levels of influence and interest can change over
time so managing the stakeholders is a constantly changing and dynamic process.
This research adopts the model shown in figure 2.7 to address the levels of
influence/power in relation to the stakeholder interest in heritage projects.

Chapter 2: Literature Review 31
Figure 2.7: Stakeholder map (Eden and Ackermann 1998) (Source:
http://stakeholdermap.com/stakeholder-analysis.html)
In addition to establishing the overall power or influence and interest of identified
stakeholders, it is also necessary in the project performance context to ascertain the
degree of stakeholder influence using a scale based on the use of possible tools,
processes and instruments that are going to be used. The relationship between what
to measure and how to measure it is shown in Table 2.2.

Chapter 2: Literature Review 32
Table 2.2: Stakeholder degrees of influence Source: Nagothu et al. (2009, p.7)
Degree of influence according to the scale
Possible tools, processes and instruments to be used
1. Stakeholders are informed – they remain passive
Folders, brochures, newsletters, advertisement, reports, exhibitions, internet
2. Stakeholders are consulted Workshops, focus group meetings, internet questionnaires
3. Stakeholders give advice Advisory panels consisting of stakeholders, interactive sessions, internet discussion
4. Stake holders become co-producers Stakeholder panel meetings, internet discussions Organizing workshops, create a common ground for discussion, for example, joint scenario development
5. Stakeholders not only produce solutions but also decide about them
Joint working groups that decide about implementation for solutions
Different types of stakeholder classifications, as well as different definitions of
stakeholder impact, exist in the stakeholder literature. Furthermore, various
frameworks have been identified for accomplishing successful stakeholder
relationship/management (Bourne and Walker 2005; Frooman 1999; Olander 2007;
Yang et al. 2010).
The stakeholder management factor ranking for heritage building projects will
contribute to better understanding of stakeholder management priorities and the
impact of those factors to the project performance, and moreover the improvement of
outcomes of overall projects.
2.8.2. Managing multiple stakeholders
It is important to interconnect all the stakeholders in order for them to work
cohesively towards facilitating common and mutually satisfying goals in order to
ensure a high degree of project success. The complexity of the conservation process

Chapter 2: Literature Review 33
and having a number of stakeholders engaged often leads to there being several
different objectives and requirements, which brings about conflicts (Alallafa and
Torreb 2010). Figure 2.8 presents the crucial problem inherent in conservation
projects when multiple stakeholders are involved.
Figure 2.8: Multiple stakeholder models in conservation projects (Alallafa and Torreb (2010, p.6)
The fact of the different objectives and requirements raised by the various
stakeholders and their different levels of involvement leads to a need to identify
conflicts and often results in a need for restructuring of the requirements.
Furthermore, as projects involve a wide array of stakeholders (Aaltonen 2011;
Olander and Landin 2005) it must be emphasised that project management decisions
made during the different phases of the project lifecycle are directly influenced by
stakeholders (Aaltonen and Kujala 2010). As Aaltonen and Kujala (2010, p. 381)
state, projects “are affected by multiple stakeholders with differing interests and
demands”. Moreover, it is noted that stakeholders “are the major source of
uncertainty in projects” (Ward and Chapman (2008). Therefore, robust and

Chapter 2: Literature Review 34
meaningful stakeholder management is a crucial element of managing projects
successfully.
Aligning with the views of Ward and Chapman (2008), in the area of stakeholder
management in conservation projects, various aims and goals can negatively affect
project delivery. Therefore, coordination among various stakeholders in the design
and construction phases and in the supervision of these phases is significant in
ensuring project success. However, this assumes that the stakeholders most closely
involved with planning and delivery of the projects, have the specialised
competencies to effectively undertake these duties and processes. The problem of the
lack of skills among the various stakeholders in conservation projects has been noted
by Alallaf and Toreb (2010, p. 2) who observe that:
“Recent studies confirm that capturing manageable documentation is
especially important in large-complex activities because the framework in
which key decisions are made will be misplaced when different actors are
engaged indifferent aspects of the conservation process; critical mistakes
are commonly made in formulation and resolution of decisions, but they are
often unnoticed in the absence of comprehensive managed documentation;
in the absence of reliable documentation, work groups engage in repetitive
discussion and resolution of the same issues; and key decisions are often
misunderstood and misinterpreted when stakeholders with conflicting skill,
perspective and viewpoints are involved. Indecision-making process, most
stakeholders have a misunderstanding of the technical problem of used tool
type and what results from such restriction.”
2.8.3. Australian – Needs for Stakeholders’ Expertise
The skill levels and specialist knowledge capabilities of those stakeholders engaged
in planning, designing and building heritage projects, especially concerning the
materials and procedures that need to be strictly followed has been identified in the
literature as an issue. Many of the “old” skills have been lost and the emphasis is on
the trades to be able to satisfy the appropriate level of preparation and execution
work required on most unique heritage buildings and places. This problem of the
lack of required skills and knowledge has been recognised and reported by the
Australian State and Environmental Committee in 2011.

Chapter 2: Literature Review 35
Figure 2.9 presents a summary of the perceived lack of skills and expertise of
specialists in historic heritage conservation according to the Australian State of the
Environment Committee (2011).
Figure 2.9: Historic heritage, lack of skills and expertise (Australian State of the
Environment Committee (2011, p. 741)
There is a clear and urgent need to investigate this lack of skills and knowledge in
the heritage buildings field. Therefore in order to ensure that the heritage projects
will be able to procure the right skills there is a need for the correct skills set to be
identified and introduced when planning heritage projects to facilitate the effective
management procedures in executing such projects.
According to the Australian State of the Environment Committee (2011, p. 745), this
lack of leadership comes about “partly through statutory limitations on the role of the

Chapter 2: Literature Review 36
Australian Heritage Council, and partly through diminution of resources and
responsibilities and, in a conceptual sense, from the absence of a national heritage
strategy”. Underlying the challenges facing the management of stakeholders in
heritage projects is a lack of leadership at a national level. Therefore, better
stakeholder management becomes the issue of interest.
2.9. Discussion
As shown, this research investigates the factors affecting project failures that are
prevalent in the two project management stages planning/design and
execution/construction of construction projects in general and heritage-listed projects
in particular. The present study investigates the challenges in heritage projects with a
view to validating these and developing set of recommendations/guidance for
improving the project performance and delivery outcomes in heritage projects. Also
of importance in the research is a need to identify and evaluate the contribution and
importance of stakeholder roles in the planning/design and execution/construction
stages of heritage projects, in order to ascertain if specific and specialised
management is possible for achievement of better project performance outcomes.
Therefore based on the extensive literature review in the project challenges the
present research seeks to address the following questions:
RQ1. What are the main challenges that form the key reasons and make the decision
on retaining existing heritage places?
RQ2. What are the challenges (and causes of the challenges) in complying with
policies and procedures that affect the management and delivery of heritage projects?
RQ3. How can the project management process be improved for more effective
management in the operation and delivery of heritage building projects?

Chapter 2: Literature Review 37
2.10. Summary
This chapter documented the instruments and approaches to maintaining heritage-
listed buildings in recognition of the value of these buildings to local communities
and their histories (Peacock and Rizzo 2008). However, like all construction projects,
heritage projects are often affected by problems such as running over time and over
budget.
Based on a review of the literature, the research objectives that form the research
question can be summarised as follows: the current project management framework
has been criticised by the research community and it is essential to develop new
models and theories based on the dominant areas of concern and project management
lifecycle model stages (Winter et al. 2006). Furthermore few, or indeed any, studies
have previously been conducted to explore the specific project management and
stakeholder issues that contribute to failed elements (time and cost) of heritage
projects. It is also important to evaluate current maintenance procedures and current
project management strategies (Carmichael 2004; Gambles 2009; Hill 2010;
Meredith and Mantel 2011; Phelps, Ashworth and Johansson 2002; Sommer 2010) as
well as identifying the challenges impacting on the management of design and
execution.
The identified research gap further relates to the research problem, that is, despite the
results from previous research studies that have been utilised to provide solutions to
improve the management of projects, many such projects are in fact still running
over time and therefore over budget. It has been estimated that 85% of projects fail to
meet delivery goals (Shenhar and Dvir 2007).
Therefore the three research objectives have been drawn from the gap in the research
and the stated problems. The research objectives are addressed by investigating the
challenges in heritage projects while investigating the stakeholder management as a
base for the development of guidance to improve the current policy and procedures
and practices to make a contribution to the successful execution of future heritage
projects. Having reviewed the literature and contextualised the research question, the
next chapter analyses the applicability of the methodology to ensure that the research
question is answered in the most appropriate way.

Chapter 2: Literature Review 38

Chapter 3: Research Design and Method 39
Chapter 3
RESEARCH DESIGN AND METHOD
Divide a problem into as many parts as necessary to attack it in the best way, and start an analysis by examining the simplest and most easily understood parts before ascending gradually to an understanding of the most complex.
Descartes in Kasi (2009, p.12 )
3.1. Introduction
In Chapter 2, the main focus was on project challenges and the major gaps in the
literature and thus the weaker or missing elements in heritage project management
were identified. This chapter deals with the critical methodological foundation for
achievement of a successful outcome in the research project. The research
methodology consists of three basic elements (Crotty 1998; Sarantakos 2005).
Firstly, positioning the study within an appropriate research paradigm is
fundamental. Secondly, the choice of research paradigm governs the selection of a
suitable research approach. Thirdly, the chosen research approach directs the
selection of the research method, that is, the data collection and the analytical
method.
The chapter begins with a restating of the research questions and provides an
introduction to the phenomenon under study in this research project by locating it
against the most relevant research paradigm and focusing on using the best and most
relevant philosophical approach most likely to collect the required data for validation
purposes. The research approach is described (Section 3.3) and the proposed research
method is outlined (Section 3.4). The overall research strategy is defined according
to the methodology. A summary of the estimated activity resources is presented
(Section 3.5).
3.2. Research Paradigm and Philosophy
The undertaking of any research begins by describing a phenomenon (Groenewald
2004). Krauss (2005, p. 760) notes that “the phenomenon of multiple realities exist
[so] conducting research without taking this into account violates their fundamental

Chapter 3: Research Design and Method 40
view of the individual”. Hatch and Cunliffe (2006) highlight that observing the same
phenomenon from different physiological perspectives may lead to different kinds of
knowledge.
There are two major philosophical approaches to research, namely, subjective or
objective approaches concerning ontology (reality), epistemology (knowledge),
human nature and methodology. Figure 3.1 presents the scheme for analysing the
assumptions reflected in the paradigms (Burrell and Morgan 1979).
Figure 3.1: Scheme for analysing assumptions reflected in the paradigms (Burrell and Morgan 1979)
There are many perspectives surrounding reality (ontology) and knowledge
(epistemology). Such debate is unlikely to end in any philosophical solution, as there
is no right or wrong philosophical stance (Holden and Lynch 2004). There are many
conflicting definitions and connotations that lead into “conceptual quicksand” rather
than a sense of understanding (Nord and Connell 1993). Furthermore, Connell and
Nord (1996, p. 12) argue that “if reality is external and unknown to humans, then
how do we accumulate knowledge regarding it? and… if we are accumulating
knowledge about it, how do we know that we are doing it?” Therefore, this way of

Chapter 3: Research Design and Method 41
understanding reality does not require any further philosophical debate because the
nature of existence cannot be correctly or definitively positioned.
Table 3.1 presents a summary of the various paradigms identified by Sarantakos
(1998), which are widely accepted by Australian and international scientists. The
positivist, critical and interpretative paradigms are discussed in detail below.
Table 3.1: Research paradigms (Sarantakos 1998)
POSITIVISTIC INTERPRETATIVE CRITICAL
Positivism
Neo-positivism
Methodological positivism
Logical positivism
Symbolic interactionism
Phenomenology
Ethnomethodology
Hermeneutics
Psychoanalysis
Ethnology
Ethnography
Sociolinguistics
Critical sociology
Conflict school of thought
Marxism
Feminism
Utilising the most appropriate philosophical approach presented in Figure 3.1 and the
relevant research paradigm presented in a Table 3.1 facilitates the researcher to
associate the correct relationship between the research questions and objectives
(Cohen, Manion and Morrison 2011). Therefore the positivist quantitative paradigm
and the qualitative interpretative research paradigm represent the core of the mixed
methods approach applied to this research (Creswell 2009).
3.3. Research context – Literature Review
As established in the literature review in Chapter 2, the need to preserve the aesthetic
quality of heritage buildings and their outstanding universal value is emerging as a
task of high importance (Mason 2005; Provins et al. 2008; Roders and Oers 2011).
Coupled with this is the evaluative notion that most projects fail to meet their goals
(Shenhar and Dvir 2007) such as time, cost and quality. Figure 3.2 shows the
estimate activity resources in the literature review step (involving the inputs, tools
and techniques, and outputs) as set out in the PMBOK.

Chapter 3: Research Design and Method 42
Figure 3.2: Estimate activity resources – Literature Review – Input, Tools & Techniques, and Outputs (adopted from PMBOK)
If heritage projects are already problematic in terms of meeting time and cost
impositions, then the fact that conventional project management frameworks are
failing to deliver in other types of projects underpins the need for a fresh look at
current systems and for the development of specific systems/guidance to assure
better outcomes in heritage projects. Issues with current project management
methodologies are addressed and criticised by the research community (Zwikael
and Smyrk 2011, p. 11).
The present study seeks to explore the following questions:
RQ1. What are the main challenges that form the key reasons and make the decision
on retaining existing heritage places?
RQ2. What are the challenges (and their causes) in complying with policies and
procedures that affect the management and delivery of heritage projects?
RQ3. How can the project management process be improved for more effective
management in the operation and delivery of heritage building projects?
According to Yin (2009), selecting the appropriate research method requires three
factors to be considered. The first and second research questions in this study are
‘what’ types of questions, which possess an exploratory purpose so the most
appropriate matching methods are survey and archival analysis. The third question is
a ‘how’ type and this has a descriptive purpose for which the appropriate method is a
case study (Yin (2009). These factors and the matching methods are described in
Figure 3.3.

Chapter 3: Research Design and Method 43
Figure 3.3: Form of research question matching the appropriate method (Yin (2009, p. 8)
Every research method has its strengths and weaknesses; therefore, a main priority in
determining the most appropriate research method (Fellows and Liu 2003) is to
ensure that the identified research questions operationalising the overriding research
problem and aims are explored and the research objectives are significantly reached.
The methods utilised in this research were case studies (involving participant
observation, document reviews and interviews) and a survey of the broad population
of stakeholders involved in heritage projects or with knowledge of the
field/discipline. This means that both qualitative and quantitative methods can be
employed. The data and concept validation were provided by focus group discussion.
Statistical techniques were used for analysis quantitative data and specialist data
coding software was used for dealing with qualitative data. Using this mixed
methodological approach, results were triangulated in order to validate the findings
from the data collection. The benefits of using a mixed-methods approach is
described in the following section.
3.4. The mixed-methods approach
Defining an appropriate research approach and research method to answer specific
research questions has a base in the research philosophy and paradigm. Established
research methods define the ways of collecting and analysing data. According to Yin

Chapter 3: Research Design and Method 44
(2011), the validity of the collected evidence is summarised in three principles:
triangulation, maintaining the chain of evidence, and creating a database.
Research approaches are commonly categorised into either a qualitative
(explanatory) or quantitative (verifying) approach (Creswell 2009; Neuman 2006).
This research project used a combination of qualitative and quantitative
methodologies to ensure multiple sources of evidence and therefore the results are
likely to be more accurate, valid and reliable. A qualitative research approach such as
an interpretative enquiry methodology has verification as categorised by Creswell
(2009). Figure 3.4 indicates in a parallel alignment the qualitative and quantitative
research characteristics.
Figure 3.4: Research approaches (ECDC and University of Chester (2009, p.15)
While the qualitative methods will generate subjective hypotheses, the quantitative
methods will test the hypotheses objectively. To produce a high quality guidance,
this research required both measures. The rationale for both measures is further
elaborated upon below.

Chapter 3: Research Design and Method 45
3.4.1. Benefits of applying qualitative research approach
The primary approaches to qualitative research are classified by Hesse-Biber and
Leavy (2010) under three categories: post-positivist, interpretative, and critical. The
interpretative approaches that focus on the interpretations and understandings of
social meaning are found to be appropriate for this research. Lythcott and Duschl
Krauss (2005, p. 760) acknowledged that:
In general, qualitative research is based on a relativistic, constructivist
ontology that posits that there is no objective reality. Rather, there are
multiple realities constructed by human beings who experience a
phenomenon of interest. People impose order on the world perceived in an
effort to construct meaning; meaning lies in cognition not in elements
external to us; information impinging on our cognitive systems is screened,
translated, altered, perhaps rejected by the knowledge that already exists in
that system; the resulting knowledge is idiosyncratic and is purposefully
constructed.
However, qualitative research involves the evaluation of people’s experiences,
feelings, social interactions, and the data gathered from this type of methodology will
be varied and needs filtering and sorting, so that the required information can be
prepared for analyses (Fellows and Liu 2003). Table 3.2 sets out the strengths and
weaknesses of qualitative research.

Chapter 3: Research Design and Method 46
Table 3.2: Strengths and weaknesses of qualitative research (Johnson and Onwuegbuzie (2004, p. 20)
Assessing the appropriateness of this method by fully considering all the advantages
and disadvantages listed in the table above is discussed in more detail in the case
study Chapter 3 and additionally supports the usefulness of the employed method for
this research project within document analysis, interviews and observations.
3.4.2. Benefits of applying a quantitative research approach
Applying a quantitative research approach will help measure the patterns with
numbers (Rudestam and Newton 2007), as the quantitative approach seeks to gather
factual data and to scrutinise or explore relationships between facts and how those
relationships concur with the theories (Fellows and Liu 2003).
The quantitative research approach is a realist view of science. For realism,
knowledge is a social and historical product. ‘Facts’ are theory-laden (Robson 2011)
and realism is particularly appropriate for practice-based research. In the realist view,
the task of science is to invent theories to explain the real world. The real world is
stratified into different layers (individual, group and institutional, and societal
levels). As heritage architectural management involves many stakeholders (some
aligned and some in conflict), and as the methodology of identifying, evaluating and
managing stakeholders is often based on a more qualitative approach, the use of
some quantitative assessment is appropriate to balance the realism of the research.

Chapter 3: Research Design and Method 47
The advantages and disadvantages of qualitative research are listed in Table 3.3. The
appropriateness of quantitative research to be employed in this research project is
discussed in more detail in Chapter 3.
Table 3.3: Strengths and weaknesses of quantitative research (Johnson and Onwuegbuzie (2004)
The applicability of this method by considering the advantages and disadvantages
listed in a table above is discussed in more detail in relation to the survey (Chapter 3)
which additionally supports the usefulness of the employed method for this research
project.
3.5. The mixed-method approach and how this is enriched by use of an
architectural research sense
The basic methodology for this research as stated above is based on a combined
qualitative and quantitative approach and enriched with a specific architectural

Chapter 3: Research Design and Method 48
research sense. In the architectural research process, as shown in Figure 3.5 (Groat
and Wang 2002) the researcher looks in two directions. On one side is a research
question and the other side is an audience in expectation of receiving the research
results. Two bodies of literature are also depicted and it is obvious that the research
literature contributes to every phase of the research process.
Figure 3.5: Overall diagrammatic of an architectural research project (Groat and Wang (2002, p.48)
On one side, the present study focuses on the real-world problem in construction
projects running over time and over budget (not just heritage projects as previously
stated), and from the other side the study looks for the gaps in the literature and aims
to fill the gaps and make a contribution for the future heritage projects which is
expected by the audience (general public and professionals). With the employment of
the mixed-method approach to investigate project failure and produce guidance, the
research has been led by experienced project practitioners to produce a useful
outcome of this investigation.
3.6. Research Methods
This section justifies the research methods to be employed to answer the three
research questions. Furthermore, the research design guides the researcher to use the
specific methods of collecting and analysing data (Too 2009). Using the mixed-
method technique, this research attempts to overcome some of the main weaknesses

Chapter 3: Research Design and Method 49
of single methodologies (outlined in Tables 3.2 and 3.3) of both the qualitative and
quantitative research methods. The mixed methodology and research paradigm
(positivist quantitative and qualitative interpretative) allow the researcher to use and
evaluate a smaller sample (focus group and case studies), in order to understand the
view of a larger group of people (survey).
Figure 3.6 presents the research design including the research background and
research paradigms, the methodologies, methods, data collection, data analysis, and
the results and validation.

Chapter 3: Research Design and Method 50
Methodology
Method
Data Collection
Data Analysis
Figure 3.6: Research design
Case studies
* Document analysis
* Interviews
* Observation
Research Paradigm
Positivism and Interpretivism
QSR NVivo
Research approach
Qualitative ‐ Inductive
Research approach
Quantitative ‐ Deductive
Survey
* Questionnaire
Data Interpretation and Examination of the results
* Focus group
Validation
* Interviews
QSR NVivo
SPSS version 21
Stata 13

Chapter 3: Research Design and Method 51
3.6.1. Rationale and design of the survey
As noted by Fellows and Liu (2008), the main objective of the survey as a
quantitative research method is to collect valid and consistent data from
representative patterns and respondents. Kasi defines a survey (2009, p.301) as “an
observation study that generally has a cross-sectional design or a commonly used
design to collect opinions”. The survey questionnaire (Fairfax County Department of
Neighborhood and Community Services 2012) is designed for the population to be
sampled, maximising responses and minimising errors. The advantages and
limitations of web questionnaires are (Kalantari, Kalantari and Maleki (2011, p.938):
The possibility of checking the answers with warnings and prevention of
illogical and out-of-framework results
Simplicity, visual attraction, and homogeneity in answering and speed
Suitable for large and various groups and for long-term surveys such as rate
of a website users’ satisfaction.
Figure 3.7 shows the estimate activity resources in the survey (involving the inputs,
tools and techniques, and outputs).
Figure 3.7: Estimate activity resources – Survey – Input, Tools & Techniques, and Outputs (adopted from PMBOK)
Applicability of chosen data collection method to this research project
Collecting data for this research project using a questionnaire (online survey)
allowed the researcher to gather information about the challenges facing heritage
projects all over Australia. The online pilot survey was distributed for validation of
the findings (from the literature review and one of the case studies) to 13 respondents
selected one from each of the stakeholder representatives and the accepted comments
from the representative of each targeted stakeholder (internal and external) made a

Chapter 3: Research Design and Method 52
valid and reliable survey to be broadly distributed and to canvas a broad range of
responses, and therefore to get a more complete picture of existing problems related
to delays in heritage building projects.
Piloting the survey with 13 respondents narrowed the challenges and extended the
questionnaire in order to facilitate discovery of the real-time project problems that
had not been identified through the literature review and preliminary case study.
Furthermore, the online survey enabled more than one user to answer the survey
questions. It was very important to enable the owners of heritage buildings (mostly
external project stakeholders) with no access to a personal computer to be able to
participate in the online survey to share experienced challenges. This ability was
recognised as an important factor especially for smaller places and towns where a
large proportion of the population shares a public computer in their heritage
organisation and/or libraries.
To collect data of interest, the online survey was divided between two identified
project stakeholder sample groups: external and internal. The sampled groups are
listed in detail in Section 4.2. The data collected from external and internal project
stakeholders across Australia enabled the researcher to evaluate the findings within
each state and to make relations to the existing challenges across the country.
3.6.2. Rationale and design of the case study
Case study approaches “facilitate in-depth investigation of particular instance of a
phenomenon” (Fellows and Liu (2003, p.110). According to Yin (2008), case studies
can be single or multiple case studies, and mapped with exploratory, explanatory and
descriptive studies. Figure 3.8 summarises the inputs, tools and techniques and
outputs of a case study.
Figure 3.8: Estimate activity resources – Case Study – Inputs, Tools & Techniques, and Outputs (adopted from PMBOK)

Chapter 3: Research Design and Method 53
Six sources of evidence are used in a case study: documentation, archival records,
direct observation, participant observation, physical artefacts and interviews. Figure
3.9 (Yin 2008) illustrates the convergence and non-convergence of multiple sources
of evidence.
Figure 3.9: Convergence and no convergence of multiple sources of evidence (Yin (2008, p.117)
As shown in Figure 3.10, the scheme of the convergence of evidence has been
applied for this research. Furthermore, the results have been analysed through the
cross-case study table and the interview highlights have been combined in a survey
model to achieve the maximum convergence of evidence. Figure 3.10 describes the
strengths and weaknesses of each source of evidence.

Chapter 3: Research Design and Method 54
Figure 3.10: Strengths and weaknesses of six sources of evidence (Yin (2008, p. 102)
The weaknesses of the case study method have been discussed by many researchers.
Abercrombie, Hill and Turner (1984, p. 34) define a case study as a “detailed
examination of the single example of a class of phenomena” and state that a case
study “cannot provide reliable information about the broader class, but it may be
useful in the preliminary stages of an investigation since it provides hypotheses,
which may be tested systematically with a larger number of cases”. To overcome this
weakness, this research first investigated the documentation of the project and
enriched the data obtained by following up with the interview questions.
Furthermore, through use of a further two ongoing cases, this research was able to

Chapter 3: Research Design and Method 55
closely investigate the challenges and the causes of the project time and budget
overruns.
Johnson and Onwuegbuzie (2004) noted that the weaknesses of the case study
include: difficulties in testing the hypotheses and theory; the findings are unique to
relatively few people; the conduct of case studies is time consuming; and the results
are likely to be influenced by the researcher. However, they (ibid 2004) also pointed
out the following strengths of the case study method: useful to study complex
phenomena; provides individual case information; and deep case study analysis
allows the researcher to describe the phenomena in rich detail, and enables the
researcher to determine and describe in rich detail the causes of the particular event.
The case study as a chosen method for this research employed the following data
collection methods:
(a) Document analysis
A document analysis is used in combination with the other qualitative methods as a
combined methodology to study same phenomenon (Bowen 2009). A document
contains text such as: minutes of meetings, agendas, letters, emails, newspapers,
tender documentation, and DVD format containing pictures that have been recorded.
As an analytical qualitative method, according to Bowen (2009, p.27), document
analysis is “a systematic procedure for reviewing or evaluating documents – both
printed and electronic material”. Document analysis is commonly used for the
systematic evaluation of a study, usually in combination with other qualitative
methods in triangulation. One of the two key objectives of the document review is to
identify documents relevant to the subject matter and to ensure that valuable
information to support the case is not missed.
Applicability of chosen data collection method to this research project
Document analysis is a systematic procedure to identify, analyse and derive useful
information from project documents. This research used document analysis as a
method to identify the actual scenario of the case study. In this research, the
document analysis took on the following form:
First, to verify the findings from the literature review and corroborate the
evidence to compare within the case study and cross-case analysis.

Chapter 3: Research Design and Method 56
Second, information gathered from documents regarding the projects to be
observed (e.g. project schedule notice of likely delay, followed by the new
schedule)
Third, following the project within the context in which the stakeholders
operate (e.g. examining the information flow and stakeholder relationship
such as changes of duty).
The resourced that has been used as a documentation analysis were predominantly
from the organizational files achieves enriched with online sites (government) and
library files such as photo documentation. Also, the documentation was found in
historical society offices and its online sites. In analysing the documents, extracting
the targeted information of the project failures enabled the researcher to make a
relation between happenings and causes.
(b) Interview
The interview is another important source of information and is used “widely to
supplement and extend our knowledge about individual thoughts, interpretations,
feelings and behaviour” And there are three types of case study interviews (Yin
(2008): in-depth interviews, focused interviews, and structured questions. Overall,
interviews are an essential source of data collection. In the research cycle, the
questions have been asked, the answers have been given and at the end the answer is
going to be questioned (ECDC and University of Chester 2009).
Applicability of chosen data collection method to this research project
The semi-structured mode of interviews was used for this project to provide the
opportunity to ask follow-up questions to the participants, allowing them to express
themselves. The involvement of key informants is critical to successful research. The
project stakeholders (discussed in detail in Chapter 5) were carefully selected for
interviews. Asking the same questions of each of the stakeholders to get the view of
an issue and/or project requirements from different perspectives was the target. It
enables the researcher to analyse the stakeholder’s perspective on the identified
challenge.

Chapter 3: Research Design and Method 57
This research project opened the opportunity to the survey respondents to further
discuss their experience either as external or internal project stakeholders. Therefore,
two different sets of interview questions were designed.
(c) Observation
As an ethnographic research method, the observation method is used to study people
in their environment to understand issues from their perspective (Baker 2006).
Observation is categorised differently as a research method or as a data collection
method. Research fields that use the observation method are anthropology and
sociology, with sociology being described as the scientific study of human social
behaviour. According to Giddens (1989) and Livesey (2005), sociology is a study of
human social life, groups and societies.
The changes in an environment (e.g. urban development) have a reflection in social
beings and social life. Serageldin (1999, p.241) points out that “many of us will not
visit any of the sites on the World Heritage List. But we would feel impoverished to
know of the loss of such sites and feel enriched by their continuing existence, even if
we never visit them”. The Australian Heritage Commission defines the methods for
heritage professionals for understanding a social value of the place as “ask, listen and
observe”. The observation method is defined by Johnston (Johnston 1992) as “the
ways in which people use a place to provide a basis for identifying places that may
have special meaning”. The most appropriate method for this research to follow is
the role of the observer as participant. Adler and Adler (1994, p. 380) advocate this
role which allows the researcher to remain “strongly research oriented” and “not to
cross into a friendship domain” with the insiders of the case study.
Bade (2011, p.73) states that participant observation “provides a context for research
and allows the researcher to experience the place which is being studied”. It means
that the information generated from observation can be used to translate the actual
event from the researcher lens. Furthermore, the findings can be used to validate
information from document analysis and interviews.
Applicability of chosen data collection method to this research project
The validity of the place is often a sensitive subject to be touched on by others, but is
highly prevalent in the heritage context. Assessing a place in terms of to whom and

Chapter 3: Research Design and Method 58
how important it is needs to be explored within the social purpose of conserving
heritage places.
Participant observation data collection techniques allow a researcher to observe
intimately the everyday life and the world view of participants who are involved to
varying degrees in heritage work and heritage projects. Baker (2006) states that the
observation roles of researchers include: complete observer, observer as participant,
participant as observer, non-participation, moderate membership and complete
membership.
3.6.3. Rationale and design of the focus group
Focus groups are an accepted method among sociologists for gathering qualitative
data and are used in a wide range of applied research areas. Focus groups are usually
used as a self-contained method (as applied for this research) but also in combination
with surveys and in-depth interviews (Morgan 1996). Powell and Single (1996,
p.499) define a focus group as “a group of individuals selected and assembled by
researchers to discuss and comment on, from personal experience, the topic that is
the subject of the research”. Figure 3.11 summarises the inputs, tools and techniques
and outputs of the focus group.
Figure 3.11: Estimate activity resources – Focus Group – Inputs, Tools & Techniques, and Outputs (adopted from PMBOK)
Applicability of chosen data collection method to this research project
The focus group as a qualitative method for this research was used to enhance the
validity of the research findings. The main purpose of the focus group technique is to
“draw up respondents’ attitudes, feelings, beliefs, experience and reactions in the
way in which will not be feasible using other methods, for example observation, one-
to-one interviewing and questionnaire survey” noted byGibbs (1997, p.1). A focus

Chapter 3: Research Design and Method 59
group has validated the proposed guidance and confirmed that it benefits heritage
management via the “call for action” recommendations prior to implementation.
Furthermore, Krueger and Casey (2009, p.12) note that “by using focus group to
pilot test the policies or procedures, the public organisations can determine which
options are easy for the public to follow”. In this research, the focus group consisted
of five panel members with over 20 years’ experience each as heritage practitioners.
The criteria for selection of the focus group members are shown in Chapter 7 (Table
7.1).
3.7. Summary of Chapter
As discussed in this chapter, applying both qualitative and quantitative analysis
techniques helps to secure the quality of the collected data. Moreover, data
triangulation was conducted by combining the interview highlights with the top
survey results to form the top four results to be finally examined by using appropriate
software.
This chapter began with introducing the paradigms and research approaches to
research methods from a philosophical perspective. An overview of the advantages
and disadvantages of the quantitative and qualitative methods was also presented,
and the rationale and specific fit of the selected research methods to this research
study were discussed. Figure 3.12 presents a summary of the activity resource
proposed for this research project. The next chapter explains the operationalisation of
the research methods.

Chapter 3: Research Design and Method 60
Figure 3.12: Summary of estimated activity resources – Research Project – Inputs, Tools & Techniques, and Outputs (adopted from PMBOK)

Chapter 4: Operationalising the Research 61
Chapter 4
OPERATIONALISING THE RESEARCH
4.1. Introduction
Chapter 3 identified the fundamental approaches that were selected as applicable for
this research project in order to ensure that the research questions would be answered
and the research objectives would be accomplished. This chapter demonstrates the
concept of the research project divided into phases. Each phase emphasises the
various stages of the research project. Although the stages are linked together, each
of the various types of methods forms a separate entity in its own right. Advocates of
the mixed-method research approach such as Creswell (2009), Johnson and
Onwuegbuzie (2004), Tashakkori and Teddlie (2012) and Terrell (2012) recommend
a graphical representation of the mixed methodology as the visual model presentation
enables the reader to comprehend the multi-phase sequences.
Figure 4.1 is an illustrative model of the research design divided into phases to show
what strategy was adopted to answer the research questions and satisfy the objectives
of the research project. The six phases in operationalising this research were: (I)
literature review and preparation, (II) qualitative data collection,(III) quantitative
data collection and qualitative data collection, (IV) qualitative data collection, (V)
data analysis, and (VI) focus group validation of the final guidance and theory
building.

Chapter 4: Operationalising the Research 62
Figure 4.1: Research outline

Chapter 4: Operationalising the Research 63
4.2. Phase I – Literature review and preparation
(a) Literature review
The purpose of the literature review phase was to conduct a comprehensive search of
existing research and texts present in the relevant field, as well as examining the
existing theories in order to define the research objectives, research questions and
preliminary conceptual framework for this research project. Therefore, the gaps in
the existing literature were identified and three literature-based research questions
were developed. To be able to answer the research questions, the researcher
investigated the applicability of each research method and data collection technique
so the project moved to the process of preparation.
(b) Preparation
After the comprehensive literature review and before the actual data collection
begins, a detailed preparation of how the data will be collected is essential. Linking
the research questions with the research strategy provides a plan regarding what kind
of data needs to be collected.
(c) Ethics Approval
Before collection of any data that involves human participants, the ethical approval
from QUT Ethics Committee has to be granted. This research project was granted
QUT research ethics approval number 1400000542.
(d) Selection of an appropriate sampling method
The mixed-method approach was applied to increase the perceived quality of the
research, as discussed in Chapter 3. Once the data collection method is known, the
next step is identifying the sample that needs to be targeted to be an accurate
representation of the population. Targeted populations are people, events, documents
and records that contain the desired information that can answer research questions
(Cooper and Schindler 2008). Therefore, the sampling design and execution can
affect the validity and/or total error of the research. The validity of the sample
depends on: (1) accuracy – a balance among the members of the sample, and (2)
precision of estimate – no sample may fully represent its population in all respects
(Cooper and Schindler 1998; Henry 1990).
There are two basic choices: a probability and non-probability sample. Probability
sampling is based on the concept of random selection, whereby each population

Chapter 4: Operationalising the Research 64
element is given a chance of selection. In contrast, non-probability is not random and
samples are chosen ‘at random’ which suggests that they are chosen ‘by wish’ or
‘wherever they could be found’ (Cooper and Schindler 1998). Figure 4.2 presents the
types of sampling design and their grouping.
Figure 4.2: Types of sampling design (Cooper and Schindler (2008, p. 379)
Furthermore, Table 4.1 compares the advantages and disadvantages of the
probability sampling design types.

Chapter 4: Operationalising the Research 65
Table 4.1: Advantages and disadvantages of the probability sampling designs (Cooper and Schindler (2008, p. 395)
For this research it was adequate for the sampling to be based on the probability of
selection. According to the different types of probability sampling, a number of
sampling techniques were employed to achieve the most relevant outcomes for the
case study, survey and focus group.
(e) Sampling process
For the case study, the complex random sampling method called double sampling
(also called sequential sampling or multi-phase sampling) was chosen. The principles
of the multi-stage sampling are straightforward. Henry (1990, p.110) notes that “a
more tractable use of multi-stage sampling, the nested units sampling involves the
selection of nested units to obtain a sample of special population”. Figure 4.3 shows
the visual steps of sampling at multiple stages.

Chapter 4: Operationalising the Research 66
Figure 4.3: Sampling in the multiple stages (Henry (1990, p.111)
According to the schematic visual example shown above in Figure 4.3, the following
steps were taken in the present research: (1) the most appropriate case studies
relevant to the research objectives were identified, (2) each case study (3) has
multiple stakeholders involved in the project; therefore, (4) selecting the most
relevant targeted stakeholders to be interviewed was the final step in good sampling.
For the survey, the simple random sampling was selected whereby “each member of
the study population has an equal probability of selection” noted by Henry (1990, p.
27). The first step was identifying the pool eligible for selection which in this case
meant:
(1) External project stakeholders
- Users/occupiers of heritage building (bookshop, café,
museum, bank, etc.), tourism and related organisations, and
members of the public that have an interest in heritage
buildings/places.

Chapter 4: Operationalising the Research 67
(2) Internal project stakeholders
- A group of experts in the field located within government and
non-government organisations and private firms in the relevant
sectors.
An online survey was distributed to the identified sampled population. The option for
further discussion regarding the survey answers was offered to the participants in
both groups if they expressed willingness to be interviewed.
The importance of randomisation for a focus group has been argued by many
researchers (Krueger and Casey 2009). Krueger and Casey (2009, p.73) state that
“randomization is an effective strategy to minimize section bias. Randomization is
rarely done of the entire population, but rather on those passing the selection
screens.” In the present study, the recruiting process for the focus group was
carefully designed to ensure the selection of a sample with the relevant knowledge.
(f) What sample size is adequate?
The sample size needs to produce reliable results (Henry 1990; Cooper and Schindler
2008). The size of a sample that is needed for the chosen probability sampling can
vary. According to Cooper and Schindler (2008, p. 385), “How large a sample should
be is a function of the variation in the population parameters under study and
estimating precision needed by the researcher”. Cooper and Schindler (1998, p. 222)
also state that “one false belief is that a sample must be large or it is not
representative” and advise (2008, p. 385) that “a sample should bear some
proportional relationship to the size of the population from which is drawn”.
Therefore, this research targeted the most representative sample of the population,
rather than focusing on the quantity in order to get the most value from the data
collection.
4.3. Phase II, IV– Qualitative data collection (case study)
Case studies emphasise the real-world context in which certain phenomena occur.
Cooper and Schindler (2008, p. 184) refer to a case study as a “powerful research
methodology that combines individual and (sometimes) group interviews with record
analysis and observation”.

Chapter 4: Operationalising the Research 68
The approach depicted in Figure 4.4 was adopted by the researcher to guide the
definition and design of the selected cases, the preparation, collection and analysis of
the data, and at the end the drawing of the cross-case study conclusions.
Figure 4.4: Case study method (Yin (2008, p. 57)
The selection of appropriate cases, defining the units of analysis, the case study
protocol, and within-case study analysis are elaborated upon below:
(a) Selection of appropriate case studies
Selection of the cases is the most important aspect of the qualitative data collection
strategy. Multiple case studies provide a good and strong base for theory building
(Yin 2009). Furthermore, Too (2009, p. 105) agrees with Eisenhardt (1989) that
multiple cases “enable comparison that clarify whether an emergent finding is simply
idiosyncratic to a single case or consistently replicated by several cases”.
In the context of this research project, all of the heritage building projects considered
are unique in regard to the techniques and materials that were used and reflect the
time it was built. One aspect they all have in common is that heritage building
projects face challenges that result in variations which lead the project to run over
time and go over budget. The selection of appropriate cases for this research project
was led by certain factors. Every case study had faced both specific and common

Chapter 4: Operationalising the Research 69
issues and had run over time and over budget, which is the core of the investigation
in this research project. Moreover, particular selection criteria were applied to ensure
the applicability of the chosen case studies for this research (as discussed in detail in
Chapter 5, Table 0.0).
(b) Definition of the units of analysis
In this study, the primary unit analysis is the project management level, that is, the
design phase and execution phase of the project management lifecycle. As noted in
the discussion in Chapter 1, 85 percent of projects have failed to meet time and
budget goals (Shenhar and Dvir 2007). Furthermore, the evidence suggests that
failure is often found even in well-managed projects that are run by experienced
managers and supported by highly regarded organisations. The present research sits
well with current interests as issues with the existing project management
methodologies are currently being addressed and criticised by the research
community. This study focuses on the two stages in the project management
lifecycle: the design phase and the execution phase. The research focuses attention
on finding the causes of the recurrent problems of the time and cost overruns that
appear to be prevalent in many heritage building projects and the causes of which
can be traced back to work within these two stages.
(c) Establishment of the case study protocol
The goal of the case study protocol is to remove bias and errors in this research
activity. This can be achieved by following the procedures of the case study protocol.
This research project adopted Yin’s (2011, p. 81) case study protocol:
An overview of the case study project – Includes the objectives of the
research, relevant reading about the topic that is being investigated,
significance and relevance of the selected case, all case study issues analysed
in depth, diagrams that can visually present the specific issue, the standard
confidentiality statements, the recorded interviews and the subsequent storage
of data.
Field procedures – Includes the presentation of credentials, access to the case
study sites, language pertaining to the protection of human subjects, source of
data, and procedural reminders.

Chapter 4: Operationalising the Research 70
Case study questions – Includes the specific question that the case study
investigator must keep in mind when collecting data, “table shells” for
specific arrays of data, and the potential sources of information for answering
each question.
A guide for the case study report – Includes the outline format for the data,
use and presentation of other documentation, and bibliographical information.
(d) Performance of the within-case study analysis
A case study allows a researcher to generate theories from practice. The proposed
data collection technique and applicability to this research project were discussed in
Chapter 3. The data collected from the document analysis, interviews and
observation were generated through the following processes. Firstly, analysing
project documents in depth guided the researcher to get a better understanding of
different issues and causes in the project. Information on how they interfere with
each other within the phase of happening and what affect each phase can produce to
other phases in the project management lifecycle was extracted (Chapter 5, Table
5.9). Further to that stage, the generic semi-structured interview questions were
formulated to ensure that the answers will be focused on the research target of
identification of ongoing project challenges and its causes. Therefore, during the
interview process the researcher prompted the interviewee to go deeper in explaining
the important challenges that the researcher marked as significant during the
document analysis and observation. Asking the same questions to the different
stakeholders in a project enabled the researcher to observe the same challenge from
different perspectives and draw the conclusions. ‘Entering’ into a project from inside
gives the researcher a certain level of intensity in observing the issues that are
happening. As stated by Baker (2006, p. 172), observation is “a complex research
method because often requires the researcher to play a number of roles and to use a
number of techniques, including her/his five senses, to collect data”. Choosing the
role of ‘observer as participant’ allowed the researcher to remain personally detached
from the people under study while gaining knowledge of the total situation (Baker
2006). Seven semi-structured interviews were undertaken for each case study. The
following seven stakeholders were identified as key stakeholders in the projects:
project owner, project manager, architect/heritage architect, engineer, quantity

Chapter 4: Operationalising the Research 71
surveyor, constructor, and consultant. All the proposed techniques (document
analysis, interviews and observation) conducted in each case study provided
considerable empirical evidence to support the argument in the study’s conclusion.
4.4. Phase III – Quantitative Data Collection
A survey is widely considered as one of the most reliable research methods in many
different fields (Kalantari, Kalantari and Maleki 2011) including construction and
project management. The main objective of the survey was to achieve statistical
validity. The survey was conducted by means of a questionnaire that was divided
into two main stakeholder groups to enhance the validity, consistency and
impartiality of data from representative samples of respondents. There are certain
advantages of this data collection method such as: it is inexpensive to conduct (or
less expensive that other data collection methods); it can be distributed widely; it has
the ability to accommodate a huge research population; it is common for respondents
to answer; and it can be interpreted both qualitatively and quantitatively (Fellows and
Liu 2008). Therefore, the questionnaire survey was identified as the most appropriate
method for accessing a large number of respondents. In this study, an online survey
was distributed nationally to targeted government and non-government organisations,
agencies, private firms, professional organisations, and industry.
Before the survey was widely distributed, the pilot survey was sent out to each of the
stakeholder group representatives (13) to validate the applicability of the questions
that had been formulated. The stakeholder representatives provided feedback by
returning the emails with the points that needed to be changed added and better
explained in order to avoid misunderstanding. The comments were accepted and the
survey was sent for ethical approval before final distribution.
4.5. Phase V – Data analysis tools
Many researchers provide a detailed description of the data analysis process. In the
process of data analysis, sorting and qualifying is given a key role (Creswell 2009;
Fellows and Liu 2003; Green et al. 2007; Yin 2008). A critical part of data analyses,
according to Green et al. (2007, p.20), is “in the process of examining the
information collected and transforming it into a coherent account of what was
found”. For the purpose of this research, data gathered from both qualitative and
quantitative methods were analysed using the appropriate software as explained.

Chapter 4: Operationalising the Research 72
The quantitative analysis that was carried out is explained in a detail as follows: The
research topic on heritage project challenges encompasses the three research
questions presented in Chapter 1 (Section 1.2). For analytical purposes, these
questions were conceptualised in two models.
4.5.1. Relationship propositions – Model 1
The relationship model presented in Figure 4.5 was conceived to answer the first
research question (RQ1): the relationship between the concepts of the constructs key
reasons (KR) and main challenges (MC) for heritage retention (HR).
Figure 4.5: Model 1 – Heritage retention model
Figure 4.5 indicates that there is a covariant relationship between two latent
constructs. Based on the conceptual model shown in Figure 4.5, two propositions
were assigned as follows:
Proposition 1 – KR and MC are directly related.
“Within the statistical model, there is a significant covariate relationship between KR
and MC. Therefore, a relationship between KR and MC exists.”
Proposition 2 – Minimising MC will improve KR.

Chapter 4: Operationalising the Research 73
4.5.2. Relationship propositions – Model 2
A conceptual model presented in Figure 4.6 is grounded in the PMBOK (2008),
which formulates standards for the project management profession and is widely
recognised as a good practice guide. Based on the assimilation of real project
challenges, PMBOK aims to establish the causal relationships between or among the
various processes and knowledge areas that appear in every project. The main focus
of this research is on the highlighted areas shown on the generic project management
cycle (Planning stage, Execution stage and Stakeholder management strategy) in
Figure 4.6.
Figure 4.6: Targeted project management process indicators (Project Management
Institute 2008, p.44)

Chapter 4: Operationalising the Research 74
The model presented in Figure 4.7 was conceived to answer the second (RQ2) and
the third (RQ3) research questions and the relationship between the concepts of the
proposed constructs.
PP Success Measurement
Figure 4.7: Model 2 – Conceptual project performance model
Based on the conceptual model shown in Figure 4.7, several propositions were
assigned as follows:
Proposition 1 – Project performance success measurement is composed of Time,
Cost and Quality/scope.
Execution/
Constructio
n (EC)
Environmental unpredictable
factors
Cost
Time
Quality/
Scope
Closure
MULTIPLE STAKEHOLDER
factors (M_stake)
Initiation
Planning/ Design (PD)
TECHNICAL factors
(Technical)
PROJECT PERFORMANCE
(PP)

Chapter 4: Operationalising the Research 75
PD and EC are the two phases in the project management lifecycle examined in this
study; by examining the observed challenges that characterised each construct,
guidance could be developed to improve the effectiveness of each phase.
Proposition 2 – PD and EC measure project performance (PP).
There is a significant association between planning design, execution/construction
and project performance as measured by the structural equation model.
Proposition 3 – M_stake factors measure PP.
Proposition 4 – Technical factors measure PP.
By examining the observed factors that characterised each construct (M-stake and
Technical), guidance could be developed to improve the effectiveness of examined
constructs.
4.5.3. Development of the Survey Questionnaire
The questionnaire was developed from the results of the literature review and
incorporated the preliminary case study results (based on real heritage project
management experience) to ensure that the survey questions being asked were
suitable in nature for drawing information from either professional or non-
professional stakeholders. Therefore, the survey questions were directed at internal
(INTS) and external project stakeholders (EXTS) in order to provide an appropriate
range of responses to answer the relevant research questions. The survey consisted of
a general opening section of questions that gather demographic information. This
was followed by sections of targeted questions designed to determine the key reasons
and challenges in retaining heritage structures/buildings, and to validate the causal
relationship between planning/design (PD) and execution/construction (EC) in a
project management context. The survey was also designed to examine how multiple
stakeholder factors (M_stake) and technical factors (Technical) influence project
management. The proposed theoretical/structural model was developed using a
structural equation modelling (SEM) approach to examine the relationship that exists
between unobserved latent variables that cannot be measured directly but only
through the use of indicators/observed variables.

Chapter 4: Operationalising the Research 76
The unobserved variables from the external stakeholders (HR, KR and MC) and
internal stakeholders (PP, PD, EC, M_stake and Technical) and the observed
variables related to each unobserved variable in the proposed models. In each of the
models (Model 1 and Model 2), the relationships between unobserved variables and
related composite items are used to answer the research questions as follows:
Part 1 of the EXTS survey questionnaire consisted of general background
questions and questions that target the first research question (see the survey in
Appendix A). By identifying and improving, the main causal challenge can maximise
the success of heritage retention that can further affect the decision making on
heritage retention.
Part 2 of the INTS survey questionnaire examined the project management
challenges that occur through the planning design and execution/construction phases
and impact on the eventual success of heritage projects and was designed to answer
the second and third research questions. By examining directly observed variables,
the questions aimed to identify and quantify the main challenges and causal
relationships that exist between PD, EC to PP; M_stake to PP; Technical to PP; M-
Stake to PD and EC through MP.
Each part of the survey questionnaire concluded with a series of open-ended
questions to enable the participants to provide knowledgeable input based on their in-
depth understanding of the critical issues in the delivery of heritage projects beyond
those raised in the survey questions. This section was highly important to gain new
knowledge from participants with different backgrounds (such as technical and
legislative) and heritage experience practitioners (such as architects, engineers,
quantity surveyors and builders). Each of the salient comments drawn from these
open-ended questions is presented in Appendix F and when analysed, they provided
rich insights into the depth of respondents’ heritage-related experiences and included
suggestions for the better management of heritage building projects in the future.
The literature clearly indicates that heritage projects, like many other types of
construction projects, not only have a tendency to run over time and go over budget,
but with such projects, this becomes a norm rather than an exception (Zwikael and
Smyrk 2011). Why projects are not able to meet the criteria of even basic project
success models such as the modified iron triangle (time, cost and quality/scope)

Chapter 4: Operationalising the Research 77
presents a major question that needs to be further investigated as in this research. In
order to determine the main challenges that have a significant impact on the project
delivery, the two models (see Figure 4.5 and Figure 4.7) were developed. To enable
the examination of each construct and unobserved variable, the measuring elements
for each were developed based on the literature as discussed in Chapter 3 and the
preliminary case study validated through extensive interviews to ensure that they
reflect specifically the Australian perspective (presented in detail in Chapter 5).
These elements are:
The need to take action to protect heritage places from further development
pressure
Historical importance
Social value
Tourism
Problematic factors that affect project delivery through the project
management phases
Scope definition
Accuracy in tender documentation
Meeting the Building Code of Australia (BCA)
Meeting the Disability Discrimination Act (DDA)
Multiple stakeholder involvement
Identification
Requirements and needs
Communication and engagement.
The factors that measure the stakeholder influence on the project were derived from
the review of previous research into stakeholder management (Yang 2010) The
stakeholder factors were mostly adopted from the survey questionnaire by Yang
(2010, p. 256 - 257), but some of the factors were omitted as they were not relevant
to this research.
The CFA model was run for each of the four main latent constructs. The items that
were most heavily loaded (0.6 and higher) were chosen between all items.

Chapter 4: Operationalising the Research 78
The constructs were analysed separately with CFA prior to assembling all factors
(with the factor loading 0.6 and higher) to be selected priory to further analyses by
using SEM.
Figure 4.8 presents the two project management phases (PD and EC) with two sets of
factors (Technical and M_stake) and all of their component elements used to
measure those unobserved variables and how they influence the overall project
performance and delivery. Successful heritage project performance in this research is
represented by the modified iron triangle theory described in the literature review
(Chapter 2), where project success is measured by time, cost and quality/scope. The
other two unobserved variables (M_stake and Technical) and their likeliness to
influence the project delivery were analysed separately. The elements of PD, MC,
M_stake and Technical that were identified in the interview results as the factors that
were most likely to impact the overall project success were examined as a statistical
model as shown in Figure 4.8. Data triangulation of the qualitative and quantitative
results takes a place prior to using the final test of the top four rankings under SEM.
The combined top four scores have been tested in SEM. Figure 4.8 present the initial
proposed SEM model that was proposed to be run for final analysis and the four
boxes represent the four top results that were chosen to sit within the detailed SEM
after the data was triangulated.
Figure 4.8: Project performance structural equation model
Execution/
Construction
(EC)
MULTIPLE STAKEHOLDER
factors
Planning/ Design (PD)
TECHNICAL factors
(Technical)
PROJECT PERFORMANCE
(PP)

Chapter 4: Operationalising the Research 79
Each of the observed variables in the CFA is an indicator variable that reflects the
associated latent variable as in this case the four of them will be further analysed.
In the final section of the survey, the respondents were asked to indicate whether
they were willing to be further contacted or interviewed. This option provided the
researcher with the opportunity to further discuss any of respondents’ answers and
extend the investigation of challenges of significance.
4.5.4. Questionnaire scales
The survey questionnaire used a Likert scale measure as an independent rating type,
as is common practice in the field of education and social sciences (Brill 2008;
Spector 2004)The aim of the scale is to measure the extent of respondents’
agreement with a critical statement and/or perceptions of a particular issue (Barnette
2010). According to Spector (2004), there are two different ranges, namely, unipolar
and bipolar ranges. The unipolar range is from low to high, and the bipolar range is
from extreme negative to extreme positive. Furthermore, Spector (2004) classifies a
number of agreements linked to the use of bipolar scales, such as using the structure
of an odd number of response choices including/excluding the neutral response in the
middle. Including the neutral number in the middle means the respondents are not
forced to make a choice in one direction or the other, but it may influence
respondents to be noncommittal. The response format used in the survey
questionnaire was from 1–5, but varied with the agreement measurement from
‘Strongly disagree’ (1) to ‘Strongly agree’ (5) including the neutral response to ‘Not
at all influential’ (1) to ‘Highest influence’ (5) and ‘Not needed’ (1) to ‘Already
provided’ (5), both excluding the neutral response. A Likert type format was used for
all of the closed-ended questions in Part 2 of the questionnaire.
Brill (2008) indicates that many researchers are likely to treat the data in the Likert
response format as interval data (using parametric statistics to analyse it), whereas it
is technically characterised as ordinal data. The retrieved Likert format response data
in this project was treated as interval data so as to be able to ensure the requirements
for parametric statistics, outliers, normality distribution and data refined from
missing values were met.

Chapter 4: Operationalising the Research 80
4.5.5. Sample size
The views in the literature on the sample size for statistical modelling (CFA and
SEM) differ greatly. The ideal sample size agreed by Comrey and Lee (1992) and
Tabachnick and Fidell (2007) is at least 300 cases. Commonly followed in practice is
the advice by Boomsma (1983) that the sample size of around 200 for so-called
“small to medium models” should be adequate. Furthermore, Hair at al. (2010)
specified the sample size for a SEM depends on the model complexity: a minimum
sample size of 100 is recommended for the model that contains five or less
constructs.
4.5.6. Preliminary data analysis
The Statistical Package for Social Sciences (SPSS) Version 22 and Stata Version 13
was used to analyse the data from the survey questionnaire. Data obtained from the
questionnaire survey underwent several processes, namely, coding of the data,
screening the outliers and testing of the normality distribution, validity and
reliability. These processes are described in detail below.
4.5.7. Coding data
The variables extracted from the key survey results were labelled as shown in
Appendix C. The data exported from the key survey results was given numerical
values that were aligned with the text values to enable the reader to understand the
results obtained from the different tests applied to both (Zikmund et al. 2012).
4.5.8. Screening the missing values/data
Missing data can cause problems regarding the reliability and validity of the research
outcome (Hair et al. 2010). There are two methods to overcome the problem of
missing data. Firstly, the amount of missing data needs to be assessed; and secondly,
the pattern of missing data needs to be evaluated (Hair et al. 2010 ; Tabachnick and
Fidell 2007). If missing data is less than ten percent for an individual case, it can be
ignored (Hair et al. 2010), as a usual procedure for handling the incomplete cases.
The amount of missing data across all module variables was less than ten percent.
Because of this low frequency, the data was left intact. Moreover, the parameters of
the CFA and SEM were obtained using both the maximum likelihood (ML)
algorithm and the maximum likelihood with missing values (MLMV) algorithm, and
in this case, the missing data did not have an impact on the module results.

Chapter 4: Operationalising the Research 81
4.5.9. Screening the outliers
In statistics, an outlier is an observation point that appears to be distant from other
observations taken (Uhde 2008). It is important to identify outliers and assess their
impact on the statistical tests. Identifying and treating them may improve the
replicability of results in other research (Aguinis, Gottfredson and Joo 2013; Sheskin
2010).
The approach to treating an outlier depends on the cause such as retention, exclusion,
non-normal distribution, set-membership uncertainties and alternative mode.
Outliers, while being the most extreme observations, can include the ‘sample
maximum‘ and ‘sample minimum’ or both depending on how extremely high or low
are they. However, if survey Likert scale is used, it would be in appropriate to delete
the highest and lowest scale items as outliers.
Hubert and Vandervieren (2008) describe the boxplot as a popular graphical tool “for
visualising the distribution of continuous unimodal data”. The boxplot tool was
employed in the present study for the fast and automatic detection of possible
outliers. According to the inbuilt validation rules that this research project set for the
online key survey, whereby the responses could only take on allowable values from 1
to 5, any outliers from the boxplot were not treated as an outlier as they took a value
from 1 to 5.
4.5.10. Normality distribution
The critical assumption in conducting SEM analysis is that the data is normal. The
statistical procedure to test the normality of the data distribution was conducted in
the present study by using the Shapiro–Francia test (Royston 1982; Royston 1991).
The test result for the INTS indicated high values of the normality of data
distribution (Appendix D6) and the result for the EXTS showed normal distribution
of the observed variables (Appendix D7). Within the CFA and structural equation
models, the asymptotically distribution-free estimation method was used as an added
check (Acock 2013).
While graphical methods are more visual and easy to interpret, the statistical test by
Shapiro–Francia was employed to test the normality of data distribution for this
research project. The different numerical methods and programs that support this

Chapter 4: Operationalising the Research 82
analysis are presented in Table 4.2. The Stata was employed in this research and
from the table could be seen that the Stata results supported the Shapiro–Francia test.
Table 4.2: Numerical methods of testing normality (Park 2008, p.8)
4.5.11. Reliability of the established measures
Reliability is an essential characteristic for a good measurement tool. In order to
ensure the quality of the data, preliminary tests were undertaken to examine the
reliability of the established measures. A pilot survey was conducted prior to the
main survey as a common practice to ensure that the content validity could be
assumed.
Reliability is a major concern when a psychological test is used to measure an
attribute. The data should be reliable before further statistical tests are applied
(DeVellis 2012). Cronbach’s alpha is the most widely used metrics to test reliability
(Gliem and Gliem 2003). Cronbach’s alpha values and their interpretations by
George and Mallery (2003) and compared to Multon and Coleman (2010) are
described in Table 4.3 with the reliability level considerations.

Chapter 4: Operationalising the Research 83
Table 4.3: Reliability level considerations (George and Mallery 2003; Multon and
Coleman 2010)
Cronbach’s Alphas Values
Reliability level consideredGeorge and Mallery Multon and Coleman Adopted for this (2003, p.203) (2010) study
> 0.9 Excellent High High
> 0.8 Good Very good Very good > 0.7 Acceptable Good Good
> 0.6 Questionable Unacceptable Unacceptable > 0.5 Poor Unacceptable Unacceptable < 0.5 Unacceptable Unacceptable Unacceptable
In this project, the Cronbach alpha was employed to measure reliability. The
reliability tests of each of the analysed constructs are described in the following
chapter. The reliability examination involved the Cronbach’s alpha test for each
construct as the first verification after obtaining the data and before the CFA and
SEM analysis. The reliability tests for each construct are shown in Appendix D8 –
D13.
4.5.12. Descriptive analysis
SPSS Version 21 was used for the descriptive analysis, and the individual mean,
median and standard deviation values. The mean value was used in this research as
the data set took the values between 1 and 5. The median is determined by sorting the
data from the lowest to the highest value, and taking the numerical value from the
middle of the observation (Kwok 2008). The value of the standard deviation is used
to indicate the distance of the separate measurements from the mean score (Richard
2010). A lower standard deviation value indicates that the data points are gathered
closely to the mean value, while a higher value indicates that the data is less accurate
(Richard 2010).
4.5.13. Correlation
For this research, the Pearson correlation coefficients were run with Bonferroni
adjustment to correct for an enhanced probability of making Type I errors across the

Chapter 4: Operationalising the Research 84
multiple pairwise comparisons between items variables. The correlation coefficient
indicates the strength of the correlation between the examined variables.
4.5.14. Confirmatory factor analysis
There are two basic disciplines of factor analysis: exploratory factor analysis (EFA)
and CFA. These two disciplines of factor analysis implement two different concepts
(Thompson 2004). Both techniques are based on linear statistical models, assume a
normal distribution, and incorporate measured variables and latent constructs. The
validity is ensured if certain assumptions are met (Suhr 2006).
EFA is useful to determine how and to what extent the observed variables are related
to their underlying factors when the link between the observed variables is uncertain
or unknown (Byrne 2013). CFA is appropriately used when the investigator has
knowledge to postulate the relationship between the observed variables and the
underlying factors and then uses the CFA to test this hypothesised model statistically
(Byrne 2013). Therefore, the CFA was used in this research as the link between the
observed variables and hypothesised model. CFA, as described by Hair et al. (2006,
p.773), “is a way of testing how well measured variables represent a smaller number
of constructs”. Suhr (2006, p.1) notes that CFA “allows the researcher to test the
hypothesis that a relationship between the observed variables and their underlying
latent construct(s) exists”. This research used a two-step CFA procedure: one step
was to examine if each of the relevant items loaded on the appropriate latent
construct and the other step was to test if that was supported for the combined model
for the data. In the present study, both the HR and PP models were shown to be
significant as discussed in the following chapter.
4.5.15. Structural Equation Modelling
The CFA model “focuses solely on the link between factors and their measurement
variables, but when used within the framework of SEM, it represents what has been
termed a measurement model” noted by Byrne (2001, p.6). SEM is a mathematical
and graphical way to represent a serious of linked regression equations. SEM has
been used widely in econometrics, epidemiology and in many areas of the social
sciences to determine the relationship between latent constructs and observed
variables.

Chapter 4: Operationalising the Research 85
The advantage of the technique lies in the ability of SEM to analyse the observed
(measured) variables and unobserved (latent or construct) variables and the
dependent and independent variables (Suhr 2006). Furthermore, those complex
relationships and related estimated parameters can be presented in a visual way.
However, having multiple indicators for each latent variable allows the effect of
measurement error to be isolated and removed from the latent variable measures. In
addition, SEM allows researchers to evaluate the proposed model-fit through
multiple tests such as the Chi-square, comparative fit index (CFI) and root mean
squared error of approximation (RMSEA) (Byrne 2013; Hair et al. 2010; Suhr 2006).
In this research, SEM was performed using Stata Version 13. According to Hair et al.
(2006), SEM is divided into two basic parts: a measurement model that deals with
the relationship between the measured variables and latent variables, and a structural
model that deals with the latent variables and their relationships. The measurement
model specifies the indicators for each construct and also enables the assessment of
construct validity, and the structural model represents the interrelationship of the
variables and constructs. A structural model is a “set of one or more dependent
relationships linking the hypothesized model’s construct” noted by Hair et al. (2006,
p.710). Table 4.4 presents the assessment of the measurement model adopted by Hair
et al. (2010, p.713) that includes standardised loading, standardised residuals and
modification indices.
Table 4.4: Assessment of measurement model (Hair et al. 2010, p.713)

Chapter 4: Operationalising the Research 86
If dropped from the model, the items with low factor loadings (0.5 and lover) would
not affect the model as long as the construct retains an adequate number of
indicators. As an optimal check, it is preferable to measure each construct by three
indicators (Hair et al. 2010).
Hair et al. (2010, p.678) identified five groups of goodness of fit indicators as
follows:
1) The x2 value and associated degree of freedom (DF): CMIN/DF
2) Absolute fit indices: GFI, RMSA or SRMR
3) Incremental fit indices: CFI or TLI
4) Goodness of fit indices: GFI, CFI, TLI
5) Badness of fit indices: RMSEA, SRMR.
By using one index from each group, the overall model fit can be assessed accurately
(Hair et al. 2010) . The goodness of fit statistics used as recommended to check the CFA
and SEM model fit for this research project were CMIN/DF, CFI, RMSEA and TLI.
SEM requires a measure of model fit or ‘predictive’ accuracy (Hooper, Coughlan and
Mullen 2008), in determining whether or not the overall model is acceptable prior to
examining the separate relationships (Hair et al. 2006). According to (Barrett 2007),
there is no “single” statistical test that indicates a correct model fit; moreover,
evaluation of the model fit is based on multiple fit indices. Table 4.5 summarises the
criteria for the multi-fit indices for defining the structural model fit.

Chapter 4: Operationalising the Research 87
Table 4.5: Criteria for multi-fit indices for defining the structural model fit (Hair et al. 2010; Hooper, Coughlan and Mullen 2008; Schermelleh-Engel, Moosbrugger and
Müller 2003)
Fit Indices Level Range Level Fit
CMIN/DF CMIN/DF < 2 (Hair et al., 2010; Schermelleh et al., 2003) Excellent fit
3 < CMIN/DF < 5 (Hair et al., 2010) Acceptable fit
CMIN/DF > 5 (Hair et al., 2010) Poor fit
GFI 0.90 < GFI < 0.95 (Hair et al., 2010; Schermelleh et al., 2003) Acceptable fit
0.95 < GFI < 1.00 (Hair et al., 2010; Hooper et al., 2008; Schermelleh et al., 2003)
Perfect fit
RMSEA RMSEA < 0.03 (Hair et al., 2010; Hooper et al., 2008; Schermelleh et al., 2003)
Excellent fit
0.03 < RMSEA < 0.07 (Hooper et al., 2008) Acceptable fit
0.03 < RMSEA < 0.08 (Hair et al., 2010; Schermelleh et al., 2003)
Acceptable fit
NFI 0.90 < NFI < 0.95 (Schermelleh et al., 2003) Acceptable fit
0.95 < GFI <1.00 (Hooper et al., 2008; Schermelleh et al., 2003) Perfect fit
TLI 0.90 < TLI < 0.95 (Hair et al., 2010) Acceptable fit
0.95 < TLI < 1.00 (Hair et al., 2010) Perfect fit
CFI 0.90 < CFI < 0.95 (Hair et al., 2010) Acceptable fit
0.95 < CFI < 1.00 (Hair et al., 2010; Hooper et al., 2008; Schermelleh et al., 2003)
Perfect fit
RNI CFI > 0.90 (Hair et al., 2010) Acceptable fit
Where: CMIN/DF = (CMIN=Chi Square or X2 & DF=Degree of freedom); GFI = Goodness-of-Fit Index; RMSEA = Root Mean Square Error of Approximation; NFI = Normed Fit Index; TLI = Tucker-Lewis Index; RNI = Relative Noncentrality Index.
4.5.16. Unpredictable environmental factors
Unpredictable environmental factors such as flood, fire, wind, earthquake, humidity
and temperature (extreme high or low) also influence the overall project delivery and
may cause a project to run beyond schedule. Such unpredictable factors are
acknowledged but were not further observed.

Chapter 4: Operationalising the Research 88
4.5.17. Qualitative tool
A number of steps were undertaken for the qualitative data analysis. Interviews with
a variety of stakeholders such as project owner, project manager, architect/heritage
architect, engineer, quantity surveyor, constructor and consultant were conducted at
their offices or at the relevant sites. The 19 interviews were then transcribed
verbatim. The text derived from the interviews was analysed using QSR
International’s Nvivo 10 (International 2012). This qualitative analysis software was
used because, according to Bullen and Love (2010, p.217-218) in agreement with
Kale (1996) it enables “the researcher to develop an organic approach to coding as it
enables triggers or categories of interest in the text to be coded and used to keep
track of emerging and developing ideas”. Rigorous analyses of the qualitative data
form the foundation of the production of high-quality research. Software is used to
maximise efficiency in interpreting the data and data coding (Bringer, Johnston and
Brackenridge 2006).
4.5.18. Data triangulation
Merging qualitative and quantitative methodologies involves triangulation in order to
avoid the potential controversy related to the paradigms as described in Chapter 3.
According to Collis and Hussey (2003), triangulation is classified as follows:
methodological triangulation (different methods); data triangulation (data sources);
and investigator triangulation (different evaluators). Patton (2002) added a fourth
type of triangulation, namely, theory triangulation or perspective to the same data set.
According to Easterby-Smith et al. (Easterby-Smith et al. 2008), data triangulation
increases the reliability of the results. Data triangulation for this research involved
the methodological triangulation using the mixed-method research (i.e. qualitative
and quantitative methods). Furthermore, the data triangulation in this research was
achieved by encompassing the highlights from the interviews (case studies) and the
survey results in the conclusion while answering the three research questions. The
interpretation and examination of the results of the case studies and the survey were
the basis for developing the set of propositions that formed the proposed guidance.
The guidance (referred to as a “call for action”) was then validated by the focus
group. The “call for action” emphasises the two project management phases
examined in this study together with the stakeholder management and technical
factors.

Chapter 4: Operationalising the Research 89
4.6. Phase VI – Theoretical propositions (validation of guidance by the focus
group)
It is necessary to develop a guidance or model because, according to Moore (1981),
“research involves the systematic analyses of phenomena under conditions allowing
facts, laws, and theories to emerge and be tested”. The proposition was set and
tested, so that “the theory was right from the first go” in this research. Model 1 and
Model 2 were strongly supported by the data.
The production of good quality research has to be evaluated. With the use of the
mixed-method concepts and chosen data collection techniques in this research
project, it was necessary to ensure that the undertaken processes were based on a
critical investigation which was validated. Quantitative methodology excludes
context from scientific practice, subjectivity and interpretation, because the theory
has to be universally applicable and based on objectivity. Auerbach and Silverstein
(2003, p. 78) give a straightforward definition that “objectivity simply means the
absence of subjectivity”. The criteria for evaluating quantitative research are
statistical tools of reliability, validity and generalisability. However, researchers need
to be aware that these tools can work only in so-called ‘ideal’ situations and indeed
cannot be obtained in practice. The qualitative methodology is based on the strong
belief that context, subjectivity and interpretation are inevitably interwoven into a
research project. Moreover, these elements are seen as essential and should not be
disregarded or eliminated. The criterion for evaluating qualitative research is the
concept of justifiability of interpretation and transferability of theoretical constructs.
Figure 4.9 presents the tests for judging the quality of the research established by
Cooper and Schindler (2008). As shown in the figure, research has to aspire to high
validity and high reliability in order to be good quality research.

Chapter 4: Operationalising the Research 90
Figure 4.9: Test for judging the research quality (Cooper and Schindler 2008, p. 292)
Reliability, or a reliable method, occurs when a method is applied by other
researchers and gives basically the same results. Research must be “systematic,
organized and disciplined so that those who re-test or re-examine your source of data
will arrive at similar findings” according to the definition of reliability by Kellehear
(1993, p. 9).
Validity refers to the scale that has been defined as a measurement of ‘what it claims
to measure’. If the scale measures what it claims, then the scale is valid and it proves
objectiveness. There are many definitions of validity such as face validity, construct
validity and predictive validity. Generalisability is an important criterion that intends
to ensure that research provides a universally applicable theory.
To ensure the reliability, validity and generalisability of the quantitative data, this
research project conducted a pilot study. The pilot study respondents were selected
from each group of sample representatives of the sample population of the main
survey as previously discussed.
Justifiability refers to the use of subjectivity in analysing and interpreting data
(Auerbach and Silverstein 2003), but it is not justifiable to impose subjectivity that
has not been grounded in the data. Therefore, there needs to be a clear distinction

Chapter 4: Operationalising the Research 91
between justifiable and unjustifiable uses of subjectivity in interpretation. This
research has a subject that ‘goes into’ the historic sense of place which is indivisible
from the emotions that form the connection between people and places/buildings.
That requires the researcher to be neutral and emotionally inexpressive in relation to
any findings in order to ensure justifiability of the qualitative data. The criteria that
researchers use for distinguishing justifiable and unjustifiable interpretations of the
data are: transparency, communicability and coherence (Rubin and Rubin 2011).
Transferability refers to the development of theory extended beyond a specific
sample. As stated by Auerbach and Silverstein (2003, p. 87), “as you include more
samples you refine theory”. The theoretical construct that has been developed in one
study, as truly transferable, helps to gain a better understanding of the subjective
experience of the participants in the next sample.
4.7. Summary
The purpose of this chapter was to discuss the operationalisation of the research
methods. This chapter summarises the whole process with the data collection
purpose that was undertaken. The next chapter will present the proposed case studies
and its findings.

Chapter 4: Operationalising the Research 92

Chapter 5: Project Management Challenges – Case Studies 93
Chapter 5
PROJECT MANAGEMENT
CHALLENGES – CASE STUDY
5.1. Introduction
Chapter 4 introduced the operationalisation of the various research phases designed
to ensure that the most appropriate data collection procedures would be undertaken.
This chapter presents the findings from the data collection accomplished by
conducting a series of qualitative case studies.
The first case study (Old Government House Restoration, QUT, Brisbane,
Queensland) was undertaken as a pilot case to provide the both qualitative and
quantitative information needed to develop a strong questionnaire survey and to
validate literature review findings through a real completed case. The second (Gona
Barracks) and third (Anzac Square) case studies were conducted after the
quantitative data was collected from an extensive survey questionnaire conducted
amongst public and professional stakeholders. The analysis of the quantitative data,
followed by two case studies, builds a deeper understanding of the challenges facing
heritage building projects and investigates whether these challenges were similar
across different parts of Australia.
5.2. Selection of the case studies
The aim of this research is to investigate the reasons why heritage-listed projects
often fail to meet the delivery goals of time, budget and scope/quality. This aim was
adopted as a major focus for selecting the case studies. Therefore, a set of selection
criteria was established to find the most appropriate cases for analytical purposes that
would achieve this aim. Firstly, this research sought to investigate heritage-listed
building projects in Queensland that were running over time and over budget. Three
projects were identified that met this selection criterion. Secondly, in order to get an
overview of the diverse issues that affect heritage projects during their lifecycle, the
case studies were to include projects with different sources of funding or mixed

Chapter 5: Project Management Challenges – Case Studies 94
funding. Thirdly, in order to get a better perspective of how heritage projects are
affected at different stages of their lifecycle, it was decided to select at least one
completed and two ongoing projects. Choosing an ongoing project enabled the
researcher to attend weekly and monthly site meetings as an observer. This enabled
the researcher to make site visits and discuss project issues with the stakeholders on a
day-to-day informal basis in addition to the semi-structured feedback from formal
interviews. The three case study projects chosen were: Old Government House
(OGH) at 2 George Street, Brisbane City; Gona Barracks on Gona Parade, Kevin
Grove; and Anzac Square at 228 Adelaide Street, Brisbane City. The application of
the criteria to select the three case studies for this research is presented in Table 5.1.
Table 5.1: Application of criteria to selected projects for case studies in this research
Case Study
Selection Criteria 1
Applicability
for this
Research
Heritage-listed
(national/state/local)
Time
issues
Budget
issues
Scope
revisions
OGH √ √ √ √ Yes
Anzac Square √ √ √ √ Yes
Gona Barracks √ √ √ √ Yes
Case Study
Selection Criteria 2
Applicability
for this
Research
Privately funded Funded by
government
Completed
project
Ongoing
project
OGH √ √ √ 0 Yes
Anzac Square 0 √ 0 √ Yes
Gona Barracks √ √ 0 √ Yes
√=satisfied the criteria, 0 = did not satisfy the criteria
As seen in the table, the chosen case studies satisfied the established criteria.
Therefore, it was believed that all three case studies would be able to accomplish the
research objectives, namely:
o To identify the causes of the project time overrun
o To identify the causes of the project budget overrun

Chapter 5: Project Management Challenges – Case Studies 95
o To identify the influence of multiple stakeholders on the project and
their inner relationships that have a positive or/and negative effect on
the overall project delivery.
5.3. Stakeholder Interviews Identification
Based on the case study objectives (a group of stakeholders was identified as
representing the relevant sources of data to pinpoint and evaluate the specific
challenges experienced by certain projects at different lifecycle stages. The identified
stakeholders (Table 5.2) were asked the same set of semi-structured questions via
interviews to enable the researcher to gather data from different stakeholders that
was based on the same research rationale. The Anzac Square case study involved an
extra stakeholder, namely, the project programmer, who was also interviewed.
Table 5.2: Stakeholder interview identification
Case
Study
Interviewees
Total Project
Owner
Project
Manager
Super-
intendant
Heritage/
Architect
Engineer Quantity
Surveyor
Builder
5.4. Data Coding for Interviews
NVivo software has many advantages for research projects (Creswell 2009, 2007)
and was chosen to assist the researcher in data-handling tasks such as organising files
and easily locating the main phrase or idea after identifying the themes in a case
study. In addition, the mapping features of the software can be used to draw a visual
model. For the purposes of the present study, not all of the features of the software
were utilised. In the within-case and cross-case analysis, an employed program
identified similar themes. Each case study highlighted emerging points that were
drawn from the interviews and grouped together as tree nodes as seen in Figure 5.1.

Chapter 5: Project Management Challenges – Case Studies 96
Figure 5.1: Tree nodes in case study data
All the interviews were transcribed, coded, transferred, categorised and grouped in
the QSR NVivo Version 10 software for analytical purposes. The data codes enabled
the researcher to easily analyse and compare the existing data with, and between, the
other case studies. Passive participant observations were carried out as part of the
qualitative approach methodology. These allowed the researcher to closely examine
the issues and behaviours prevalent within the projects, make photo-documentation
and informally discuss project issues with the involved stakeholders on the site. The

Chapter 5: Project Management Challenges – Case Studies 97
ongoing projects, namely, Gona Barracks and Anzac Square, provided working real
examples and allowed for rich discussions and observation of working solutions
being applied to the latent condition issues. The observation of the ongoing projects
through site visits involved informal discussions which enriched the interviews
already conducted with each of the project stakeholders. The following sections
provide a detailed overview of the three case studies.

Chapter 5: Project Management Challenges – Case Studies 98
5.5. Case Study 1: Old Government House
5.5.1. Introduction
The history of the place
In 1859, Queensland became a separate colony with 30,000 settlers and a site was
chosen for the state’s first government house. The first Queensland Government
House was designed by colonial architect Charles Tiffin. The house was built with
the purpose to serve the various governors of Queensland until 1910. OGH has been
used as a government office, public reception and governor’s accommodation which
included family members and servants. With changes in the role of governor around
1910, OGH was allocated to the new university that was established on the same site
(Queensland Government 2015c).
Building Characteristics
OGH is situated adjacent to the Botanical Gardens and was built from sandstone. The
building was designed to be naturally ventilated. It is a symmetrically planned, two
storeyed building with an entrance facing the river emphasised by two storeyed
semicircular colonnades. Figure 5.2 shows a photograph of OGH (1863) from the
Queensland University of Technology (QUT) archives.
Figure 5.2: Old Government House (Source: QUT Archives)

Chapter 5: Project Management Challenges – Case Studies 99
The building was designed in a way that connects and simultaneously separates the
private (family members and servants) and public aspects of the building’s use. The
verandas continue around both sides on both elevations. The interior of the house has
timber floors, and the walls and ceilings are plastered. The interior joinery is made of
the highest quality cedar. Influenced by the classical revival style assembled in a
tropical environment, the building is a fine example of a well-appointed nineteenth
century house. Figure 5.3 shows the design symmetry in the ground floor plan and
main entrance of the building.
Figure 5.3: Design symmetry in the ground floor plan and main entrance of the building (Source: QUT Archives)

Chapter 5: Project Management Challenges – Case Studies 100
Cultural Heritage Significance
The principal period of the historical significance of OGH was from 1860 to 1945, a
period of history when Queensland was undergoing extensive industrial and
agricultural development. OGH is also unique as a rare surviving example of the
work of colonial architect Charles Tiffin. Moreover, the picturesque quality of the
villa was enhanced by the garden surrounding the house which has also been heritage
listed (Figure 5.4, 1870).
Figure 5.4: The Old Government House garden (Source: QUT Archives)
The garden is significant as the work of botanist and Botanic Garden curator, Walter
Hill, with planting schemes and large established trees that perfectly shape the
building. The building evinces a perfect design that fuses separate functional spaces
in one cohesive unit. OGH was heritage listed in 1978 and was the first building in
the state to be heritage listed. Table 5.3 presents a summary of the characteristics of
OGH.

Chapter 5: Project Management Challenges – Case Studies 101
Table 5.3: Characteristics of OGH (Source: Registers and Inventories EPH QLD Government (2015c)
Name:
Old Government House
Place ID: 600118
Registration type: State Heritage
Architect: Charles Tiffin
Design Period: 1840s – 1860s (Mid-19th century)
Constructed between: 1860-1862/1899
Style: Victorian - Composite
Place Classification: Built Landscape
Place Category: Government Administration
Place Type: Government House
Cultural significance: First QLD Government Building
Present use of the building: Cafe, museum, art gallery, different functions
Heritage listed: Listed on the Queensland Heritage Register
Location: 2 George Street
Brisbane City, 4000
5.5.2. OGH Restoration Project 2007–2009
Project Budget
The original project budget was approximately $8,500,000. The final project cost
was approximately $13,500,000.
Project Timeframe
The original proposed timeline was 2007 to 2008. The final project duration was
extended to 2009.
5.5.3. Stakeholder Interviews
Most heritage projects experience some kind of difficulty in regard to meeting
financial and time targets. In the interviews with the OGH stakeholders, questions
were asked to target these issues and the interview objectives were discussed with
each of the identified stakeholders to get their views on these problems. Table 5.4

Chapter 5: Project Management Challenges – Case Studies 102
shows the stakeholders interviewed in the OGH case study. The remainder of this
section presents the OGH stakeholders’ views on the topics investigated in the
interviews.
Table 5.4: OGH case study stakeholder interviews
Case
Study
Interviews
Total Project
Owner
Project
Manager
Super-
intendant
Heritage/
Architect
Engineer Quantity
Surveyor
Builder
OGH √ √ 0 √/0 0 0 √ 4
Gona
Barracks √ √ √ 0/√ √ 0 √ 6
Anzac
Square √ √ √ 0/√ √ √ √ 7+1
Differences in managing/designing heritage building projects and conventional
building projects
It is not only heritage building projects that run over time and over budget: most
conventional building projects also experience these difficulties. Managing a project
to run within its scope is challenging in most construction-based projects (Zwikael
and Smyrk 2011).
The following comments made by the OGH stakeholder [R4] revealed the view on
the differences between heritage building projects and conventional building
projects:
a) Pre-planning – “Heritage projects require considerably greater level of pre-
planning and consultation. Sufficient timeframe should be allocated during
this period”.
b) Stakeholder management – “There are a greater number of stakeholders in
heritage projects. In fact stakeholder management is one of the key
requirements”.
c) Community consultation – “Owned by the public, community consultation is
also one of the key aspects in delivering these projects. Programming this
activity into the program is critical”.

Chapter 5: Project Management Challenges – Case Studies 103
d) Risks – “Due to age of these building, it is very difficult to assess what one
comes across the building during the construction stage. The construction
risks are considerably higher. It is not uncommon to have a contingency of
20–40%”.
e) Media and political interest – Heritage projects “attract considerable interest
from media as well as from political arenas”.
Conventional building projects are mostly run in line with “what the client wants”
[R1], while heritage building projects have to follow the Burra Charter outlining
good practice for heritage places.
Conventional building projects are also believed to take “the short term view” [R1]
while heritage projects consider the “long term community interest” [R1, R3 and
R4]. One main difference between conventional building projects and heritage
projects is that “you can make mistakes” [R1] in conventional building projects but
in heritage projects there is no place for mistakes and the stakeholders must be
“prudent, careful, responsible and very proper” [R1].
Furthermore, different trades are involved in conventional and heritage projects, and
sourcing materials is different [R2]. Meeting the BCA requirements for conventional
projects and heritage projects is also different [R2].
Limitations of current policies and procedures for heritage building projects
Meeting the requirements of heritage legislation can sometimes be time consuming,
but when dealing with heritage projects the concept of time can be considered
differently: “what is two months in two hundred years?” [R1]. Due to the
limitations, “there are more about people to think in conservation way, to have more
general understanding of procedures and it is about too many people who carry out
this processes do not understand very well” [R1]. Moreover, “a heritage
classification of the building whether it is local, state or national listed limits the
design” [R2].
“It is very hard to determine the scope” [R4], as the amount of investigation of the
building is not adequate and “non-destructive investigation prior to tender
documentation is desirable” [R2 and R3]. Visual inspection of the building

Chapter 5: Project Management Challenges – Case Studies 104
especially in relation to termite infestation could be insufficient. Differences in
meeting the requirements of the BCA were noted, highlighting the need for
adjustments to the BCA or a “separate code is needed” [R2]. Also “finding
strategies to meet Disability Discrimination Act 1992 (DDA) is a challenge” [R2] for
heritage building projects.
Causes of project delays
In relation to project delays, common problems emerge from project to project. One
of the OGH stakeholders [R1] highlighted: “Bad process of planning as significance
of place is not well understood” (usually the approval of the proposed project is
revised two to five times or more); “doing work in a wrong order as work that has
been completed has been damaged because of the late work” (further causing new
rework); “having unsuitable deadline” (e.g. political interests); and “building
investigation challenges” (only visual inspection was allowed prior to the scope
definition). At the end, “It is all about the latent condition” [R2].
Different stakeholders and the project delivery
When multiple stakeholders are involved in the project, it is ideal to have a “team
environment where everyone heading towards the same outcome regardless of the
political, financial and other goals” [R2]. The stakeholders can be grouped as:
“owners – passionate and have understanding; consultants – clear thinking,
technical and historical knowledge experience; community – looking after the place
to keep it significant – individuals and organisations such as the National Trust;
regulators – ultimate protection; trades – knowledge that needs to be passed along”
[R1]. Understanding the role of the different groups enables the project to be led and
maintained in a desirable way. However, managing different stakeholders with
different interest/influence on the project is difficult especially when project attracts
considerable interest from media as well as political arenas.

Chapter 5: Project Management Challenges – Case Studies 105
Specialists and subcontractors on the project
The subcontractor could be already allocated by the heritage consultant, or “the
builder has to ensure the subcontractor for the specific work” [R3]; “there are
specific trades that are now difficult to find. In OGH, it was difficult to find a
tradesperson for the re-roofing component. Stone mason is another trade difficult to
procure” [R4]. Therefore, sourcing of traditional trades to do the specific work can
sometimes be difficult as “knowledge has not been passed along” [R3 and R4].
Moreover, “very few understand to do it in a proper way” [R1].
Heritage project components
Among the policies and procedures, scope definition, tender documentation, decision
making, managing within time, lack of information on the building and managing the
multiple stakeholders as the various heritage project components, the OGH
stakeholders identified the scope definition as the most difficult component [R1, R2,
R3 and R4], followed by the media for the tender documentation, and the lack of
information on the building. “The request for the information on the project has
become an almost daily procedure” [R2]; because the project documentation is not
detailed enough, the requests for information “take the considerable time of the
project” [R3]. Furthermore, one of the stakeholders [R4] stated that:
“I would consider defining the scope would be the most difficult component of
the project. Having the right team of heritage architects, experienced
engineers in this area would be critical in delivering the project
successfully.”
“Managing the time is another major risk item and needs to be appropriately
programmed into the timeframe incorporating consultation, stakeholder
management, risks etc.”
Project contingency
Based on their experience, the respondents stated that the project contingency
“should be a minimum 30%” [R1 and R2]: “It is quite normal to have 20 to 40%
contingency on projects of this nature” [R4]. The discovery of latent conditions is

Chapter 5: Project Management Challenges – Case Studies 106
likely to happen: “The contingency should be based on the areas of risk and the
unknowns and estimated by a quantity surveyor with experience in this area” [R4].
An appropriate amount of contingency would ensure that any further work could be
covered to ensure the project quality. Owners have an “influence in getting a good
result” [R1] by allocating the suitable amount for the contingency fund: “It is not
difficult convince the project owner as long as it has been assessed properly” [R4].
Dilapidation survey - October 2007
A survey was conducted in 2007 “to capture the existing conditions and defects prior
to removal of fabric”; it was intended that the survey would be “a reference point to
match existing fabric where required once removed” Kane Construction (2007, p.2).
The archived photo-documentation from the dilapidation survey, including external
elevations, courtyard and external landscaping, showed the condition of the building
before adaptation.
Building Exterior/ Interior
Figures 5.5 and 5.6 show photo-documentation of the building condition (exterior
and interior).

Chapter 5: Project Management Challenges – Case Studies 107
Figure 5.5: Photo-documentation of the building condition- exterior 1

Chapter 5: Project Management Challenges – Case Studies 108
Figure 5.6: Photo-documentation of the building condition - interior 2
5.5.4. Archived documentation
The conservation and adaptation process on the building and the landscaping project
was photo-documented using photos from QUT archives for the purpose of
addressing and photo-documenting the main project delays. Two items were
highlighted by the stakeholders and classified as service reticulation (Item 1) and

Chapter 5: Project Management Challenges – Case Studies 109
termite infestation (Item 2). Each item is briefly summarised below; however, the
specific time and budget implications could not be determined from the final cost.
Item 1: Service Reticulation
Example:
All the reticulations that came into the building needed to be new. The heritage-listed
garden contained large and mature trees with widespread roots. The trees had to be
treated as heritage, which meant “any damages to the roots are not allowed” [R2].
This limitation affected the directions of the reticulation infrastructure for the
services upgrade. The specific details on the time and budget implications of that
work were not possible to be extracted from the final sum.
New service reticulation in the heritage-
listed garden – one of the details

Chapter 5: Project Management Challenges – Case Studies 110
Item 2: Termite Infestation
Before:
Termite‐damaged joists – The extent
was discovered when replacing the
floorboards
Termite‐damaged joists – Sections of
joists that was highly damaged

Chapter 5: Project Management Challenges – Case Studies 111
After:

Chapter 5: Project Management Challenges – Case Studies 112
Summary of OGH delays: The structural investigation was part of the original
contract work as it was designed to be undertaken as the post-contract award due to
heritage constraints of any structural investigation prior to approval. Following the
structural investigation, a high level of termite infestation was discovered. Dealing
with the termite infestation required:
1) Rectification of roof and finishes in the ceilings
2) Rectification of first floor joists including the flooring
3) Rectification of ground floor joists including flooring.
Time and budget implications: It was not possible to extract the specific details on
the time and budget implications of that work from the final sum due to the achieved
missing documents.
5.5.5. Summary of Case Study 1
Based on the points discussed and highlighted by the OGH project stakeholders, the
main issues that affect the project performance and delivery can be summarised as
follows:
a) Pre-planning – a sufficient timeframe should be allocated during the
planning/design stage
b) Stakeholder management – a large number of stakeholders with different
interest are involved in the project
c) Community consultation – it is critical to programme this activity into the
project
d) Project risk – allocate up to 40% for contingency
e) Media and political interest is strong in this type of project
f) Heritage classification of the building limits the design
g) Scope – hard to determine
h) Getting approval from heritage bodies involves multiple redesign resulting in
additional cost and time delays
i) Latent conditions cause:

Chapter 5: Project Management Challenges – Case Studies 113
Redesign and re-documentation involving the architect, engineer and
contractor
New approvals from heritage authorities to get the design approved
Pricing issues
Difficulties in sourcing additional materials due to the limited sources
Difficulties in finding new subcontractors and trade specialists
j) Specifications should be written clearly and concisely to avoid requests for
information
k) Requests for information take up considerable time in the project
l) Adjustments to the BCA are needed in regard to heritage projects
m) Challenges to satisfy DDA
n) Non-destructive investigation prior to tender is needed.

Chapter 5: Project Management Challenges – Case Studies 114
5.6. Case Study 2: QUT Precinct 2, “Gona Barracks”
5.6.1. Introduction
The History of the place
The Gona Barracks at Kelvin Grove, Brisbane, is a rare surviving precinct that
demonstrates the pattern of Queensland military activities in history. From 1879 to
1911, the site was used by the Brisbane Grammar School under an endowment by the
then British colonial government. No buildings were constructed on the site at that
time. In 1911, the site was renamed as the Kevin Grove Defence Reserve and was
used for compulsory military training. Buildings including an infantry drill hall
began to be constructed on the site. In the 1920s, the use of the site began to diversify
as part of a gradual expansion on the site in the inter-war period including a riding
school and memorial hall. During the Second World War, a garage and workshops
were added. In 1960, the name was changed and the site became “Gona Barracks”
with the name derived from the battle of Gona on the north coast of Papua New
Guinea in 1942. The site was mostly used as base of voluntary military forces until
1998 when the barracks officially closed (Queensland Government 2015b). In 2000,
the Queensland Department of Housing purchased the site and subsequently formed
a partnership with the Brisbane City Council and the Queensland University of
Technology to develop a mixed-use urban village precinct using the Gona Barracks
site and adjacent land.
Building Characteristics
The military complex ‘Gona Barracks’ comprises approximately 70 buildings which
are located in two areas, namely, the upper barracks and the lower barracks. The
buildings that are being renovated in the Gona Barracks project are situated in the
upper barracks area. The main characteristics of the buildings are a timber structure
and a concrete base (some of the concrete bases are not original). Some of the
buildings have a gabled roof sheeted in corrugated iron and some are sheeted in
corrugated steel. Most of the buildings have the original timber linings and doors, but
some of the original doors and windows have not survived and were replaced with
steel doors. Figure 5.7 shows the Australian Army Service Corps drill hall and
wagon shed, with the plans and elevations dated from 1915.

Chapter 5: Project Management Challenges – Case Studies 115
Figure 5.7: Australian Army Services Corps drill hall and wagon shed, plans and elevations, 1915 (Source: QUT Archives)
Infantry drill hall – a large single-storey building with the gabled roof sheeted in
corrugated iron. The concrete floor is not original.
Australian Army Service Corps (AASC) drill hall – a long single-storey building set
on an original concrete base with the centrally located double storey height section.
The gabled roof is sheeted in corrugated steel.
Frank Moran Hall – a single storey building with a gabled roof sheeted in corrugated
steel. The building sits on low concrete stumps.
Infill building (at the rear of the AASC drill hall and infantry drill hall) – a single
structure building with a simple gable skillion roof.
Workshop – a large single storey building with a corrugated iron roof that has a saw
tooth profile. The building has been demolished and will be rebuilt in the same place.
Former Toowong drill hall – this building was not of cultural heritage significance.
More detailed information about the history of the buildings is presented in
Appendix G-2. Table 5.5 presents a summary of the characteristics of Gona
Barracks.

Chapter 5: Project Management Challenges – Case Studies 116
Table 5.5: Characteristics of Gona Barracks (Source: Registers and Inventories EPH QLD Government (2015b)
Name: Gona Barracks
Place ID: 601966
Registration type: State Heritage (QLD)
The Local Authority (BCC)
Architect:
Design Period: 1914–1919 World War I
Constructed between: 1914–1960s
Style: Early military building
Place Classification: Built
Place Category: Defence
Place Type: Military barracks
Cultural significance: Defence heritage
Present use of the building: Different educational purposes such as workshops
Heritage listed: Listed on the Queensland Heritage Register
Location: 3, 7, 12, 25 & 26 Gona Parade
Kevin Grove, 4059
Cultural Heritage Significance
The principal period of historical significance was during the First World War and
Second World War. Thousands of men and women who served in the defence forces
had an association with the site.
The Gona Barracks site with its buildings and other elements was identified as
culturally significant because of its aesthetic significance and the buildings’
illustration of the military use of the site. The site has strong connections to the
military community as the operations carried out on this site played an active role
during the First and Second World Wars. The landscape significance could be
identified, with the Ficus platypoda along the Kevin Grove alignment as the only
remnant vegetation on the site.

Chapter 5: Project Management Challenges – Case Studies 117
5.6.2. QUT Precinct 2 Project 2013–2015
Project Budget
The original project budget was approximately $6,085,000. The final project cost is
unknown from this stage as the project was still in progress at the time of writing The
expenditure up to the point cannot be estimated against the scheduled expenditure as
project scope has its revisions.
Project Timeframe
The original proposed timeline for project completion was August 2014. The final
project duration is unknown as the project was still in progress at the time of writing.
5.6.3. Stakeholder Interviews
As discussed previously, heritage projects—like most building projects—experience
difficulties that result in delays. To explore the experience of difficulties and
challenges in the Gona Barracks project as part of the QUT Precinct 2 project,
targeted interview questions were asked and the interview objectives were discussed
with the each of the identified stakeholders to get their views. Table 5.6 summarises
the six QUT Precinct 2 stakeholders who were interviewed.
Table 5.6: QUT Precinct 2, Gona Barracks case study stakeholder interviews
Case
Study
Interviews
Total Project
Owner
Project
Manager
Super-
intendant
Heritage/
Architect
Engineer Quantity
Surveyor
Builder
OGH √ √ 0 √/0 0 0 √ 4
Gona
Barracks √ √ √ 0/√ √ 0 √ 6
Anzac
Square √ √ √ 0/√ √ √ √ 7+1

Chapter 5: Project Management Challenges – Case Studies 118
Differences in managing/designing heritage building projects and conventional
building projects
In preserving our heritage for the future generation, the stakeholders believed that we
have to be aware of the “duty of care to preserve the architectural fabric and make
changes in a sensitive manner” [R7]. Further, it is necessary in heritage projects to
assess the “importance of the building” [R7] in order to recognise the significant
fabric and “the real intent in terms of heritage listing and how the heritage project
should be approached”; this is one of the ways in which a heritage project is
different to the conventional building project [R7].
From the technical point of view, the main differences are in the “level of detailing
in particular design, as for heritage, a higher level of detail is required” [R6].
Heritage projects are “never, 100% documented” and understanding “the building
design and how the structure was built” [R8] could be a challenge. Further,
“sourcing of original style of material is an issue” [R8] such as “having to match all
materials” [R5] and “procuring the right people, the skilled people to do the work”
[R8] due to the “reduced pool of subcontractors to do the work” [R5]. Therefore, the
importance of trades for heritage projects is crucial.
Unlike the conventional building projects where scope could be easily determined, it
is difficult in heritage projects “to determine the scope” [R5 and R10] as there is a
lack of ability to fully ascertain the condition of the building prior to obtaining the
approval.
The approval time is another difference between heritage and conventional building
projects. This is because the design itself is usually inadequate as the “footprint”
[R5] of the heritage building is fixed. The use of the space has to be reconsidered,
and “defining a use of the space” [R5] is sometimes demanding. Once “you know
where you stand” [R7], the next step is handling the technical difficulties, and the
challenge to “bring it up to the code” [R5 and R10] requires “a lot of additional
activities in the construction process to achieve code compliance”. In contrast, the
BCA could be easily applied to conventional projects.

Chapter 5: Project Management Challenges – Case Studies 119
Limitations of current policies and procedures for heritage building projects
From the structural point of view, “how much intervention is allowed in the building
against how much heritage you keep” and “replacing small parts… rather than the
whole thing” are challenges that mean “you cannot comply with the current building
code” [R9]. Sometimes there is a need “to rebuild the building to make it safe” [R9]
which goes against the heritage practice to change “as little as possible” [R9], as
“heritage people don’t want to change anything” [R9].
“The current policies and procedures are convoluted” [R6] as “there is not one
particular policy and procedure that defines what you need to do” [R6]. As a result,
the policy and procedures framework “needs to be streamlined” [R6] especially if
the “department keeps changing” [R7]. Furthermore, the stakeholders “prefer the
government to have [its] own resources and expertise”, rather than relying on the
external services. The stakeholders were concerned about “how to streamline this
process” and “make administration more efficient” [R5 and R10].
The stakeholders also advised that “ensuring the specifications are written very
clearly and concisely” would be desirable [R8] with “higher detail resolution” on
the site in order to avoid unnecessary requests for more information.
Project delay causes
According to the stakeholders, in relation to the cause of delays, “predominantly, it
is unknown latent conditions” [R9] as “the biggest one” [R6], as you have to
“design and document without knowing enough about the building” [R7]. This
problem is attributed to “the scope that is not clearly defined and all documented,
because you physically cannot document everything” [R6].
The lack of prior knowledge about the building then causes “too much work to
redesign and re-document after construction starts” [R7] with “not knowing how
long to wait the decision” [R7] and you almost always have to do a “lot more to get
the design approved” [R9]. In addition, there is not always the “time for approvals
before” [R10] the construction starts, so it takes place “during the construction”
[R10].

Chapter 5: Project Management Challenges – Case Studies 120
Discovering the latent conditions is the so-called “big exercise” [R5]. When you
“uncover something” [R5] you have to “design, price and agree on the
methodology” [R5] again, and get it approved again. The same process has to be
repeated each time the project team uncovers something new [R5].
The reality is that stakeholders are starting the project knowing that “you do know the
full extent of [what is] required” [R5]: “if you can identify [the requirements] before
construction starts” [R5], it will lead to enormous savings in the time and project
cost.
One of the stakeholders pointed out that, when a project is documented, “a lot of
detail needs to be changed as it must not fit each scenario” [R8]. Therefore, an
“early works package” [R7] needs to be considered in heritage building projects as a
“separate contract” [R7]. This would consist of “the demolition work” [R7] which
means detailed investigation work and “the removal of asbestos” [R7] if any as “the
decision on design” [R7] will help clarify the tender documentation. That kind of the
pre-tender “early works package” will require “all design approval – what to
demolish” and with the possibility of the “extent of demolition” [R7].
Sometimes the heritage authorities do not quite understand the problem of “sourcing
the materials” [R6] and the “limitation of sources”. This problem occurs because the
materials that are available today often cannot match the materials that were
available at the time the object was built.
Another cause of project delays is change introduced by the client during the
construction phase. Therefore, “the project client needs the clear image of the design
brief of what they want” [R5] to avoid the situation where the client expresses the
view that “it is not what I had in my mind” [R5].
Different stakeholders and the project delivery
Every building project involves a range of different stakeholders who have a
different interest in the project, guided by different motivations and focused on
different goals. Dealing with the multiple stakeholders and their influence is “critical
in terms of the client” [R7]. The project delivery is mostly “stakeholder driven”
[R6]: “[the] client wants to keep cost down and the architect often forgets about the
cost, while heritage authorities want to maintain the heritage components of the

Chapter 5: Project Management Challenges – Case Studies 121
building” ensuring that the heritage components “would not be compromised” [R6].
The heritage authorities, as an external stakeholder, play an important role: “they
determine what has to be kept” [R5] and “they have a final say [about] what you are
allowed to do” [R10]. Early involvement of heritage bodies during the design even
conceptual phase is desirable.
Among the internal stakeholders, it is important that the engineers “do not
overdesign what is required” [R6]. Another internal stakeholder is the
superintendent who is driven “to ensure that what the client is paying for they are
getting”, to guarantee that the “quality will be maintained” [R6] and moreover to
verify “the design team [architect, engineer and services] give a realistic view” [R6]
and are “aware of the importance and what the approaches are” [R7]. The quantity
surveyor has a hard task: “because of not standard materials, details, as there is no
set standard market rate that you can apply” [R6]. The builder’s responsibility is to
“appraise, construct and maintain the program” which might be very difficult due to
the numerous “latent conditions” on the project.
Other external project stakeholders are “the members of the public that are really
passionate about the heritage buildings” [R9] and taking into account the public
opinion of the heritage projects is highly recommended. This is especially so with
heritage projects that contain a military element or in projects where there is a much
deeper relationship to the community.
Specialists and subcontractors on the project
Finding the appropriate contractor and specialist consultancy staff could be difficult
as “expertise is a challenge” [R6]. Many times, “the realistic timeframe” is
unknown “until they start doing it” [R6]. This could be explained by “the lack of
experience” [R6], as “the subcontractors that do have the skills” are few in number.
Heritage project components
Among the various heritage project components including the policies and
procedures, scope definition, tender documentation, decision making, managing
within time, lack of information on the building, and managing the multiple

Chapter 5: Project Management Challenges – Case Studies 122
stakeholders, the project stakeholders identified the following components as the
most significant challenges: “Everything that happens on the project relies on the
design” [R6], but “during the design [there] is just a limited amount of
investigation” [R9]; therefore, the project is designed with a “lack of
information”[R9], “the scope cannot be clearly outlined” which results in “tender
documentation omissions when items are not included” [R8]. Overall, therefore, “the
biggest risk is the scope definition” [R5].
If a project has “over 2000 requests for information” [R8], then something needs to
be improved for the good of future heritage projects. For example, one solution is for
the “architect to be situated on the site” [R8]. This would enable any latent
conditions and requests for more information to be addressed immediately.
Heritage projects cannot be looked at in purely economic terms during reconstruction
when certain procedures and requirements must be undertaken to satisfy the “various
categories of significance” [R5]; nevertheless, “most of the decisions are budget
focused” [R5]. The project stakeholders stated that it was important for the client “to
know how the value of the heritage can produce some extra cost” [R9] because a
“lack of appreciation of the costs that are incurred in heritage buildings” [R10] can
be a “nightmare” [R10]. The challenge for the project team is that they still have to
“create the level of satisfaction of the client” [R10] without “compromising the end
result” [R5].
Sourcing the materials in a heritage project is “deliverable versus perception
requirements” [R10]. In the case of the Gona Barracks project, the timber was
sourced as reconstituted material from another site. Sources of the material were
extremely limited, as timber of the required size could not be found today.
The lack of information about the building such as termite infestation should be
addressed as early as possible. Many heritage buildings are termite infested, so the
stakeholders recommend “more clarity about the pest control system” such as
“termite management as the termite system gets broken”. Some of the systems such
as the “pipe system” or “elevate all timber, etc.”[R8] should be listed and the use of
each system should be specified.

Chapter 5: Project Management Challenges – Case Studies 123
Project contingency
In terms of the adequate project contingency, one of the stakeholders believed that if
more of “the testing/sampling of existing building such as: asbestos, lead paint,
contamination (in ground), rotted timber and white art damage was completed prior
to design phase, documentation could be more accurate” [R8] and less contingency
would be required to cover the risk.
5.6.4. Observation
As an observer, the researcher followed the conservation and adaptation process on
the following buildings involved in the Gona Barracks renovation project: the
infantry drill hall (A25), the AASC drill hall (A16), the Frank Moran Hall (A21), the
infill building at the rear of A16, and A21 and the Workshop (A26). The former
Toowong drill hall was not recognised as having cultural heritage significance and
was demolished.
For the purpose of addressing and documenting the issue of project delays, three
items are described in detail as follows:
Item 1: Infantry drill hall – Condition of existing roof
Item 2: AASC drill hall, Frank Moran Hall and infantry drill hall – Termite
infestation, and
Item 3: Infantry drill hall – Condition of existing slab and foundations.
A summary of each item was made including the time and budget implications to
describe an issue. Further, every item was photo-documented. For some of the items
it was possible to show the condition before and after renovation as the work was
completed. For the other items, it was only possible to document the conditions
before and during the adaptation as the work was still in progress at the time of
writing.

Chapter 5: Project Management Challenges – Case Studies 124
Plan – map of items
Figure 5.8 shows a map of the items and their locations.
Figure 5.8: Map of items and its locations

Chapter 5: Project Management Challenges – Case Studies 125
Item 1: Infantry Drill Hall – Condition of Existing Roof
Before:
Timber decay – Dry rot and termite-
damaged timber roof battens and
purlins

Chapter 5: Project Management Challenges – Case Studies 126
After:

Chapter 5: Project Management Challenges – Case Studies 127
Summary of Gona Barracks – Item 1 delay: Following the inspection of the
existing tin roof and the decision to remove and replace the roof sheets, it was also
discovered the existing roof battens and purlins (and other key timber structural
members) were in very poor condition due to timber rot and termite infestation.
Owing to the structural and safety concerns, it was decided to replace approximately
75% of the timber battens and purlins.
Time Implications: Approximately 3–4 weeks delay was caused. Non-standard
timber sizes had to be sourced to replace the timber battens and purlins. New
connection details (i.e. splicing detail of new timber into existing timber) had to be
designed and approved by the engineers.
Budget Implications: The budget implications were unknown at the time of writing;
however, an estimate would be an additional 10–15% cost

Chapter 5: Project Management Challenges – Case Studies 128
Item 2: AASC Building, Frank Moran Building & Infantry Drill Hall – Termite
Infestation
Termite-damaged joists – The extent
was discovered when replacing the
floor boards
Termite-damaged columns & timber
roof framing – Sections of timber
columns were required to be
replaced
Termite prevention measures such
as ‘termimesh’ installed to
vulnerable/key entry points

Chapter 5: Project Management Challenges – Case Studies 129
Summary of Gona Barracks – Item 2 delay: During the design phase, a condition
report including termite assessment of the heritage buildings was undertaken. The
condition report identified areas within the heritage buildings requiring repair work
and/or complete removal and reinstatement works, particularly to the timber
structure. This document was included in the tender documentation for pricing by the
main contractor.
When the work was undertaken, it was discovered the extent of the termite
infestation was much greater than anticipated and as documented in the condition
report. As a result, additional structural timber members were required to be replaced
and additional termite prevention measures were introduced.
Time Implications: It is difficult to determine the exact time implication given that
the works were spread out over a long period. In total, the time implications could be
approximately 5 weeks. Non-standard timber sizes had to be sourced to replace the
timber columns and trusses, and the lead times to source these members added to the
delay.
Budget Implications: The budget implications were unknown at the time of writing;
however, an estimate would be an additional 30% cost.

Chapter 5: Project Management Challenges – Case Studies 130
Item 3: Infantry Drill Hall – Condition of Existing Slab and Foundations
The base of the main timber
columns – timber rot/termite
damage

Chapter 5: Project Management Challenges – Case Studies 131
The existing concrete footings and
slab were in very poor condition.
The engineer could not certify the
integrity of the existing footing and
slab, and the decision was made to
remove and replace.

Chapter 5: Project Management Challenges – Case Studies 132
Damaged timber columns cut and
new sections/splicing detail
introduced as well as new footing
Damaged timber columns cut and
new sections/splicing detail
introduced as well as new footing
New footing and slab
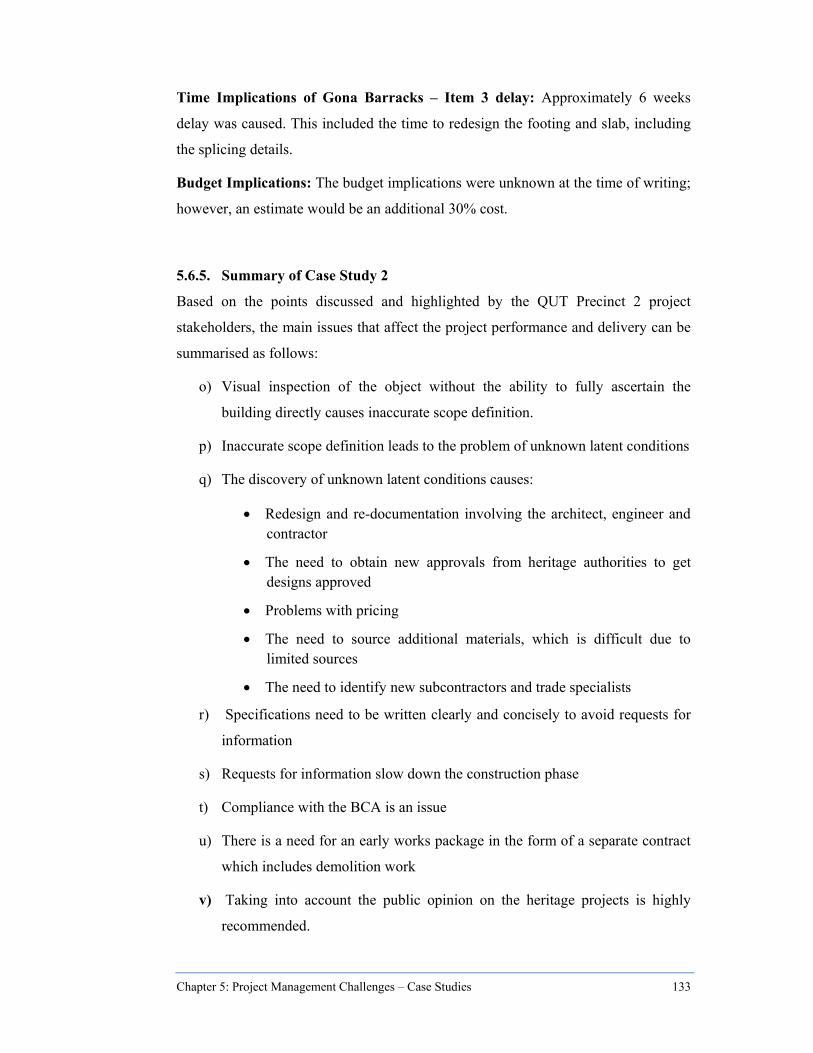
Chapter 5: Project Management Challenges – Case Studies 133
Time Implications of Gona Barracks – Item 3 delay: Approximately 6 weeks
delay was caused. This included the time to redesign the footing and slab, including
the splicing details.
Budget Implications: The budget implications were unknown at the time of writing;
however, an estimate would be an additional 30% cost.
5.6.5. Summary of Case Study 2
Based on the points discussed and highlighted by the QUT Precinct 2 project
stakeholders, the main issues that affect the project performance and delivery can be
summarised as follows:
o) Visual inspection of the object without the ability to fully ascertain the
building directly causes inaccurate scope definition.
p) Inaccurate scope definition leads to the problem of unknown latent conditions
q) The discovery of unknown latent conditions causes:
Redesign and re-documentation involving the architect, engineer and contractor
The need to obtain new approvals from heritage authorities to get designs approved
Problems with pricing
The need to source additional materials, which is difficult due to limited sources
The need to identify new subcontractors and trade specialists
r) Specifications need to be written clearly and concisely to avoid requests for
information
s) Requests for information slow down the construction phase
t) Compliance with the BCA is an issue
u) There is a need for an early works package in the form of a separate contract
which includes demolition work
v) Taking into account the public opinion on the heritage projects is highly
recommended.
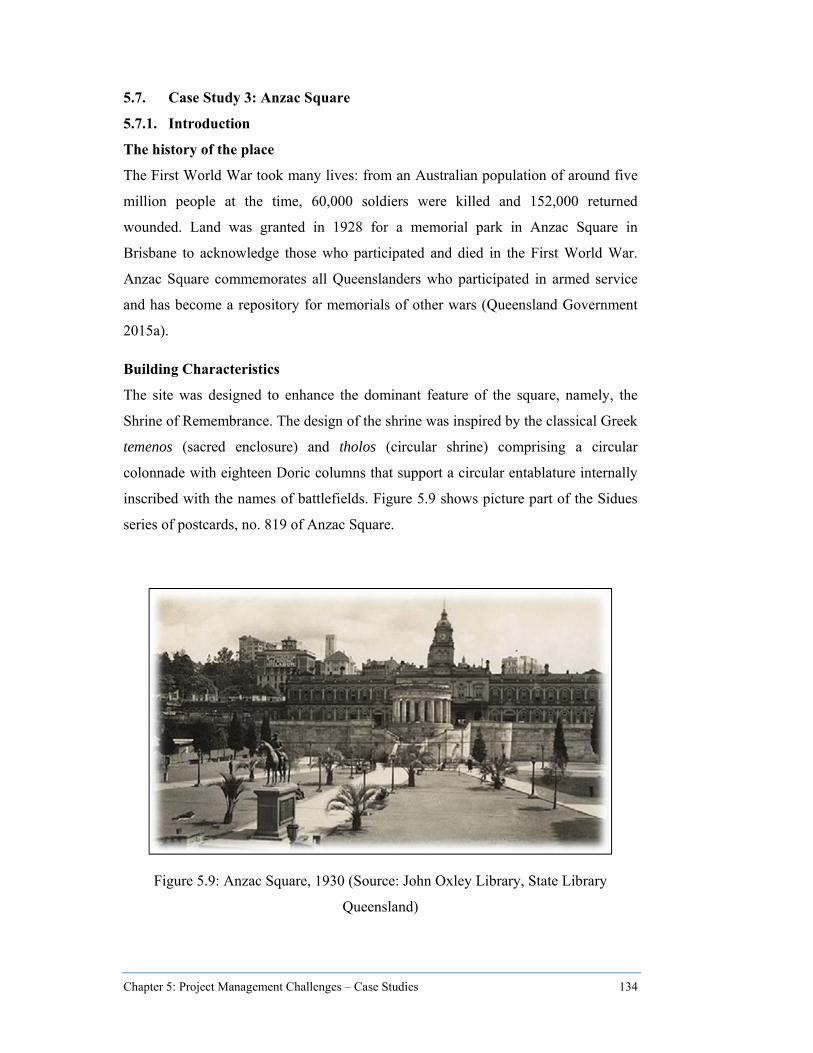
Chapter 5: Project Management Challenges – Case Studies 134
5.7. Case Study 3: Anzac Square
5.7.1. Introduction
The history of the place
The First World War took many lives: from an Australian population of around five
million people at the time, 60,000 soldiers were killed and 152,000 returned
wounded. Land was granted in 1928 for a memorial park in Anzac Square in
Brisbane to acknowledge those who participated and died in the First World War.
Anzac Square commemorates all Queenslanders who participated in armed service
and has become a repository for memorials of other wars (Queensland Government
2015a).
Building Characteristics
The site was designed to enhance the dominant feature of the square, namely, the
Shrine of Remembrance. The design of the shrine was inspired by the classical Greek
temenos (sacred enclosure) and tholos (circular shrine) comprising a circular
colonnade with eighteen Doric columns that support a circular entablature internally
inscribed with the names of battlefields. Figure 5.9 shows picture part of the Sidues
series of postcards, no. 819 of Anzac Square.
Figure 5.9: Anzac Square, 1930 (Source: John Oxley Library, State Library
Queensland)

Chapter 5: Project Management Challenges – Case Studies 135
The Queensland Women’s War Memorial was unveiled in 1932 and is located on the
western wall of Anzac Square. The relief panel was carved in sandstone from
Helidon in Queensland’s Lockyer Valley and depicts the military procession. This
panel is the work of Queensland sculptor Daphne Mayo. The symbolism of
tranquillity and renewed life is marked with the shallow tide reflecting pools situated
on either side of the staircase which leads to the shrine. Table 5.7 presents a
summary of the characteristics of Anzac Square.
Table 5.7: Characteristics of Anzac Square (Source: Registers and Inventories EPH QLD Government (2015a))
Name:
Anzac Square
Place ID: 600062
Registration type: State Heritage (QLD)
Architect: Buchanan and Cowper
Design Period: 1919–1930s (Interwar period)
Constructed between: 1928–1988
Style: Greek style
Place Classification: Built
Place Category: Monuments and Memorials
Place Type: Memorial/Monument
Cultural significance: Defence heritage
Themes: Creating social and cultural institutions/ Commemorating significant events
Heritage listed: Listed on the Queensland Heritage Register
Location: 228 Adelaide Street
Brisbane City, 4000
Cultural Heritage Significance
The principal periods of cultural significance of Anzac Square were: 1928–1988
(historical), 1928–1939 (park and memorials), and 1988 (Korean & Vietnam War
memorials). The memorial is a rare example of formal urban design on a large scale
for the purpose of commemorative services. Anzac Square is an example of
Australian war iconography which glorifies the service of men and women in armed

Chapter 5: Project Management Challenges – Case Studies 136
conflicts. The memorial is located in the central city area with built elements in a
green space as a large open park. More details about the cultural significance of the
site are presented in Appendix G-3. Figure 5.10 shows another early picture of Anzac
Square.
Figure 5.10: Anzac Square (Source: John Oxley Library, State Library Queensland)
5.7.2. Anzac Square Restoration Project Phase One (2013–2015) and Phase 2
(2016)
Project Budget
The original project budget was approximately $3,400,000. The final project cost
was unknown at the time of writing as the project was in progress. The figures given
in the observation section present the current cost overrun by items and cannot be
estimated in more detail.
Project Timeframe
In the original proposed timeline, Phase 1 was to be completed in 2015 and Phase 2
was to be completed in 2016. In the observation section, the current project overrun
is overall five weeks as presented under the items.

Chapter 5: Project Management Challenges – Case Studies 137
5.7.3. Stakeholder Interviews
Interviews were held with each of the identified stakeholders in the Anzac Square
project to get their views on the problems faced by heritage projects in meeting
financial and timeline targets. As this project employed a project programmer to
monitor the project performance, this stakeholder was added to the group of
interviewees. Table 5.8 shows the roles of the eight stakeholders interviewed in
relation to the Anzac Square project.
Table 5.8: Anzac Square case study stakeholder interviews
Case
Study
Interviews
Total Project
Owner
Project
Manager
Super-
intendant
Heritage/
Architect
Engineer Quantity
Surveyor
Builder
OGH √ √ 0 √/0 0 0 √ 4
Gona
Barracks √ √ √ √ √ 0 √ 6
Anzac
Square √ √ √ √ √ √ √ 7+1
Differences in managing/designing heritage building projects and conventional
projects
There is a perception that heritage projects run over time and over budget, but
conventional projects experience the same issues. The usual amount of contingency
to deal with latent difficulties in conventional projects is “10% and for heritage
projects it is 25%” [R16]. Heritage building projects are different as they have an
“extra layer of constraints and opportunity” [R14]. The difficulties arise when
“people do not have experience” [Q18] such as “practical experience and
understanding building techniques” [R13] which is crucial for heritage projects.
Design is based on “the information of the building [which] is in archives” [R13]
and this information is often not the latest record. Therefore, heritage projects face
the unique problem of “managing unknown factors, constantly dealing with design
and changing detail” [R17]. This leads to heritage projects “stopping – starting”

Chapter 5: Project Management Challenges – Case Studies 138
[R17] every time a new unknown factor arises. When a new factor arises, “you have
to redesign” [R17] again and it takes the project team back to the beginning.
Cost management for heritage projects is always difficult because there is no
“benchmark data available and to create budget estimates we need to adapt” [R16].
In addition, there are “no similar buildings” [R16] so every heritage project is
different.
At the time a building such as Anzac Square was constructed “no one thought about
the people with disability” [R15]. Therefore, with heritage projects “the biggest thing
is to incorporate modern standards in building under DDA [Disability
Discrimination Act 1992] compliance” [R13]. According to one of the project
stakeholders, the most difficult challenge “is to find an engineer to understand that
you cannot apply modern design and technical modern standards” [R13]; rather, the
main issue for engineers is that “the design has to be covered by code” [R13]. A
further difference between heritage projects and conventional projects is that in the
“normal building market, suppliers and subcontractors tend to be more different”
[R18]. The heritage project requirements reduce the pool, which is already small.
Limitations of current policies and procedures for heritage building projects
The lack of a building investigation (other than a visual investigation) prior to
approval causes numerous issues as it is only possible to “make the best guess
estimate” [R18]. The difficulty arises in having to define a scope “with the lack of
information about the structure – nature of the structure” [R18] together “with the
lack of information on the existing drawings” [R13] and “lack of preliminary
investigation” [R13]. This compounds the problem of already facing a “lack of
heritage experts – project managers” [R13] and trades. Therefore, there will usually
be “hidden layers” [R16] to be uncovered during the construction phase.
The usual procedure is “tracking [down] the subcontractors” using “the database
[of] who you already used or who you know” [R17]. Specialist trades “are unique
with not much competition on the market” [R17]. Efforts are made to find the
subcontractors who suit the project based on “their references, past experience, trade
qualification and samples of work”; however, “at the end of the day it comes down to
the budget, and what fits in the budget” [R17].

Chapter 5: Project Management Challenges – Case Studies 139
A further limitation in heritage projects arises when “you try to replicate heritage
work” [R13]. Sourcing the materials is not an easy task: for example, when “getting
the right stone to replace” [R13] you have to “to consider how the heritage building
will be impacted” [R12].
Causes of project delays
“Allowing the sufficient time” for investigation work in the design stage and having
access to appropriate “cost contingency” [R18] will reduce the likelihood of project
delays. When “the records are not kept” [R11] or “the archived records are not the
latest version” [R11], the documentation can be misleading. This is compounded by
problems related to “investigative works such as soil investigation, X-rays and visual
inspection on hidden elements” [R14]. Limitations in the equipment are a problem.
For example, the use of non-destructive techniques (such as X-rays) for structural
investigations is not reliable: in some cases, what was anticipated (solid concrete
beams under the slab) and what was found (brick webbing) are totally different.
“Latent conditions” [R14] and “client brief changes” [R14] are the most common
causes of project delays. Managing projects on time when “the time is based on the
current program” [R16] but “the whole sequence of events has been changed” [R13]
is the typical scenario.
Sometimes “the competitive type of arrangement and trying to win the project tend to
[lead to] underestimating the work” [R18] and this has further consequences in terms
of delays. Furthermore, when the construction phase starts “the RFI [requests for
more information] slow the process down” [R17].
In order to manage delays it is necessary “to mitigate delays as they arise not to try
and mitigate accumulated delays at the end of the project” [R18]. The construction
progress has to be strictly monitored in order “to stay on track” [R18]. However,
having the “project team and construction team working to the same goal with
everyone on the same page with quick decision making” [R17] can ensure the
project’s success.
Sourcing of the materials for the heritage projects is difficult most of the time. It is
“more challenging to get heritage stuff products as predominantly all of it was from
the UK, and we have to source from the UK” [R17]. This is because the project team

Chapter 5: Project Management Challenges – Case Studies 140
must follow the rule of “like to like” [R17], so the making of timely decisions in
procurement is critical. The “lead time for material” [R17] has to be considered and
“ordering material early on in the project” [R17] will avoid “procurement delays –
materials” [R14]. If a delay still happens, “the realistic timeframe to start with
dealing delay with procurement” [R14] has to be thoroughly considered if “there is
no more room to change” [R12].
Different stakeholders and the project delivery
Through the decades, war memorial sites have been of broad interest to the
community. Today, the “community are more interested in theoretical outcomes,
purity of restoration and integrity of building” [R14]. Further, any intervention to a
memorial site can result in “losing the essence of community” [R14]. War memorials
have “extremely personal attachment” [R14] to the families who lost loved ones in a
war and have to be dealt with sensitively as “people get very emotional” [R14].
Managing the project in line with the “political agenda” [R16] puts an added
pressure on all project stakeholders.
Different project stakeholders have different goals: “Getting all the team to recognise
opportunities and constraints is a challenge” [R14]. Every stakeholder “has a
different perception which leads to a different set of objective in their mind and from
the objective and design” and “if some of their objectives cannot be met, animosity
between different stakeholders can be [present]” [R18]. Therefore, “managing
expectations in the initial phase” [R18] is desirable.
War memorial projects must be “dealt with very carefully and thoughtfully” [R16]
especially due to the community expectations. Managing stakeholders, either
external or internal, is about “managing expectations – what they expect and what
they receive” [R17] and sometimes “changing the mind” will require “more work
which will impact to extend [i.e. delay]” [R17]. Not every stakeholder can visualise
the space from the design and sometimes it can cause the additional changes.
Sometimes the stakeholder “does not have visibility of cost” [R18] and this can give
rise to issues as every post-design intervention is always more costly.

Chapter 5: Project Management Challenges – Case Studies 141
Specialists and subcontractors in the project
The Anzac Square project was affected by the availability of “only two stone masons
in Queensland” [R13]. The “NSW heritage advisory network” [R14] helped the
project team and contractors to find “recommendations for suppliers” [R14].
Heritage project components
The Anzac Square project stakeholders were asked to identify the most significant
challenges among the various heritage project components including the policies and
procedures, scope definition, tender documentation, decision making, managing
within time, lack of information on the building, and managing the multiple
stakeholders. They reported that the quality procedure is “the rigorous procedure”
[R17], and “the difficulties arrived with not having documentation” [R17] and
adequate “access to the site” [R14]. Most of the time, “assessing the condition of the
building can be difficult” [R14]. Therefore, an “incomplete tender set” results in
“latent conditions – that leads to variations, council requests, etc.”[R17]. The worst
thing is when “the amount of investigation is related to money” [R17].
Further, “how much to take out and to put back is the biggest issue” [R15] in relation
to the scope. For example “the demolition and investigation package [should specify]
all fabric to be removed to enable accurate assessment of the building” [R14]. It will
enable the project team “to fully address the scope” so we will get a “more accurate
tender” and “unknown factors then could be eliminated” [R17]. The project will be
able to “save time and money on construction process” if the “limitation to
investigation” [R17] is addressed and “to demolish” [R17] is allowed prior to scope
definition. Without this, the project team is forced “to design without knowing”
[R17]. It is important that the “project roles are clearly defined” [R14] from the
beginning of the project, as a “change of command” [R14] during the project can
influence multiple stakeholder relationships.
Project contingency
“Allowing sufficient contingency” [R18] helped the project to get back on the track.

Chapter 5: Project Management Challenges – Case Studies 142
5.7.4. Observation
As an observer, the researcher followed the adaptation process of the heritage
memorial for the purpose of addressing and documenting the project delay causes.
The following four items were described in detail:
Item 1: Retaining wall on the Ann Street footpath
Item 2: The Ann Street footpath
Item 3: The cenotaph
Item 4: Concrete stairs (around the cenotaph).
A summary was made of each item including the time and budget implications.
Every item was photo-documented. The items were documented before and during
the adaptation as the works were still in progress at the time of writing.
Plan – map of items
Figure 5.11 shows the Anzac Square restoration project including the proposed
colonnade plan with a map of items and their locations.
Figure 5.11: Anzac Square restoration project map of items and their locations

Chapter 5: Project Management Challenges – Case Studies 143
Item 1: Retaining Wall on the Ann Street Footpath
Reconstruction:
Retaining wall /issue 1/ – in a
different location to the document
on the tender drawings
Retaining wall /issue 2/ – the depth
of the retaining wall that was not as
anticipated

Chapter 5: Project Management Challenges – Case Studies 144
Summary of Anzac Square restoration – Item 1 delay: Following the removal of
the concrete slabs, it was discovered two latent conditions in regards to the retaining
wall. The retaining wall on the Ann Street footpath was in a different location to that
documented on the tender drawings. The information from the tender drawings was
based on old drawings found in archives. As a consequence, it added the additional
work to increase the length of the steel beams and increase the amount of bondek
formwork on top to pour the new concrete slabs. The above photos show the actual
length of the void space under the existing concrete slabs.
The second discovery was the depth of the retaining wall that was not as anticipated.
Again, this was based on old original drawings. This strengthens the theory of the
importance of as-built drawings. This discovery involved an additional excavation up
to 1000 mm and additional waterproofing to ensure the waterproofing integrity.
Time implications: Approximately two weeks delay.
Budget implications: The budget implications were unknown at the time of writing;
however, an estimate would be approximately 5–8% to the cost in this area of work.

Chapter 5: Project Management Challenges – Case Studies 145
Item 2: The Ann Street Footpath
Summary of Anzac Square restoration – Item 2 delay: Another latent condition
that has been found on site was existing concrete hobs in the void space under the
existing footpath slabs (refer to photo above). This required modifications of the steel
beams around this structure and also required cutting the top of the concrete hobs in
order to be able to install the new bondek and suspended slab. Again, this
information was based on original drawings. Over a period of time, modifications
have been made to the structure and there has been no as-built drawings. This is very
indicative of old buildings, as changes are made but are not documented. As a result,
this added the additional scope of work and required the new design.
Time Implications: The approximate time implication would be one additional
week.
Budget implications: An estimate of the budget implications was an additional 2%
cost.
The Ann Street footpath – uncovering
the existing concrete hobs in the void
space under the existing footpath slabs

Chapter 5: Project Management Challenges – Case Studies 146
Item 3: The Cenotaph
Before:
The cenotaph – there were no solid
concrete beams under the slab
however it was only existing brick

Chapter 5: Project Management Challenges – Case Studies 147
After:
The cenotaph – the brick webbing
removed in preparation for the new
concrete beams and slab
The cenotaph – the whole existing
slab has been removed

Chapter 5: Project Management Challenges – Case Studies 148
Summary of Anzac Square restoration – Item 3 delay: The existing conditions in
the cenotaph were uncovered once the existing concrete slabs were removed. The
investigation of the structure had been undertaken by using non-destructive testing,
such as an X-ray machine. It was anticipated that there were solid concrete beams
under the slab; however, it was only existing brick webbing. Moreover, the existing
brick webbing was not structurally adequate and the best solution to the problem
involved installing two new concrete beams to support the new slab. As a result, the
brick webbing was removed in preparation for the new concrete beams and slab
which added to the additional scope of work and the new design.
Time implications: The approximate time implication would be one additional
week.
Budget implications: An estimate of the budget implications was an additional 2%
cost.

Chapter 5: Project Management Challenges – Case Studies 149
Item 4: Concrete Stairs (around the cenotaph)
Concrete stairs – The thickness of
existing concrete stairs had been
anticipated at 300 mm
Concrete stairs – The existing
thickness when uncovered was
approximately 600 mm thick

Chapter 5: Project Management Challenges – Case Studies 150
Summary of Anzac Square restoration – Item 4 delay: The latent condition was
the thickness of the existing concrete stairs around the cenotaph. It was anticipated to
be 300 mm thick when in fact it was approximately 600 mm thick, which increased
the demolition time and cost in this area by approximately 75%. Due to the nature of
the surrounding stone work, large demolition methods could not be used. Therefore,
demolition had to be carried out using small hand-held breakers. This was very
labour-intensive and therefore costs and delays increased.
Time implications: Approximately one additional week; this included the time to
redesign, including the new details.
Budget Implications: An estimate of the budget implications was an additional 75%
for this section of the demolition works.
5.7.5. Summary of Case Study 3
Based on the points discussed and highlighted by the Anzac Square project
stakeholders, the main issues that affect the project performance and delivery can be
summarised as follows:
a) Design is based on archived documents; however, problems arise because:
Records are not kept
The archived records are not often the last record
b) Documentation can be misleading due to:
Lack of sufficient time for investigation work
Lack of information of the building (“make the best guess estimate”)
Lack of heritage experts who can take on the role of project managers
Limitations of equipment for investigations using non-destructive
techniques
Assessing the condition of the building is difficult
Assessments of the site is not made frequently enough
High cost of post-design intervention
c) The discovery of previously unknown latent conditions leads to:

Chapter 5: Project Management Challenges – Case Studies 151
Variations
The project stopping and starting
Redesigns involving the architect, engineer and contractor
Going back to heritage authorities to get new designs approved
Pricing problems
Difficulties in sourcing the materials
Difficulties in finding trade specialists to do the work.
d) The political agenda is an added pressure
e) The client’s brief changes
f) Requests for information slow down the construction phase
g) The need for the design to be covered by the Building code (BCA) is an issue
h) Complying with the Disability Discrimination Act 1992 (DDA) is a challenge
i) Small pool of subcontractors and suppliers
j) A demolition and investigation package is highly needed.
5.8. Cross-Case Study Analysis
Following the summary of the case studies, the cross-case analysis is summarised in
Table 5.9 to provide a visual overview of the issues experienced in heritage projects.
The issues were selected if they occurred in a minimum of two case studies. The
items that had only one acknowledgment were not included.
A number of issues repeatedly emerged showing in the heritage project case studies.
The interviews enabled the most frequently encountered issues to be highlighted and
investigated in more detail. As set out in the discussion chapter (Chapter 7), the
interviewees also suggested solutions to address the issues as each of the
stakeholders was highly interested to identify what needs to be done to ensure the
successful delivery of the projects. Table 5.9 presents the summary of the issues
highlighted in the case studies and the identified causes.

Chapter 5: Project Management Challenges – Case Studies 152
Table 5.9: Cross-case study analysis – highlighted issues and causes
Delivering heritage project – ISSUES
Case study - Experiencing an
issues
Delivering heritage project -
CAUSES
OGH GB AS
Records are not kept Archived record not often the last
record
Yes
Yes
Yes
documentation/ drawings based on the archived records – not reliable 100%
Lack of sufficient time for investigation work
(assessing the condition of the building)
No Yes Yes Fully extend what is required is
unknown The best guess estimate
Expertise in heritage projects Yes Yes Yes Unrealistic time frame New rework
Obtaining approval from the heritage bodies
Yes Yes Yes Multiple redesigns
Visual inspection of the object Yes Yes Yes
Hard to define scope of the work, design and document without knowing enough about the building - results in inaccurate scope definition
Inaccurate scope definition Yes Yes Yes Incomplete tender set
Incomplete tender set Yes Yes Yes Latent conditions
Latent conditions Yes Yes Yes
Multiple design, price and agree on the methodology : architect – engineer – contractor
Heritage authorities - to get design approved
Searching for trades specialist Sourcing materials Notice of likely delay (NOLD) Variations
Specifications / site documentation Yes Yes Yes Not enough documented results in
numerous RFI
Request for Information (RFI) Yes Yes Yes Slow down the construction phase
Sourcing the materials Yes Yes Yes Overseas If hardly to match result Inadequate
replacement
Building Code of Australia (BCA) Yes Yes Yes Hardly to comply with the current
building code
Discrimination Disability Act (DDA) Installations to satisfy disability
access
Multiple Stakeholder Management Yes Yes Yes Project delivery is stakeholder driven Client brief change
Media and political interest Yes No Yes Attract considerable interest from
media as well as from political arenas

Chapter 6: Project Management Challenges – Survey 153
Chapter 6
PROJECT MANAGEMENT
CHALLENGES – SURVEY
6.1. Introduction
Chapter 5 examined the literature review, extended the knowledge, and clearly
identified the challenges that heritage projects are facing by using the three case
studies. The cross-case summary (Table 5.9) highlighted the challenges and causes
identified in all three cases, thus helping to answer the second research question. This
chapter presents the findings of an online survey conducted by using the Key Survey
system of Queensland University of Technology. The key survey link was distributed
to potential respondents and the survey was open for 37 days and during that period,
444 responses were received (a response rate of 60.1%). The sample of the survey
respondents achieved the targeted level for a random sample to ensure that the data
was representative of both external and internal stakeholder groups. In order to get
accurate findings from the data, applicable statistical procedures were employed to
ensure meaningful output from the collected data.
The analysis involved the application of descriptive statistics and multivariate
statistical procedures. The descriptive statistics encompassed frequency distributions
and measures of the individual mean, median and standard deviation. Furthermore,
the CFA followed by SEM were employed to determine the significant correlation
and direct influence between the proposed concept/model driven from the theory and
rooted in practice through the respondents’ many years of experience. The proposed
model derived from the theory was tested through SEM in order to examine the fit to
the sample data. The collected data was divided and analysed using two theoretical
models to ensure accurate findings and to answer the targeted research question.
Where applicable, the results from the CFA were enriched with interview highlights
to form the best representative construct for the SEM.

Chapter 6: Project Management Challenges – Survey 154
6.2. Preliminary Results
The aim of the preliminary data analysis was to ensure the reliability of the data. This
section discusses the results of the descriptive statistics related to the identification
and appropriateness of the respondents, and the checking processes for missing data,
outliers and normality distribution.
Demography of respondents
The questionnaire survey targeted two different stakeholder groups in order to obtain
an accurate answer to the three research questions, namely, the internal stakeholder
group (INTS) and external stakeholder group (EXTS). External stakeholder
participants were targeted to answer the first research question/general questions, and
the internal project stakeholders were targeted to answer the second and third
research questions as these questions required the respondent to have real project
experience.
External respondents
The external respondents were members of the general public with an interest in
heritage, and included the end-users of heritage buildings/places, owners of the
heritage building/place or tourism and related organisations. The aim of including the
external respondents was to gather an overall ‘picture’ of public opinion regarding
what heritage buildings and places mean to the general public. The results
represented a reflection on the general level of interest of the public in retaining
heritage places: 95% of the respondents were members of the general public, and the
remaining 5% represented tourism operators and owners of heritage places.
Internal respondents
The internal stakeholder group consisted of all types of specific heritage project
stakeholders, including project owners, project managers, contractors/builders,
architects, heritage consultants, engineers (all disciplines), quantity surveyors,
superintendents, heritage administration as an approval body, building tradespeople
and archaeologists. The most highly represented groups among the internal
respondents were contract builders (22.42%), architects (21.82%) and heritage

Chapter 6: Project Management Challenges – Survey 155
consultants (21.21%). This significant distribution of respondents draws a range of
views from a specifically targeted research population targeted at helping to improve
the delivery phases (such as the planning and design) for future heritage projects.
Respondents’ current location
The majority of respondents were Queensland-based (69.39%), followed by New
South Wales (18.79%). The other states and territories were represented as follows:
Victoria (7.27%), South Australia (6.06%), Western Australia (4.85%), Tasmania
(1.82%), Australian Capital Territory (1.21%) and Northern Territory (0.61%).
Respondents’ type of workplace
Most of the respondents were employed in the private sector (52.73%), followed by
the public sector (31.5%) comprising state or federal government departments and
agencies (21.82%), local government (9.7%) and non-profit organisations (3.03%).
The remainder of the respondents were in “other” work situations including
retirement (19.39%).
Respondents’ membership of organisations
The survey questionnaire asked the respondents to indicate their membership of
organisations, using a multiple response question that enabled the respondents to tick
as many as applicable and also to add some other organisations that were not
presented as an option. The results showed that most of the respondents were
members of ICOMOS (38.79%), followed by “other” organisations (27.27%) (the list
of other organisations is presented in Appendix F5). Respondents were also members
of the National Trust (24.24%), Australian Institute of Architects (18.79%),
Australian Institute of Project Management (5.45%), Master Builders Australia
(4.85%), Australian Institute of Quantity Surveyors (2.42%), Australian Institute of
Building Surveyors (1.82%), Australian Institute of Building (1.82%), Royal Institute
of Chartered Surveyors (1.21%), and the Urban Development Institute of Australia
(1.21%). A number of the respondents were not members of any related organisation
(21.82%).

Chapter 6: Project Management Challenges – Survey 156
Respondents’ experience with heritage projects
It was important to determine the respondents’ experience in heritage projects. The
results showed that the respondents with a high level of experience (20+ years) and
the respondents with a low level of experience (0–5 years’ experience) were equally
represented (30.3% and 30.3%, respectively). These groups were followed by
respondents’ with 10–20 years’ experience (26.06%) and respondents with 5–10
years’ experience (13.33%).
Respondents’ work focus
The survey discovered the portion of the respondents’ work focus that was
specifically related to heritage projects. The results indicated that work was 100%
heritage related for 23% of the respondents. For 15% of the respondents, their work
focus on heritage projects was 50–70%, and for 13% of the respondents their work
focus on heritage projects was 25–50%. For almost half of the respondents (49%),
their work focus on heritage projects was 0–25%.
Respondents’ project sizes
The questionnaire sought to gather data on the size of heritage projects that
respondents had worked on, based on project cost. The results showed that 35% of
respondents had worked on heritage projects with the estimated project cost between
$1 million and $10 million, followed by 30% of respondents who had worked on
projects with an estimated cost of less than $1 million. Furthermore, 18% of
respondents had worked on projects with an estimated cost between $10 million and
$50 million, and 15% had worked on projects with a cost of greater than $50 million.
Respondents’ experience based by state/territory
The majority of the heritage projects that the respondents had worked on were based
in Queensland (49.09%), followed by New South Wales (23.64%), Victoria (9.09%),
South Australia (6.67%), Western Australia (5.46%), Tasmania and the Australian
Capital Territory (both 2.42%) and the Northern Territory (1.21%). Among the
respondents with overseas experience (17%), the locations included: the United

Chapter 6: Project Management Challenges – Survey 157
Kingdom, South Africa, European Union, Nigeria, Hong Kong, Iran, United States of
America, Saudi Arabia, Afghanistan, Sri Lanka, Spain, Bangladesh, Vietnam,
Austria, New Zealand, Wales, Germany, China, Ireland, Pakistan and Dubai.
Respondents’ experience based on listing of projects
The majority of respondents had worked on projects for heritage sites that were state-
listed (75.32%), followed by locally-listed (65.19%), nationally-listed (50.63%) and
world-listed sites (23.42%).
Respondents’ project type
The questionnaire asked the respondents to rate one of their typical projects,
providing information that allowed the researcher to interrelate the types of projects
based on budget, timeframe, expenditure, contingency and other common issues.
Respondents’ particular project experience within the certain listed level/s
Most of the projects chosen by the respondents for further discussion were state-
listed (49%), followed by locally-listed (24%), nationally-listed (14%), and world-
listed (4%). Five of the heritage projects selected for further questioning were not
inscribed in any heritage register.
Respondents’ particular project experience in regard to project cost
Most of the projects selected by the respondents for further questioning had a cost of
less than $1 million (41%), followed by projects with a cost between $ 1 million and
$10 million (37%). Thus, most of the selected heritage projects cost less than $10
million. Some of the projects selected by the respondents for further discussion cost
between $10 million and $50 million (13%), while 9% of the projects selected by the
respondents cost more than $50 million.

Chapter 6: Project Management Challenges – Survey 158
Respondents’ experience of project time goals
More than half of the projects had met time goals (59.39%), while 35.15% of the
projects had experienced some kind of difficulties that resulted in the project falling
behind schedule. Furthermore, 5.45% of the respondents’ projects had been able to
perform better than scheduled.
Respondents’ experience of project budget goals
In terms of meeting project budget goals, 52.8% of the projects had been completed
within the proposed budget, 40.99% of the projects required an additional budget due
to unexpected circumstances, and 6.21% were successfully completed at a cost less
than allocated.
Respondents’ particular project experience in regard to project special requirements
The heritage impact statement was required for 29% of projects, followed by projects
requiring a conservation management plan (27%) and other specialised reports (26%)
and reports (17%) as shown in Appendix F1.
Respondents’ experience of different needs for the contingency expenditure
In terms of the contingency expenditure on the specific problems in the project, in
41% of the respondents’ projects the allocated contingency had been spent on
unknown situations discovered after work started. Problems with particular materials
such as stone, mortar and timber were the second specific problem (23%), followed
by problems with the particular elements such as roof and windows (13%).
Contingency expenditure for other purposes was required in 12% of the projects
(AppendixF4), and contingency expenditure was required for termite infestation in
10% of the projects.

Chapter 6: Project Management Challenges – Survey 159
Respondents’ experience of the allocated amount of contingency in the project
Almost every second project experienced the proposed contingency allocated for the
project being insufficient to cover the additional work required (46.8%), with
53.15% of the respondents’ projects being able to cover any additional work within
the allocated contingency expenditure.
Respondents’ suggestions regarding the amount of contingency
Regarding the required amount of contingeny, 49% of the respondentssuggested that
the amount should be between 10%–20%, followed by 33% of the respondents who
suggested that the amount of contingency for the project should be between 20%–
30%. For 8% of the respondents, 8% of contingency was considered to be enough to
cover the additional work, while 10% listed other recommended amounts (as shown
in Appendix F7).
Respondents’ challenges meeting the Building Code of Australia
In the work on heritage buildings, 50% of the respondents had faced some kind of
difficulties in meeting the Building Code of Australia requirements for:
Fire safety – 70% of the respondents had faced difficulties in meeting the BCA,
while 30% of the respondents had not faced this kind of difficulty.
Workplace safety – Half of the respondents had faced difficulties in meeting the
BCA with regard to workplace safety.
Disability access – 78% of the respondents had faced some kind of difficulty in
applying the BCA requirements in the project in regard to disability access.
Respondents’ maintenance challenges
The respondents faced the following maintenance challenges: ‘adjusting the design
to get the approval’ (20%), followed by ‘finding the right materials’ (17%). Both
‘getting approval from council/government’ and ‘finding the skilled person’ (15%
including ‘other’) were in the third place. Further, the respondents found ‘getting

Chapter 6: Project Management Challenges – Survey 160
advice (architect, engineer, other specialist)’ and ‘finding helpful technical
information (library, online, etc.)’ to be the cause of maintenance challenges (10%).
6.3. Coding Data
As explained previously, the variables extracted from the key survey results were
labelled (as shown in Appendix C). The data exported from the key survey results
was given numerical values that were aligned with the text values to enable the
reader to understand the results obtained from the different tests applied to both
(Zikmund et al. 2010).
6.4. Missing Values
As previously stated, the parameters of the CFA model and the structural equation
model were obtained using both the ML algorithm and the MLMV algorithm and the
MLMV and ML procedures were run on all cases. The missing data did not have an
impact on the model results, as the MLMV model statistically was similar to the ML
results. The missing data across all the model variables was less than three percent.
6.5. Outliers
This research project used an online key survey with built-in validation rules so that
responses could only take on allowable values from 1 to 5. Therefore, all the
variables were within the ordinal scale range of 1 to 5. One record (ID No. 51)
exhibited consistently low survey responses across most items. All multivariate
statistics were run with this record included and with this record removed to ensure
this observation did not bias the results. No differences in any of the multivariate
tests were observed and this record was subsequently included in all analyses.
6.6. Normality of Distribution
The Shapiro–Wilk (SW) and the Shapiro–Francia (SF) tests for univariate normality
were conducted across all relevant scale items, and the results are reported in
Appendices D-2-1 – D-2-2. These tests have been shown to be reliable for samples
between 4 ≤ n ≤ 2000 observations for the SW procedure and between 5 ≤ n ≤ 5000
observations for the SF procedure (Royston 1982; Royston 1991).

Chapter 6: Project Management Challenges – Survey 161
The results for the PM model construct showed that the data was normally
distributed. The HR model result indicated that the following four values did not
show normal distribution: a1 (q7a1), a3 (q7a3), a7 (q7a7) and b2 (q8a2). Table 6.1
shows the four indicated values that were not normally distributed.
Table 6.1: Values that were not normally distributed
Prob>z Data Code Description
0.00002 a1 (q7a1) Appearance and design qualities
0.03797 a3 (q7a3) Contribution to streetscapes and views
0.00001 a7 (q7a7) Historical importance – evidence of past ways of life
0.00001 b2 (q8a2) Cost/ Investment
CFA and structural equation models usually use the ML estimation function to
determine model parameters. ML is the default model estimation procedure within
most statistical packages including Stata; with the ML estimator being consistent,
efficient and asymptotically normal if multivariate normality holds and the sample
size approaches infinity (Long and Freese 2006, p.77). Although ML estimators are
widely used to model small to large data sets, their exact behaviour in small data sets
(less than 500 observations) is largely unknown. Potential estimators may not be
consistent and efficient, and this situation may be made worse in the absence of
multivariate normality (Long and Freese 2006, p.77). Stata provides four estimation
methods for SEM models, the maximum likelihood (ML), quasi maximum likelihood
(QML), asymptotic distribution free (ADF), and maximum likelihood with missing
values (MLMV).
The assumptions one must make to establish the consistency of the SEM estimates
and their asymptotic normality is determined by the method used to estimate them.
To this end, ML is the default estimation method that SEM uses. In SEM, the
function being maximized formally assumes the full joint normality of all the
variables, including the observed variables. But the full joint-normality assumption
can be relaxed, and the substitute conditional-on-the observed-exogenous-variables is

Chapter 6: Project Management Challenges – Survey 162
sufficient to justify all reported estimates and statistics except the log-likelihood
value and the model-versus-saturated χ2 test.
QML uses ML to fit the model parameters but relaxes the normality assumptions
when estimating the standard errors, however QML has little impact on remedying
non-normality issues for latent variables, but in these situations, it does provide more
robust latent construct estimates than ML.
ADF is a form of weighted least squares (WLS) and is a generalized method of
moments. In simulations of the measurement model with X ~ χ2(2), ADF produces
excellent results , even for the standard error of the variance of X. However ADF is
less efficient than ML when latent variables can be assumed to be normally
distributed. If latent variables (including errors) are not normally distributed, ADF
will produce more efficient estimates than ML or QML.
Given that the population of ‘professionals’ was less than 500 and some of the items
showed non-normality, the CFA model and structural equation model were fit using
the ML function, as well as the asymptotic distribution free function (ADF) function
and the quasi-maximum likelihood (QML) function. The main advantage of the ADF
and QML functions for the CFA model and structural equation model is that
multivariate normality is not required (Acock 2013, p.15) and in the absence of
multivariate normality, the ADF and QML estimators can be more consistent and
more efficient than ML estimators. However, in the models developed in this
research, ‘little’ difference was observed between the ML, ADF and QML
estimators; hence, the ML estimator procedure was unbiased even with the small
sample plus some items showing non-normality.
ML also uses list-wise case deletion that produces unbiased estimators if the missing
data is missing completely at random. The MLMV method in Stata 13 aims to
retrieve as much information as possible from observations containing a small
number of missing values. In this regard, the SEM methods of ML, QML and ADF
“do a poor job” (Acock 2013; Rubin 1996, 1972). QML and ADF are known as list
wise deleters. If variable x1 appears anywhere in a model and if x1 contains a
missing value in observation 10, then observation 10 will not be used if list-wise
deletion is employed. This occurs whether x1 is endogenous or exogenous and if x1
appears in some equations but not in others (Acock 2013, p.15). However, method

Chapter 6: Project Management Challenges – Survey 163
MLMV formally requires the assumption of joint normality of all variables, both
observed and latent. Therefore, using the modified MLMV as another alternative,
observation 10 will only be omitted in those regressions that require x1; if not
required, the record is included and all other recorded variables are available for
subsequent use (Stata Press 2013, p.43-45). The MLMV method was also used in all
the CFA model and structural equation model in the present study to ensure the
impact of missing data was minimised.
6.7. Reliability of the Data
Cronbach’s alpha coefficient was used to examine the internal reliability of each
scale. As already discussed, different researchers propose different justifications for
the Chronbach alpha, and this research project followed the reliability level
established by George and Mallery (2003) where >0.7 = acceptable, >0.8 = good fit,
and >0.9 = excellent. The results for the reliability test for each construct KR, MC,
PD, EC, Technical and M_stake are as shown in Table 6.2, indicating that all the
constructs were able to be further examined as they were all reliable.
Table 6.2: Cronbach’s alpha results
Chrombach’s Alpha
Construct Reliability level by George and Mallery (2003)(>0.7=acceptable,>0.8=goodfitand>0.9=excellent)
0.763 MC Acceptable fit
0.809 KR Good fit
0.884 PD Good fit
0.895 EC Good fit
0.900 Technical Excellent fit
0.920 M_stake Excellent fit
6.8. Descriptive Statistical Analysis
The results from the descriptive statistical analysis of the frequencies (Tables 6.3 to
6.8) show the top-ranked scores based on the mean values for each of the constructs,

Chapter 6: Project Management Challenges – Survey 164
KR, MC, PD, EC, Technical and M_stake. The standard deviations in the tables
show the measure of dispersion around the mean.
Table 6.3: Key reasons (KR)
Mean Std. Dev. Data Code Description
4.58 0.666 a7 (q7a7) Historical importance – evidence of past ways of life
4.33 0.750 a6 (q7a6) Rarity
4.25 0.706 a2 (q7a2) Landmark qualities
For mean score scale: from 1 = strongly disagree to 5 = strongly agree.
The KR results indicate that historic importance was given as the key reason for the
preservation of heritage places. Based on its strong ‘highly agree’ rating, historical
importance (evidence of past ways of life) was seen as an imperative factor. The
rarity of the historic place, followed by the landmark qualities, were the next top key
reasons for preserving heritage places. The lowest mean value was 3.65, which
indicates that all ten measured key reasons were important. The results of the
frequencies and descriptive statistics of the heritage retention (HR) construct, key
reasons (KR) and main challenges (MC) can be seen in Appendix D-4-1.
Table 6.4: Main challenges (MC)
Mean Std. Dev. Data Code Description
4.21 0.822 b2 (q8a2) Cost/ Investment
4.14 0.766 b3 (q8a3) Availability of funding sources (Gov, non-Gov, private, etc.)
3.93 0.966 b10 (q8a10) Urban Development
For mean score scale: from 1 = strongly disagree to 5 = strongly agree.
The MC results showed that the two top-ranked challenges to retaining heritage
places were related to the financial aspects of projects. The first main challenge was
cost/investment’, which means that any action to retain heritage will be strongly

Chapter 6: Project Management Challenges – Survey 165
connected with the perception of the project cost. This was followed by the
availability of funding sources (public or private sector funds) which greatly
influences the decision to retain heritage sites. The respondents saw urban
development as a third main challenge. This echoes the emphasis placed by the
Australian State of the Environment Committee (2011) on the importance of taking
action to protect heritage places from further development pressure in order to retain
their value. The lowest mean value was 3.38, which indicates that all ten measured
challenges were believed to have an influence on heritage retention. The results of
the frequencies and descriptive statistics of the heritage retention (HR) construct, key
reasons (KR) and main challenges (MC) can be seen in Appendix D-4-1.
Table 6.5: Planning/Design (PD)
Mean Std. Dev. Data Code Description
3.84 0.895 q27a3 Availability of funding sources
3.67 0.942 q27a6 Defining the scope accurately
3.63 1.017 q27a4 Political influence/interest
3.56 0.815 q27a1 Approvals – Timeframes for Local/State/Federal heritage
For mean score scale: from 1 = Not at all influential to 5 = Highest influence.
The results for the planning and design stage of the project management lifecycle
confirmed once again the importance of availability of funding sources. The second
challenge that was found to highly influence the ability to meet project delivery
objectives (on time and on budget) was scope definition. Political influence/interest
was the third-ranked challenge, showing the importance of heritage places that are
often used as a political tool. The timeframes for local/state/federal heritage
approvals were seen to have an influence on the final project time overrun and
therefore the budget. The lowest mean value was 2.95, which indicates that all
sixteen measured PD challenges were believed to have a degree of influence on the
project delivery objectives. The results of the frequencies and descriptive statistics of
heritage building project challenges and project performance (PP) can be seen in
Appendix D-4-2.

Chapter 6: Project Management Challenges – Survey 166
Table 6.6: Execution/Construction (EC)
Mean Std. Dev. Data Code Description
3.95 0.841 q28a15 Financial/budget considerations/constraints
3.90 0.837 q28a3 Qualifications/experience of contractor/subcontractors
3.72 0.991 q28a1 Qualifications/experience of project design team
3.70 0.965 q28a12 Lack of coordination/communication between design team/client/contractor
For mean score scale: from 1 = Not at all influential to 5 = Highest influence.
The survey results on the execution/construction phase also confirmed the top main
challenge was again of a financial nature (financial/budget
considerations/constraints). The qualifications/experience of the
contractor/subcontractors and qualifications/experience of the project design team
were the second and third main challenges faced in this phase of a heritage project
lifecycle, concurring with the Australian State of the Environment Committee’s
(2011) report on the lack of skills and expertise. The lowest mean value was 3.32,
which indicates that all fifteen measured execution/construction phase challenges
were seen to have an influence on the project delivery objectives. The results of the
frequencies and descriptive statistics of heritage building projects, challenges and
project performance (PP) can be seen in Appendix D-4-2.
Table 6.7: Technical factors (Technical)
Mean Std. Dev. Data Code Description
3.29 1.034 q29a6 System in place to identify what is significant fabric
3.27 1.074 q29a5 Heritage protocol doc.
3.21 1.097 q29a3 Procedures for repair or rebuild of: stone work, brick work, steel work, concrete work and timber work
For the mean score scale: from 1 = not needed, 2 = medium need, 3 = highly needed, 4 = already provided (more information required), and 5 = already provided (high quality).

Chapter 6: Project Management Challenges – Survey 167
The results on technical factors showed that the respondents believed that having a
system in place to identify the significant fabric is highly necessary. The availability
of heritage protocol documentation and the available procedures for the repair or
rebuild (of stone work, brick work, steel work, concrete work and timber work)
require more information and updating. The lowest mean value was 2.97, which
indicates that all eight measured technical factors were believed to have an influence
on the project delivery objectives. The results of the frequencies and descriptive
statistics of heritage building projects, challenges and project performance (PP) can
be seen in Appendix D-4-2.
Table 6.8: Multiple stakeholder factors (M_stake)
Mean Std. Dev. Data Code Description
4.30 0.712 q36a12 Communicating with and engaging stakeholders effectively and frequently
4.28 0.652 q36a8 Keeping and promoting a good relationship
4.26 0.661 q36a2 Identifying stakeholder requirements
For the mean score scale: from 1 = strongly disagree to 5 = strongly agree.
The top three most important factors among the twelve multiple stakeholder tested
factors were communicating with and engaging stakeholders effectively and
frequently, keeping and promoting a good relationship, and identifying stakeholder
requirements. The results indicate that good and frequent engagement and
communication between stakeholders, while keeping a good relationship, are the
most critical multiple stakeholder factors in successful project delivery. The third-
ranked critical factor is to identify stakeholder requirements in the project. The
lowest mean value was 3.79, which indicates that all twelve measured stakeholder
factors were seen to have an influence on the project delivery objectives. The results
of the frequencies and descriptive statistics of heritage building project, challenges
and project performance (PP) can be seen in Appendix D-4-2.

Chapter 6: Project Management Challenges – Survey 168
6.9. Correlation within the Constructs
The Pearson correlation coeficients were run with the Bonferroni adjustment to
correct for an enhanced probability of making Type I errors across the multiple
pairwise comparison.That gives the confirmation of relationship between variables
within each of the constructs and the correlation coeficient indicates the magnitude
of the relationship. The correlation coeficient effect size is considered to be small if it
is 0.1 – 0.3, medium if it is 1.3 – 0.5 and large if it is over 0.5 (Green and Neil 2008,
p.259). Therefore, most of the correlations were moderately high.
The results of the Bonferroni test within the construct variables were as follows:
Key Reasons: The Pearson correlation coefficient between the appearance and
design qualities (a1) and landmark qualities (a2) (0.55) and also the contribution to
streetscapes (a3) and views, and the amenity of the suburb with consistent character
(a4) (0.51) were shown as the most significant. All the other variables were
correlated, and the lowest correlations were found between the historical importance
of the heritage places as evidence of past ways of life (a7) and the prevention of
negative environmental and/or social impact (a10) (0.15). The further correlation
results on the key reasons are shown in Appendix D-5-1. For all the codes’
explanations, refer to Appendix C-1.
Main Challenges: The Pearson correlation coefficient between cost/investment (b2)
and availability of government, non-government and private funding sources (b3)
(0.55) was shown as the most significant. All other correlated variables showed
significance in correlation. The lowest correlation was found between uninformed
client/customer (b4) and technical barriers/design/engineering (b5) (0.158), and also
between compliance (heritage approvals/development approvals)/regulatory
barriers/policy requirements (b1) and the problems of poor maintenance of current
building stock (b7) (0.159). The further correlation results on the main challenges are
shown in Appendix D-5-2.
Planning/Design: The most significant correlation was found between the lack of
appropriate staff skills (q27a9) and qualifications/experience of the project team

Chapter 6: Project Management Challenges – Survey 169
(q27a10) (0.69); further, the existing condition of the building (q27a13) was related
to the lack of ability to fully ascertain the condition of the building (q27a14) (0.62).
All other correlated variables were shown to have significance. The lower significant
correlation was shown between the level of appropriate contingency (q27a2) and
discontinuous or unknown existing building fabric/materials causing delay or rework
(q27a16) (0.28). The further correlation results on planning/design are shown in
Appendix D-5-3.
Execution/Construction: The most significant correlation was between
qualifications/experience of the project design team (q28a1) and
qualifications/experience of the project client team (q28a2) (0.63). A correlation was
also found between the lack of coordination/communication between the design
team/client/contractor (q28a12) and incomplete project construction documentation
(q28a13) (0.61), followed by the qualifications/experience of the project design team
(q28a1) and the qualifications/experience of the contractor/subcontractor (q28a3)
(0.60). The lowest correlation was found between qualifications/experience of the
project client team (q28a2) with an accurate pre-tender estimation (q28a5) (0.275),
and the post-demolition investigation (q28a10) (0.278). The further correlation
results on execution/construction are shown in Appendix D-5-4.
Technical Factors: The most significant correlations were found between the
guidance of different construction methodologies used at various times and locations
(q29a1) and consistent procedures on how to deal with specific issues – to help
mediate this detail/issue (q29a2) (0.76). The lowest correlation was found between
the guidance on different construction methodologies used at various times and
locations (q29a1) and the heritage protocol documentation (q29a5) (0.33). The
further correlation results on technical factors are shown in Appendix D-5-5.
Multiple Stakeholder Factors: The most significant correlation was found between
predicting stakeholder reactions for implementing the strategies (q36a10) and
analysing the change of stakeholder influence and relationship during the project
process (q36a11) (0.76). All the other variables were shown to be significant except

Chapter 6: Project Management Challenges – Survey 170
one. The lowest correlation was found between identifying stakeholder requirements
(q36a2) and formulating appropriate strategies to manage stakeholders (q36a9)
(0.27). The further correlation results on multiple stakeholder factors are shown in
Appendix D-5-6.
These results cannot indicate the correlation between constructs, only within the
construct itself. The significant correlation that was found between each of constructs
indicates the strong connection/relation between certain variables. Over 50% of the
examined variables had significant correlation coefficients.
6.10. Confirmatory Factor Analysis
CFA facilitates theory development in a measurement context. The six proposed
constructs were divided into two models and the CFA results are presented in this
section.
6.10.1. Assessment of standardised CFA Model_Heritage Retention_Key
Reasons (KR)_Main Challenges (MC)
The results of the CFA heritage retention, key reasons and main challenges model
show the level of achieved values in comparison with the indexes to the proposed
criteria for assessing the structural model fit (Figure 6.1). The proposed KR_MC
model showed an acceptable fit which means that the data supported the proposed
model (Table 6.9).

Chapter 6: Project Management Challenges – Survey 171
Model_CFA_KR_MC χ2 CMIN/DF
<2.00
CFI
>0.90
TLI
>0.90
RMSEA
<0.080
Model_KR_MC_20 311.330 1.982 0.926 0.910 0.047
Figure 6.1: Heritage retention CFA Model_KR_MC_20
.42

Chapter 6: Project Management Challenges – Survey 172
Table 6.9: Level of fit for the heritage retention model
CMIN/DF
<2.00
χ2 = Chi Square = CMIN, DF= Degree of Freedom
< 2 = excellent fit, 3-5 = acceptable fit, > 5= poor fit
1.982 1.982< 2 Excellent fit (KR_MC)
CFI
>0.90
Comparative Fit Index- Goodness-of-fit index
0.90 <CFI< 0.95 = acceptable fit, 0.95 <CFI< 1.00 = perfect fit
0.926 0.90 <0.926< 0.95 Acceptable fit (KR_MC)
TLI
>0.90
Incremental Fit Index
0.90 <TLI< 0.95 = acceptable fit, 0.95 <TLI< 1.00 = perfect fit
0.910 0.90 <0.910< 0.95 Acceptable fit(KR_MC)
RMSEA
>0.08
Badness-of-fit index
0.03 <RMSEA< 0.08 = acceptable fit, < 0.03 = excellent fit
0.047 0.03 <0.047< 0.08 Acceptable fit (KR_MC)
The CFA analysis with the values of each variable indicates the ranking by
importance of each examined variable within the KR model. The three first ranked
variables for KR are shown in Table 6.10. As shown in the table 6.10, the
contribution of the heritage place to the streetscapes and view is the first key reason
indicating the importance of retaining heritage. Heritage buildings with their quality
design and landmark style are not just about the past but about the future. The
pleasing view of streets and harmony that heritage places create is irreplaceable.
Moreover, every place that indicates the history is known as a landmark and
symbolises the country, time, place, people and events. A special character is
imprinted in heritage buildings and places. Every site has its own story.
Table 6.10: CFA top three reasons for heritage retention
CFA_KR Data Code Description
0.67 a3 (q7a3) Contribution to streetscapes and view
0.63 a2 (q7a2) Landmark qualities
0.61 a5 (q7a5) Special character
- indicates the source from CFA - indicates the source from CFA

Chapter 6: Project Management Challenges – Survey 173
The top three challenges for heritage retention, as found through the CFA analysis,
are shown in Table 6.11. As shown in the table, the main challenge of heritage
building/ places is ongoing maintenance after renovation that sometimes could be
costly. The continuing decline in the availability of specialist heritage tradespersons
has an impact on the cost of maintenance. Moreover, the poor maintenance of current
building stock is a challenge. Poor maintenance influences the project’s financial
management and the program specification once it comes to the renovation.
Table 6.11: CFA top three challenges for heritage retention
CFA_MC Data Code Description
0.60 b9 (q8a9) Ongoing maintenance after renovation/ high cost
0.56 b7 (q8a7) Poor maintenance of current building stock
0.55 b6 (q8a6) Project risk (program/financial)
- indicates the source from CFA - indicates the source from CFA
6.10.2. Assessment of standardised CFA Model_Planning/Design (PD)
The results for the CFA planning/design model show the level of achieved values in
comparison with the indexes to the proposed criteria for assessing the structural
model fit (Figure 6.2 and Table 6.12).

Chapter 6: Project Management Challenges – Survey 174
Model_CFA_PD χ2 CMIN/DF
<2.00
CFI
>0.90
TLI
>0.90
RMSEA
<0.080
Model _PD_16 146.20 1.642 0.935 0.912 0.062
Figure 6.2: Planning design CFA Model_PD_16

Chapter 6: Project Management Challenges – Survey 175
Table 6.12: Level of fit for the CFA planning/design model
CMIN/DF
<2.00
χ2 = Chi Square = CMIN, DF= Degree of Freedom
< 2 = excellent fit, 3-5 = acceptable fit, > 5= poor fit
1.642 1.642< 2 Excellent fit (PD_16)
CFI
>0.90
Comparative Fit Index- Goodness-of-fit index
0.90 <CFI< 0.95 = acceptable fit, 0.95 <CFI< 1.00 = perfect fit
0.935 0.935> 0.95 Acceptable fit (PD_16)
TLI
>0.90
Incremental Fit Index
0.90 <TLI< 0.95 = acceptable fit, 0.95 <TLI< 1.00 = perfect fit
0.912 0.912<0.90 Acceptable fit (PD_16)
RMSEA
>0.08
Badness-of-fit index
0.03 <RMSEA< 0.08 = acceptable fit, < 0.03 = excellent fit
0.062 0.03 <0.062< 0.08 Acceptable fit (PD_16)
The proposed model PD_16 showed acceptable results except for CMIN/DF with an
excellent fit. From the sixteen factors analysed in CFA, five of them with the factor
loading higher than 0.60 will be further analysed in SEM and all others (eleven
factors) have been not applicable for further analysis. This indicated that five factors
with the measured values had significant influence. These are shown in Table 6.13.
Table 6.13: CFA challenges for PD
CFA_PD_5 Data Code Description
0.69 q27a12 Non-availability or incomplete original building plans
0.66 q27a14 Lack of ability to fully ascertain the “condition of the building”
0.63 q27a8 Quantifying capital cost of works
0.63 q27a15 Limitations for methodology for repairs or new works due to heritage constraints
0.60 q27a11 Implications of change of use/ significant works causing compliance with current codes (BCA code)
- indicates the source from CFA - indicates the source from CFA

Chapter 6: Project Management Challenges – Survey 176
The values from assessing the CFA measurement model_16 placed the first
challenge in the design/planning stage as the non-availability or incomplete original
building plans, followed by the lack of ability to fully ascertain the condition of the
building which together influence clarification of the project design. The quantifying
capital cost of works together with the limitations in the methodology for repairs or
new works due to heritage constraints is the third most important challenge in the
design/planning stage, followed by the implications of change of use/ significant
works causing compliance with current codes (BCA code). All factors will be further
analysed in SEM.
6.10.3. Assessment of standardised CFA Model_Execution/Construction (EC)
The results for the CFA execution/construction model show the level of achieved
values in comparison with the indexes to the proposed criteria for assessing the
structural model fit (Figure 6.3 and Table 6.14).

Chapter 6: Project Management Challenges – Survey 177
Model_CFA_EC χ2 CMIN/DF
<2.00
CFI
>0.90
TLI
>0.90
RMSEA
<0.080
Model _EC_15 147.286 1.818 0.928 0.906 0.074
Figure 6.3: Execution/construction CFA Model_EC_15

Chapter 6: Project Management Challenges – Survey 178
Table 6.14: Level of fit for the CFA execution/construction model
CMIN/DF
<2.00
χ2 = Chi Square = CMIN, DF= Degree of Freedom
< 2 = excellent fit, 3-5 = acceptable fit, > 5= poor fit
1.818 1.818< 2 Excellent fit (EC_15)
CFI
>0.90
Comparative Fit Index – Goodness-of-fit index
0.90 <CFI< 0.95 = acceptable fit, 0.95 <CFI< 1.00 = perfect fit
0.928 0.90 <0.928< 0.95 Acceptable fit (EC_15)
TLI
>0.90
Incremental Fit Index
0.90 <TLI< 0.95 = acceptable fit, 0.95 <TLI< 1.00 = perfect fit
0.906 0.90 <0.906< 0.95 Acceptable fit (EC_15)
RMSEA
>0.08
Badness-of-fit index
0.03 <RMSEA< 0.08 = acceptable fit, < 0.03 = excellent fit
0.074 0.03 <0.074< 0.08 Acceptable fit (EC_15)
The proposed model EC_15 showed mostly acceptable results, while CMIN/DF
indicates an excellent fit. From the fifteen factors that has been analysed using CFA,
eight of them have factor loading higher than 0.60 and will be further analysed, while
seven factors with lower factor loading were considered as not applicable. The
factors that will be further analysed are listed in Table 6.15.
Table 6.15: CFA challenges for EC
CFA_EC_8 Data Code Description
0.74 q28a8 Documentation quality (on the site)
0.73 q28a13 Incomplete project construction documentation (lack of detail – results in variations)
0.68 q28a11 Administration
0.62 q28a5 Accurate Pre tender estimate
0.62 q28a7 Scope changes Client/Architect/Engineer
0.62 q28a12 Lack of coordination/communication between design Team/Client/Contractor
0.61 q28a10 Post demolition investigation
0.60 q28a4 Gaps in tender documentation
- indicates the source from CFA - indicates the source from CFA

Chapter 6: Project Management Challenges – Survey 179
The execution/construction project phase as seen from the CFA_EC_15 results
highlighted the documentation quality on the site and incomplete project construction
documentation as a highest challenges. Administration was ranked as the third main
challenge in the execution/construction phase. Accuracy in pretender estimate will
highly improve execution/construction performance. All eight factors will be further
examined in SEM.
6.10.4. Assessment of standardised CFA Model_Technical factors (Technical)
The results for the CFA technical factors model show the level of achieved values in
comparison with the indexes to the proposed criteria for assessing the structural
model fit (Figure 6.4 and Table 6.16).

Chapter 6: Project Management Challenges – Survey 180
Model_CFA_Technical χ2 CMIN/DF
<2.00
CFI
>0.90
TLI
>0.90
RMSEA
<0.080
Model _Technical_8 26.347 1.882 0.983 0.967 0.073
Figure 6.4: Technical factor CFA Model_Technical_8

Chapter 6: Project Management Challenges – Survey 181
Table 6.16: Level of fit for the CFA technical model
CMIN/DF
<2.00
χ2 = Chi Square = CMIN, DF= Degree of Freedom
< 2 = excellent fit, 3-5 = acceptable fit, > 5= poor fit
1.882 1.882< 2 Excellent fit (Technical_8)
CFI
>0.90
Comparative Fit Index – Goodness-of-fit index
0.90 <CFI< 0.95 = acceptable fit, 0.95 <CFI< 1.00 = perfect fit
0.983 0.95<0.983< 1.00 Perfect fit (Technical_8)
TLI
>0.90
Incremental Fit Index
0.90 <TLI< 0.95 = acceptable fit, 0.95 <TLI< 1.00 = perfect fit
0.967 0.95<0.967< 1.00 Perfect fit (Technical_8)
RMSEA
>0.08
Badness-of-fit index
0.03 <RMSEA< 0.08 = acceptable fit, < 0.03 = excellent fit
0.073 0.03 <0.073< 0.08 Acceptable fit (Technical_8)
The proposed Technical_8 model showed an excellent, mostly perfect fit and
acceptable fit. Six factors extracted from the Technical_ CFA results indicated the
factors with factor loading higher than 0.60. Two factors with the lower factor
loading would not have be further analysed. Therefore, the six factors that will be
further analysed are listed by the ranked score in Table 6.17.
Table 6.17: CFA factors for Technical
CFA_Technical_6 Data Code Description
0.81 q29a3 Procedures of repair or rebuild of: stone work, brick work, steel work, concrete work and timber work.
0.80 q29a7 Architectural detailing
0.78 q29a2 Consistent procedures how to deal with specific issues – to help mediate this issue
0.77 q28a4 Design in regard to the proposed usage (e.g. BCA)
0.76 q28a8 Structural testing
0.71 q29a1 Guidance on different construction methodologies used at various time & locations
- indicates the source from CFA - indicates the source from CFA

Chapter 6: Project Management Challenges – Survey 182
The technical factors by CFA_Technical_8 model results suggest the importance of
having procedures for the repair or rebuilding of stone work, brick work, steel work,
concrete work and timber work available as a best practice experience – “knowledge
book”. Architectural detailing followed by the consistent procedures how to deal
with specific issues – to help mediating this detail/ issue are certainly one of the most
important needs for heritage projects together with the procedures of repair and
architectural detailing. The questionnaires, professionals marked the BCA as difficult
to follow in many ways. This indicates the need to revise and adapt the current BCA
with the heritage building requirements.
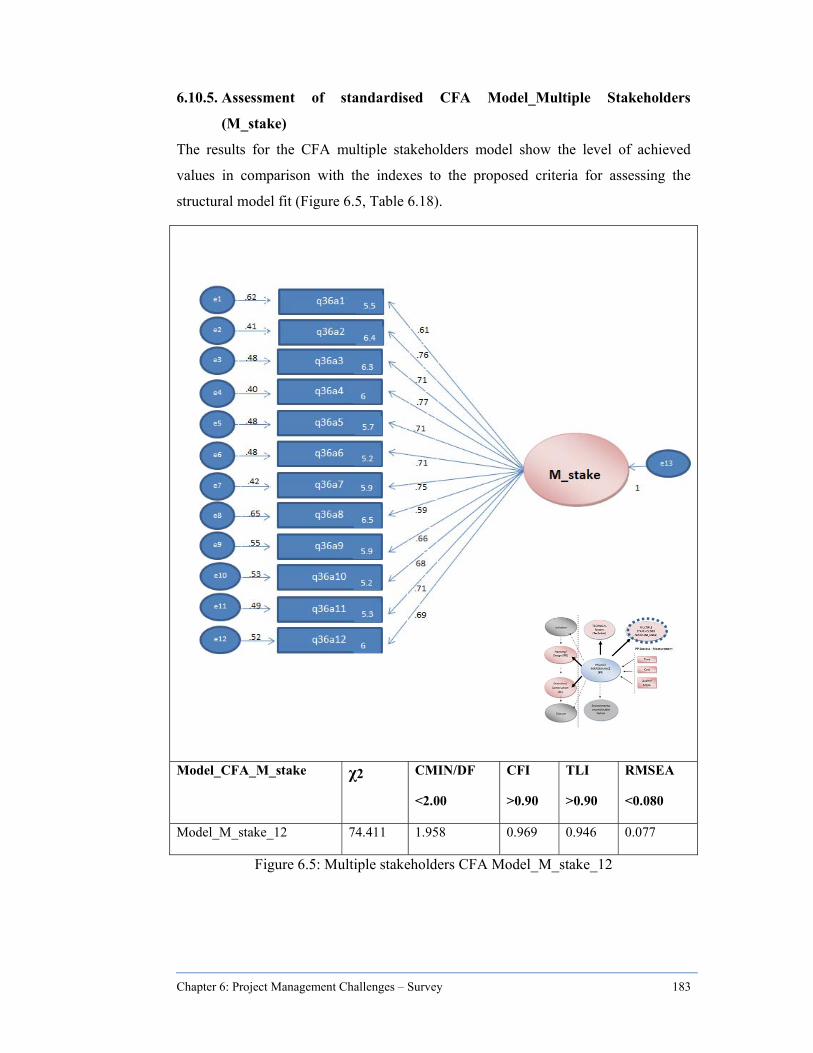
Chapter 6: Project Management Challenges – Survey 183
6.10.5. Assessment of standardised CFA Model_Multiple Stakeholders
(M_stake)
The results for the CFA multiple stakeholders model show the level of achieved
values in comparison with the indexes to the proposed criteria for assessing the
structural model fit (Figure 6.5, Table 6.18).
Model_CFA_M_stake χ2 CMIN/DF
<2.00
CFI
>0.90
TLI
>0.90
RMSEA
<0.080
Model_M_stake_12 74.411 1.958 0.969 0.946 0.077
Figure 6.5: Multiple stakeholders CFA Model_M_stake_12

Chapter 6: Project Management Challenges – Survey 184
Table 6.18: Level of fit for the CFA multiple stakeholders model
CMIN/DF
<2.00
χ2 = Chi Square = CMIN, DF= Degree of Freedom
< 2 = excellent fit, 3-5 = acceptable fit, > 5= poor fit
1.958 1.958< 2 Excellent fit (M_stake_12)
CFI
>0.90
Comparative Fit Index – Goodness-of-fit index
0.90 <CFI< 0.95 = acceptable fit, 0.95 <CFI< 1.00 = perfect fit
0.969 0.95 <0.969< 1.00 Perfect fit (M_stake_12)
TLI
>0.90
Incremental Fit Index
0.90 <TLI< 0.95 = acceptable fit, 0.95 <TLI< 1.00 = perfect fit
0.946 0.90<0.946< 0.95 Acceptable fit(M_stake_12)
RMSEA
>0.08
Badness-of-fit index
0.03 <RMSEA< 0.08 = acceptable fit, < 0.03 = excellent fit
0.077 0.03 <0.077< 0.08 Acceptable fit (M_stake_12)
The proposed model M_stake_12 showed the mostly acceptable and also perfect and
excellent fit. Results from M_stake_12 suggested that eleven factors have been
identified with factor loading higher than 0.60 and only one factor with the lower
factor loading would not be further analysed. Table 6.19 shows the ranking of the
eleven factors by the score from the multiple stakeholders model CFA analysis.

Chapter 6: Project Management Challenges – Survey 185
Table 6.19: CFA factors for M_Stake
CFA_M_stake_11 Data Code Description
0.77 q36a4 Exploring stakeholder needs and constraints
0.76 q36a2 Identifying stakeholder requirements
0.75 q36a7 Resolving conflicts among stakeholders effectively
0.71 q36a6 Analysing conflicts and coalitions among stakeholders
0.71 q36a3 Understanding area of stakeholder interest
0.71 q36a5 Assessing stakeholder attributes (urgency and proximity)
0.71 q36a11 Analysing the change of stakeholder influence and relationship during the project process
0.69 q36a12 Communicating with and engaging stakeholders effectively and frequently
0.68 q36a10 Predicting stakeholder reactions for implementing the strategies
0.66 q36a9 Formulating appropriate strategies to manage stakeholders
0.61 q36a1 Identifying stakeholders on the project
- indicates the source from CFA - indicates the source from CFA
The M_stake factors by CFA_M_stake_12 results indicate that the most important is
to explore stakeholder needs and constraints, and to identify the stakeholders’
requirements. The third most important factor in the multiple stakeholder
management is the effectiveness in resolving the conflicts among stakeholders
followed by the importance of analysing conflicts and coalitions among stakeholders
effectively together with understanding the area of stakeholder interest, assessing
stakeholder attributes (urgency and proximity) and analysing the change of
stakeholder influence and relationship during the project process. All eleven factors
will be further analysed in SEM.

Chapter 6: Project Management Challenges – Survey 186
6.11. Assessment of standardised SEM Model_ Project Performance (PP)
Figure 6.6 presents the structural equation model _Project Performance (PP) with the
results, which indicate that the model has achieved fitness.
Model_SEM_PP χ2 CMIN/DF
<2.00
CFI
>0.90
TLI
>0.90
RMSEA
<0.080
Model_PP_30 592.40 1.558 0.917 0.906 0.058
Figure 6.6: Structural equation model _Project Performance (PP)
.73
.83
.41
.34
PP
e35
1

Chapter 6: Project Management Challenges – Survey 187
The results show the level of achieved values in comparison with the indexes to the
proposed criteria for assessing the structural model fit (Table 6.21).
Table 6.20: Level of fit for the SEM Project Performance Model
CMIN/DF
<2.00
CMIN/DF - χ2 = Chi square = CMIN, DF= Degree of freedom
< 2 = Excellent fit, 3–5 = Acceptable fit, > 5 = Poor fit
1.558 1.558 < 2 Excellent fit
CMIN/DF Excellent fit
CFI
>0.90
CFI – Comparative Fit Index – Goodness-of-fit index
0.90 <CFI< 0.95 = Acceptable fit, 0.95 <CFI< 1.00 = Perfect fit
0.917 0.90 <0.917< 0.95 Acceptable fit
CFI Acceptable fit
TLI
>0.90
TLI – Incremental fit Index
0.90 <TLI< 0.95 = Acceptable fit, 0.95 <TLI< 1.00 = Perfect fit
0.906 0.90<0.906< 0.95 Acceptable fit
TLI Acceptable fit
RMSEA
>0.08
RMSEA – Badness-of-fit index
0.03 <RMSEA< 0.08 (0.07) = Acceptable fit, < 0.03 = Excellent fit
0.058 0.03 <0.058< 0.08 Acceptable fit
RMSEA Acceptable fit

Chapter 6: Project Management Challenges – Survey 188
Planning/Design_SEM Model_Project Performance (PP)
The planning/design challenges analysed in SEM indicated that lack of ability to
fully ascertain the “condition of the building” was the most significant challenge that
is worth further consideration together with the implications of change of use/
significant works causing compliance with current codes (BCA code) followed by
non-availability or incomplete original building plans and limitations for
methodology for repairs or new works due to heritage constraints. All of these
challenges are closely connected and have an influence on getting the scope right.
Due to the factor loading lower than 0.60, q27a8 (quantifying capital cost of works)
has not been included in the table 6.21. Table 6.21 presents the main challenges for
planning/design from the SEM analysis.
Table 6.21: SEM_ main challenges for PD
SEM_PD_4 Data Code Description
0.76 q27a14 Lack of ability to fully ascertain the “condition of the building”
0.68 q27a11 Implications of change of use/ significant works causing compliance with current codes (BCA code)
0.66 q27a12 Non-availability or incomplete original building plans
0.60 q27a15 Limitations for methodology for repairs or new works due to heritage constraints
- indicates the source from SEM - indicates the source from SEM
Execution/Construction_SEM Model_Project Performance (PP)
The execution/construction challenges analysed in SEM identified incomplete
project construction documentation (lack of detail – results in variations) as the main
concern. Documentation quality (on the site) were shown to be highly important in
the execution/construction phase and needed to be considered in further analyses.
Administration was the third main challenge, followed by the gaps in tender
documentation. All of identified challenges influence on the project performance -
time and has as a consequence an impact on the budget. Due to the factor loading
lower than 0.60, q28a10 (post demolition investigation) and q28a12 (lack of

Chapter 6: Project Management Challenges – Survey 189
coordination/communication between design team/ client/ contractor) have not been
included in the table 6.22. Table 6.22 presents the top challenges for
execution/construction from the SEM analysis.
Table 6.22: SEM_ main challenges for EC
SEM_EC_6 Data Code Description
0.74 q28a13 Incomplete project construction documentation (lack of detail – results in variations)
0.70 q28a8 Documentation quality (on the site)
0.68 q28a11 Administration
0.65 q28a4 Gaps in tender documentation
0.62 q28a7 Scope changes Client/Architect/Engineer
0.61 q28a5 Accurate Pre tender estimate
- indicates the source from SEM - indicates the source from SEM
Technical_SEM Model_Project Performance (PP)
The technical factors derived from CFA were further examined using SEM. The very
high result indicates that the procedures for the repair or rebuilding of stone work,
brick work, steel work, concrete work and timber work, together with the consistent
procedures on how to deal with specific issues, are the main needs for heritage
projects. Furthermore, the guidance on different construction methodologies used at
various time & locations, together with architectural detailing has been identified as a
highly needed. Table 6.23 presents the main needs for technical factors derived from
the SEM analysis.

Chapter 6: Project Management Challenges – Survey 190
Table 6.23: SEM_ main factors for Technical
SEM_Technical_6 Data Code Description
0.85 q29a3 Procedures of repair or rebuild of: stone work, brick work, steel work, concrete work and timber work.
0.82 q29a2 Consistent procedures how to deal with specific issues – to help mediate this issue
0.76 q29a1 Guidance on different construction methodologies used at various time & locations
0.72 q29a7 Architectural detailing
0.66 q28a4 Design in regard to the proposed usage (e.g. BCA)
0.61 q28a8 Structural testing
- indicates the source from SEM - indicates the source from SEM
M_stake_SEM Model_Project Performance (PP)
The SEM analysis of the multiple stakeholder factors suggests that it is highly
important to explore stakeholder needs and constraints, together with understanding
the areas of stakeholder interest, followed by identification of stakeholder
requirements and assessment of stakeholder attributes (urgency and proximity).
Table 6.24 presents the top three multiple stakeholder challenges from the SEM
analysis.

Chapter 6: Project Management Challenges – Survey 191
Table 6.24: SEM_ main factors for M_stake
SEM_M_stake_11 Data Code Description
0.78 q36a4 Exploring stakeholder needs and constraints
0.78 q36a3 Understanding area of stakeholder interest
0.77 q36a2 Identifying stakeholder requirements
0.71 q36a5 Assessing stakeholder attributes (urgency and proximity)
0.68 q36a6 Analysing conflicts and coalitions among stakeholders
0.65 q36a10 Predicting stakeholder reactions for implementing the strategies
0.65 q36a12 Communicating with and engaging stakeholders effectively and frequently
0.65 q36a11 Analysing the change of stakeholder influence and relationship during the project process
0.65 q36a9 Formulating appropriate strategies to manage stakeholders
0.64 q36a1 Identifying stakeholders on the project
0.62 q36a7 Resolving conflicts among stakeholders effectively
- indicates the source from SEM - indicates the source from SEM
6.12. Summary
The results of the survey and interviews were interpreted in this chapter, and project
performance challenges/factors that were identified as concerns in heritage projects
were presented. Firstly, the challenges/factors were examined within each separate
construct by CFA. Once the challenges/factors were identified from CFA (each
construct was run analysed separately) with factor loading 0.60 and higher, they were
then further analysed using the structural equation model. Thus, the formed
constructs with the strong evidence in sets of results acted as reliable constructs that
represented the factors to be further examined using SEM.
Secondly, the SEM Model_ Project Performance was employed to examine the main
challenges/factors derived from CFA. The factors (with the factor loading 0.60 and
higher) were presented together with the results and were ranked by the result score

Chapter 6: Project Management Challenges – Survey 192
with the data code description. The SEM results has been triangulated with the
interview findings and discussed/validated by the Focus Group in the next chapter.
The next chapter presents the results of the focus group discussion on the findings
from the case study interviews and survey questionnaire results presented in this
chapter.

Chapter 7: Focus Group Discussion and Validation of Results 193
Chapter 7
FOCUS GROUP DISCUSSION AND
VALIDATION OF RESULTS
7.1. Introduction
This study utilised a mixed-method research design, and Chapters 5 and 6 presented
and discussed the findings from the data collected from three comparative case
studies and the survey. The data was further analysed using the quantitative and
qualitative techniques.
A focus group was formed to validate the findings from both the qualitative and
quantitative data. The focus group comprised five experts who had worked on
heritage projects all over Australia and each of whom had more than twenty years’
experience.
The first part of this chapter presents a summary of the findings from the case studies
and the survey regarding the four areas of challenges faced in the of heritage
projects, including the comments made by the focus group members on these
challenges. The second part of the chapter discusses the focus group validation of the
presented findings. Finally, the chapter discusses the valuable suggestions made by
the focus group members based on their extensive heritage project experience. These
suggestions are presented to supplement the main research findings and for use in the
conclusion chapter.
7.2. Project Performance and Delivery Challenges
The identification of the commonly raised factors in the case studies and surveys led
to the creation of a concise list of issues faced in heritage projects. These issues are
grouped in four areas: in the planning/design phase; in the execution/construction
phase; in the management of multiple stakeholders; and in the management of
technical issues. The findings on the challenges faced in each of these four areas
were considered by the focus group, as discussed next.

Chapter 7: Focus Group Discussion and Validation of Results 194
7.2.1. Challenges in the planning/design phase
The case study analysis showed that heritage documentation and drawings rely on
the archived records, which are not always totally reliable. Some of the archived
records do not represent the last ‘as-built’ information. Further case study analysis
showed that the drawings portrayed a situation that was different from the situation
uncovered after the construction phase commenced. This was supported by the
findings from the survey. Thus, the non-availability or incompleteness of the
building plans was identified as an important factor in heritage project delays.
The lack of ability to fully ascertain the condition of the building due to the limited
inspection permission by the relevant statutory bodies was identified as the second
most important factor affecting the project performance. According to the findings of
both the survey and the case study, the lack of sufficient time to perform
investigative work (assessing the condition of the building) forces the project team to
make the “the best guess estimate”, with the full extent of what is actually required
remaining largely unknown. This, together with the lack of expertise that exists in
many heritage project teams, can lead to the proposal of unrealistic timeframes and
risk of not achieving agreed time frame, which in turn leads to the need for major
rework to already completed or in-progress portions of projects.
Both the above highlighted factors directly relate back to the scope definition and
project design. If the basic documents of a project are inaccurate, revisions of the
scope can be expected. Moreover, tender documentation that is based on an
inaccurate scope definition can also be expected to be incomplete and so to lead to
variations during project execution.
The focus group members also emphasised that obtaining approval from heritage
bodies was a problem as it required multiple re-designs (for local/state/federal
heritage bodies) resulting in additional cost and time delays .
A further focus group concern has been related to the allocation of inappropriate
amounts of contingency funds at the beginning of the project. The allocation of a
realistic contingency fund is necessary to ensure that projects could overcome any
latent adverse conditions during the construction phase.

Chapter 7: Focus Group Discussion and Validation of Results 195
7.2.2. Challenges in the execution/construction phase
Challenges are faced in the execution/construction phase of heritage projects due to
the constraints of the initial building investigation, the inaccurate scope definition
and the incomplete tender documentation. Furthermore, due to the incomplete tender
documentation, the discovery of latent conditions often leads to disputes or huge
variations, which require multiple re-designs and re-negotiations of the price and
possibly the construction methodology (involving the architect, engineer and
contractor) each time an unknown condition is uncovered.
The administrative process involved in getting the approvals from the heritage
authorities for newly submitted designs is time consuming, and this process occurs
each time a new latent condition is exposed. The submitted design often requires a
significant amount of additional work, resulting in extra costs and fees.
Furthermore, the findings of the study showed that the execution phase faces the
challenge of incomplete project construction documentation on the site (i.e. a lack of
detail in the specifications). This leads to numerous requests for information which,
in turn, slows down the construction process and ultimately leads to variations and
claims.
Finally, the findings on the problems faced in the execution/construction phase
indicated that recruiting tradespeople with the required skills to do the work is a
challenge. Much of the knowledge of constructing to heritage standards or dealing
with heritage details and materials has not been passed along via trades and some of
the old building techniques unfortunately have now been lost.
7.2.3. Challenges in the management of multiple stakeholders
Project delivery is often stakeholder-driven (individual stakeholder interest);
therefore, exploring the stakeholders’ needs and constraints is very important.
Moreover, it is necessary for project teams to understand the stakeholders’ interest in
their heritage projects. Spending time to manage stakeholders in the initial phase was
highly recommended by the respondents. Furthermore, heritage projects attract
considerable interest from the media as well as within various political arenas.
Anticipating proactively what the political pressures are and how to deal with that is
important to be considered as acknowledged by interview respondents.

Chapter 7: Focus Group Discussion and Validation of Results 196
Every stakeholder has a different perception of the project and a different set of
objectives: this leads to different ideas about the design, which in turn often leads to
conflict among stakeholders’ interests. The need to analyse such conflicts and
understand the coalitions that form among stakeholders was raised by the
respondents as an important factor. In order to counter this, the project team needs to
possess the necessary skills to successfully resolve conflict, thus ensuring that
projects are able to move forward. Getting all the stakeholders “on the same page”
and working together towards the same goal was identified as highly important by all
the interviewees in the case studies.
The inability to visualise the final project design means that some of the
stakeholders, including the client, will request changes when the work is completed.
This inability to visualise the final project causes a set of difficulties of which the
client and the project team are often not aware. Changes in the client’s brief have
direct impacts on the budget and time allocated to the project, as the development of
a new design during the construction phase costs considerably more. Therefore, an
effective client design team will ensure that the client has enough information to
clearly visualise the final project outcomes.
The community, as an external stakeholder, plays the important role of a third-party
‘consultant’ due to the public’s interest in heritage places. The findings showed that
community consultation was considered to be one of the key necessities in delivering
heritage projects and that accurately allocating this activity into the project
programme is critical. In particular, the findings highlighted the need for sensitivity
in dealing with heritage defence sites. In those cases, it is especially necessary to
acknowledge the memories and associations connected to such places by members of
the public.
In the discussion on the challenges faced in the management of multiple
stakeholders, the focus group made useful and timely suggestions that follow in the
next sub-section 7.2.4. Firstly, the focus group pointed out the potential opportunities
for the education precinct projects carried out by universities (often involving the
repurposing of heritage buildings) to be used as practical placements for project
management students. Such projects could be used for educating a new generation of
managers who are specialised in delivering heritage projects. Secondly, the focus
group recommended the development of a heritage project mobile application

Chapter 7: Focus Group Discussion and Validation of Results 197
(“app”) to be used by heritage practitioners as a resource for successful project
management.
7.2.4. Challenges in the management of technical issues
As mentioned in relation to the challenges in the execution/construction phase, the
findings of the study highlighted the difficulty in recruiting skilled tradespeople.
Finding people with the knowledge to do the specialised work involved in heritage
projects is often difficult. In the case studies, these difficulties were particularly
found to relate to the repair or rebuilding of stone work, brick work, steel work,
concrete work and timber work.
As highlighted in relation to the challenges in the planning and design stage, the
study found that matching the design with the proposed usage (e.g. BCA
compliance) was very difficult. The Building Code of Australia (The Australian
Building Codes Board 2013)is entirely appropriate for controlling the construction of
conventional building projects; however, the findings of this study indicate that
heritage projects constantly face issues in trying to comply with the current code.
Sourcing of materials was identified (by the project stakeholders during the
interviews) as another important issue/challenge for heritage projects. Challenges in
sourcing the materials sometimes lead to inadequate or incorrect replacement
materials having to be specified. Often the materials for heritage buildings can only
be sourced from outside Australia (primarily the UK). This sourcing issue requires
early and accurate planning.
The case study interviewees also pointed that it was difficult to identify the
significant fabric due to the lack of requisite experience and knowledge. This is
another technical problem that may affect the completeness and accuracy of the
project design.
7.3. Validation – Focus group method
The focus group method was employed to justify the research findings and validate
the usefulness of the conducted research. The findings from the qualitative and
quantitative data collection were presented to the focus group in the form of a
PowerPoint presentation and printouts.

Chapter 7: Focus Group Discussion and Validation of Results 198
The focus group panel consisted of five highly reputable Australian heritage experts,
each with more than twenty years’ experience working on heritage projects all over
Australia. Table 7.1 summarises the criteria applied in the selection of the focus
group members and therefore the relevance of their involvement in this research.
Table 7.1: Application of criteria to select the focus group panel
Focus Group Panel
Selection Criteria
Applicability for this
Research
Over 20 years’
experience
Work experience on projects (national
/state/local)
Works in decision- making position
Recipient of award
RF1 √ √ √ √ Yes
RF2 √ √ √ √ Yes
RF3 √ √ √ √ Yes
RF4 √ √ √ √ Yes
RF5 √ √ √ √ Yes
The focus group discussion was organised in such a way that the panel members
could ask questions during the presentation. This opened the discussion and enabled
the panel members to make recommendations for action during the presentation.
During the presentation, the panel members talked freely and openly about the issues
related to successful project delivery. The researcher considered all of the suggested
actions together with the feedback on the presented findings to ensure the efficacy of
the contribution of the research to future research and heritage project outputs
(particularly in the planning/design and execution phases). The conclusions on the
presented findings together with the suggestions from the focus group panel
members were documented and emailed to the panel members who were asked to
agree with the conclusions and/or make any further comments. Further suggestions
were received from three panel members, and these suggestions were considered and
included in the final conclusion.

Chapter 7: Focus Group Discussion and Validation of Results 199
The focus group panel expressed personal interest in this research and supported its
aim to accomplish useful outcomes through the set of actions to be undertaken in
future heritage projects.
7.3.1. Focus group insights into the heritage project management process
One of the aims of the study was to identify ways to influence the beginning stages
of a heritage project, because concentrating on the planning/design stage and
proposing the “call for action” guidance will ensure the improvement of the overall
project performance and delivery. The findings were evaluated [RF1, RF2, RF3, RF4
and RF5] and conclusions were reached through the content analysis and through an
analysis of the clarity of the proposed actions, each of which is discussed next.
7.3.2. Validation of the Project Performance and Delivery Challenges
The data obtained from the mixed-method approach used in this research required
validation by experts in the field in order to prove or disprove the utility of the
conducted research. Such validation involved:
content analysis – recognising the value of the results that may benefit future
projects
clarity of the conclusion – where a merger of results (both qualitative and
quantitative) underlines the core project issues/challenges and causes/risks
proposals for action – where a set of actions is recommended to ensure future
project success.
A. Content analysis
Based on the results of the focus group validation of the findings on the challenges
facing heritage projects, the factors that will assist the successful project performance
and delivery of heritage projects are:
a) Improvement to the steps in the preliminary investigation phase (concept stage)
of heritage projects including:
Undertaking initial research into the history of the place

Chapter 7: Focus Group Discussion and Validation of Results 200
The results of research into the history of a place can ameliorate the effects
caused by the later discovery of archaeological deposits that may need to be
excavated prior to further construction works being undertaken
Understanding the construction of the building
Identifying the significant fabric and the most appropriate design to apply is
crucial. There is a need for in-depth understanding of a place, in terms of both
its significance) and its condition. This understanding is critical during the
planning stage and the design decision-making.
Identifying suitable/unsuitable uses for the building/place
During the planning stage, the future use of the building must be designed in
such a way that does not go far from the original use of the building and that
satisfies the current owner’s needs. The design must accommodate both
purposes.
Understanding the incentives available for keeping heritage places
One of the main challenges for keeping heritage places is the lack of available
funding sources (either government or non-government). The community
plays an important role; therefore, listening to and acknowledging community
organisations can help to conserve a heritage place (e.g. through the provision
of donations).
Assembling a team of professionals
The qualifications and experience of the contractor, subcontractor team and
project design team are critical for the successful management of projects. It
is important to assemble a team of experienced contractors and tradespeople
who understand the Burra Charter and who can apply traditional techniques
during construction.
Undertaking thorough documentation (drawings, details, schedules and
specification), and understanding new services to be inserted into the
building/place
Quality documentation is the key factor in project cost and time savings.

Chapter 7: Focus Group Discussion and Validation of Results 201
Detailing carefully the time and cost of solutions for best practice
conservation and sympathetic changes during the design and documentation
stage
Understanding the implications of the conditions attached to the development
application, especially in relation to time delays
Understanding the requirements of the development application process will
ensure timely preparation of the necessary documentation.
Noting the insurance cost as one of the important factors to be considered
when making estimations for heritage projects
The relationship between the contingency sum allocated and the insurance
coverage for the project must be addressed
b) Improvement to the steps in the planning/design phase of heritage projects
including:
Implementing the conservation management plan before the design starts
Identifying potential issues as part of the scope of works and, where
appropriate, negotiating ‘deemed to satisfy’ alternatives to avoid changing the
heritage fabric
Performing an early and thorough investigation of the building prior to
defining the scope (noting, however, that heritage approval is sometimes
required for detailed investigation and time delays can occur)
Addressing statutory requirements (the quality of documentation is
fundamental)
Highlighting the risk associated with time and cost on the project in order to
ensure the right amount of contingency is in reserve
Ensuring that the conservation management plan covers the maintenance
costs (on yearly basis)
c) Improvement to the steps in the execution/construction phase of heritage projects
including:
Undertaking “opening-up’ works before decisions are made

Chapter 7: Focus Group Discussion and Validation of Results 202
Opening up may or may not reveal unexpected problems and construction
needs that are different to those assumed (such as hazardous materials or
archaeological or historic evidence) and may prevent later time delays
Recognising the direct link between the quality and compliance of the
documentation to the construction outcome
d) Improvement to aspects of the management and roles of various
stakeholders/professionals in all phases of heritage projects including:
Making heritage a higher priority to the project manager, depending on the
type of protection and the level of heritage significance of the place
(balancing the project team’s typical priorities of time and budget)
Assembling a team of appropriate professionals to undertake the works with
an understanding of the issues that may arise
Encouraging experienced team members to respond to changing
circumstances faster and anticipate potential problems earlier in the project,
thereby reducing time delays
Employing a project manager with heritage qualification/skills
The assessment of the prospective project manager’s qualifications and skills
should take place during the stakeholder identification within the planning
stage in order to avoid “design blame”
Building a closer relationship with the heritage authorities and the key
stakeholders from the beginning of the planning stage
Recognising that the part played by political decisions/issues has a
disproportional effect on many projects (both positive and negative)
e) Improvement in managing the technical factors in the early phase of heritage
projects including:
Developing innovative solutions and/or finding strategy to deal with the
difficulties in complying with the Building Code of Australia 2013
Developing innovative solutions and/or finding strategy to comply with the
Disability Discrimination Act 1992
Performing early procurement to ensure the materials arrive on a time
(noting that some materials are only available overseas).

Chapter 7: Focus Group Discussion and Validation of Results 203
B. Clarity of conclusions
The aim of the study was to identify the causes of the project delays and cost
overruns through an investigation of the existing policies and procedures for heritage
building projects, impeding technical barriers and stakeholders’ involvement.
Evaluating the current procedures through the case studies and survey led to
findings—subsequently validated by the focus group discussion—that clearly
identified the areas where changes need to be undertaken to facilitate the successful
project performance and delivery of a heritage project. Thus, the study explored two
project management life cycle phases (planning/design and execution/construction),
multiple stakeholder involvement and technical factors regarding what needs to be
done to make future projects more successful in terms of time, budget and scope
definition, and to minimise the impact of the perceived challenges and it’s
causes/risks to their lowest possible level. This was in line with the focus of this
study, which was to identify the major heritage project performance and delivery
challenges based on the literature review and data collection, and to use the validated
findings to develop guidance for use in the planning of future heritage building
projects.
C. Proposals for actions
The conclusions of the overall research, based on a merging of the qualitative and
quantitative results, underline the core project issues and causes/risks and form the
basis of appropriate recommended actions that can be followed to ensure the success
(time, cost and scope) of future heritage projects. The critical factors that need to be
improved in order to ensure the successful completion of heritage projects within the
time and cost parameters are summarised in Table 7.2.

Chapter 7: Focus Group Discussion and Validation of Results 204
SUMMARY
DELIVERING HERITAGE PROJECTS – “CALL FOR ACTION”
(3 case studies including observations and 19 interviews + 444 survey responses)
CHALLENGES
CAUSES/ RISKS
ACTION
Project Stakeholders
Project stakeholders identification Right skills has not been procured Process of selection in place to ensure right stakeholders
for the project
Lack of qualification and experience of the project team members in heritage projects
Misunderstanding of what is happening/needed Risk in achieving agreed timeframe Design risk
Assemble an experienced project team to ensure the realistic timeframe
The project manager is preferred to have heritage background qualification/skills/experience/
Managing multiple stakeholders on the project
Individual stakeholder interest Client brief changes
Project delivery must be conservation-driven Design team has to ensure the clarity with the owner at
the design stage
Media and political interest Projects attract considerable interest from media as
well as from political arenas Anticipate proactively what the political pressure are
and how to deal with that
Community (if not involved) Public interest has not been considered To be consulted as a key player in a project program
Table 7.2: S
umm
ary of the validated findings – conclusions and recomm
ended actions

Chapter 7: Focus Group Discussion and Validation of Results 205
CHALLENGES CAUSES/ RISKS ACTION
Planning /Design
Original building documentation/plans/ drawings /records
Documentation/plans/drawings are not kept Archived records are often not the last record - not
100% reliable
Early investigation to document accurate building solutions
Lack of sufficient time for investigation work - assessing the condition of the building
Full extent of what is required is unknown The best guess estimate Lack of understanding about the construction of the
building
Allowing enough time for design stage will ensure the quality of the estimation
Lack of expertise of the design team in heritage projects
Failure to identify the significant fabric Lack of understanding about the archaeological and
intangible values Poor heritage interpretation
Architects and designers should be experienced in heritage and familiar with the Burra Charter for the heritage interpretation
Future Maintenance of the building Maintenance cost not included Loss of original building character over time
Conservation Management Plan has to ensure maintenance cost will be covered (on yearly basis)
Obtaining approval from the heritage bodies
Multiple redesigns resulting in additional cost and time delays
Early involvement of heritage bodies during the design and concept stages
Limited inspection permission by relevant statutory bodies
Hard to define the scope of the work, design and document without knowing enough about the building, resulting in inaccurate scope definition
To be considered in the approval for ‘detailed investigation of the building’ to be able to define a scope and produce a good quality document
Scope definition (if not well defined)
Risk of time and budget overruns Due to lack of scope definition that causes inaccurate
tender documentation which leads to large number of latent conditions that causes: Multiple design, price and agreement on the
methodology (architect– engineer – contractor) Heritage authorities (to get design approved) Discovery of archaeological deposits Searching for trade specialists Sourcing additional materials Notice of likely delay Variations
Ensure scope well defined Detailed investigation during design stage – which
allows to “open up” to get the building assessment right to minimise the occurrence of unexpected problems during the execution stage
Conduct initial research into the history of the place Excavate any archaeological deposits prior to
construction works/ execution stage
Table 7.2: S
umm
ary of the validated findings – conclusions and recomm
ended actions (continued)

Chapter 7: Focus Group Discussion and Validation of Results 206
CHALLENGES CAUSES/ RISKS ACTION
Execution/Construction
Specifications / site documentation Not enough detailed documentation, leading to
numerous requests for information Ensure the quality and compliance of documentation
Requests for information Slows down the construction phase Ensure the quality and compliance of documentation
Latent conditions Heritage authorities to get redesign approved Accurate tender documentation
Technical Factors
Sourcing the materials Some materials only available overseas If difficult to match, the result is inadequate
replacement
Early procurement will ensure the materials arrive on a time
Inadequate replacement should not occur
Building Code of Australia Difficult to comply with the current building code Finding strategy to comply with the BCA code
Disability Discrimination Act Challenges to satisfy DDA Finding strategy to meets DDA
Table 7.2: S
umm
ary of the validated findings – conclusions and recomm
ended actions (continued)

Chapter 7: Focus Group Discussion and Validation of Results 207
7.4. Summary
This chapter presented the focus group validation of the findings from the case
studies and survey. The validated findings support the proposition discussed in the
opening chapters that there is a greater ability to influence cost saving at the
beginning of a heritage project; therefore, a heavier investment in the planning and
design stages will ultimately cost the project owner less than advancing with
unresolved critical issues. Once the on-site operation starts, the inclusion of changes
such as dealing with latent conditions would cost the owner considerably more than
envisaged in project budgets used to gain approvals for works and let contracts.
The proposed heritage building practice guidances were developed as recommended
actions (Figure 7.2) on the basis of the research findings reported in this thesis and
with the input of experts with more than 20 years’ experience each in heritage
building projects. The guidance are designed to ensure that realistic cost targets and
delivery timeframes are set in future heritage projects. The evaluation of the results
during the focus group discussion generated the final recommended actions to be
included as part of the research recommendations. The need for urgent action in the
delivery of current and future heritage projects is clear, and significant improvements
in current practices are necessary in order to overcome the problems of cost and time
overruns in future heritage projects. The following chapter presents the conclusions
related to the answers to the research questions and summarises the current status of
the research problem area, as well as detailing implications for theory and practice
and offering suggestions for directions in further research.

Chapter 7: Focus Group Discussion and Validation of Results 208

Chapter 8: Conclusion 209
Chapter 8
CONCLUSION
Heritage is not just the past, but the present interacting with the past in the ongoing growth of cultural tradition.
Pearson and Sullivan (1995, p. 195)
8.1. Introduction
The previous chapter discussed the focus group validation of the results from the
qualitative and quantitative data and proposed the heritage building practice guidance
that were developed on the basis of the research findings (Table 7.2). This chapter
provides the conclusion of the study based on the results and discusses the findings
in relation to the research objectives and questions. This is followed by a discussion
of the actions within the proposed guidance, the study’s contribution to the
knowledge area and suggestions for directions in further research.
8.2. Background
The importance of preserving and protecting heritage places for future generations is
globally recognised. Managing heritage projects is often seen as a sensitive issue,
with projects sometimes facing criticism due to running over time and over budget.
Despite the development of principles, policies and guidelines, many problems still
exist that affect the management of heritage projects.
Therefore, the aim of this research project was to investigate the factors that affect
the successful project performance and delivery of heritage building projects. This
aim was accomplished as follows:
Theoretical base – Establishing the base for the research, the literature review
identified the global problem of delivering heritage projects on time and on budget.
The focus of the study was narrowed down to the Australian context in order to
investigate and contribute to Australian heritage projects. The literature review
identified the gaps in knowledge and informed the development of the research
objectives and questions. The evidence of challenges that Australian heritage sites
continue to face further guided the researcher to test and extend the issues

Chapter 8: Conclusion 210
highlighted in the literature through the use of real case study examples and by
collecting views and responses from concerned stakeholders. Furthermore, literature
on the phases in the project management lifecycle was studied and two key phases
were identified as the research target, namely, the design phase and execution phase.
Practical base – To achieve the research goal, this study focused on project delivery
problems with the focus on the two phases (planning/design and
execution/construction) in the project management lifecycle and their challenges. As
heritage projects attract political attention, the further investigation of the impact of
multiple stakeholders and their interest in the project has been a major focus of this
research. From the case studies that have been selected to examine why heritage
projects often fail to successfully deliver, the technical factors have been pointed out
as of significant importance. Therefore, the relevant impacting technical factors
identified from the interviews of the case study stakeholders open another dimension
and set of issues to be investigated in future.
The problems experienced in the design and execution phases were examined
through three case studies (involving interviews and observations) and a survey, with
the proposition that improvements in the design phase can directly contribute to the
successful overall project delivery. A generic project management model was
adopted from PMBOK (Figure 8.1), to ensure clarity and common understanding in
position and sequence proposed actions to modify current project management
planning related to heritage building projects (while answering the research
questions).

Chapter 8: Conclusion 211
Figure 8.1: Targeted project stages and research questions
8.3. Conclusion
Literature review
The significance of historic sites has been well recognised in most developed
countries. The need to preserve the outstanding universal value of heritage buildings
and places is emerging as a task of high importance. Heritage buildings are also seen
as an important element of Australia’s social capital (Bullen and Love 2011).
Australian leadership in taking action to protect heritage places has been recognised
internationally (Australian State of the Environment Committee 2011). The
Australian State of the Environment Committee (2011) highlighted the importance of
taking action to protect heritage places from further development pressure in order to
retain their values. In 2013, the Australian Government called on heritage

Chapter 8: Conclusion 212
practitioners and experts across Australia to come forward with their ideas and
suggestions for the Australian Heritage Strategy (Strategy 2011).
Heritage is part of a nation’s identity. The way in which action is taken to protect
heritage signifies pride in a nation’s culture and background. Furthermore, taking
action to ensure the protection of others’ heritage is a way to show respect to them
and their cultural background.
Researchers globally have argued that the cost of preserving a heritage building as a
multi-valuable resource is sometimes more economical and sustainable than
engaging in the new construction (Maeer and Fawcett 2011; Rypkema 2001;
Wilkinson, James and Reed 2009). Nevertheless, the wholesale destruction of the
traditional urban fabric is being witnessed in many places due to the view held by
many owners, investors and developers that adapting and refurbishing an historical
building would cost considerably more than developing new construction. The World
Heritage Committee (Australia) in the List of World Heritage in Danger (Department
of Sustainability Environment Water Population and Communities 2012b) identifies
new development projects as the most prevalent threat to future heritage
preservation.
To help weigh the argument in favour of recognising the viability of heritage
preservation projects rather than automatically choosing new development, one of
the major areas of focus in this research was to understand the factors that influence
the successful delivery of heritage projects. Every project, especially heritage
projects, is challenged to meet time and cost impositions. Moreover, the existing
project management methodologies are subject to some criticism by the research
community (Winter et al. 2006), underpinning the need for a fresh look at current
approaches.
The management of multiple stakeholder relationships has been the theme of many
research studies which have sought to identify how to best deal with different
stakeholder requirements and interests even in new construction projects, given that
such interests often compete and may lead to conflict. Hence, it is especially
important for heritage projects to interconnect all the stakeholders in order for them
to work cohesively towards facilitating mutually satisfying goals and ensure a high
degree of project success.

Chapter 8: Conclusion 213
Therefore, the aim of this study was to investigate the causes of the project delivery
failure in heritage projects to adequately define the project scope and to meet time
and budget requirements. This was achieved by investigating the challenges that
heritage projects face in the two project management stages planning/design and
execution/construction, together with the factors related to multiple stakeholder
involvement and technical needs.
Accordingly, the three research objectives and the related research questions were:
RO1. To document the values of heritage-listed buildings and to address the main
challenges in protecting and maintaining an existing building rather than constructing
a new one.
RQ1. What are the main challenges that form the key reasons and make the decision
on retaining existing heritage places?
RO2. To evaluate the current policy and procedures relevant to heritage projects and
identify ongoing project challenges and causes.
RQ2. What are the challenges (and their causes) in complying with policies and
procedures that affect the management and delivery of heritage projects?
RO3. To recognise the challenges in the management process, elaborate its causes
and propose a set of actions to maximise the effectiveness of heritage project
performance.
RQ3. How can the project management process be improved for more effective
management in the operation and delivery of heritage building projects?
In order to attain the objectives and answer the three research questions with a deeper
understanding of current and past heritage project practices, the case study and
survey methods were applied.
Case Studies
An evaluation of current management practices (in the policies, procedures and
processes) was conducted with the cooperation of the project stakeholders who were

Chapter 8: Conclusion 214
interested in sharing their experience to improve the project delivery of future
projects. Three case studies that satisfied the criteria (Chapter 5, Table 5.1) were
selected to examine and extend the heritage project issues identified in the literature
review.
The case studies, all located in Brisbane, Queensland Australia, were:
I. Old Government House
II. Queensland University of Technology (QUT) Precinct 2 - Gona Barracks
III. Anzac Square.
The investigation of the causes of the project delays included observation of two
ongoing projects (Old Government House and Gona Barracks). Eighteen interviews
were conducted with project stakeholders who included project owners, project
managers, superintendents, architects or heritage architects, engineers, quantity
surveyors, builders and programmers.
Survey
The current practices (in relation to the policies, procedures and processes) in
managing heritage sites were explored in a comprehensive survey that received 444
responses. The interest of heritage practitioners in the survey topic “managing the
future of heritage” was seen in the response rate of 60.1%. Today the contribution of
the general public to heritage project discussions and policies is well recognised and
their opinion is valued in managing the future of the heritage places. Therefore,
members of the public also participated in the survey, as the involvement of the
public and their opinions and experiences added significant value to this research and
as an important factor to be considered/ listened to in every heritage project.
To answer the first research question (RQ1) and to reach the first research objective
(RO1), the online survey investigated the key reasons for, and challenges in,
retaining heritage buildings and places by use of a set of questions that enabled the
research to focus on the main facts to be considered to ensure the future of the
heritage retention. Data analysis was then performed to examine how the relevant
constructs were correlated and to identify the most significant factors in-between the
constructs by employing confirmatory factor analysis (CFA). Furthermore the CFA

Chapter 8: Conclusion 215
has proved that the relation between the key reasons (KR) and the main challenges
(MC) exists.
8.4. Research objectives reached and research questions addressed
The findings both from the case studies and the survey have been triangulated under
the each research question to achieve that the research objectives are reached and the
research questions are addressed as follows:
RQ1: Key reasons for and challenges in retaining heritage sites
Case Study: According to the data gathered from interviews with the case study
stakeholders, the main reason for retaining heritage places is the community’s
appreciation of the cultural significance of the place. Retaining heritage places is
considered to be a long-term goal for the benefit of the community. Furthermore, the
interviewees identified the duty of care to preserve the architectural fabric and make
changes in a sensitive manner. Moreover, the rarity of the heritage buildings/places is
emphasised, as no two buildings are the same. Every building/place has its own story
and the retaining of those places for the future generations ensures that they will be
able to connect the story with the place and significance of the past events.
Survey: The main reason given by the survey respondents for the retention of
heritage buildings and places was the contribution of the heritage buildings and
places to the streetscape and view. Due to their unique quality and design, heritage
buildings mark not just the past but the future. The pleasing view of streets and the
harmony that heritage places create are irreplaceable. Moreover, every place that
indicates the history is recognised as a landmark and symbolises the country, time,
place, people and events. A special character is imprinted in heritage buildings and
places. Every site has its own story.
RQ2: Main challenges/causes that affect the project delivery
Case Study: The case study interviewees identified that the main problems in
heritage retention were the poor condition of the building due to the lack of
maintenance over long periods. In some cases, the heritage site has been neglected or

Chapter 8: Conclusion 216
deliberately left to ruin for the purpose of developing new construction on the site.
This is the most significant challenge as it has a direct impact on the decision to keep
the building. A further problem is related to undertaking the adaptive reuse as it was
sometimes difficult to define a new use for the space.
Community consultation was also identified as a key task. As the case study
buildings and places were owned by the public, community consultation was one of
the key aspects in delivering these projects. Programming this activity into the
program is critical, especially for defence heritage places.
The need to have a system in place to identify the significant fabric for
retention/repair/further investigation has been identified as a challenge. The project
design team should be qualified and experienced in undertaking heritage work and be
familiar with the Burra Charter (1999) in order to carry out the heritage
interpretations.
The interviews also examined the issues for heritage projects in current policy,
procedures and processes with a focus on the causes (Chapter 5, Table 5.9) of the
time overrun and budget implications related to the time. Time is a particular issue
for heritage projects due to the difficulty in sourcing the materials that are “like to
like”.
According to the interviewees, the main technical problem at the beginning of a
heritage project is the assessment of the significance of the place. Understanding the
place and its fabric is crucial for well-managed projects that can guarantee the quality
will be maintained and the various categories of significance will be satisfied.
Another technical issue was the problem of records that have not been archived or—
if they have been archived—that may not be the latest record. Thus, the available
documentation is used without knowing whether or not it is 100% reliable.
Difficulties arise from having to define a scope of the work which cannot be clearly
determined due to the limitations on the building investigation. The visual inspection
of the building cannot uncover what is behind the walls and under the floors, and
thus cannot determine the full extent of the work that has to be considered. From the
poor scope definition, several other difficulties arise such as an incomplete tender set
with documentation omissions when items are not included. This leads to variations
together with the latent conditions once the construction phase starts. The latent

Chapter 8: Conclusion 217
conditions are linked to multiple redesigns and price and agreement negotiations
which involve the owner, architect, engineer and builder and then the heritage
authorities for the approval. This problem is compounded when the latent conditions
are uncovered one after another. Another difficulty is faced in applying the Disability
Discrimination Act 1992 (1992) when disability access was not considered at the
time the heritage building was constructed. Further, all the design has to comply with
the Building Code of Australia (2013); according to the interviewees, meeting the
current code is usually difficult for a heritage building as the code was designed for
conventional building projects. Heritage projects require specific knowledge;
therefore, finding the trades and specialists to do the work sometimes could be
difficult, together with the sourcing of the materials.
Another major challenge is the quality of the documentation delivered on the site
which results in numerous requests for information and slows down the construction
process. According to the interviewees, insufficient project contingency was a
problem. They recommended that the contingency should be a minimum of 30% to
40% of the estimated contract sum.
The involvement of multiple stakeholders, each with different interests in the project,
was identified as a challenge. This is especially the case if there is a lack of
experience in the project team. As an added pressure, the political and media interest
in a heritage project is an issue.
The findings on the important role played by the community as a stakeholder in
heritage projects reflect the government’s recognition of the community’s role in
future planning for Australian heritage places (Strategy 2011). Despite the
recognised role of the community, the destruction of heritage places still occurs due
to the developers’ focus on profit without fully considering the impact on the
community. In its favour, an organised group of community members has a powerful
voice. Many heritage projects have been initiated by community groups and have
become popular sites especially when community members understand and can see
that the project team has taken care of their places of memories.
The findings on the challenges in heritage projects and the causes of project delays
helped to answer the second research question and were also directly linked to
answering the third research question which aimed to propose the actions that would

Chapter 8: Conclusion 218
improve the management process for the future operation and delivery of the heritage
projects.
Survey: According to the survey results, the main problems for heritage retention
were the ongoing maintenance after renovation, the high cost, and the failure to
include maintenance in the site’s conservation management plan. Further, the poor
maintenance of the current building stock was seen as a difficulty, as the condition of
the building from the structural point of view means that it cannot be replaced “like
to like” and/or must be upgraded to ensure its safe use. The next problem highlighted
in the survey response was the project risk (program/financial) that arises due to the
policy that does not allow the proper building investigation to be carried out prior to
approval. This leads to the program/scope not being accurately defined. Such a scope
can be expected to require revisions, which certainly affects the financial side of the
project. Furthermore, the latent conditions emerge as a result of the poor scope
definition.
The survey results further highlighted problems faced in the planning/design and
execution/construction phases, together with examining the stakeholder factors and
technical factors. All of these factors were explored through confirmatory factor
analysis followed by structural equation modelling in order to answer the second and
third research questions.
The main problem in the planning/design stage by confirmatory factor analysis was
found to be the non-availability or incompleteness of the original building plans. This
was a challenge because the design has to be based on the archived documentation (if
it exists) and to ascertain if it is 100% reliable. The lack of capability to fully
ascertain the “condition of the building” as the second ranked challenge was
confirmed numerous times as highlighted in the interview findings. Furthermore, the
main problem identified in the survey data of PD construct through structural
equation modelling was the lack of availability of fully ascertained “condition of the
building”. The implications of change of use/ significant work causing compliance
with current codes (BCA code) created problems for the engineers and builders.
Finding the strategy to comply with the current BCA code is a task to be further
examined.

Chapter 8: Conclusion 219
In regard to the execution/construction phase, the main problem by confirmatory
factor analysis has found that the poor documentation quality (on the site) together
with the incomplete project construction documentation (lack of detail – resulting in
variations) were important challenges. A project slows down with every new request
for more information. The administrative work involved in dealing with the relevant
heritage bodies was the third main problem identified for the execution phase. Every
latent condition discovered during the execution phase has to go back to the design
phase and obtain the approval from the heritage body. Administrative dealings are
sometimes a long process as there is no set timeframe for the heritage body’s reply.
Furthermore, the SEM analysis confirmed the incomplete project construction
documentation (lack of detail – results in variation) followed by the documentation
quality on the site as a major challenge. Not enough detailed documentation leads to
numerous requests for information and this slows down the construction process.
A high level of training and experience among the design team is desirable for
heritage projects and is not often the case. If the project team members – especially
the project manager – have no heritage qualifications and/or practical experience it
may have a significant effect on the project delivery.
The third factor that has an effect on the project delivery success is the issue of the
multiple stakeholder management. The involvement of multiple stakeholders in the
project poses multiple challenges if the project team has not explored the
stakeholders’ needs followed by the identification of the stakeholder requirements as
the major factors by the confirmatory factor analysis. The SEM analysis has
confirmed the importance of exploring the stakeholders’ needs and constraints
together with the understanding of the stakeholders’ interests from the early stages of
the project as a major factor that needs to be considered for successful management
in the multiplicity of the stakeholder’s involvement in the project. Identifying
stakeholder requirements over and above assessing the stakeholder attributes
(urgency and proximity), the failure to address the stakeholders’ interests
immediately can lead to conflict between the stakeholders. Analysing conflicts and
coalitions among the stakeholders then becomes an important task to be given
attention throughout the whole project.
In regard to the technical factors, the fourth factor that influences the project delivery
data examined in the CFA has found that another main problem in heritage projects

Chapter 8: Conclusion 220
is the procedure involved in the repair or rebuild of stone work, brick work, steel
work, concrete work and timber work and it has been confirmed as a major factor
with the SEM analysis. Therefore this was the main technical challenge in both CFA
and SEM data analysis. While the CFA results as a second major factor is
architectural detailing the SEM the survey results highlighted the need for consistent
procedures on how to deal with specific issues related to repair and rebuild
procedures. This would help mediate this issue especially in the construction phase.
The knowledge on such procedures has not been passed along and tradespeople on
heritage projects are now “doing their best” to achieve the quality level of the
project. Some of the techniques are irretrievably lost.
Engineers are facing difficulties in complying with the BCA when working on
heritage building projects, and the survey indicated the need for finding the strategy
how to comply to the BCA Code and to meets DDA.
RQ3: Management processes being improved in operation and delivery
To achieve improvements in future heritage projects, a summary of the factors
(challenges, causes and call for action) that were validated and enriched by the focus
group was provided (Chapter 7, Table 7.2). This research project identified the
factors and circumstances that caused delays and proposed guidance for instigating a
set of actions that will improve the project delivery. The steps that should be
carefully followed to achieve operational improvements in heritage project
management and delivery are shown in Figure 8.2.
8.5. Summary
Heritage buildings/places belong to the community and thus the social value
assessment or genuine community consultation is highly important. Failure to do this
properly results in appeals on development proposals and the loss of intangible and
tangible values.
Everything that happens in the execution/construction stage relies to a great extent on
the design; however, during the design phase, a limited amount of investigation is
often undertaken for various reasons (Chapter 7, Table 7.2). This means the project is
designed with a lack of information and the scope cannot be clearly outlined,

Chapter 8: Conclusion 221
resulting in omissions in the tender documentation when items are not included.
Overall, therefore, the most significant risk in heritage project management is the
scope definition. This risk can be overcome by implementing the series of proposed
actions (Chapter 7, Table 7.2).
The significance and contribution of the research to the field of heritage project
management are summarised in a Table 7.2 Chapter 7. The guidance can be utilised
to undertake proposed specific actions that have been clearly drawn from the
examination of the relationship of the current challenges and the associated
causes/risks. Therefore this “call for action” should be considered primarily by the
heritage authorities in the development and review of the relevant policies and
procedures in order to improve the scope definition and enhance the overall success
of project performance and delivery to the satisfaction of all the project stakeholders.
All project stakeholders have to work to the common goal which is high quality
220the rewiew of the current nproject performance/delivery. Everybody’s task is to
ensure the timely and’ within budge’t project conclusion undertaken to excellent
quality building conservation levels at the same time. Furthermore, the maintenance
plan (cost) as a part of the conservation management plan would ensure that the
building will be maintained on the regular basis and remain in a good condition
through the decades.
8.6. Limitations of the Study
This study was undertaken with the aim to make a contribution to the management of
future heritage projects in Australia. The data was collected exclusively from
Australian practitioners, experts (including some with overseas experience),
Australian heritage authorities and members of the public. This may affect the ability
of the findings to be exactly repeated or generalised to the practices of heritage
project management in other countries.
8.7. Contribution of the Study and Directions in Future Research
As far as the author is aware, this is the first research project that has been
undertaken to encompass all project challenges and causes of delay across all
Australian states. The project brought together heritage practitioners and experts
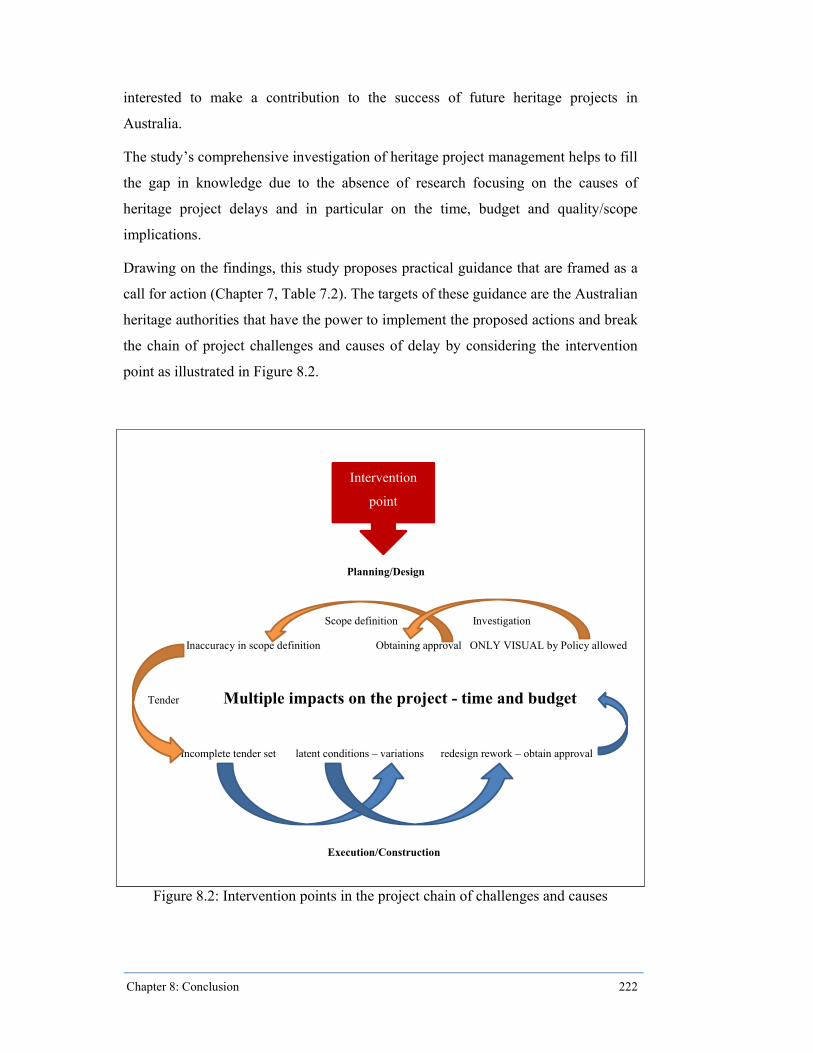
Chapter 8: Conclusion 222
interested to make a contribution to the success of future heritage projects in
Australia.
The study’s comprehensive investigation of heritage project management helps to fill
the gap in knowledge due to the absence of research focusing on the causes of
heritage project delays and in particular on the time, budget and quality/scope
implications.
Drawing on the findings, this study proposes practical guidance that are framed as a
call for action (Chapter 7, Table 7.2). The targets of these guidance are the Australian
heritage authorities that have the power to implement the proposed actions and break
the chain of project challenges and causes of delay by considering the intervention
point as illustrated in Figure 8.2.
Figure 8.2: Intervention points in the project chain of challenges and causes
Intervention
point
Planning/Design
Scope definition Investigation
Inaccuracy in scope definition Obtaining approval ONLY VISUAL by Policy allowed
Tender Multiple impacts on the project - time and budget
Incomplete tender set latent conditions – variations redesign rework – obtain approval
Execution/Construction

Chapter 8: Conclusion 223
The results of this research can be tested on other Australian heritage projects as well
as in other countries, to investigate whether the set of actions is applicable or can be
applied with certain modification. It is also suggested that future research builds on
the current study by pursuing the following objectives:
To review the current policy/procedures by considering the impact of the
non-destructive ‘demolition investigation packet’ on the scope definition
To review the Building Code of Australia and propose strategy to comply
with or amendments that will suit the particular needs of heritage buildings
To explore the potential of implementing the maintenance plan/cost as a part
of conservation management plan
To create a heritage project app to be used by heritage practitioners as a
resource for successful project performance

Chapter 8: Conclusion 224

References 225
References
Aaltonen, K. 2011. "Project stakeholder analysis as an environmental interpretation process." International Journal of Project Management 29 (2): 165-183.
Aaltonen, K. and J. Kujala. 2010. "A project lifecycle perspective on stakeholder
influence strategies in global projects." Scandinavian Journal of Management 26 (4): 381-397.
Abercrombie, N., S. Hill and B. S. Turner. 1984. Dictionary of sociology: Penguin
Books.
Acock, A.C. 2013. "Discovering structural equation modeling using Stata." Stata
Press books.
Adler, P. A. and P. Adler. 1994. "Observational techniques." Handbook of
qualitative research 1: 377-392.
Aguinis, H., R.K. Gottfredson and H. Joo. 2013. "Best-practice recommendations for
defining, identifying, and handling outliers." Organizational Research Methods: 1094428112470848.
Alallafa, E.H. and S. Della Torreb. 2010. "A procedure for representing and tackling
constraints of multiplicity of stakeholders objectives in the conservation process.
Araoz, G.F. 2011. "Preserving heritage places under a new paradigm." Journal of
Cultural Heritage Management and Sustainable Development vol.1 (1): pp. 55-60. http://dx.doi.org/10.1108/20441261111129933.
Atkinson, R. 1999. "Project management: cost, time and quality, two best guesses
and a phenomenon, its time to accept other success criteria." International Journal of Project Management 17 (6): 337-342. http://www.sciencedirect.com/science/article/pii/S0263786398000696.
Auerbach, C. F. and L. B. Silverstein. 2003. Qualitative data: An introduction to
coding and analysis: NYU press.
Australia ICOMOS. 1999. The Burra Charter: the Australia ICOMOS Charter for
Places of Cultural Significance: Australia ICOMOS.
Australian Bureau of Statistics. 2013a. "Strong tourism growth affirms 'there's
nothing like Australia'". Canberra.

References 226
Australian Bureau of Statistics. 2013b. "Tourism grows faster than the total of the economy in 2011-12". Canberra.
Australian Bureau of Statistics. 2015. "TOURISM Cultural and heritage visitors".
Australian Government Productivity Commission. 2006. "Conservation of Australia's
Historic Heritage Places".
Australian State of the Environment Committee. 2011. Heritage.
http://www.environment.gov.au/soe/2011/report/heritage/pubs/soe2011-report-heritage.pdf.
Bade, D. 2011. "An Approach to Researching Cultural Heritage Management on
Conservation Islands in New Zealand." Graduate Journal of Asia-Pacific Studies 7 (2): 62-77.
Baker, L. 2006. "Observation: A complex research method." Library Trends 55 (1):
171-189.
Barnette, J.J. 2010. "Likert Scaling". In Encyclopedia of research design, edited by
N.J. Salkind: SAGE Publications.
Barrett, P. 2007. "Structural equation modelling: Adjudging model fit." Personality
and Individual differences 42 (5): 815-824.
Belassi, W. and O.I.Tukel. 1996. "A new framework for determining critical
success/failure factors in projects." International Journal of Project Management 14 (3): 141-151.
Boomsma, A. 1983. "On the robustness of LISREL (maximum likelihood
estimation) against small sample size and non-normality, University of Groningen.
Bourne, L. and D.H.T. Walker. 2005. "Visualising and mapping stakeholder
influence." Management Decision 43 (5): 649-660.
Bowen, G.A. 2009. "Document analysis as a qualitative research method."
Qualitative Research Journal 9 (2): 27-40.
Brand, S. 1995. How buildings learn: what happens after they're built: Penguin
Books.
Brill, J.E. 2008. Likert scale, edited by P.J. Lavrakas, Encyclopedia of survey
research methods: SAGE Publications.

References 227
Bringer, J.D., L.H. Johnston and C.H. Brackenridge. 2006. "Using computer-assisted
qualitative data analysis software to develop a grounded theory project." Field Methods 18 (3): 245-266.
Brooks, G. 1992. "The Burra Charter: Australia's Methodology for Conserving
Cultural Heritage [Standards]." Places 8 (1).
Bullen, P.A. and P.E.D. Love. 2010. "The rhetoric of adaptive reuse or reality of
demolition: Views from the field." Cities 27 (4): 215-224. http://www.sciencedirect.com/science/article/pii/S0264275109001450. doi: 10.1016/j.cities.2009.12.005.
Bullen, P.A. and P.E.D. Love. 2011. "Adaptive reuse of heritage buildings."
Structural survey 29 (5): 411-421. http://dx.doi.org/10.1108/02630801111182439.
Burrell, G. and G. Morgan. 1979. Sociological paradigms and organisational
analysis. Vol. 248: London: Heinemann.
Byrne, B.M. 2001. Structural equation modeling with AMOS: Basic concepts,
applications, and programming, L Erlbaum Associates, Mahwah, NJ.
Byrne, B.M. 2013. Structural equation modeling with AMOS: Basic concepts,
applications, and programming: Routledge.
Carmichael, D.G. 2004. Project management framework: Taylor & Francis.
Cleland, D.I. and L.R. Ireland. 2010. Project Manager's Portable Handbook
Cohen, L., L. Manion and K. Morrison. 2011. Research Methods in Education [7 th
edn] Abingdon, Oxon ; New York: Routledge.
Collis, J. and R. Hussey. 2003. "Business research-a practical guide for
undergraduate and postgraduate students.: Palgrave Macmillan.
ComLaw, Australian Government. 1992. "Disability Discrimination Act 1992".
Comrey, A.L. and H.B. Lee. 1992. "A first course infactor analysis." Hillsdale, New
Jersey: Erlbaum 2nd ed.
Connell, A.F. and W. Nord. 1996. "The bloodless coup: The infiltration of
organization science by uncertainty and values." The Journal of Applied Behavioral Science 32 (4): 407-427.

References 228
Cooke-Davies, T. 2002. "The “real” success factors on projects." International
Journal of Project Management 20 (3): 185-190.
Cooper, D. R. and P. S. Schindler. 1998. Business research methods: Irwin McGraw-
Hill.
Cooper, D. R. and P. S. Schindler. 2008. Business research methods. Tenth edition
ed: McGraw-Hill Irwin.
Crawford, L.H. and J. Helm. 2009. "Government and governance: The value of
project management in the public sector." Project Management Journal 40 (1): 73-87.
Creswell, J.W. 2007. "Qualitative enquiry and research design: Choosing among five
approaches.
Creswell, J.W. 2009. Research design: Qualitative, quantitative, and mixed methods
approaches: Sage Publications, Inc.
Crotty, M. 1998. The foundations of social research: Meaning and perspective in the
research process: Sage.
Dann, N. and T. Cantell. 2007. "Maintenance in conservation." Understanding
Historic Building Conservation: 185-198. doi: 10.1002/9780470691823.ch16
Dann, N. and S. Wood. 2004. "Tensions and omissions in maintenance management
advice for historic buildings." Structural survey 22 (3): 138-147. http://dx.doi.org/10.1108/02630800410549035.
Dann, N., D. Worthing and S. Bond. 1999. "Conservation maintenance management
- establishing a research agenda." Structural survey 17 (3): 143-153. http://dx.doi.org/10.1108/02630809910291325.
Department of Environment and Heritage Protection. 2014a. "Conservation
Management Plans." Accessed 17 January 2014. http://www.ehp.qld.gov.au/heritage/documents/gl-conservation-management-plans.pdf.
Department of Environment and Heritage Protection. 2014b. "Protecting Queensland
heritage." Accessed 17 January 2014. http://www.ehp.qld.gov.au/heritage/heritage-in-qld/protecting-heritage.html.

References 229
Department of Environment and Heritage Protection and Queensland Heritage Council. 2012. "Queensland Heritage Strategy: a ten-year plan." Accessed 29 December 2012. http://www.qldheritage.org.au/heritage-strategy.html.
Department of Sustainability Environment Water Population and Communities.
2012a. "Australian Heritage Strategy public consultation paper." Accessed 29 December 2012. http://www.environment.gov.au/resource/australian-heritage-strategy-public-consultation-paper.
Department of Sustainability Environment Water Population and Communities.
2012b. "The World Heritagre Convention." Accessed 27 December 2012. http://www.environment.gov.au/heritage/about/world/convention.html.
DeVellis, R.F. 2012. Scale development: Theory and applications. Vol. 26: Sage
publications.
Dumont, P.R., G.E. Gibson Jr and J.R. Fish. 1997. "Scope management using project
definition rating index." Journal of Management in Engineering 13 (5): 54-60.
Easterby-Smith, M., R. Thorpe, P. Jackson and A. Lowe. 2008. Management
research: SAGE Publications Limited.
ECDC and UK University of Chester. 2009. "Activity 9.4 Qualitative and
quantitative research approaches." Accessed 18 january 2013. http://influenzatraining.org/documents/s17645en/s17645en.pdf.
Eden, C. and F. Ackermann. 1998. "Strategy making: The journey of strategic
management." Sage, London
Eisenhardt, K. M. 1989. "Building theories from case study research." Academy of
management review 14 (4): 532-550.
English Heritage. 2005. "Guidance on the management of conservation areas."
English Heritage, London.
English Heritage. 2008. Conservation principles: policies and guidance for the
sustainable management of the historic environment: English Heritage. http://www.english-heritage.org.uk/publications/conservation-principles-sustainable-management-historic-environment/conservationprinciplespoliciesguidanceapr08web.pdf.
English Heritage. 2011. "Heritage at risk. http://www.english-
heritage.org.uk/content/publications/publicationsNew/heritage-at-risk/har-2011-local-summaries/acc-HAR-2011-lon-summary.pdf.

References 230
Fairfax County Department of Neighborhood and Community Services. 2012.
"Survey Questionnaire Design." Accessed 20 January www.fairfaxcounty.gov/demogrph/pdf/questionnairedesign.pdf.
Fellows, R. and A. Liu. 2003. Research methods for construction: Wiley-Blackwell.
Fellows, R. and A. Liu. 2008. Research methods for construction: Blackwell
Publishing Ltd.
Forster, A.M. and B. Kayan. 2009. "Maintenance for historic buildings: a current
perspective." Structural survey 27 (3): 210-229. http://dx.doi.org/10.1108/02630800910971347.
Freeman, M. and P. Beale. 1992. "Measuring project success." Project Management
Journal 23 (1): 8-17.
Freeman, R. and J. McVea. 2001. "A stakeholder approach to strategic management.
Frooman, J. 1999. "Stakeholder influence strategies." Academy of management
review: 191-205.
Frooman, J. 2010. "The issue network: Reshaping the stakeholder model." Canadian
Journal of Administrative Sciences/Revue Canadienne des Sciences de l'Administration 27 (2): 161-173.
Gambles, I. 2009. Making the business case: proposals that succeed for projects that
work: Gower Pub Co.
George, D. and M. Mallery. 2003. "Using SPSS for Windows step by step: a simple
guide and reference." Boston, MA: Allyn y Bacon.[Links].
Gibbs, A. 1997. "Focus groups." Social research update 19 (8).
http://sru.soc.surrey.ac.uk/SRU19.html.
Giddens, A. 1989. "Sociology Polity Press": Cambridge.
Gliem, J.A. and R.R. Gliem. 2003. "Calculating, interpreting, and reporting
Cronbach’s alpha reliability coefficient for Likert-type scales, edited: Midwest Research-to-Practice Conference in Adult, Continuing, and Community Education.
Green, J., K. Willis, E. Hughes, R. Small, N. Welch, L. Gibbs and J. Daly. 2007.
"Generating best evidence from qualitative research: the role of data

References 231
analysis." Australian and New Zealand journal of public health 31 (6): 545-550.
Green, S.B. and J. Neil. 2008. "Salkind 2008. Using SPSS for Windows and
Macintosh: Analyzing and Understanding Data": Pearson/Prentice Hall.
Groat, L.N. and D. Wang. 2002. Architectural research methods: Wiley.
Groenewald, T. 2004. "A phenomenological research design illustrated.
Grogan, A. 2012. "Heritage retrofitting." Engineering & Technology 7 (3): 56-59.
Hair, J.F., W.C. Black, B.J. Babin and R.E. Anderson. 2010. Multivariate data
analysis. A global perspective. 7th ed. Vol. 7458, USR, New Jersey. London: Pearson.
Hair, J.F., W.C. Black, B.J. Babin, R.E. Anderson and R.L. Tatham. 2006.
Multivariate data analysis. Vol. 6: Pearson Prentice Hall Upper Saddle River, NJ.
Hatch, M.J. and A.L. Cunliffe. 2006. Organization Theory: Oxford University Press
Inc.
Haughey, D. 2012. "An Introduction to Project Management." Accessed 25 May
2012. http://www.projectsmart.co.uk/introduction-to-project-management.html.
Henry, G. T. 1990. Practical sampling. Vol. 21: Sage.
Heritage Council of New South Wales and The Royal Australian Institute of
Architects. 2008. "New uses for heritage places", edited by Department of Planning.
Heritage Perth. 2014. "The History of the Burra Charter." Accessed 10 January 2014.
http://heritageperth.com.au/your-heritage/the-burra-charter/the-history-of-the-burra-charter/.
Hesse-Biber, S.N. and P. Leavy. 2010. The practice of qualitative research: Sage
Publications, Incorporated.
Hill, G.M. 2010. The complete project management methodology and toolkit: CRC
Press.

References 232
Holden, M.T. and P. Lynch. 2004. "Choosing the appropriate methodology: understanding research philosophy." The marketing review 4 (4): 397-409.
Hooper, D., J. Coughlan and M. Mullen. 2008. "Structural equation modelling:
Guidelines for determining model fit." Articles: 2.
Hubert, M. and E. Vandervieren. 2008. "An adjusted boxplot for skewed
distributions." Computational statistics & data analysis 52 (12): 5186-5201.
ICOMOS. 1987. "Charter for the conservation of historic towns and urban areas
(Washington Charter 1987)." Accessed 11 February 2014. http://www.international.icomos.org/charters/towns_e.pdf.
International, QSR. 2012. "NVivo." Accessed 20 July 2012.
http://www.qsrinternational.com/products_nvivo.aspx.
Jepsen, A.L. and P. Eskerod. 2009. "Stakeholder analysis in projects: Challenges in
using current guidelines in the real world." International Journal of Project Management 27 (4): 335-343. http://www.sciencedirect.com/science/article/pii/S0263786308000549.
Johnson, R.B. and A. J. Onwuegbuzie. 2004. "Mixed methods research: A research
paradigm whose time has come." Educational researcher 33 (7): 14-26.
Johnston, C. 1992. What is Social Value?: A Discussion Paper: Australian
Government Publishing Service, Canberra.
Jokilehto, J. 2011. "World heritage: observations on decisions related to cultural
heritage." Journal of Cultural Heritage Management and Sustainable Development 1 (1): 61-74. http://dx.doi.org/10.1108/20441261111129942.
Kalantari, D.H., D.E. Kalantari and S. Maleki. 2011. "E-survey (surveys based on e-
mail & web)." Procedia Computer Science 3: 935-941.
KANE Constructions. 2007. Dilapidation Survey, QUT Old Government House
Refurbishment.
Kasi, P.M. 2009. Research: What, Why and How?: a Treatise from Researchers to
Researchers: AuthorHouse.
Kellehear, A. 1993. The unobtrusive researcher: A guide to methods: Allen & Unwin
St Leonards.
Krauss, S. E. 2005. "Research paradigms and meaning making: A primer." The
Qualitative Report 10 (4): 758-770.

References 233
Krueger, R.A. and M.A. Casey. 2009. Focus groups: A practical guide for applied
research: Pine Forge Press.
Kumarasuriyar, A. C. and D. Nielsen. 2012. "Tangible cultural heritage and adaptive
reuse: the Old Government House, Brisbane, Australia." In Heritage 2012: Proceedings of the 3rd International Conference on Heritage and Sustainable Development (Volume 3), edited, 1857-1865: Green Lines Institute for Sustainable Development.
Kvale, S. 1996. "The 1,000-page question." Qualitative inquiry 2 (3): 275-284.
Kwok, R. 2008. Mean, edited by P.J. Lavrakas, Encyclopedia of Survey Research
Methods: Sage Publications.
Lawerance Douglas County Metropolitan Planning Office. 2011. "Historic
Preservation Plan Element.
Lipovetsky, S., A. Tishler, D. Dvir and A. Shenhar. 2002. "The relative importance
of project success dimensions." R&D Management 27 (2): 97-106.
Livesey, C. 2005. "Defining Sociology." www.sociology.org.uk/as4def.doc.
Long, J.S. and J. Freese. 2006. Regression models for categorical dependent
variables using Stata: Stata press.
Maeer, G. and G. Fawcett. 2011. "Values and benefits of heritage." A research
review. London: Heritage Lottery Fund.
Marquis-Kyle, P. and M. Walker. 1992a. The Illustrated Burra Charter: Making
good decisions about the care of important places: Australia ICOMOS Inc with the Australian Heritage Commission.
Marquis-Kyle, P. and M. Walker. 1992b. The Illustrated Burra Charter: Making
good decisions about the care of important places: Australia ICOMOS, Australian Heritage Commission.
Mason, R. 2005. "Economics and historic preservation." Washington, DC: The
Brookings Institution.
McKercher, B., P.S.Y Ho and H. du Cros. 2005. "Relationship between tourism and
cultural heritage management: Evidence from Hong Kong." Tourism Management 26 (4): 539-548.

References 234
Meredith, J.R. and S.J.Jr. Mantel. 2011. Project management: a managerial approach: Wiley.
Moore, G.T. 1981. New directions for environment-behavior research in
architecture: Center for Architecture and Urban Planning Research, University of Wisconsin-Milwaukee.
Morgan, D.L. 1996. "Focus groups." Annual review of sociology: 129-152.
Multon, K. and J. Coleman. 2010. "Coefficient alpha." Sage Publications, Inc.,
Thousand Oaks: 160-164.
Nagothu, U.S., P. Stalnacke, J. Garnier, G. Billen, P. Passy, V. Rousseau and C.
Lancelot. 2009. Identification of Key Stakeholders in the AWARE case study areas - Vol. First edition January 2009: Bioforsk, Norway; Universite Pierre et Marie Curie, France; Universite Libre de Bruxelles, Belgium.
Navrud, S. and R.C. Ready. 2002. Valuing cultural heritage: applying environmental
valuation techniques to historic buildings, monuments and artifacts: Edward Elgar Pub.
Neuman, W.L. 2006. Social Research Methods: Qualitative and Quantitative
Approaches (6th ed.). Boston: MA: Pearson Education.
Newcombe, R. 2003. "From client to project stakeholders: a stakeholder mapping
approach." Construction management and economics 21 (8): 841-848.
Nord, W.R. and A.F. Connell. 1993. "From quicksand to crossroads: An agnostic
perspective on conversation." Organization Science 4 (1): 108-120.
Olander, S. 2007. "Stakeholder impact analysis in construction project management."
Construction management and economics 25 (3): 277-287.
Olander, S. and A. Landin. 2005. "Evaluation of stakeholder influence in the
implementation of construction projects." International Journal of Project Management 23 (4): 321-328.
Orbagli, Aylin. 2008. "Architectural conservation." Blackwell Publishing.
https://wiki.uii.ac.id/images/4/4f/Peras5.2010_Handout_-_Architectural_Conservation.pdf.
OWHC. 2012. Accessed 20 July 2012. http://www.ovpm.org/.

References 235
Park, H.M. 2008. "Univariate analysis and normality test using SAS, Stata, and SPSS." The University Information Technology Services (UITS) Center for Statistical and Mathematical Computing, Indiana University.
Patton, M.Q. 2002. Qualitative research & evaluation methods (3rd ed.). Thousand
Oaks: CA: Sage
Peacock, A.T. and I. Rizzo. 2008. The heritage game: economics, policy, and
practice: Oxford University Press, USA.
Pearson, M. and S. Sullivan. 1995. Looking after heritage places: The basics of
heritage planning for managers, landowners and administrators: Melbourne University Press.
Phelps, A., G.J. Ashworth and B.O.H. Johansson. 2002. "The Construction of Built
Heritage: A North European perspective on policies, practices and outcomes." Recherche 67: 02.
Plevoets, B. and K. Van Cleempoel. 2011. "Assessing authenticity of nineteenth-
century shopping passages." Journal of Cultural Heritage Management and Sustainable Development 1 (2): 135-156. http://dx.doi.org/10.1108/20441261111171693.
Poria, Y., R. Butler and D. Airey. 2003. "The core of heritage tourism." Annals of
tourism research 30 (1): 238-254.
Powell, R.A. and H.M. Single. 1996. "Focus groups." International journal for
quality in health care 8 (5): 499-504.
Productivity Commission. 2006. "Conservation of Australia’s historic heritage
places." Productivity Commission Inquiry report (37).
Project Management Institute. 2008. A guide to the project management body of
knowledge (PMBOK GUIDE). Fourth Edition ed: Project Management Institute.
Provins, A., D. Pearce, E. Ozdemiroglu, S. Mourato and S. Morse-Jones. 2008.
"Valuation of the historic environment: The scope for using economic valuation evidence in the appraisal of heritage-related projects." Progress in planning 69 (4): 131-175.
Queensland Government. 2015a. "Anzac Square", edited by Environment Land and
Water.

References 236
Queensland Government. 2015b. "Gona Barracks", edited by Land and Water Environment.
Queensland Government. 2015c. "Old Government House", edited by Environment
Land and Water.
Queensland Heritage Council. 2006. "Using the criteria: a methodology".
Queensland Heritage Council. 2014. "Welcome." Accessed 17 January 2014.
http://www.qldheritage.org.au/.
Reyers, J. and J. Mansfield. 2001. "The assessment of risk in conservation
refurbishment projects." Structural survey 19 (5): 238-244.
RIBA. 2000. "Architect's Plan of Work."
http://www.ribapublishing.com/publications/practiceManagement/planWork.asp.
RIBA. 2013. "Plan of Work 2013." Accessed 27 February 2013.
http://www.architectsjournal.co.uk/news/daily-news/riba-scraps-plan-of-work-say-goodbye-to-stages-a-l/8637663.article.
Richard, D.M. 2010. Standard Deviation, edited by J.N. Salkind. Vol. 1,
Encyclopedia of Research Design: SAGE Publications.
Robson, C. 2011. Real world research: a resource for users of social research
methods in applied settings: Wiley Chichester.
Roders, A.P. and R. Van Oers. 2011. "World Heritage cities management." Facilities
29 (7): 276-285. http://dx.doi.org/10.1108/02632771111130898.
Royston, J.P. 1982. "An extension of Shapiro and Wilk's W test for normality to
large samples." Applied Statistics: 115-124.
Royston, P. 1991. "Estimating departure from normality." Statistics in Medicine 10
(8): 1283-1293.
Rubin, D.B. 1972. "A non-iterative algorithm for least squares estimation of missing
values in any analysis of variance design." Applied Statistics: 136-141.
Rubin, D.B. 1996. "Multiple imputation after 18+ years." Journal of the American
statistical Association 91 (434): 473-489.

References 237
Rubin, H. J. and I. S. Rubin. 2011. Qualitative interviewing: The art of hearing data: Sage Publications.
Rudestam, K.E. and R.R. Newton. 2007. Surviving your dissertation: A
comprehensive guide to content and process: Sage Publications, Incorporated.
Rypkema, D.D. 1990. "Preservation Under (Development) Pressure". In Vital
Speeches of the Day: McMurry Inc.
Rypkema, D.D. 2001. The economic power of restoration: D. Rypkema.
Rypkema, D.D. 2003. "Planning for the Future." Using the Past: The Role of
Historic Preservation in Building Tomorrow’s Washington, DC National Trust for Historic Preservation.
Sarantakos, S. 1998. Social research: Macmillan Education Australia South
Melbourne, VIC.
Sarantakos, S. 2005. Social research: Third Edition: Palgrave Macmillan,
Hampshire.
Schermelleh-Engel, K., H. Moosbrugger and H. Müller. 2003. "Evaluating the fit of
structural equation models: Tests of significance and descriptive goodness-of-fit measures." Methods of psychological research online 8 (2): 23-74.
Serageldin, I. 1999. "Cultural heritage as public good." Global Public Goods: 240.
Shenhar, A. and D. Dvir. 2007. Reinventing project management: the diamond
approach to successful growth and innovation: Harvard Business Press.
Sheskin, D. 2010. Outlier, edited by N.J. Salkind. Vol. 1, Encyclopedia of research
design: SAGE Publications.
Shipley, R., S. Utz and M. Parsons. 2006. "Does adaptive reuse pay? A study of the
business of building renovation in Ontario, Canada." International Journal of Heritage Studies 12 (6): 505-520.
Sida Civil Society Center. 2006. Logical Framework Approach with an appreciative
approach.
Slatyer, R.O. 1983. "The origin and evolution of the World Heritage Convention."
Ambio: 138-140.

References 238
Smith, J. 2005. "Cost budgeting in conservation management plans for heritage buildings." Structural survey 23 (2): 101-110. http://dx.doi.org/10.1108/02630800510593675.
Smith, J., N. O'Keeffe, J. Georgiou and P.E.D.Love. 2004. "Auditing construction
costs during building design: A case study of cost planning in action." Managerial auditing journal 19 (2): 259-271.
Soetanto, R., D.G. Proverbs and G.D. Holt. 2001. "Achieving quality construction
projects based on harmonious working relationships-Clients’ and architects’ perceptions of contractor performance." International Journal of Quality & Reliability Management 18 (5): 528-548.
Sommer, H. 2010. Project Management for Building Construction: 35 Years of
Innovation at Drees & Sommer: Springer Verlag.
Spector, P.E. 2004. "Likert scale". In Encyclopedia of Social Science Research
Methods, edited by A. Bryman: SAGE Publications.
Spennemann, D.H.R. 2006. "Gauging community values in Historic preservation."
CRM-WASHINGTON- 3 (2): 6.
Stata Press. 2013. "Stata SEM v13 manual": College Station: Texas.
Strategy, Australian Heritage Strategy - About the. 2008. "A guide to heritage listing
in Australia." Accessed 18th March 2013. http://www.environment.gov.au/system/files/resources/c6c7a87e-d4a6-4001-b62b-04ebd0ae2aef/files/heritage-listing-guide.pdf.
Strategy, Australian Heritage Strategy - About the. 2011. "Australian Heritage
Strategy." Accessed 29 December 2012. http://www.environment.gov.au/heritage/strategy/index.html.
Suhr, D.D. 2006. Exploratory or confirmatory factor analysis? : SAS Institute Cary.
Sullivan, S. 2006. "Cultural Heritage and Local Government." Australian State of the
Environment Committee.
Tabachnick, B.G. and L.S. Fidell. 2007. "Multivariate analysis of variance and
covariance." Using multivariate statistics 3: 402-407.
Teddlie, C. and A. Tashakkori. 2012. "Common “Core” Characteristics of Mixed
Methods Research A Review of Critical Issues and Call for Greater Convergence." American Behavioral Scientist 56 (6): 774-788.

References 239
Terrell, S. R. 2012. "Mixed-Methods Research Methodologies." Qualitative Report 17 (1): 254-280.
The Australian Building Codes Board. 2013. "Building Code of Australia".
The Hon. Greg Hunt MP. 2013. A new vision for Australia's Heritage.
http://www.environment.gov.au/minister/hunt/2013/mr20131104.html
The Prince of Wales. 2009. "HRH gives the annual lecture at the Royal Institute of
British Architects." Accessed 20 July 2012. http://www.princeofwales.gov.uk/newsandgallery/news/hrh_gives_the_annual_lecture_at_the_royal_institute_of_briti_104828133.html.
Thompson, B. 2004. Exploratory and confirmatory factor analysis: Understanding
concepts and applications: American Psychological Association.
Too, E.G. 2009. "Capabilities for strategic infrastructure asset management." PhD,
Queensland University of Technology
Toor, S.R. and S.O. Ogunlana. 2010. "Beyond the ‘iron triangle’: Stakeholder
perception of key performance indicators (KPIs) for large-scale public sector development projects." International Journal of Project Management 28 (3): 228-236.
Turzynski, J. 2013. "We look at each asset afresh – buildings, campuses, property
portfolios or entire districts – to find improvements that bring maximum value and resilience." Accessed 02nd April 2013. http://www.arup.com/Services/Building_retrofit.aspx.
Tyler, N., T. Ligibel and I.R. Tyler. 2009. Historic preservation: An introduction to
its history, principles, and practice: WW Norton & Company.
Uhde, N. 2008. "Validity of scoring methods in the presence of outliers." Journal of
Business and Economics Research 6 (11).
UNESCO. 1972. "Convention concerning the protection of the world cultural and
natural heritage." Accessed 25 May 2012. http://whc.unesco.org/en/conventiontext.
University of the West of England. 2003. Maintaining Value. Bristol.
Vines, E. 2012. "New Futures for Heritage Buildings." In the Australian Institute of
Architects' refuel national Seminars Series CPD event, Brisbane, edited: Australian Institute of Architects'

References 240
Ward, S. and C. Chapman. 2008. "Stakeholders and uncertainty management in projects." Construction management and economics 26 (6): 563-577.
Wilkinson, S.J., K. James and R. Reed. 2009. "Using building adaptation to deliver
sustainability in Australia." Structural survey 27 (1): 46-61.
Williamson, K. 2010. Development and Design of Heritage Sensitive Sites:
Strategies for Listed Buildings and Conservation Areas: Routledge.
Winter, M., C. Smith, P. Morris and S. Cicmil. 2006. "Directions for future research
in project management: The main findings of a UK government-funded research network." International Journal of Project Management 24 (8): 638-649. http://www.sciencedirect.com/science/article/pii/S0263786306001268.
Worthing, D. and J. Counsell. 1999. "Issues arising from computer-based recording
of heritage sites." Structural survey 17 (4): 200-210.
Yang, J. 2010. "A Framework for Stakeholder Management in Construction Projects
Department of Building and Real Estate, The Hong Kong Polytechnic University.
Yang, J., G. Shen, D. Drew and M. Ho. 2010. "Critical Success Factors for
Stakeholder Management: Construction Practitioners’ Perspectives." Journal of Construction Engineering and Management 136 (7): 778-786. http://ascelibrary.org/doi/abs/10.1061/%28ASCE%29CO.1943-7862.0000180. doi: doi:10.1061/(ASCE)CO.1943-7862.0000180.
Yin, R.K. 2009. Case study research: design and methods. Vol. 5, 4 ed: Sage
Publications.
Yin, R.K. 2008. Case study research: Design and methods. Vol. 5: Sage
Publications, Incorporated.
Yin, R.K. 2011. Applications of case study research. Vol. 34: Sage Publications,
Incorporated.
Zikmund, W., B. Babin, J. Carr and M. Griffin. 2012. Business research methods:
Cengage Learning.
Zikmund, W.G., B.J. Babin, J.C. Carr and M. Griffin. 2010. "Business Research
Methods, South-Western, Cengage Learning." Mason, OH.
Zwikael, O. and J. Smyrk. 2011. Project Management for the Creation of
Organisational Value: Springer Verlag.

Appendix A: Survey Questionnaire 241
Appendices
Appendix A: Survey Questionnaire

Appendix A: Survey Questionnaire 242
Which of the following best represents you?
○ User/Public (Bookshop, Cafe, Museum, etc.)
Go to Section A ○ Occupier (Bookshop, Cafe, Museum, etc.)
○ Tourism and related organisations
○ Project Owner/Client
Continue to Section B
○ Project Financiers/Sponsors/Grant givers
○ Project Manager
○ Contractor/Builder
○ Architect
○ Heritage Consultant
○ Engineers Discipline (All)
○ Quantity Surveyor
○ Superintendent
○ Heritage Administration
○ Building Tradesperson
○ Conservator
○ Archaeologist

Appendix A: Survey Questionnaire 243
Section A
A1: General Background
In which state/territory you are located?
○ ACT
○ NSW
○ QLD
○ VIC
○ TAS
○ SA
○ WA
○ NT Which of the following organizations are you currently a member of? Please tick relevant option/s.
○ National Trust (NT)
○ International Council on Monuments and Sites (ICOMOS)
○ Australian Institute of Architects (AIA)
○ Australian Institute of Project Management (AIPM)
○ Australian Institute of Building Surveyors (AIBS)
○ Australian Institute of Quantity Surveyors (AIQS)
○ Royal Institution of Chartered Surveyors (RICS)
○ Engineers Australia (EA)
○ EA/National Professional Engineers Register (NPER)
○ Australian Institute of Building (AIB)
○ Master Builders Australia (MBA)
○ The Urban Development Institute of Australia (UDIA)
○ None
○ Other (please specify) ........................................................................................................................................

Appendix A: Survey Questionnaire 244
A2: Retention of Heritage Places
What do you consider to be the key reasons for retaining heritage buildings/places? Please select one option for each of the following.
Strongly Disagree
Disagree Neutral Agree Strongly Agree
Appearance and design qualities ○ ○ ○ ○ ○
Landmark qualities ○ ○ ○ ○ ○ Contribution to streetscapes and views ○ ○ ○ ○ ○
The amenity of a suburb with a consistent character
○ ○ ○ ○ ○
Special character ○ ○ ○ ○ ○ Rarity ○ ○ ○ ○ ○ Historical importance - evidence of past ways of life
○ ○ ○ ○ ○
Their connection to people – groups in the community
○ ○ ○ ○ ○
Tourism ○ ○ ○ ○ ○ Preventing negative environmental and/or social impacts
○ ○ ○ ○ ○

Appendix A: Survey Questionnaire 245
What do you consider to be the main challenges to retaining heritage buildings/places?
Please select one option for each challenge.
Strongly Disagree
Disagree Neutral Agree Strongly Agree
Compliance (heritage approvals – development approvals) / regulatory barriers/ policy requirements
○ ○ ○ ○ ○
Cost/ Investment ○ ○ ○ ○ ○ Availability of funding sources (Gov., non Gov., private, etc.)
○ ○ ○ ○ ○
Uninformed client/customer ○ ○ ○ ○ ○ Technical barriers/design/engineering ○ ○ ○ ○ ○
Project Risk (program/financial) ○ ○ ○ ○ ○
Poor maintenance of current building stock ○ ○ ○ ○ ○
Contamination (asbestos, contaminated soil etc.) ○ ○ ○ ○ ○
Ongoing maintenance after renovation/ high cost ○ ○ ○ ○ ○
Urban Development ○ ○ ○ ○ ○ What is your view about the level of funding available to retain and/or maintain heritage places and buildings from these funding sources? Please select one option for each funding source.
Poor Good Excellent
Government support funds ○ ○ ○ ○ ○ Non-government support funds ○ ○ ○ ○ ○
Institutional funds
(Universities/Councils, etc.) ○ ○ ○ ○ ○
Private funds ○ ○ ○ ○ ○

Appendix A: Survey Questionnaire 246
Do you own/occupy or manage/maintain or have previously owned/occupied or managed/maintained, a heritage listed building?
○ Yes
○ No What challenges did you face in maintaining your building? Please list specific challenge/s you find significantly difficult.
○ Finding helpful technical information (library, online, etc.)
○ Getting advice (architect, engineer, other specialist)
○ Finding the right materials
○ Finding skilled trades person
○ Getting approval from council/government
○ Adjusting the design to get the approval
○ Other ........................................................................................................................................ ........................................................................................................................................ Do you have any further suggestion? What has not been covered that will help you better maintain your building?
........................................................................................................................................... ........................................................................................................................................... ........................................................................................................................................... ...........................................................................................................................................

Appendix A: Survey Questionnaire 247
A3: Remarks about the Survey
Are you willing to being contacted by the researcher to further discuss/be interviewed regarding any of your answers?
○ Yes
○ No

Appendix A: Survey Questionnaire 248
Section B
B1: General Background
In which state/territory you are located?
○ ACT
○ NSW
○ QLD
○ VIC
○ TAS
○ SA
○ WA
○ NT
What is the type of the organisation/institution you are currently working with?
Please tick relevant option
○ Private
○ State or Federal Government departments and agencies
○ Local Government
○ Non-profit organisation
○ Other (please specify) ........................................................................................................................................
Which of the following organizations are you currently a member of? Please tick relevant option/s.
○ National Trust (NT)
○ International Council on Monuments and Sites (ICOMOS)
○ Australian Institute of Architects (AIA)
○ Australian Institute of Project Management (AIPM)
○ Australian Institute of Building Surveyors (AIBS)
○ Australian Institute of Quantity Surveyors (AIQS)
○ Royal Institution of Chartered Surveyors (RICS)
○ Engineers Australia (EA)
○ EA/National Professional Engineers Register (NPER)
○ Australian Institute of Building (AIB)
○ Master Builders Australia (MBA)
○ The Urban Development Institute of Australia (UDIA)
○ None
○ Other (please specify) ........................................................................................................................................

Appendix A: Survey Questionnaire 249
How long have you been involved in heritage projects?
○ 0-5 years
○ 5-10 years
○ 10 -20 years
○ 20+ years What percentage of your work is heritage related?
○ 0-25%
○ 25-50%
○ 50-75%
○ 100%
How many building projects have you worked on that have had a heritage component?
○ 0-10
○ 10-50
○ 50 +
What is the largest estimated project cost you have worked on?
○ Less than $1 million
○ Between $1 million - $10 million
○ Between $10 million - $50 million
○ Greater than $50 million
In which state/territory have the majority of your heritage projects been located?
Please tick relevant option/s.
○ ACT
○ NSW
○ QLD
○ VIC
○ TAS
○ SA
○ WA
○ NT
○ Overseas (please specify) ........................................................................................................................................

Appendix A: Survey Questionnaire 250
In what levels of heritage listing have you have had experience?
○ World listed level
○ National listed level
○ State listed level
○ Local listed level Please think about ONE typical project that you have been involved in, when answering the following nine questions
In what levels of heritage listing have you have had experience?
○ World
○ National
○ State
○ Local
○ None
What was the project cost?
○ < $1 million
○ Between $1 million - $10 million
○ Between $10 million - $50 million
○ $50 million +
How successful was the project in meeting project time goals?
○ Ahead of schedule
○ On time
○ Behind schedule
How successful was the project in meeting project budget goals?
○ Under budget
○ On budget
○ Required additional budget
Were you require to prepare any of the following
○ Conservation Management Plan
○ Heritage Impact Statement
○ Other specialised reports
○ Other ........................................................................................................................................
If there was a contingency amount allowed in the budget, what was the use of

Appendix A: Survey Questionnaire 251
contingency?
........................................................................................................................................... ........................................................................................................................................... ...........................................................................................................................................
What percentage of the total budget was allocated for contingencies?
...........................................................................................................................................
Was the proposed contingency enough to cover any additional work?
○ Yes
○ No
Were the key items that required contingency expenditure?
○ unknown situations discovered after work started
○ termite infestation
○ problems with particular elements, such as windows, roofs
○ problems with particular materials such as stone, mortar, timber
○ Other ........................................................................................................................................

Appendix A: Survey Questionnaire 252
B2: Retention of Heritage Places
What do you consider to be the key reasons for retaining heritage buildings/places? Please select one option for each of the following.
Strongly Disagree
Disagree Neutral Agree Strongly Agree
Appearance and design qualities ○ ○ ○ ○ ○
Landmark qualities ○ ○ ○ ○ ○ Contribution to streetscapes and views ○ ○ ○ ○ ○
The amenity of a suburb with a consistent character
○ ○ ○ ○ ○
Special character ○ ○ ○ ○ ○ Rarity ○ ○ ○ ○ ○ Historical importance - evidence of past ways of life
○ ○ ○ ○ ○
Their connection to people – groups in the community
○ ○ ○ ○ ○
Tourism ○ ○ ○ ○ ○ Preventing negative environmental and/or social impacts
○ ○ ○ ○ ○

Appendix A: Survey Questionnaire 253
What do you consider to be the main challenges to retaining heritage buildings/places?
Please select one option for each challenge.
Strongly
Disagree Disagree Neutral Agree Strongly
Agree
Compliance (heritage approvals – development approvals) / regulatory barriers/ policy requirements
○ ○ ○ ○ ○
Cost/ Investment ○ ○ ○ ○ ○ Availability of funding sources (Gov., non Gov., private, etc.)
○ ○ ○ ○ ○
Uninformed client/customer ○ ○ ○ ○ ○ Technical barriers/design/engineering ○ ○ ○ ○ ○
Project Risk (program/financial) ○ ○ ○ ○ ○
Poor maintenance of current building stock ○ ○ ○ ○ ○
Contamination (asbestos, contaminated soil etc.) ○ ○ ○ ○ ○
Ongoing maintenance after renovation/ high cost ○ ○ ○ ○ ○
Urban Development ○ ○ ○ ○ ○

Appendix A: Survey Questionnaire 254
B3: Heritage Building Projects – Challenges To what extent do you think that the following challenges during design/preconstruction phase have an influence on meeting project delivery objectives (on time and on budget)?
Please select one option for each challenge.
Not at all influential
Low influence
Medium influence
High influence
Highest influence
Approvals - Timeframes for
Local/State/Federal heritage
○ ○ ○ ○ ○
Level of appropriate Contingency ○ ○ ○ ○ ○ Availability of funding sources ○ ○ ○ ○ ○ Political influence/interest ○ ○ ○ ○ ○ Multiple stakeholders input ○ ○ ○ ○ ○ Defining the scope accurately ○ ○ ○ ○ ○ Defining the consultants fee to do the work ○ ○ ○ ○ ○ Quantifying capital cost of works ○ ○ ○ ○ ○ Lack of appropriate staff skills ○ ○ ○ ○ ○ Qualifications/experience of Project Team ○ ○ ○ ○ ○ Implications of change of use/ significant works causing compliance with current codes (BCA code)
○ ○ ○ ○ ○
Non availability or incomplete original building plans
○ ○ ○ ○ ○
Existing condition of building ○ ○ ○ ○ ○ Lack of ability to fully ascertain "condition of the building"
○ ○ ○ ○ ○
Limitations with methodology for repairs or new works due to heritage constraints
○ ○ ○ ○ ○

Appendix A: Survey Questionnaire 255
Discontinuous or unknown existing building fabric/materials causing delay or rework
○ ○ ○ ○ ○
What do you consider to be the key challenges in execution/construction phase of heritage building projects? Please select one option for each challenge.
Not at all influential
Low influence
Medium influence
High influence
Highest influence
Qualifications/experience of Project Design Team
○ ○ ○ ○ ○
Qualifications/experience of Project Client Team
○ ○ ○ ○ ○
Qualifications/experience of Contractor/Subcontractors ○ ○ ○ ○ ○ Gaps in tendered documentation (all actions has not been covered by tender)
○ ○ ○ ○ ○
Accurate Pre tender estimate ○ ○ ○ ○ ○Latent conditions ○ ○ ○ ○ ○Scope changes Client/Architect/Engineer ○ ○ ○ ○ ○ Documentation quality (on the site) ○ ○ ○ ○ ○ Pre Demolition phase/detailed investigation of building
○ ○ ○ ○ ○
Post demolition investigation ○ ○ ○ ○ ○ Administration ○ ○ ○ ○ ○Lack of coordination/communication between Design Team/Client/Contractor
○ ○ ○ ○ ○
Incomplete project construction documentation (lack in detail – results with variations)
○ ○ ○ ○ ○
Discontinuous/unknown existing building fabric/materials
○ ○ ○ ○ ○
Financial/budget considerations/constraints ○ ○ ○ ○ ○

Appendix A: Survey Questionnaire 256

Appendix A: Survey Questionnaire 257
To what extent do you think that there is a NEED for industry wide checklists, specifications, procedures and guidelines? Please select one option for each need.
Not needed
Medium need
High needed
Already provided
(more information
required)
Already provided
(high quality)
Guidance on different construction methodologies used at various times & locations
○ ○ ○ ○ ○
Consistent procedures how to deal with specific
issues – to help
mediating this detail/ issue
○ ○ ○ ○ ○
Procedures for repair or rebuild of: stone work, brick work, steel work, concrete work and timber work
○ ○ ○ ○ ○
Design in regard to the proposed usage (e.g. BCA code)
○ ○ ○ ○ ○
Heritage protocol doc. ○ ○ ○ ○ ○System in place to identify what is significant fabric
○ ○ ○ ○ ○
Architectural detailing ○ ○ ○ ○ ○Structural testing ○ ○ ○ ○ ○
Would quality measures, which provide a basis for assessment against the best conservation practice and processes for heritage building fabric, be a useful tool? Please provide a comment.
........................................................................................................................................... ........................................................................................................................................... ........................................................................................................................................... ...........................................................................................................................................
What do you think is an appropriate percentage for contingency for projects with a substantial heritage component?
○ Less than 10%
○ 10% -20%

Appendix A: Survey Questionnaire 258
○ 20% - 30%
○ Other .................................................................................................................................................... In work on heritage buildings have you faced challenges with meeting the National Construction Code (Building Code of Australia) requirements for:
Yes No
Fire safety ○ ○ Workplace safety ○ ○ Disability access ○ ○
Do you think the outcome for heritage was:
Positive Neutral Negative
○ ○ ○
In retrospect, would the outcome have been improved if your team had:
Yes No
Better knowledge of the code requirements ○ ○ Access to better technical solutions ○ ○

Appendix A: Survey Questionnaire 259
B4: Multiple Stakeholder Management
To what extent do you think the following factors are critical to the project delivery?
Please select one option for each factor.
Strongly Disagree
Disagree Neutral Agree Strongly Agree
Identifying stakeholders on the project ○ ○ ○ ○ ○ Identifying stakeholder requirements ○ ○ ○ ○ ○ Understanding area of stakeholder interest ○ ○ ○ ○ ○ Exploring stakeholder needs and constraints ○ ○ ○ ○ ○ Assessing stakeholder attributes (urgency and proximity)
○ ○ ○ ○ ○ Analysing conflicts and coalitions among stakeholders
○ ○ ○ ○ ○ Resolving conflicts among stakeholders effectively
○ ○ ○ ○ ○ Keeping and promoting a good relationship ○ ○ ○ ○ ○ Formulating appropriate strategies to manage stakeholders
○ ○ ○ ○ ○ Predicting stakeholder reactions for implementing the strategies
○ ○ ○ ○ ○
Analysing the change of stakeholder influence and relationship during the project process
○ ○ ○ ○ ○
Communicating with and engaging stakeholders effectively and frequently
○ ○ ○ ○ ○ Do you use any formal project management framework (such as PRINCE2, PMBOK, Logical Framework, etc.) to deliver heritage projects?
○ Yes
○ No

Appendix A: Survey Questionnaire 260

Appendix A: Survey Questionnaire 261
Please indicate what limitations you have found in framework you use. . ....................................................................................................................................... ........................................................................................................................................ ........................................................................................................................................ ........................................................................................................................................
Do you use any other/s (then PRINCE2, PMBOK, Logical Framework, etc.), please give details. . ....................................................................................................................................... ........................................................................................................................................ ........................................................................................................................................ ........................................................................................................................................

Appendix A: Survey Questionnaire 262
B5: Remarks about the Survey
Are there any other issues/experiences regarding heritage projects that you have worked on that have not already been covered in this survey? . ....................................................................................................................................... ........................................................................................................................................ ........................................................................................................................................ ........................................................................................................................................
What other measures are needed (or desirable) to assist the conservation of heritage buildings/places? . ....................................................................................................................................... ........................................................................................................................................ ........................................................................................................................................ ........................................................................................................................................
Are you willing to being contacted by the researcher to further discuss/be interviewed regarding any of your answers?
○ Yes
○ No

Appendix B: Semi-Structured Interviews 263
Appendix B: Semi-Structured Interviews

Appendix B: Semi-Structured Interviews 264
INTERVIEW - Participant group from Case Study
Interview objectives are:
To determine differences between traditional building projects and projects with heritage components
To address limitations in current policies and procedures for heritage building projects
To determine what the main causes of project delays are on heritage building projects
To investigate how different stakeholders influence project delivery of heritage building projects
The interview will be divided into three main sections, as follows:
Introduction (10 min) will allow participant to ask any question that they may have regarding the research project.
Interview questions (60 min):
1. What did you find different in managing/designing a heritage building project from a traditional project?
2. Have you experienced any difficulties in finding appropriate contractors and specialist consultancy staff for such projects?
3. What would you consider to be the most difficult component of a heritage project? (procedures/design/management)
a) Policies/procedures b) Scope definition c) Tender documentation d) Decision making e) Managing within time f) Lack of information of building g) Managing multiple stakeholders
4. Usually due to lack of technical information/hence lack of scope definition a
large contingency is regarded. How difficult was it to convince the project owner of the necessity for the contingency amount? (Only Project manager)
Conclusion (15 min):
Key points will be summarised and the participant will be asked if they have any question/s(arising from the interview).

Appendix C: Data Coding 265
Appendix C: Data Coding

Appendix C: Data Coding 266
Appendix C-1: Key Reasons for Heritage Retention
Q. What do you consider to be the key reasons for retaining heritage
buildings/places?
Code
Description
a1 (q7a1) Appearance and design qualities
a2 (q7a2) Landmark qualities
a3 (q7a3) Contribution to streetscapes and views
a4 (q7a4) The amenity of a suburb with a consistent character
a5 (q7a5) Special character
a6 (q7a6) Rarity
a7 (q7a7) Historical importance - evidence of past ways of life
a8 (q7a8) Their connection to people – groups in the community
a9 (q7a9) Tourism
a10 (q7a10) Preventing negative environmental and/or social impacts
Appendix C-2: Main Challenges of Heritage Retention
Q. What do you consider to be the main challenges for retaining heritage
buildings/places?
Code Description
b1 (q8a1) Compliance (heritage approvals – development approvals) / regulatory
barriers/ policy requirements
b2 (q8a2) Cost/ Investment
b3 (q8a3) Availability of funding sources (Gov., non Gov., private, etc.)
b4 (q8a4) Uninformed client/customer
b5 (q8a5) Technical barriers/design/engineering
b6 (q8a6) Project Risk (program/financial)
b7 (q8a7) Poor maintenance of current building stock
b8 (q8a8) Contamination (asbestos, contaminated soil etc.)
b9 (q8a9) Ongoing maintenance after renovation/ high cost
b10 (q8a10) Urban Development

Appendix C: Data Coding 267
Appendix C-3: Planning/Design Phase
Q. To what extent do you think that the following challenges during
design/preconstruction phase have an influence on meeting project delivery
objectives (on time and on budget)?
Code Description
q27a1 Approvals - Timeframes for Local/State/Federal heritage
q27a2 Level of appropriate Contingency
q27a3 Availability of funding sources
q27a4 Political influence/interest
q27a5 Multiple stakeholders input
q27a6 Defining the scope accurately
q27a7 Defining the consultants fee to do the work
q27a8 Quantifying capital cost of works
q27a9 Lack of appropriate staff skills
q27a10 Qualifications/experience of Project Team
q27a11 Implications of change of use/ significant works causing compliance with current codes (BCA code)
q27a12 Non availability or incomplete original building plans
q27a13 Existing condition of building
q27a14 Lack of ability to fully ascertain "condition of the building"
q27a15 Limitations with methodology for repairs or new works due to heritage constraints
q27a16 Discontinuous or unknown existing building fabric/materials causing delay or rework

Appendix C: Data Coding 268
Appendix C-4: Execution/Construction Phase
Q. What do you consider to be the key challenges in execution/construction phase of
heritage building projects?
Code Description
q28a1 Qualifications/experience of Project Design Team
q28a2 Qualifications/experience of Project Client Team
q28a3 Qualifications/experience of Contractor/Subcontractors
q28a4 Gaps in tendered documentation (all actions has not been covered by tender)
q28a5 Accurate Pre tender estimate
q28a6 Latent conditions
q28a7 Scope changes Client/Architect/Engineer
q28a8 Documentation quality (on the site)
q28a9 Pre Demolition phase/detailed investigation of building
q28a10 Post demolition investigation
q28a11 Administration
q28a12 Lack of coordination/communication between Design Team/Client/Contractor
q28a13 Incomplete project construction documentation (lack in detail – results with variations)
q28a14 Discontinuous/unknown existing building fabric/materials
q28a15 Financial/budget considerations/constraints

Appendix C: Data Coding 269
Appendix C-5: Technical Factors
Q. To what extent do you think that there is a NEED for industry wide checklists,
specifications, procedures and guidelines?
Code Description
q29a1 Guidance on different construction methodologies used at various times &
locations
q29a2 Consistent procedures how to deal with specific issues – to help mediating
this detail/ issue
q29a3 Procedures for repair or rebuild of: stone work, brick work, steel work,
concrete work and timber work
q29a4 Design in regard to the proposed usage (e.g. BCA code)
q29a5 Heritage protocol doc.
q29a6 System in place to identify what is significant fabric
q29a7 Architectural detailing
q29a8 Structural testing
Appendix C-6: Multiple Stakeholders’ Factors
Q. To what extent do you think the following factors are critical to the project
delivery?
Code Description
q36a1 Identifying stakeholders on the project
q36a2 Identifying stakeholder requirements
q36a3 Understanding area of stakeholder interest
q36a4 Exploring stakeholder needs and constraints
q36a5 Assessing stakeholder attributes (urgency and proximity)
q36a6 Analysing conflicts and coalitions among stakeholders
q36a7 Resolving conflicts among stakeholders effectively
q36a8 Keeping and promoting a good relationship
q36a9 Formulating appropriate strategies to manage stakeholders
q36a10 Predicting stakeholder reactions for implementing the strategies
q36a11 Analysing the change of stakeholder influence and relationship during the
project process
q36a12 Communicating with and engaging stakeholders effectively and frequently

Appendix C: Data Coding 270

Appendix D: Preliminary Data Analysis 271
Appendix D: Preliminary Data Analysis

Appendix D: Preliminary Data Analysis 272
Appendix D-1: Normality
Appendix D-1-1: Normality Test – Heritage Retention Construct: Key Reasons and Main Challenges
Note: the next Q7a1 = a1; q7a2=a2;
Appendix D-1-2: Normality Test – Project Management Construct: Planning/Design, Execution/Construction, Technical Factors and Multiple Stakeholders’ Factors
Shapiro-Francia W' test for normal data Variable | Obs W' V' z Prob>z -------------+-------------------------------------------------- q27a11 | 162 0.99820 0.245 -2.865 0.99791 q27a8 | 164 0.99813 0.257 -2.776 0.99725 q27a12 | 164 0.99472 0.726 -0.654 0.74358 q27a14 | 165 0.99425 0.795 -0.469 0.68037 q27a15 | 161 0.99905 0.129 -4.171 0.99998
Shapiro-Francia W' test for normal data Variable | Obs W' V' z Prob>z -------------+-------------------------------------------------- q28a4 | 163 0.99919 0.111 -4.480 1.00000 q28a5 | 164 0.99910 0.123 -4.271 0.99999 q28a7 | 164 0.99891 0.149 -3.881 0.99995 q28a8 | 163 0.99891 0.149 -3.882 0.99995 q28a10 | 160 0.99958 0.056 -5.873 1.00000 q28a11 | 164 0.99719 0.387 -1.939 0.97375 q28a12 | 164 0.99906 0.130 -4.168 0.99998 q28a13 | 163 0.99650 0.479 -1.501 0.93336

Appendix D: Preliminary Data Analysis 273
Shapiro-Francia W' test for normal data Variable | Obs W' V' z Prob>z -------------+-------------------------------------------------- q36a1 | 165 0.99576 0.587 -1.088 0.86178 q36a2 | 165 0.99337 0.917 -0.177 0.57039 q36a3 | 165 0.99963 0.052 -6.054 1.00000 q36a4 | 164 1.00000 0.000 -28.209 1.00000 q36a5 | 165 0.99971 0.040 -6.549 1.00000 q36a6 | 165 0.99450 0.760 -0.561 0.71245 q36a7 | 165 0.98833 1.613 0.977 0.16436 q36a9 | 165 0.98841 1.603 0.964 0.16765 q36a10 | 164 0.99689 0.427 -1.735 0.95860 q36a11 | 164 0.99928 0.099 -4.717 1.00000 q36a12 | 165 0.99568 0.597 -1.052 0.85356
Shapiro-Francia W' test for normal data Variable | Obs W' V' z Prob>z -------------+-------------------------------------------------- q29a1 | 161 0.99857 0.193 -3.349 0.99959 q29a2 | 164 0.99711 0.398 -1.881 0.97003 q29a3 | 165 0.99850 0.207 -3.214 0.99935 q29a4 | 161 0.99840 0.217 -3.115 0.99908 q29a7 | 162 0.99611 0.530 -1.296 0.90250 q29a8 | 159 0.98563 1.925 1.335 0.09100

Appendix D: Preliminary Data Analysis 274
Appendix D-2: Reliability Test of Measures in the Questionnaire
Appendix D-2-1: Reliability Test – Key Reasons for Heritage Retention
Case Processing Summary
N %
Cases
Valid 408 91.9
Excludeda 36 8.1
Total 444 100.0
a. Listwise deletion based on all variables in the
procedure.
Reliability Statistics
Cronbach's Alpha N of Items
.809 10
Appendix D-2-2: Reliability Test – Main Challenges of Heritage Retention
Case Processing Summary
N %
Cases
Valid 409 92.1
Excludeda 35 7.9
Total 444 100.0
a. Listwise deletion based on all variables in the
procedure.
Reliability Statistics
Cronbach's
Alpha
N of Items
.763 10
Appendix D-2-3: Reliability Test – Planning/Design Phase
Case Processing Summary
N %
Cases
Valid 143 86.7
Excludeda 22 13.3
Total 165 100.0
a. Listwise deletion based on all variables in the
procedure.

Appendix D: Preliminary Data Analysis 275
Reliability Statistics
Cronbach's Alpha N of Items
.884 16
Item Statistics
Mean Std. Deviation N
q27a1 3.5734 .80919 143
q27a2 3.2308 .87768 143
q27a3 3.7832 .89710 143
q27a4 3.5804 1.03061 143
q27a5 3.5315 .88655 143
q27a6 3.7063 .93321 143
q27a7 2.9580 .94104 143
q27a8 3.4126 .85026 143
q27a9 3.1958 1.09582 143
q27a10 3.3986 1.06903 143
q27a11 3.4406 .86905 143
q27a12 3.0210 1.10357 143
q27a13 3.5385 .94025 143
q27a14 3.4755 1.01975 143
q27a15 3.3147 1.03065 143
q27a16 3.2797 .96710 143
Item-Total Statistics
Scale Mean if
Item Deleted
Scale Variance
if Item Deleted
Corrected Item-Total
Correlation
Cronbach's Alpha if Item
Deleted
q27a1 50.8671 78.947 .471 .880
q27a2 51.2098 77.660 .514 .878
q27a3 50.6573 79.311 .392 .882
q27a4 50.8601 77.051 .457 .880
q27a5 50.9091 78.421 .456 .880
q27a6 50.7343 77.802 .468 .880
q27a7 51.4825 76.040 .576 .875
q27a8 51.0280 76.746 .598 .875
q27a9 51.2448 74.735 .551 .877
q27a10 51.0420 75.139 .545 .877
q27a11 51.0000 76.493 .600 .875
q27a12 51.4196 72.949 .648 .872
q27a13 50.9021 76.807 .527 .877
q27a14 50.9650 75.555 .552 .876
q27a15 51.1259 74.294 .620 .873
q27a16 51.1608 76.094 .554 .876

Appendix D: Preliminary Data Analysis 276
Appendix D-2-4: Reliability Test – Execution/Construction Phase
Case Processing Summary
N %
Cases
Valid 149 90.3
Excludeda 16 9.7
Total 165 100.0
a. Listwise deletion based on all variables in the
procedure.
Reliability Statistics
Cronbach's
Alpha
N of Items
.895 15
Item Statistics
Mean Std. Deviation N
q28a1 3.7248 .96464 149
q28a2 3.6107 .89828 149
q28a3 3.9128 .82144 149
q28a4 3.6309 .77415 149
q28a5 3.5101 .89002 149
q28a6 3.5302 .91944 149
q28a7 3.5503 .88100 149
q28a8 3.5638 .86464 149
q28a9 3.6174 .94866 149
q28a10 3.3221 .84844 149
q28a11 2.9664 .95448 149
q28a12 3.7047 .94084 149
q28a13 3.6309 .89555 149
q28a14 3.3557 .84688 149
q28a15 3.9396 .84812 149

Appendix D: Preliminary Data Analysis 277
Item-Total Statistics
Scale Mean if
Item Deleted
Scale Variance
if Item Deleted
Corrected Item-
Total
Correlation
Cronbach's
Alpha if Item
Deleted
q28a1 49.8456 61.740 .610 .887
q28a2 49.9597 63.363 .542 .890
q28a3 49.6577 63.727 .573 .888
q28a4 49.9396 64.138 .579 .888
q28a5 50.0604 62.733 .596 .887
q28a6 50.0403 65.796 .354 .897
q28a7 50.0201 63.047 .579 .888
q28a8 50.0067 62.155 .662 .885
q28a9 49.9530 62.194 .590 .888
q28a10 50.2483 63.161 .596 .888
q28a11 50.6040 61.673 .623 .886
q28a12 49.8658 62.360 .584 .888
q28a13 49.9396 61.557 .681 .884
q28a14 50.2148 64.291 .509 .891
q28a15 49.6309 64.883 .463 .893
Appendix D-2-5: Reliability Test – Technical Factors
Case Processing Summary
N %
Cases
Valid 148 89.7
Excludeda 17 10.3
Total 165 100.0
a. Listwise deletion based on all variables in the
procedure.
Reliability Statistics
Cronbach's
Alpha
N of Items
.900 8

Appendix D: Preliminary Data Analysis 278
Item Statistics
Mean Std. Deviation N
q29a1 2.9797 1.07203 148
q29a2 2.8514 1.03913 148
q29a3 3.1959 1.09208 148
q29a4 2.9595 1.06827 148
q29a5 3.2365 1.08397 148
q29a6 3.2838 1.03701 148
q29a7 3.0000 1.11270 148
q29a8 3.0405 1.16571 148
Item-Total Statistics
Scale Mean if
Item Deleted
Scale Variance
if Item Deleted
Corrected Item-
Total
Correlation
Cronbach's
Alpha if Item
Deleted
q29a1 21.5676 34.655 .673 .889
q29a2 21.6959 34.458 .719 .885
q29a3 21.3514 33.549 .756 .881
q29a4 21.5878 34.053 .731 .883
q29a5 21.3108 35.590 .583 .897
q29a6 21.2635 36.454 .541 .900
q29a7 21.5473 33.066 .781 .878
q29a8 21.5068 33.408 .708 .886
Appendix D-2-6: Reliability Test – Multiple Stakeholders’ Factors
Case Processing Summary
N %
Cases
Valid 162 98.2
Excludeda 3 1.8
Total 165 100.0
a. Listwise deletion based on all variables in the
procedure.
Reliability Statistics
Cronbach's
Alpha
N of Items
.920 12

Appendix D: Preliminary Data Analysis 279
Item Statistics
Mean Std. Deviation N
q36a1 4.0679 .73194 162
q36a2 4.2531 .66231 162
q36a3 4.0988 .65190 162
q36a4 4.1235 .68493 162
q36a5 3.9506 .68527 162
q36a6 3.9321 .75697 162
q36a7 4.1667 .70711 162
q36a8 4.2840 .65436 162
q36a9 4.0802 .68686 162
q36a10 3.7963 .74048 162
q36a11 3.8272 .71870 162
q36a12 4.3025 .71444 162
Item-Total Statistics
Scale Mean if
Item Deleted
Scale Variance
if Item Deleted
Corrected Item-
Total
Correlation
Cronbach's
Alpha if Item
Deleted
q36a1 44.8148 31.692 .644 .914
q36a2 44.6296 32.272 .641 .914
q36a3 44.7840 31.823 .719 .911
q36a4 44.7593 31.563 .715 .911
q36a5 44.9321 31.741 .689 .912
q36a6 44.9506 30.917 .718 .911
q36a7 44.7160 31.571 .687 .912
q36a8 44.5988 32.900 .560 .918
q36a9 44.8025 32.060 .643 .914
q36a10 45.0864 31.421 .670 .913
q36a11 45.0556 31.481 .686 .912
q36a12 44.5802 31.773 .652 .914

Appendix D: Preliminary Data Analysis 280
Appendix D-3: Descriptive Statistics by Frequencies Test Appendix D-3-1: Frequencies Test – Key Reasons and Main Challenges
Statistics
N Mean Median Mode Std. Deviation
Valid Missing
a1 443 1 4.23 4.00 4 .766
a2 436 8 4.25 4.00 4 .706
a3 436 8 4.14 4.00 4 .793
a4 436 8 3.85 4.00 4 .854
a5 439 5 4.23 4.00 4 .733
a6 437 7 4.33 4.00 5 .750
a7 443 1 4.58 5.00 5 .666
a8 438 6 4.19 4.00 4 .783
a9 440 4 4.00 4.00 4 .893
a10 435 9 3.65 4.00 4 .967
b1 436 8 3.74 4.00 4 .876f
b2 440 4 4.21 4.00 4 .822
b3 436 8 4.14 4.00 4 .766
b4 440 4 3.75 4.00 4 .802
b5 441 3 3.38 3.00 4 .991
b6 432 12 3.57 4.00 4 .797
b7 438 6 3.90 4.00 4 .831
b8 435 9 3.63 4.00 4 .962
b9 438 6 3.81 4.00 4 .859
b10 437 7 3.93 4.00 4 .966

Appendix D: Preliminary Data Analysis 281
Appendix D-3-2: Frequencies Test – Project Management Challenges
Statistics
N Mean Median Mode Std. Deviation
Valid Missing
q27a1 164 1 3.5610 4.0000 4.00 .81546q27a2 162 3 3.2160 3.0000 3.00 .87561q27a3 163 2 3.8405 4.0000 4.00 .89530q27a4 163 2 3.6380 4.0000 4.00 1.01727q27a5 163 2 3.4785 3.0000 3.00a .88428q27a6 160 5 3.6750 4.0000 4.00 .94203q27a7 164 1 2.9573 3.0000 3.00 .92246q27a8 164 1 3.4390 3.5000 4.00 .87357q27a9 162 3 3.2099 3.0000 3.00 1.09449q27a10 165 0 3.4364 4.0000 4.00 1.07233q27a11 162 3 3.4383 3.5000 4.00 .90507q27a12 164 1 2.9634 3.0000 2.00 1.12904q27a13 159 6 3.5157 4.0000 4.00 .91993q27a14 165 0 3.4545 4.0000 4.00 1.04447bq27a15 161 4 3.2609 3.0000 3.00 1.03996q27a16 163 2 3.2393 3.0000 3.00 .98026q28a1 165 0 3.7212 4.0000 4.00 .99135q28a2 164 1 3.5915 4.0000 3.00 .89863q28a3 164 1 3.9024 4.0000 4.00 .83790q28a4 163 2 3.6380 4.0000 4.00 .77636q28a5 164 1 3.5061 4.0000 4.00 .88267q28a6 164 1 3.5000 3.0000 3.00 .92345q28a7 164 1 3.5366 4.0000 4.00 .88193q28a8 163 2 3.5521 4.0000 4.00 .86176q28a9 163 2 3.5951 4.0000 3.00 .97903q28a10 160 5 3.3250 3.0000 3.00 .86548q28a11 164 1 2.9695 3.0000 3.00 .96200q28a12 164 1 3.7073 4.0000 4.00 .96551q28a13 163 2 3.6503 4.0000 4.00 .89948q28a14 160 5 3.3438 3.0000 3.00 .86908q28a15 163 2 3.9571 4.0000 4.00 .84144q29a1 161 4 3.0062 3.0000 3.00 1.06358q29a2 164 1 2.8780 3.0000 3.00 1.03189q29a3 165 0 3.2121 3.0000 3.00 1.09760q29a4 161 4 2.9752 3.0000 3.00 1.05446q29a5 162 3 3.2716 3.0000 3.00 1.07498q29a6 159 6 3.2956 3.0000 3.00 1.03455q29a7 162 3 3.0185 3.0000 2.00 1.10038q29a8 159 6 3.0629 3.0000 2.00 1.16209q36a1 165 0 4.0788 4.0000 4.00 .73242q36a2 165 0 4.2606 4.0000 4.00 .66164q36a3 165 0 4.0909 4.0000 4.00 .67008q36a4 164 1 4.1159 4.0000 4.00 .68641q36a5 165 0 3.9394 4.0000 4.00 .68696q36a6 165 0 3.9333 4.0000 4.00 .75815q36a7 165 0 4.1515 4.0000 4.00 .74577q36a8 163 2 4.2822 4.0000 4.00 .65272q36a9 165 0 4.0606 4.0000 4.00 .72159q36a10 164 1 3.7927 4.0000 4.00 .73872q36a11 164 1 3.8293 4.0000 4.00 .71453q36a12 165 0 4.3091 4.0000 4.00 .71242
a. Multiple modes exist. The smallest value is shown

Appendix D: Preliminary Data Analysis 282
Appendix D-4: Correlation by Bonferroni Test Appendix D-4-1: Bonferroni Test – Key Reasons
pwcorr a1-a10, bonferroni print(.05) sig star(.05) | a1 a2 a3 a4 a5 a6 a7 -------------+--------------------------------------------------------------- a1 | 1.0000 | | a2 | 0.5561* 1.0000 | 0.0000 | a3 | 0.4789* 0.4617* 1.0000 | 0.0000 0.0000 | a4 | 0.3339* 0.3702* 0.5100* 1.0000 | 0.0000 0.0000 0.0000 | a5 | 0.2825* 0.3728* 0.4286* 0.4467* 1.0000 | 0.0000 0.0000 0.0000 0.0000 | a6 | 0.2940* 0.3932* 0.3023* 0.3385* 0.4769* 1.0000 | 0.0000 0.0000 0.0000 0.0000 0.0000 | a7 | 0.2439* 0.3167* 0.2373* 0.2035* 0.3265* 0.4502* 1.0000 | 0.0000 0.0000 0.0000 0.0009 0.0000 0.0000 | a8 | 0.2125* 0.2837* 0.2691* 0.2418* 0.2556* 0.2735* 0.5004* | 0.0003 0.0000 0.0000 0.0000 0.0000 0.0000 0.0000 | a9 | 0.2448* 0.2473* 0.2420* 0.2031* 0.2288* 0.1888* 0.2699* | 0.0000 0.0000 0.0000 0.0009 0.0001 0.0035 0.0000 | a10 | 0.2695* 0.2557* 0.3705* 0.2519* 0.2610* 0.2425* 0.1573* | 0.0000 0.0000 0.0000 0.0000 0.0000 0.0000 0.0454 | | a8 a9 a10 -------------+--------------------------- a8 | 1.0000 | | a9 | 0.3129* 1.0000 | 0.0000 | a10 | 0.2507* 0.2003* 1.0000 | 0.0000 0.0012 | . pwcorr b1-b10, bonferroni print(.05) sig star(.05)

Appendix D: Preliminary Data Analysis 283
Appendix D-4-2: Bonferroni Test – Main Challenges | b1 b2 b3 b4 b5 b6 b7 -------------+--------------------------------------------------------------- b1 | 1.0000 | | b2 | 0.3783* 1.0000 | 0.0000 | b3 | 0.2853* 0.5539* 1.0000 | 0.0000 0.0000 | b4 | 1.0000 | | b5 | 0.3783* 0.1822* 0.1875* 0.1585* 1.0000 | 0.0000 0.0056 0.0038 0.0387 | b6 | 0.2512* 0.1973* 0.2580* 0.2094* 0.4699* 1.0000 | 0.0000 0.0017 0.0000 0.0005 0.0000 | b7 | 0.1593* 0.1893* 0.2349* 0.2352* 0.2998* 0.3753* 1.0000 | 0.0412 0.0032 0.0000 0.0000 0.0000 0.0000 | b8 | 0.1790* 0.1789* 0.3474* 0.3461* 0.3255* | 0.0086 0.0081 0.0000 0.0000 0.0000 | b9 | 0.3144* 0.3512* 0.3473* 0.3263* 0.2717* 0.2926* | 0.0000 0.0000 0.0000 0.0000 0.0000 0.0000 | b10 | 0.1609* 0.2197* 0.1969* | 0.0364 0.0002 0.0017 | | b8 b9 b10 -------------+--------------------------- b8 | 1.0000 | | b9 | 0.3747* 1.0000 | 0.0000 | b10 | 0.1755* 0.3170* 1.0000 | 0.0113 0.0000 |

Appendix D: Preliminary Data Analysis 284
Appendix D-4-3: Bonferroni Test – Planning/Design Phase . pwcorr q27a1-q27a16, bonferroni print(.05) sig star(.05) | q27a1 q27a2 q27a3 q27a4 q27a5 q27a6 q27a7 -------------+--------------------------------------------------------------- q27a1 | 1.0000 | | q27a2 | 0.3032* 1.0000 | 0.0105 | q27a3 | 0.3362* 1.0000 | 0.0016 | q27a4 | 0.3291* 0.4526* 1.0000 | 0.0021 0.0000 | q27a5 | 0.3455* 0.3945* 1.0000 | 0.0008 0.0000 | q27a6 | 0.3630* 0.2845* 1.0000 | 0.0003 0.0334 | q27a7 | 0.3799* 0.2818* 0.3265* 1.0000 | 0.0001 0.0322 0.0030 | q27a8 | 0.4270* 0.3413* 0.3091* 0.4345* | 0.0000 0.0010 0.0084 0.0000 | q27a9 | 0.2951* 0.3234* 0.3330* | 0.0174 0.0041 0.0018 | q27a10 | 0.3118* 0.3366* 0.3344* | 0.0061 0.0016 0.0015 | q27a11 | 0.3098* 0.3161* 0.4035* 0.4137* 0.3234* | 0.0076 0.0059 0.0000 0.0000 0.0034 | q27a12 | 0.3090* 0.2877* 0.3669* 0.3401* | 0.0068 0.0247 0.0002 0.0010 | q27a13 | 0.2889* | 0.0306 | q27a14 | 0.3643* | 0.0002 | q27a15 | 0.3389* 0.3454* 0.4024* | 0.0013 0.0010 0.0000 | q27a16 | 0.2867* 0.2768* | 0.0259 0.0417 |

Appendix D: Preliminary Data Analysis 285
| q27a8 q27a9 q27a10 q27a11 q27a12 q27a13 q27a14 -------------+--------------------------------------------------------------- q27a8 | 1.0000 | | q27a9 | 1.0000 | | q27a10 | 0.3518* 0.6975* 1.0000 | 0.0005 0.0000 | q27a11 | 0.3869* 0.2981* 0.3524* 1.0000 | 0.0000 0.0162 0.0005 | q27a12 | 0.3025* 0.3118* 0.3317* 0.4779* 1.0000 | 0.0099 0.0064 0.0017 0.0000 | q27a13 | 0.3559* 0.5273* 1.0000 | 0.0006 0.0000 | q27a14 | 0.4628* 0.3499* 0.3866* 0.4998* 0.6292* 1.0000 | 0.0000 0.0005 0.0000 0.0000 0.0000 | q27a15 | 0.3173* 0.3608* 0.4984* 0.5313* 0.4914* | 0.0049 0.0004 0.0000 0.0000 0.0000 | q27a16 | 0.3527* 0.2977* 0.3146* 0.4417* 0.5309* 0.4570* | 0.0005 0.0150 0.0061 0.0000 0.0000 0.0000 | | q27a15 q27a16 -------------+------------------ q27a15 | 1.0000 | | q27a16 | 0.5991* 1.0000
| 0.0000

Appendix D: Preliminary Data Analysis 286
Appendix D-4-4: Bonferroni Test – Execution/Construction Phase . pwcorr q28a1-q28a15, bonferroni print(.05) sig star(.05) | q28a1 q28a2 q28a3 q28a4 q28a5 q28a6 q28a7 -------------+--------------------------------------------------------------- q28a1 | 1.0000 | | q28a2 | 0.6369* 1.0000 | 0.0000 | q28a3 | 0.6017* 0.5972* 1.0000 | 0.0000 0.0000 | q28a4 | 0.3514* 0.3390* 0.4197* 1.0000 | 0.0004 0.0011 0.0000 | q28a5 | 0.3498* 0.2756* 0.3824* 0.5544* 1.0000 | 0.0005 0.0388 0.0000 0.0000 | q28a6 | 0.3086* 0.3374* 1.0000 | 0.0068 0.0011 | q28a7 | 0.2898* 0.3112* 0.3328* 0.3217* 0.4021* 1.0000 | 0.0175 0.0055 0.0016 0.0030 0.0000 | q28a8 | 0.3101* 0.3241* 0.4381* 0.4756* 0.5091* | 0.0059 0.0027 0.0000 0.0000 0.0000 | q28a9 | 0.3321* 0.3368* 0.3240* 0.2979* 0.4456* 0.4216* 0.3321* | 0.0016 0.0012 0.0027 0.0124 0.0000 0.0000 0.0017 | q28a10 | 0.3218* 0.2786* 0.3575* 0.3240* 0.3377* 0.3705* 0.3278* | 0.0035 0.0396 0.0004 0.0033 0.0013 0.0002 0.0026 | q28a11 | 0.3646* 0.2952* 0.4192* 0.3394* 0.3868* 0.4958* | 0.0002 0.0137 0.0000 0.0010 0.0000 0.0000 | q28a12 | 0.5732* 0.4159* 0.4743* 0.3324* 0.2901* 0.3297* | 0.0000 0.0000 0.0000 0.0015 0.0173 0.0018 | q28a13 | 0.4486* 0.3261* 0.3353* 0.5547* 0.4890* 0.3877* | 0.0000 0.0024 0.0014 0.0000 0.0000 0.0000 | q28a14 | 0.3089* 0.2803* 0.2797* 0.3483* 0.3907* 0.4635* | 0.0074 0.0362 0.0374 0.0007 0.0000 0.0000 | q28a15 | 0.3178* 0.3247* 0.3192* 0.2974* 0.3116* 0.3114* | 0.0037 0.0026 0.0037 0.0128 0.0054 0.0058 |

Appendix D: Preliminary Data Analysis 287
| q28a8 q28a9 q28a10 q28a11 q28a12 q28a13 q28a14 -------------+--------------------------------------------------------------- q28a8 | 1.0000 | | q28a9 | 0.3671* 1.0000 | 0.0002 | q28a10 | 0.4025* 0.6112* 1.0000 | 0.0000 0.0000 | q28a11 | 0.4585* 0.3265* 0.3564* 1.0000 | 0.0000 0.0022 0.0004 | q28a12 | 0.3662* 0.2802* 0.3153* 0.5650* 1.0000 | 0.0002 0.0306 0.0051 0.0000 | q28a13 | 0.5313* 0.3622* 0.3675* 0.5251* 0.6144* 1.0000 | 0.0000 0.0002 0.0002 0.0000 0.0000 | q28a14 | 0.3522* 0.4158* 0.4442* 0.3082* 1.0000 | 0.0006 0.0000 0.0000 0.0077 | q28a15 | 0.3571* 0.3597* 0.4008* 0.3061* | 0.0003 0.0003 0.0000 0.0087 | | q28a15 -------------+--------- q28a15 | 1.0000 |

Appendix D: Preliminary Data Analysis 288
Appendix D-4-5: Bonferroni Test – Technical Factors
. pwcorr q29a1-q29a8, bonferroni print(.05) sig star(.05) | q29a1 q29a2 q29a3 q29a4 q29a5 q29a6 q29a7 -------------+--------------------------------------------------------------- q29a1 | 1.0000 | | q29a2 | 0.7631* 1.0000 | 0.0000 | q29a3 | 0.6533* 0.7134* 1.0000 | 0.0000 0.0000 | q29a4 | 0.5143* 0.5079* 0.5878* 1.0000 | 0.0000 0.0000 0.0000 | q29a5 | 0.3317* 0.3583* 0.3915* 0.5233* 1.0000 | 0.0006 0.0001 0.0000 0.0000 | q29a6 | 0.3765* 0.3434* 0.4228* 0.3987* 0.5889* 1.0000 | 0.0000 0.0003 0.0000 0.0000 0.0000 | q29a7 | 0.5794* 0.6133* 0.6075* 0.6748* 0.4704* 0.4712* 1.0000 | 0.0000 0.0000 0.0000 0.0000 0.0000 0.0000 | q29a8 | 0.4978* 0.5315* 0.4950* 0.6610* 0.4727* 0.4190* 0.7478* | 0.0000 0.0000 0.0000 0.0000 0.0000 0.0000 0.0000 | | q29a8 -------------+--------- q29a8 | 1.0000 |

Appendix D: Preliminary Data Analysis 289
Appendix D-4-6: Bonferroni Test – Multiple Stakeholders’ Factors
. pwcorr q36a1-q36a12, bonferroni print(.05) sig star(.05) | q36a1 q36a2 q36a3 q36a4 q36a5 q36a6 q36a7 -------------+--------------------------------------------------------------- q36a1 | 1.0000 | | q36a2 | 0.6243* 1.0000 | 0.0000 | q36a3 | 0.5693* 0.6477* 1.0000 | 0.0000 0.0000 | q36a4 | 0.4720* 0.6372* 0.6470* 1.0000 | 0.0000 0.0000 0.0000 | q36a5 | 0.4579* 0.5045* 0.6214* 0.6636* 1.0000 | 0.0000 0.0000 0.0000 0.0000 | q36a6 | 0.5476* 0.5089* 0.5041* 0.4969* 0.5659* 1.0000 | 0.0000 0.0000 0.0000 0.0000 0.0000 | q36a7 | 0.4134* 0.3767* 0.4847* 0.4345* 0.4227* 0.6758* 1.0000 | 0.0000 0.0000 0.0000 0.0000 0.0000 0.0000 | q36a8 | 0.3227* 0.4444* 0.4581* 0.3650* 0.3928* 0.4213* 0.5282* | 0.0018 0.0000 0.0000 0.0001 0.0000 0.0000 0.0000 | q36a9 | 0.4178* 0.2732* 0.4677* 0.4920* 0.5118* 0.4755* 0.5494* | 0.0000 0.0253 0.0000 0.0000 0.0000 0.0000 0.0000 | q36a10 | 0.4035* 0.4462* 0.4837* 0.4865* 0.5220* 0.5239* | 0.0000 0.0000 0.0000 0.0000 0.0000 0.0000 | q36a11 | 0.3646* 0.3280* 0.4466* 0.4974* 0.4570* 0.5591* 0.6055* | 0.0001 0.0012 0.0000 0.0000 0.0000 0.0000 0.0000 | q36a12 | 0.3737* 0.5266* 0.4773* 0.5518* 0.3998* 0.3996* 0.4507* | 0.0001 0.0000 0.0000 0.0000 0.0000 0.0000 0.0000 |
| q36a8 q36a9 q36a10 q36a11 q36a12 -------------+--------------------------------------------- q36a8 | 1.0000 | | q36a9 | 0.3498* 1.0000 | 0.0003 | q36a10 | 0.3380* 0.6549* 1.0000 | 0.0007 0.0000 | q36a11 | 0.4078* 0.5561* 0.7622* 1.0000 | 0.0000 0.0000 0.0000 | q36a12 | 0.5281* 0.3785* 0.4705* 0.4885* 1.0000 | 0.0000 0.0000 0.0000 0.0000 |

Appendix D: Preliminary Data Analysis 290

Appendix E: Confirmatory Factor Analysis 291
Appendix E: Confirmatory Factor Analysis

Appendix E: Confirmatory Factor Analysis 292
Appendix E-1: Confirmatory Factor Analysis - Key Reasons and Main Challenges
Endogenous variables Measurement: a1 a2 a3 a4 a5 a6 a7 a8 a9 a10 b1 b2 b3 b4 b5 b6 b7 b8 b9 b10 Exogenous variables Latent: Key_reasons Main_challenges Estimation method = mlmv Log likelihood = -9739.9405 ( 1) [a1]Key_reasons = 1 ( 2) [b1]Main_challenges = 1
------------------------------------------------------------------------------------------------- | OIM Standardized | Coef. Std. Err. z P>|z| [95% Conf. Interval] --------------------------------+---------------------------------------------------------------- Measurement | a1 <- | Key_reasons | .5477358 .0420696 13.02 0.000 .4652809 .6301907 _cons | 5.551051 .1916747 28.96 0.000 5.175375 5.926726 ------------------------------+---------------------------------------------------------------- a2 <- | Key_reasons | .637624 .0365402 17.45 0.000 .5660066 .7092413 _cons | 6.036091 .2095691 28.80 0.000 5.625344 6.446839 ------------------------------+---------------------------------------------------------------- a3 <- | Key_reasons | .6739725 .0362466 18.59 0.000 .6029304 .7450146 _cons | 5.159242 .1832686 28.15 0.000 4.800042 5.518442 ------------------------------+---------------------------------------------------------------- a4 <- | Key_reasons | .5910247 .040183 14.71 0.000 .5122676 .6697819 _cons | 4.520149 .1599618 28.26 0.000 4.20663 4.833669 ------------------------------+---------------------------------------------------------------- a5 <- | Key_reasons | .6161246 .0382778 16.10 0.000 .5411015 .6911476 _cons | 5.780724 .2005151 28.83 0.000 5.387722 6.173727 ------------------------------+---------------------------------------------------------------- a6 <- | Key_reasons | .5456832 .0418162 13.05 0.000 .4637249 .6276414 _cons | 5.800986 .2010977 28.85 0.000 5.406842 6.195131 ------------------------------+---------------------------------------------------------------- a7 <- | Key_reasons | .4528287 .0450541 10.05 0.000 .3645243 .5411332 _cons | 6.904771 .2349012 29.39 0.000 6.444374 7.365169 ------------------------------+---------------------------------------------------------------- a8 <- | Key_reasons | .4605788 .0447059 10.30 0.000 .3729568 .5482007 _cons | 5.366319 .1870825 28.68 0.000 4.999644 5.732994 ------------------------------+---------------------------------------------------------------- a9 <- | Key_reasons | .4297889 .0459155 9.36 0.000 .3397961 .5197817 _cons | 4.481181 .1583105 28.31 0.000 4.170898 4.791464 ------------------------------+---------------------------------------------------------------- a10 <- | Key_reasons | .467134 .0445096 10.50 0.000 .3798968 .5543713 _cons | 3.779642 .1365856 27.67 0.000 3.511939 4.047345 ------------------------------+----------------------------------------------------------------

Appendix E: Confirmatory Factor Analysis 293
b1 <- | Main_challenges | .427148 .0477722 8.94 0.000 .3335162 .5207798 _cons | 4.280471 .1521991 28.12 0.000 3.982167 4.578776 ------------------------------+---------------------------------------------------------------- b2 <- | Main_challenges | .4308081 .0477086 9.03 0.000 .337301 .5243152 _cons | 5.170362 .178451 28.97 0.000 4.820604 5.520119 ------------------------------+---------------------------------------------------------------- b3 <- | Main_challenges | .477716 .04598 10.39 0.000 .3875969 .5678352 _cons | 5.38875 .1895699 28.43 0.000 5.017199 5.7603 ------------------------------+---------------------------------------------------------------- b4 <- | Main_challenges | .338708 .0528696 6.41 0.000 .2350854 .4423306 _cons | 4.680009 .1647984 28.40 0.000 4.35701 5.003008 ------------------------------+---------------------------------------------------------------- b5 <- | Main_challenges | .5386805 .0441977 12.19 0.000 .4520546 .6253064 _cons | 3.421675 .1243797 27.51 0.000 3.177896 3.665455 ------------------------------+---------------------------------------------------------------- b6 <- | Main_challenges | .5515109 .0443259 12.44 0.000 .4646338 .638388 _cons | 4.481842 .159926 28.02 0.000 4.168392 4.795291 ------------------------------+---------------------------------------------------------------- b7 <- | Main_challenges | .5660525 .0422316 13.40 0.000 .4832801 .648825 _cons | 4.705469 .1657654 28.39 0.000 4.380575 5.030363 ------------------------------+---------------------------------------------------------------- b8 <- | Main_challenges | .5034982 .0452832 11.12 0.000 .4147447 .5922516 _cons | 3.778362 .1367324 27.63 0.000 3.510371 4.046352 ------------------------------+---------------------------------------------------------------- b9 <- | Main_challenges | .6063761 .0425912 14.24 0.000 .5228988 .6898534 _cons | 4.437429 .1573864 28.19 0.000 4.128958 4.745901 ------------------------------+---------------------------------------------------------------- b10 <- | Main_challenges | .3376308 .0523969 6.44 0.000 .2349347 .4403269 _cons | 4.076331 .145693 27.98 0.000 3.790778 4.361884
--------------------------------+---------------------------------------------------------------- var(e.a1)| .6999855 .046086 .6152437 .7963994 var(e.a2)| .5934357 .0465978 .5087866 .6921683 var(e.a3)| .5457611 .0488585 .457931 .6504369 var(e.a4)| .6506898 .0474982 .5639479 .7507735 var(e.a5)| .6203905 .0471678 .5345016 .7200808 var(e.a6)| .7022299 .0456368 .6182457 .7976227 var(e.a7)| .7949461 .0408036 .7188638 .8790808 var(e.a8)| .7878672 .0411812 .7111503 .8728601 var(e.a9)| .8152815 .039468 .7414822 .896426 var(e.a10)| .7817858 .0415839 .7043874 .8676888 var(e.b1)| .8175446 .0408116 .7413439 .9015778 var(e.b2)| .8144044 .0411065 .7376941 .8990915 var(e.b3)| .7717874 .0439308 .6903139 .8628767 var(e.b4)| .8852769 .0358147 .8177921 .9583305 var(e.b5)| .7098234 .0476169 .6223711 .809564 var(e.b6)| .6958357 .0488924 .6063141 .7985751 var(e.b7)| .6795845 .0478106 .592051 .7800597 var(e.b8)| .7464896 .0456 .6622581 .8414343 var(e.b9)| .632308 .0516526 .5387594 .7421001 var(e.b10)| .8860055 .0353816 .8193032 .9581382 var(Key_reasons)| 1 . . . var(Main_challenges)| 1 . . . --------------------------------+---------------------------------------------------------------- cov (Key_reasons,Main_challenges)| .4242337 .0557529 7.61 0.000 .31496 .5335073 ------------------------------------------------------------------------------------------------- LR test of model vs. saturated: chi2(157) = 311.33, Prob > chi2 = 0.0000

Appendix E: Confirmatory Factor Analysis 294
. estat gof,stats(all) ---------------------------------------------------------------------------- Fit statistic | Value Description ---------------------+------------------------------------------------------ Likelihood ratio | chi2_ms(157) | 311.330 model vs. saturated p > chi2 | 0.000 chi2_bs(190) | 2275.505 baseline vs. saturated p > chi2 | 0.000 ---------------------+------------------------------------------------------ Population error | RMSEA | 0.047 Root mean squared error of approximation 90% CI, lower bound | 0.039 upper bound | 0.055 pclose | 0.729 Probability RMSEA <= 0.05 ---------------------+------------------------------------------------------ Information criteria | AIC | 19625.881 Akaike's information criterion BIC | 19924.876 Bayesian information criterion ---------------------+------------------------------------------------------ Baseline comparison | CFI | 0.926 Comparative fit index TLI | 0.910 Tucker-Lewis index ---------------------+------------------------------------------------------

Appendix E: Confirmatory Factor Analysis 295
Appendix E-2: Confirmatory Factor Analysis – Planning/Design Phase
Endogenous variables Measurement: q27a1 q27a2 q27a3 q27a4 q27a5 q27a6 q27a7 q27a8 q27a9 q27a10 q27a11 q27a12 q27a13 q27a14 q27a15 q27a16 Exogenous variables Latent: PD Estimation method = mlmv Log likelihood = -3153.4188 ( 1) [q27a1]PD = 1 | OIM Standardized | Coef. Std. Err. z P>|z| [95% Conf. Interval] ----------------------+---------------------------------------------------------------- Measurement | q27a1 <- | PD | .4217582 .0718154 5.87 0.000 .2810027 .5625138 _cons | 4.381864 .2540677 17.25 0.000 3.883901 4.879828 --------------------+---------------------------------------------------------------- q27a2 <- | PD | .5460123 .061889 8.82 0.000 .4247121 .6673125 _cons | 3.675074 .2193019 16.76 0.000 3.24525 4.104898 --------------------+---------------------------------------------------------------- q27a3 <- | PD | .2994599 .0776845 3.85 0.000 .1472011 .4517187 _cons | 4.293767 .2499417 17.18 0.000 3.80389 4.783643 --------------------+---------------------------------------------------------------- q27a4 <- | PD | .3454804 .0745183 4.64 0.000 .1994272 .4915337 _cons | 3.595055 .2097505 17.14 0.000 3.183951 4.006158 --------------------+---------------------------------------------------------------- q27a5 <- | PD | .4477133 .0683657 6.55 0.000 .313719 .5817075 _cons | 3.946615 .2320774 17.01 0.000 3.491752 4.401478 --------------------+---------------------------------------------------------------- q27a6 <- | PD | .4124598 .0708705 5.82 0.000 .2735561 .5513635 _cons | 3.912764 .2324146 16.84 0.000 3.45724 4.368289 --------------------+---------------------------------------------------------------- q27a7 <- | PD | .5551225 .0602612 9.21 0.000 .4370127 .6732323 _cons | 3.214371 .193975 16.57 0.000 2.834187 3.594555 --------------------+---------------------------------------------------------------- q27a8 <- | PD | .6392469 .0552355 11.57 0.000 .5309873 .7475065 _cons | 3.961383 .2314829 17.11 0.000 3.507685 4.415081 --------------------+---------------------------------------------------------------- q27a9 <- | PD | .4692529 .0675275 6.95 0.000 .3369014 .6016043 _cons | 2.932557 .1808522 16.22 0.000 2.578093 3.287021 --------------------+---------------------------------------------------------------- q27a10 <- | PD | .5151547 .0637727 8.08 0.000 .3901624 .6401469 _cons | 3.232094 .1924811 16.79 0.000 2.854838 3.609351 --------------------+---------------------------------------------------------------- q27a11 <- | PD | .6061806 .0557618 10.87 0.000 .4968895 .7154718 _cons | 3.823709 .2252948 16.97 0.000 3.382139 4.265278 --------------------+---------------------------------------------------------------- q27a12 <- | PD | .6977912 .0484907 14.39 0.000 .6027513 .7928312 _cons | 2.639215 .1648648 16.01 0.000 2.316086 2.962344 --------------------+---------------------------------------------------------------- q27a13 <- | PD | .5081165 .0645722 7.87 0.000 .3815573 .6346757 _cons | 3.906533 .2280135 17.13 0.000 3.459635 4.353432 --------------------+---------------------------------------------------------------- q27a14 <- | PD | .6689005 .0506753 13.20 0.000 .5695788 .7682222 _cons | 3.306411 .1979876 16.70 0.000 2.918362 3.694459 --------------------+---------------------------------------------------------------- q27a15 <- | PD | .6360417 .0542108 11.73 0.000 .5297904 .7422929 _cons | 3.173364 .1913658 16.58 0.000 2.798294 3.548434 --------------------+---------------------------------------------------------------- q27a16 <- | PD | .5838409 .0590918 9.88 0.000 .4680231 .6996586 _cons | 3.314226 .1988899 16.66 0.000 2.924409 3.704043

Appendix E: Confirmatory Factor Analysis 296
var(e.q27a1)| .82212 .0605774 .7115656 .9498511 var(e.q27a2)| .7018706 .0675843 .5811569 .847658 var(e.q27a3)| .9103238 .0465268 .8235516 1.006238 var(e.q27a4)| .8806433 .0514893 .7852938 .98757 var(e.q27a5)| .7995528 .0612164 .6881392 .9290049 var(e.q27a6)| .8298769 .0584625 .7228513 .9527489 var(e.q27a7)| .691839 .0669047 .5723861 .8362209 var(e.q27a8)| .5913634 .0706183 .4679585 .7473113 var(e.q27a9)| .7798017 .0633749 .6649769 .914454 var(e.q27a10)| .7346157 .0657057 .6164911 .8753738 var(e.q27a11)| .632545 .0676035 .513002 .7799448 var(e.q27a12)| .5130874 .0676727 .3962084 .6644449 var(e.q27a13)| .7418176 .0656204 .6237359 .8822538 var(e.q27a14)| .5525722 .0677934 .4344678 .7027816 var(e.q27a15)| .595451 .0689607 .4745328 .747181 var(e.q27a16)| .6591299 .0690004 .5368633 .8092416 var(PD)| 1 . . . ----------------------+---------------------------------------------------------------- LR test of model vs. saturated: chi2(89) = 146.20, Prob > chi2 = 0.0001 . estat gof,stats(all) ---------------------------------------------------------------------------- Fit statistic | Value Description ---------------------+------------------------------------------------------ Likelihood ratio | chi2_ms(89) | 146.195 model vs. saturated p > chi2 | 0.000 chi2_bs(120) | 996.431 baseline vs. saturated p > chi2 | 0.000 ---------------------+------------------------------------------------------ Population error | RMSEA | 0.062 Root mean squared error of approximation 90% CI, lower bound | 0.044 upper bound | 0.080 pclose | 0.130 Probability RMSEA <= 0.05 ---------------------+------------------------------------------------------ Information criteria | AIC | 6432.838 Akaike's information criterion BIC | 6628.512 Bayesian information criterion ---------------------+------------------------------------------------------ Baseline comparison | CFI | 0.935 Comparative fit index TLI | 0.912 Tucker-Lewis index ---------------------+------------------------------------------------------
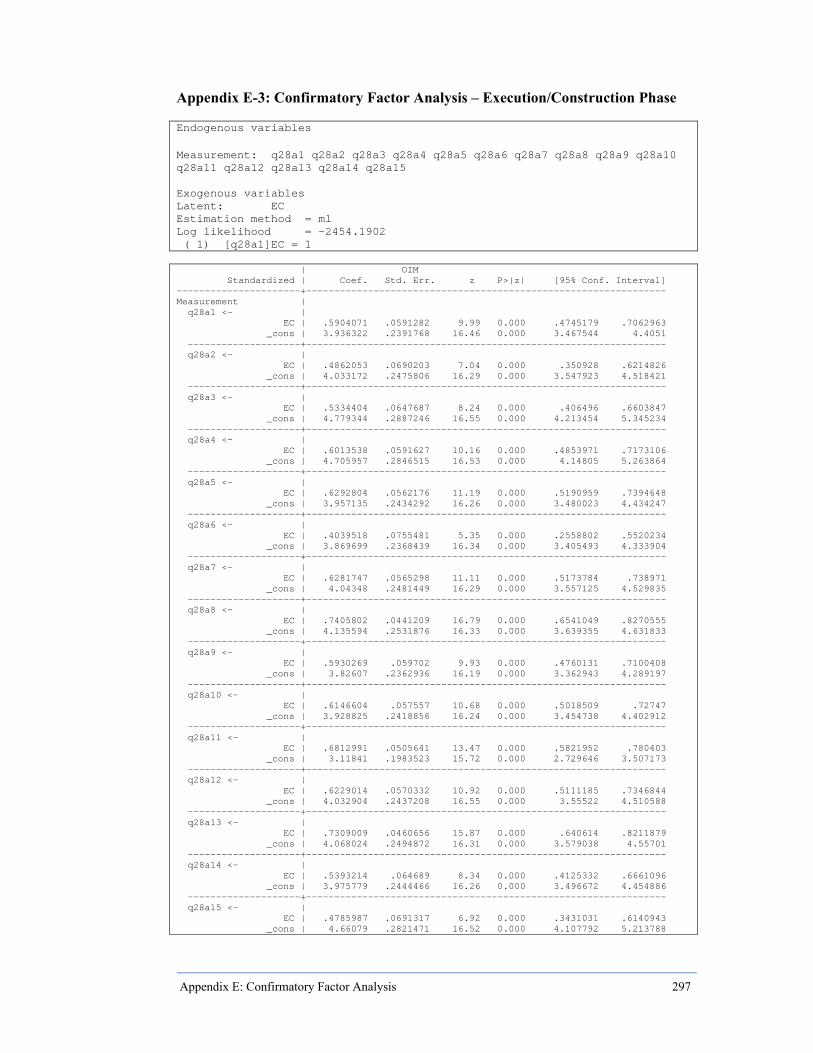
Appendix E: Confirmatory Factor Analysis 297
Appendix E-3: Confirmatory Factor Analysis – Execution/Construction Phase
Endogenous variables
Measurement: q28a1 q28a2 q28a3 q28a4 q28a5 q28a6 q28a7 q28a8 q28a9 q28a10 q28a11 q28a12 q28a13 q28a14 q28a15 Exogenous variables Latent: EC Estimation method = ml Log likelihood = -2454.1902 ( 1) [q28a1]EC = 1 | OIM Standardized | Coef. Std. Err. z P>|z| [95% Conf. Interval] ----------------------+---------------------------------------------------------------- Measurement | q28a1 <- | EC | .5904071 .0591282 9.99 0.000 .4745179 .7062963 _cons | 3.936322 .2391768 16.46 0.000 3.467544 4.4051 --------------------+---------------------------------------------------------------- q28a2 <- | EC | .4862053 .0690203 7.04 0.000 .350928 .6214826 _cons | 4.033172 .2475806 16.29 0.000 3.547923 4.518421 --------------------+---------------------------------------------------------------- q28a3 <- | EC | .5334404 .0647687 8.24 0.000 .406496 .6603847 _cons | 4.779344 .2887246 16.55 0.000 4.213454 5.345234 --------------------+---------------------------------------------------------------- q28a4 <- | EC | .6013538 .0591627 10.16 0.000 .4853971 .7173106 _cons | 4.705957 .2846515 16.53 0.000 4.14805 5.263864 --------------------+---------------------------------------------------------------- q28a5 <- | EC | .6292804 .0562176 11.19 0.000 .5190959 .7394648 _cons | 3.957135 .2434292 16.26 0.000 3.480023 4.434247 --------------------+---------------------------------------------------------------- q28a6 <- | EC | .4039518 .0755481 5.35 0.000 .2558802 .5520234 _cons | 3.869699 .2368439 16.34 0.000 3.405493 4.333904 --------------------+---------------------------------------------------------------- q28a7 <- | EC | .6281747 .0565298 11.11 0.000 .5173784 .738971 _cons | 4.04348 .2481449 16.29 0.000 3.557125 4.529835 --------------------+---------------------------------------------------------------- q28a8 <- | EC | .7405802 .0441209 16.79 0.000 .6541049 .8270555 _cons | 4.135594 .2531876 16.33 0.000 3.639355 4.631833 --------------------+---------------------------------------------------------------- q28a9 <- | EC | .5930269 .059702 9.93 0.000 .4760131 .7100408 _cons | 3.82607 .2362936 16.19 0.000 3.362943 4.289197 --------------------+---------------------------------------------------------------- q28a10 <- | EC | .6146604 .057557 10.68 0.000 .5018509 .72747 _cons | 3.928825 .2418856 16.24 0.000 3.454738 4.402912 --------------------+---------------------------------------------------------------- q28a11 <- | EC | .6812991 .0505641 13.47 0.000 .5821952 .780403 _cons | 3.11841 .1983523 15.72 0.000 2.729646 3.507173 --------------------+---------------------------------------------------------------- q28a12 <- | EC | .6229014 .0570332 10.92 0.000 .5111185 .7346844 _cons | 4.032904 .2437208 16.55 0.000 3.55522 4.510588 --------------------+---------------------------------------------------------------- q28a13 <- | EC | .7309009 .0460656 15.87 0.000 .640614 .8211879 _cons | 4.068024 .2494872 16.31 0.000 3.579038 4.55701 --------------------+---------------------------------------------------------------- q28a14 <- | EC | .5393214 .064689 8.34 0.000 .4125332 .6661096 _cons | 3.975779 .2444466 16.26 0.000 3.496672 4.454886 --------------------+---------------------------------------------------------------- q28a15 <- | EC | .4785987 .0691317 6.92 0.000 .3431031 .6140943 _cons | 4.66079 .2821471 16.52 0.000 4.107792 5.213788

Appendix E: Confirmatory Factor Analysis 298
var(e.q28a1)| .6514194 .0698195 .5279934 .8036981 var(e.q28a2)| .7636044 .0671161 .6427663 .9071597 var(e.q28a3)| .7154414 .0691005 .5920539 .8645435 var(e.q28a4)| .6383736 .0711554 .513094 .794242 var(e.q28a5)| .6040062 .0707533 .4801 .7598907 var(e.q28a6)| .8368229 .0610356 .7253527 .9654236 var(e.q28a7)| .6053965 .0710211 .4810415 .7618988 var(e.q28a8)| .451541 .0653501 .3400208 .5996375 var(e.q28a9)| .648319 .0708098 .5233834 .8030777 var(e.q28a10)| .6221926 .070756 .4978814 .7775418 var(e.q28a11)| .5358316 .0688986 .4164651 .6894107 var(e.q28a12)| .6119938 .0710521 .4874421 .768371 var(e.q28a13)| .4657838 .0673388 .3508532 .6183629 var(e.q28a14)| .7091324 .0697764 .5847522 .8599691 var(e.q28a15)| .7709433 .0661726 .6515698 .9121871 var(EC)| 1 . . . ----------------------+---------------------------------------------------------------- LR test of model vs. saturated: chi2(81) = 147.29, Prob > chi2 = 0.0000 . estat gof,stats(all) ---------------------------------------------------------------------------- Fit statistic | Value Description ---------------------+------------------------------------------------------ Likelihood ratio | chi2_ms(81) | 147.286 model vs. saturated p > chi2 | 0.000 chi2_bs(105) | 1019.836 baseline vs. saturated p > chi2 | 0.000 ---------------------+------------------------------------------------------ Population error | RMSEA | 0.074 Root mean squared error of approximation 90% CI, lower bound | 0.055 upper bound | 0.093 pclose | 0.022 Probability RMSEA <= 0.05 ---------------------+------------------------------------------------------ Information criteria | AIC | 5016.380 Akaike's information criterion BIC | 5178.593 Bayesian information criterion ---------------------+------------------------------------------------------ Baseline comparison | CFI | 0.928 Comparative fit index TLI | 0.906 Tucker-Lewis index ---------------------+------------------------------------------------------

Appendix E: Confirmatory Factor Analysis 299
Appendix E-4: Confirmatory Factor Analysis – Technical Factors Endogenous variables Measurement: q29a1 q29a2 q29a3 q29a4 q29a5 q29a6 q29a7 q29a8 Exogenous variables Latent: Technical Estimation method = mlmv Log likelihood = -1554.3936 ( 1) [q29a1]Technical = 1 ------------------------------------------------------------------------------------- | OIM Standardized | Coef. Std. Err. z P>|z| [95% Conf. Interval] --------------------+---------------------------------------------------------------- Measurement | q29a1 <- | Technical | .7148006 .0451577 15.83 0.000 .6262932 .8033081 _cons | 2.840017 .1757393 16.16 0.000 2.495574 3.18446 ------------------+---------------------------------------------------------------- q29a2 <- | Technical | .7838331 .0405487 19.33 0.000 .704359 .8633071 _cons | 2.813617 .1730995 16.25 0.000 2.474348 3.152886 ------------------+---------------------------------------------------------------- q29a3 <- | Technical | .8116559 .0349931 23.19 0.000 .7430707 .8802412 _cons | 2.935399 .1793639 16.37 0.000 2.583852 3.286945 ------------------+---------------------------------------------------------------- q29a4 <- | Technical | .7781428 .0378785 20.54 0.000 .7039023 .8523833 _cons | 2.843334 .1756252 16.19 0.000 2.499115 3.187553 ------------------+---------------------------------------------------------------- q29a5 <- | Technical | .5291993 .0620135 8.53 0.000 .4076551 .6507435 _cons | 3.041165 .1860579 16.35 0.000 2.676498 3.405832 ------------------+---------------------------------------------------------------- q29a6 <- | Technical | .5108415 .0627577 8.14 0.000 .3878388 .6338443 _cons | 3.206337 .1952102 16.43 0.000 2.823732 3.588942 ------------------+---------------------------------------------------------------- q29a7 <- | Technical | .8030729 .0359905 22.31 0.000 .7325329 .873613 _cons | 2.757467 .1713585 16.09 0.000 2.421611 3.093324 ------------------+---------------------------------------------------------------- q29a8 <- | Technical | .7610318 .0472622 16.10 0.000 .6683995 .853664 _cons | 2.664247 .1672201 15.93 0.000 2.336502 2.991993
--------------------+---------------------------------------------------------------- var(e.q29a1)| .4890601 .0645575 .3775729 .6334664 var(e.q29a2)| .3856057 .0635669 .2791408 .5326765 var(e.q29a3)| .3412147 .0568047 .2462189 .4728616 var(e.q29a4)| .3944938 .0589498 .2943364 .5287331 var(e.q29a5)| .7199481 .065635 .602144 .8607996 var(e.q29a6)| .7390409 .0641184 .6234751 .8760278 var(e.q29a7)| .3550738 .057806 .2580733 .4885334 var(e.q29a8)| .4208307 .0719361 .3010262 .5883157 var(Technical)| 1 . . . --------------------+---------------------------------------------------------------- LR test of model vs. saturated: chi2(14) = 26.35, Prob > chi2 = 0.0234

Appendix E: Confirmatory Factor Analysis 300
. estat gof,stats(all) ---------------------------------------------------------------------------- Fit statistic | Value Description ---------------------+------------------------------------------------------ Likelihood ratio | chi2_ms(14) | 26.347 model vs. saturated p > chi2 | 0.023 chi2_bs(28) | 769.852 baseline vs. saturated p > chi2 | 0.000 ---------------------+------------------------------------------------------ Population error | RMSEA | 0.073 Root mean squared error of approximation 90% CI, lower bound | 0.026 upper bound | 0.116 pclose | 0.172 Probability RMSEA <= 0.05 ---------------------+------------------------------------------------------ Information criteria | AIC | 3168.787 Akaike's information criterion BIC | 3261.966 Bayesian information criterion ---------------------+------------------------------------------------------ Baseline comparison | CFI | 0.983 Comparative fit index TLI | 0.967 Tucker-Lewis index ---------------------+------------------------------------------------------

Appendix E: Confirmatory Factor Analysis 301
Appendix E-5: Confirmatory Factor Analysis – Multiple Stakeholders’ Factors
Endogenous variables Measurement: q36a1 q36a2 q36a3 q36a4 q36a5 q36a6 q36a7 q36a8 q36a9 q36a10 q36a11 q36a12 Exogenous variables Latent: M_stake Estimation method = ml Log likelihood = -1478.4978 ( 1) [q36a1]M_stake = 1
--------------------------------------------------------------------------------------- | OIM Standardized | Coef. Std. Err. z P>|z| [95% Conf. Interval] ----------------------+---------------------------------------------------------------- Measurement | q36a1 <- | M_stake | .6149758 .0531741 11.57 0.000 .5107566 .7191951 _cons | 5.567258 .3189974 17.45 0.000 4.942035 6.192482 --------------------+---------------------------------------------------------------- q36a2 <- | M_stake | .7647868 .0428705 17.84 0.000 .6807622 .8488114 _cons | 6.478838 .365108 17.74 0.000 5.76324 7.194436 --------------------+---------------------------------------------------------------- q36a3 <- | M_stake | .7169971 .0435728 16.46 0.000 .6315961 .8023981 _cons | 6.306956 .359087 17.56 0.000 5.603159 7.010754 --------------------+---------------------------------------------------------------- q36a4 <- | M_stake | .773526 .0356774 21.68 0.000 .7035996 .8434523 _cons | 6.038885 .3445704 17.53 0.000 5.363539 6.71423 --------------------+---------------------------------------------------------------- q36a5 <- | M_stake | .7145889 .0432669 16.52 0.000 .6297873 .7993904 _cons | 5.782923 .3307408 17.48 0.000 5.134683 6.431163 --------------------+---------------------------------------------------------------- q36a6 <- | M_stake | .71775 .0426943 16.81 0.000 .6340707 .8014294 _cons | 5.241083 .3001334 17.46 0.000 4.652832 5.829333 --------------------+---------------------------------------------------------------- q36a7 <- | M_stake | .757278 .0440795 17.18 0.000 .6708838 .8436723 _cons | 5.911784 .3362473 17.58 0.000 5.252752 6.570817 --------------------+---------------------------------------------------------------- q36a8 <- | M_stake | .5909149 .0525664 11.24 0.000 .4878866 .6939433 _cons | 6.567072 .3732012 17.60 0.000 5.835611 7.298533 --------------------+---------------------------------------------------------------- q36a9 <- | M_stake | .6641828 .0484324 13.71 0.000 .569257 .7591086 _cons | 5.958825 .3402414 17.51 0.000 5.291964 6.625686 --------------------+---------------------------------------------------------------- q36a10 <- | M_stake | .6821596 .0455072 14.99 0.000 .592967 .7713521 _cons | 5.215583 .2964419 17.59 0.000 4.634568 5.796599 --------------------+---------------------------------------------------------------- q36a11 <- | M_stake | .7112171 .0437046 16.27 0.000 .6255576 .7968766 _cons | 5.341653 .3069828 17.40 0.000 4.739978 5.943328 --------------------+---------------------------------------------------------------- q36a12 <- | M_stake | .6912827 .0429682 16.09 0.000 .6070666 .7754989 _cons | 6.041308 .3445893 17.53 0.000 5.365926 6.716691

Appendix E: Confirmatory Factor Analysis 302
----------------------+---------------------------------------------------------------- var(e.q36a1)| .6218047 .0654015 .5059697 .7641587 var(e.q36a2)| .4151012 .0655736 .3045717 .5657418 var(e.q36a3)| .4859152 .0624831 .3776641 .6251945 var(e.q36a4)| .4016575 .0551947 .3068217 .5258063 var(e.q36a5)| .4893628 .0618361 .3820083 .6268867 var(e.q36a6)| .4848349 .0612877 .3784373 .6211461 var(e.q36a7)| .42653 .0667609 .3138475 .5796696 var(e.q36a8)| .6508195 .0621246 .5397695 .7847166 var(e.q36a9)| .5588612 .064336 .4459785 .700316 var(e.q36a10)| .5346583 .0620864 .4258256 .6713065 var(e.q36a11)| .4941703 .062167 .3861846 .6323512 var(e.q36a12)| .5221282 .0594064 .4177627 .6525662 var(M_stake)| 1 . . . ----------------------+---------------------------------------------------------------- LR test of model vs. saturated: chi2(38) = 74.41, Prob > chi2 = 0.0004 . estat gof,stats(all) ---------------------------------------------------------------------------- Fit statistic | Value Description ---------------------+------------------------------------------------------ Likelihood ratio | chi2_ms(38) | 74.411 model vs. saturated p > chi2 | 0.000 chi2_bs(66) | 1228.987 baseline vs. saturated p > chi2 | 0.000 ---------------------+------------------------------------------------------ Population error | RMSEA | 0.077 Root mean squared error of approximation 90% CI, lower bound | 0.051 upper bound | 0.103 pclose | 0.047 Probability RMSEA <= 0.05 ---------------------+------------------------------------------------------ Information criteria | AIC | 3060.996 Akaike's information criterion BIC | 3221.551 Bayesian information criterion ---------------------+------------------------------------------------------ Baseline comparison | CFI | 0.969 Comparative fit index TLI | 0.946 Tucker-Lewis index ---------------------+------------------------------------------------------

Appendix F: Structural Equation Modelling 303
Appendix F: Structural Equation Modelling

Appendix F: Structural Equation Modelling 304
Appendix F-1: Structural Equation Modelling - Project Performance Model Endogenous variables Measurement: q27a11 q27a8 q27a12 q27a14 q27a15 q28a4 q28a5 q28a7 q28a8 q28a10 q28a11 q28a12 q28a13 q36a1 q36a2 q36a3 q36a4 q36a5 q36a6 q36a7 q36a9 q36a10 q36a11 q36a12 q29a1 q29a2 q29a3 q29a4 q29a7 q29a8 Latent: PD EC M_stake Technical Exogenous variables Latent: PP Estimation method = mlmv Log likelihood = -5032.8968 ( 1) [q27a11]PD = 1 ( 2) [q28a4]EC = 1 ( 3) [q36a1]M_stake = 1 ( 4) [q29a1]Technical = 1 ( 5) [PD]PP = 1 --------------------------------------------------------------------------------------- | OIM Standardized | Coef. Std. Err. z P>|z| [95% Conf. Interval] ----------------------+---------------------------------------------------------------- Structural | PD <- | PP | .7315382 .0865638 8.45 0.000 .5618763 .9012001 --------------------+---------------------------------------------------------------- EC <- | PP | .8374865 .091002 9.20 0.000 .6591258 1.015847 --------------------+---------------------------------------------------------------- M_stake <- | PP | .414396 .0885614 4.68 0.000 .2408189 .5879731 --------------------+---------------------------------------------------------------- Technical <- | PP | .3499688 .0917254 3.82 0.000 .1701904 .5297473 ----------------------+---------------------------------------------------------------- Measurement | q27a11 <- | PD | .6865036 .0593858 11.56 0.000 .5701096 .8028976 _cons | 3.820647 .2253617 16.95 0.000 3.378947 4.262348 --------------------+---------------------------------------------------------------- q27a8 <- | PD | .5700556 .0607618 9.38 0.000 .4509647 .6891466 _cons | 3.9436 .2316701 17.02 0.000 3.489535 4.397665 --------------------+---------------------------------------------------------------- q27a12 <- | PD | .6668125 .0532724 12.52 0.000 .5624005 .7712245 _cons | 2.62707 .1650147 15.92 0.000 2.303647 2.950493 --------------------+---------------------------------------------------------------- q27a14 <- | PD | .7691499 .05024 15.31 0.000 .6706813 .8676185 _cons | 3.317544 .1985256 16.71 0.000 2.928441 3.706647 --------------------+---------------------------------------------------------------- q27a15 <- | PD | .6073625 .0596279 10.19 0.000 .4904939 .7242311 _cons | 3.150727 .1917943 16.43 0.000 2.774817 3.526637 --------------------+---------------------------------------------------------------- q28a4 <- | EC | .6526254 .0558761 11.68 0.000 .5431102 .7621405 _cons | 4.7077 .2715758 17.33 0.000 4.175422 5.239979 --------------------+---------------------------------------------------------------- q28a5 <- | EC | .6141568 .0572827 10.72 0.000 .5018848 .7264287 _cons | 3.98144 .233492 17.05 0.000 3.523804 4.439076 --------------------+---------------------------------------------------------------- q28a7 <- | EC | .6216997 .0561324 11.08 0.000 .5116822 .7317171 _cons | 4.022974 .2353213 17.10 0.000 3.561753 4.484196 --------------------+---------------------------------------------------------------- q28a8 <- | EC | .7030646 .0481925 14.59 0.000 .608609 .7975203 _cons | 4.135004 .2418593 17.10 0.000 3.660968 4.609039 --------------------+---------------------------------------------------------------- q28a10 <- | EC | .5426957 .062995 8.61 0.000 .4192278 .6661636 _cons | 3.854194 .229238 16.81 0.000 3.404896 4.303492

Appendix F: Structural Equation Modelling 305
--------------------+---------------------------------------------------------------- q28a11 <- | EC | .6853547 .0507594 13.50 0.000 .585868 .7848413 _cons | 3.098503 .1879102 16.49 0.000 2.730206 3.466801 --------------------+---------------------------------------------------------------- q28a12 <- | EC | .5338649 .0642609 8.31 0.000 .4079158 .6598139 _cons | 3.867306 .2259776 17.11 0.000 3.424398 4.310214 --------------------+---------------------------------------------------------------- q28a13 <- | EC | .7442051 .0437818 17.00 0.000 .6583944 .8300158 _cons | 4.06258 .2384127 17.04 0.000 3.595299 4.52986 --------------------+---------------------------------------------------------------- q36a1 <- | M_stake | .6441639 .0511463 12.59 0.000 .543919 .7444087 _cons | 5.598194 .3171118 17.65 0.000 4.976666 6.219722 --------------------+---------------------------------------------------------------- q36a2 <- | M_stake | .7708664 .0390248 19.75 0.000 .6943792 .8473536 _cons | 6.467146 .3633221 17.80 0.000 5.755048 7.179244 --------------------+---------------------------------------------------------------- q36a3 <- | M_stake | .7832838 .0350433 22.35 0.000 .7146003 .8519674 _cons | 6.123724 .3459725 17.70 0.000 5.445631 6.801818 --------------------+---------------------------------------------------------------- q36a4 <- | M_stake | .7882448 .0342392 23.02 0.000 .7211372 .8553525 _cons | 6.024384 .3408753 17.67 0.000 5.356281 6.692487 --------------------+---------------------------------------------------------------- q36a5 <- | M_stake | .7171368 .0428245 16.75 0.000 .6332022 .8010713 _cons | 5.751987 .3260663 17.64 0.000 5.112909 6.391065 --------------------+---------------------------------------------------------------- q36a6 <- | M_stake | .6883336 .04465 15.42 0.000 .6008213 .775846 _cons | 5.207664 .2965287 17.56 0.000 4.626478 5.78885 --------------------+---------------------------------------------------------------- q36a7 <- | M_stake | .6275458 .0512763 12.24 0.000 .5270462 .7280455 _cons | 5.583703 .3170782 17.61 0.000 4.962241 6.205165 --------------------+---------------------------------------------------------------- q36a9 <- | M_stake | .6529139 .0512674 12.74 0.000 .5524317 .753396 _cons | 5.64442 .3203193 17.62 0.000 5.016605 6.272234 --------------------+---------------------------------------------------------------- q36a10 <- | M_stake | .6567236 .0510843 12.86 0.000 .5566002 .7568469 _cons | 5.158813 .2946274 17.51 0.000 4.581354 5.736272 --------------------+---------------------------------------------------------------- q36a11 <- | M_stake | .6540004 .0500805 13.06 0.000 .5558445 .7521564 _cons | 5.409333 .3062942 17.66 0.000 4.809007 6.009658 --------------------+---------------------------------------------------------------- q36a12 <- | M_stake | .654176 .04823 13.56 0.000 .559647 .7487051 _cons | 6.066959 .3429285 17.69 0.000 5.394832 6.739087 --------------------+---------------------------------------------------------------- q29a1 <- | Technical | .7664203 .0435955 17.58 0.000 .6809746 .851866 _cons | 2.832352 .1756322 16.13 0.000 2.488119 3.176585 --------------------+---------------------------------------------------------------- q29a2 <- | Technical | .8282251 .0367329 22.55 0.000 .7562299 .9002202 _cons | 2.801563 .1728952 16.20 0.000 2.462695 3.140431 --------------------+---------------------------------------------------------------- q29a3 <- | Technical | .8538635 .034106 25.04 0.000 .7870171 .92071 _cons | 2.935399 .1793639 16.37 0.000 2.583852 3.286945 --------------------+---------------------------------------------------------------- q29a4 <- | Technical | .6637994 .0518519 12.80 0.000 .5621716 .7654272 _cons | 2.843056 .1756868 16.18 0.000 2.498717 3.187396 --------------------+---------------------------------------------------------------- q29a7 <- | Technical | .724796 .0452359 16.02 0.000 .6361353 .8134567 _cons | 2.755325 .1713402 16.08 0.000 2.419505 3.091146 --------------------+---------------------------------------------------------------- q29a8 <- | Technical | .6102836 .0571632 10.68 0.000 .4982457 .7223216 _cons | 2.649259 .1671325 15.85 0.000 2.321685 2.976832 ----------------------+----------------------------------------------------------------

Appendix F: Structural Equation Modelling 306
----------------------+---------------------------------------------------------------- var(e.q27a11)| .5287128 .0815371 .3907951 .7153039 var(e.q27a8)| .6750366 .0692752 .5520434 .8254321 var(e.q27a12)| .5553611 .0710454 .4321994 .7136195 var(e.q27a14)| .4084085 .0772842 .2818511 .591793 var(e.q27a15)| .6311108 .0724315 .5039816 .7903084 var(e.q28a4)| .5740801 .0729323 .4475424 .7363951 var(e.q28a5)| .6228115 .0703611 .4991069 .7771765 var(e.q28a7)| .6134895 .0697949 .4908722 .7667361 var(e.q28a8)| .5057001 .0677649 .388893 .6575911 var(e.q28a10)| .7054813 .0683742 .5834294 .8530662 var(e.q28a11)| .530289 .0695764 .4100445 .6857949 var(e.q28a12)| .7149883 .0686133 .5923987 .8629464 var(e.q28a13)| .4461588 .0651652 .3350922 .5940385 var(e.q36a1)| .5850529 .0658932 .4691657 .729565 var(e.q36a2)| .405765 .0601658 .3034315 .542611 var(e.q36a3)| .3864664 .0548976 .2925488 .5105345 var(e.q36a4)| .3786701 .0539778 .2863689 .5007214 var(e.q36a5)| .4857148 .0614221 .3790887 .6223316 var(e.q36a6)| .5261968 .0614682 .4185182 .6615796 var(e.q36a7)| .6061862 .0643564 .4923085 .7464055 var(e.q36a9)| .5737035 .0669463 .4564146 .7211332 var(e.q36a10)| .5687142 .0670965 .4513048 .7166683 var(e.q36a11)| .5722834 .0655053 .4572777 .7162132 var(e.q36a12)| .5720537 .0631018 .4608323 .7101183 var(e.q29a1)| .4125999 .066825 .3003778 .5667486 var(e.q29a2)| .3140432 .0608462 .2148168 .4591035 var(e.q29a3)| .2709171 .0582437 .177762 .4128893 var(e.q29a4)| .5593703 .0688385 .4394879 .7119539 var(e.q29a7)| .4746708 .0655736 .3620787 .6222746 var(e.q29a8)| .6275539 .0697716 .5046778 .7803471 var(e.PD)| .4648519 .1266495 .2725233 .7929129 var(e.EC)| .2986164 .1524259 .109806 .8120847 var(e.M_stake)| .828276 .073399 .6962168 .9853842 var(e.Technical)| .8775218 .0642021 .7602939 1.012825 var(PP)| 1 . . . ----------------------+---------------------------------------------------------------- LR test of model vs. saturated: chi2(380) = 592.40, Prob > chi2 = 0.0000 . estat gof,stats(all) ---------------------------------------------------------------------------- Fit statistic | Value Description ---------------------+------------------------------------------------------ Likelihood ratio | chi2_ms(380) | 592.396 model vs. saturated p > chi2 | 0.000 chi2_bs(435) | 3009.147 baseline vs. saturated p > chi2 | 0.000 ---------------------+------------------------------------------------------ Population error | RMSEA | 0.058 Root mean squared error of approximation 90% CI, lower bound | 0.049 upper bound | 0.067 pclose | 0.071 Probability RMSEA <= 0.05 ---------------------+------------------------------------------------------ Information criteria | AIC | 10295.794 Akaike's information criterion BIC | 10652.977 Bayesian information criterion ---------------------+------------------------------------------------------ Baseline comparison | CFI | 0.917 Comparative fit index TLI | 0.906 Tucker-Lewis index ---------------------+------------------------------------------------------

Appendix G: Building History 307
Appendix G: Heritage Legislation Summary

Appendix H: Heritage Legislation Summary 308

Appendix H: Heritage Legislation Summary 309

Appendix H: Heritage Legislation Summary 310

Appendix H: Heritage Legislation Summary 311

Appendix H: Heritage Legislation Summary 312

Appendix I: Survey results - Additional 313
Appendix H: Survey results - Additional

Appendix I: Survey results - Additional 314
Q1: Other experienced heritage plans, assesments and reports?
Responses
2 Assessment of impact on heritage values 6 strata title plans 9 N/A 22 Heritage Project Plan related with Architects Plan of Work 31 not applicable 66 transport impact assessment 73 No 81 None 98 n/a 168 safety in design report 187 n/a 222 Services investigation report 234 CONSTRUCTION DOCUMENTATION 236 Public access risk assessment (industrial heritage site) 238 Heritage Interpretation Plan and implementation 244 Heritage assessment at planning permit stage of approval 251 Wrote World Heritage nomination for Sydney Opera House as the NSW Heritage
Office's Project Manager of the nomination process 259 n/a 260 Architectural documentation 263 Heritage Management Strategy 267 Post-construction rectification reports 268 Archaeological Excavation Report 279 architectural documentation 287 design and documentation 290 Engineering Heritage Recognition Nomination (EHA Program) 293 Bill of quantities 301 The work structure in Germany is slightly different from what it is in Australia.
We had beginning 1970 already very strict guidelines, at the City where I was involved in Heritage building, we had to follow. There was a strict procedure to get a building permit equivalent to DA and BA in QLD.
303 these were done for the project for me by others 311 These were done by consultants 315 Paint Test Analysis & Adaptive Reuse Study. 325 Heritage interpretation strategy plan, negotiation with Aboriginal Elders,
changing of the boundary 328 Drawings 330 World Heritage Management Plan 331 None 344 I assessed the heritage consultant's work 412 NA 417 dilapidation report; photographic record; paint colour analysis report; lead, PCD
and asbestos surveys and reports; 434 No

Appendix I: Survey results - Additional 315
Q: If there was a contingency amount allowed in the budget, what was the use of contingency?
Responses
9 To cover Latent Conditions 10 Contingency amount is paramount to every project. It is meant to cover any
unexpected expenses required along the project development. Items which are not identified or reported from the dilapidation survey.
11 to cover cost of works expected but not quantifiable 16 Basic construction 22 To cover unforeseen issues and work 26 Unforseen rectification works i.e. termite damage 81 unexpected/unknown expenditure 90 About 25% 97 unknowns were expected as high level access was to reinstate a removed stone
with fibreglass pediment 130 Repair, refurbishment and re-use of existing heritage materials and fittings. 139 construction 164 Unforeseen costs associated with construction 219 latent site conditions 220 Unforseen heritage and archaeology costs 221 $15,000 222 for additional work that may have been required that was unknown in initial
investigative stage. 231 additional works due to unforseen latent conditions 233 not known 234 For works unable to be identified prior to erection of scaffolds 236 Barriers, signage and protection measures eg. decontamination, asbestos and
lead (Pb) surveys 238 In case of construction overrun 242 Unforeseen works discovered during the selective demolition of extraneous fabric 243 $50,000 246 Structural issues that was unknown prior to works. 247 The contingency was designed to meet unexpected costs - such as removing
cladding and finding pest infestations and requirements for replacement of timber members
248 Allowance for unexpected costs with regards to heritage materials and trades. 253 Unforeseen repairs/reconstruction 256 Due to funding constraints there was little to no amount allowed for contingency.
Basically works get reduced if one element is over budget. 257 Unknown 258 To allow for unforseen damage/conservation works not apparent on the fabric
surfaces 261 yes - unforeseen works 262 Nil 263 Latent conditions 266 building conservation works and interpretation fit out 267 Repair of sandstone window frames 268 not really 274 Actual costs greater than estimated costs 276 No contingency. Project was a finite funding assisted budget. The scope was
varied to cover any unanticipated works. 279 To address previously unidentified damage exposed during 'opening up' works 280 To allow for rectification of unknowns uncovered by demolition of later additions.
Also to cover extras requested by client.

Appendix I: Survey results - Additional 316
283 Design and construction contingency allowances 284 For unknown conditions discovered after work started 287 This job has many parts and is ongoing It is managed within an overall budget
per year so it one component is above budget then work on another component is brought in under budget or work is deferred. For reports then they have a fixed fee agreed to. For building work there are inevitable extras that occur with heritage and non-heritage sites.
291 To cover the unforeseen costs 293 The contingency was expended on contingency items & on items with inadequate
budget allowances. The funds from work completed under budget were reallocated back into the contingency fund.
294 NA 301 In Heritage building there must be always a higher contingency than at "normal"
construction projects. Often the problems which lead to additional cost hidden behind false walls, plaster, foundation and structural conditions.
302 Allowance for management of additional costs arising from latent defects and other variations.
304 Additional remediation works beyond that original anticipated 305 any project related scope amendments and also construction variations 306 There was, but it was managed by the Client. 307 latent asbestos 308 Termite infestation Lead paint Contaminated soil 310 dealing with latent conditions 311 Asbestos removal, latent conditions 314 Overruns 318 Not privy to details 321 No Contingency 324 YEs, contingency was for unforeseen items during the works. 325 we used the contingency to implement heritage interpretation scheme 328 We advised client 10% 331 n/a 336 Unforeseen conditions and additional client nominated scope 338 Approx. 50% of contingency used 344 n/a 351 delays incurred due to unforeseeable circumstances through demolition or
rectifcation works 364 n/a 377 As the Project Manager for the Construction company, I'm unsure what
contingencies were allowed but knew there is a contingency through discussions with the Client.
381 Out of my scope 404 (1) Latent Conditions; (2) In the event that substantial amount of additional
structural upgrade works are required; (3) Provisional Sum allowances not adequate.
407 damage to heritage components 412 NA 416 Mainly used for additional structural timber works required subsequent to
demolition phase that uncovered previously unknown structural damage. 433 no visibility of contingencies 434 The Contingency is for instructed variation for design and construction works 436 For works uncovered that were not apparent at the outset 437 Mainly for latent conditions / unknowns and extension of time claims - some
scope had to be cut to accommodate these latent conditions 441 Not used

Appendix I: Survey results - Additional 317
Q: The other items that required contingency expenditure?
Responses
4 unknown material 16 structural 22 issues with funding bodies 98 asbestos removal 187 Not in my fled of expertise 220 tree preservation 222 additional specialised engineering to protect building damage 233 the heritage consultant is not privy to this information 236 lead, explosives magazines, unbonded asbestos 243 asbestos 257 High cost of delivery of sandstone for repair 279 procurement of specialised materials 280 Extras by client. 285 Original budget unrealistic to begin with. 293 Unstable structure. 301 Often craftsmanship, because it is not always easy to find a person who is able
to replicate the old style and technics, if required. 306 plus additional Client requested scope 308 Hazardous material 336 Client added scope 338 mistakes by contractors that couldn’t be claimed 344 INCOMPLETE CMP 416 timber rot 417 Design issues, rusted roof sheeting
Q: Other appropriate percentage for contingency for projects?
# Responses 90 20-30% as an average, however a greater amount may be required depending
on how much invasive investigations have been carried out. 233 not qualified to answer 244 Would depend on the quality of information/documentation known at tender
stage 251 Don't know 270 Projects vary so attracting a % is too difficult to measure 274 Too difficult to generalise 291 40% 293 Impossible to answer as mut be project specific and a function of the precontract
understanding of the quantity of work required. 303 at least 30 % for the heritage part separate to overall 324 really depends on the project and the level of risk. 325 in heritage buildings at least 30% for unforeseen discoveries during survey of
the building, which might require design/work redesign and adjustments 344 10-20% depends on nature of significance 360 depends on the building and how well you can determine its condition; also on
what scope of work is intended 364 as with any project the contingency should be relative to that project's specifics 367 50% 433 Dependent on extent of heritage component 30%+

Appendix I: Survey results - Additional 318
Q: Other suggestion for better maintenance?
Responses
7 putting air-conditioning into the building 32 Before purchasing a heritage building council to provide you with information
about the challenges and impediment in renovating a heritage building (e.g. cost, length of time to obtain approval, changes need to be in sympathy with the era of the house, etc.)
43 What quantum of heritage is required to maintain the character of the building, while modernising it and ensuring that it has better sustainability and essential services such as computer networks?
68 I don't necessarily believe buildings need to be retained, but mediocre architectural design kills all aesthetics. heritage colours are also silly. Quality is key. A really excellent rejuvenation project is self evident, it will leave you a-gasp.
155 Current construction methods and materials are unlikely to survive (or be able to be sustained) into the future where they will be valued as heritage (unlike stone based construction of previous eras).
273 Good heritage architect 'saved' us from Council's Uniform Building Regulations, e.g. fire system prevented need for 2 hour fire-rated ceilings (destroying cornices) and enclosed stair in heritage B & B.
409 Heritage architects and conservationists seem to know only one standard - their notion of perfection. This often results in restoration that makes old appear new which is entirely the wrong approach. Many more buildings would be saved if there was an appreciation of maintenance of "faded elegance" rather than insisting on "new for old".