Embed Size (px)
Citation preview
Palaeontologia Electronica palaeo-electronica.org
Overcoming sampling issues in dental tribology: Insights from an experimentation on sheep
Anusha Ramdarshan, Cécile Blondel, Denis Gautier, Jérôme Surault, and Gildas Merceron
ABSTRACT
Dental microwear has been used in paleoecology for nearly half a century. Theadvent of technologies in the past decade has allowed for enamel surfaces to bescanned in 3D, and thus for microwear textures to be characterized as a whole.Although dental microwear texture analysis is widely used, few studies have tackledthe issue of sample representativity, or the variability of the microwear signal along afacet or a tooth row. How much information can we accurately extract from a fossilsample when tooth wear is considered? Can we accurately make inferences on awhole species based on fossil samples primarily comprised of isolated teeth? Thesematters remain to be characterized in a controlled setting. In this study, we tackle thisissue from the ground up. A large-scale controlled food trial conducted on domesticsheep provides the framework in which to test these fundamental questions. Ourresults highlight that analyzing a 200 × 200 µm surface allows for better differentiationbetween dietary categories, as opposed to analyzing smaller surfaces. Comparisons offacets from upper and lower molars reveal significant variations depending on the con-tribution to either the buccal or the lingual shearing phase I during the chewing cycle.Investigating the microwear signal along the tooth row does not reveal any significantvariation between molars belonging to a same tooth row. However, when simulatingthree fossil samples composed of isolated upper or lower molars from M1 to M3 fromthe three sets of ewes, our study does highlight poor results in discriminating dietarycategories.
Anusha Ramdarshan. Institut de Paléoprimatologie et Paléontologie Humaine: Evolution et Paléoenvironnements UMR 7262 (CNRS and Université de Poitiers), 86073 Poitiers Cedex 9, France. [email protected]écile Blondel. Institut de Paléoprimatologie et Paléontologie Humaine: Evolution et Paléoenvironnements UMR 7262 (CNRS and Université de Poitiers), 86073 Poitiers Cedex 9, France. [email protected] Gautier. Ferme du Mourier, Institut de l’Elevage, 87800 St Priest Ligoure, France; Centre Interrégional d’Information et de Recherche en Production Ovine, Ferme du Mourier, 87800 Saint Priest
Ramdarshan, Anusha, Blondel, Cécile, Gautier, Denis, Surault, Jérôme, and Merceron, Gildas. 2017. Overcoming sampling issues in dental tribology: Insights from an experimentation on sheep. Palaeontologia Electronica 19.3.53A: 1-19. https://doi.org/10.26879/762palaeo-electronica.org/content/2017/2042-what-does-toothwear-represent
Copyright: September 2017 Palaeontology Association. This is an open access article distributed under the terms of Attribution-NonCommercial-ShareAlike 4.0 International (CC BY-NC-SA 4.0), which permits users to copy and redistribute the material in any medium or format, provided it is not used for commercial purposes and the original author and source are credited, with indications if any changes are made.creativecommons.org/licenses/by-nc-sa/4.0/
RAMDARSHAN ET AL.: WHAT DOES TOOTHWEAR REPRESENT?
Ligoure, France. [email protected]érôme Surault. Institut de Paléoprimatologie et Paléontologie Humaine: Evolution et Paléoenvironnements UMR 7262 (CNRS and Université de Poitiers), 86073 Poitiers Cedex 9, France. [email protected] Merceron. Institut de Paléoprimatologie et Paléontologie Humaine: Evolution et Paléoenvironnements UMR 7262 (CNRS and Université de Poitiers), 86073 Poitiers Cedex 9, France.
Keywords: Dental microwear texture analysis; representativity; mammals; diet; sheep; controlled-food-testing
Submission: 15 February 2017 Acceptance: 2 October 2017
INTRODUCTION
The fossil record suffers from its fragmentarynature. The conditions necessary for fossilizationare very rarely met, and consequently the fossilrecord only represents a partial representation ofpast biodiversity (Foote and Sepkoski, 1999; Ben-ton et al., 2000; Le Fur et al., 2011). Inferences inpaleontology, but also disciplines such as pal-eoecology and paleoanthropology rely on fossilspecimens, which can vary in number for a givenspecies from thousands of cranial and post cranialremains to a single isolated tooth. Paleoecology isparticularly dependent on this issue. Ecologicaltraits, from diet to ranging behavior, vary betweenspecies but also within a given species from popu-lation to population. For example, both red deerand roe deer vary significantly in the diet through-out the year (Storms et al., 2008). Some taxa evenvary from being grazers for a given season toincorporating a substantial amount of fruit in its dietfor another (Gagnon and Chew, 2000). Environ-ment can also be a significant factor influencingdiet. For example, impalas (Aepyceros melampus)living in open savanna and grassland landscapesgenerally eat more grass than their counterparts insavanna woodlands (Codron et al., 2005). Localevents with high impact on vegetal resources mayalso be a major source of dietary variation. Forexample, in South America, annual flooding forcesthe red brocket deer (Mazama americana) and thecollared peccary (Tayassu tajacu) to retreat tofloodplain islands and to shift from a frugivorous toa woody browse diet (Bodmer, 1990). Interpreta-tions in the fossil record are based on specimenswhich, although belonging to the same locality andpossibly the same species, offer no guarantee oforiginating from the same season or even thesame year (or even century) of death. In this con-
text, making inferences on a whole species basedon a few specimens seems challenging at best.
Among the available paleoecological meth-ods, the analyses of tooth wear at different scalesare robust proxies to interpret dietary habits ofextinct species in the fossil record. There are twomain types of tooth wear, both resulting in the lossof small fragments of enamel from the tooth itself:attrition, the wear resulting from tooth-to-tooth con-tact, and abrasion, resulting from food-to-toothcontact (Kaiser et al., 2013). Although tooth wearcan also have other root causes such as chemicalerosion, abrasion is of particular interest in pal-eoecology as it varies according to the physicalproperties of the food ingested over the last weeksof an animal’s life (Calandra and Merceron, 2016;Merceron et al., 2016; Ramdarshan et al., 2016).Dental microwear texture analysis (DMTA) hasnow become a widespread tool for reconstructingthe past diet of mammals (Ungar, 2015; Calandraand Merceron, 2016; DeSantis, 2016) and evenother vertebrates (Purnell et al., 2007; Gill et al.,2014). However, although this method is widelyused, few studies have tackled the issue of samplerepresentativity. Can a single scan, representing atbest a few hundred square micrometers, give anaccurate representation of a whole dental facet, letalone a whole tooth? How does the microwear sig-nal vary along a facet? How large does a scanhave to be to provide accurate discriminationbetween different diets? Answers to these ques-tions are fundamental before reliable dietary inter-pretations can be given. Microwear is now widelyused in paleoecology to reconstruct past diets.However, most studies use whatever material isavailable: upper, lower, first, second, third molars,and even sometimes premolars are often jumbledtogether in the same analysis in order to maximizesample size. However, several factors vary along
2
PALAEO-ELECTRONICA.ORG
the tooth row. For example, the force of the powerstroke is known to vary along the tooth row (Pérez-Barbería and Gordon, 1998, 1999; Radinsky, 1985;von Koenigswald et al., 2013). Efficiency in foodcomminution depends directly on molar surfaceocclusal area and contact area (Pérez-Barberíaand Gordon, 1998), which varies according to thetooth considered. All foods are not reduced in thesame way along the tooth row (Reilly et al., 2001).Furthermore, previous studies (Schulz et al., 2010;Taylor et al., 2013, 2016) have highlighted inter-tooth differences in several taxa. In these condi-tions, are the microwear patterns on the first, sec-ond and third molars along a same tooth rowdirectly comparable?
These matters remain to be characterized in acontrolled setting. In this study, we tackle this issuefrom the ground up. A large-scale controlled foodtrial conducted on domestic sheep provides theframework in which to test these fundamentalquestions. Controlling the physical and mechanicalproperties of the diet (i.e., toughness, hardness)allows us to characterize the microwear signal.Here, we focus on the questions of scan size rep-resentativity, signal variation along the tooth rowand between upper and lower cheekteeth (Figure1).
MATERIAL AND METHODS
Controlled-food Trials
The controlled-food trials were carried out atthe Mourier farm (Limousin region, France; agree-ment number B-87-176-01), under the supervisionof the Centre Interrégional d’Information et deRecherche en Production Ovine (CIIRPO) and theInstitut de l'Elevage (Idele; see details in Merceronet al., 2016; Ramdarshan et al., 2016). G.M. andD.G. who have official approval to carry out suchprocedures, designed these trials. They were per-formed on domestic sheep (Ovis aries), using onlyewes from the Vendéen breed. All experimentswere conducted on cull ewes, meaning sheep nolonger suitable for breeding and sold for meat.None of the experiments required the sheep to behandled. In this study, all the ewes had been keptin the same pasture highly dominated in grassesfor six months before the start of the trials. As such,their dental microwear textures are considered tobe homogenous at the beginning of the controlledfood testing. Sheep had full access to foods withwhich they were familiar. The ewes were keptinside a covered sheepfold. The sheep were notkept on hay, which they would have eaten, but on
dust-free wood shavings used in equestrian cen-tres. Feeding troughs were covered with a plasticfilm and cleaned out daily to avoid contamination.None of the ewes lost weight during the experi-ments (see details in Merceron et al., 2016 and inRamdarshan et al., 2016).
Thirty sheep were included in this study (Table1), divided into three groups of ten. Three groupswere each given foods with different physical andmechanical properties: soft and silica-depletedbrowse, tough and silica bearing grass, hard andbrittle seeds in complement with soft browse.These qualitative terms are used to broadly qualifythe food properties used in this study. Grasses areconsidered tougher, i.e., to have a higher energyrelease rate (Berthaume, 2016; Thiery et al., 2017)than browse such as clover. However, we shouldnote that the clover and grass assemblages for-aged by the ewes during the experiments do notdisplay any significant differences in fracturetoughness (meaning the ability to absorb deforma-tion energy per unit volume before failure) meas-ured thanks to a tensile test (Merceron et al.,2016). Seeds are qualified as hard and brittle ascomminution can be obtained through stress cre-ated between flat surfaces, as opposed to grassesand browse which require blades to cut throughthem (Fortelius, 1985). For details on the specificproperties of these foods (specific abundance, bio-silica content, toughness, hardness), refer to Mer-ceron et al. (2016) and Ramdarshan et al. (2016).The first group of cull ewes was fed on a red clo-ver-dominated silage (~1.650 kg per ewe and perday), the second on a multispecific assemblagehighly dominated by grasses (~1.550 kg per eweand per day), and the third on the clover-dominatedsilage (~1.275 kg per ewe and per day) in additionwith barley kernels (~0.425 kg per ewe and perday). The fodders were harvested and then bale-wrapped 24 hours after the cutting in order to guar-antee similar natural physical properties (percent-age of dry matter about 50%) to the uncut plantthroughout the controlled food testing. The eweshad full access to the food. These amounts weredefined by giving large amounts of fodder andmeasuring how much the ewes had consumed in24 hours. It is worth highlighting that silage tends tobe acid and one could hypothesize that differencesin dental microwear textures reflects acid erosionrather abrasion or attrition. However, it is knownthat saliva plays an active role in protecting dentalenamel from acid erosion (Hannig and Balz, 1999;Lendenmann et al., 2000; Wetton et al., 2006).
3
RAMDARSHAN ET AL.: WHAT DOES TOOTHWEAR REPRESENT?
4
2. Differences in scan size
Specimen Group Tooth31-078 Clover + Barley UM131-078 Clover + Barley lm230-068 Clover + Barley lm121-253 Clover + Barley lm331-045 Clover + Barley UM307-347 Clover + Barley UM290-237 Clover + Barley lm390-237 Clover + Barley UM131-045 Clover + Barley UM131-045 Clover + Barley UM2
�
1 23
1 cm
45
6
7
5. Simulation as a bridge between experimentation and fossil samples
3. Differences between facets
4. Differences along the tooth row
� � � � ��
����
�� ���� ��
� � �
� ��
200 x 200 100 x 100 50 x 50 μm 4 x [100 x 100 μm]
Detail of the lingual facet of the lower second molar
1 cm
1. Upper and lower tooth rows
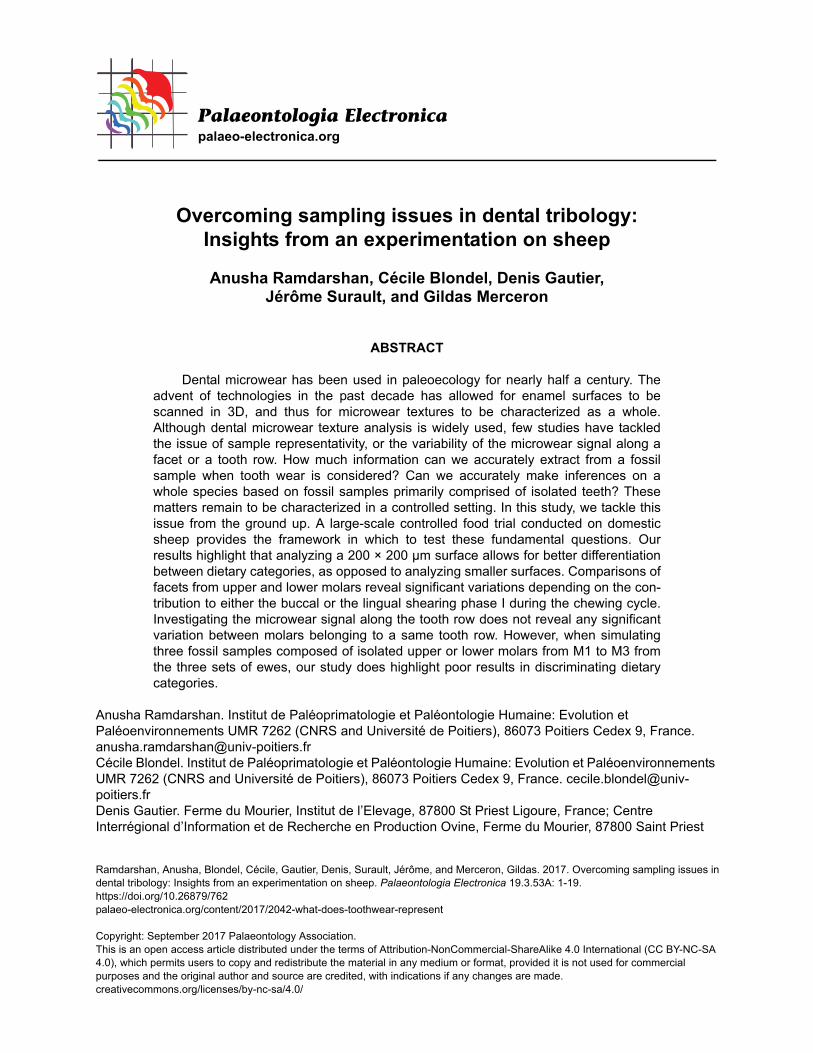
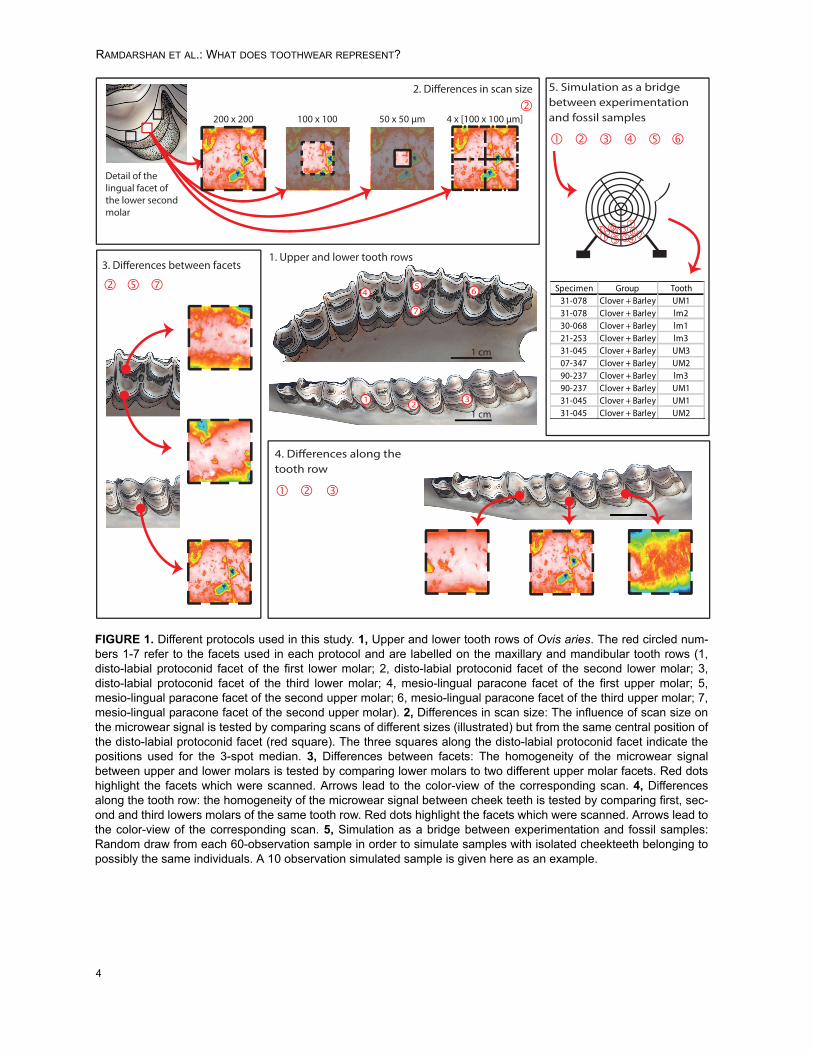
FIGURE 1. Different protocols used in this study. 1, Upper and lower tooth rows of Ovis aries. The red circled num-bers 1-7 refer to the facets used in each protocol and are labelled on the maxillary and mandibular tooth rows (1,disto-labial protoconid facet of the first lower molar; 2, disto-labial protoconid facet of the second lower molar; 3,disto-labial protoconid facet of the third lower molar; 4, mesio-lingual paracone facet of the first upper molar; 5,mesio-lingual paracone facet of the second upper molar; 6, mesio-lingual paracone facet of the third upper molar; 7,mesio-lingual paracone facet of the second upper molar). 2, Differences in scan size: The influence of scan size onthe microwear signal is tested by comparing scans of different sizes (illustrated) but from the same central position ofthe disto-labial protoconid facet (red square). The three squares along the disto-labial protoconid facet indicate thepositions used for the 3-spot median. 3, Differences between facets: The homogeneity of the microwear signalbetween upper and lower molars is tested by comparing lower molars to two different upper molar facets. Red dotshighlight the facets which were scanned. Arrows lead to the color-view of the corresponding scan. 4, Differencesalong the tooth row: the homogeneity of the microwear signal between cheek teeth is tested by comparing first, sec-ond and third lowers molars of the same tooth row. Red dots highlight the facets which were scanned. Arrows lead tothe color-view of the corresponding scan. 5, Simulation as a bridge between experimentation and fossil samples:Random draw from each 60-observation sample in order to simulate samples with isolated cheekteeth belonging topossibly the same individuals. A 10 observation simulated sample is given here as an example.
PALAEO-ELECTRONICA.ORG
Casting and Data Analysis
The skulls are housed at the iPHEP lab (UMR7262 CNRS and Université de Poitiers). Each ana-lyzed tooth (first, second, and third upper molars[UM1, UM2, and UM3, respectively] and first, sec-ond, and third lower molars [lm1, lm2, and lm3,respectively]; Figure 1.1) was then carefullycleaned with a cotton-swab soaked in acetone.Molds are then made using a polyvinylsiloxaneelastomer (Regular Body President, ref 6015 - ISO4823, medium consistency, polyvinylsiloxane addi-tion type; Coltene Whaledent). This product isknown to be the most efficient one to replicate agiven surface (Galbany et al., 2006; Goodall et al.,2015).
The molds are then placed under a LeicaDCM8 confocal profilometer using white light con-focal technology with a Leica 100× objective(Numerical aperture = 0.90; working distance = 0.9mm). The lateral resolution is an (x, y) interval of0.129 μm, with a vertical numerical step of 1 nm.
The analyses were performed using theScale-Sensitive Fractal Analysis using Toothfrax
and Sfrax software (Surfract, www.surfract.com)following Scott et al. (2006). Complexity (Asfc orArea-scale fractal complexity) is a measure of theroughness at a given scale. Anisotropy (epLsar orexact proportion of length-scale anisotropy ofrelief) measures the orientation concentration ofsurface roughness (Table 1; Appendix 1).
Before each sets of statistical tests in thisstudy, data were rank-transformed in order toensure the conditions for parametric tests were met(Conover and Iman, 1981). Data were then ana-lyzed using two-way repeated measures ANOVAsand corresponding post-hoc tests (Pairwise Stu-dent test, performed with the Bonferroni adjust-ment method to take into account non-independentobservations).
Different Case Studies for Different Questions
Differences in scan size. Dental microwear tex-ture analysis has been highly improved by Scott etal. (2005, 2006). Since then the method has beenwidely used to reconstruct diet in both living andextinct mammals. The standard scan size of 4adjoining scans of 100 × 140 µm was defined in
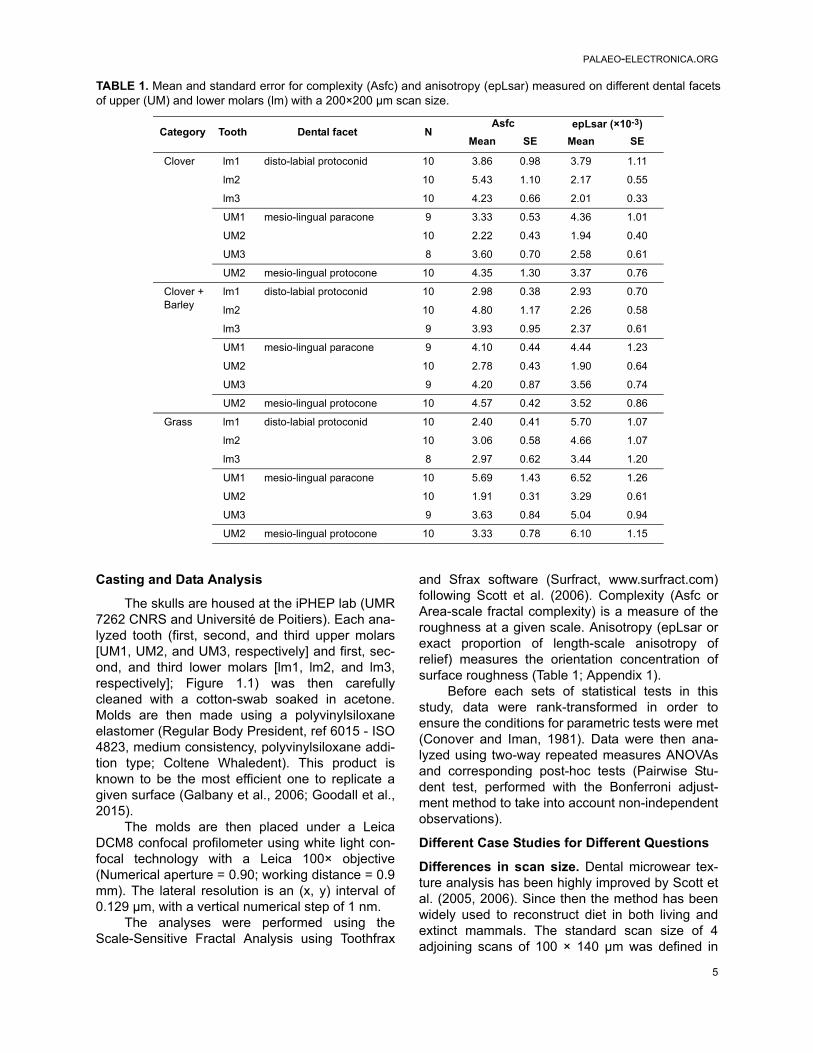
TABLE 1. Mean and standard error for complexity (Asfc) and anisotropy (epLsar) measured on different dental facetsof upper (UM) and lower molars (lm) with a 200×200 µm scan size.
Category Tooth Dental facet NAsfc epLsar (×10-3)
Mean SE Mean SE
Clover lm1 disto-labial protoconid 10 3.86 0.98 3.79 1.11
lm2 10 5.43 1.10 2.17 0.55
lm3 10 4.23 0.66 2.01 0.33
UM1 mesio-lingual paracone 9 3.33 0.53 4.36 1.01
UM2 10 2.22 0.43 1.94 0.40
UM3 8 3.60 0.70 2.58 0.61
UM2 mesio-lingual protocone 10 4.35 1.30 3.37 0.76
Clover + Barley
lm1 disto-labial protoconid 10 2.98 0.38 2.93 0.70
lm2 10 4.80 1.17 2.26 0.58
lm3 9 3.93 0.95 2.37 0.61
UM1 mesio-lingual paracone 9 4.10 0.44 4.44 1.23
UM2 10 2.78 0.43 1.90 0.64
UM3 9 4.20 0.87 3.56 0.74
UM2 mesio-lingual protocone 10 4.57 0.42 3.52 0.86
Grass lm1 disto-labial protoconid 10 2.40 0.41 5.70 1.07
lm2 10 3.06 0.58 4.66 1.07
lm3 8 2.97 0.62 3.44 1.20
UM1 mesio-lingual paracone 10 5.69 1.43 6.52 1.26
UM2 10 1.91 0.31 3.29 0.61
UM3 9 3.63 0.84 5.04 0.94
UM2 mesio-lingual protocone 10 3.33 0.78 6.10 1.15
5

RAMDARSHAN ET AL.: WHAT DOES TOOTHWEAR REPRESENT?
order to match the size used in early studies usingSEM. Several studies, carried out on smaller taxasuch as rodents or lagomorphs, even use scans assmall as 15 × 15 µm (Schulz et al., 2013; Withnelland Ungar, 2014; Burgman et al., 2016; Calandraet al., 2016a, 2016b). Here, we test the representa-tivity of scan size (Figure 1.2). A scan was per-formed at the central position for each disto-labialprotoconid facet of the second lower molar. Fromthis scan several surfaces were treated: 50 × 50µm, 100 × 100 µm, and 200 × 200 µm. Each 200 ×200 µm scan was also treated as four equal sub-surfaces, to test the pertinence to analyze a sur-face as a whole, or as a combination ofsubsurfaces as established by Scott et al. (2005,2006). An additional value, called 3-spot mean,corresponds to the mean of the anisotropy (epL-sar) and complexity (Asfc) of three different scansalong the facet (i.e., in a buccal, central and lingualposition). Three scans along the facet were madein order to test the variation of the microwear sig-nal. Although variations can be seen between thelingual, central, and jugal positions, no significantdifferences are highlighted by this study (seeAppendices 2-3). The mean of the three values(buccal, central, and lingual) is also used to test dif-ferences with value gained from scans of differentsize. Differences between upper and lower teeth.Numerous microwear studies use both upper andlower molars in order to maximize sample size.The lingual paracone facets and the labial protoco-nid facets are traditionally used in dental microwearstudies (Semprebon et al., 2004; Merceron et al.,2012; Scott, 2012; Rivals et al., 2015) as theyocclude during the shearing phase I (Janis, 1979,1990) and supposedly share similar microwear pat-terns. Phase I is dominated by shearing actions asopposed to phase II during which grinding actionsare more prevalent (Crompton and Hiiemae, 1969;Janis, 1990; Lucas, 2004). Here, we suppose thatthe paracone first enters in to contact with lingualcuspids on the lower molar at the beginning ofphase I, and then with the buccal cuspids as thelower molars move centrally. It results that the faceton paracone traditionally used in microwear stud-ies enters in contact with more enamel facets thanthe buccal dental facets of the protoconid on lowermolars. Here we test the homogeneity of the den-tal microwear texture between upper and lowersecond molars issued from the very same individ-ual (Figure 1.2). Alternatively, we also consider lin-gual protocone facets on upper second molarsbecause in the same way as the buccal facets of
the protoconid on lower molars, they occlude withfewer enamel facets from the homologous counter-parts (Figure 1.3). All of the comparisons are madewith 200×200 µm scans performed on the centralposition along the enamel band. Differences between cheekteeth along thetooth row. Similarly to upper and lower molars,numerous microwear studies jumble first, second,and third molars together in order to maximizesample size (Merceron et al., 2005a, 2005b, 2012;Ungar et al., 2007, 2016; García-González et al.,2015). Here, we test the homogeneity of themicrowear signal along the lower tooth row (Figure1.4). Each disto-labial protoconid facet of the first,second, and third lower molars was scanned foreach ewe. Dental microwear texture analysis isperformed on 200×200 µm surfaces.
Simulation as Bridge Between Experimentation and Fossil Samples
In this study, we will test what the signal car-ried by a fossil sample really means. Mostmicrowear studies utilize associated dentitionswhere the specific locus of the tooth sampled isknown and pseudoreplication of individuals isabsent or minimal (Scott, 2012; Scott et al., 2012;Merceron et al., 2014). However, many have tocontend with isolated teeth implying that one indi-vidual could be represented several times in onesample (Merceron et al., 2012; Tütken et al., 2013;Oliver Pérez et al., 2014). Does regrouping first,second, and third lower with upper molars as pale-ontologists used to do reinforce or weaken ecologi-cal interpretations compared with analysis run on asingle tooth type (e.g., second lower molar)? Toanswer this question, each disto-labial protoconidfacet on lower molars or each mesio-lingual para-cone facet on upper molars were scanned (Figure1). Complexity (Asfc) and Anisotropy (epLsar) werecalculated for each scan. This results in a datasetwith 60 observations (UM1–3 and lm1–3) for a 10-ewe sample. The ewes considered in this studyhave different ages, and so some individuals donot have a fully erupted third molar. However, theyare considered in the datasets so the observationthey represent is associated with no values for thetwo textural parameters.
In order to simulate samples with isolatedcheekteeth belonging to possibly the same individ-uals, three sets of 10, 20, or 30 observations aredrawn randomly from each 60-observation sample(grass, clover, and clover/barley; Figure 1.5). Thisprocess is repeated a thousand times to generatea significant amount out of possible cases. As stud-
6
PALAEO-ELECTRONICA.ORG
ies on fossil specimens have to primarily contendwith isolated teeth with no indication as to whetheror not they belong to the same individual, no pre-caution is taken here to avoid sampling multipleobservations from the same individual (althoughthe random sampling is without replacement). Theresult is a dataset with three groups (grass, clover,and clover/barley) containing 10, 20, or 30 obser-vations each.
For each of the thousand iterations, data arerank transformed to ensure the conditions to carryout parametric statistical tests are met. As we areconsidering datasets as we would in the fossil sam-ple, single classification ANOVAs (and notrepeated measures) are then performed to high-light any significant differences between clover-,grass-, and clover/barley-fed ewes. Results arereported as the frequency of significant p-valuesover the 1000 iterations.
RESULTS AND DISCUSSION
Scan Mode and Size on Lower Molar
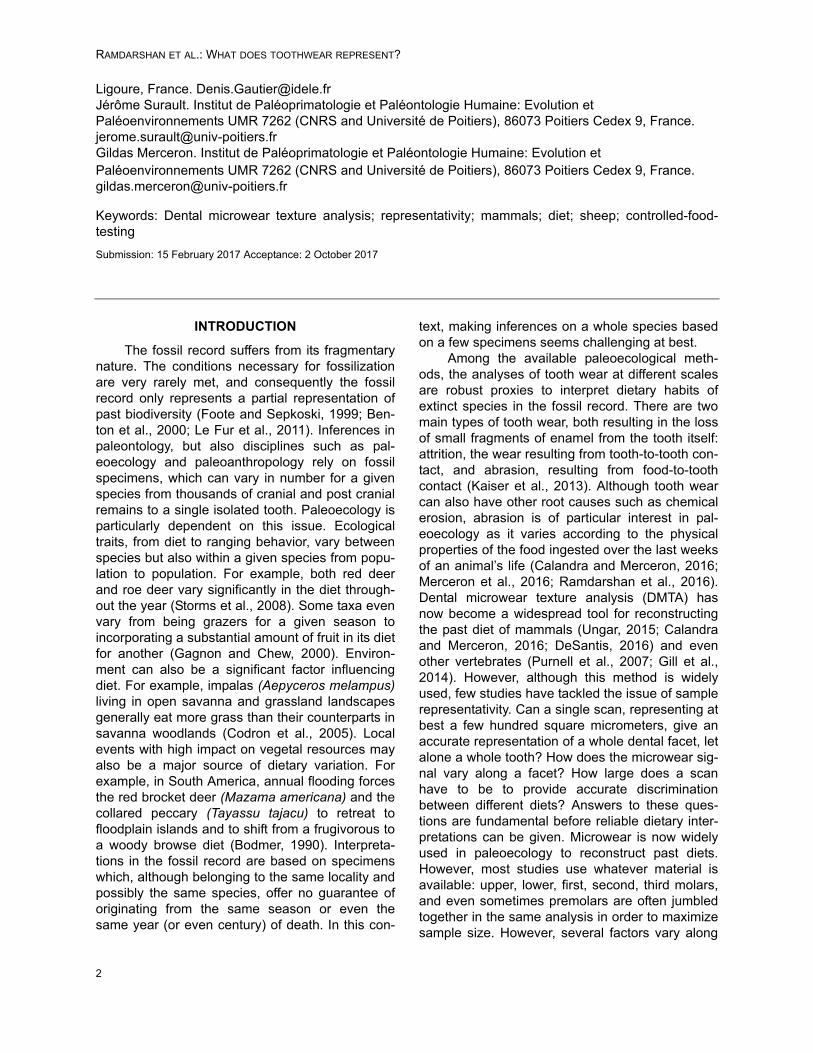
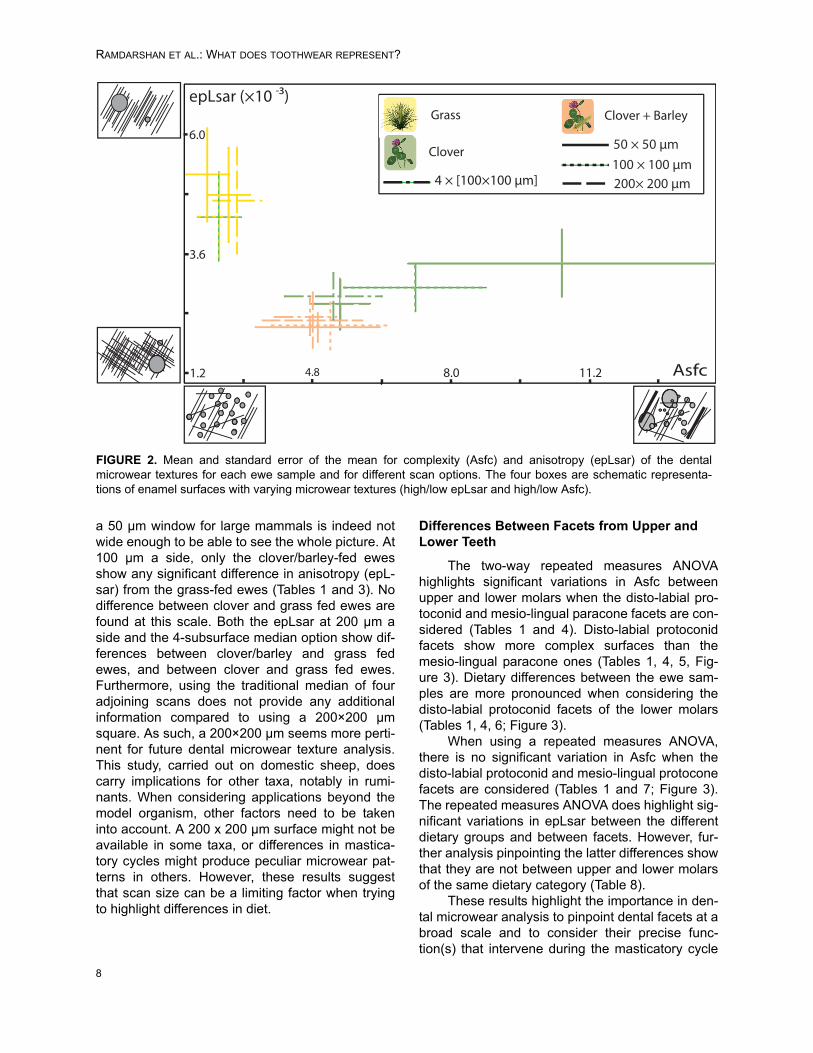
The two-way repeated measure ANOVAshows significant variations in complexity (Asfc)between scan options (marginally with p = 0.054;Table 2) with a significant effect of the interactionbetween scan option and dietary groups (Figure 2).The two-way repeated measure ANOVA alsoshows marginal variations in anisotropy (epLsar)between dietary groups. The pairwise post-hoccomparisons highlight significant differences incomplexity (Asfc) and anisotropy (epLsar) betweenthe three different dietary groups for all scan size
options except for the 3-spot mean (Tables 1 and3; Figure 2). Indeed, there is no significant differ-ence between the different dietary groups of eweswhen several scans at different position along afacet are considered. To multiply scans over a den-tal facet, instead of focusing on a scan at the cen-tral position, blurs the differences between groups.
When looking at the different scans from 200to 50 µm a side, differences between diets dependon which scan size is considered. Results at 200µm, 100 µm, and 50 µm all show significant differ-ences between the clover-fed and grass-fed sam-ples for Asfc (Table 3). None highlight differencesin complexity (Asfc, Tables 2 and 3, Figure 2)between the clover/barley-fed ewes and the twoother groups. Using the 4-subsurface medianoption, differences in complexity are significantbetween clover-fed and grass-fed ewes, but againnone between the clover/barley fed ewes and thetwo other groups (Table 3).
Results for anisotropy (epLsar) are more var-ied. Results at 50 µm do not show any significantdifferences between groups (Table 3). This resultmay seem counterintuitive given the very differentmeans of each group. Actually, the high inter-indi-vidual differences in anisotropy (and complexity aswell) due to the random occurrence of a givenmicrowear feature (such as deep overlapping pitswith complex slopes) and thus high variance (Fig-ure 2) in each group is such that there is a majoroverlap between all the groups, preventing therepeated measures ANOVA from highlighting anypotential difference in microwear textures. Thisresult would seem to indicate that looking through
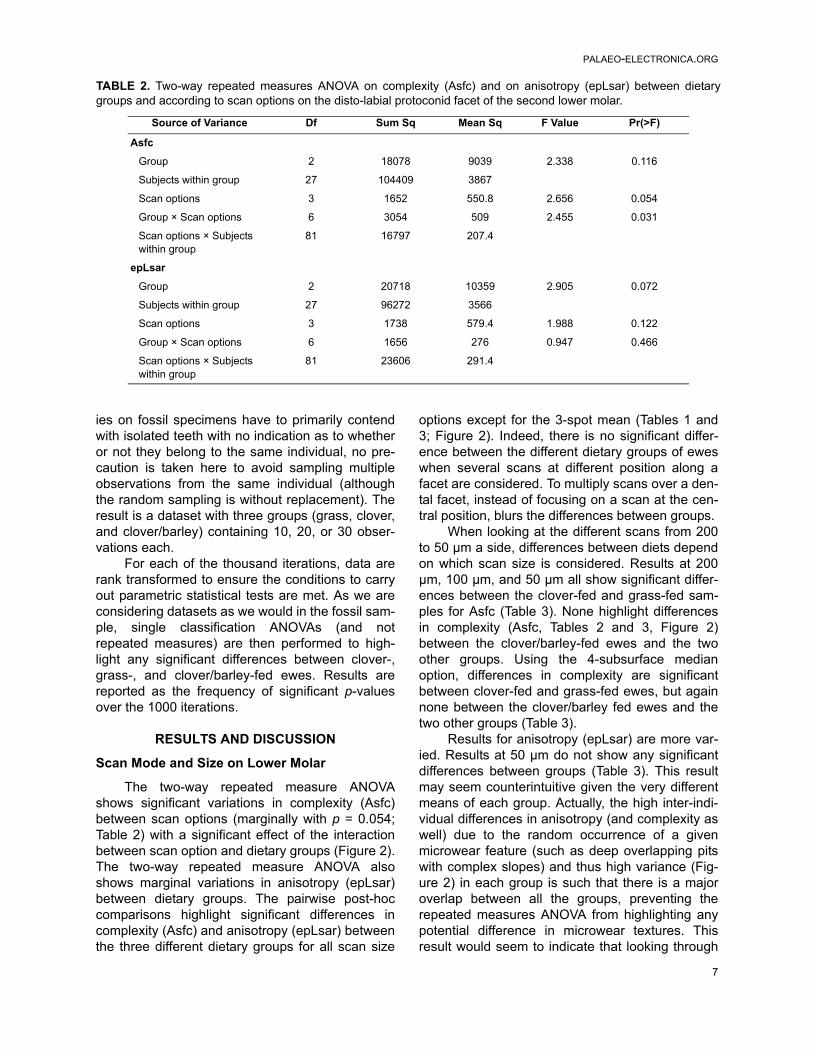
TABLE 2. Two-way repeated measures ANOVA on complexity (Asfc) and on anisotropy (epLsar) between dietarygroups and according to scan options on the disto-labial protoconid facet of the second lower molar.
Source of Variance Df Sum Sq Mean Sq F Value Pr(>F)
Asfc
Group 2 18078 9039 2.338 0.116
Subjects within group 27 104409 3867
Scan options 3 1652 550.8 2.656 0.054
Group × Scan options 6 3054 509 2.455 0.031
Scan options × Subjects within group
81 16797 207.4
epLsar
Group 2 20718 10359 2.905 0.072
Subjects within group 27 96272 3566
Scan options 3 1738 579.4 1.988 0.122
Group × Scan options 6 1656 276 0.947 0.466
Scan options × Subjects within group
81 23606 291.4
7
RAMDARSHAN ET AL.: WHAT DOES TOOTHWEAR REPRESENT?
a 50 µm window for large mammals is indeed notwide enough to be able to see the whole picture. At100 µm a side, only the clover/barley-fed ewesshow any significant difference in anisotropy (epL-sar) from the grass-fed ewes (Tables 1 and 3). Nodifference between clover and grass fed ewes arefound at this scale. Both the epLsar at 200 µm aside and the 4-subsurface median option show dif-ferences between clover/barley and grass fedewes, and between clover and grass fed ewes.Furthermore, using the traditional median of fouradjoining scans does not provide any additionalinformation compared to using a 200×200 µmsquare. As such, a 200×200 µm seems more perti-nent for future dental microwear texture analysis.This study, carried out on domestic sheep, doescarry implications for other taxa, notably in rumi-nants. When considering applications beyond themodel organism, other factors need to be takeninto account. A 200 x 200 µm surface might not beavailable in some taxa, or differences in mastica-tory cycles might produce peculiar microwear pat-terns in others. However, these results suggestthat scan size can be a limiting factor when tryingto highlight differences in diet.
Differences Between Facets from Upper and Lower Teeth
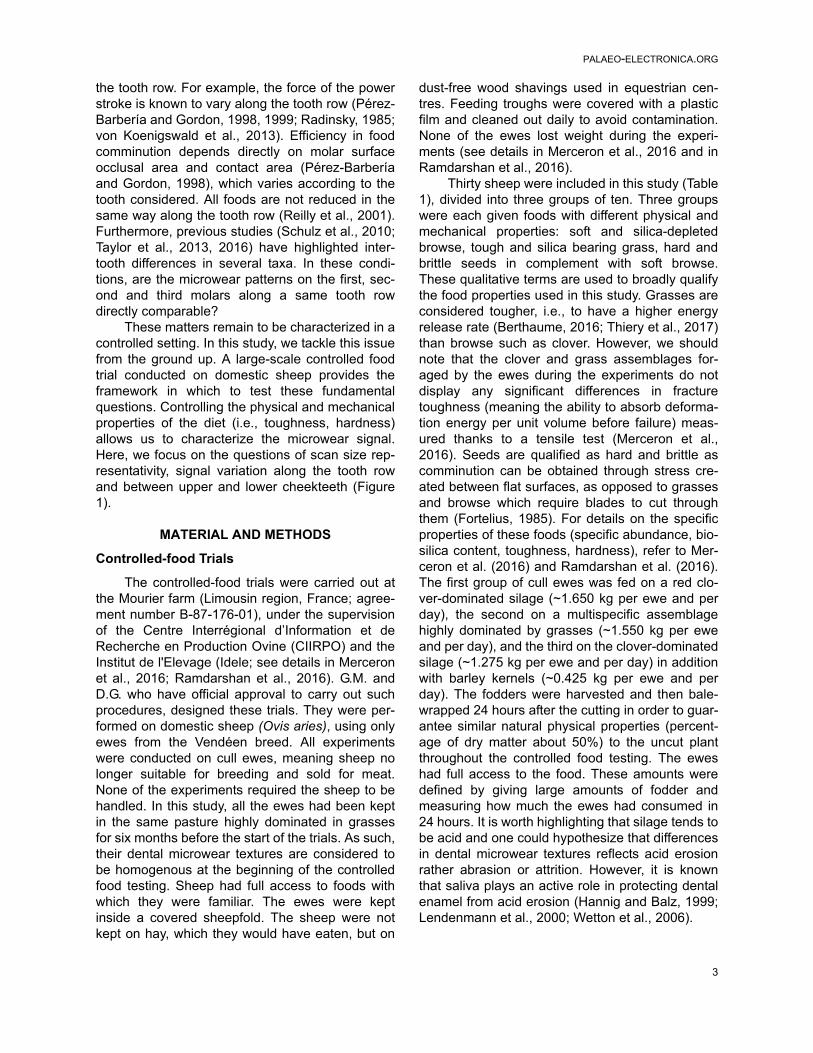
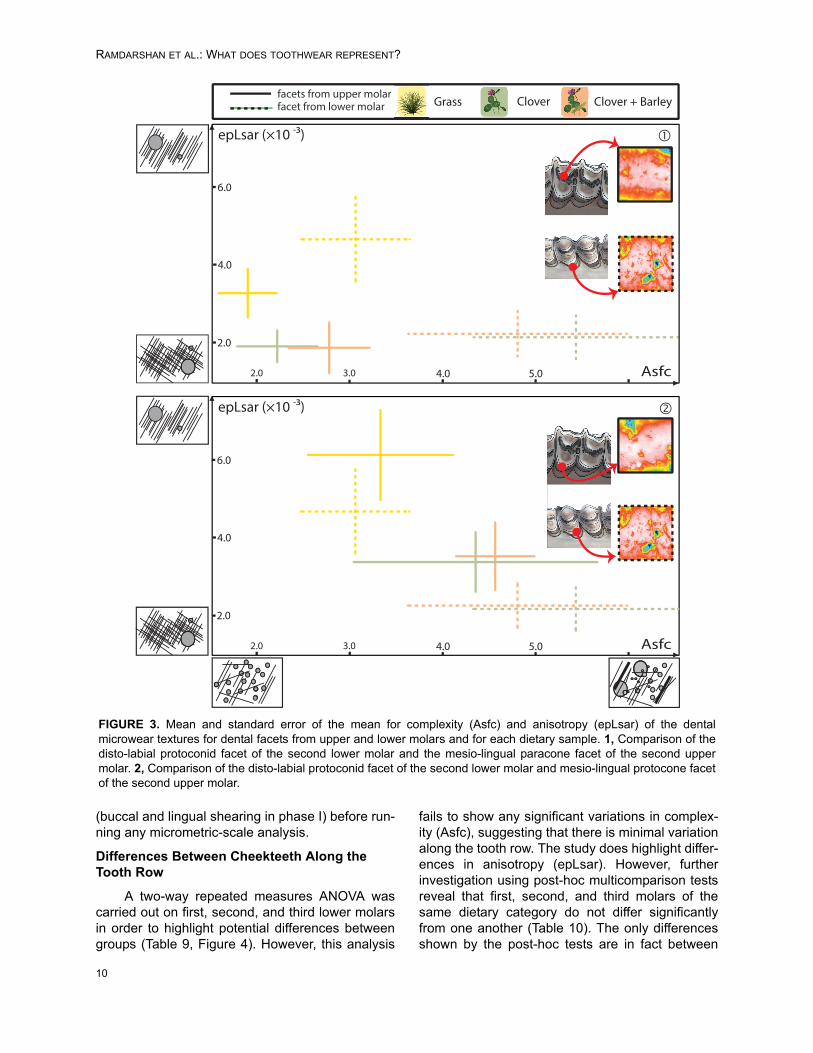
The two-way repeated measures ANOVAhighlights significant variations in Asfc betweenupper and lower molars when the disto-labial pro-toconid and mesio-lingual paracone facets are con-sidered (Tables 1 and 4). Disto-labial protoconidfacets show more complex surfaces than themesio-lingual paracone ones (Tables 1, 4, 5, Fig-ure 3). Dietary differences between the ewe sam-ples are more pronounced when considering thedisto-labial protoconid facets of the lower molars(Tables 1, 4, 6; Figure 3).
When using a repeated measures ANOVA,there is no significant variation in Asfc when thedisto-labial protoconid and mesio-lingual protoconefacets are considered (Tables 1 and 7; Figure 3).The repeated measures ANOVA does highlight sig-nificant variations in epLsar between the differentdietary groups and between facets. However, fur-ther analysis pinpointing the latter differences showthat they are not between upper and lower molarsof the same dietary category (Table 8).
These results highlight the importance in den-tal microwear analysis to pinpoint dental facets at abroad scale and to consider their precise func-tion(s) that intervene during the masticatory cycle
Asfc
epLsar (×10 -3)
1.2
3.6
6.0
4.8 8.0 11.2
Grass
Clover
Clover + Barley
4 × [100×100 μm]100 × 100 μm50 × 50 μm
200× 200 μm
FIGURE 2. Mean and standard error of the mean for complexity (Asfc) and anisotropy (epLsar) of the dentalmicrowear textures for each ewe sample and for different scan options. The four boxes are schematic representa-tions of enamel surfaces with varying microwear textures (high/low epLsar and high/low Asfc).
8
PALAEO-ELECTRONICA.ORG
9
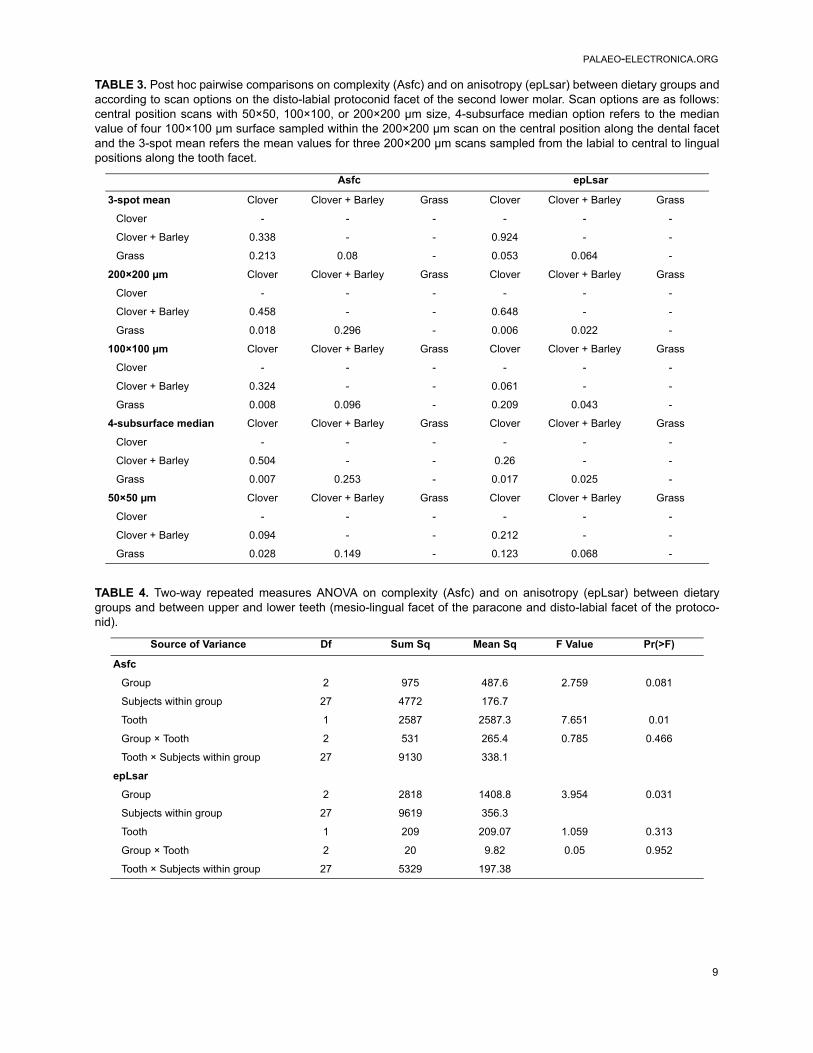
TABLE 3. Post hoc pairwise comparisons on complexity (Asfc) and on anisotropy (epLsar) between dietary groups andaccording to scan options on the disto-labial protoconid facet of the second lower molar. Scan options are as follows:central position scans with 50×50, 100×100, or 200×200 µm size, 4-subsurface median option refers to the medianvalue of four 100×100 µm surface sampled within the 200×200 µm scan on the central position along the dental facetand the 3-spot mean refers the mean values for three 200×200 µm scans sampled from the labial to central to lingualpositions along the tooth facet.
TABLE 4. Two-way repeated measures ANOVA on complexity (Asfc) and on anisotropy (epLsar) between dietarygroups and between upper and lower teeth (mesio-lingual facet of the paracone and disto-labial facet of the protoco-nid).
Asfc epLsar
3-spot mean Clover Clover + Barley Grass Clover Clover + Barley Grass
Clover - - - - - -
Clover + Barley 0.338 - - 0.924 - -
Grass 0.213 0.08 - 0.053 0.064 -
200×200 µm Clover Clover + Barley Grass Clover Clover + Barley Grass
Clover - - - - - -
Clover + Barley 0.458 - - 0.648 - -
Grass 0.018 0.296 - 0.006 0.022 -
100×100 µm Clover Clover + Barley Grass Clover Clover + Barley Grass
Clover - - - - - -
Clover + Barley 0.324 - - 0.061 - -
Grass 0.008 0.096 - 0.209 0.043 -
4-subsurface median Clover Clover + Barley Grass Clover Clover + Barley Grass
Clover - - - - - -
Clover + Barley 0.504 - - 0.26 - -
Grass 0.007 0.253 - 0.017 0.025 -
50×50 µm Clover Clover + Barley Grass Clover Clover + Barley Grass
Clover - - - - - -
Clover + Barley 0.094 - - 0.212 - -
Grass 0.028 0.149 - 0.123 0.068 -
Source of Variance Df Sum Sq Mean Sq F Value Pr(>F)
Asfc
Group 2 975 487.6 2.759 0.081
Subjects within group 27 4772 176.7
Tooth 1 2587 2587.3 7.651 0.01
Group × Tooth 2 531 265.4 0.785 0.466
Tooth × Subjects within group 27 9130 338.1
epLsar
Group 2 2818 1408.8 3.954 0.031
Subjects within group 27 9619 356.3
Tooth 1 209 209.07 1.059 0.313
Group × Tooth 2 20 9.82 0.05 0.952
Tooth × Subjects within group 27 5329 197.38
RAMDARSHAN ET AL.: WHAT DOES TOOTHWEAR REPRESENT?
(buccal and lingual shearing in phase I) before run-ning any micrometric-scale analysis.
Differences Between Cheekteeth Along the Tooth Row
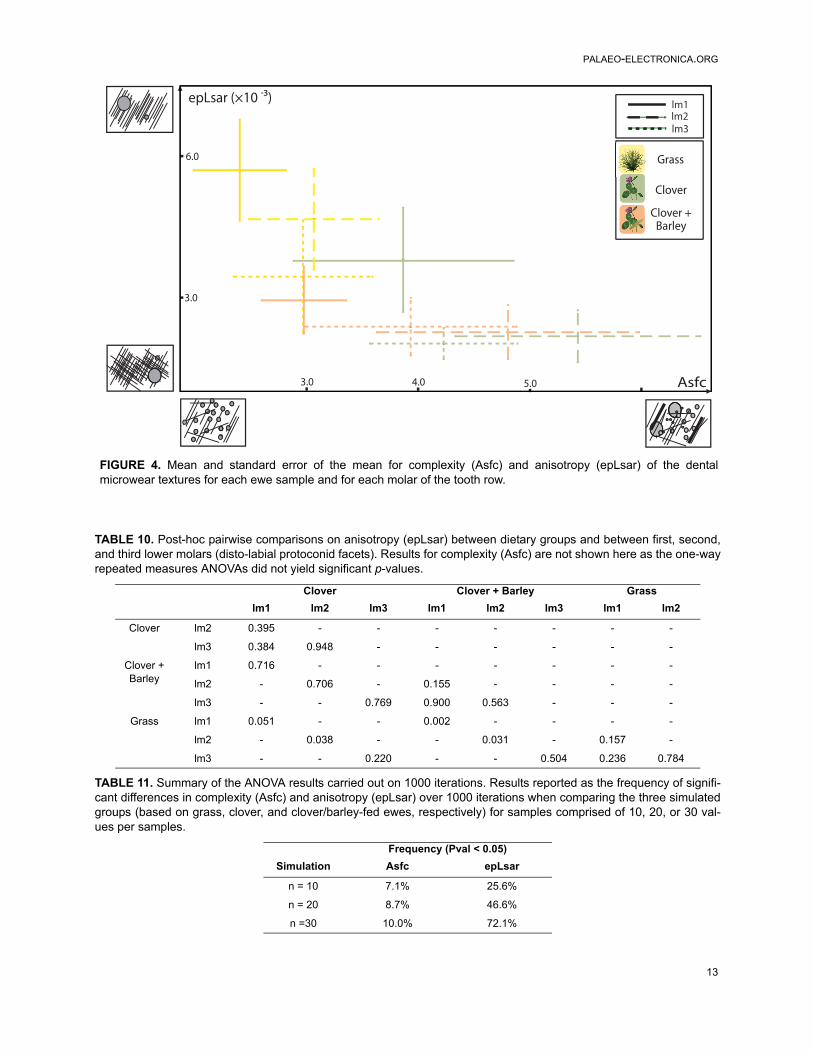
A two-way repeated measures ANOVA wascarried out on first, second, and third lower molarsin order to highlight potential differences betweengroups (Table 9, Figure 4). However, this analysis
fails to show any significant variations in complex-ity (Asfc), suggesting that there is minimal variationalong the tooth row. The study does highlight differ-ences in anisotropy (epLsar). However, furtherinvestigation using post-hoc multicomparison testsreveal that first, second, and third molars of thesame dietary category do not differ significantlyfrom one another (Table 10). The only differencesshown by the post-hoc tests are in fact between
Asfc
epLsar (×10 -3)
4.0
6.0
3.0 4.0 5.02.0
facets from upper molarGrass Clover Clover + Barley
2.0
4.0
6.0
2.0
epLsar (×10 -3)
Asfc3.0 4.0 5.02.0
facet from lower molar
�
�
FIGURE 3. Mean and standard error of the mean for complexity (Asfc) and anisotropy (epLsar) of the dentalmicrowear textures for dental facets from upper and lower molars and for each dietary sample. 1, Comparison of thedisto-labial protoconid facet of the second lower molar and the mesio-lingual paracone facet of the second uppermolar. 2, Comparison of the disto-labial protoconid facet of the second lower molar and mesio-lingual protocone facetof the second upper molar.
10
PALAEO-ELECTRONICA.ORG
different dietary categories (Table 10). Again, thisresult suggests that there is little variation in themicrowear textures along the tooth row in a givendietary category.
The results in this study fail to highlight differ-ences in microwear texture between the differentcheek teeth on the lower left jaw. This would seemto indicate that microwear textures are relativelyhomogenous along the tooth row. Simply put,microwear is a direct reflection of how food isreduced. This simple notion means that microwear
depends on numerous factors such as the size,shape, and material properties of food particles,the size, shape, material properties of teeth, occlu-sal forces, vectors, and more (Lucas, 2004). Inthese conditions one expectation would be thatmicrowear textures show significant differencesbetween different teeth from the same tooth row.Our results indicate this is not the case. The lack ofvariations in dental microwear textures along thetooth row could mean that the power stroke, even ifmaximum at a given point along the tooth row,would see its force homogenously distributed dueto the tooth row acting as a geometric plane (inruminants compared to carnivorous mammals withmolar shape heterogeneity).
Simulating a Fossil Sample
The lack of any significant differencesbetween teeth from the same tooth row suggeststhat dietary differences will still be able to be high-lighted when using first, second, and third molarstogether. We have also highlighted the misuse of
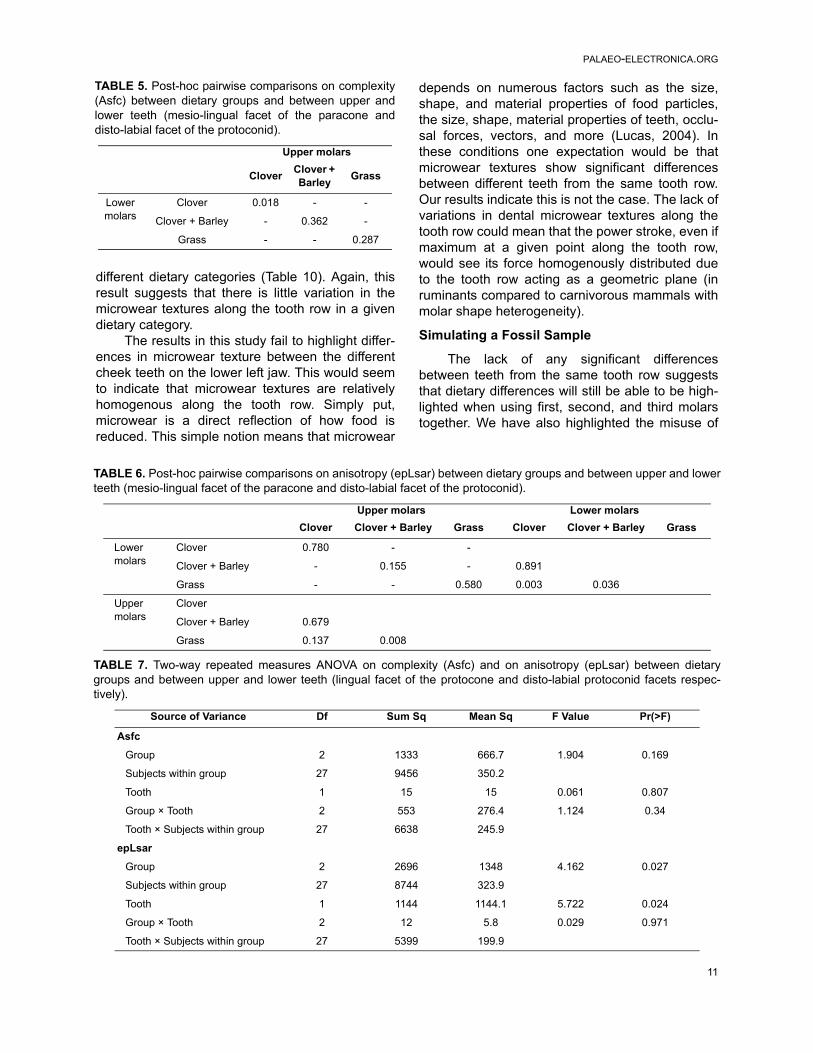
TABLE 5. Post-hoc pairwise comparisons on complexity(Asfc) between dietary groups and between upper andlower teeth (mesio-lingual facet of the paracone anddisto-labial facet of the protoconid).
Upper molars
CloverClover + Barley
Grass
Lower molars
Clover 0.018 - -
Clover + Barley - 0.362 -
Grass - - 0.287
TABLE 6. Post-hoc pairwise comparisons on anisotropy (epLsar) between dietary groups and between upper and lowerteeth (mesio-lingual facet of the paracone and disto-labial facet of the protoconid).
TABLE 7. Two-way repeated measures ANOVA on complexity (Asfc) and on anisotropy (epLsar) between dietarygroups and between upper and lower teeth (lingual facet of the protocone and disto-labial protoconid facets respec-tively).
Upper molars Lower molars
Clover Clover + Barley Grass Clover Clover + Barley Grass
Lower molars
Clover 0.780 - -
Clover + Barley - 0.155 - 0.891
Grass - - 0.580 0.003 0.036
Upper molars
Clover
Clover + Barley 0.679
Grass 0.137 0.008
Source of Variance Df Sum Sq Mean Sq F Value Pr(>F)
Asfc
Group 2 1333 666.7 1.904 0.169
Subjects within group 27 9456 350.2
Tooth 1 15 15 0.061 0.807
Group × Tooth 2 553 276.4 1.124 0.34
Tooth × Subjects within group 27 6638 245.9
epLsar
Group 2 2696 1348 4.162 0.027
Subjects within group 27 8744 323.9
Tooth 1 1144 1144.1 5.722 0.024
Group × Tooth 2 12 5.8 0.029 0.971
Tooth × Subjects within group 27 5399 199.9
11
RAMDARSHAN ET AL.: WHAT DOES TOOTHWEAR REPRESENT?
the combination of upper and lower dental facets,assumed to be homologous (or antagonist sensuSchultz et al., 2017) because occluding during thedental shearing phase I (Janis, 1990), but actuallyinvolved in different ways during the phase I. Thus,here, we investigated the effects of grouping alto-gether these two types of dental facets from upperand lower molars, a habit widely used by paleoeco-logists to increase sample size and supposedlystrengthen their analysis.
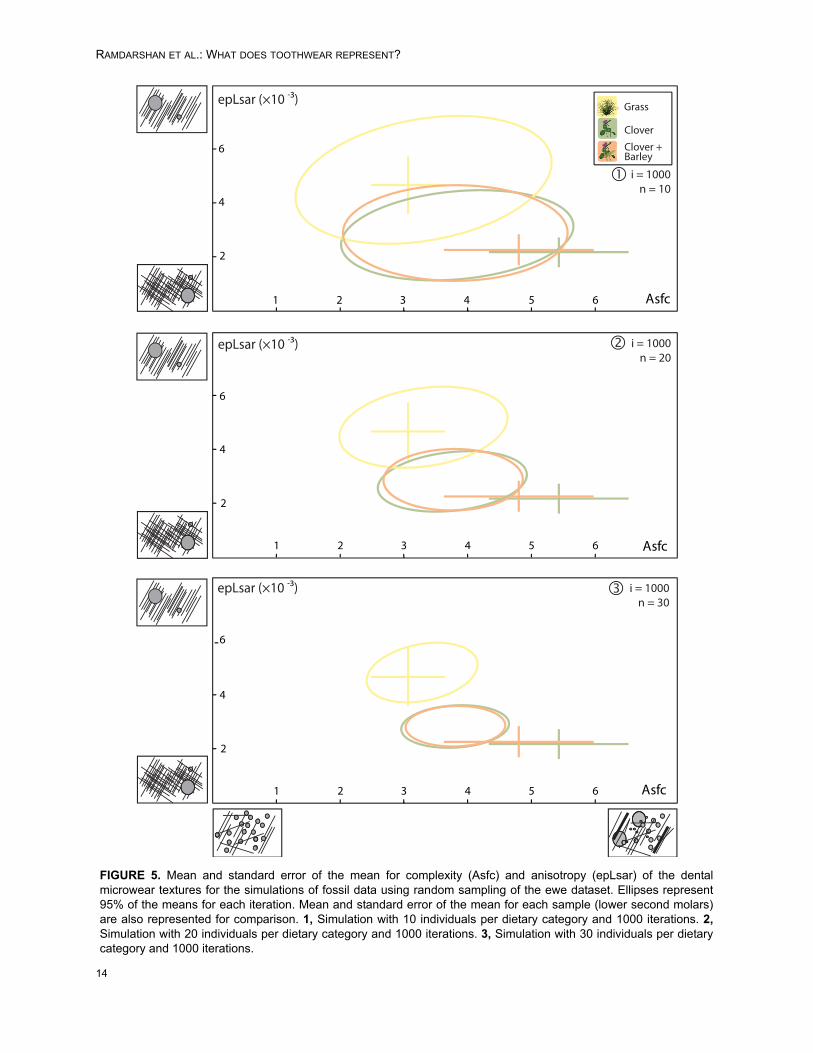
To test this hypothesis, we simulated fossilsamples using a random sampling (see Materialand Methods; Appendix 4). Results for the simula-tion of a fossil sample are summarized in Table 11and Figure 5. These results are detailed in Appen-dices 5-10. Complexity (Asfc) and anisotropy (epL-sar) for each dietary group and for each iterationare presented in Appendices 5-7. The frequencywith which significant differences are highlightedvary according to the number of simulated individu-
als per group. When considering n = 10, significantdifferences are highlighted in only 7.1% (Asfc) and25.6% (epLsar) of the 1000 iterations. Frequenciesare higher when considering 20 individuals pergroup (8.7% and 46.6%, respectively) and highestwhen considering 30 individuals per group (10%and 72.1%, respectively).
Our results suggest that combining dentalmicrowear textures on disto-labial facets on proto-conid of first, second, and third lower molarstogether with the textural parameters from themesio-lingual facets on upper molars increases thesample variance to the point of hiding any differ-ences between dietary categories. Numerous stud-ies base their microwear results on data includingsignificant amount of isolated, determined, orundetermined teeth, jumbled together to maximizesample size (Ungar et al., 2007; Merceron et al.,2012; Tütken et al., 2013). Our results indicate thatthis practice does not help gain statistical strength.
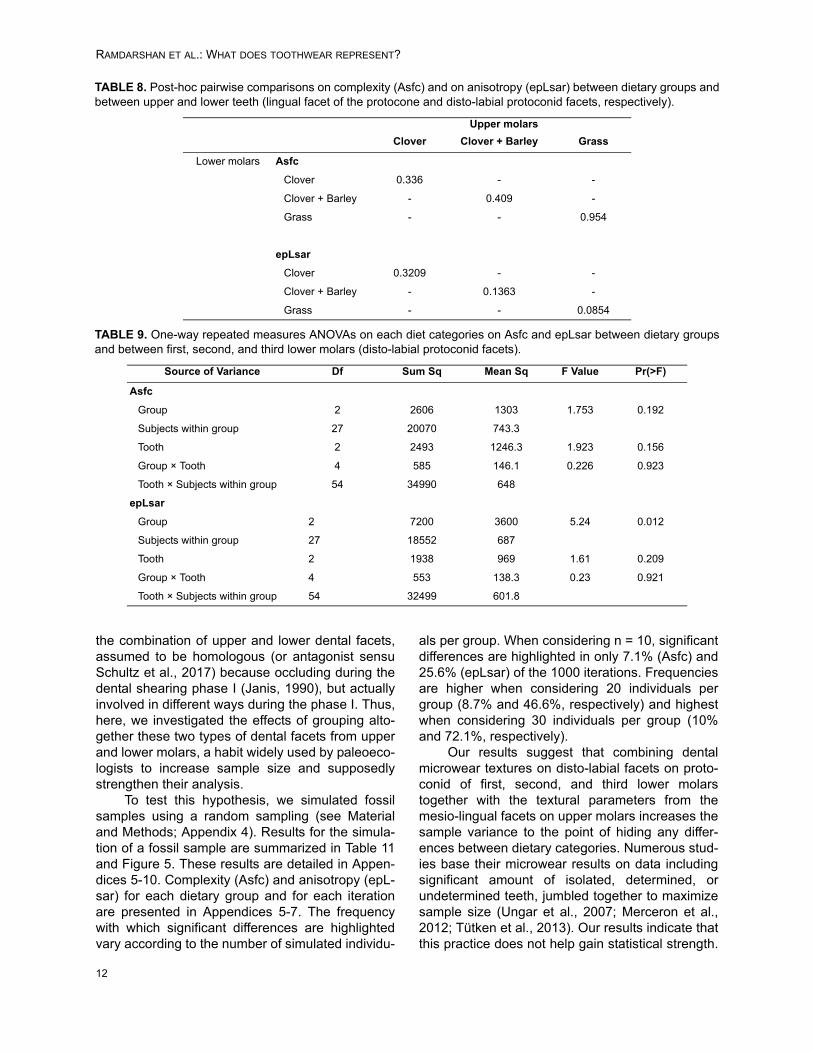
TABLE 8. Post-hoc pairwise comparisons on complexity (Asfc) and on anisotropy (epLsar) between dietary groups andbetween upper and lower teeth (lingual facet of the protocone and disto-labial protoconid facets, respectively).
TABLE 9. One-way repeated measures ANOVAs on each diet categories on Asfc and epLsar between dietary groupsand between first, second, and third lower molars (disto-labial protoconid facets).
Upper molars
Clover Clover + Barley Grass
Lower molars Asfc
Clover 0.336 - -
Clover + Barley - 0.409 -
Grass - - 0.954
epLsar
Clover 0.3209 - -
Clover + Barley - 0.1363 -
Grass - - 0.0854
Source of Variance Df Sum Sq Mean Sq F Value Pr(>F)
Asfc
Group 2 2606 1303 1.753 0.192
Subjects within group 27 20070 743.3
Tooth 2 2493 1246.3 1.923 0.156
Group × Tooth 4 585 146.1 0.226 0.923
Tooth × Subjects within group 54 34990 648
epLsar
Group 2 7200 3600 5.24 0.012
Subjects within group 27 18552 687
Tooth 2 1938 969 1.61 0.209
Group × Tooth 4 553 138.3 0.23 0.921
Tooth × Subjects within group 54 32499 601.8
12
PALAEO-ELECTRONICA.ORG
13
Asfc
epLsar (×10 -3)
3.0
6.0
3.0 4.0 5.0
lm1
lm3
Grass
Clover
Clover + Barley
lm2
FIGURE 4. Mean and standard error of the mean for complexity (Asfc) and anisotropy (epLsar) of the dentalmicrowear textures for each ewe sample and for each molar of the tooth row.
TABLE 10. Post-hoc pairwise comparisons on anisotropy (epLsar) between dietary groups and between first, second,and third lower molars (disto-labial protoconid facets). Results for complexity (Asfc) are not shown here as the one-wayrepeated measures ANOVAs did not yield significant p-values.
TABLE 11. Summary of the ANOVA results carried out on 1000 iterations. Results reported as the frequency of signifi-cant differences in complexity (Asfc) and anisotropy (epLsar) over 1000 iterations when comparing the three simulatedgroups (based on grass, clover, and clover/barley-fed ewes, respectively) for samples comprised of 10, 20, or 30 val-ues per samples.
Clover Clover + Barley Grass
lm1 lm2 lm3 lm1 lm2 lm3 lm1 lm2
Clover lm2 0.395 - - - - - - -
lm3 0.384 0.948 - - - - - -
Clover + Barley
lm1 0.716 - - - - - - -
lm2 - 0.706 - 0.155 - - - -
lm3 - - 0.769 0.900 0.563 - - -
Grass lm1 0.051 - - 0.002 - - - -
lm2 - 0.038 - - 0.031 - 0.157 -
lm3 - - 0.220 - - 0.504 0.236 0.784
Frequency (Pval < 0.05)
Simulation Asfc epLsar
n = 10 7.1% 25.6%
n = 20 8.7% 46.6%
n =30 10.0% 72.1%
RAMDARSHAN ET AL.: WHAT DOES TOOTHWEAR REPRESENT?
14
1 2 3 4 5 6
Grass
Clover
Clover + Barley
2
4
6
1 2 3 4 5 6
2
4
6
1 2 3 4 5 6 Asfc
2
4
6
i = 1000n = 10
i = 1000n = 20
i = 1000n = 30
Asfc
Asfc
epLsar (×10 -3)
epLsar (×10 -3)
epLsar (×10 -3)
�
�
�
FIGURE 5. Mean and standard error of the mean for complexity (Asfc) and anisotropy (epLsar) of the dentalmicrowear textures for the simulations of fossil data using random sampling of the ewe dataset. Ellipses represent95% of the means for each iteration. Mean and standard error of the mean for each sample (lower second molars)are also represented for comparison. 1, Simulation with 10 individuals per dietary category and 1000 iterations. 2,Simulation with 20 individuals per dietary category and 1000 iterations. 3, Simulation with 30 individuals per dietarycategory and 1000 iterations.
PALAEO-ELECTRONICA.ORG
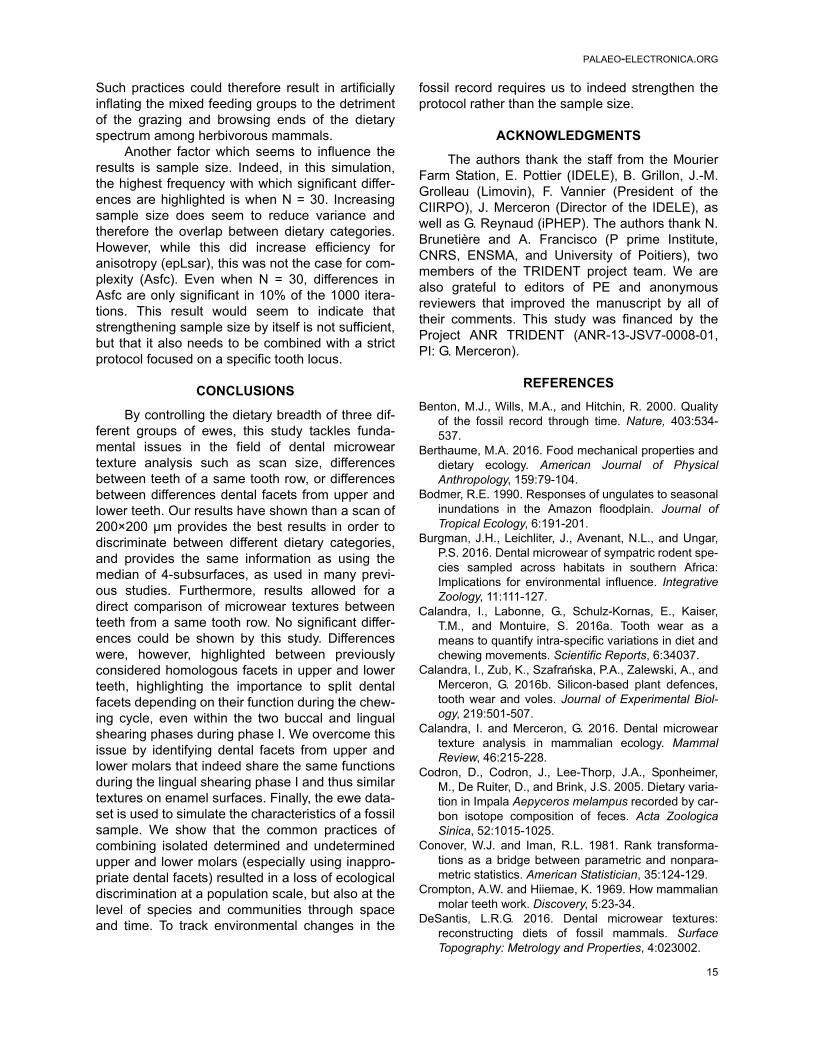
Such practices could therefore result in artificiallyinflating the mixed feeding groups to the detrimentof the grazing and browsing ends of the dietaryspectrum among herbivorous mammals.
Another factor which seems to influence theresults is sample size. Indeed, in this simulation,the highest frequency with which significant differ-ences are highlighted is when N = 30. Increasingsample size does seem to reduce variance andtherefore the overlap between dietary categories.However, while this did increase efficiency foranisotropy (epLsar), this was not the case for com-plexity (Asfc). Even when N = 30, differences inAsfc are only significant in 10% of the 1000 itera-tions. This result would seem to indicate thatstrengthening sample size by itself is not sufficient,but that it also needs to be combined with a strictprotocol focused on a specific tooth locus.
CONCLUSIONS
By controlling the dietary breadth of three dif-ferent groups of ewes, this study tackles funda-mental issues in the field of dental microweartexture analysis such as scan size, differencesbetween teeth of a same tooth row, or differencesbetween differences dental facets from upper andlower teeth. Our results have shown than a scan of200×200 µm provides the best results in order todiscriminate between different dietary categories,and provides the same information as using themedian of 4-subsurfaces, as used in many previ-ous studies. Furthermore, results allowed for adirect comparison of microwear textures betweenteeth from a same tooth row. No significant differ-ences could be shown by this study. Differenceswere, however, highlighted between previouslyconsidered homologous facets in upper and lowerteeth, highlighting the importance to split dentalfacets depending on their function during the chew-ing cycle, even within the two buccal and lingualshearing phases during phase I. We overcome thisissue by identifying dental facets from upper andlower molars that indeed share the same functionsduring the lingual shearing phase I and thus similartextures on enamel surfaces. Finally, the ewe data-set is used to simulate the characteristics of a fossilsample. We show that the common practices ofcombining isolated determined and undeterminedupper and lower molars (especially using inappro-priate dental facets) resulted in a loss of ecologicaldiscrimination at a population scale, but also at thelevel of species and communities through spaceand time. To track environmental changes in the
fossil record requires us to indeed strengthen theprotocol rather than the sample size.
ACKNOWLEDGMENTS
The authors thank the staff from the MourierFarm Station, E. Pottier (IDELE), B. Grillon, J.-M.Grolleau (Limovin), F. Vannier (President of theCIIRPO), J. Merceron (Director of the IDELE), aswell as G. Reynaud (iPHEP). The authors thank N.Brunetière and A. Francisco (P prime Institute,CNRS, ENSMA, and University of Poitiers), twomembers of the TRIDENT project team. We arealso grateful to editors of PE and anonymousreviewers that improved the manuscript by all oftheir comments. This study was financed by theProject ANR TRIDENT (ANR-13-JSV7-0008-01,PI: G. Merceron).
REFERENCES
Benton, M.J., Wills, M.A., and Hitchin, R. 2000. Qualityof the fossil record through time. Nature, 403:534-537.
Berthaume, M.A. 2016. Food mechanical properties anddietary ecology. American Journal of PhysicalAnthropology, 159:79-104.
Bodmer, R.E. 1990. Responses of ungulates to seasonalinundations in the Amazon floodplain. Journal ofTropical Ecology, 6:191-201.
Burgman, J.H., Leichliter, J., Avenant, N.L., and Ungar,P.S. 2016. Dental microwear of sympatric rodent spe-cies sampled across habitats in southern Africa:Implications for environmental influence. IntegrativeZoology, 11:111-127.
Calandra, I., Labonne, G., Schulz-Kornas, E., Kaiser,T.M., and Montuire, S. 2016a. Tooth wear as ameans to quantify intra-specific variations in diet andchewing movements. Scientific Reports, 6:34037.
Calandra, I., Zub, K., Szafrańska, P.A., Zalewski, A., andMerceron, G. 2016b. Silicon-based plant defences,tooth wear and voles. Journal of Experimental Biol-ogy, 219:501-507.
Calandra, I. and Merceron, G. 2016. Dental microweartexture analysis in mammalian ecology. MammalReview, 46:215-228.
Codron, D., Codron, J., Lee-Thorp, J.A., Sponheimer,M., De Ruiter, D., and Brink, J.S. 2005. Dietary varia-tion in Impala Aepyceros melampus recorded by car-bon isotope composition of feces. Acta ZoologicaSinica, 52:1015-1025.
Conover, W.J. and Iman, R.L. 1981. Rank transforma-tions as a bridge between parametric and nonpara-metric statistics. American Statistician, 35:124-129.
Crompton, A.W. and Hiiemae, K. 1969. How mammalianmolar teeth work. Discovery, 5:23-34.
DeSantis, L.R.G. 2016. Dental microwear textures:reconstructing diets of fossil mammals. SurfaceTopography: Metrology and Properties, 4:023002.
15
RAMDARSHAN ET AL.: WHAT DOES TOOTHWEAR REPRESENT?
Foote, M. and Sepkoski, J.J. 1999. Absolute measuresof the completeness of the fossil record. Nature,398:415-417.
Fortelius, M. 1985. Ungulate cheek teeth: Developmen-tal, functional, and evolutionary interrelations. ActaZoologica Fennica, 180:1-76.
Gagnon, M. and Chew, A.E. 2000. Dietary preferences inextant African Bovidae. Journal of Mammalogy,8:490-511.
Galbany, J., Estebaranz, F., Martínez, L.M., Romero, A.,De Juan, J., Turbón, D., and Pérez-Pérez, A. 2006.Comparative analysis of dental enamel polyvinylsi-loxane impression and polyurethane casting meth-ods for SEM research. Microscopy Research andTechnique, 69:246-252.
García-González, R., Carretero, J.M., Richards, M.P.,Rodríguez, L., and Quam, R. 2015. Dietary infer-ences through dental microwear and isotope analy-ses of the Lower Magdalenian individual from ElMirón Cave (Cantabria, Spain). Journal of Archaeo-logical Science, 60:28-38.
Gill, P.G., Purnell, M.A., Crumpton, N., Brown, K.R.,Gostling, N.J., Stampanoni, M., and Rayfield, E.J.2014. Dietary specializations and diversity in feedingecology of the earliest stem mammals. Nature,512:303-305.
Goodall, R.H., Darras, L.P., and Purnell, M.A. 2015.Accuracy and precision of silicon based impressionmedia for quantitative areal texture analysis. Scien-tific Reports, 5:10800.
Hannig, M. and Balz, M. 1999. Influence of in vivoformed salivary pellicle on enamel erosion. CariesResearch, 33:372-379.
Janis, C.M. 1979. Mastication in the hyrax and its rele-vance to ungulate dental evolution. Paleobiology,5:50-59.
Janis, C.M. 1990. The correlation between diet and den-tal wear in herbivorous mammals, and its relationshipto the determination of diets of extinct species, p.241-259. In Boucot, A.J. (ed.), Evolutionary Paleobi-ology of Behavior and Coevolution. Elsevier, Amster-dam.
Kaiser, T.M., Müller, D.W.H., Fortelius, M., Schulz, E.,Codron, D., and Clauss, M. 2013. Hypsodonty andtooth facet development in relation to diet and habitatin herbivorous ungulates: Implications for under-standing tooth wear. Mammal Review, 43:34-46.
Le Fur, S., Fara, E., and Vignaud, P. 2011. Effect of sim-ulated faunal impoverishment and mixture on theecological structure of modern mammal faunas:Implications for the reconstruction of Mio-PlioceneAfrican palaeoenvironments. Palaeogeography,Palaeoclimatology, Palaeoecology, 305:295-309.
Lendenmann, U., Grogan, J., and Oppenheim, F.G.2000. Saliva and dental pellicle-a review. Advancesin Dental Research, 14:22-28.
Lucas, P.W. 2004. Dental Functional Morphology: HowTeeth Work. Cambridge University Press, Cam-bridge.
Merceron, G., Blondel, C., Bonis, L. de, Koufos, G.D.,and Viriot, L. 2005a. A new dental microwear analy-sis: application to extant Primates and Ouranopithe-cus macedoniensis (Late Miocene of Greece).Palaios, 20:551-561.
Merceron, G., Bonis, L. de, Viriot, L., and Blondel, C.2005b. Dental microwear of the Late Miocene bovidsof Northern Greece: The Vallesian/Turolian environ-mental changes as explanation of the disappearanceof Ouranopithecus macedoniensis ? Bulletin de laSociété Géologique de France, 176:475-484.
Merceron, G., Costeur, L., Maridet, O., Ramdarshan, A.,and Göhlich, U.B. 2012. Multi-proxy approachdetects heterogeneous habitats for primates duringthe Miocene climatic optimum in Central Europe.Journal of Human Evolution, 63:150-161.
Merceron, G., Hofman-Kamińska, E., and Kowalczyk, R.2014. 3D dental microwear texture analysis of feed-ing habits of sympatric ruminants in the BiałowieżaPrimeval Forest, Poland. Forest Ecology and Man-agement, 328:262-269.
Merceron, G., Ramdarshan, A., Blondel, C., Boisserie,J.-R., Brunetiere, N., Francisco, A., Gautier, D., Mil-het, X., Novello, A., and Pret, D. 2016. Untangling theenvironmental from the dietary: Dust does not matter.Proceeding Royal Society of London, series B,283:20161032.
Oliver Pérez, A., Hernández Vallarín, V., López Guer-rero, P., García Paredes, I., Álvarez Sierra, M.Á.,Gómez Cano, A.R., García Yelo, A.B., AlcaldeRincón, G.M., and Peláez-Campomanes de Labra, P.2014. Dental microwear analysis in Gliridae (Roden-tia): Methodological issues and paleodiet inferencesbased on Armantomys from the Madrid Basin(Spain). Journal of Iberian Geology, 40:157-166.
Pérez-Barbería, F.J. and Gordon, I.J. 1998. Factorsaffecting food comminution during chewing in rumi-nants: A review. Biological Journal of the LinneanSociety, 63:233-256.
Pérez-Barbería, F.J. and Gordon, I.J. 1999. The func-tional relationship between feeding type and jaw andcranial morphology in ungulates. Oecologia,118:157-165.
Purnell, M.A., Bell, M.A., Baines, D.C., Hart, P.J.B., andTravis, M.P. 2007. Correlated evolution and dietarychange in fossil Stickleback. Science, 317:1887.
Radinsky, L. 1985. Patterns in the evolution of ungulatejaw shape. American Zoologist, 25:303-314.
Ramdarshan, A., Blondel, C., Brunetière, N., Francisco,A., Gautier, D., Surault, J., and Merceron, G. 2016.Seeds, browse, and tooth wear: A sheep perspec-tive. Ecology and Evolution, 6:5559-5569.
Reilly, S.M., McBrayer, L.D., and White, T.D. 2001. Preyprocessing in amniotes: Biomechanical and behav-ioral patterns of food reduction. Comparative Bio-chemistry and Physiology Part A: Molecular &Integrative Physiology, 128:397-415.
Rivals, F., Prignano, L., Semprebon, G.M., and Lozano,S. 2015. A tool for determining duration of mortality
16

PALAEO-ELECTRONICA.ORG
events in archaeological assemblages using extantungulate microwear. Scientific Reports, 5:17330.
Schultz, J.A., Menz, U., Winkler, D.E., Schulz-Kornas,E., Engels, S., Kalthoff, D.C., von Koenigswald, W.,Ruf, I., Kaiser, T.M., Kullmer, O., and others. 2017.Modular wear facet nomenclature for mammalianpost-canine dentitions. Historical Biology, 1-12.
Schulz, E., Calandra, I., and Kaiser, T.M. 2010. ApplyingTribology to Teeth of Hoofed Mammals. Scanning,32:162-182.
Schulz, E., Piotrowski, V., Clauss, M., Mau, M., Merce-ron, G., and Kaiser, T.M. 2013. Dietary abrasivenessis associated with variability of microwear and dentalsurface texture in rabbits. PLoS ONE, 8:e56167.
Scott, J.R. 2012. Dental microwear texture analysis ofextant African Bovidae. Mammalia, 76:157-174.
Scott, R.S., Teaford, M.F., and Ungar, P.S. 2012. Dentalmicrowear texture and anthropoid diets. AmericanJournal of Physical Anthropology, 147:551-579.
Scott, R.S., Ungar, P., Bergstrom, T.S., Brown, C.A.,Childs, B.E., Teaford, M.F., and Walker, A. 2006.Dental microwear texture analysis: Technical consid-erations. Journal of Human Evolution, 51:339-349.
Scott, R.S., Ungar, P.S., Bergstrom, T.S., Brown, C.A.,Grine, F.E., Teaford, M.F., and Walker, A. 2005. Den-tal microwear texture analysis shows within-speciesdiet variability in fossil hominins. Nature, 436:693-695.
Semprebon, G.M., Godfrey, L.R., Solounias, N., Suther-land, M.R., and Jungers, W.L. 2004. Can low-magni-fication stereomicroscopy reveal diet? Journal ofHuman Evolution, 47:115-144.
Storms, D., Aubry, P., Hamann, J.-L., Saïd, S., Fritz, H.,Saint-Andrieux, C., and Klein, F. 2008. Seasonal vari-ation in diet composition and similarity of sympatricred deer Cervus elaphus and roe deer Capreoluscapreolus. Wildlife Biology, 14:237-250.
Taylor, L.A., Kaiser, T.M., Schwitzer, C., Müller, D.W.,Codron, D., Clauss, M., and Schulz, E. 2013. Detect-
ing inter-cusp and inter-tooth wear patterns in rhinoc-erotids. PLoS ONE, 8:e80921.
Taylor, L.A., Müller, D.W.H., Schwitzer, C., Kaiser, T.M.,Castell, J.C., Clauss, M., and Schulz-Kornas, E.2016. Comparative analyses of tooth wear in free-ranging and captive wild equids. Equine VeterinaryJournal, 48:240-245.
Thiery, G., Guy, F., and Lazzari, V. 2017. Investigatingthe dental toolkit of primates based on food mechani-cal properties: Feeding action does matter. AmericanJournal of Primatology, 79: e22640
Tütken, T., Kaiser, T.M., Vennemann, T., and Merceron,G. 2013. Opportunistic feeding strategy for the earli-est old world hypsodont equids: Evidence from stableisotope and dental wear proxies. PLoS ONE,8:e74463.
Ungar, P.S. 2015. Mammalian dental function and wear:A review. Biosurface and Biotribology, 1:25-41.
Ungar, P.S., Scott, J.R., and Steininger, C.M. 2016. Den-tal microwear differences between eastern andsouthern African fossil bovids and hominins. SouthAfrican Journal of Science, 112:1-5.
Ungar, P.S., Merceron, G., and Scott, R.S. 2007. Dentalmicrowear texture analysis of Varswater bovids andearly Pliocene paleoenvironments of Langebaanweg,Western Cape Province, South Africa. Journal ofMammalian Evolution, 14:163-181.
von Koenigswald, W., Anders, U., Engels, S., Schultz,J.A., and Kullmer, O. 2013. Jaw movement in fossilmammals: Analysis, description and visualization.Paläontologische Zeitschrift, 87:141-159.
Wetton, S., Hughes, J., West, N., and Addy, M. 2006.Exposure time of enamel and dentine to saliva forprotection against erosion: A study in vitro. CariesResearch, 40:213-217.
Withnell, C.B. and Ungar, P.S. 2014. A preliminary analy-sis of dental microwear as a proxy for diet and habitatin shrews. Mammalia, 78:409-415.
17
RAMDARSHAN ET AL.: WHAT DOES TOOTHWEAR REPRESENT?
APPENDIX 1.
Anisotropy and complexity for each ewe and for each case study. See palaeo-electronica.org/content/2017/2042-what-does-toothwear-represent for zipped PDF of Appendices.
APPENDIX 2.
Two-way repeated measures ANOVA on Asfc and epLsar between dietary groups and betweendifferent positions on the shearing facet. Significant p-values are highlighted in bold. See palaeo-electronica.org/content/2017/2042-what-does-toothwear-represent for zipped PDF of Appendi-ces.
APPENDIX 3.
Two-way repeated measures ANOVA on Asfc and epLsar between dietary groups and betweendifferent positions on the shearing facet. Significant p-values are highlighted in bold. See palaeo-electronica.org/content/2017/2042-what-does-toothwear-represent for zipped PDF of Appendi-ces.
APPENDIX 4.
Example of a randomized dataset simulating a fossil sample for which all molar positions areconsidered. Complexity (Asfc) and anisotropy (epLsar) are measured on disto-labial protoconidfacets on lower molars and mesiolingual paracone facets on upper molars. See palaeo-electron-ica.org/content/2017/2042-what-does-toothwear-represent for zipped PDF of Appendices.
APPENDIX 5.
Means of complexity (Asfc) and anisotropy (epLsar) for the three simulated dietary groups (withn = 10) for each of 1000 iterations (see material and methods for details). See palaeo-electron-ica.org/content/2017/2042-what-does-toothwear-represent for zipped PDF of Appendices.
APPENDIX 6.
Means of complexity (Asfc) and anisotropy (epLsar) for the three simulated dietary groups (withn = 20) for each of 1000 iterations (see material and methods for details). See palaeo-electron-ica.org/content/2017/2042-what-does-toothwear-represent for zipped PDF of Appendices.
APPENDIX 7.
Means of complexity (Asfc) and anisotropy (epLsar) for the three simulated dietary groups (withn = 30) for each of 1000 iterations (see Material and Methods for details). See palaeo-electron-ica.org/content/2017/2042-what-does-toothwear-represent for zipped PDF of Appendices.
APPENDIX 8.
Differences between the three dietary groups for each of the 1000 iterations and for N = 10 areexplored through ANOVAs after rank transformation of the data. See palaeo-electronica.org/con-tent/2017/2042-what-does-toothwear-represent for zipped PDF of Appendices.
18
PALAEO-ELECTRONICA.ORG
APPENDIX 9.
Differences between the three dietary groups for each of the 1000 iterations and for N = 20 areexplored through ANOVAs after rank transformation of the data. See palaeo-electronica.org/con-tent/2017/2042-what-does-toothwear-represent for zipped PDF of Appendices.
APPENDIX 10.
Differences between the three dietary groups for each of the 1000 iterations and for N = 30 areexplored through ANOVAs after rank transformation of the data. See palaeo-electronica.org/con-tent/2017/2042-what-does-toothwear-represent for zipped PDF of Appendices.
19