Embed Size (px)
Citation preview
OVERCOMINGCHALLENGES
ANNUAL REPORT 2016
EZ
ION
HO
LDIN
GS
LIMIT
ED
AN
NU
AL R
EP
OR
T 2
01
6

2
EZION HOLDINGS LIMITED

001
ANNUAL REPORT 2016
004CORPORATE PROFILE
008FINANCIAL HIGHLIGHTS
010LETTER TO SHAREHOLDERS
014BOARD OF DIRECTORS
018KEY EXECUTIVES
022OPERATIONS REVIEW
030CORPORATE STRUCTURE
032CORPORATE INFORMATION
034CORPORATE GOVERNANCE AND
FINANCIAL CONTENTS
CONTENTS
OVERCOMING CHALLENGES
002
EZION HOLDINGS LIMITED

003
ANNUAL REPORT 2016

004
EZION HOLDINGS LIMITED
CORPORATE PROFILE
A LEADER IN THE DEVELOPMENT,OWNERSHIP AND CHARTERING OFSTRATEGIC OFFSHORE ASSETS
CO
RP
OR
AT
E P
RO
FIL
E
005
ANNUAL REPORT 2016
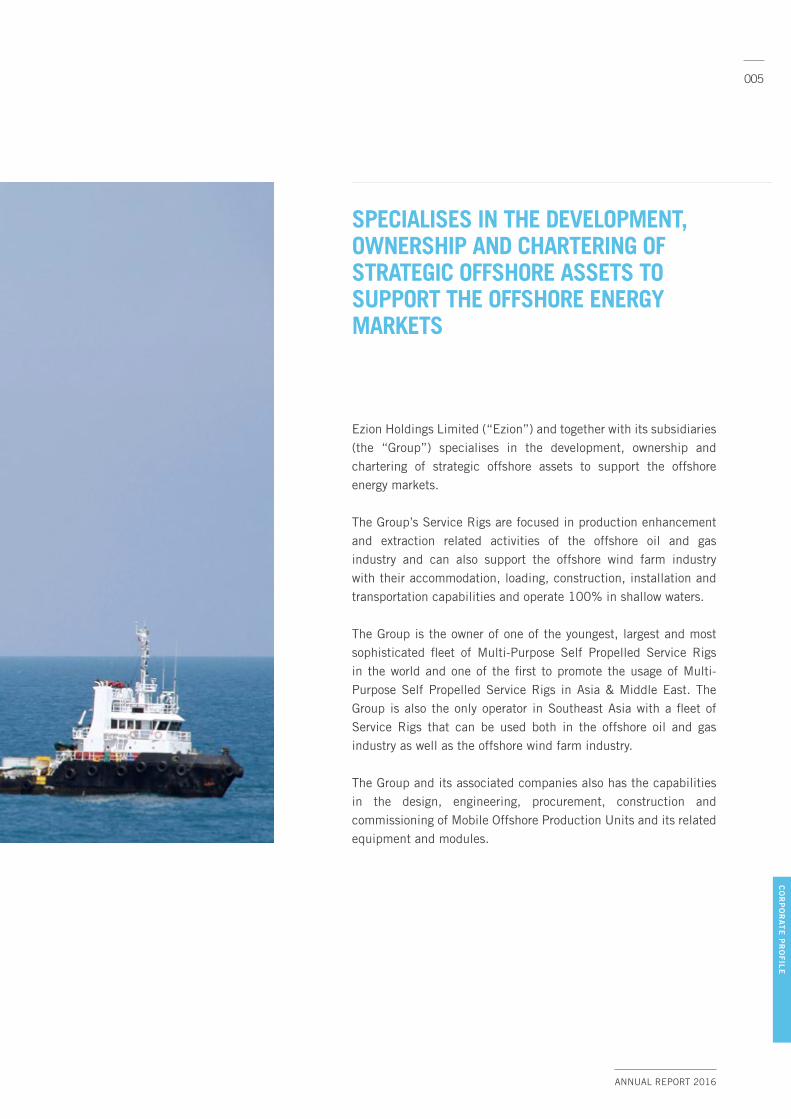
Ezion Holdings Limited (“Ezion”) and together with its subsidiaries (the “Group”) specialises in the development, ownership and chartering of strategic offshore assets to support the offshore energy markets.
The Group’s Service Rigs are focused in production enhancement and extraction related activities of the offshore oil and gas industry and can also support the offshore wind farm industry with their accommodation, loading, construction, installation and transportation capabilities and operate 100% in shallow waters.
The Group is the owner of one of the youngest, largest and most sophisticated fleet of Multi-Purpose Self Propelled Service Rigs in the world and one of the first to promote the usage of Multi-Purpose Self Propelled Service Rigs in Asia & Middle East. The Group is also the only operator in Southeast Asia with a fleet of Service Rigs that can be used both in the offshore oil and gas industry as well as the offshore wind farm industry.
The Group and its associated companies also has the capabilities in the design, engineering, procurement, construction and commissioning of Mobile Offshore Production Units and its related equipment and modules.
CO
RP
OR
AT
E P
RO
FIL
E
SPECIALISES IN THE DEVELOPMENT, OWNERSHIP AND CHARTERING OF STRATEGIC OFFSHORE ASSETS TO SUPPORT THE OFFSHORE ENERGY MARKETS

006
EZION HOLDINGS LIMITED

007
ANNUAL REPORT 2016

008
EZION HOLDINGS LIMITED
SHAREHOLDERS’ FUND (US$’000)
FINANCIAL HIGHLIGHTS
FIN
AN
CIA
L H
IGH
LIG
HT
S
REVENUE (US$’000) $318.25M
318,245
351,147
386,512
281,924
158,669
2016
2015
2014
2013
2012
NET (LOSS)/PROFIT (US$’000) ($33.6M)
(33,606)
36,784
223,734
160,328
78,841
2016
2015
2014
2013
2012
$1,315.4M1,315,384
1,241,310
1,312,621
800,248
552,849
2016
2015
2014
2013
2012
EARNINGS PER SHARE (US Cents / Share) (2.30¢)
(2.30)
1.51*
15.66*
12.80*
6.33*
2016
2015
2014
2013
2012
NET ASSET VALUE (US Cents / Share) 63.43¢
63.43
77.50*
81.93*
55.45*
41.57*
2016
2015
2014
2013
2012

009
ANNUAL REPORT 2016
2016
US$’000
2015
US$’000
2014
US$’000
2013
US$’000
2012
US$’000
Revenue 318,245 351,147 386,512 281,924 158,669
(Loss)/Profit Before Tax (30,924) 38,365 225,763 162,968 82,768
Net (Loss)/Profit (33,606) 36,784 223,734 160,328 78,841
KEY FINANCIAL POSITION INDICATORS
Shareholders’ Fund 1,315,384 1,241,310 1,312,621 800,248 552,849
Total Assets 3,001,710 3,108,402 2,980,971 2,043,078 1,198,005
Total Liabilities 1,686,326 1,867,092 1,668,350 1,242,830 645,156
PERFORMANCE INDICATORS
Earnings Per Share (cents/share) (2.30) 1.51* 15.66* 12.80* 6.33*
Net Asset Value (cents/share) 63.43 77.50* 81.93* 55.45* 41.57*
FINANCIAL RATIOS
ROE (%) (2.63) 2.88 21.18 23.70 19.20
ROA (%) (1.10) 1.21 8.91 9.89 9.45
Current Ratio (times) 1.11 1.01 1.54 1.01 1.72
Net Gearing (times) 0.98 1.14 0.86 1.15 0.76
* Restated due to retrospective adjustments for issuance of Rights Issue.
FIN
AN
CIA
L H
IGH
LIG
HT
S

010
EZION HOLDINGS LIMITED
LETTER TO SHAREHOLDERS
TO ALL OUR VALUED SHAREHOLDERS
Grace and peace to all.
On behalf of the Board of Directors, we are pleased to present to you the annual report for Ezion Holdings Limited (the “Company”) in respect of the financial year ended 31 December 2016 (“FY2016”).
WEATHERING THE STORM There has not been a significant improvement in the overall operating environment even though fuel prices have improved over the last few months and Brent Crude, for example, has stayed above US$50 per barrel since late 2016. The stability in prices has helped Exploration & Production companies broadly but there appears to be no significant adjustment yet to the corresponding operating budget of these companies. Against this backdrop, we expect the headwind to persist for the large part of FY2017 for companies that are mainly involved in the provision of assets and services to the offshore oil and gas industry such as ours. Across the industry, asset and service providers continue to suffer from slow payments from clients on the one hand, and obtaining acceptable credit terms from their respective suppliers on the other.
The revenue of the Company and its subsidiaries (the “Group”) for FY2016 decreased by 9.4% to US$318.2 million. The Group made impairment losses on plant and equipment and provision for trade receivables of US$70.9 million, bringing accumulated impairment losses since FY2015 to US$152.0 million. In addition, the Group also registered a loss of US$2.0 million due to the results of associates and jointly controlled entities mainly for provisions taken during the year by these companies. As a result, we incurred a loss of US$33.6 million for full year 2016. The Group generated US$148.6 million of operating cash flows during the year. The current shareholder’s fund as at the end of FY2016 was US$1.32 billion.
LE
TT
ER
TO
SH
AR
EH
OL
DE
RS

011
THE COST CUTTING MEASURES THAT WE HAVE IMPLEMENTED ACROSS THE ENTIRE GROUP SOME TIME AGO AND THE COST STRUCTURES WITHIN THE GROUP ARE CONSTANTLY BEING MONITORED TO MAINTAIN OUR COMPETITIVENESS.
LE
TT
ER
TO
SH
AR
EH
OL
DE
RS
Left:
DR WANG KAI YUENChairman
Right:
MR CHEW THIAM KENGChief Executive Officer
ANNUAL REPORT 2016

012
EZION HOLDINGS LIMITED
SECURING THE SHIPIn the third quarter of 2016, with the support of DBS Bank Limited, Maybank Kim Eng Securities Pte. Ltd. and United Overseas Bank Limited, the Group successfully completed a rights issue of 478,576,422 new ordinary shares in the capital of the Company (the “Rights Issue”). The proceeds from the Rights Issue strengthened our Balance Sheet by US$99.8 million, and facilitated the Group in its efforts to fit out and re-purpose our fleet to enhance their operational flexibility to cater for different contracts going forward, thus providing greater resilience for the Group under different market conditions. With the support of all our bankers, the Group was able to reduce its net annual principal repayment to match the Group’s operating cash flows. In addition, the Group has also successfully renewed its working capital facilities with all its principal bankers.
We have also reviewed our financial position and decided that it is in the best interest of the Group to indefinitely postpone the delivery of 4 units of Service Rigs amidst the continued challenges faced by the industry as well as our clients.
The cost cutting measures that we have implemented across the entire Group some time ago and the cost structures within the Group are constantly being monitored to maintain our competitiveness.
STAYING THE COURSEThe Group continues to focus on its strategies outlined in 2015, whilst constantly developing its key business areas in support of customers in the Oil and Gas industry. In respect of the offshore windfarm markets in China and Europe, we formally entered the China offshore wind farm market through the establishment of a joint venture company, Sinomarine & Teras (Tianjin) Offshore Co. Ltd., with Shanghai Changhang Shipping Co. Ltd. During the year, the Group successfully redeployed one of our Service Rigs to support the offshore wind farm activities in Europe. We will continue to explore opportunities in this new business segment and we expect at least two more units will be redeployed within this year into this industry with special focus on the offshore sector in China.
We have also set up a new joint venture company in Indonesia with a local partner to fortify our relationship with one of our existing clients through the provision of a new asset. We will continue to explore more tie ups and joint ventures with strategic partners to more efficiently meet the demands of our clients.
THE GROUP CONTINUES TO FOCUS ON ITS STRATEGIES OUTLINED IN 2015, WHILST CONSTANTLY DEVELOPING ITS KEY BUSINESS AREAS IN SUPPORT OF CUSTOMERS IN THE OIL AND GAS INDUSTRY.
LETTER TO SHAREHOLDERS
LE
TT
ER
TO
SH
AR
EH
OL
DE
RS
013
ANNUAL REPORT 2016
The Group is working closely with our bankers and several government agencies for the modification, upgrade and redeployment of our existing fleet of Service Rigs to support our customers in the Oil and Gas industry. We have secured new contracts in the Middle East and expect a few of our units to commence work there within 2Q-3Q FY2017. We are also in discussions with clients within South East Asia to modify our units to support their long term requirements, and these could potentially include the conversion and deployment of Mobile Offshore Production Units.
Most critically, the Group will be focusing on matching its cash flow with the capital expenditure that is required to fulfill its obligation to its customers. We continue to believe that a strong balance sheet and conservation of cash will best serve the interest of the Group and its shareholders, and as such have decided not to declare a dividend for FY2016.
APPRECIATIONWe thank you, God almighty, with all our hearts. We are eternally grateful for the peace and refuge that you have granted.
We are grateful to our fellow directors for their continued guidance and support. We are deeply appreciative of the pressures endured by the management and staff in these trying times as well as their unwavering hard work and dedication.
To our bankers, we thank you for standing by us amidst the challenges currently facing our industry and we are truly grateful.
To our business associates and partners, we hope to weather this storm together through closer collaboration and dialogue. We have confidence that with your support we will sail through the storm together.
We are also thankful for the Government’s various efforts and schemes in providing financial support and relief to companies in our industry, and in particular to International Enterprise Singapore for their continuous support.
Last but not least, to our dear shareholders, we thank you for your continuous support.
The grace of our Lord be with your spirit.
DR WANG KAI YUENChairman
MR CHEW THIAM KENGChief Executive Officer
LE
TT
ER
TO
SH
AR
EH
OL
DE
RS

014
EZION HOLDINGS LIMITED
BOARD OF DIRECTORS
BO
AR
D O
F D
IRE
CT
OR
S
Right:
DR WANG KAI YUEN
Left:
MR CHEW THIAM KENG

015
ANNUAL REPORT 2016
BO
AR
D O
F D
IRE
CT
OR
S
DR WANG KAI YUENIndependent Non-Executive Chairman
Dr Wang Kai Yuen was appointed the Independent Non-Executive Chairman on 5 January 2016. He has been an Independent Non-Executive Director since 28 July 2000 and was last re-elected on 27 April 2016. Dr Wang sits on the Board of COSCO Corporation (Singapore) Limited, ComfortDelGro Corporation Limited, China Aviation Oil (Singapore) Corporation Ltd, HLH Group Limited and Emas Offshore Limited, companies listed on the SGX-ST. He previously served as independent director of Superbowl Holdings Ltd, Matex International Limited and A-Sonic Aerospace Limited. Dr Wang retired from Fuji Xerox Singapore Software Centre in December 2009 as the Centre Manager. Dr Wang served as a Member of Parliament for the Bukit Timah Constituency from December 1984 till April 2006. He was the Chairman of Feedback unit from 2002 till his retirement from politics. Dr Wang graduated from the National University of Singapore with a Bachelor in Engineering (First Class Honours in Electrical and Electronics). He also holds a Master of Science in Industrial Engineering, a Master of Science in Electrical Engineering and a PhD in Engineering from Stanford University. He received a Friend of Labour Award in 1988 for his contributions to the Singapore labour movement.
MR CHEW THIAM KENGChief Executive Officer and Executive Director
Mr Chew Thiam Keng was appointed an Executive Director on 1 March 2007, and was appointed as the Chief Executive Officer on 1 June in the same year. He was last re-elected as a Director on 22 April 2015. Mr Chew is responsible for the Group’s operations, strategic planning, corporate management and business development. Before joining the Group, Mr Chew was the Managing Director/CEO of KS Energy Services Limited for about 5 years and was an Executive Director of Kian Ann Engineering Ltd. between 1996 and November 2001. Before that, Mr Chew was with the Development Bank of Singapore Limited for nine years working in the areas of banking such as corporate finance and retail banking. Mr Chew holds a Master Degree in Business Administration from the University of Hull and a Bachelor Degree (Honours) in Mechanical Engineering from the National University of Singapore. Mr Chew is currently a non-executive and/or independent director of Charisma Energy Services Limited and Pharmesis International Limited, companies listed on the SGX-ST. He previously served as independent director of Multi-Chem Limited.

016
BO
AR
D O
F D
IRE
CT
OR
S
BOARD OF DIRECTORS
From left to right:
Mr Lim Thean Ee, Mr Tan Woon Hum, Mr Yee Chia Hsing

017
ANNUAL REPORT 2016
BO
AR
D O
F D
IRE
CT
OR
S
MR LIM THEAN EEIndependent Non-Executive Director
Mr Lim Thean Ee is an Independent Non-Executive Director appointed on 28 July 2000 and was last re-elected on 25 April 2013. He has been appointed the Chairman of the Remuneration Committee with effect from 18 July 2008 and is a member of both the Audit and Nominating Committees. Mr Lim participates actively in community work. He is Chairman of Telok Blangah Citizens’ Consultative Committee and Chairman of CCC’s Community Development & Welfare Fund Committee. In addition, he is also the Chairman of Depot Estate Businesses Association. In recognition of his contribution to the community, Mr Lim was conferred both the Public Service Medal and the Public Service Star Medal in 1998 and 2012 respectively. He currently serves as the Managing Director of Coastal Navigation Pte Ltd and has more than 30 years of experience in shipbuilding and ship repairing industry. He is an Associate Member of Society of Naval Architects and Marine Engineers, USA since year 1974. Mr Lim is currently an independent director of Miyoshi Limited, a company listed on the SGX-ST.
MR TAN WOON HUMIndependent Non-Executive Director
Mr Tan Woon Hum is an Independent Non-Executive Director appointed on 21 March 2007 and was last re-elected on 22 April 2015. He has been appointed the Chairman of the Audit Committee with effect from 5 January 2016 and is a member of both the Nominating and Remuneration Committees. Mr Tan is currently a partner of Shook Lin & Bok LLP, a Singapore law firm and has been with the firm since December 2003. He graduated from the National University of Singapore with a LLB (Honours) Degree in 1995 and was admitted as an Advocate and Solicitor of the Supreme Court of Singapore in 1996. Mr Tan obtained his MBA (Finance) from the University of Leicester in 2000. He has been in private legal practice since 1996 and specializes in trust, asset and wealth management. He advises on the establishment of traditional and alternative funds including related licences and exemptions for fund management companies, as well as the establishment and listing of REITS. Mr Tan is also an independent non-executive director of AP Oil International Limited, a company listed on the SGX-ST. He previously served as independent director of Yong Xin International Holdings Limited.
MR YEE CHIA HSINGIndependent Non-Executive Director
Mr Yee Chia Hsing is an Independent Non-Executive Director appointed on 5 January 2016 and was last re-elected on 27 April 2016. He has been appointed the Chairman of the Nominating Committee with effect from 5 January 2016 and is a member of both the Audit and Remuneration Committees. Mr Yee is currently Head, Catalist of CIMB Bank Berhad, Singapore Branch, a position he has held since early 2011. At CIMB Bank, he is responsible for the introduction, supervision and continuing sponsorship of Catalist companies on the SGX-ST. Mr Yee holds a Bachelor of Accountancy Degree (First Class Honours) from the Nanyang Technological University, Singapore. He currently sits on the audit committee of Ren Ci Hospital (a Singapore charity) and is an independent director of First Sponsor Group Limited, a company listed on the SGX-ST. Mr Yee is an elected Member of Parliament for Chua Chu Kang GRC.

018
EZION HOLDINGS LIMITED
KEY EXECUTIVES
KE
Y E
XE
CU
TIV
ES
MR LEE KON MENG, PETERChief Operating Officer
Mr Lee Kon Meng, Peter joined the Group in May 2010 and is responsible for developing and nurturing the Group’s core businesses and overseeing the group fleet operations. Mr Lee holds a Master Mariner Class 1 certification and he is a veteran of the merchant navy and offshore industry in related management oversight and responsibilities. Before joining the Group, Mr Lee served as a Director of POSH Semco Pte Ltd (joining from 1993 to May 2010), specialising in turnkey major transportation and FPSO towage, installation projects in the offshore oil and gas industry and salvage.
MR CHEAH BOON PINGroup Chief Financial Officer
Mr Cheah Boon Pin is responsible for all accounting, financial and taxation matters. He joined the Group in June 2007 bringing with him over 15 years of experience in auditing and commercial accounting. Before joining the Group, Mr Cheah had served in financial management positions in two Singapore Exchange Main Board listed companies. He holds an ACCA accounting qualification and is a member of the Institute of Singapore Chartered Accountants.
MR POH LEONG CHING, DAVIDChief Business Development Officer
Mr Poh Leong Ching, David is responsible for identifying, securing and managing relationships in new business areas in line with the strategic direction of the Group. He is also the country head of China and Mexico spearheading the Group’s foray in developing business opportunities in these countries. Under his credentials are over 20 years of experience in the sales and operations of vessels and cranes. Mr Poh was the Marketing Manager of Tiong Woon Marine Pte Ltd and Tat Hong Holdings Group before joining the Group.
MR TAN KIM KWANGGroup Human Resources Director
Mr Tan Kim Kwang joined the Group in January 2014 and is responsible for the human resources management for the Group. He was a Managing Director with the Government of Singapore Investment Corporate Pte Ltd (GIC) managing the global human resources and facilities function. He was with the GIC for 16 years. Prior to joining the GIC, Mr Tan was with the DBS Bank for seven years, working in the retail banking sector. Mr Tan holds a Bachelor Degree (1st Class Honours) in Mechanical Engineering from the National University of Singapore.
019
ANNUAL REPORT 2016
KE
Y E
XE
CU
TIV
ES
MR LAWRENCE CHANDirector, Corporate Development
Mr Lawrence Chan joined the Group in June 2015 and heads the corporate development as well as the legal departments of the Group. He was the deputy regional business head of an offshore and marine services company that was listed on the Australia Securities Exchange. Prior to that, he was in the Executive Chairman’s Office of Keppel Corporation Limited and held various portfolios such as corporate development and investments within the Keppel Group. Mr Chan holds a Master of Business Administration from Nanyang Technological University (2014) and BI Norwegian Business School (2012), and is an Advocate & Solicitor of the Supreme Court of Singapore and a Barrister-at-law of England & Wales (Middle Temple).
MR JULIEN CIGLARDirector, Fleet Services
Mr Julien Ciglar joined the Group in August 2014 to oversee Teras Fleet including Operations, HSE, Procurement, Crewing and Technical functions. Mr Ciglar has gained his experience through various positions (Rig Manager, Country Manager) held in North Sea and South East Asia with mainly Liftboats and Jack-ups operations. Mr Ciglar holds a Master in Economics.
MR YE MINDeputy Chief Information Officer
Mr Ye Min is responsible for providing vision and leadership in developing and implementing information technology initiatives that align with the business and operation needs of the Group. He joined the Group in April 2014, with over 20 years’ experience in Information Technology. Prior to this, Mr Ye served as General Manager, IT Services in a Singapore Exchange Main Board listed company managing the IT aspects of the operation.
MR ALAN CHONGHead, Corporate Finance
Mr Alan Chong joined the Group in February 2007 and is responsible for the debt and equity raising activities as well as the investor relations of the Group. Mr Chong is also in charge of the insurance requirements of the vessels and Service Rigs owned by the Group. He holds a Bachelor of Business (Honours) degree in Banking and Finance from the Nanyang Technological University, Singapore and has more than 10 years of experience in the offshore oil and gas industry whereby he started his career as a management trainee in a Singapore Exchange Main Board listed company.
MR DERRICK CHINGSenior Manager, Commercial
Mr Derrick Ching joined the Group in March 2008 and is responsible for marketing of the Group’s fleet of Jack-ups and vessels. Mr Ching has more than 10 years of experience in the oil and gas industry and has successfully completed several upgrading and refurbishment of offshore drilling rigs. On top of that, he is also experienced in heavy lift accommodation barges, seismic vessels and pipe layers.

020
EZION HOLDINGS LIMITED
KE
Y E
XE
CU
TIV
ES

021
ANNUAL REPORT 2016
KE
Y E
XE
CU
TIV
ES

022
EZION HOLDINGS LIMITED
OPERATIONS REVIEW
OP
ER
AT
ION
S R
EV
IEW
FINANCIAL HIGHLIGHTS
The Group’s revenue for FY2016 decreased by 9.4% to US$318.2 million. The decrease in revenue was mainly due to the reduction in charter rates and delay in the completion of the modifications and upgrade of the Group’s Service Rigs.
The cost of sales and servicing for FY2016 increased by 10.3% to US$257.0 million as compared to FY2015. The increase was due to the deployment of additional Service Rigs.
As a result of the above, the Group’s gross profit for FY2016 decreased by US$56.8 million (or 48.1%) to US$61.2 million as compared to FY2015.
The increase in other income in FY2016 as compared to FY2015 was mainly due to gain arising from the completion of the sale of assets held for sale during the year and unrealised foreign exchange gains on the Group’s Notes Payable.
The other operating expenses in FY2016 includes impairment losses on plant and equipment and provision for trade receivables amounting to approximately US$70.9 million, in addition to the impairment losses made in FY2015 of US$81.1 million bringing accumulated impairment losses for FY2016 and FY2015 to US$152.0 million. Impairment losses for FY2016 were made due to some of the projects that were committed at higher oil prices and the difficult and uncertain market conditions of the global oil and gas industry.
THE GROUP REVENUE FOR FY2016 DECREASED BY 9.4% TO US$318.2 MILLION. THE DECREASE IN REVENUE WAS MAINLY DUE TO THE REDUCTION IN CHARTER RATES AND DELAY IN THE COMPLETION OF THE MODIFICATIONS AND UPGRADE OF THE GROUP’S SERVICE RIGS.

023
ANNUAL REPORT 2016
OP
ER
AT
ION
S R
EV
IEW

024
EZION HOLDINGS LIMITED
OPERATIONS REVIEW
OP
ER
AT
ION
S R
EV
IEW
The increase in finance income in FY2016 as compared to FY2015 was mainly due to higher interest income from loans to Joint Ventures.
The increase in finance costs in FY2016 as compared to FY2015 was due mainly to additional interest expense for the financing of newly delivered Service Rigs.
The lower share of associates and jointly controlled entities’ results in FY2016 as compared to FY2015 was mainly due to the impairment losses on plant and equipment and trade receivables recognised by the Group’s Joint Ventures and Associates.
As a result of the above, the loss before income tax for FY2016 stands at US$30.9 million.
THE INCREASE IN FINANCE COSTS IN FY2016 AS COMPARED TO FY2015 WAS DUE MAINLY TO ADDITIONAL INTEREST EXPENSE FOR THE FINANCING OF NEWLY DELIVERED SERVICE RIGS.

025
ANNUAL REPORT 2016
OP
ER
AT
ION
S R
EV
IEW
Charter income derived from Singapore flagged vessels are exempted from tax under Section 13A of the Income Tax Act of Singapore. Current period income tax expense of US$2.7 million relates to the corporate tax expense and withholding tax expense incurred by vessels operating in certain overseas waters.
026
EZION HOLDINGS LIMITED
OPERATIONS REVIEW
OP
ER
AT
ION
S R
EV
IEW
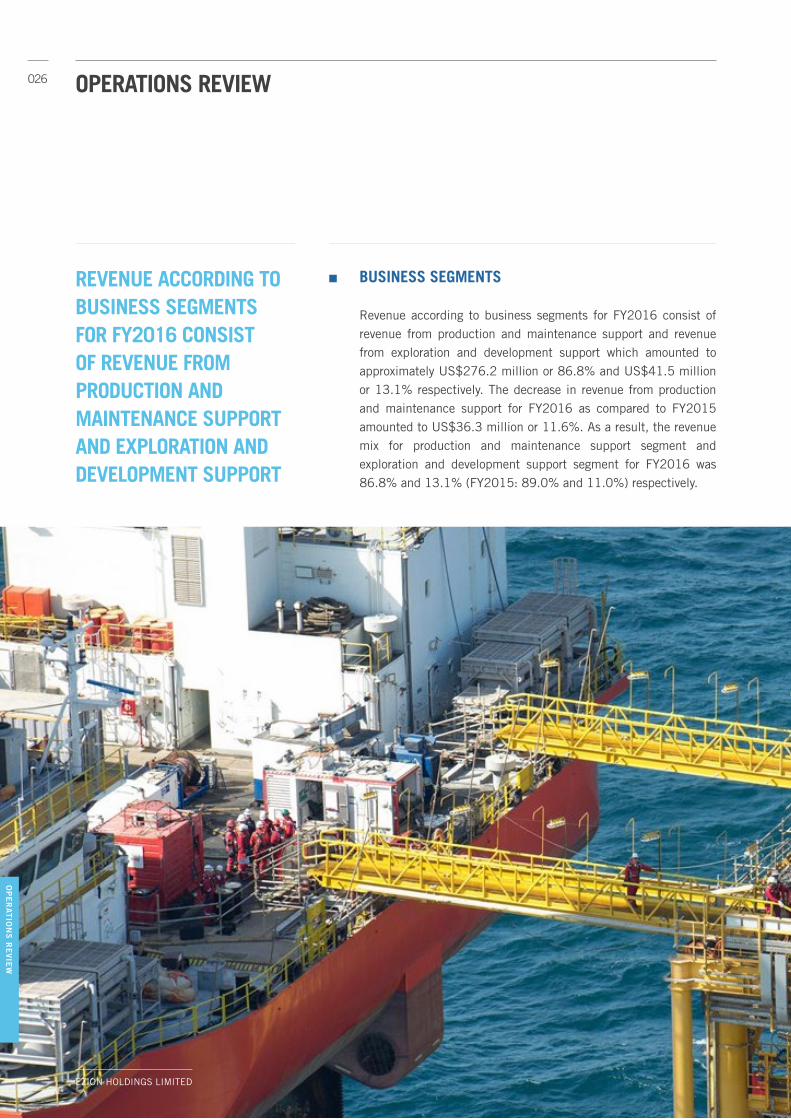
BUSINESS SEGMENTS
Revenue according to business segments for FY2016 consist of revenue from production and maintenance support and revenue from exploration and development support which amounted to approximately US$276.2 million or 86.8% and US$41.5 million or 13.1% respectively. The decrease in revenue from production and maintenance support for FY2016 as compared to FY2015 amounted to US$36.3 million or 11.6%. As a result, the revenue mix for production and maintenance support segment and exploration and development support segment for FY2016 was 86.8% and 13.1% (FY2015: 89.0% and 11.0%) respectively.
REVENUE ACCORDING TO BUSINESS SEGMENTS FOR FY2016 CONSIST OF REVENUE FROM PRODUCTION AND MAINTENANCE SUPPORT AND EXPLORATION AND DEVELOPMENT SUPPORT

027
ANNUAL REPORT 2016
OP
ER
AT
ION
S R
EV
IEW
GEOGRAPHICAL SEGMENTS
Our revenue contributions based on geographical segments for FY2016 were adequately diversified, reducing geographical market risk. In FY2016, revenue contributed by Singapore, Middle East, India, rest of Asia and Europe amounted to approximately US$50.0 million or 15.7%, US$95.1 million or 29.9%, US$48.5 million or 15.2%, US$77.7 million or 24.4% and US$30.4 million or 9.6%, respectively, of total revenue.
SINGAPORE, MIDDLE EAST, INDIA, REST OF ASIA AND EUROPE

028
EZION HOLDINGS LIMITED

029
ANNUAL REPORT 2016
030
EZION HOLDINGS LIMITED
CORPORATE STRUCTURE
CO
RP
OR
AT
E S
TR
UC
TU
RE
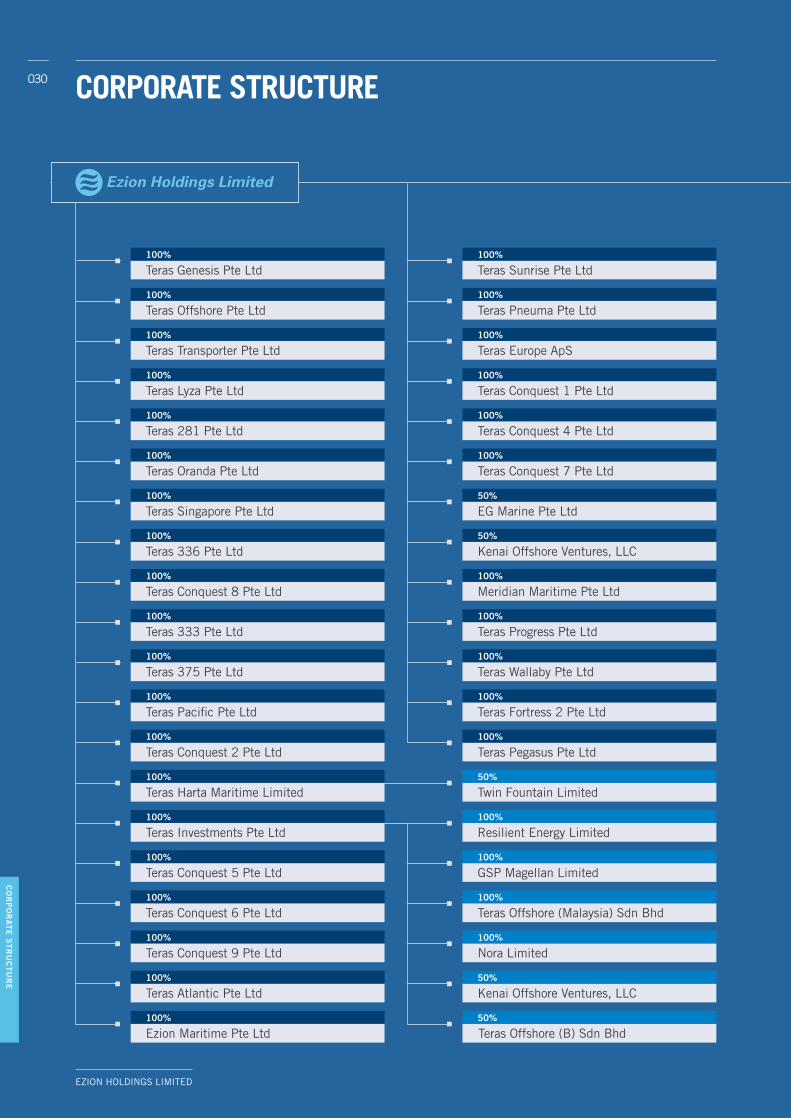
100% 100%
100% 100%
Teras Genesis Pte Ltd Teras Sunrise Pte Ltd
Teras Wallaby Pte Ltd
100% 100%
100% 100%
100% 100%
100% 100%
Teras Offshore Pte Ltd Teras Pneuma Pte Ltd
Teras Fortress 2 Pte Ltd
100% 100%
100% 100%
100% 100%
100% 100%
Teras Transporter Pte Ltd Teras Europe ApS
Teras Pegasus Pte Ltd
100% 100%
100% 50%
100% 100%
100% 50%
100% 50%
100% 100%
100% 50%
100% 100%
100% 100%
100% 50%
Teras Lyza Pte Ltd Teras Conquest 1 Pte Ltd
Twin Fountain Limited
Teras 281 Pte Ltd Teras Conquest 4 Pte Ltd
Resilient Energy Limited
Teras Oranda Pte Ltd Teras Conquest 7 Pte Ltd
GSP Magellan Limited
EG Marine Pte Ltd
Teras Offshore (Malaysia) Sdn Bhd
Kenai Offshore Ventures, LLC
Nora Limited
Meridian Maritime Pte Ltd
Kenai Offshore Ventures, LLC
Teras Progress Pte LtdTeras 333 Pte Ltd
Teras 375 Pte Ltd
Teras Pacific Pte Ltd
Teras Conquest 2 Pte Ltd
Teras Harta Maritime Limited
Teras Investments Pte Ltd
Teras Conquest 5 Pte Ltd
Teras Singapore Pte Ltd
Teras Conquest 6 Pte Ltd
Teras 336 Pte Ltd
Teras Conquest 9 Pte Ltd
Teras Conquest 8 Pte Ltd
Teras Atlantic Pte Ltd
Teras Offshore (B) Sdn BhdEzion Maritime Pte Ltd
031
ANNUAL REPORT 2016
CO
RP
OR
AT
E S
TR
UC
TU
RE
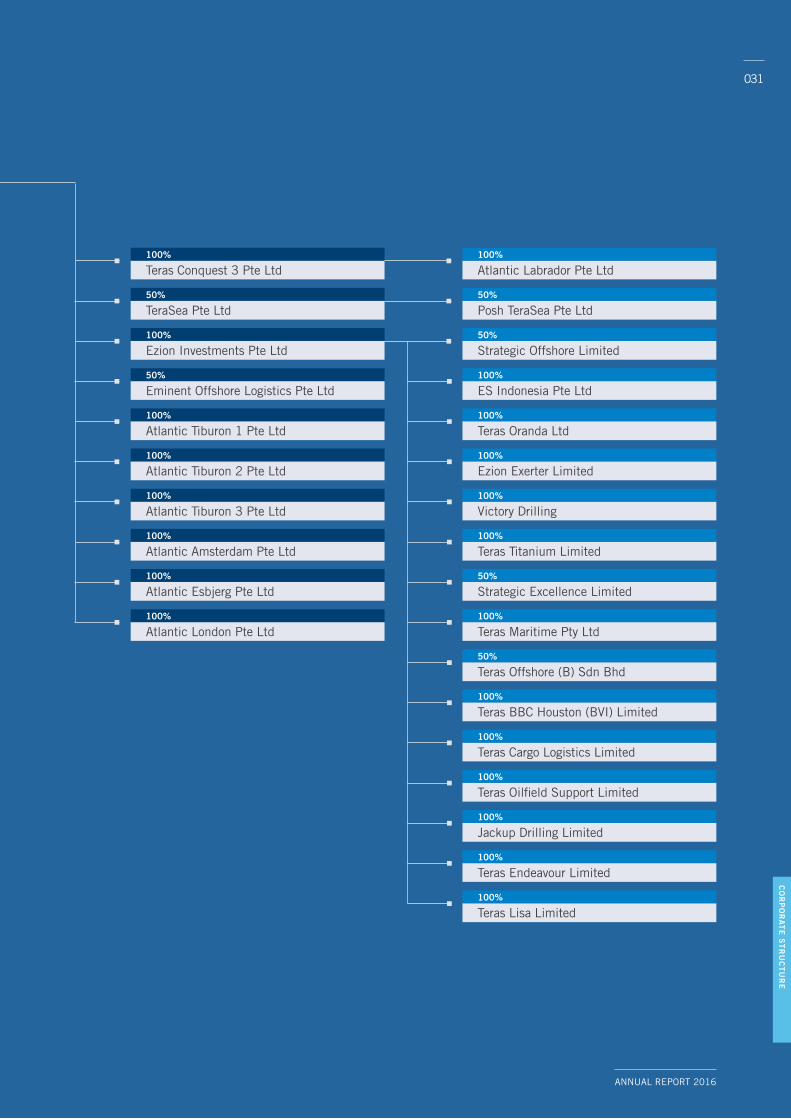
100% 100%
100%
100%
100%
100%
Teras Conquest 3 Pte Ltd Atlantic Labrador Pte Ltd
50% 50%
100%100%
50%
100%
100%
TeraSea Pte Ltd Posh TeraSea Pte Ltd
100% 50%
100%100%
100%
50%
100%
Ezion Investments Pte Ltd Strategic Offshore Limited
ES Indonesia Pte Ltd
Teras Oranda Ltd
Ezion Exerter Limited
Victory Drilling
Teras Titanium Limited
Strategic Excellence Limited
Teras Maritime Pty Ltd
Teras Offshore (B) Sdn Bhd
Teras BBC Houston (BVI) Limited
Teras Cargo Logistics Limited
Teras Oilfield Support Limited
Jackup Drilling Limited
Teras Endeavour Limited
Teras Lisa Limited
100%
100%
50%
100%
100%
100%
100%
Eminent Offshore Logistics Pte Ltd
Atlantic Tiburon 1 Pte Ltd
Atlantic Tiburon 2 Pte Ltd
Atlantic Tiburon 3 Pte Ltd
Atlantic Amsterdam Pte Ltd
Atlantic Esbjerg Pte Ltd
Atlantic London Pte Ltd

032
EZION HOLDINGS LIMITED
BOARD OF DIRECTORSChairman : Dr Wang Kai Yuen Members : Chew Thiam Keng Tan Woon Hum Lim Thean Ee Yee Chia Hsing
AUDIT COMMITTEEChairman : Tan Woon HumMembers : Lim Thean Ee Yee Chia Hsing
REMUNERATION COMMITTEEChairman : Lim Thean EeMembers : Tan Woon Hum Yee Chia Hsing
NOMINATING COMMITTEEChairman : Yee Chia HsingMembers : Tan Woon Hum Lim Thean Ee
REGISTERED ADDRESS15 Hoe Chiang Road #12-05 Tower Fifteen Singapore 089316 Telephone : (65) 6309 0555 Facsimile : (65) 6222 7848 Website : www.ezionholdings.com Email : [email protected]
PRINCIPAL BANKERSDBS Bank Ltd12 Marina BoulevardDBS Asia Central @ MBFC Tower 3 Singapore 018982
Oversea-ChineseBanking Corporation Limited 65 Chulia StreetOCBC CentreSingapore 049513
Malayan Banking Bhd2 Battery Road Maybank Tower Singapore 049907
United Overseas Bank Limited80 Raffles Place UOB Plaza Singapore 048624
CIMB Bank Berhad50 Raffles PlaceSingapore Land TowerSingapore 048623
AUDITORSKPMG LLPPartner-in-charge: Koh Wei Peng (Appointed since financial year ended 31 December 2012)16 Raffles Quay #22-00Hong Leong BuildingSingapore 048581
SHARE REGISTRARM&C Services Private Limited112 Robinson Road #05-01 Singapore 068902
COMPANY SECRETARIESLee Tiong HockCheah Boon Pin
CORPORATE INFORMATION
CO
RP
OR
AT
E IN
FO
RM
AT
ION

ANNUAL REPORT 2016
033
034CORPORATE GOVERNANCE REPORT
048DIRECTORS’ STATEMENTS
054INDEPENDENT AUDITORS’ REPORT
060STATEMENTS OF FINANCIAL POSITION
061CONSOLIDATED INCOME STATEMENT
062CONSOLIDATED STATEMENT OF COMPREHENSIVE INCOME
063CONSOLIDATED STATEMENT OF CHANGES IN EQUITY
066CONSOLIDATED STATEMENT OF CASH FLOWS
068NOTES TO FINANCIAL STATEMENTS
148SHAREHOLDERS’ INFORMATION
150STATISTICS OFWARRANT HOLDINGS
151NOTICE OF ANNUAL GENERAL MEETING
PROXY FORM
CONTENTS
OVERCOMING CHALLENGES

EZION HOLDINGS LIMITED
034
The Board of Directors and Management of Ezion Holdings Limited (“Ezion” or the “Company”) are committed to continually enhancing shareholder value by maintaining high standards of corporate governance, business integrity and professionalism in all its activities.
This report describes the Company’s corporate governance framework and practices that were in place throughout the financial year, which are substantially in line with the principles of the Code of Corporate Governance 2012 (the “Code”). Where there are deviations from the Code, appropriate explanations are provided.
BOARD MATTERS PRINCIPLE 1 BOARD’S CONDUCT OF AFFAIRSPRINCIPLE 2 BOARD COMPOSITION AND GUIDANCE
The Company is led by an effective Board comprising a majority of non-executive and independent Directors. Each Director brings to the Board his skills, experience, insights and sound judgement, which together with strategic networking relationships, serves to further the interests of the Company. At all times, the Directors are collectively and individually obliged to act in good faith and consider the best interests of the Company.
The Board currently comprises the following members:
(i) Dr Wang Kai Yuen Independent Non-Executive Chairman(ii) Mr Chew Thiam Keng Chief Executive Officer (“CEO”) and Executive Director(iii) Mr Tan Woon Hum Independent Non-Executive Director (iv) Mr Lim Thean Ee Independent Non-Executive Director(v) Mr Yee Chia Hsing Independent Non-Executive Director
The Board oversees the business of Company and assumes responsibility for the overall strategic plans, key operational initiatives, major investment and funding proposals, financial performance reviews and corporate governance practices. The Board provides the direction and goals for the Management and monitors the performance of these goals to enhance the shareholders’ value. The Company has in place financial authorisation and approval limits for operating and capital expenditure, procurement of goods and services, acquisitions and disposal of investments and treasury transactions. Within these guidelines, the Board approves transactions above certain thresholds. The Board also approves the financial results for release to the Singapore Exchange Securities Trading Limited (“SGX-ST”).
The Company has adopted internal guidelines setting forth matters that required Board approval. A summary of matters reserved for the Board is set out below:
(i) Matters in relation to the overall strategy and management of the Group;(ii) Material changes to the Group’s management and control structure;(iii) Matters involving financial reporting and dividends;(iv) Major/strategic acquisitions and disposal of investments not in the ordinary course of business; and(v) Matters which require Board approval as specified in the SGX-ST Listing Manual, Companies Act, Cap. 50 or other
relevant laws and regulations.
CORPORATE GOVERNANCE REPORT

ANNUAL REPORT 2016
035
The Board is supported by three Board Committees, namely the Audit Committee (“AC”), the Remuneration Committee (“RC”) and the Nominating Committee (“NC”). These committees function within clearly defined terms of reference and operating procedures, which were approved by the Board.
The Board conducts regular scheduled meetings. Adhoc meetings are convened as and when circumstances require. Dates of Board meeting, Board Committee meeting and annual general meetings are scheduled in advance in consultation with the Directors to assist them in planning their attendance. A Director who is unable to attend a Board or Board Committee meeting physically may participate via telephone conference or other electronic and telegraphic means. The Constitution of the Company provides for the meetings to be held via telephone conference and other electronic or telegraphic means; and also for matters requiring decisions of the Board to be approved by way of written resolutions of the Board. The attendance of the directors at Board and Board Committee meetings held during the financial year ended 31 December 2016 (“FY2016”) is as follows:
Type of Meetings Board Audit CommitteeNominating Committee
Remuneration Committee
Total No. Held 4 4 1 1
Name of Director and Attendance
Dr Wang Kai Yuen 4 N.A. N.A. N.A.
Chew Thiam Keng 4 N.A. N.A. N.A.
Tan Woon Hum 4 4 1 1
Lim Thean Ee 4 4 1 1
Yee Chia Hsing 4 4 1 1
N.A. - Not Applicable New directors will be briefed on the business activities, strategic directions, policies and corporate governance practices of the Group.
Directors are provided with briefings and updates from time to time by professional advisers, auditor and Management on relevant practices, new laws, rules and regulations, directors’ duties and responsibilities, corporate governance, changes in accounting standards and risk management issues applicable or relevant to the performance of their duties and responsibilities as Directors. The CEO updates the Board at Board meetings on business and strategic developments of the Group and industry. Informal meetings are held for Management to brief Directors on prospective deals and potential developments in the early stages before formal Board approval is sought.
The Board and Management engage in open and constructive debate for the furtherance and achieving of strategic objectives. All Board members are provided with relevant and sufficient information on a timely basis and non-executive directors may challenge Management’s assumptions and also extend guidance to Management, in the best interest of the Group.
The Independent Directors hold informal meeting session on a need basis without the presence of Management and other Directors.
CORPORATE GOVERNANCE REPORT
EZION HOLDINGS LIMITED
036
Directors are informed and encouraged to attend relevant training programmes organised by the Singapore Institute of Directors and may suggest training topics, the funding of which will be provided by the Company.
During FY2016, Directors were briefed by the external auditor on the developments in financial reporting, governance standards and issues which have a direct impact on financial statements so as to enable them to discharge their duties and responsibilities as Board members or Board committee members. News releases issued by the SGX-ST which are relevant to the Directors are also circulated to the Board for information.
As a group, the Directors bring with them a broad range of industry knowledge, expertise and experience in areas such as finance, legal, business and management. Key information regarding the Directors, including directorships or chairmanships both present and those held over the preceding three years in other listed companies and other principal commitments are set out in pages 14 to 17 of this Annual Report.
The NC reviews the size and composition of the Board and the Board Committees annually. The NC considers the present board size and composition appropriate taking into account the business and scale of operations. It is of the view that the Board and Board Committees, comprises Directors who have the relevant skills and knowledge, expertise and experiences to discharge the Board’s duties as a group.
The NC has reviewed the declaration of independence provided by each of the Independent Non-Executive Director for FY2016 in accordance with the Code’s guidelines. The NC and Board consider a director as independent if he has no relationship with the Company, its related corporations, its 10% shareholders or officers that could interfere or reasonably perceived to interfere with the exercise of the director’s independent business judgement with a view to the best interest of the Company.
In the course of the year, the NC also assessed the independence of Board members in light of Guideline 2.4 of the Code, which requires that the independence of any Director, who has served on the Board beyond nine years, from the date of first appointment, be subject to particularly rigorous review. Dr Wang Kai Yuen, Mr Lim Thean Ee and Mr Tan Woon Hum have served on the Board for more than nine years since their first appointment as Directors.
The NC recognises that an individual’s independence cannot be determined arbitrarily on the basis of a set period of time. After particular scrutiny, Dr Wang, Mr Lim and Mr Tan are determined to be independent. They continue to express their viewpoints, debate issues and objectively scrutinise and challenge Management. They also seek clarification and amplification as deemed required in discharging their duties as Independent Directors. After careful consideration of the relevant factors and to avoid an abrupt loss of a member with experience and institutional memory, the Board has determined that the tenure of Dr Wang, Mr Lim and Mr Tan have not affected their independence or ability to bring judgement to bear, in their discharge of their duties as a Board and Board Committees members. In the determination of the independence of Dr Wang, Mr Lim and Mr Tan by the NC, they had recused themselves.
PRINCIPLE 3 CHAIRMAN AND CHIEF EXECUTIVE OFFICER
There is a clear separation of the roles and responsibilities of the Chairman and the CEO. This is to ensure appropriate balance of power and authority, accountability and decision-making.
Dr Wang Kai Yuen, who is the Independent Non-Executive Chairman, and Mr Chew Thiam Keng, the CEO of the Company are not related to each other. Therefore, no Lead Independent Director was appointed. The CEO is responsible for the day-to-day management of the affairs of the Company and the Group. He plays a leading role in developing and expanding the businesses of the Group and ensures that the Board is kept updated and informed of the Group’s business.
CORPORATE GOVERNANCE REPORT

ANNUAL REPORT 2016
037
The Chairman’s duties include:
1) scheduling meetings and leading the Board to ensure its effectiveness and approves the agenda of Board meetings in consultation with the CEO;
2) ensures that Board members are provided with accurate and timely information;
3) promote a culture of openness and debate within the Board; and
4) ensure high standards of corporate governance and ensure effective communication with shareholders.
PRINCIPLE 4 BOARD MEMBERSHIP
NOMINATING COMMITTEE
The NC comprises three Directors, all of whom, including the Chairman are independent. The NC members are:
Mr Yee Chia Hsing (Chairman)Mr Tan Woon Hum Mr Lim Thean Ee
The NC’s duties include the following:
• identifying candidates and making recommendations for all Board appointments and re-nomination or continuation in office of any Director;
• review and recommend to the Board the retirement and re-election of directors in accordance with the Company’s Constitution at each Annual General Meeting (“AGM”);
• determine the independence of Directors annually;
• review the size and composition of the Board annually to ensure that the Board has appropriate balance of Independent Directors and to ensure an appropriate balance of expertise, skills, attributes and ability among the Directors; and
• evaluate the performance and effectiveness of the Board as a whole.
On the process for selection, appointment and re-appointment of directors, the NC reviews and assesses candidates for directorship before making recommendations to the Board. In recommending new directors to the Board, the NC takes into consideration the skills and experience and the current composition of the Board, and strives to ensure that the Board has an appropriate balance of independent directors as well as directors with the right profile of expertise, skills, attributes and ability.
CORPORATE GOVERNANCE REPORT

EZION HOLDINGS LIMITED
038
The Directors submit themselves for re-nomination and re-election at regular intervals of at least once every three years. The Company’s Constitution provides that one third of the Board, or the number nearest to one third is to retire by rotation at every AGM. In addition, the Company’s Constitution also provides that newly appointed Directors are required to submit themselves for re-nomination and re-election at the next AGM of the Company.
Mr Chew Thiam Keng, CEO and Executive Director and Mr Lim Thean Ee, an Independent Non-Executive Director, will be retiring at the forthcoming AGM pursuant to Article 107 of the Company’s Constitution. Both Mr Chew and Mr Lim being eligible, had consented to re-election as Directors at the forthcoming AGM.
The NC has recommended that the above mentioned Directors be nominated for re-election at the forthcoming AGM. In making the recommendation, the NC had considered the Directors’ overall contributions and performance.
The dates of initial appointment and last re-election of each director are set out as follows:
Name of director AppointmentDate of initial appointment Date of last re-election
Dr Wang Kai Yuen Independent Non-Executive Chairman 28 July 2000 27 April 2016
Mr Chew Thiam Keng CEO and Executive Director 1 March 2007 22 April 2015
Mr Tan Woon Hum Independent Non-Executive Director 21 March 2007 22 April 2015
Mr Lim Thean Ee Independent Non-Executive Director 28 July 2000 25 April 2013
Mr Yee Chia Hsing Independent Non-Executive Director 5 January 2016 27 April 2016
Based on the attendance of the Directors and their contributions at meetings of the Board and Board Committees and their time commitment to the affairs of the Company, the NC believes that the Directors continue to meet the demands of the Group and are able to discharge their duties adequately. The Board is of the view that setting a maximum number of listed company board representations would not be meaningful as the contributions of the Directors would depend on many factors such as whether they were in full time employment and their other responsibilities. If a quantitative limit on the number of directorships was imposed, the NC and the Board might have omitted outstanding individuals who despite the demands on their time had the capacity to participate and contribute as new members of the Board. The NC will assess each Director relative to his abilities and known commitments and responsibilities. There is no alternate director on the Board. PRINCIPLE 5 BOARD PERFORMANCE
The performance of the Board is ultimately reflected in the long term performance of the Company. The Board, through the delegation of its authority to the NC, had made its best efforts to ensure each Director possess the experience, knowledge and skills critical to the Group’s business. This is necessary to enable the Board to make sound and well-considered decisions. The NC, in considering the nomination of any Director for re-election, will evaluate the performance of the Director involved taking into account factors such as that existing director’s attendance, participation and contribution.
A process is in place to assess the performance and effectiveness of the Board as a whole. The evaluation of the Board is conducted annually through a questionnaire designed to assess the performance of the Board and its Board Committees and enhance the overall effectiveness of Directors. The performance criteria for the Board evaluation are based on
CORPORATE GOVERNANCE REPORT

ANNUAL REPORT 2016
039
financial and non-financial indicators such as evaluation of the size and composition of the Board, the Board’s access to information, Board’s processes, strategy and planning, risk management, accountability, Board’s performance in relation to discharging its principal functions, communication with Management and standards of conduct of the Directors which do not change yearly. The Board evaluation results were discussed with the NC and the Board. Key actions were mapped with the goal of enhancing the effectiveness of Board and Board Committees.
Renewal or replacement of Directors, if any, does not necessarily reflect their contribution to date, but may be driven by the need to position and shape the Board in line with the needs of the Company and its business.
The Chairman of the NC confers with the Chairman of the Board on the findings and appropriate follow-up actions are taken as necessary. The Board is satisfied that all Directors have discharged their duties adequately for FY2016 and expects that the Directors will continue to discharge their duties adequately in FY2017.
PRINCIPLE 6 ACCESS TO INFORMATION
The Board members are provided with adequate and timely information prior to Board meetings and on an ongoing basis. All relevant information including the Group’s forecast, annual budgets and financial statements are circulated to the Directors for review prior to the Board meetings.
The Board has separate and independent access to the Group’s senior management and the advice and services of the Company Secretaries who are responsible to the Board for ensuring board procedures are followed and that the Company’s Constitution, the relevant statutory rules and regulations are complied with. Requests for information from the Board are dealt with promptly and the Board is informed of all material events and transactions as and when they occur.
Under the Constitution of the Company, the decision to appoint or remove the Company Secretaries can only be taken by the Board as a whole. At least one of the Company Secretaries will be present at Board and Board Committee meetings.
Should directors, whether as a group or individually, need independent professional advice to enable them to discharge their duties, the Company, subject to the approval of the Board, will appoint a professional advisor to render advice at its own cost.
REMUNERATION MATTERS PRINCIPLE 7 PROCEDURES FOR DEVELOPING REMUNERATION POLICIESPRINCIPLE 8 LEVEL AND MIX OF REMUNERATIONPRINCIPLE 9 DISCLOSURE IN REMUNERATION The RC comprises three Directors, all of whom including the Chairman are independent. The RC members are as follows:
Mr Lim Thean Ee (Chairman)Mr Tan Woon HumMr Yee Chia Hsing
CORPORATE GOVERNANCE REPORT

EZION HOLDINGS LIMITED
040
The duties of the RC include the following:
• review and recommend to the Board an appropriate and competitive framework of remuneration for the Directors and key management personnel of the Group;
• recommend to the Board specific remuneration packages for each Executive Director, taking into account factors including remuneration packages of Executive Directors in comparable industries as well as the performance of the Company and that of the Executive Directors;
• review and make recommendation on the fees of Independent Non-Executive Directors for approval by the Board;
• ensure the remuneration policies and systems of the Group support the Group’s objectives and strategies; and
• administration of the Ezion Employee Share Plan and the Ezion Employee Option Scheme.
The remuneration policy for key management personnel is based largely on the Group’s performance and the responsibilities and performance of each individual key management personnel. In setting remuneration packages, the RC takes into consideration the pay and employment conditions within the industry and local practices. The RC recommends the remuneration packages of key management personnel for Board’s approval.
The remuneration package adopted for the Executive Director is as per the service contract entered into between the Director and the Company. The RC will review and recommend the specific remuneration package for each Executive Director upon recruitment. Thereafter, the RC reviews subsequent increments, bonuses and allowances where these payments are discretionary against the achievement of prescribed goals and targets for the CEO and Executive Director. No Director or member of the RC is involved in deciding his own remuneration.
The RC reviews the terms of compensation and employment for Executive Directors at the time of their respective employment or renewal (where applicable) including considering the Company’s obligations in the event of termination of services to ensure such contracts of service contain fair and reasonable termination clauses which are not overly generous.
Independent Non-Executive Directors do not have any service contracts with the Company. Save for Directors’ fees, Independent Non-Executive Directors do not receive any remuneration from the Company.
Directors’ fees are set in accordance with a remuneration framework comprising basic fees and additional fees for serving on any of the committees having regards to the scope and extent of a Director’s responsibilities and obligations, the prevailing market conditions and referencing Directors’ fees against comparable benchmarks. Directors’ fees are subject to approval of shareholders of the Company as a lump sum payment at the AGM of the Company.
The RC has access to the appropriate advice from the Head of Human Resources who attends all RC meetings and also external professional advice on remuneration matters, if required. The RC will ensure that existing relationships, if any, between the Company and its appointed external professional consultants will not affect their independence and objectivity.
The Company has in place the Ezion Employee Share Option Scheme and Ezion Employee Share Plan, both administered by the RC. Details of the Scheme and the Share Plan are disclosed under Directors’ Statement set out in pages 49 to 52 of this Annual Report.
CORPORATE GOVERNANCE REPORT

ANNUAL REPORT 2016
041
Remuneration of Directors
Taking note of the competitive pressures in the industry and the talent market, the Board has on review decided to disclose the remuneration of the Directors, in bands with a breakdown of the components in percentage. Information on the remuneration of Directors of the Company for FY2016 is as follows:
Remuneration Band and Name of Directors Fees %
Salary & CPF%
Bonus & CPF%
Other Benefits%
Total %
US$1,000,000 and below
Chew Thiam Keng - 37 61 2 100
Below US$250,000
Lee Kian Soo* 100 - - - 100
Dr Wang Kai Yuen 100 - - - 100
Lim Thean Ee 100 - - - 100
Tan Woon Hum 100 - - - 100
* Stepped down as Non-Executive Chairman and Non-Executive Director on 5 January 2016.
Remuneration of Key Management Personnel
The Company adopts a remuneration system that is responsive to the market elements and performance of the Company and business divisions respectively. Taking note of the competitive pressures in the talent market, the Board has, on review, decided not to disclose the names of the Group’s top nine key management personnel (who is not a Director or CEO of the Company) as such confidential and sensitive information could be exploited by the competitors. All the nine key management personnel received total remuneration of less than US$400,000 each for FY2016.
Key information on the key management personnel is set out in pages 18 & 19 of this Annual Report.
The Company’s compensation framework comprises fixed pay, short-term and long-term incentives. The Company subscribes to linking executive remuneration to corporate and individual performance. Long-term incentive schemes are put in place to motivate and reward employees and align their interests to maximise long-term shareholder value.
For the financial year, there were no termination, retirement and post-employment benefits granted to any Director, the CEO and key management personnel other than the payment in lieu of notice in the event of termination in their respective employment contracts, where applicable.
There are no employees within the Group who are immediate family members of a Director or the CEO whose remuneration exceeds S$50,000 during the financial year.
CORPORATE GOVERNANCE REPORT

EZION HOLDINGS LIMITED
042
ACCOUNTABILITY AND AUDIT PRINCIPLE 10 ACCOUNTABILITY
The Board, through its announcements of the Group financial results to shareholders, aims to present a balanced and understandable assessment of the Group’s financial position and prospects.
In preparing the financial statements, the Directors have:
(i) selected suitable accounting policies and applied them consistently;
(ii) made judgements and estimates that are reasonable and prudent;
(iii) ensured that all applicable accounting standards have been followed; and
(iv) prepared financial statements on the basis that the Directors have reasonable expectations, having made enquires, that the Group and Company have adequate resources to continue operations for the foreseeable future.
The Management provides the Board with management accounts and such explanation and information on a regular basis and as the Board may require from time to time, to enable the Board to make a balanced and informed assessment of the Company’s performance, position and prospects.
Management is delegated with the responsibility of ensuring compliance with legislative and regulatory requirements, including requirements under the SGX-ST listing rules. In this connection, Management is encouraged to seek necessary professional advice from the Company Secretaries or legal advisors if necessary. PRINCIPLE 11 RISK MANAGEMENT AND INTERNAL CONTROLS
The Board is responsible for the governance of risk and sets the tone and direction for the Group in the way risks are managed in the Group’s businesses. The Board has ultimate responsibility for approving the strategy of the Group in a manner which addresses stakeholders’ expectations and does not expose the Group to an unacceptable level of risk.
The Board approves the key risk management policies and ensures a sound system of risk management and internal controls and monitors performance against them. In addition to determining the approach to risk governance, the Board sets and instils the right risk focused culture throughout the Group for effective risk governance.
The Board has approved a Group Risk Management Framework for the identification of key risks within the business which is aligned with the ISO 31000:2009 Risk Management framework. To enhance the effectiveness of the ERM framework, the Group implemented Orion ERM system, a third party software that automates the risk management, internal control and assurance functions and enables these functions to be managed on an integrated platform.
The AC oversees risk governance which includes the following roles and responsibilities:
• proposes the risk governance approach and risk policies for the Group to the Board;
• reviews the risk management methodology adopted by the Group;
CORPORATE GOVERNANCE REPORT

ANNUAL REPORT 2016
043
• reviews the strategic, financial, operational, regulatory, compliance, information technology and other emerging risks relevant to the Group identified by Management; and
• reviews Management’s assessment of risks and Management’s action plans to mitigate such risks. Management presented an Annual Report to the AC and the Board on the Group’s risk profile, the risk mitigation action plans and the results of various assurance activities carried out on the adequacy and effectiveness of the Group’s risk management and internal controls systems including financial, operational, compliance and information technology controls. Such assurance activities include control self-assessments performed by Management, internal audit, external audit, external certifications conducted by various external professional service firms, and enterprise risk assessment performed by the Management and facilitated by consultant.
In respect of FY2016, the Board has received assurance from the CEO and Group Chief Financial Officer:
(a) that financial records have been properly maintained and the financial statements give a true and fair view of the Company’s operations and finances; and
(b) the Company’s risk management and internal control systems are effective and adequate. The CEO and Group Chief Financial Officer have obtained assurance from the respective risk and control owners.
Based on the risk management framework and internal controls established and maintained by the Group, work performed by the internal and external auditors, external certification firms and reviews performed by Management, various Board Committees and the Board, the Board (with concurrence of the AC) are of the opinion that the Group’s risk management and internal control systems addressing financial, operational, compliance and information technology risks, were adequate and effective as at 31 December 2016.
The Board notes that system of internal controls and risk management established by the Company provides reasonable, but not absolute, assurance that the Company will not be adversely affected by any event that can be reasonably foreseen as it strives to achieve its business objectives. However, the Board also notes that no system of internal controls and risk management can provide absolute assurance in this regard, or absolute assurance against the occurrence of material errors, poor judgement in decision-making, human error, losses, fraud or other irregularities.
PRINCIPLE 12 AUDIT COMMITTEE
The AC comprises three Directors, all of whom including the Chairman are independent. The AC members are:
Mr Tan Woon Hum (Chairman)Mr Lim Thean Ee Mr Yee Chia Hsing
The Board is of the view that the members of the AC have the relevant accounting or related financial management expertise and experience to discharge their duties.
CORPORATE GOVERNANCE REPORT

EZION HOLDINGS LIMITED
044
The AC performs the following functions:
(a) review with the external auditors the scope and results of the audit, their evaluation of the system of internal accounting controls, their management letter and management’s response;
(b) review with the internal auditors, their audit plan, the adequacy of the internal audit procedures and their evaluation of the effectiveness of the overall internal control systems, including financial, operational, compliance and information technology controls;
(c) review the quarterly and annual financial statements, including announcements to shareholders and the SGX-ST prior to submission to the Board so as to ensure the integrity of the Company’s financial statements;
(d) review any significant findings and recommendations of the external and internal auditors and related Management response and assistance given by the Management to auditors;
(e) review interested person transactions to ensure that the review procedures approved by the shareholders are adhered to;
(f) conduct annual review of the independence and objectivity of the external auditor, including the volume of non-audit services provided by the external auditor, to satisfy itself that the nature and extent of such services will not prejudice the independence and objectivity of the external auditor before confirming their re-nomination; and
(g) oversees risk governance (refer to detailed disclosure under Principle 11). The AC has full access to and receives full co-operation from Management, and has full discretion to invite members of Management to attend its meetings and has been given reasonable resources to enable it to discharge its functions. The external auditor have direct and unrestricted access to the AC, which is empowered to conduct or authorise investigations into any matters within its terms of reference.
The AC has reviewed the overall scope of the external audit and the assistance given by the Company’s officers to the auditor. It met with the Company’s external auditor to discuss the results of their respective examinations and their evaluation of the Company’s system of internal accounting controls.
The AC meets annually with the external and internal auditors, without the presence of Management.
The Company has in place a whistle blowing policy, details of which have been made available to all employees, to provide a channel for staff to raise in good faith and in confidence, without fear of reprisals, concerns about possible improprieties in financial reporting or other matters. The objective of such a policy is to ensure independent investigation of such matters and for appropriate follow-up action. The complaint can be made through email and mail, both administered by Yang Lee & Associates, which reports directly to the AC on all such matters. There were no complaints received by the AC for FY2016.
The AC has reviewed the non-audit service provided by the external auditor for FY2016. The AC is of the view that the provision of this non-audit service does not compromise the independence of the external auditor. Details of the aggregate amount of fees paid to the external auditor for FY2016 and a breakdown of the fees paid in total for audit and non-audit services respectively, can be found on page 125.
CORPORATE GOVERNANCE REPORT
ANNUAL REPORT 2016
045
During the financial year, the AC reviewed the quarterly financial statements prior to approving or recommending their release to the Board; the internal and external audit plans and results of the audits; risk management and internal controls systems; non-audit services rendered by the external auditor as well as the independence and objectivity of the external auditor; and the report on the administration of the whistle blowing policy of the Group.
The external auditor provides regular updates and briefings to the AC on changes or amendments to accounting standards to enable the AC to keep abreast of such changes and its corresponding impact on the financial statements, if any.
Neither the members nor the Chairman of the AC are former partners or directors of the Group’s auditing firm. None of them have any financial interest in the Group’s auditing firm.
PRINCIPLE 13 INTERNAL AUDIT
The AC approves the hiring, removal and evaluation of the professional service firm to which the internal audit function was outsourced.
The Company outsources its internal audit functions to Yang Lee & Associates. The internal auditor report directly to the AC and internal control weaknesses identified during the internal audit reviews and the recommended corrective actions are reported to the AC periodically. The internal auditor has unfettered access to all the Company’s documents, records, properties and personnel, including access to the AC.
The AC has reviewed and confirmed that Yang Lee & Associates is a suitable professional service firm to meet the Company’s internal audit obligations, having regard to the adequacy of resources and experience of the firm and the assigned engagement director, number and experience of supervisory and professional staff assigned to internal audits.
The AC reviews and approves the internal audit scope and plan to ensure that there is sufficient coverage of the Group’s activities. It also oversees the implementation of the internal audit plan and ensures that Management provides the necessary co-operation to enable the internal auditor to perform its function.
The internal auditor is guided by the International Standards for the Professional Practice of Internal Auditing (IIA Standards) issued by the Institute of Internal Auditors.
The AC annually reviews the adequacy of the internal audit function to ensure that the internal audits are performed effectively.
In relation to FY2016, the IA completed one review in accordance with the internal control testing plan approved by the Board under the Group Risk Management Framework. The findings and recommendations of the IA, Management’s responses, and Management’s implementation of the recommendations have been reviewed and approved by the AC.
CORPORATE GOVERNANCE REPORT

EZION HOLDINGS LIMITED
046
SHAREHOLDER RIGHTS AND RESPONSIBILITIES PRINCIPLE 14 SHAREHOLDER RIGHTSPRINCIPLE 15 COMMUNICATION WITH SHAREHOLDERSPRINCIPLE 16 CONDUCT OF SHAREHOLDER MEETINGS The Board is committed to providing clear and full information on the Group to shareholders through the publication of notices, announcements, circulars, quarterly and full-year financial results. The Company does not practise selective disclosures and releases its financial results and other material information to the shareholders on a timely basis in accordance with the requirements of the Listing Manual of the SGX-ST, via the SGXNet system. All announcements are also available on the Company’s corporate website.
The Company strongly encourages and supports shareholders participation at general meetings. At general meetings of the Company, shareholders will be given opportunity to express their views, concerns and ask questions regarding the Company and the Group. All shareholders of the Company receive a copy of the annual report, the notice of AGM and circulars and notices pertaining to any extraordinary general meetings of the Company. The notice is also advertised in the newspaper and available on the SGX-ST’s website.
The Company’s general meetings are the forum for dialogue with shareholders and allow the Board and Management to address shareholders’ views and concerns. At the AGMs, all Directors, in particular Chairman of the Board and the respective Chairman of the AC, NC and RC as well as the external auditor of the Company are in attendance to answer queries from shareholders.
Each item of special business included in the notice of the general meetings will be accompanied by an explanation for the proposed resolution. Separate resolutions are proposed for substantially separate issues at the general meetings.
To facilitate participation by the shareholders, the Company’s Constitution allows a shareholder to appoint not more than two proxies to attend and vote at general meetings. With the introduction of the multiple proxies regime under the Singapore Companies (Amendment) Act 2014, investors who hold the Company’s shares through a nominee company or custodian bank or through a CPF agent bank may attend and vote at the general meetings of shareholders. As the authentication of shareholder identity information and other related security issues still remain a concern, the Company has decided, for the time being, not to implement voting in absentia by mail, email or fax.
All minutes of general meetings include substantial and relevant comments or queries from shareholders relating to the agenda of the meeting, and responses from the Board and Management, are available to shareholders upon request. Resolutions are passed at the general meetings by poll voting and conducted in the presence of independent scrutineers for greater transparency in the voting process. The rules, including voting procedures that govern the meeting, will be provided to the shareholders at the general meetings. Detailed results of the outcome will be announced after the general meetings via SGXNet. Electronic poll voting has not been adopted by the Company for the time being as the turnout of the shareholders is still considerably small.
The Company does not have a formal investor relations policy. Pertinent information is regularly conveyed to the shareholders through SGXNet and the Company’s website at http://www.ezionholdings.com. Shareholders can submit their feedback and raise any question to the Company’s investor relations, contact as provided in the Company’s corporate website.
CORPORATE GOVERNANCE REPORT
ANNUAL REPORT 2016
047
There is no formal dividend policy adopted by the Company. Nonetheless, Management will review, inter alia, the Group’s performance in the relevant financial period, projected capital needs and working capital requirements and make appropriate recommendations to the Board on dividend declaration.
DEALINGS IN SECURITIES The Company has adopted an internal policy with regard to dealings in securities to provide guidance for its Directors and employees.
The Company’s policy provides that Directors and employees of the Group are prohibited from dealing in securities of the Company when they are in possession of any unpublished material price-sensitive information of the Group. The Company’s policy also prohibits the Directors and employees from trading in the Company’s securities during the period commencing one month and two weeks before the date of announcement of the Company’s full year or quarterly results respectively and ending on the date of announcement of the relevant results.
Directors and employees are also required to observe insider trading laws at all times even when dealing in securities within the permitted trading period. In addition, the Directors and employees are expected not to deal in the Company’s securities for short-term considerations. INTERESTED PERSON TRANSACTIONS (“IPTS”) POLICY
The Company has established procedures to ensure that transactions with interested persons are properly reviewed and approved and are conducted at arm’s length basis.
There were no IPTs during the financial year ended 31 December 2016. MATERIAL CONTRACTS
There were no material contracts entered into by the Company and its subsidiaries involving the interests of its CEO, Directors or Controlling Shareholders. USE OF PROCEEDS
Proceeds Description of use of proceeds Remaining as at 6 April 2017
Net proceeds of approximately S$30 million from issue of redeemable exchangeable preference shares (“REPS”) by the subsidiary of the Company, Teras Investments Pte. Ltd.
Acquisition of offshore and marine assets
Nil
Net proceeds of approximately S$194 million from placement of 100,000,000 ordinary shares in share capital of the Company completed on 6 May 2014.
Acquisition of offshore and marine assets
Nil
Net proceeds of approximately S$132.74 million from the renounceable underwritten rights issue of 478,576,422 ordinary shares in the capital of the Company completed on 5 August 2016.
Acquisition of offshore and marine assets
S$118.36 million
CORPORATE GOVERNANCE REPORT

EZION HOLDINGS LIMITED
048
We are pleased to submit this annual report to the members of the Company together with the audited financial statements for the financial year ended 31 December 2016.
In our opinion:
(a) the financial statements set out on pages 60 to 147 are drawn up so as to give a true and fair view of the financial position of the Group and of the Company as at 31 December 2016 and the financial performance, changes in equity and cash flows of the Group for the year ended on that date in accordance with the provisions of the Singapore Companies Act, Chapter 50 and Singapore Financial Reporting Standards; and
(b) at the date of this statement, there are reasonable grounds to believe that the Company will be able to pay its debts as and when they fall due.
The Board of Directors has, on the date of this statement, authorised these financial statements for issue.
DIRECTORS
The directors in office at the date of this statement are as follows:
Chew Thiam KengDr Wang Kai YuenLim Thean EeTan Woon HumYee Chia Hsing
DIRECTORS’ INTERESTS
According to the register kept by the Company for the purposes of Section 164 of the Companies Act, Chapter 50 (the “Act”), particulars of interests of directors who held office at the end of the financial year (including those held by their spouses and infant children) in shares, debentures, warrants and share options in the Company and in related corporations (other than wholly-owned subsidiaries) are as follows:
Direct Deemed
Name of director and corporation in which interests are held
Holdings at beginningof the year
Holdings at end
of the year
Holdings at beginningof the year
Holdings at end
of the year
The Company
Dr Wang Kai Yuen 547,200 711,400 – –
Lim Thean Ee 2,016,000 2,220,000 – –
Chew Thiam Keng 20,518,800 27,259,440 204,480,000 250,324,000
Tan Woon Hum 230,400 299,520 500,000 650,000
DIRECTORS’ STATEMENTYear ended 31 December 2016
ANNUAL REPORT 2016
049
By virtue of Section 7 of the Act, Chew Thiam Keng, is deemed to have interests in the subsidiaries of the Company, which are wholly-owned, at the beginning and at the end of the financial year.
Except as disclosed in this statement, no director who held office at the end of the financial year had interests in shares, debentures, warrants or share options of the Company, or of related corporations, either at the beginning or at the end of the financial year.
There were no changes in any of the above mentioned interests in the Company between the end of the financial year and 21 January 2017, except for Lim Thean Ee who has direct interests of 2,100,000 shares in the Company as at 21 January 2017.
Except as disclosed under the “Share Options” Section of this statement, neither at the end of, nor at any time during the financial year, was the Company a party to any arrangement whose objects are, or one of whose objects is, to enable the directors of the Company to acquire benefits by means of the acquisition of shares in or debentures of the Company or any other body corporate.
During the financial year, the Company and its related corporations have in the normal course of business entered into transactions with companies including a joint venture in which a director of the Company has financial interest. Such transactions comprised charter of vessels and lease of office carried out on normal commercial terms as set out in note 29 to the financial statements. The director has neither received nor become entitled to receive any benefit arising out of these transactions other than those to which he is ordinarily entitled to as shareholder of these companies.
SHARE OPTIONS
EZION EMPLOYEE SHARE OPTION SCHEME
The Ezion Employee Share Option Scheme (the “Scheme”) was approved and adopted by its members at an Extraordinary General Meeting held on 23 November 2009. The Scheme is administered by the Company’s Remuneration Committee, comprising three directors, Lim Thean Ee, Tan Woon Hum and Yee Chia Hsing.
Other information regarding the Scheme is set out below:
Option granted on 11 October 2011 (“Grant Date 1”)
• The exercise price of each option is fixed at S$0.259. (Prior to Rights Issue: S$0.288)
• The share option shall be exercised, in whole or in part, in accordance with the following schedule from 11 October 2012 to 11 October 2021:
i. 20% of the options shall vest after the end of first anniversary of Grant Date 1;
ii. 50% of the options shall vest after 31 March 2013; and
iii. 30% of the options shall vest after 31 March 2014.
DIRECTORS’ STATEMENTYear ended 31 December 2016

EZION HOLDINGS LIMITED
050
• All options are settled by physical delivery of shares.
• The options granted expire after 10 years or upon cessation of the employment of employees.
Option granted on 7 June 2012 (“Grant Date 2”)
• The exercise price of each option is fixed at S$0.462. (Prior to Rights Issue: S$0.514)
• The share option shall be exercised, in whole or in part, in accordance with the following schedule from 7 June 2013 to 7 June 2022:
i. 30% of the options shall vest after the end of first anniversary of Grant Date 2;
ii. 30% of the options shall vest after the end of second anniversary of Grant Date 2; and
iii. 40% of the options shall vest after the end of third anniversary of Grant Date 2.
• All options are settled by physical delivery of shares.
• The options granted expire after 10 years or upon cessation of the employment of employees.
Option granted on 21 January 2013 (“Grant Date 3”)
• The exercise price of each option is fixed at S$0.973. (Prior to Rights Issue: S$1.083)
• The share option shall be exercised, in whole or in part, in accordance with the following schedule from 21 January 2015 to 21 January 2023:
i. 30% of the options shall vest after the end of second anniversary of Grant Date 3;
ii. 30% of the options shall vest after the end of third anniversary of Grant Date 3; and
iii. 40% of the options shall vest after the end of fourth anniversary of Grant Date 3.
• All options are settled by physical delivery of shares.
• The options granted expire after 10 years or upon cessation of the employment of employees.
Option granted on 16 January 2015 (“Grant Date 5”)
• The exercise price of each option is fixed at S$1.011.
• The share option shall be exercised, in whole or in part, in accordance with the following schedule from 16 January 2017 to 16 January 2025:
i. 30% of the options shall vest after the end of second anniversary of Grant Date 5;
DIRECTORS’ STATEMENTYear ended 31 December 2016

ANNUAL REPORT 2016
051
ii. 30% of the options shall vest after the end of third anniversary of Grant Date 5; and
iii. 40% of the options shall vest after the end of fourth anniversary of Grant Date 5.
• All options are settled by physical delivery of shares.
• The options granted expire after 10 years or upon cessation of the employment of employees.
Option granted on 9 March 2016 (“Grant Date 6”)
• The exercise price of each option is fixed at S$0.489.
• The share option shall be exercised, in whole or in part, in accordance with the following schedule from 9 March 2018 to 9 March 2026:
i. 30% of the options shall vest after the end of second anniversary of Grant Date 6;
ii. 30% of the options shall vest after the end of third anniversary of Grant Date 6; and
iii. 40% of the options shall vest after the end of fourth anniversary of Grant Date 6.
• All options are settled by physical delivery of shares.
• The options granted expire after 10 years or upon cessation of the employment of employees.
At the end of the financial year, details of the options granted under the Scheme on unissued ordinary shares of the Company are as follows:
Date of grant of options
Exercise price per share
Options outstanding
at 1 January
2016Options granted
Options cancelled
Options outstanding
at 31 December
2016
Number of option holders
at 31 December
2016Exercise period
’000 ’000 ’000 ’000
11/10/2011 S$0.259 2,016 229 – 2,245 111/10/2012 to 11/10/2021
7/6/2012 S$0.462 1,641 187 – 1,828 97/6/2013 to 7/6/2022
21/1/2013 S$0.973 7,042 800 (160) 7,682 4221/1/2015 to 21/1/2023
16/1/2015 S$1.011 11,900 – (200) 11,700 8116/1/2017 to 16/1/2025
9/3/2016 S$0.489 – 7,140 – 7,140 999/3/2018 to 9/3/2026
22,599 8,356 (360) 30,595
Except for the above, there are no other share options forfeited, expired, cancelled or exercised since commencement of Scheme to 31 December 2016.
DIRECTORS’ STATEMENTYear ended 31 December 2016

EZION HOLDINGS LIMITED
052
Details of options granted to the directors of the Company are as follows:
Name of director
Options grantedfor financialyear ended
31 December2016
Aggregateoptions
granted sincecommencementof Scheme to31 December
2016
Aggregateoptions
exercised sincecommencementof Scheme to31 December
2016
Aggregateoptions
cancelled sincecommencementof Scheme to31 December
2016
Aggregateoptions
outstandingas at
31 December2016
Chew Thiam Keng 1,158,587 8,130,587 – (1,540,000) 6,590,587
Lim Thean Ee 116,378 819,978 (239,600) (120,000) 460,378
Tan Woon Hum 122,929 874,929 (230,400) (120,000) 524,529
Dr Wang Kai Yuen 111,465 863,465 (331,200) (120,000) 412,265
Yee Chia Hsing 100,000 100,000 – – 100,000
1,609,359 10,788,959 (801,200) (1,900,000) 8,087,759
EMPLOYEE SHARE PLAN
The Employee Share Plan (the “Plan”) was approved and adopted by members of the Company at the Extraordinary General Meeting held on 20 April 2008. The Plan is administered by a committee comprising the directors of the Company. No treasury shares had been awarded to employees under the Plan in 2016.
AUDIT COMMITTEE
The members of the Audit Committee during the year and at the date of this statement are:
Tan Woon Hum (Chairman and independent director)Lim Thean Ee (Independent director)Yee Chia Hsing (Independent director)
The Audit Committee performs the functions specified in Section 201B of the Act, the SGX Listing Manual and the Code of Corporate Governance.
The Audit Committee has held 4 meetings since the last directors’ statement. In performing its functions, the Audit Committee met with the Company’s external and internal auditors to discuss the scope of their work, the results of their examination and evaluation of the Company’s internal accounting control system.
The Audit Committee also reviewed the following:
• assistance provided by the Company’s officers to the external and internal auditors;
• quarterly financial information and annual financial statements of the Group and the Company prior to their submission to the directors of the Company for adoption and approval; and
• interested person transactions (as defined in Chapter 9 of the SGX Listing Manual).
DIRECTORS’ STATEMENTYear ended 31 December 2016

ANNUAL REPORT 2016
053
The Audit Committee has full access to management and is given the resources required for it to discharge its functions. It has full authority and the discretion to invite any director or executive officer to attend its meetings. The Audit Committee also recommends the appointment of the external auditors and reviews the level of audit and non-audit fees.
The Audit Committee is satisfied with the independence and objectivity of the external auditors and has recommended to the Board of Directors that the auditors, KPMG LLP, be nominated for re-appointment as auditors at the forthcoming Annual General Meeting of the Company.
In appointing our auditors for the Company and its subsidiaries, we have complied with Rules 712 and 715 of the SGX Listing Manual.
AUDITORS
The auditors, KPMG LLP, have indicated their willingness to accept re-appointment.
On behalf of the Board of Directors
Dr Wang Kai YuenDirector
Chew Thiam KengDirector
3 April 2017
DIRECTORS’ STATEMENTYear ended 31 December 2016
EZION HOLDINGS LIMITED
054
REPORT ON THE AUDIT OF THE FINANCIAL STATEMENTS
Opinion
We have audited the financial statements of Ezion Holdings Limited (the “Company”) and its subsidiaries (the “Group”), which comprise the consolidated statement of financial position of the Group and the statement of financial position of the Company as at 31 December 2016, the consolidated statement of comprehensive income, consolidated statement of changes in equity and consolidated statement of cash flows of the Group for the year then ended, and notes to the financial statements, including a summary of significant accounting policies, as set out on pages 60 to 147.
In our opinion, the accompanying consolidated financial statements of the Group and the statement of financial position of the Company are properly drawn up in accordance with the provisions of the Singapore Companies Act, Chapter 50 (the Act) and Financial Reporting Standards in Singapore (FRSs) so as to give a true and fair view of the consolidated financial position of the Group and the financial position of the Company as at 31 December 2016 and of the consolidated financial performance, consolidated changes in equity and consolidated cash flows of the Group for the year ended on that date.
Basis for opinion
We conducted our audit in accordance with Singapore Standards on Auditing (SSAs). Our responsibilities under those standards are further described in the Auditors’ responsibilities for the audit of the financial statements section of our report. We are independent of the Group in accordance with the Accounting and Corporate Regulatory Authority (ACRA) Code of Professional Conduct and Ethics for Public Accountants and Accounting Entities (ACRA Code) together with the ethical requirements that are relevant to our audit of the financial statements in Singapore, and we have fulfilled our other ethical responsibilities in accordance with these requirements and the ACRA Code. We believe that the audit evidence we have obtained is sufficient and appropriate to provide a basis for our opinion.
Key audit matters
Key audit matters are those matters that, in our professional judgement, were of most significance in our audit of the financial statements of the current period. These matters were addressed in the context of our audit of the financial statements as a whole, and in forming our opinion thereon, and we do not provide a separate opinion on these matters.
INDEPENDENT AUDITORS’ REPORTMembers of the CompanyEzion Holdings Limited
ANNUAL REPORT 2016
055
VALUATION OF THE GROUP’S VESSELS AND SERVICE RIGS(REFER TO NOTE 4 TO THE FINANCIAL STATEMENTS)
The key audit matter How the matter was addressed in our audit
The Group’s vessels and service rigs of US$2.2 billion represented 73% of its total assets as at 31 December 2016. In the current year, there is a risk that the recoverable amount of the Group’s vessels and service rigs may be adversely impacted by the continuing decline in demand for vessels and service rigs chartering services.
Management has assessed the recoverable amounts of the Group’s vessels and service rigs based on the estimated value in use of each vessel and service rig. Each vessel and service rig is a cash-generating unit.
The assessment of impairment depends heavily on management’s judgement and estimates of charter rates, utilisation rates, operating expenditure and discount rates of the Group’s vessels and service rigs.
We obtained management’s value in use calculations and assessed the key assumptions including forecast charter rates, forecast utilisation, operating expenditure and discount rates. We assessed these assumptions by reference to market data and past experience of the Group. These include:
– comparing the forecast charter rates and utilisation to those achieved in prior periods;
– comparing forecast charter rates to signed contracts for contracted periods and challenging basis of charter rates post-contracted periods;
– re-computing the discount rates using market inputs, and incorporating market, country and asset-specific risk premiums; and
– testing the mathematical accuracy of the calculations.
We also evaluated the adequacy of disclosures in respect of the impairment test assessment.
Findings
We found management’s estimate of value in use has been appropriately applied to each individual cash-generating unit. We have considered the relevance of management’s assumptions by reference to the historical forecasts and actual performance, and industry benchmarks.
The disclosures on the key assumptions which have the most impact on the recoverable amounts are balanced and reflective of inherent uncertainties.
INDEPENDENT AUDITORS’ REPORTMembers of the CompanyEzion Holdings Limited

EZION HOLDINGS LIMITED
056
RECOVERABILITY OF TRADE RECEIVABLES (REFER TO NOTE 9 TO THE FINANCIAL STATEMENTS)
The key audit matter How the matter was addressed in our audit
The Group has outstanding trade receivables of US$179 million.
Owing to the oil crisis, the Group has experienced significant delays in the recovery of debts owing from various counterparties in the oil and gas sector.
Determining the creditworthiness of counterparties and the recoverability of receivables requires significant management judgement.
We challenged the Group’s assessment of the recoverability of trade receivables, focusing on those that were long outstanding and/or of significant amounts. Our procedures include:
– analysing the payment history of the debtors for these receivables and the receipts subsequent to the year end;
– considering revised repayment schedules reached with these debtors; and
– assessing the historical reliability of the Group’s estimates in previous periods by comparing the past impairment losses recognised against the actual amounts written-off.
We also considered the adequacy of disclosures about the risk of estimation involved in arriving at the impairment losses recognised.
Findings
We found management have considered relevant factors in its assessment of impairment losses on trade receivables. We found the disclosures to be proportionate to the judgement used by the Group.
INDEPENDENT AUDITORS’ REPORTMembers of the CompanyEzion Holdings Limited
ANNUAL REPORT 2016
057
VALUATION OF INVESTMENTS IN JOINT VENTURES AND ASSOCIATES(REFER TO NOTES 6 AND 7 TO THE FINANCIAL STATEMENTS)
The key audit matter How the matter was addressed in our audit
The Group holds significant amounts of investment in joint ventures and associates. The current market conditions are challenging to the businesses in the oil and gas sectors which these investees operate in.
The Group determines the existence of any objective evidence through which the Group’s investments in joint ventures and associates may be impaired. The identification of different cash-generating units (“CGUs”), assessment of indicators of impairment and where such indicators exist, the determination of the recoverable amounts of the CGUs require judgement.
We assessed the determination of the CGUs and the recoverable amounts of the CGUs based on our understanding of the nature of the Group’s business and the economic environment in which its CGUs operate.
We evaluated the management’s key assumptions and estimates to determine the recoverable amounts of its investments in joint ventures and associates.
Findings
We found the approach taken by the Group to determine the recoverable amounts of its investments to be balanced. We found the disclosures to be proportionate to the judgement used by the Group.
Other information
Management is responsible for the other information. The other information comprises information included in the annual report, but does not include the financial statements and our auditors’ report thereon.
Our opinion on the financial statements does not cover the other information and we do not and will not express any form of assurance conclusion thereon.
In connection with our audit of the financial statements, our responsibility is to read the other information and, in doing so, consider whether the other information is materially inconsistent with the financial statements or our knowledge obtained in the audit or otherwise appears to be materially misstated. If, based on the work we have performed, we conclude that there is a material misstatement of this other information, we are required to report that fact. We have nothing to report in this regard.
INDEPENDENT AUDITORS’ REPORTMembers of the CompanyEzion Holdings Limited

EZION HOLDINGS LIMITED
058
Responsibilities of management and directors for the financial statements
Management is responsible for the preparation of financial statements that give a true and fair view in accordance with the provisions of the Act and FRSs, and for devising and maintaining a system of internal accounting controls sufficient to provide a reasonable assurance that assets are safeguarded against loss from unauthorised use or disposition; and transactions are properly authorised and that they are recorded as necessary to permit the preparation of true and fair financial statements and to maintain accountability of assets.
In preparing the financial statements, management is responsible for assessing the Group’s ability to continue as a going concern, disclosing, as applicable, matters related to going concern and using the going concern basis of accounting unless management either intends to liquidate the Group or to cease operations, or has no realistic alternative but to do so.
The directors’ responsibilities include overseeing the Group’s financial reporting process.
Auditor’s responsibilities for the audit of the financial statements
Our objectives are to obtain reasonable assurance about whether the financial statements as a whole are free from material misstatement, whether due to fraud or error, and to issue an auditors’ report that includes our opinion. Reasonable assurance is a high level of assurance, but is not a guarantee that an audit conducted in accordance with SSAs will always detect a material misstatement when it exists. Misstatements can arise from fraud or error and are considered material if, individually or in the aggregate, they could reasonably be expected to influence the economic decisions of users taken on the basis of these financial statements.
As part of an audit in accordance with SSAs, we exercise professional judgement and maintain professional scepticism throughout the audit. We also:
• Identify and assess the risks of material misstatement of the financial statements, whether due to fraud or error, design and perform audit procedures responsive to those risks, and obtain audit evidence that is sufficient and appropriate to provide a basis for our opinion. The risk of not detecting a material misstatement resulting from fraud is higher than for one resulting from error, as fraud may involve collusion, forgery, intentional omissions, misrepresentations, or the override of internal control.
• Obtain an understanding of internal control relevant to the audit in order to design audit procedures that are appropriate in the circumstances, but not for the purpose of expressing an opinion on the effectiveness of the Group’s internal control.
• Evaluate the appropriateness of accounting policies used and the reasonableness of accounting estimates and related disclosures made by management.
• Conclude on the appropriateness of management’s use of the going concern basis of accounting and, based on the audit evidence obtained, whether a material uncertainty exists related to events or conditions that may cast significant doubt on the Group’s ability to continue as a going concern. If we conclude that a material uncertainty exists, we are required to draw attention in our auditors’ report to the related disclosures in the financial statements or, if such disclosures are inadequate, to modify our opinion. Our conclusions are based on the audit evidence obtained up to the date of our auditor’s report. However, future events or conditions may cause the Group to cease to continue as a going concern.
INDEPENDENT AUDITORS’ REPORTMembers of the CompanyEzion Holdings Limited

ANNUAL REPORT 2016
059
• Evaluate the overall presentation, structure and content of the financial statements, including the disclosures, and whether the financial statements represent the underlying transactions and events in a manner that achieves fair presentation.
• Obtain sufficient appropriate audit evidence regarding the financial information of the entities or business activities within the Group to express an opinion on the consolidated financial statements. We are responsible for the direction, supervision and performance of the group audit. We remain solely responsible for our audit opinion.
We communicate with the directors regarding, among other matters, the planned scope and timing of the audit and significant audit findings, including any significant deficiencies in internal control that we identify during our audit.
We also provide the directors with a statement that we have complied with relevant ethical requirements regarding independence, and to communicate with them all relationships and other matters that may reasonably be thought to bear on our independence, and where applicable, related safeguards.
From the matters communicated with the directors, we determine those matters that were of most significance in the audit of the financial statements of the current period and are therefore the key audit matters. We describe these matters in our auditor’s report unless law or regulation precludes public disclosure about the matter or when, in extremely rare circumstances, we determine that a matter should not be communicated in our report because the adverse consequences of doing so would reasonably be expected to outweigh the public interest benefits of such communication.
REPORT ON OTHER LEGAL AND REGULATORY REQUIREMENTS
In our opinion, the accounting and other records required by the Act to be kept by the Company and by those subsidiary corporations incorporated in Singapore of which we are the auditors have been properly kept in accordance with the provisions of the Act.
The engagement partner on the audit resulting in this independent auditors’ report is Koh Wei Peng.
KPMG LLPPublic Accountants andChartered Accountants
Singapore3 April 2017
INDEPENDENT AUDITORS’ REPORTMembers of the CompanyEzion Holdings Limited

EZION HOLDINGS LIMITED
060
Group Company
Note 2016US$’000
2015US$’000
2016US$’000
2015US$’000
Non-current assetsPlant and equipment 4 2,198,446 2,284,117 406 567
Subsidiaries 5 – – 1,285,514 1,227,226
Joint ventures 6 171,584 131,354 52,232 51,759
Associates 7 78,801 72,621 60,153 53,982
Other assets, including derivatives 8 4,941 11,566 2,241 121
2,453,772 2,499,658 1,400,546 1,333,655
Current assetsTrade receivables 9 178,899 193,247 9,599 8,077
Other assets 8 164,086 80,188 68,053 48,861
Assets held for sale 10 – 105,553 – –
Cash and cash equivalents 11 204,953 229,756 149,497 188,382
547,938 608,744 227,149 245,320
Total assets 3,001,710 3,108,402 1,627,695 1,578,975
EquityShare capital 12 648,940 536,368 648,940 536,368
Perpetual securities 13 116,499 116,499 116,499 116,499
Redeemable exchangeable preference shares 14 23,464 23,464 – –
Reserves 15 (31,549) (32,323) (1,541) (2,915)
Retained earnings 558,030 597,302 798 89,508
Equity attributable to owners of the Company 1,315,384 1,241,310 764,696 739,460
Non-current liabilitiesOther payables, including derivatives 16 33,961 35,954 141,817 90,185
Notes payable 17 372,040 378,691 372,040 378,691
Financial liabilities 18 788,067 851,101 112,082 137,312
Deferred tax liabilities 19 – 449 – –
1,194,068 1,266,195 625,939 606,188
Current liabilitiesTrade payables 20 112,074 126,165 198 40
Other payables 16 42,846 50,091 110,240 93,896
Liabilities relating to assets held for sale 10 – 42,658 – –
Financial liabilities 18 331,055 375,254 122,912 135,689
Provision for tax 6,283 6,729 3,710 3,702
492,258 600,897 237,060 233,327
Total liabilities 1,686,326 1,867,092 862,999 839,515
Total equity and liabilities 3,001,710 3,108,402 1,627,695 1,578,975
STATEMENTS OF FINANCIAL POSITIONAs at 31 December 2016
The accompanying notes form an integral part of these financial statements.

ANNUAL REPORT 2016
061
Note2016
US$’0002015
US$’000
Revenue 22 318,245 351,147
Cost of sales (256,999) (233,082)
Gross profit 61,246 118,065
Other income 32,254 25,236
Administrative expenses (18,328) (19,103)
Other expenses (76,238) (87,308)
Results from operating activities (1,066) 36,890
Finance income 4,695 4,439
Finance costs (32,512) (26,412)
Net finance costs 23 (27,817) (21,973)
Share of results of joint ventures and associates, net of tax (2,041) 23,448
(Loss)/Profit before income tax 24 (30,924) 38,365
Income tax expense 25 (2,682) (1,581)
(Loss)/Profit for the year attributable to owners of the Company (33,606) 36,784
Earnings per share
Basic earnings per share (cents) 26 (2.30) 1.51
Diluted earnings per share (cents) 26 (2.27) 1.49
CONSOLIDATED INCOME STATEMENTYear ended 31 December 2016
The accompanying notes form an integral part of these financial statements.

EZION HOLDINGS LIMITED
062
2016US$’000
2015US$’000
(Loss)/Profit for the year (33,606) 36,784
Other comprehensive income
Items that are or may be reclassified subsequently to profit or loss:
Foreign currency translation differences relating to financial statements of foreign operations 892 (6,409)
Share of foreign currency translation differences of associates 402 2,155
Exchange differences on monetary items forming part of net investment in foreign operations (1,969) (4,861)
Effective portion of changes in fair value of cash flow hedges 1,449 (406)
Other comprehensive income for the year, net of tax 774 (9,521)
Total comprehensive income for the year, attributable to owners of the Company (32,832) 27,263
CONSOLIDATED STATEMENT OF COMPREHENSIVE INCOMEYear ended 31 December 2016
The accompanying notes form an integral part of these financial statements.

ANNUAL REPORT 2016
063At
trib
utab
le t
o ow
ners
of
the
Com
pany
Not
eSh
are
capi
tal
US$
’000
Perp
etua
lse
curit
ies
US$
’000
Red
eem
able
ex
chan
geab
le
pref
eren
cesh
ares
US$
’000
Trea
sury
sh
ares
US$
’000
Fore
ign
curr
ency
tr
ansl
atio
n re
serv
eU
S$’0
00
Hed
ging
re
serv
eU
S$’0
00
Stat
utor
y re
serv
eU
S$’0
00
Ret
aine
d ea
rnin
gsU
S$’0
00To
tal
US$
’000
Non
-co
ntro
lling
in
tere
sts
US$
’000
Tota
l eq
uity
US$
’000
Gro
upAt
1 J
anua
ry 2
015
535,6
54
211,8
74
23,4
64
(102)
(20,2
18)
(1,0
98)
(6)
563,0
59
1,3
12,6
27
(6)
1,3
12,6
21
Tota
l com
preh
ensi
ve in
com
e
for
the
year
Pro
fit f
or t
he y
ear
––
––
––
–36,7
84
36,7
84
–36,7
84
Oth
er c
ompr
ehen
sive
inco
me
Fore
ign
curr
ency
tra
nsla
tion
diff
eren
ces
rela
ting
to fi
nanc
ial
stat
emen
ts o
f fo
reig
n op
erat
ions
––
––
(6,4
09)
––
–(6
,409)
–(6
,409)
Sha
re o
f fo
reig
n cu
rren
cy t
rans
latio
n di
ffer
ence
s of
ass
ocia
tes
––
––
2,1
55
––
–2,1
55
–2,1
55
Exc
hang
e di
ffer
ence
s on
mon
etar
y ite
ms
form
ing
part
of
net
inve
stm
ent
in f
orei
gn o
pera
tions
––
––
(4,8
61)
––
–(4
,861)
–(4
,861)
Eff
ectiv
e po
rtio
n of
cha
nges
in f
air
valu
e of
cas
hflow
hed
ges
––
––
–(4
06)
––
(406)
–(4
06)
Tota
l com
preh
ensi
ve in
com
e
for
the
year
––
––
(9,1
15)
(406)
–36,7
84
27,2
63
–27,2
63
Tran
sact
ions
with
ow
ners
of
the
Com
pany
, rec
ogni
sed
dire
ctly
in
equ
ityCo
ntrib
utio
ns b
y an
d di
strib
utio
ns t
o ow
ners
of
the
Com
pany
R
edem
ptio
n of
per
petu
al s
ecur
ities
–(9
5,3
75)
––
––
–9,0
63
(86,3
12)
–(8
6,3
12)
Acc
rued
per
petu
al s
ecur
ities
di
strib
utio
ns–
––
––
––
(12,5
20)
(12,5
20)
–(1
2,5
20)
Rep
urch
ase
of o
wn
shar
es15
––
–(1
,378)
––
––
(1,3
78)
–(1
,378)
Sha
re o
ptio
ns e
xerc
ised
12
714
––
––
––
–714
–714
Div
iden
ds p
aid
––
––
––
–(1
,193)
(1,1
93)
–(1
,193)
Sha
re-b
ased
pay
men
t tr
ansa
ctio
ns21
––
––
––
–2,1
21
2,1
21
–2,1
21
Tota
l con
trib
utio
ns b
y an
d di
strib
utio
ns t
o ow
ners
714
(95,3
75)
–(1
,378)
––
–(2
,529)
(98,5
68)
–(9
8,5
68)
CONSOLIDATED STATEMENT OF CHANGES IN EQUITY Year ended 31 December 2016
The
acco
mpa
nyin
g no
tes
form
an
inte
gral
par
t of
the
se fi
nanc
ial s
tate
men
ts.

EZION HOLDINGS LIMITED
064At
trib
utab
le t
o ow
ners
of
the
Com
pany
Not
eSh
are
capi
tal
US$
’000
Perp
etua
lse
curit
ies
US$
’000
Red
eem
able
ex
chan
geab
le
pref
eren
cesh
ares
US$
’000
Trea
sury
sh
ares
US$
’000
Fore
ign
curr
ency
tr
ansl
atio
n re
serv
eU
S$’0
00
Hed
ging
re
serv
eU
S$’0
00
Stat
utor
y re
serv
eU
S$’0
00
Ret
aine
d ea
rnin
gsU
S$’0
00To
tal
US$
’000
Non
-co
ntro
lling
in
tere
sts
US$
’000
Tota
leq
uity
US$
’000
Gro
up
Chan
ges
in o
wne
rshi
p in
tere
sts
in
subs
idia
ries
Acq
uisi
tion
of n
on-c
ontr
ollin
g in
tere
sts
––
––
––
–(1
2)
(12)
6(6
)
Tota
l cha
nges
in o
wne
rshi
p in
tere
sts
in s
ubsi
diar
ies
––
––
––
–(1
2)
(12)
6(6
)
Tota
l tra
nsac
tions
with
ow
ners
714
(95,3
75)
–(1
,378)
––
–(2
,541)
(98,5
80)
6(9
8,5
74)
At
31 D
ecem
ber
2015
536,3
68
116,4
99
23,4
64
(1,4
80)
(29,3
33)
(1,5
04)
(6)
597,3
02
1,2
41,3
10
–1,2
41,3
10
CONSOLIDATED STATEMENT OF CHANGES IN EQUITY Year ended 31 December 2016
The
acco
mpa
nyin
g no
tes
form
an
inte
gral
par
t of
the
se fi
nanc
ial s
tate
men
ts.

ANNUAL REPORT 2016
065At
trib
utab
le t
o ow
ners
of
the
Com
pany
Not
eSh
are
capi
tal
US$
’000
Perp
etua
lse
curit
ies
US$
’000
Red
eem
able
ex
chan
geab
le
pref
eren
cesh
ares
US$
’000
Trea
sury
sh
ares
US$
’000
Fore
ign
curr
ency
tr
ansl
atio
n re
serv
eU
S$’0
00
Hed
ging
re
serv
eU
S$’0
00
Stat
utor
y re
serv
eU
S$’0
00
Ret
aine
d ea
rnin
gsU
S$’0
00To
tal
US$
’000
Non
-co
ntro
lling
in
tere
sts
US$
’000
Tota
l eq
uity
US$
’000
Gro
upAt
1 J
anua
ry 2
016
536,3
68
116,4
99
23,4
64
(1,4
80)
(29,3
33)
(1,5
04)
(6)
597,3
02
1,2
41,3
10
–1,2
41,3
10
Tota
l com
preh
ensi
ve in
com
e
for
the
year
Loss
for
the
yea
r–
––
––
––
(33,6
06)
(33,6
06)
–(3
3,6
06)
Oth
er c
ompr
ehen
sive
inco
me
Fore
ign
curr
ency
tra
nsla
tion
diff
eren
ces
rela
ting
to
finan
cial
sta
tem
ents
of
fore
ign
oper
atio
ns–
––
–892
––
–892
–892
Sha
re o
f fo
reig
n cu
rren
cy
tran
slat
ion
diff
eren
ces
of
asso
ciat
es–
––
–402
––
–402
–402
Exc
hang
e di
ffer
ence
s on
m
onet
ary
item
s fo
rmin
g pa
rt
of n
et in
vest
men
t in
for
eign
op
erat
ions
––
––
(1,9
69)
––
–(1
,969)
–(1
,969)
Eff
ectiv
e po
rtio
n of
cha
nges
in
fair
valu
e of
cas
hflow
hed
ges
––
––
–1,4
49
––
1,4
49
–1,4
49
Tota
l com
preh
ensi
ve in
com
e
for
the
year
––
––
(675)
1,4
49
–(3
3,6
06)
(32,8
32)
–(3
2,8
32)
Tran
sact
ions
with
ow
ners
of
the
Com
pany
, rec
ogni
sed
dire
ctly
in
equ
ityCo
ntrib
utio
ns b
y an
d di
strib
utio
ns
to o
wne
rs o
f th
e Co
mpa
ny
Issu
e of
sha
res
112,5
72
––
––
––
–112,5
72
–112,5
72
Acc
rued
per
petu
al s
ecur
ities
di
strib
utio
ns–
––
––
––
(7,6
34)
(7,6
34)
–(7
,634)
Sha
re-b
ased
pay
men
t tr
ansa
ctio
ns21
––
––
––
–1,9
68
1,9
68
–1,9
68
Tota
l con
trib
utio
ns b
y an
d di
strib
utio
ns t
o ow
ners
112,5
72
––
––
––
(5,6
66)
106,9
06
–106,9
06
At 3
1 D
ecem
ber
2016
648,9
40
116,4
99
23,4
64
(1,4
80)
(30,0
08)
(55)
(6)
558,0
30
1,3
15,3
84
–1,3
15,3
84
CONSOLIDATED STATEMENT OF CHANGES IN EQUITY Year ended 31 December 2016
The
acco
mpa
nyin
g no
tes
form
an
inte
gral
par
t of
the
se fi
nanc
ial s
tate
men
ts.

EZION HOLDINGS LIMITED
066
Note 2016US$’000
2015US$’000
Cash flows from operating activities
(Loss)/Profit for the year (33,606) 36,784
Adjustments for:
Income tax expense 25 2,682 1,581
Depreciation expense 4 150,612 134,873
Loss/(Gain) on disposal of:
- plant and equipment 5,116 –
- assets held for sale (26,251) –
Foreign exchange gain (8,144) (5,003)
Gain from change in ownership interest in associates 24 – (8,882)
Income from financial guarantee income provided to joint ventures (1,325) (2,112)
Finance income 23 (4,695) (4,439)
Finance costs 23 32,512 26,412
Net impairment loss on:
- plant and equipment 4 45,647 37,900
- trade receivables 9 25,219 43,228
Equity-settled share-based payment transactions 21 1,968 2,121
Share of results of joint ventures and associates, net of tax 2,041 (23,448)
Operating profit before changes in working capital 191,776 239,015
Changes in working capital:
Trade receivables and other assets (31,530) (81,238)
Trade and other payables (11,651) 49,738
Cash generated from operating activities 148,595 207,515
Tax paid (2,905) (3,666)
Net cash from operating activities 145,690 203,849
Cash flows from investing activities
Advance payments for purchase of plant and equipment (827) (125,149)
Interest received 2,431 8,099
Investment in joint ventures (21,013) 657
Investment in associates (7,607) (4,707)
Proceeds from disposal of plant and equipment 1,829 –
Proceeds from disposal of assets held for sale 20,400 –
Purchase of plant and equipment (66,715) (256,726)
Net cash used in investing activities (71,502) (377,826)
CONSOLIDATED STATEMENT OF CASH FLOWSYear ended 31 December 2016
The accompanying notes form an integral part of these financial statements.

ANNUAL REPORT 2016
067
Note 2016US$’000
2015US$’000
Cash flows from financing activities
Interest paid (38,178) (37,888)
Net proceeds from issuance of notes – 87,413
Net proceeds from issuance of ordinary shares 99,843 –
Net proceeds from exercise of share options – 714
Dividends paid – (1,193)
Proceeds from borrowings 45,666 342,875
Repayment of borrowings (191,813) (250,504)
Repurchase of own shares – (1,378)
Redemption of perpetual securities – (86,312)
Net cash (used in)/from financing activities (84,482) 53,727
Net decrease in cash and cash equivalents (10,294) (120,250)
Cash and cash equivalents at 1 January 229,756 371,510
Effect of exchange rate fluctuations on cash held (14,509) (21,504)
Cash and cash equivalents at 31 December 11 204,953 229,756
CONSOLIDATED STATEMENT OF CASH FLOWSYear ended 31 December 2016
The accompanying notes form an integral part of these financial statements.

EZION HOLDINGS LIMITED
068 NOTES TO THE FINANCIAL STATEMENTSYear ended 31 December 2016
These notes form an integral part of the financial statements.
The financial statements were authorised for issue by the Board of Directors on 3 April 2017.
1 DOMICILE AND ACTIVITIES
Ezion Holdings Limited (the “Company”) is incorporated in Singapore. The address of the Company’s registered office is 15 Hoe Chiang Road, #12-05 Tower Fifteen, Singapore 089316.
The financial statements of the Company as at and for the year ended 31 December 2016 comprise the Company, its subsidiaries and jointly controlled operations (together referred to as the “Group” and individually as “Group entities”) and the Group’s interests in associates and joint ventures.
The principal activities of the Company are those of investment holding company and the provision of management services to its subsidiaries. The principal activities of the significant subsidiaries are set out in note 5 to the financial statements.
2 BASIS OF PREPARATION
(A) STATEMENT OF COMPLIANCE
The financial statements have been prepared in accordance with the Singapore Financial Reporting Standards (“FRS”).
(B) BASIS OF MEASUREMENT
The financial statements have been prepared on the historical cost basis except as otherwise disclosed in the accounting policies below.
(C) FUNCTIONAL AND PRESENTATION CURRENCY
These financial statements are presented in United States dollars (“US$”), which is the Company’s functional currency. All financial information presented in United States dollars has been rounded to the nearest thousand, unless otherwise stated.
(D) USE OF ESTIMATES AND JUDGEMENTS
The preparation of financial statements in conformity with FRSs requires management to make judgements, estimates and assumptions that affect the application of accounting policies and the reported amounts of assets, liabilities, income and expenses. Actual results may differ from these estimates.
Estimates and underlying assumptions are reviewed on an ongoing basis. Revisions to accounting estimates are recognised in the period in which the estimates are revised and in any future periods affected. Information about assumptions and estimation uncertainties that have a significant risk of resulting in a material adjustment within the next financial year are included in note 30.

ANNUAL REPORT 2016
069NOTES TO THE FINANCIAL STATEMENTSYear ended 31 December 2016
3 SIGNIFICANT ACCOUNTING POLICIES
The accounting policies set out below have been applied consistently to all periods presented in these financial statements, and have been applied consistently by Group entities.
(A) BASIS OF CONSOLIDATION
(i) Business combinations
Business combinations are accounted for using the acquisition method in accordance with FRS 103 Business Combination as at the date of acquisition, which is the date on which control is transferred to the Group.
Any contingent consideration payable is recognised at fair value at the date of acquisition and included in the consideration transferred. If the contingent consideration that meets the definition of a financial instrument is classified as equity, it is not remeasured and settlement is accounted for within equity. Otherwise, other contingent consideration is remeasured at fair value at each reporting date and subsequent changes to the fair value of the contingent consideration are recognised in profit or loss.
Non-controlling interests that are present ownership interests and entitle their holders to a proportionate share of the acquiree’s net assets in the event of liquidation are measured either at fair value or at the non-controlling interests’ proportionate share of the recognised amounts of the acquiree’s identifiable net assets, at the acquisition date. The measurement basis taken is elected on a transaction-by-transaction basis. All other non-controlling interests are measured at acquisition-date fair value, unless another measurement basis is required by FRSs.
Costs related to the acquisition, other than those associated with the issue of debt or equity securities, that the Group incurs in connection with a business combination are expensed as incurred.
Changes in the Group’s interest in a subsidiary that do not result in a loss of control are accounted for as transactions with owners in their capacity as owners and therefore no adjustments are made to goodwill and no gain or loss is recognised in profit or loss. Adjustments to non-controlling interests arising from transactions that do not involve the loss of control are based on a proportionate amount of the net assets of the subsidiary.
(ii) Subsidiaries
Subsidiaries are entities controlled by the Group. The Group controls an entity when it is exposed to, or has rights to, variable returns from its involvement with the entity and has the ability to affect those returns through its power over the entity. The financial statements of subsidiaries are included in the consolidated financial statements from the date that control commences until the date that control ceases.
The accounting policies of subsidiaries have been changed when necessary to align them with the policies adopted by the Group. Losses applicable to the non-controlling interests in a subsidiary are allocated to the non-controlling interests even if doing so causes the non-controlling interests to have a deficit balance.
EZION HOLDINGS LIMITED
070 NOTES TO THE FINANCIAL STATEMENTSYear ended 31 December 2016
3 SIGNIFICANT ACCOUNTING POLICIES (CONT’D)
(A) BASIS OF CONSOLIDATION (C0NT’D) (iii) Loss of control
Upon the loss of control, the Group derecognises the assets and liabilities of the subsidiary, any non-controlling interests and the other components of equity related to the subsidiary. Any surplus or deficit arising on the loss of control is recognised in profit or loss. If the Group retains any interest in the previous subsidiary, then such interest is measured at fair value at the date that control is lost. Subsequently, it is accounted for as an equity-accounted investee or as an available-for-sale financial asset depending on the level of influence retained.
(iv) Investments in associates and joint ventures (equity-accounted investees)
Associates are those entities in which the Group has significant influence, but not control or joint control, over the financial and operating policies of these entities. Significant influence is presumed to exist when the Group holds between 20% or more of the voting power of another entity.
A joint venture is an arrangement in which the Group has joint control, whereby the Group has rights to the net assets of the arrangement, rather than rights to its assets and obligations for its liabilities.
Investments in associates and joint ventures are accounted for using the equity method and are recognised initially at cost. The cost of the investments includes transaction costs. Subsequent to initial recognition, the consolidated financial statements include the Group’s share of the profit or loss and other comprehensive income of the equity accounted investees, after adjustments to align the accounting policies of the equity accounted investee with those of the Group, from the date that significant influence joint control commences until the date that significant influence or joint control ceases.
When the Group’s share of losses exceeds its interest in an equity accounted investee, the carrying amount of that interest, including any long-term investments, is reduced to zero, and the recognition of further losses is discontinued except to the extent that the Group has an obligation or has made payments on behalf of the investee.
(v) Joint operations
A joint operation is an arrangement in which the Group has joint control whereby the Group has rights to the assets, and obligations for the liabilities, relating to an arrangement. The Group accounts for each of its assets, liabilities and transactions, including its share of those held or incurred jointly, in relation to the joint operation.

ANNUAL REPORT 2016
071NOTES TO THE FINANCIAL STATEMENTSYear ended 31 December 2016
3 SIGNIFICANT ACCOUNTING POLICIES (CONT’D)
(A) BASIS OF CONSOLIDATION (C0NT’D)
(vi) Transactions eliminated on consolidation
Intra-group balances and transactions, and any unrealised income and expenses arising from intra-group transactions, are eliminated in preparing the consolidated financial statements. Unrealised gains arising from transactions with equity accounted investees are eliminated against the investment to the extent of the Group’s interest in the investee. Unrealised losses are eliminated in the same way as unrealised gains, but only to the extent that there is no evidence of impairment.
(vii) Accounting for subsidiaries, associates and joint ventures
Investments in subsidiaries, associates and joint ventures are stated in the Company’s statement of financial position at cost less accumulated impairment losses.
(B) FOREIGN CURRENCY
(i) Foreign currency transactions
Transactions in foreign currencies are translated to the respective functional currencies of the Group entities at the exchange rates at the dates of the transactions. Monetary assets and liabilities denominated in foreign currencies at the end of the reporting date are retranslated to the functional currency at the exchange rate at that date. The foreign currency gain or loss on monetary items is the difference between amortised cost in the functional currency at the beginning of the year, adjusted for effective interest and payments during the year, and the amortised cost in foreign currency translated at the exchange rate at the end of the year.
Non-monetary assets and liabilities denominated in foreign currencies that are measured at fair value are retranslated to the functional currency at the exchange rate at the date that the fair value was determined. Non-monetary items in a foreign currency that are measured in terms of historical cost are translated using the exchange rate at the date of the transaction. Foreign currency differences arising on retranslation are recognised in profit or loss, except for the differences arising on the retranslation of available-for-sale equity instruments and retranslation of monetary items that are in substance form part of the Group’s net investment in foreign operations (see (iii) below).
(ii) Foreign operations
The assets and liabilities of foreign operations are translated to US$ at exchange rates at the end of the reporting period. The income and expenses of foreign operations are translated to US$ at exchange rates at the dates of the transactions.

EZION HOLDINGS LIMITED
072 NOTES TO THE FINANCIAL STATEMENTSYear ended 31 December 2016
3 SIGNIFICANT ACCOUNTING POLICIES (CONT’D)
(B) FOREIGN CURRENCY (CONT’D)
(ii) Foreign operations (Cont’d)
Foreign currency differences are recognised in other comprehensive income, and presented in the foreign currency translation reserve in equity. When a foreign operation is disposed of such that control, significant influence or joint control is lost, the cumulative amount in the translation reserve related to that foreign operation is reclassified to profit or loss as part of the gain or loss on disposal. When the Group disposes of only part of its interest in a subsidiary that includes a foreign operation while retaining control, the relevant proportion of the cumulative amount is reattributed to non-controlling interests. When the Group disposes of only part of its investment that includes a foreign operation while retaining significant influence or joint control, the relevant proportion of the cumulative amount is reclassified to profit or loss.
When the settlement of a monetary item receivable from or payable to a foreign operation is neither planned nor likely in the foreseeable future, foreign exchange gains and losses arising from such a monetary item are considered to form part of a net investment in a foreign operation. These are recognised in other comprehensive income, and are presented in the translation reserve in equity.
(iii) Net investment in foreign operations
Exchange differences arising from monetary items that in substance form part of the Company’s net investment in a foreign operation are recognised in the Company’s profit or loss. Such exchange differences are reclassified to other comprehensive income in the consolidated financial statements. When the foreign operation is disposed of, the cumulative amount in equity is transferred to profit or loss as an adjustment to the gain or loss arising on disposal.
(C) PLANT AND EQUIPMENT
(i) Recognition and measurement
Items of plant and equipment are measured at cost less accumulated depreciation and accumulated impairment losses.
Cost includes expenditure that is directly attributable to the acquisition of the asset.
Purchased software that is integral to the functionality of the related equipment is capitalised as part of that equipment.
When parts of an item of plant and equipment have different useful lives, they are accounted for as separate items (major components) of plant and equipment.
The gain or loss on disposal of an item of plant and equipment is determined by comparing the proceeds from disposal with the carrying amount of plant and equipment, and is recognised in profit or loss.

ANNUAL REPORT 2016
073NOTES TO THE FINANCIAL STATEMENTSYear ended 31 December 2016
3 SIGNIFICANT ACCOUNTING POLICIES (CONT’D)
(C) PLANT AND EQUIPMENT (CONT’D)
(ii) Subsequent costs
The cost of replacing a component of an item of plant and equipment is recognised in the carrying amount of the item if it is probable that the future economic benefits embodied within the component will flow to the Group, and its cost can be measured reliably. The carrying amount of the replaced component is derecognised. The costs of the day-to-day servicing of plant and equipment are recognised in profit or loss as incurred.
Costs incurred on subsequent dry-docking of vessels are capitalised and depreciated over the shorter of period to next estimated dry-docking and five years. When significant dry-docking costs are incurred prior to the expiry of the depreciation period, the remaining costs of the previous dry-docking are written off in the month of the next dry-docking.
(iii) Depreciation
Depreciation is based on the cost of an asset less its residual value. Significant components of individual assets are assessed and if a component has a useful life that is different from the remainder of that asset, that component is depreciated separately.
Depreciation is recognised as an expense in profit or loss on a straight-line basis over the estimated useful lives of each component of an item of plant and equipment. Leased assets are depreciated over the shorter of the lease term and their useful lives unless it is reasonably certain that the Group will obtain ownership by the end of the lease term. Assets under construction are not depreciated.
Depreciation is recognised from the date that plant and equipment are completed and ready for use.
The estimated useful lives for the current and comparative years are as follows:
Vessels 10 – 25 yearsAssets on board the vessels 3 – 23 yearsDry-docking expenditure 5 yearsRig and other oil and gas related assets 10 – 25 yearsRenovation, furniture, fittings and office equipment 2 yearsMotor vehicles 5 – 7 years
Depreciation methods, useful lives and residual values are reviewed at the end of each reporting period and adjusted if appropriate.

EZION HOLDINGS LIMITED
074 NOTES TO THE FINANCIAL STATEMENTSYear ended 31 December 2016
3 SIGNIFICANT ACCOUNTING POLICIES (CONT’D)
(D) FINANCIAL INSTRUMENTS
(i) Non-derivative financial assets
The Group initially recognises loans and receivables on the date that they are originated. All other financial assets (including assets designated at fair value through profit or loss) are recognised initially on the trade date, which is the date that the Group becomes a party to the contractual provisions of the instrument.
The Group derecognises a financial asset when the contractual rights to the cash flows from the asset expire, or it transfers the rights to receive the contractual cash flows on the financial asset in a transaction in which substantially all the risks and rewards of ownership of the financial asset are transferred. Any interest in transferred financial assets that is created or retained by the Group is recognised as a separate asset or liability.
Financial assets and liabilities are offset and the net amount presented in the statement of financial position when, and only when, the Group has a legal right to offset the amounts and intends either to settle on a net basis or to realise the asset and settle the liability simultaneously.
The Group classifies non-derivative financial assets into the following categories: loans and receivables and available-for-sale financial assets.
Loans and receivables
Loans and receivables are financial assets with fixed or determinable payments that are not quoted in an active market. Such assets are recognised initially at fair value plus any directly attributable transaction costs. Subsequent to initial recognition, loans and receivables are measured at amortised cost using the effective interest rate method, less any impairment losses.
Loans and receivables comprise cash and cash equivalents, trade receivables and other assets (excludes advances to suppliers, prepayments, interest rate swaps used for hedging and available-for-sale financial asset).
Cash and cash equivalents
Cash and cash equivalents comprise cash balances and bank deposits. For the purpose of the statement of cash flows, pledged deposits are excluded from cash and cash equivalents.

ANNUAL REPORT 2016
075NOTES TO THE FINANCIAL STATEMENTSYear ended 31 December 2016
3 SIGNIFICANT ACCOUNTING POLICIES (CONT’D)
(D) FINANCIAL INSTRUMENTS (CONT’D)
(i) Non-derivative financial assets (Cont’d)
Available-for-sale financial assets
Available-for-sale financial assets are non-derivative financial assets that are designated as available for sale or are not classified in any of the above categories of financial assets. Subsequent to initial recognition, they are measured at fair value and changes therein, other than impairment losses (see note 3(g)(i)) and foreign currency differences on available-for-sale equity instruments (see note 3(b)(i)), are recognised in other comprehensive income and presented in the fair value reserve in equity. When an investment is derecognised, the gain or loss accumulated in equity is reclassified to profit or loss.
Where equity instruments do not have a quoted market price in an active market and other methods of determining fair value do not result in a reliable estimate, the investment is measured at cost less impairment losses.
Available-for-sale financial assets comprise equity securities.
(ii) Non-derivative financial liabilities
The Group initially recognises debt securities issued and subordinated liabilities on the date that they are originated. All other financial liabilities (including liabilities designated at fair value through profit or loss) are recognised initially on the trade date, which is the date that the Group becomes a party to the contractual provisions of the instrument.
The Group derecognises a financial liability when its contractual obligations are discharged, cancelled or expire.
Financial assets and liabilities are offset and the net amount presented in the statement of financial position when, and only when, the Group has a legal right to offset the amounts and intends either to settle on a net basis or to realise the asset and settle the liability simultaneously.
The Group classifies non-derivative financial liabilities into the other financial liabilities category. Such financial liabilities are recognised initially at fair value plus any directly attributable transaction costs. Subsequent to initial recognition, these financial liabilities are measured at amortised cost using the effective interest rate method.
Other financial liabilities comprise financial liabilities, notes payable and trade and other payables (excludes downpayments and advances from customers, interest rate swaps used for hedging and deferred revenue).

EZION HOLDINGS LIMITED
076 NOTES TO THE FINANCIAL STATEMENTSYear ended 31 December 2016
3 SIGNIFICANT ACCOUNTING POLICIES (CONT’D)
(D) FINANCIAL INSTRUMENTS (CONT’D)
(iii) Share capital
Ordinary shares
Ordinary shares are classified as equity. Incremental costs directly attributable to the issue of ordinary shares and share options are recognised as a deduction from equity, net of any tax effects.
Perpetual securities
The perpetual securities do not have a maturity date and the Company is able to elect to defer making a distribution subject to the term and conditions of the securities issued. Accordingly, the Company is not considered to have a contractual obligation to make principal repayments or distributions in respect of its perpetual securities issued and the perpetual capital securities are presented within equity. Distributions are treated as dividends which will be directly debited from equity. Incremental costs directly attributable to the issue of the perpetual securities are deducted against the proceeds from the issue.
Preference share capital
Preference share capital is classified as equity if it is non-redeemable, or redeemable only at the Company’s option, and any dividends are discretionary.
Preference share capital is classified as a financial liability if it is redeemable on a specific date or at the option of the shareholders.
(iv) Repurchase, disposal and reissue of share capital (treasury shares)
When share capital recognised as equity is repurchased, the amount of the consideration paid, which includes directly attributable costs, net of any tax effects, is recognised as a deduction from equity. Repurchased shares are classified as treasury shares and are presented in the reserve for own share account. When treasury shares are sold or reissued subsequently, the amount received is recognised as an increase in equity, and the resulting surplus or deficit on the transaction is presented in non-distributable capital reserve.
(v) Intra-group financial guarantees
Financial guarantees are financial instruments issued by the Group that require the issuer to make specified payments to reimburse the holder for the loss it incurs because a specified debtor fails to meet payment when due in accordance with the original or modified terms of a debt instrument.
Financial guarantees are recognised initially at fair value and are classified as financial liabilities. Subsequent to initial measurement, the financial guarantees are stated at the higher of the initial fair value less cumulative amortisation and the amount that would be recognised if they were accounted for as contingent liabilities. When financial guarantees are terminated before their original expiry date, the carrying amount of the financial guarantees is transferred to profit or loss.

ANNUAL REPORT 2016
077NOTES TO THE FINANCIAL STATEMENTSYear ended 31 December 2016
3 SIGNIFICANT ACCOUNTING POLICIES (CONT’D)
(D) FINANCIAL INSTRUMENTS (CONT’D)
(vi) Derivative financial instruments, including hedge accounting
The Group holds derivative financial instruments to hedge its interest rate risk exposures. Embedded derivatives are separated from the host contract and accounted for separately if the economic characteristics and risks of the host contract and the embedded derivative are not closely related, a separate instrument with the same terms as the embedded derivative would meet the definition of a derivative, and the combined instrument is not measured at fair value through profit or loss.
On initial designation of the derivative as the hedging instrument, the Group formally documents the relationship between the hedging instrument and the hedged item, including the risk management objectives and strategy in undertaking the hedge transaction and the hedged risk, together with the methods that will be used to assess the effectiveness of the hedging relationship. The Group makes an assessment, both at the inception of the hedge relationship as well as on an ongoing basis, of whether the hedging instruments are expected to be “highly effective” in offsetting the changes in the fair value or cash flows of the respective hedged items attributable to the hedged risk, and whether the actual results of each hedge are within a range of 80 %-125%. For a cash flow hedge of a forecast transaction, the transaction should be highly probable to occur and should present an exposure to variations in cash flows that could ultimately affect reported profit or loss.
Derivatives are recognised initially at fair value; attributable transactions are recognised in profit or loss as incurred. Subsequent to initial recognition, derivatives are measured at fair value, and changes therein are recognised immediately in profit or loss.
Cash flow hedges
When a derivative is designated as the hedging instrument in a hedge of the variability in cash flows attributable to a particular risk associated with a recognised asset or liability or a highly probable forecast transaction that could affect profit or loss, the effective portion of changes in the fair value of the derivative is recognised in other comprehensive income and presented in the hedging reserve in equity. Any ineffective portion of changes in the fair value of the derivative is recognised immediately in profit or loss.
When the hedged item is a non-financial asset, the amount accumulated in equity is retained in other comprehensive income and reclassified to profit or loss in the same period or periods during which the non-financial item affects profit or loss. In other cases as well, the amount accumulated in equity is reclassified to profit or loss in the same period that the hedged item affects profit or loss. If the hedging instrument no longer meets the criteria for hedge accounting, expires or is sold, terminated or exercised, or the designation is revoked, then hedge accounting is discontinued prospectively. If the forecast transaction is no longer expected to occur, then the balance in equity is reclassified to profit or loss.

EZION HOLDINGS LIMITED
078 NOTES TO THE FINANCIAL STATEMENTSYear ended 31 December 2016
3 SIGNIFICANT ACCOUNTING POLICIES (CONT’D)
(D) FINANCIAL INSTRUMENTS (CONT’D)
(vi) Derivative financial instruments, including hedge accounting (Cont’d)
Other non-trading derivatives
When a derivative financial instrument is not designated in a hedge relationship that qualifies for hedge accounting, all changes in its fair value are recognised immediately in profit or loss.
(E) LEASES
(i) When entities within the Group are lessees of a finance lease
Leased assets in which the Group assumes substantially all the risks and rewards of ownership are classified as finance leases. Upon initial recognition, the leased asset is measured at an amount equal to the lower of its fair value and the present value of the minimum lease payments. Subsequent to initial recognition, the asset is accounted for in accordance with the accounting policy applicable to that asset. Leased assets are depreciated over the shorter of the lease term and their estimated useful lives. Lease payments are apportioned between finance expense and reduction of the lease liability. The finance expense is allocated to each period during the lease term so as to produce a constant periodic rate of interest on the remaining balance of the liability. Contingent lease payments are accounted for by revising the minimum lease payments over the remaining term of the lease when the lease adjustment is confirmed.
At inception, an arrangement that contains a lease is accounted for as such based on the terms and conditions even though the arrangement is not in the legal form of a lease.
(ii) When entities within the Group are lessees of an operating lease
Where the Group has the use of assets under operating leases, payments made under the leases are recognised in profit or loss on a straight-line basis over the term of the lease. Lease incentives received are recognised in profit or loss as an integral part of the total lease payments made. Contingent rentals are charged to profit or loss in the accounting period in which they are incurred.
(iii) When entities within the Group are lessors of a finance lease
When entities within the Group are lessor of the finance lease, the amounts due under the leases, after deduction of unearned charges, are included in “Finance lease receivables” as appropriate. The difference between the gross receivable and present value of the receivable is recognised as unearned interest. Interest receivable is recognised over the periods of the leases so as to give a constant rate of return on the net investment in the leases.

ANNUAL REPORT 2016
079NOTES TO THE FINANCIAL STATEMENTSYear ended 31 December 2016
3 SIGNIFICANT ACCOUNTING POLICIES (CONT’D)
(E) LEASES (CONT’D)
(iv) When entities within the Group are lessors of an operating lease
Where the Group leases out assets under operating leases, the leased assets are included in statement of financial position according to their nature and, where applicable, are depreciated in accordance with Group’s depreciation policies. Revenue arising from operating leases is recognised in accordance with the Group’s revenue recognition policies.
(F) INTER-COMPANY LOANS
In the Company’s financial statements, inter-company loans to subsidiaries are stated at fair value at inception. The difference between the fair value and the loan amount at inception is recognised as additional investments in subsidiaries in the Company’s financial statements. Subsequently, these loans are measured at amortised cost using the effective interest rate method. The unwinding of the difference is recognised as interest income in profit or loss over the expected repayment period.
Inter-company loans, where settlement is neither planned nor likely to occur in the foreseeable future, are in substance, part of the holding company’s net investment in the entities and are stated at cost less accumulated impairment losses.
Such balances are eliminated in full in the Group’s consolidated financial statements.
(G) IMPAIRMENT
(i) Non-derivative financial assets
A financial asset not carried at fair value through profit or loss is assessed at the end of each reporting period to determine whether there is objective evidence that it is impaired. A financial asset is impaired if objective evidence indicates that a loss event has occurred after the initial recognition of the asset, and that the loss event had a negative effect on the estimated future cash flows of that asset that can be estimated reliably.
Objective evidence that financial assets are impaired can include default or delinquency by a debtor, restructuring of an amount due to the Group on terms that the Group would not consider otherwise, indications that a debtor or issuer will enter bankruptcy, adverse changes in the payment status of borrowers or issuers in the Group, economic conditions that correlate with defaults or the disappearance of an active market for a security. In addition, for an investment in an equity security, a significant or prolonged decline in its fair value below its cost is objective evidence of impairment. The Group considers a decline of 20% to be significant and a period of 9 months to be prolonged.

EZION HOLDINGS LIMITED
080 NOTES TO THE FINANCIAL STATEMENTSYear ended 31 December 2016
3 SIGNIFICANT ACCOUNTING POLICIES (CONT’D)
(G) IMPAIRMENT (CONT’D)
(i) Non-derivative financial assets (Cont’d)
Loans and receivables
The Group considers evidence of impairment for loans and receivables at both a specific asset and collective level. All individually significant loans and receivables are assessed for specific impairment. All individually significant receivables found not to be specifically impaired are then collectively assessed for any impairment that has been incurred but not yet identified. Loans and receivables that are not individually significant are collectively assessed for impairment by grouping together loans and receivables with similar risk characteristics.
In assessing collective impairment, the Group uses historical trends of the probability of default, the timing of recoveries and the amount of loss incurred, adjusted for management’s judgement as to whether current economic and credit conditions are such that the actual losses are likely to be greater or less than suggested by historical trends.
An impairment loss in respect of a financial asset measured at amortised cost is calculated as the difference between its carrying amount and the present value of the estimated future cash flows, discounted at the asset’s original effective interest rate. Losses are recognised in profit or loss and reflected in an allowance account against loans and receivables. Interest on the impaired asset continues to be recognised. When the Group considers that there are no realistic prospects of recovery of the asset, the relevant amounts are written off. If the amount of impairment loss subsequently decreases and the decrease can be related objectively to an event occurring after the impairment was recognised, then the previously recognised impairment loss is reversed through profit or loss.
Available-for-sale financial assets
Impairment losses on available-for-sale financial assets are recognised by reclassifying the losses accumulated in the fair value reserve in equity to profit or loss. The cumulative loss that is reclassified from equity to profit or loss is the difference between the acquisition cost, net of any principal repayment and amortisation, and the current fair value, less any impairment loss recognised previously in profit or loss. Changes in impairment provisions attributable to application of the effective interest method are reflected as a component of interest income. If, in a subsequent period, the fair value of an impaired available-for-sale debt security increases and the increase can be related objectively to an event occurring after the impairment loss was recognised in profit or loss, then the impairment loss is reversed. The amount of the reversal is recognised in profit or loss. However, any subsequent recovery in the fair value of an impaired available-for-sale equity security is recognised in other comprehensive income.

ANNUAL REPORT 2016
081NOTES TO THE FINANCIAL STATEMENTSYear ended 31 December 2016
3 SIGNIFICANT ACCOUNTING POLICIES (CONT’D)
(G) IMPAIRMENT (CONT’D)
(ii) Non-financial assets
The carrying amounts of the Group’s non-financial assets are reviewed at each reporting date to determine whether there is any indication of impairment. If any such indication exists, then the asset’s recoverable amount is estimated. For goodwill, the recoverable amount is estimated each year at the same time. An impairment loss is recognised if the carrying amount of an asset or its related cash-generating unit (“CGU”) exceeds its estimated recoverable amount.
The recoverable amount of an asset or CGU is the greater of its value in use and its fair value less costs to sell. In assessing value in use, the estimated future cash flows are discounted to their present value using a pre-tax discount rate that reflects current market assessments of the time value of money and the risks specific to the asset or CGU. For the purpose of impairment testing, assets that cannot be tested individually are grouped together into the smallest group of assets that generates cash inflows from continuing use that are largely independent of the cash inflows of other assets or CGU. Subject to an operating segment ceiling test, for the purposes of goodwill impairment testing, CGUs to which goodwill has been allocated are aggregated so that the level at which impairment is tested reflects the lowest level at which goodwill is monitored for internal reporting purposes. Goodwill acquired in a business combination is allocated to groups of CGUs that are expected to benefit from the synergies of the combination.
The Group’s corporate assets do not generate separate cash inflows and are utilised by more than one CGU. Corporate assets are allocated to CGUs on a reasonable and consistent basis and tested for impairment as part of the testing of the CGU to which the corporate asset is allocated.
Impairment losses are recognised in profit or loss. Impairment losses recognised in respect of CGUs are allocated first to reduce the carrying amount of any goodwill allocated to the CGU (group of CGUs), and then to reduce the carrying amounts of the other assets in the CGU (group of CGUs) on a pro rata basis.
An impairment loss in respect of goodwill is not reversed. In respect of other assets, impairment losses recognised in prior periods are assessed at each reporting date for any indications that the loss has decreased or no longer exists. An impairment loss is reversed if there has been a change in the estimates used to determine the recoverable amount. An impairment loss is reversed only to the extent that the asset’s carrying amount does not exceed the carrying amount that would have been determined, net of depreciation or amortisation, if no impairment loss had been recognised.
(H) NON-CURRENT ASSETS HELD FOR SALE
Non-current assets comprising assets and liabilities that are expected to be recovered primarily through sale or distribution rather than through continuing use, are classified as held for sale or distribution. Immediately before classification as held for sale, the assets are remeasured in accordance with the Group’s accounting policies. Thereafter, the assets are generally measured at the lower of their carrying amount and fair value less costs to sell. Impairment losses on initial classification as held for sale or distribution and subsequent gains nor losses on remeasurement are recognised in profit or loss. Gains are not recognised in excess of any cumulative impairment loss.
Plant and equipment once classified as held for sale are not depreciated.

EZION HOLDINGS LIMITED
082 NOTES TO THE FINANCIAL STATEMENTSYear ended 31 December 2016
3 SIGNIFICANT ACCOUNTING POLICIES (CONT’D)
(I) EMPLOYEE BENEFITS
(i) Defined contribution plans
A defined contribution plan is a post-employment benefit plan under which an entity pays fixed contributions into a separate entity and will have no legal or constructive obligations to pay further amounts. Obligations for contributions to defined contribution pension plans are recognised as an employee benefit expense in profit or loss in the periods during which services are rendered by employees.
(ii) Short-term employee benefits
Short-term employee benefit obligations are measured on an undiscounted basis and are expensed as the related service is provided. A liability is recognised for the amount expected to be paid under short-term cash bonus or profit-sharing plans if the Group has a present legal or constructive obligation to pay this amount as a result of past service provided by the employee and the obligation can be estimated reliably.
(iii) Share-based payment transactions
The grant date fair value of share-based payment awards granted to employees is recognised as an employee expense, with a corresponding increase in equity, over the period that the employees unconditionally become entitled to the awards. The amount recognised as an expense is adjusted to reflect the number of awards for which the related service and non-market vesting conditions are expected to be met, such that the amount ultimately recognised as an expense is based on the number of awards that meet the related service and non-market performance conditions at the vesting date. For share-based payment awards with non-vesting conditions, the grant date fair value of the share-based payment is measured to reflect such conditions and there is no true-up for differences between expected and actual outcomes.
(J) PROVISIONS
A provision is recognised if, as a result of a past event, the Group has a present legal or constructive obligation that can be estimated reliably, and it is probable that an outflow of economic benefits will be required to settle the obligation. Provisions are determined by discounting the expected future cash flows at a pre-tax rate that reflects current market assessments of the time value of money and the risks specific to the liability.
(K) REVENUE RECOGNITION
(i) Chartering and offshore support services
Revenue from chartering and offshore support services relates to chartering of vessels and is recognised in profit or loss on a straight-line basis over the respective term of the charter, net of trade discounts.
(ii) Rendering of marine services
Revenue from rendering of marine services is recognised as and when the related service is rendered.

ANNUAL REPORT 2016
083NOTES TO THE FINANCIAL STATEMENTSYear ended 31 December 2016
3 SIGNIFICANT ACCOUNTING POLICIES (CONT’D)
(K) REVENUE RECOGNITION (CONT’D)
(iii) Sale of goods Revenue from the sale of goods is measured at the fair value of the consideration received or receivable, net of returns and allowances, trade discounts and volume rebates. Revenue is recognised when persuasive evidence exists, usually in the form of an executed sales agreement, that the significant risks and rewards of ownership have been transferred to the customer, recovery of the consideration is probable, the associated costs and possible return of goods can be estimated reliably, there is no continuing management involvement with the goods, and the amount of revenue can be measured reliably. If it is probable that discounts will be granted and the amount can be measured reliably, then the discount is recognised as a reduction of revenue as the sales are recognised.
The timing of the transfer of risks and rewards varies depending on the individual terms of the sales agreement.
(iv) Management services fees
Management services fees are recognised as and when the related services are rendered.
(v) Dividend income
Dividend income is recognised in profit or loss when the shareholders’ right to receive payment is established.
(L) FINANCE INCOME AND COSTS
Finance income comprises interest income on bank deposits and finance leases. Interest income is recognised as it accrues in profit or loss, using the effective interest method.
Finance costs comprise interest expense on borrowings are recognised in profit or loss.
Borrowing costs that are not directly attributable to the acquisition, construction or production of a qualifying asset are recognised in profit or loss using the effective interest method.
(M) INCOME TAX EXPENSE
Income tax expense comprises current and deferred tax. Current tax and deferred tax is recognised in profit or loss except to the extent that it relates to items recognised directly in equity or in other comprehensive income.
Current tax is the expected tax payable or receivable on the taxable income or loss for the period, using tax rates enacted or substantively enacted at the reporting date, and any adjustment to tax payable or receivable in respect of previous periods.

EZION HOLDINGS LIMITED
084 NOTES TO THE FINANCIAL STATEMENTSYear ended 31 December 2016
3 SIGNIFICANT ACCOUNTING POLICIES (CONT’D)
(M) INCOME TAX EXPENSE (CONT’D)
Deferred tax is recognised in respect of temporary differences between the carrying amounts of assets and liabilities for financial reporting purposes and the amounts used for taxation purposes. Deferred tax is not recognised for temporary differences on the initial recognition of assets or liabilities in a transaction that affects neither accounting nor taxable profit or loss.
Deferred tax is measured at the tax rates that are expected to be applied to the temporary differences when they reverse, based on the laws that have been enacted or substantively enacted by the reporting date.
Deferred tax assets and liabilities are offset if there is a legally enforceable right to offset current tax liabilities and assets, and they relate to income taxes levied by the same tax authority on the same taxable entity or on different tax entities, but they intend to settle current tax liabilities and assets on a net basis or their tax assets and liabilities will be realised simultaneously.
A deferred tax asset is recognised for unused tax losses, tax credits and deductible temporary differences, to the extent that it is probable that future taxable profits will be available against which they can be utilised. Deferred tax assets are reviewed at each reporting date and are reduced to the extent that it is no longer probable that the related tax benefit will be realised.
In determining the amount of current and deferred tax, the Company takes into account the impact of uncertain tax positions and whether additional taxes and interest may be due. The Company believes that its accruals for tax liabilities are adequate for all open tax years based on its assessment of many factors, including interpretations of tax law and prior experience. This assessment relies on estimates and assumptions and may involve a series of judgements about future events. New information may become available that causes the Company to change its judgement regarding the adequacy of the existing tax liabilities; such changes to tax liabilities will impact tax expense in the period that such a determination is made.
(N) EARNINGS PER SHARE
The Group presents basic and diluted earnings per share (“EPS”) data for its ordinary shares. Basic EPS is calculated by dividing the profit or loss attributable to ordinary shareholders of the Company by the weighted average number of ordinary shares outstanding during the year, adjusted for own shares held. Diluted EPS is determined by adjusting the profit or loss attributable to ordinary shareholders and the weighted average number of ordinary shares outstanding, adjusted for own shares held, for the effects of all dilutive potential ordinary shares, which comprise redeemable exchangeable preference shares and share options granted to employees.
ANNUAL REPORT 2016
085NOTES TO THE FINANCIAL STATEMENTSYear ended 31 December 2016
3 SIGNIFICANT ACCOUNTING POLICIES (CONT’D)
(O) SEGMENT REPORTING
An operating segment is a component of the Group that engages in business activities from which it may earn revenues and incur expenses, including revenues and expenses that relate to transactions with any of the Group’s other components. All operating segments’ operating results are reviewed regularly by the Group’s Chief Executive Officer to make decisions about resources to be allocated to the segment and assess its performance, and for which discrete financial information is available.
Segment results that are reported to the Group’s Chief Executive Officer include items directly attributable to a segment as well as those that can be allocated on a reasonable basis. Unallocated items comprise mainly corporate assets (primarily the Company’s headquarters), head office expenses and tax liabilities.
Segment capital expenditure is the total cost incurred during the year to acquire plant and equipment.
(P) NEW STANDARDS AND INTERPRETATIONS ISSUED BUT NOT YET EFFECTIVE IN THE FINANCIAL YEAR ENDED 31 DECEMBER 2016
A number of new standards and amendments to standards are effective for annual periods beginning after 1 January 2016, and earlier application is permitted; however, the Group has not early applied the following new or amended standards in preparing these statements.
For those new standards and amendments to standards that are expected to have an effect on the financial statements of the Group and the Company in future financial periods, management has completed its preliminary assessment and will perform detailed analysis on certain available policy choices, transitional optional exemptions and practical expedients. The Group does not plan to adopt these standards early.

EZION HOLDINGS LIMITED
086 NOTES TO THE FINANCIAL STATEMENTSYear ended 31 December 2016
3 SIGNIFICANT ACCOUNTING POLICIES (CONT’D)
(P) NEW STANDARDS AND INTERPRETATIONS ISSUED BUT NOT YET EFFECTIVE IN THE FINANCIAL YEAR ENDED 31 DECEMBER 2016 (CONT’D)
Applicable to 2018 financial statements
New standards
Summary of the requirements Potential impact on the financial statements
FRS 115 Revenue from Contracts with Customers
FRS 115 establishes a comprehensive framework for determining whether, how much and when revenue is recognised. It also introduces new cost guidance which requires certain costs of obtaining and fulfilling contracts to be recognised as separate assets when specified criteria are met.
When effective, FRS 115 replaces existing revenue recognition guidance, including FRS 18 Revenue, FRS 11 Construction Contracts, INT FRS 113 Customer Loyalty Programmes, INT FRS 115 Agreements for the Construction of Real Estate, INT FRS 118 Transfers of Assets from Customers and INT FRS 31 Revenue – Barter Transactions Involving Advertising Services.
FRS 115 is effective for annual periods beginning on or after 1 January 2018, with early adoption permitted. FRS 115 offers a range of transition options including full retrospective adoption where an entity can choose to apply the standard to its historical transactions and retrospectively adjust each comparative period presented in its 2018 financial statements. When applying the full retrospective method, an entity may also elect to use a series of practical expedients to ease transition.
During 2016, the Group completed its initial assessment of the impact on the Group’s financial statements.
Overall, the Group does not expect a significant impact on the financial statements in the year of initial adoption. The Group’s initial assessment is as described below
Identification of performance obligations and timing of revenue recognition
The Group main sources of revenue can be summarised as:-
- chartering and offshore support services- rendering of marine services
The Group expects to recognise a new revenue stream as a result of the separation of non-lease components such as crewing, maintenance and others from its chartering services.
Currently, the Group recognised its leasing revenue from chartering contracts, which include a services component, on a straight line basis over the contract period.
Transition - The Group plans to adopt the standard when it becomes effective in 2018 using the full retrospective approach modified by practical expedients. The Group is currently performing a detailed analysis under FRS 115 to determine its election of the practical expedients and to quantify the transition adjustments on its financial statements.

ANNUAL REPORT 2016
087NOTES TO THE FINANCIAL STATEMENTSYear ended 31 December 2016
3 SIGNIFICANT ACCOUNTING POLICIES (CONT’D)
(P) NEW STANDARDS AND INTERPRETATIONS ISSUED BUT NOT YET EFFECTIVE IN THE FINANCIAL YEAR ENDED 31 DECEMBER 2016 (CONT’D)
Applicable to 2018 financial statements
New standards
Summary of the requirements Potential impact on the financial statements
FRS 109 Financial Instruments
FRS 109 replaces most of the existing guidance in FRS 39 Financial Instruments: Recognition and Measurement. It includes revised guidance on the classification and measurement of financial instruments, a new expected credit loss model for calculating impairment on financial assets, and new general hedge accounting requirements. It also carries forward the guidance on recognition and de-recognition of financial instruments from FRS 39.
FRS 109 is effective for annual periods beginning on or after 1 January 2018, with early adoption permitted. Retrospective application is generally required, except for hedge accounting. For hedge accounting, the requirements are generally applied prospectively, with some limited exceptions. Restatement of comparative information is not mandatory. If comparative information is not restated, the cumulative effect is recorded in opening equity as at 1 January 2018.
During 2016, the Group completed its initial assessment of the impact on the Group’s financial statements.
Overall, the Group does not expect a significant impact on its opening equity for the effect of applying the impairment requirements of FRS 109. The Group’s initial assessment of the three elements of FRS 109 is as described below.
Classification and measurement - The Group does not expect a significant change to the measurement basis arising from adopting the new classification and measurement model under FRS 109.
Loans and receivables that are currently accounted for at amortised cost will continue to be accounted for using amortised cost model under FRS 109.
For equity investment currently classified as available for sale, the group expects to classify it as financial assets subsequently measured at fair value through other comprehensive income (“FVOCI”) as they are held to maintain liquidity for the Group and may be sold from time to time should the need arises.
Impairment – On adoption of FRS 109, the Group does not expect a significant increase in the impairment loss allowance because it currently applies a specific identification basis of impairment assessment on all its customers on an individual basis, using the incurred loss model. The Group plans to apply the simplified approach and record lifetime expected impairment losses for all trade receivables.
Hedge accounting – The Group expects that all its existing hedges that are designated in effective hedging relationships will continue to qualify for hedge accounting under FRS 109.
Transition – The Group plans to adopt the standard when it becomes effective in 2018 without restating comparative information. The Group will perform detailed analysis of certain available policy choices and other refinements as described above.

EZION HOLDINGS LIMITED
088 NOTES TO THE FINANCIAL STATEMENTSYear ended 31 December 2016
3 SIGNIFICANT ACCOUNTING POLICIES (CONT’D)
(P) NEW STANDARDS AND INTERPRETATIONS ISSUED BUT NOT YET EFFECTIVE IN THE FINANCIAL YEAR ENDED 31 DECEMBER 2016 (CONT’D)
Convergence with International Financial Reporting Standards (IFRS)
In addition, the Accounting Standards Council (ASC) announced on 29 May 2014, that Singapore-incorporated companies listed on the Singapore Exchange (SGX) will apply a new financial reporting framework identical to the International Financial Reporting Standards (referred to as SG-IFRS in these financial statements) for the financial year ending 31 December 2018, onwards.
The Group has performed a preliminary assessment of the impact of SG-IFRS 1 First-time adoption of International Financial Reporting Standards for the transition to the new reporting framework. Based on the Group’s preliminary assessment, the Group expects that the impact on adoption of SG-IFRS 15 Revenue from Contracts with Customers and SG-IFRS 9 Financial Instruments will be similar to adopting FRS 115 and FRS 109 as described in this Note.
Other than arising from the adoption of new and revised standards, the Group does not expect to change its existing accounting policies on adoption of the new framework.
The Group will perform detailed analysis of certain available policy choices, transitional optional exemptions and transitional mandatory exceptions under SG-IFRS 1 and the preliminary assessment may be subject to changes arising from the detailed analyses.

ANNUAL REPORT 2016
089NOTES TO THE FINANCIAL STATEMENTSYear ended 31 December 2016
3 SIGNIFICANT ACCOUNTING POLICIES (CONT’D)
(P) NEW STANDARDS AND INTERPRETATIONS ISSUED BUT NOT YET EFFECTIVE IN THE FINANCIAL YEAR ENDED 31 DECEMBER 2016 (CONT’D)
Applicable to 2019 financial statements
New standards
Summary of the requirements Potential impact on the financial statements
FRS 116 Leases
FRS 116 eliminates the lessee’s classification of leases as either operating leases or finance leases and introduces a single lessee accounting model. Applying the new model, a lessee is required to recognise right-of-use (ROU) assets and lease liabilities for all leases with a term of more than 12 months, unless the underlying asset is of low value.
FRS 116 substantially carries forward the lessor accounting requirements in FRS 17 Leases. Accordingly, a lessor continues to classify its leases as operating leases or finance leases, and to account for these two types of leases using the FRS 17 operating lease and finance lease accounting models respectively. However, FRS 116 requires more extensive disclosures to be provided by a lessor.
When effective, FRS 116 replaces existing lease accounting guidance, including FRS 17, INT FRS 104 Determining whether an Arrangement contains a Lease, INT FRS 15 Operating Leases – Incentives, and INT FRS 27 Evaluating the Substance of Transactions Involving the Legal Form of a Lease.
FRS 116 is effective for annual periods beginning on or after 1 January 2019, with early adoption permitted if FRS 115 is also applied.
The Group has performed a preliminary high-level assessment of the new standard on its existing operating lease arrangements as a lessee (refer to Note 28(b)). Based on the preliminary assessment, the Group expects these operating leases to be recognised as ROU assets with corresponding lease liabilities under the new standard. Assuming no additional new operating leases in future years until the effective date, the Group expects the amount of ROU asset and lease liability to be lower due to discounting and as the lease terms run down.
The Group plans to adopt the standard when it becomes effective in 2019. The Group will perform a detailed analysis of the standard, including the transition options and practical expedients.
The Group expects that the impact on adoption of IFRS 16 Leases to be similar to adopting SG-FRS 116, after the transition to SG-IFRS in 2018 as described above.

EZION HOLDINGS LIMITED
090 NOTES TO THE FINANCIAL STATEMENTSYear ended 31 December 2016
4 PL
ANT
AND
EQUI
PMEN
T
Gro
upN
ote
Asse
tsun
der
cons
truc
tion
US$
’000
Vess
els
US$
’000
Asse
ts o
n bo
ard
the
vess
els
US$
’000
Dry
-doc
king
ex
pend
iture
US$
’000
Rig
and
ot
her
oil
and
gas
rela
ted
asse
tsU
S$’0
00
Ren
ovat
ion,
fu
rnitu
re,
fittin
gs a
nd
offic
e eq
uipm
ent
US$
’000
Mot
or
vehi
cles
US$
’000
Tota
l U
S$’0
00
Cost
At
1 J
anua
ry 2
015
775,8
99
375,8
78
2,8
24
14,3
56
1,1
39,4
98
1,9
16
711
2,3
11,0
82
Add
ition
s193,8
64
4,6
76
32,7
30
231,1
01
599
–432,9
73
Rec
lass
ifica
tion
(213,6
90)
––
–213,6
90
––
–
Rec
lass
ifica
tion
to a
sset
s he
ld f
or s
ale
10
––
––
(117,4
27)
––
(117,4
27)
Tran
slat
ion
diff
eren
ces
on c
onso
lidat
ion
–(1
,034)
––
(5,3
82)
––
(6,4
16)
At
31 D
ecem
ber
2015
756,0
73
379,5
20
2,8
27
17,0
86
1,4
61,4
80
2,5
15
711
2,6
20,2
12
Add
ition
s48,2
13
2,3
99
11
11,3
77
56,3
85
191
–118,5
76
Dis
posa
ls–
(9,7
23)
(149)
(1,3
84)
–(1
8)
–(1
1,2
74)
Rec
lass
ifica
tion
(175,7
72)
––
–175,7
72
––
–
Tran
slat
ion
diff
eren
ces
on c
onso
lidat
ion
–(7
9)
––
(1,7
59)
––
(1,8
38)
At
31 D
ecem
ber
2016
628,5
14
372,1
17
2,6
89
27,0
79
1,6
91,8
78
2,6
88
711
2,7
25,6
76
Accu
mul
ated
dep
reci
atio
n an
d im
pairm
ent
loss
es
At
1 J
anua
ry 2
015
–43,2
59
2,1
24
1,2
22
127,1
94
1,2
94
409
175,5
02
Dep
reci
atio
n ch
arge
for
the
yea
r–
16,1
28
256
610
117,3
50
439
90
134,8
73
Impa
irmen
t lo
ss f
or t
he y
ear
–9,4
46
––
28,4
54
––
37,9
00
Rec
lass
ifica
tion
to a
sset
s he
ld f
or s
ale
10
––
––
(11,8
74)
––
(11,8
74)
Tran
slat
ion
diff
eren
ces
on c
onso
lidat
ion
–(5
2)
––
(254)
––
(306)
At
31 D
ecem
ber
2015
–68,7
81
2,3
80
1,8
32
260,8
70
1,7
33
499
336,0
95
Dep
reci
atio
n ch
arge
for
the
yea
r–
15,6
11
208
2,9
90
131,3
63
357
83
150,6
12
Dis
posa
ls–
(3,7
34)
(115)
(625)
–(1
8)
–(4
,492)
Impa
irmen
t lo
ss f
or t
he y
ear
11,7
17
11,4
77
––
22,4
53
––
45,6
47
Tran
slat
ion
diff
eren
ces
on c
onso
lidat
ion
–(2
2)
––
(611)
1–
(632)
At
31 D
ecem
ber
2016
11,7
17
92,1
13
2,4
73
4,1
97
414,0
75
2,0
73
582
527,2
30
Carr
ying
am
ount
s
At
1 J
anua
ry 2
015
775,8
99
332,6
19
700
13,1
34
1,0
12,3
04
622
302
2,1
35,5
80
At
31 D
ecem
ber
2015
756,0
73
310,7
39
447
15,2
54
1,2
00,6
10
782
212
2,2
84,1
17
At
31 D
ecem
ber
2016
616,7
97
280,0
04
216
22,8
82
1,2
77,8
03
615
129
2,1
98,4
46
Dur
ing
the
finan
cial
yea
r, th
e G
roup
acq
uire
d pl
ant an
d eq
uipm
ent w
ith a
n ag
greg
ate
cost
of ap
prox
imat
ely
US$118,5
76,0
00 (2015: U
S$432,9
73,0
00)
of w
hich
app
roxi
mat
ely
US$2,3
51,0
00 (
2015: U
S$71,7
89,0
00)
was
pai
d in
adv
ance
to
the
supp
liers
in t
he p
revi
ous
year
.
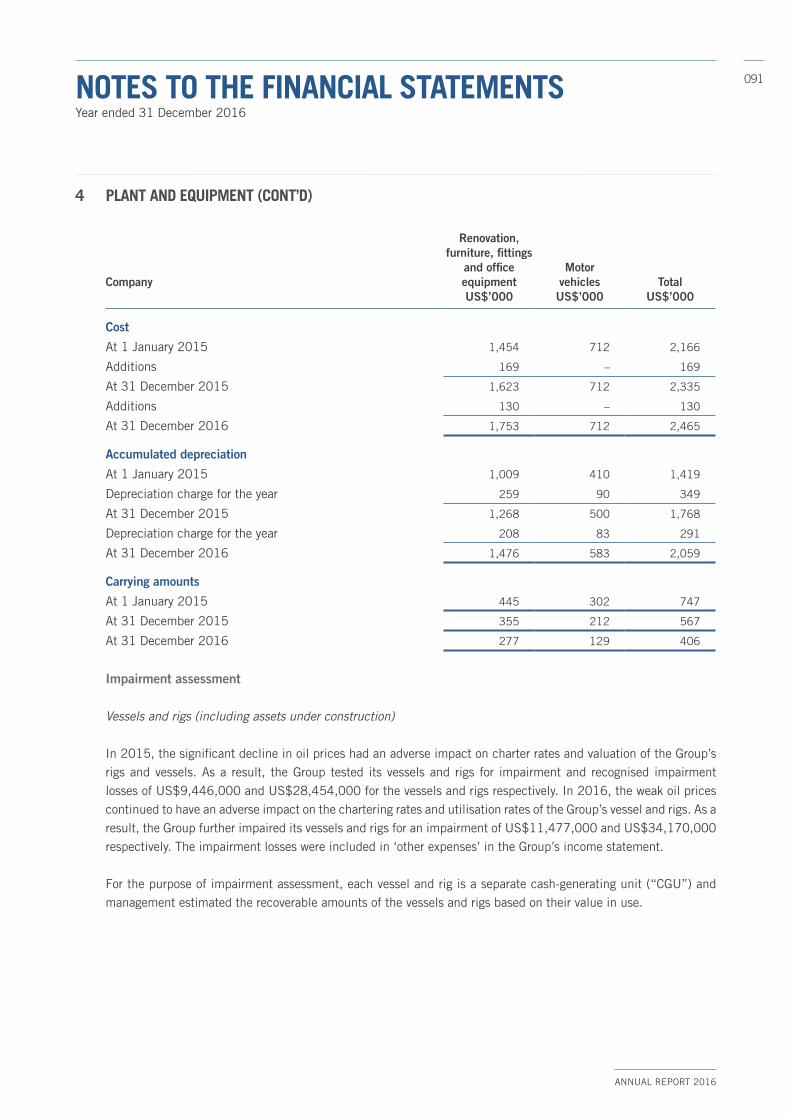
ANNUAL REPORT 2016
091NOTES TO THE FINANCIAL STATEMENTSYear ended 31 December 2016
4 PLANT AND EQUIPMENT (CONT’D)
Company
Renovation, furniture, fittings
and office equipmentUS$’000
Motor vehiclesUS$’000
Total US$’000
Cost
At 1 January 2015 1,454 712 2,166
Additions 169 – 169
At 31 December 2015 1,623 712 2,335
Additions 130 – 130
At 31 December 2016 1,753 712 2,465
Accumulated depreciation
At 1 January 2015 1,009 410 1,419
Depreciation charge for the year 259 90 349
At 31 December 2015 1,268 500 1,768
Depreciation charge for the year 208 83 291
At 31 December 2016 1,476 583 2,059
Carrying amounts
At 1 January 2015 445 302 747
At 31 December 2015 355 212 567
At 31 December 2016 277 129 406
Impairment assessment
Vessels and rigs (including assets under construction)
In 2015, the significant decline in oil prices had an adverse impact on charter rates and valuation of the Group’s rigs and vessels. As a result, the Group tested its vessels and rigs for impairment and recognised impairment losses of US$9,446,000 and US$28,454,000 for the vessels and rigs respectively. In 2016, the weak oil prices continued to have an adverse impact on the chartering rates and utilisation rates of the Group’s vessel and rigs. As a result, the Group further impaired its vessels and rigs for an impairment of US$11,477,000 and US$34,170,000 respectively. The impairment losses were included in ‘other expenses’ in the Group’s income statement.
For the purpose of impairment assessment, each vessel and rig is a separate cash-generating unit (“CGU”) and management estimated the recoverable amounts of the vessels and rigs based on their value in use.
4 PL
ANT
AND
EQUI
PMEN
T
Gro
upN
ote
Asse
tsun
der
cons
truc
tion
US$
’000
Vess
els
US$
’000
Asse
ts o
n bo
ard
the
vess
els
US$
’000
Dry
-doc
king
ex
pend
iture
US$
’000
Rig
and
ot
her
oil
and
gas
rela
ted
asse
tsU
S$’0
00
Ren
ovat
ion,
fu
rnitu
re,
fittin
gs a
nd
offic
e eq
uipm
ent
US$
’000
Mot
or
vehi
cles
US$
’000
Tota
l U
S$’0
00
Cost
At
1 J
anua
ry 2
015
775,8
99
375,8
78
2,8
24
14,3
56
1,1
39,4
98
1,9
16
711
2,3
11,0
82
Add
ition
s193,8
64
4,6
76
32,7
30
231,1
01
599
–432,9
73
Rec
lass
ifica
tion
(213,6
90)
––
–213,6
90
––
–
Rec
lass
ifica
tion
to a
sset
s he
ld f
or s
ale
10
––
––
(117,4
27)
––
(117,4
27)
Tran
slat
ion
diff
eren
ces
on c
onso
lidat
ion
–(1
,034)
––
(5,3
82)
––
(6,4
16)
At
31 D
ecem
ber
2015
756,0
73
379,5
20
2,8
27
17,0
86
1,4
61,4
80
2,5
15
711
2,6
20,2
12
Add
ition
s48,2
13
2,3
99
11
11,3
77
56,3
85
191
–118,5
76
Dis
posa
ls–
(9,7
23)
(149)
(1,3
84)
–(1
8)
–(1
1,2
74)
Rec
lass
ifica
tion
(175,7
72)
––
–175,7
72
––
–
Tran
slat
ion
diff
eren
ces
on c
onso
lidat
ion
–(7
9)
––
(1,7
59)
––
(1,8
38)
At
31 D
ecem
ber
2016
628,5
14
372,1
17
2,6
89
27,0
79
1,6
91,8
78
2,6
88
711
2,7
25,6
76
Accu
mul
ated
dep
reci
atio
n an
d im
pairm
ent
loss
es
At
1 J
anua
ry 2
015
–43,2
59
2,1
24
1,2
22
127,1
94
1,2
94
409
175,5
02
Dep
reci
atio
n ch
arge
for
the
yea
r–
16,1
28
256
610
117,3
50
439
90
134,8
73
Impa
irmen
t lo
ss f
or t
he y
ear
–9,4
46
––
28,4
54
––
37,9
00
Rec
lass
ifica
tion
to a
sset
s he
ld f
or s
ale
10
––
––
(11,8
74)
––
(11,8
74)
Tran
slat
ion
diff
eren
ces
on c
onso
lidat
ion
–(5
2)
––
(254)
––
(306)
At
31 D
ecem
ber
2015
–68,7
81
2,3
80
1,8
32
260,8
70
1,7
33
499
336,0
95
Dep
reci
atio
n ch
arge
for
the
yea
r–
15,6
11
208
2,9
90
131,3
63
357
83
150,6
12
Dis
posa
ls–
(3,7
34)
(115)
(625)
–(1
8)
–(4
,492)
Impa
irmen
t lo
ss f
or t
he y
ear
11,7
17
11,4
77
––
22,4
53
––
45,6
47
Tran
slat
ion
diff
eren
ces
on c
onso
lidat
ion
–(2
2)
––
(611)
1–
(632)
At
31 D
ecem
ber
2016
11,7
17
92,1
13
2,4
73
4,1
97
414,0
75
2,0
73
582
527,2
30
Carr
ying
am
ount
s
At
1 J
anua
ry 2
015
775,8
99
332,6
19
700
13,1
34
1,0
12,3
04
622
302
2,1
35,5
80
At
31 D
ecem
ber
2015
756,0
73
310,7
39
447
15,2
54
1,2
00,6
10
782
212
2,2
84,1
17
At
31 D
ecem
ber
2016
616,7
97
280,0
04
216
22,8
82
1,2
77,8
03
615
129
2,1
98,4
46
Dur
ing
the
finan
cial
yea
r, th
e G
roup
acq
uire
d pl
ant an
d eq
uipm
ent w
ith a
n ag
greg
ate
cost
of ap
prox
imat
ely
US$118,5
76,0
00 (2015: U
S$432,9
73,0
00)
of w
hich
app
roxi
mat
ely
US$2,3
51,0
00 (
2015: U
S$71,7
89,0
00)
was
pai
d in
adv
ance
to
the
supp
liers
in t
he p
revi
ous
year
.

EZION HOLDINGS LIMITED
092 NOTES TO THE FINANCIAL STATEMENTSYear ended 31 December 2016
4 PLANT AND EQUIPMENT (CONT’D)
The value in use calculation was based on cash flow projections with the following key assumptions:
Vessels Rigs
Period of cash flow projections Estimated remaining useful life Estimated remaining useful lifeCharter rates– FY2017 to FY2018 Actual FY2016 or FY2017
secured charter ratesActual FY2016 or FY2017
secured charter rates– FY2019 onwards Same rates as assumed for
FY2017 to FY2018An average upwards revision of 14% in FY2019 and no change
thereafterProjected utilisation rate upon deployment– FY2017 10%
(2015: 10%)50% - 75%
(2015: 50%-75%)– FY2018 onwards 50% - 55%
(2015: 50%-55%)90%
(2015: 90%)Pre-tax discount rate 9.2%
(2015: 8.9%)10.1%
(2015: 9.3%)
The cash flow projections were based on forecasts prepared by the management taking into account of past experience and existing market conditions. The discount rates applied to the cash flow projections were estimated
based on weighted average cost of capital of similar assets. Following the impairment loss recognised in the vessels
and rigs, the recoverable amounts are equal to the carrying amounts and any adverse movements in the key assumptions can lead to further impairment losses in future periods.
Security
At 31 December 2016, plant and equipment of the Group with carrying amount of US$1,926,099,000 (2015: US$2,176,831,000) are pledged as security to secure the term loans facilities (note 18).
Assets under construction
The Group has assets under construction with costs capitalised up to the reporting date totalling US$616,797,000 (2015: US$756,073,000). Included in the aforementioned capitalised costs are borrowing costs related to the construction of assets amounting to US$74,713,000 (2015: US$56,282,000). Borrowing costs capitalised during the year amounted to US$24,274,000 (2015: US$26,511,000).
The depreciation charge of the Group is recognised in the following line items of profit or loss:
Group
2016US$’000
2015US$’000
Cost of sales 150,193 134,380
Administrative expenses 419 493
150,612 134,873

ANNUAL REPORT 2016
093NOTES TO THE FINANCIAL STATEMENTSYear ended 31 December 2016
5 SUBSIDIARIES
Company
2016US$’000
2015US$’000
Equity investments, at cost 295,835 291,418
Impairment losses (39,957) (27,286)
255,878 264,132
Loans to subsidiaries 1,166,258 1,009,664
Impairment losses (136,622) (46,570)
1,029,636 963,094
1,285,514 1,227,226
Except for amounts of US$505,130,000 (2015: US$445,056,000) which bear interest ranging from 3.65% to 5.10% (2015: 3.65% to 5.10%) per annum, the loans to subsidiaries are interest-free. The loans to subsidiaries are unsecured and settlement is neither planned nor likely to occur in the foreseeable future. As the amounts are, in substance, a part of the Company’s net investments in the subsidiaries, they are stated at cost less impairment.
Impairment losses
The change in impairment loss in respect of equity investments in subsidiaries was as follows:
Company
2016US$’000
2015US$’000
At 1 January 27,286 155
Utilised – (155)
Impairment losses 12,671 27,286
At 31 December 39,957 27,286
The change in impairment loss in respect of loans to subsidiaries was as follows:
Company
2016US$’000
2015US$’000
At 1 January 46,570 –
Impairment losses 90,052 46,570
At 31 December 136,622 46,570

EZION HOLDINGS LIMITED
094 NOTES TO THE FINANCIAL STATEMENTSYear ended 31 December 2016
5 SUBSIDIARIES (CONT’D)
The impairment losses amounting to US$12,671,000 (2015: US$27,286,000) and US$90,052,000 (2015: US$46,570,000) in 2016 were recognised in respect of the Company’s investments in and loans to subsidiaries as a result of losses incurred by these subsidiaries in their underlying assets. Management assessed the recoverable amounts for each of the relevant subsidiaries based on the recoverable amounts of the net assets owned by the subsidiaries, which comprise predominantly vessels and rigs whose recoverable amounts were estimated using the value in use calculations as described in note 4.
A subsidiary is considered significant if its net tangible assets represent 2% or more of the Group’s consolidated net tangible assets, or if its pre-tax profits account for 2% or more than the Group’s consolidated pre-tax profits.
Details of the significant subsidiaries are as follows:
Name of significant subsidiary Principal activitiesCountry of
incorporation 2016%
2015%
Held by the Company
Teras Offshore Pte Ltd 1 Shipping agent and provision of ship chartering services, ship management services and engineering works.
Singapore 100 100
Teras Conquest 2 Pte Ltd 1 Ship owner and provision of ship chartering services
Singapore 100 100
Teras Conquest 5 Pte Ltd 1 Ship owner and provision of ship chartering services
Singapore 100 100
Teras Conquest 6 Pte Ltd 1 Ship owner and provision of ship chartering services
Singapore 100 100
Teras 375 Pte Ltd 1 Ship owner and provision of ship chartering services
Singapore 100 100
Teras Pneuma Pte Ltd 1 Ship owner and provision of ship chartering services
Singapore 100 100
Atlantic London Pte Ltd 1 Ship owner and provision of ship chartering services
Singapore 100 100
Teras 336 Pte Ltd 1 Ship owner and provision of ship chartering services
Singapore 100 100
Atlantic Esbjerg Pte Ltd 1 Ship owner and provision of ship chartering services
Singapore 100 100

ANNUAL REPORT 2016
095NOTES TO THE FINANCIAL STATEMENTSYear ended 31 December 2016
5 SUBSIDIARIES (CONT’D)
Name of significant subsidiary Principal activitiesCountry of
incorporation 2016%
2015%
Held by the Company (continued)
Atlantic Amsterdam Pte Ltd 1 Ship owner and provision of ship chartering services
Singapore 100 100
Atlantic Tiburon 2 Pte Ltd 1 Ship owner and provision of ship chartering services
Singapore 100 100
Ezion Investments Pte Ltd 1 Investment holding Singapore 100 100
Kenai Offshore Ventures, LLC 2 Ship owner and provision of ship chartering services
United States of America
100 100
Teras Conquest 1 Pte Ltd 1 Ship owner and provision of ship chartering services
Singapore 100 100
Teras Conquest 4 Pte Ltd 1 Ship owner and provision of ship chartering services
Singapore 100 100
Teras Conquest 3 Pte Ltd 1 Ship owner and provision of ship chartering services
Singapore 100 100
Teras Transporter Pte Ltd 1 Ship owner and provision of ship chartering services
Singapore 100 100
Teras Fortress 2 Pte Ltd 1 Ship owner and provision of ship chartering services
Singapore 100 100
Atlantic Tiburon 1 Pte Ltd 1 Ship owner and provision of ship chartering services
Singapore 100 100
Teras Harta Maritime Limited 2 Ship owner and provision of ship chartering services
Bahamas 100 100
Teras Investments Pte Ltd 1 Investment holding Singapore 100 100
Meridian Maritime Pte Ltd 1 Ship owner and provision of ship chartering services
Singapore 100 100
Teras Sunrise Pte Ltd 1 Ship owner and provision of ship chartering services
Singapore 100 100
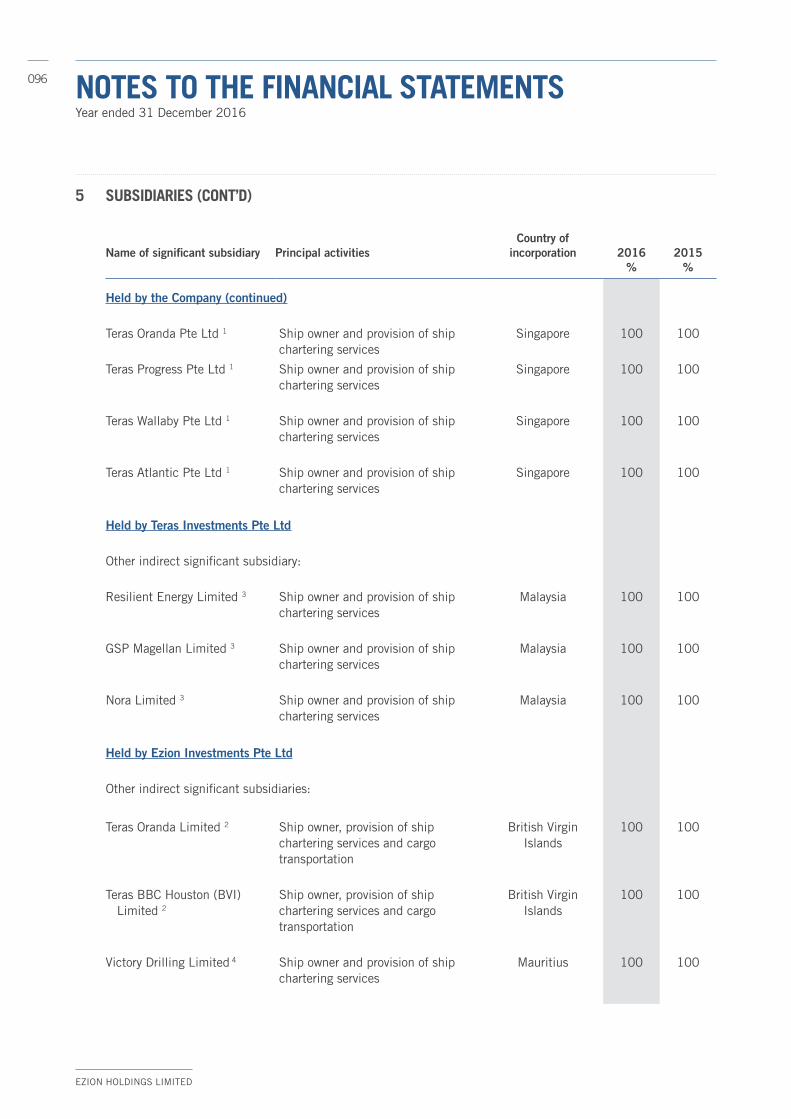
EZION HOLDINGS LIMITED
096 NOTES TO THE FINANCIAL STATEMENTSYear ended 31 December 2016
5 SUBSIDIARIES (CONT’D)
Name of significant subsidiary Principal activitiesCountry of
incorporation 2016%
2015%
Held by the Company (continued)
Teras Oranda Pte Ltd 1 Ship owner and provision of ship chartering services
Singapore 100 100
Teras Progress Pte Ltd 1 Ship owner and provision of ship chartering services
Singapore 100 100
Teras Wallaby Pte Ltd 1 Ship owner and provision of ship chartering services
Singapore 100 100
Teras Atlantic Pte Ltd 1 Ship owner and provision of ship chartering services
Singapore 100 100
Held by Teras Investments Pte Ltd
Other indirect significant subsidiary:
Resilient Energy Limited 3 Ship owner and provision of ship chartering services
Malaysia 100 100
GSP Magellan Limited 3 Ship owner and provision of ship chartering services
Malaysia 100 100
Nora Limited 3 Ship owner and provision of ship chartering services
Malaysia 100 100
Held by Ezion Investments Pte Ltd
Other indirect significant subsidiaries:
Teras Oranda Limited 2 Ship owner, provision of ship chartering services and cargo transportation
British VirginIslands
100 100
Teras BBC Houston (BVI) Limited 2
Ship owner, provision of ship chartering services and cargo transportation
British VirginIslands
100 100
Victory Drilling Limited 4 Ship owner and provision of ship chartering services
Mauritius 100 100

ANNUAL REPORT 2016
097NOTES TO THE FINANCIAL STATEMENTSYear ended 31 December 2016
5 SUBSIDIARIES (CONT’D)
Name of significant subsidiary Principal activitiesCountry of
incorporation 2016%
2015%
Held by Ezion Investments Pte Ltd (continued)
Jackup Drilling Limited 4 Ship owner and provision of ship chartering services
Mauritius 100 100
Ezion Exerter Limited 4 Ship owner and provision of ship chartering services
Mauritius 100 100
Teras Endeavour Limited 4 Ship owner and provision of ship chartering services
Mauritius 100 100
Teras Maritime Pty Ltd 5 Ship owner and provision of ship chartering services
Australia 100 100
Held by Teras Conquest 3 Pte Ltd
Other indirect significant subsidiary:
Atlantic Labrador Pte Ltd 1 Ship owner and provision of ship chartering services
Singapore 100 100
1 Audited by KPMG LLP, Singapore. 2 Not required to be audited in accordance with the law of the country of incorporation.3 Audited by PKF, Malaysia.4 Audited by KPMG (Mauritius).5 Audited by RSM, Australia.
6 JOINT VENTURES
Group Company
2016US$’000
2015US$’000
2016US$’000
2015US$’000
Interests in joint ventures 94,298 75,878 15,943 15,737
Loans to joint ventures 77,286 55,476 36,289 36,022
171,584 131,354 52,232 51,759
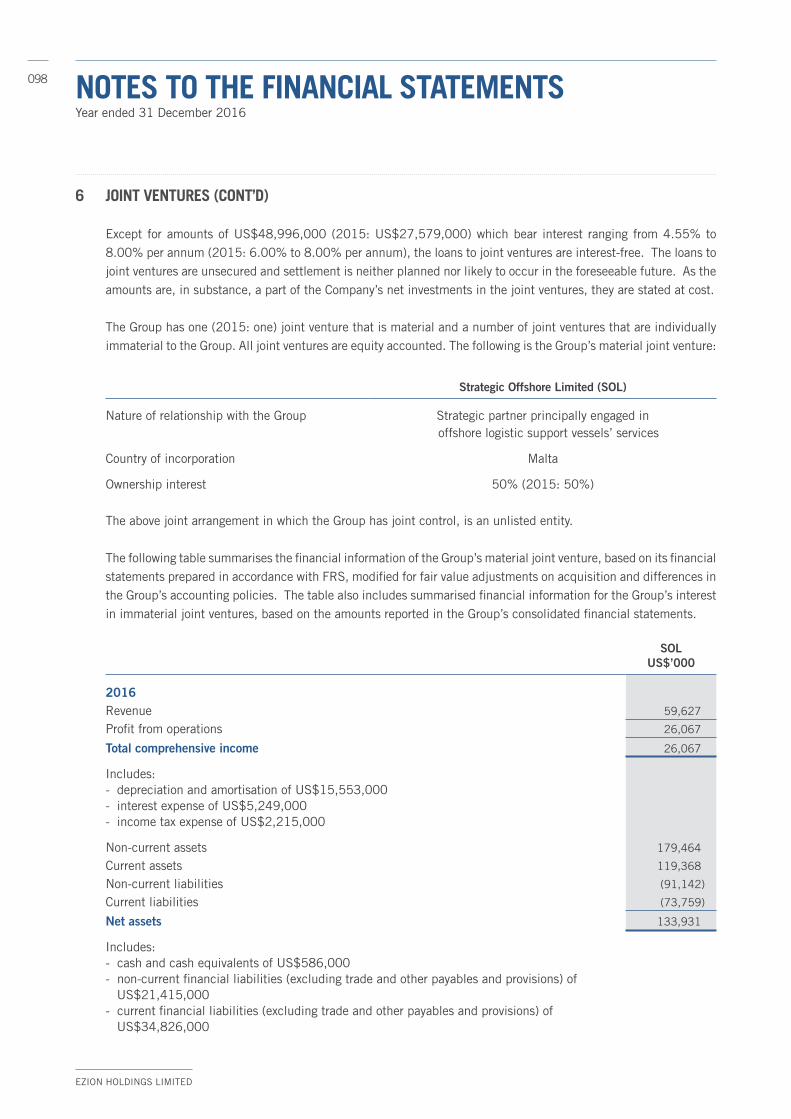
EZION HOLDINGS LIMITED
098 NOTES TO THE FINANCIAL STATEMENTSYear ended 31 December 2016
6 JOINT VENTURES (CONT’D)
Except for amounts of US$48,996,000 (2015: US$27,579,000) which bear interest ranging from 4.55% to 8.00% per annum (2015: 6.00% to 8.00% per annum), the loans to joint ventures are interest-free. The loans to joint ventures are unsecured and settlement is neither planned nor likely to occur in the foreseeable future. As the amounts are, in substance, a part of the Company’s net investments in the joint ventures, they are stated at cost.
The Group has one (2015: one) joint venture that is material and a number of joint ventures that are individually immaterial to the Group. All joint ventures are equity accounted. The following is the Group’s material joint venture:
Strategic Offshore Limited (SOL)
Nature of relationship with the Group Strategic partner principally engaged in offshore logistic support vessels’ services
Country of incorporation Malta
Ownership interest 50% (2015: 50%)
The above joint arrangement in which the Group has joint control, is an unlisted entity.
The following table summarises the financial information of the Group’s material joint venture, based on its financial statements prepared in accordance with FRS, modified for fair value adjustments on acquisition and differences in the Group’s accounting policies. The table also includes summarised financial information for the Group’s interest in immaterial joint ventures, based on the amounts reported in the Group’s consolidated financial statements.
SOLUS$’000
2016Revenue 59,627
Profit from operations 26,067
Total comprehensive income 26,067
Includes:- depreciation and amortisation of US$15,553,000- interest expense of US$5,249,000- income tax expense of US$2,215,000
Non-current assets 179,464
Current assets 119,368
Non-current liabilities (91,142)
Current liabilities (73,759)
Net assets 133,931
Includes:- cash and cash equivalents of US$586,000- non-current financial liabilities (excluding trade and other payables and provisions) of
US$21,415,000- current financial liabilities (excluding trade and other payables and provisions) of
US$34,826,000

ANNUAL REPORT 2016
099NOTES TO THE FINANCIAL STATEMENTSYear ended 31 December 2016
6 JOINT VENTURES (CONT’D)
SOLUS$’000
Immaterial joint venturesUS$’000
TotalUS$’000
Group’s interest in net assets of investee at beginning of the year 60,522 15,356 75,878
Group’s share of profit from operations 13,034 143 13,177
Group’s contribution during the year – 5,243 5,243
Carrying amount of interest in investee at end of the year 73,556 20,742 94,298
SOLUS$’000
2015
Revenue 61,356
Profit from operations 38,168
Total comprehensive income 38,168
Includes:- depreciation and amortisation of US$15,553,000- interest expense of US$6,687,000- income tax expense of US$2,396,000
Non-current assets 193,767
Current assets 80,019
Non-current liabilities (97,396)
Current liabilities (68,525)
Net assets 107,865
Includes:- cash and cash equivalents of US$12,607,000- non-current financial liabilities (excluding trade and other
payables and provisions) of US$87,215,000- current financial liabilities (excluding trade and other
payables and provisions) of US$34,749,000
SOLUS$’000
Immaterial joint venturesUS$’000
TotalUS$’000
Group’s interest in net assets of investee at beginning of the year 41,438 7,884 49,322
Group’s share of profit from operations 19,084 8,819 27,903
Group’s contribution during the year – 3 3
Return of capital during the year – (1,350) (1,350)
Carrying amount of interest in investee at end of the year 60,522 15,356 75,878
The joint ventures had no capital commitments and contingent liabilities as at 31 December 2016 and 2015.

EZION HOLDINGS LIMITED
100 NOTES TO THE FINANCIAL STATEMENTSYear ended 31 December 2016
6 JOINT VENTURES (CONT’D)
Joint operations
During the year, the Group entered into 2 joint operations arrangement and became 49% partner in PT Teras Marine Indonesia (“PTTMI”) and PT Conquest Offshore Indonesia (“PTCOI”) respectively to jointly operate two self-propelled jack-up rigs to provide charterer service to external customers.
The Group has classified PTTMI and PTCOI as joint operations. This is on the basis that the partners are legally obliged to the benefits, rights, liabilities and obligation arising from the operating activities based on their shareholding proportion.
7 ASSOCIATES
Group Company
2016US$’000
2015US$’000
2016US$’000
2015US$’000
Interests in associates 46,806 48,392 64,243 51,253
Impairment loss – – (35,905) (21,500)
46,806 48,392 28,338 29,753
Loan to an associate 31,995 24,229 31,815 24,229
78,801 72,621 60,153 53,982
Details of the material associates are as follows:
Alpha Energy Holdings Limited1
(Alpha Energy)
AusGroup Limited2
(AusGroup)
Charisma Energy Services Limited1 (Charisma Energy Services)
Nature of relationship with the Group Strategic partner in ownership of oil reserves in Alaska
Strategic partner in ownership and
management of port and marine base in
Australia
Strategic partner in ownership and
management of energy assets
Country of incorporation Singapore Singapore Singapore
Ownership interest 29.86% (2015: 29.86%)
17.83% (2015: 17.83%)
42.73%3 (2015: 42.54%)
Fair value of ownership interest (if listed)
US$2,932,000(2015:
US$6,747,000)
US$4,200,000(2015:
US$14,010,000)
US$23,137,000(2015:
US$46,356,000)
1 Audited by KPMG LLP, Singapore.2 Audited by PricewaterhouseCoopers LLP, Singapore3 Voting rights held: 21.36% (2015: 21.27%)

ANNUAL REPORT 2016
101NOTES TO THE FINANCIAL STATEMENTSYear ended 31 December 2016
7 ASSOCIATES (CONT’D)
The Group has less than 20% ownership of the equity interests of AusGroup. However, the Group determined that it has significant influence because it has representation on the board of directors of AusGroup Limited.
During the year, the Group subscribed for:
• 115,193,000 new ordinary shares in the capital of Charisma Energy Services Limited, by way of share options at an exercise price of S$0.002 per share and the consideration for the subscription shares were satisfied by cash; and
• 321,000 new ordinary shares in the capital of Rotating Offshore Solutions Pte Ltd (“ROS”), at an issue price of S$56.00 per share representing 30% interest in ROS. The consideration for the subscription shares were satisfied by shares of the Company.
In 2015, the Group subscribed for:
• 370,000,000 new ordinary shares in the capital of Charisma Energy Services Limited, by way of share options at an exercise price of S$0.0018 per share and the consideration for the subscription shares were satisfied by cash; and
• 64,000,000 new ordinary shares in the capital of Alpha Energy Limited, at an issue price of S$0.09 per share and the consideration for the subscription shares were satisfied by cash.
The following summarises the financial information of each of the Group’s material associates based on their respective (consolidated) financial statements prepared in accordance with FRS, modified for fair value adjustments on acquisition and differences in the Group’s accounting policies. The table also includes summarised financial information for the Group’s interest in immaterial associates, based on the amounts reported in the Group’s consolidated financial statements.
Charisma Energy Services
US$’000AusGroupUS$’000
2016
Revenue 24,537 270,225
Profit/(Loss) from operations 1,234 (92,145)
Other comprehensive income (292) 988
Total comprehensive income 942 (91,157)
Non-current assets 141,228 105,454
Current assets 11,845 129,017
Non-current liabilities (48,856) (119,321)
Current liabilities (19,075) (121,365)
Net assets/(liabilities) 85,142 (6,215)

EZION HOLDINGS LIMITED
102 NOTES TO THE FINANCIAL STATEMENTSYear ended 31 December 2016
7 ASSOCIATES (CONT’D)
Charisma Energy Services
US$’000AusGroupUS$’000
Immaterial associatesUS$’000
TotalUS$’000
2016Group’s interest in net assets of investee
at beginning of the year 21,878 14,405 12,109 48,392
Group’s share of:- profit/(loss) from operations 949 (14,807) (1,360) (15,218)
- other comprehensive income – 402 – 402
Translation difference – – 239 239
Group’s contribution during the year 190 – 12,801 12,991
Carrying amount of interest in investee at end of the year 23,017 – 23,789 46,806
Charisma Energy Services
US$’000AusGroupUS$’000
2015Revenue 24,290 325,202
Profit/(Loss) from operations 9,041 (49,920)
Other comprehensive income – 12,082
Total comprehensive income 9,041 (37,838)
Non-current assets 109,733 228,727
Current assets 22,249 163,316
Non-current liabilities (68,382) (43,307)
Current liabilities (18,237) (217,624)
Net assets 45,363 131,112
Charisma Energy ServicesUS$’000
AusGroupUS$’000
Immaterial associatesUS$’000
TotalUS$’000
2015Group’s interest in net assets of investee
at beginning of the year 12,661 25,738 2,711 41,110
Group’s share of:- profit/(loss) from operations 4,508 (8,903) (60) (4,455)
- other comprehensive income – 2,155 – 2,155
Translation difference 4,219 – 4,663 8,882
Group’s contribution during the year – (4,585) 578 (4,007)
Disposal of an associate 490 – 4,217 4,707
Carrying amount of interest in investee at end of the year 21,878 14,405 12,109 48,392

ANNUAL REPORT 2016
103NOTES TO THE FINANCIAL STATEMENTSYear ended 31 December 2016
8 OTHER ASSETS, INCLUDING DERIVATIVES
Group Company
2016US$’000
2015US$’000
2016US$’000
2015US$’000
Non-currentAvailable-for-sale equity security – 48 – –
Deposits to suppliers 2,700 6,445 – –
Loan to investee company – 4,952 – –
Prepayments 110 121 110 121
Interest rate swaps used for hedging 2,131 – 2,131 –
4,941 11,566 2,241 121
CurrentAvailable-for-sale equity security 48 – – –
Advances to suppliers 47,512 44,533 6 –
Deposits to suppliers 10,171 9,764 4,140 4,138
Prepayments 4,776 3,552 55 80
Non-trade amounts due from:- associates 926 437 926 437
- joint ventures and joint operations 74,398 – 425 392
Interest receivables 8,886 6,879 59,666 41,015
Other receivables 17,369 15,023 2,835 2,799
164,086 80,188 68,053 48,861
Total 169,027 91,754 70,294 48,982
The equity security is unquoted and stated at cost less impairment loss, as there is no active market for the investment and its fair value could not be reliably measured.
Deposits to suppliers largely relate to deposits made to service providers, such as vessel owners.
Included in other receivables is an amount of US$4,952,000 related to loan to investee company which is interest-free, unsecured and repayable within one year. In prior year, loan to investee company was interest-free, unsecured and settlement was neither planned nor likely to occur in foreseeable future. As the amount was in substance, a part of the Group’s investment in an investee company, it was stated at cost.
Non-trade amounts due from associates, joint ventures and joint operations are unsecured, interest-free and repayable on demand. There is no allowance for doubtful debts arising from outstanding non-trade balances with related parties.
Deposits to suppliers, non-trade amounts due from related parties, interest receivables and other receivables are not past due.

EZION HOLDINGS LIMITED
104 NOTES TO THE FINANCIAL STATEMENTSYear ended 31 December 2016
8 OTHER ASSETS, INCLUDING DERIVATIVES (CONT’D)
There are no impairment losses arising from deposits to suppliers, non-trade amounts due from related parties, interest receivables and other receivables.
At 31 December 2016, the Group held interest rate swaps with a total notional amount of US$225,000,000. The Group has designated these interest rate swaps as cash flow hedges to provide fixed rate funding for a term of between 1 to 4 years.
9 TRADE RECEIVABLES
Group Company
2016US$’000
2015US$’000
2016US$’000
2015US$’000
Trade amounts due from:
- associates 12,725 12,660 – –
- joint ventures – – 242 243
- subsidiaries – – 9,357 7,813
- third parties 241,164 230,358 – 21
253,889 243,018 9,599 8,077
Impairment losses (74,990) (49,771) – –
Total trade receivables 178,899 193,247 9,599 8,077
Trade amounts due from associates, joint ventures and subsidiaries are unsecured and are not past due. There are no impairment losses (2015: no impairment losses) arising from outstanding trade balances due from the associates, joint ventures and subsidiaries in the current financial year.
The Group’s primary exposure to credit risk relating to trade receivables from third parties arising mainly from the chartering activities by the subsidiaries. These customers are mainly national oil majors that are engaged in a wide spectrum of offshore activities. The Group and the Company’s exposure to credit risk for trade receivables are disclosed in note 31.
The maximum exposure to credit risk for trade receivables, excluding trade amounts due from subsidiaries at the reporting date (by type of customer) was:
Group Company
2016US$’000
2015US$’000
2016US$’000
2015US$’000
Government related and multi-national entities 163,202 185,100 – 21
Small-medium enterprises 15,697 8,147 242 243
178,899 193,247 242 264

ANNUAL REPORT 2016
105NOTES TO THE FINANCIAL STATEMENTSYear ended 31 December 2016
9 TRADE RECEIVABLES (CONT’D)
Impairment losses
The ageing of trade receivables due from third parties and associates at the reporting date was:
2016 2015
GrossUS$’000
Impairment losses
US$’000Gross
US$’000
Impairment losses
US$’000
Group
Not past due or less than 60 days overdue 74,630 – 67,208 –
Past due 61 – 120 days 14,264 – 23,781 –
Past due more than 120 days 164,995 (74,990) 152,029 (49,771)
253,889 (74,990) 243,018 (49,771)
The change in impairment loss in respect of trade receivables during the year was as follows:
Group
2016US$’000
2015US$’000
At 1 January 49,771 6,543
Impairment loss 25,219 43,228
At 31 December 74,990 49,771
At 31 December 2016, impairment losses of the Group amounted to US$74,990,000 (2015: US$49,771,000), which relate to customers who have indicated that they are not expecting to be able to pay their full outstanding balances, mainly due to economic circumstances.
Apart from the above, based on historical default rates, the Group believes that no additional impairment allowance is necessary in respect of the remaining trade receivables.
10 ASSETS HELD FOR SALE AND LIABILITIES RELATING TO ASSETS HELD FOR SALE
As at 31 December 2015, the Group committed to a plan to sell two self-propelled jack-up rigs to its two joint operations (Note 6). Accordingly, the carrying amounts of these two service rigs and their related secured bank loans were presented as assets held for sale and liabilities relating to assets held for sale respectively. The sale was completed during the year and the Group’s share of gain amounting to US$26,251,000 was recognised in profit or loss.

EZION HOLDINGS LIMITED
106 NOTES TO THE FINANCIAL STATEMENTSYear ended 31 December 2016
11 CASH AND CASH EQUIVALENTS
Group Company
2016US$’000
2015US$’000
2016US$’000
2015US$’000
Cash at bank and in hand 114,951 90,494 60,995 50,620
Fixed deposits 90,002 139,262 88,502 137,762
204,953 229,756 149,497 188,382
The interest rates for cash at bank and fixed deposits for the Group and the Company range between 0.50% and 2.03% (2015: 0.70% and 2.03%) per annum.
12 SHARE CAPITAL
Group and Company
2016No. of shares
’000
2015No. of shares
’000
At 1 January 1,580,941 1,578,988
Shares issued during the year 496,086 –
Exercise of share options – 1,953
At 31 December 2,077,027 1,580,941
All shares rank equally with regard to the Company’s residual assets. All issued shares are fully paid with no par value.
Ordinary shares
The holders of ordinary shares are entitled to receive dividends as declared from time to time, and are entitled to one vote per share at meetings of the Company.
Issuance of ordinary shares
In 2016, the following shares were issued:
(i) 17,498,000 new ordinary shares issued at an issue price of US$0.7276 (equivalent to S$1.0287) per share, amounting to US$12,731,000 (equivalent to S$18,000,000) to acquire 30% interest in Rotary Offshore Solutions Pte Ltd;
(ii) 478,576,000 new ordinary shares (“right issues”) issued at an issue price of US$0.21 (equivalent to S$0.29) per share amounting to US$101,866,000 (equivalent to S$137,265,000), pursuant to the renounceable underwritten rights issue undertaken by the Company on the basis of three Rights Shares for every ten existing ordinary shares of the Company; and
(iii) 12,000 new ordinary shares issued pursuant to the exercise of 12,000 warrants by various warrant holders.

ANNUAL REPORT 2016
107NOTES TO THE FINANCIAL STATEMENTSYear ended 31 December 2016
12 SHARE CAPITAL (CONT’D)
Exercise of share option
In 2016, there were no shares issued under the Company’s Employee Share Option Scheme.
In 2015, the following shares were issued under the Company’s Employee Share Option Scheme:
(i) 288,000 shares issued at an exercise price of US$0.212 (equivalent to S$0.288), amounting to US$61,000 (equivalent to S$83,000);
(ii) 1,622,040 shares issued at an exercise price of US$0.38 (equivalent to S$0.514), amounting to US$616,000 (equivalent to S$834,000); and
(iii) 43,200 shares issued at an exercise price of US$0.81 (equivalent to S$1.083), amounting to US$35,000 (equivalent to S$47,000).
Capital management
The Group’s objectives when managing capital are to safeguard the Group’s ability to continue as a going concern in order to provide returns for shareholders and benefits for other stakeholders and to maintain an optimal capital structure to reduce the cost of capital. In order to maintain or adjust the capital structure, the Group may issue new shares, buy back issued shares, obtain new borrowings or reduce its borrowings.
The Group monitors capital based on gearing ratio. The gearing ratio is calculated as net debt divided by total equity. Net debt is calculated as financial liabilities and notes payable less cash and cash equivalents. Total equity includes equity attributable to owners of the Company, perpetual securities, redeemable exchangeable preference shares, reserves and retained earnings.
Group
2016US$’000
2015US$’000
Financial liabilities 1,119,122 1,226,355
Notes payable 372,040 378,691
Less: Cash and cash equivalents (204,953) (229,756)
Net debt 1,286,209 1,375,290
Total equity 1,315,384 1,241,310
Gearing ratio (times) 0.98 1.11
There were no changes in the Group’s approach to capital management during the year.
The Singapore vessels-owning companies are required to have a minimum share capital of US$34,571 (equivalent to S$50,000) as required by the Maritime and Port Authority of Singapore. Except for the above, the Company and its subsidiaries are not subject to externally imposed capital requirements.

EZION HOLDINGS LIMITED
108 NOTES TO THE FINANCIAL STATEMENTSYear ended 31 December 2016
13 PERPETUAL SECURITIES
The Company has a Multi-currency Debt Issuance Programme (the “Programme”) which allows the Company from time to time to issue notes and perpetual securities in any currency. The limit of the Programme was increased from S$500 million to S$1.5 billion with effect from 8 May 2014. Under the Programme, the perpetual securities shall constitute direct, unconditional, unsubordinated and unsecured obligations of the Company and shall at all times rank pari passu, without any preference among themselves, and with any parity obligations of the Company.
As at 31 December 2016, the Company has perpetual securities with a nominal principal amount of S$150,000,000 (equivalent to US$117,380,000) issued in 2014. The securities are perpetual, subordinated and the distribution interest of 7.0% per annum may be deferred at the sole discretion of the Company.
These perpetual securities are classified as equity instruments and recorded in equity in the consolidated statement of financial position. Transaction costs incurred in connection with the issuance of perpetual securities amounted to US$881,000 (2015: US$881,000).
As at 31 December 2016, the Group has accrued perpetual securities distribution of approximately US$7,634,000 (2015: US$12,520,000).
14 REDEEMABLE EXCHANGEABLE PREFERENCE SHARES
Group
2016US$’000
2015US$’000
At 1 January and 31 December 23,464 23,464
In 2013, 300 redeemable exchangeable preference shares (“REPS”) were issued by a subsidiary of the Company (“Subsidiary”) at an issue price of S$100,000 (equivalent to US$78,388) per share (“Issue Price’’). All issued shares are fully paid. The main terms and conditions of the subscription agreement are as follows:
(a) The REPS are convertible into certain number of ordinary shares in the share capital of the Company based on an exchange price of S$1.8214 (“Exchange Price”). The conversion ratio will be subject to the usual anti-dilution adjustments.
(b) The holders of REPS shall have the right to convert:
(i) the first 50% of their holdings of REPS into Exchange Shares at the Exchange Price at any time starting from the first anniversary of the date of issue of REPS (“Issue Date”) and up to one business day before the third anniversary of the Issue Date (“Maturity Date”); and
(ii) the remaining 50% of their holdings of REPS into Exchange Shares at any time starting from the second anniversary of the Issue Date and up to one business day before the Maturity Date.
ANNUAL REPORT 2016
109NOTES TO THE FINANCIAL STATEMENTSYear ended 31 December 2016
14 REDEEMABLE EXCHANGEABLE PREFERENCE SHARES (CONT’D)
(c) Save as otherwise provided herein under the clause entitled “Distribution Preference Deferral” and subject to the Companies Act (Chapter 50) of Singapore, the Preference Shares shall be entitled to:
(i) an annual dividend equal to 5% of the Issue Price (the “Distribution Preference”) in respect of the outstanding REPS as at the Maturity Date, with such Distribution Preference payable cumulatively on the Maturity Date; and
(ii) a one-off dividend equal to 3% of the Issue Price (the “One-Time Dividend”) in respect of the REPS that are exchanged into Exchange Shares before the Maturity Date, with such One-Time Dividend payable no later than 5 business days after the date of exchange of the REPS into Exchange Shares,
(such date of payment of the Distribution Preference or the One-Time Dividend by the Subsidiary, a “Distribution Payment Date”).
(d) The Group may, at its sole discretion, elect to defer (in whole or in part) the payment of any Distribution Preference and/or One-Time Dividend which is otherwise scheduled to be paid on a Distribution Payment Date to a date no later than the date on which the Group pays a discretionary dividend, distribution or other payment (other than in connection with any employee benefit plan or similar arrangements with or for the benefit of employees, officers, directors or consultants) for the financial year in which the relevant Distribution Payment Date falls within.
The Group has no obligation to pay any dividend on any Distribution Payment Date if it validly elects not to do so.
(e) Each holder of REPS shall have the right to exchange all of its holdings of REPS into Exchange Shares upon the occurrence of any of the following events prior to the Maturity Date:
(i) a merger or consolidation of the Subsidiary with or into another entity (except a merger or consolidation in which the Group continues to hold at least 50% of the voting power of the capital of the surviving or acquiring entity);
(ii) a change in control in which in excess of 50% of the outstanding voting power of the Subsidiary is transferred;
(iii) the Subsidiary is unable to pay its debts as they fall due or is insolvent; or
(iv) the Subsidiary is subject to a liquidation or winding up action (whether voluntary or otherwise), or an administrator or receiver has been appointed over any of the assets of the Subsidiary, or if any of its material assets have been seized by a court order.
Such number of Exchange Shares is to be determined in accordance with the exchange formula.

EZION HOLDINGS LIMITED
110 NOTES TO THE FINANCIAL STATEMENTSYear ended 31 December 2016
14 REDEEMABLE EXCHANGEABLE PREFERENCE SHARES (CONT’D)
(f) Within five business days immediately after the Maturity Date, the Subsidiary has the option to redeem (upon which the Company shall guarantee) any amount of outstanding REPS not exchanged by the Holders as at the Maturity Date at a redemption price per REPS equal to the Issue Price in cash.
In the event that the Subsidiary does not exercise the aforementioned redemption option, all outstanding REPS as at the Maturity Date shall be automatically exchanged into Exchange Shares at the Exchange Price. For the avoidance of doubt, the Holders shall be entitled to the Distribution Preference on the outstanding Preference Shares as at the Maturity Date.
On 7 October 2016, the Company entered a supplemental agreement to the subscription agreement with the REPS holders and the Subsidiary, to amend the terms of the REPS as follows:
(a) The maturity date of the REPS shall be extended by three years, from the date falling on the third anniversary of the Issue Date, being 10 October 2016, to the date falling on the sixth anniversary of the Issue Date, being 10 October 2019 (the “Extended Maturity Date”).
(b) No annual dividend in respect of the outstanding REPS as at the Extended Maturity Date shall accrue and be payable for the period commencing from 11 October 2016 to the Extended Maturity Date.
Save as disclosed above, the terms and conditions of the subscription agreement shall continue to apply mutatis mutandis and shall remain in full force and effect.
In 2016 and 2015, no REPS in Subsidiary was exchanged by the holders for shares in the Company.
15 RESERVES
The reserves of the Group and the Company comprise the following balances:
Group Company
2016US$’000
2015US$’000
2016US$’000
2015US$’000
Treasury shares (1,480) (1,480) (1,480) (1,480)
Foreign currency translation reserve (30,008) (29,333) – –
Hedging reserve (55) (1,504) (55) (1,429)
Statutory reserve (6) (6) (6) (6)
(31,549) (32,323) (1,541) (2,915)
Treasury shares
Treasury shares comprise the cost of the Company’s shares held by the Group.
As at 31 December 2016, the Group held 3,184,000 (2015: 3,184,000) of the Company’s shares. All rights attached to the Company’s shares held by the Group are suspended until those shares are reissued.

ANNUAL REPORT 2016
111NOTES TO THE FINANCIAL STATEMENTSYear ended 31 December 2016
15 RESERVES (CONT’D)
Foreign currency translation reserve
The foreign currency translation reserve comprises:
(a) foreign exchange differences arising from the translation of the financial statements of subsidiaries whose functional currencies are different from the functional currency of the Company; and
(b) the exchange differences on monetary items which form part of the Group’s net investment in foreign operations, provided certain conditions are met.
Hedging reserve
The hedging reserve comprises the effective portion of the cumulative change (net of taxes) in the fair value of cash flow hedging instruments related to hedged transactions that have not yet affected profit or loss.
Statutory reserve
The statutory reserve comprises the difference between the fair value and the cost of treasury shares issued to certain employees pursuant to the Employee Share Plan (see note 21 (b)).
16 OTHER PAYABLES, INCLUDING DERIVATIVES
Group Company
2016US$’000
2015US$’000
2016US$’000
2015US$’000
Non-current
Other payables 15,000 15,000 – –
Deposits from a supplier 2,000 2,000 – –
Deposits from a customer 16,961 17,900 – –
Interest rate swaps used for hedging – 1,054 – 979
Non-trade amounts due to subsidiaries – – 141,817 89,206
33,961 35,954 141,817 90,185
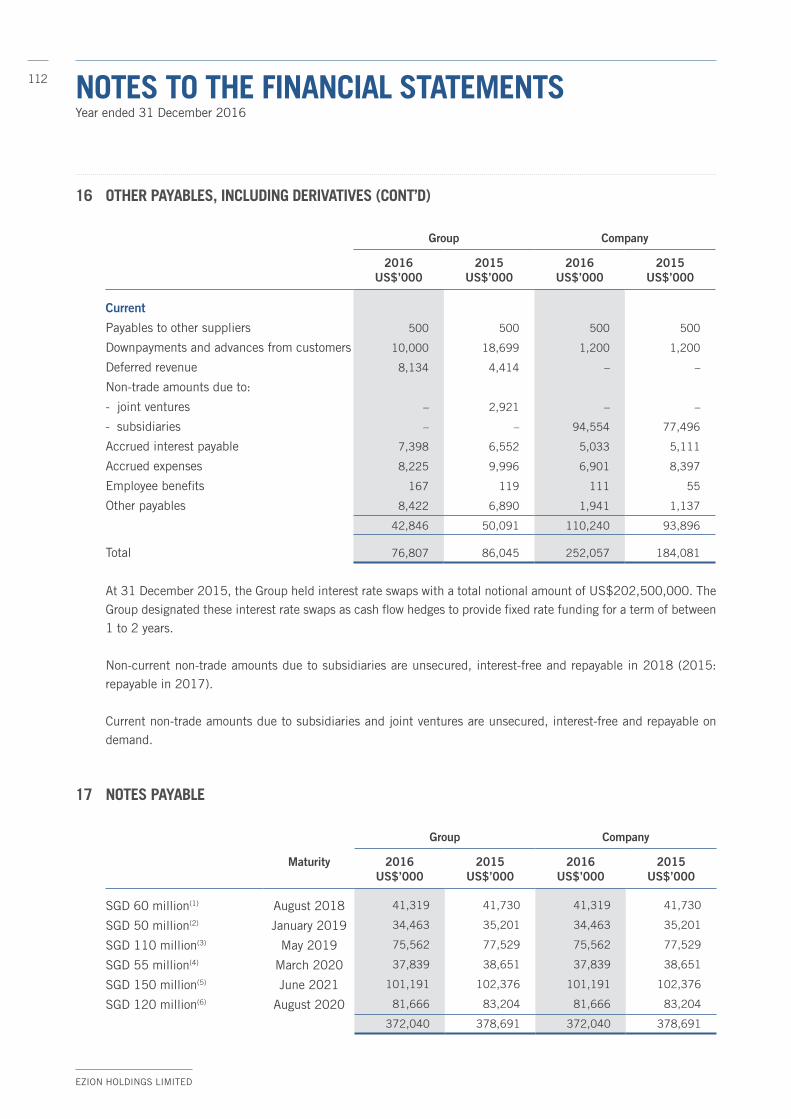
EZION HOLDINGS LIMITED
112 NOTES TO THE FINANCIAL STATEMENTSYear ended 31 December 2016
16 OTHER PAYABLES, INCLUDING DERIVATIVES (CONT’D)
Group Company
2016US$’000
2015US$’000
2016US$’000
2015US$’000
Current
Payables to other suppliers 500 500 500 500
Downpayments and advances from customers 10,000 18,699 1,200 1,200
Deferred revenue 8,134 4,414 – –
Non-trade amounts due to:
- joint ventures – 2,921 – –
- subsidiaries – – 94,554 77,496
Accrued interest payable 7,398 6,552 5,033 5,111
Accrued expenses 8,225 9,996 6,901 8,397
Employee benefits 167 119 111 55
Other payables 8,422 6,890 1,941 1,137
42,846 50,091 110,240 93,896
Total 76,807 86,045 252,057 184,081
At 31 December 2015, the Group held interest rate swaps with a total notional amount of US$202,500,000. The Group designated these interest rate swaps as cash flow hedges to provide fixed rate funding for a term of between 1 to 2 years.
Non-current non-trade amounts due to subsidiaries are unsecured, interest-free and repayable in 2018 (2015: repayable in 2017).
Current non-trade amounts due to subsidiaries and joint ventures are unsecured, interest-free and repayable on demand.
17 NOTES PAYABLE
Maturity
Group Company
2016US$’000
2015US$’000
2016US$’000
2015US$’000
SGD 60 million(1) August 2018 41,319 41,730 41,319 41,730
SGD 50 million(2) January 2019 34,463 35,201 34,463 35,201
SGD 110 million(3) May 2019 75,562 77,529 75,562 77,529
SGD 55 million(4) March 2020 37,839 38,651 37,839 38,651
SGD 150 million(5) June 2021 101,191 102,376 101,191 102,376
SGD 120 million(6) August 2020 81,666 83,204 81,666 83,204
372,040 378,691 372,040 378,691

ANNUAL REPORT 2016
113NOTES TO THE FINANCIAL STATEMENTSYear ended 31 December 2016
17 NOTES PAYABLE (CONT’D)
(1) The notes bear fixed interest rate of 4.60% (2015: 4.60%) per annum payable semi-annually, with fair value of
approximately US$34,147,000 (2015: US$38,287,000) based on quoted market prices.
(2) The notes bear fixed interest rate of 4.85% (2015: 4.85%) per annum payable semi-annually, with fair value of
approximately US$26,426,000 (2015: US$31,722,000) based on quoted market prices.
(3) The notes bear fixed interest rate of 4.70% (2015: 4.70%) per annum payable semi-annually, with fair value of
approximately US$56,037,000 (2015: US$71,122,000) based on quoted market prices.
(4) The notes bear fixed interest rate of 5.10% (2015: 5.10%) per annum payable semi-annually, with fair value of
approximately US$25,134,000 (2015: US$35,430,000) based on quoted market prices.
(5) The notes bear fixed interest rate of 4.875% (2015: 4.875%) per annum payable semi-annually, with fair value of
approximately US$61,517,000 (2015: US$103,621,000) based on quoted market prices.
(6) The notes bear fixed interest rate of 3.65% (2015: 3.65%) per annum payable semi-annually, with fair value of
approximately US$82,993,000 (2015: US$84,909,000) based on quoted market prices.
The above notes are listed on the Main Board of the Singapore Exchange Securities Trading Limited and the full carrying amount of the notes payable is classified as non-current.
18 FINANCIAL LIABILITIES
Group Company
2016US$’000
2015US$’000
2016US$’000
2015US$’000
Non-current
Unsecured bank loans 12,659 12,659 12,659 12,659
Secured bank loans 772,373 834,374 41,054 42,436
Finance lease liabilities 24 48 24 48
Financial guarantees 3,011 4,020 58,345 82,169
788,067 851,101 112,082 137,312
Current
Secured bank loans 228,406 265,303 – –
Unsecured bank loans 100,941 108,091 100,941 108,091
Finance lease liabilities 23 65 23 65
Financial guarantees 1,685 1,795 21,948 27,533
331,055 375,254 122,912 135,689
Total financial liabilities 1,119,122 1,226,355 234,994 273,001

EZION HOLDINGS LIMITED
114 NOTES TO THE FINANCIAL STATEMENTSYear ended 31 December 2016
18 FINANCIAL LIABILITIES (CONT’D)
Secured bank loans
All the bank loans were secured by corporate guarantees from the Company, first legal charge on the Group’s vessels, legal assignment of the rental proceeds from the Group’s vessels, assignment of insurances in respect of vessels in bank’s favour and all monies standing to the credit of the Group’s receiving operating account in respect of the vessels maintained by the Group with the bank.
The bank loans are secured on vessels, rigs and assets under construction with a carrying amount of US$1,926,099,000 (2015: US$2,176,831,000).
Terms and debt repayment schedule
Terms and conditions of outstanding loans and borrowings are as follows:
Nominalinterest rate
%
Year ofmaturity
Carrying amount
2016US$’000
2015US$’000
GroupUSD secured floating rate loans 2.56 – 3.56 2017 - 2022 959,725 1,057,241
SGD secured floating rate loan 4.08 2018 41,054 42,436
USD unsecured floating rate loans 2.08 – 3.60 2017 - 2018 113,600 120,750
SGD finance lease liabilities 2.20 – 2.28 2019 47 113
1,114,426 1,220,540
Company
SGD secured floating rate loan 4.08 2018 41,054 42,436
USD unsecured floating rate loans 2.08 – 3.60 2017 - 2018 113,600 120,750
SGD finance lease liabilities 2.20 – 2.28 2019 47 113
154,701 163,299
Finance lease liabilities
Finance lease liabilities are payable as follows:
2016 2015
PrincipalUS$’000
InterestUS$’000
Future minimum
lease paymentsUS$’000
PrincipalUS$’000
InterestUS$’000
Future minimum
lease paymentsUS$’000
Group and CompanyWithin 1 year 23 1 24 65 2 67
After 1 year but within 5 years 24 1 25 48 1 49
Total 47 2 49 113 3 116

ANNUAL REPORT 2016
115NOTES TO THE FINANCIAL STATEMENTSYear ended 31 December 2016
18 FINANCIAL LIABILITIES (CONT’D)
The following are the expected contractual undiscounted cash outflows of financial liabilities, including interest payments and excluding the impact of netting agreements:
Carrying amount
US$’000
Cash flows
Contractual cash flowsUS$’000
Within 1 year
US$’000
Within 2 to 5 yearsUS$’000
After 5 years
US$’000
Group
2016
Non-derivative financial liabilitiesSecured bank loans 1,000,779 (1,095,057) (287,398) (776,700) (30,959)
Unsecured bank loans 113,600 (117,096) (104,118) (12,978) –
Notes payable 372,040 (432,353) (17,405) (414,948) –
Finance lease liabilities 47 (49) (24) (25) –
Financial guarantees(1) 4,696 (164,146) (164,146) – –
Trade payables 112,074 (112,074) (112,074) – –
Other payables(2) 58,673 (58,673) (24,712) (33,961) –
1,661,909 (1,979,448) (709,877) (1,238,612) (30,959)
Group2015Non-derivative financial liabilitiesSecured bank loans 1,099,677 (1,181,629) (305,298) (866,442) (9,889)
Unsecured bank loans 120,750 (123,753) (110,847) (12,906) –
Notes payable 378,691 (460,564) (17,870) (334,004) (108,690)
Finance lease liabilities 113 (116) (67) (49) –
Financial guarantees(1) 5,815 (96,707) (96,707) – –
Trade payables 126,165 (126,165) (126,165) – –
Other payables(2) 61,878 (61,878) (26,978) (34,900) –
Liabilities relating to assets held for sale 42,658 (43,484) (43,484) – –
1,835,747 (2,094,296) (727,416) (1,248,301) (118,579)
Derivative financial instrumentsInterest rate swaps used for hedging 1,054 (1,293) (1,125) (168) –
1,836,801 (2,095,589) (728,541) (1,248,469) (118,579)

EZION HOLDINGS LIMITED
116 NOTES TO THE FINANCIAL STATEMENTSYear ended 31 December 2016
18 FINANCIAL LIABILITIES (CONT’D)
Carrying amount
US$’000
Cash flows
Contractual cash flowsUS$’000
Within 1 year
US$’000
Within 2 to 5 yearsUS$’000
After 5 years
US$’000
Company2016Non-derivative financial liabilitiesSecured bank loans 41,054 (43,347) (1,716) (41,631) –
Unsecured bank loans 113,600 (117,096) (104,118) (12,978) –
Notes payable 372,040 (432,353) (17,405) (414,948) –
Finance lease liabilities 47 (49) (24) (25) –
Financial guarantees(1) 80,293 (1,215,856) (1,215,856) – –
Trade payables 198 (198) (198) – –
Other payables(2) 250,857 (250,857) (109,040) (141,817) –
858,089 (2,059,756) (1,448,357) (611,399) –
2015Non-derivative financial liabilitiesSecured bank loans 42,436 (44,345) (1,760) (42,585) –
Unsecured bank loans 120,750 (123,753) (110,847) (12,906) –
Notes payable 378,691 (460,564) (17,870) (334,004) (108,690)
Finance lease liabilities 113 (116) (67) (49) –
Financial guarantees(1) 109,702 (1,223,991) (1,223,991) – –
Trade payables 40 (40) (40) – –
Other payables(2) 181,902 (181,902) (92,696) (89,206) –
833,634 (2,034,711) (1,447,271) (478,750) (108,690)
Derivative financial instrumentsInterest rate swaps used for hedging 979 (1,218) (1,050) (168) –
834,613 (2,035,929) (1,448,321) (478,918) (108,690)
(1) At the reporting date, the Company does not consider it probable that a claim will be made against the Company under the financial guarantees granted to the subsidiaries and joint ventures.
(2) Excludes downpayments and advances from customers, interest rate swaps used for hedging and deferred revenue.
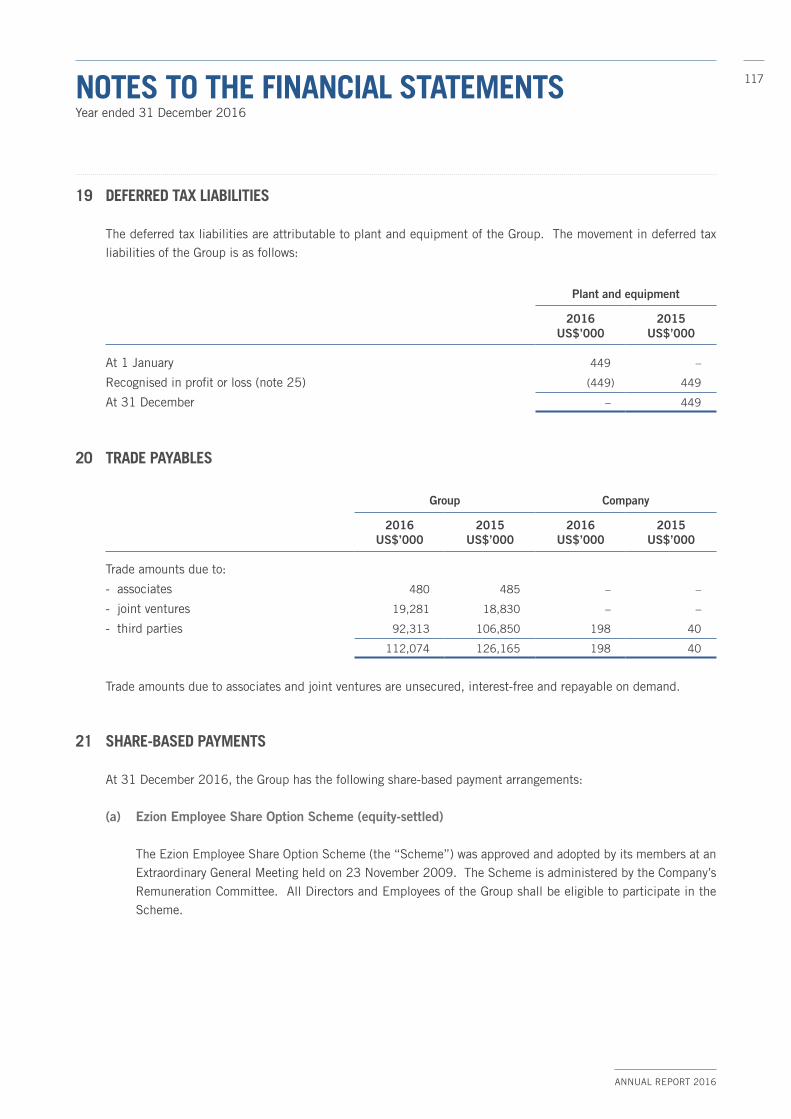
ANNUAL REPORT 2016
117NOTES TO THE FINANCIAL STATEMENTSYear ended 31 December 2016
19 DEFERRED TAX LIABILITIES
The deferred tax liabilities are attributable to plant and equipment of the Group. The movement in deferred tax liabilities of the Group is as follows:
Plant and equipment
2016US$’000
2015US$’000
At 1 January 449 –
Recognised in profit or loss (note 25) (449) 449
At 31 December – 449
20 TRADE PAYABLES
Group Company
2016US$’000
2015US$’000
2016US$’000
2015US$’000
Trade amounts due to:
- associates 480 485 – –
- joint ventures 19,281 18,830 – –
- third parties 92,313 106,850 198 40
112,074 126,165 198 40
Trade amounts due to associates and joint ventures are unsecured, interest-free and repayable on demand.
21 SHARE-BASED PAYMENTS
At 31 December 2016, the Group has the following share-based payment arrangements:
(a) Ezion Employee Share Option Scheme (equity-settled)
The Ezion Employee Share Option Scheme (the “Scheme”) was approved and adopted by its members at an Extraordinary General Meeting held on 23 November 2009. The Scheme is administered by the Company’s Remuneration Committee. All Directors and Employees of the Group shall be eligible to participate in the Scheme.

EZION HOLDINGS LIMITED
118 NOTES TO THE FINANCIAL STATEMENTSYear ended 31 December 2016
21 SHARE-BASED PAYMENTS (CONT’D)
(a) Ezion Employee Share Option Scheme (equity-settled) (cont’d)
Other information regarding the Scheme is set out below:
Option granted on 11 October 2011 (“Grant Date 1”)
• The exercise price of each option is fixed at S$0.259. (Prior to Rights Issue: S$0.288)
• The share option shall be exercised, in whole or in part, in accordance with the following schedule from 11 October 2012 to 11 October 2021:
(i) 20% of the options shall vest after the end of first anniversary of Grant Date 1;
(ii) 50% of the options shall vest after 31 March 2013; and
(ii) 30% of the options shall vest after 31 March 2014.
• All options are settled by physical delivery of shares.
• The options granted expire after 10 years or upon cessation of the employment of employees.
• The options include 1,400,000 share options granted to each of the executive directors, Chew Thiam Keng and Captain Larry Glenn Johnson; and 100,000 share options granted to each of the non-executive directors, Lim Thean Ee, Tan Woon Hum and Dr. Wang Kai Yuen.
• With effect from 7 November 2014, Captain Larry Glenn Johnson resigned as an executive director of the Company.
Option granted on 7 June 2012 (“Grant Date 2”)
• The exercise price of each option is fixed at S$0.462. (Prior to Rights Issue: S$0.514)
• The share option shall be exercised, in whole or in part, in accordance with the following schedule from 7 June 2013 to 7 June 2022:
(i) 30% of the options shall vest after the end of first anniversary of Grant Date 2;
(ii) 30% of the options shall vest after the end of second anniversary of Grant Date 2; and
(iii) 40% of the options shall vest after the end of third anniversary of Grant Date 2.
ANNUAL REPORT 2016
119NOTES TO THE FINANCIAL STATEMENTSYear ended 31 December 2016
21 SHARE-BASED PAYMENTS (CONT’D)
(a) Ezion Employee Share Option Scheme (equity-settled) (cont’d)
Option granted on 7 June 2012 (“Grant Date 2”) (cont’d)
• All options are settled by physical delivery of shares.
• The options granted expire after 10 years or upon cessation of the employment of employees.
• The options include 700,000 share options granted to each of the executive directors, Chew Thiam Keng and Captain Larry Glenn Johnson; and 100,000 share options granted to each of the directors, Lim Thean Ee, Tan Woon Hum, Dr. Wang Kai Yuen and Lee Kian Soo.
• With effect from 5 January 2016, Lee Kian Soo resigned as a director of the Company.
Option granted on 21 January 2013 (“Grant Date 3”)
• The exercise price of each option is fixed at S$0.973 (Prior to Rights Issue: S$1.083)
• The share option shall be exercised, in whole or in part, in accordance with the following schedule from 21 January 2015 to 21 January 2023:
(i) 30% of the options shall vest after the end of second anniversary of Grant Date 3;
(ii) 30% of the options shall vest after the end of third anniversary of Grant Date 3; and
(iii) 40% of the options shall vest after the end of fourth anniversary of Grant Date 3.
• All options are settled by physical delivery of shares.
• The options granted expire after 10 years or upon cessation of the employment of employees.
• The options include 700,000 share options granted to each of the executive directors, Chew Thiam Keng and Captain Larry Glenn Johnson; and 100,000 share options granted to each of the directors, Lim Thean Ee, Tan Woon Hum, Dr. Wang Kai Yuen and Lee Kian Soo.
Option granted on 16 January 2015 (“Grant Date 5”)
• The exercise price of each option is fixed at S$1.011.
• The share option shall be exercised, in whole or in part, in accordance with the following schedule from 16 January 2017 to 16 January 2025:
(i) 30% of the options shall vest after the end of second anniversary of Grant Date 5;
EZION HOLDINGS LIMITED
120 NOTES TO THE FINANCIAL STATEMENTSYear ended 31 December 2016
21 SHARE-BASED PAYMENTS (CONT’D)
(a) Ezion Employee Share Option Scheme (equity-settled) (cont’d)
Option granted on 16 January 2015 (“Grant Date 5”) (cont’d)
(ii) 30% of the options shall vest after the end of third anniversary of Grant Date 5; and
(iii) 40% of the options shall vest after the end of fourth anniversary of Grant Date 5.
• All options are settled by physical delivery of shares.
• The options granted expire after 10 years or upon cessation of the employment of employees.
• The options include 1,400,000 share options granted to the executive director, Chew Thiam Keng; and 200,000 share options granted to each of the directors, Lim Thean Ee, Tan Woon Hum, Dr. Wang Kai Yuen and Lee Kian Soo.
Option granted on 9 March 2016 (“Grant Date 6”)
• The exercise price of each option is fixed at S$0.489.
• The share option shall be exercised, in whole or in part, in accordance with the following schedule from 9 March 2018 to 9 March 2026:
(i) 30% of the options shall vest after the end of second anniversary of Grant Date 6;
(ii) 30% of the options shall vest after the end of third anniversary of Grant Date 6; and
(iii) 40% of the options shall vest after the end of fourth anniversary of Grant Date 6.
• All options are settled by physical delivery of shares.
• The options granted expire after 10 years or upon cessation of the employment of employees.
• The options include 700,000 share options granted to the executive director, Chew Thiam Keng; and 100,000 share options granted to each of the directors, Lim Thean Ee, Tan Woon Hum, Dr. Wang Kai Yuen and Yee Chia Hsing.
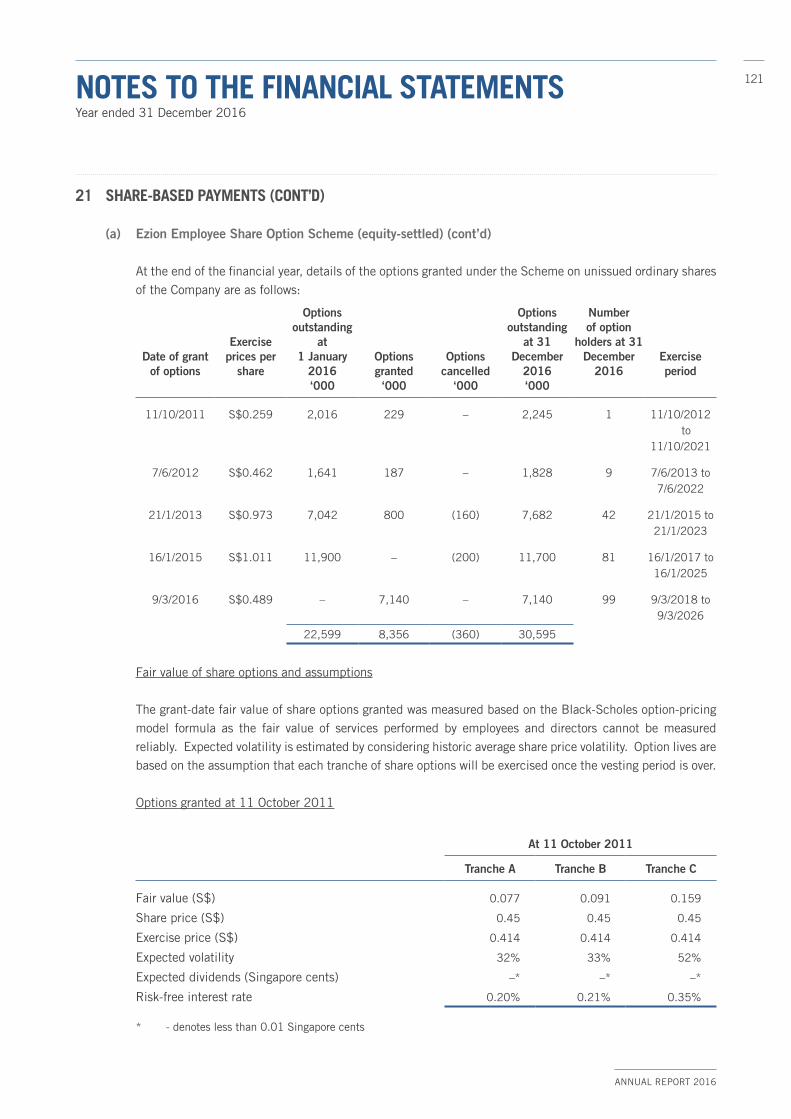
ANNUAL REPORT 2016
121NOTES TO THE FINANCIAL STATEMENTSYear ended 31 December 2016
21 SHARE-BASED PAYMENTS (CONT’D)
(a) Ezion Employee Share Option Scheme (equity-settled) (cont’d)
At the end of the financial year, details of the options granted under the Scheme on unissued ordinary shares of the Company are as follows:
Date of grant of options
Exerciseprices per
share
Options outstanding
at 1 January
2016‘000
Optionsgranted‘000
Optionscancelled
‘000
Optionsoutstanding
at 31 December
2016‘000
Numberof option
holders at 31 December
2016Exercise period
11/10/2011 S$0.259 2,016 229 – 2,245 1 11/10/2012 to
11/10/2021
7/6/2012 S$0.462 1,641 187 – 1,828 9 7/6/2013 to7/6/2022
21/1/2013 S$0.973 7,042 800 (160) 7,682 42 21/1/2015 to21/1/2023
16/1/2015 S$1.011 11,900 – (200) 11,700 81 16/1/2017 to16/1/2025
9/3/2016 S$0.489 – 7,140 – 7,140 99 9/3/2018 to9/3/2026
22,599 8,356 (360) 30,595
Fair value of share options and assumptions
The grant-date fair value of share options granted was measured based on the Black-Scholes option-pricing model formula as the fair value of services performed by employees and directors cannot be measured reliably. Expected volatility is estimated by considering historic average share price volatility. Option lives are based on the assumption that each tranche of share options will be exercised once the vesting period is over.
Options granted at 11 October 2011
At 11 October 2011
Tranche A Tranche B Tranche C
Fair value (S$) 0.077 0.091 0.159
Share price (S$) 0.45 0.45 0.45
Exercise price (S$) 0.414 0.414 0.414
Expected volatility 32% 33% 52%
Expected dividends (Singapore cents) –* –* –*
Risk-free interest rate 0.20% 0.21% 0.35%
* - denotes less than 0.01 Singapore cents

EZION HOLDINGS LIMITED
122 NOTES TO THE FINANCIAL STATEMENTSYear ended 31 December 2016
21 SHARE-BASED PAYMENTS (CONT’D)
(a) Ezion Employee Share Option Scheme (equity-settled) (cont’d)
Options granted at 7 June 2012
At 7 June 2012
Tranche A Tranche B Tranche C
Fair value (S$) 0.16 0.174 0.224
Share price (S$) 0.78 0.78 0.78
Exercise price (S$) 0.74 0.74 0.74
Expected volatility 46.11% 35.88% 39.13%
Expected dividends (Singapore cents) –* –* –*
Risk-free interest rate 0.25% 0.23% 0.33%
* - denotes less than 0.01 Singapore cents
Options granted at 21 January 2013
At 21 January 2013
Tranche A Tranche B Tranche C
Fair value (S$) 0.473 0.530 0.758
Share price (S$) 1.76 1.76 1.76
Exercise price (S$) 1.56 1.56 1.56
Expected volatility 39.06% 36.58% 51.40%
Expected dividends (Singapore cents) –* –* –*
Risk-free interest rate 0.24% 0.27% 0.30%
* - denotes less than 0.01 Singapore cents
Options granted at 16 January 2015
At 16 January 2015
Tranche A Tranche B Tranche C
Fair value (S$) 0.267 0.337 0.396
Share price (S$) 1.155 1.155 1.155
Exercise price (S$) 1.011 1.011 1.011
Expected volatility 28.75% 32.57% 34.62%
Expected dividends (Singapore cents) –* –* –*
Risk-free interest rate 0.54% 0.73% 1.02%
* - denotes less than 0.01 Singapore cents

ANNUAL REPORT 2016
123NOTES TO THE FINANCIAL STATEMENTSYear ended 31 December 2016
21 SHARE-BASED PAYMENTS (CONT’D)
(a) Ezion Employee Share Option Scheme (equity-settled) (cont’d)
Options granted at 9 March 2016
At 9 March 2016
Tranche A Tranche B Tranche C
Fair value (S$) 0.220 0.234 0.258
Share price (S$) 0.630 0.630 0.630
Exercise price (S$) 0.489 0.489 0.489
Expected volatility 43.10% 38.16% 37.78%
Expected dividends (Singapore cents) –* –* –*
Risk-free interest rate 1.06% 1.21% 1.43%
* - denotes less than 0.01 Singapore cents
There is no market condition associated with the share option grants.
(b) Employee Share Plan (equity-settled)
The Employee Share Plan (the “Plan”) was approved and adopted by members of the Company at the Extraordinary General Meeting held on 29 April 2008. The Plan is administered by a committee comprising the directors of the Company.
In 2009, 230,000 treasury shares were awarded to certain employees pursuant to the Plan. No treasury shares had been awarded to employees under the Plan subsequent to 2009.
Disclosure of share-based payments arrangements
The number and weighted average exercise prices of share options are as follows:
Weighted average exercise price per share
2016S$
Number of options2016’000
Weightedaverage exercise price per share
2015S$
Number of options2015’000
Outstanding at 1 January 0.89 22,599 1.07 19,762
Granted during the year 0.53 8,356 1.01 11,900
Exercised during the year – – 0.49 (1,953)
Cancelled during the year 0.99 (360) 1.57 (7,110)
Outstanding at 31 December 0.83 30,595 0.93 22,599
Exercisable at 31 December 0.79 7,865 0.64 5,740
The options outstanding at 31 December 2016 have an exercise price in the range of S$0.26 to S$1.01 (2015: S$0.29 to S$1.08) and the weighted average contractual life of 6.7 years (2015: 7.1 years).

EZION HOLDINGS LIMITED
124 NOTES TO THE FINANCIAL STATEMENTSYear ended 31 December 2016
21 SHARE-BASED PAYMENTS (CONT’D)
Employee expenses
Group
2016US$’000
2015US$’000
Ezion Employee Share Option Scheme 1,968 2,121
Total expenses recognised as share-based payments 1,968 2,121
22 REVENUE
Group
2016US$’000
2015US$’000
Chartering and offshore support services income 316,046 348,247
Others 2,199 2,900
318,245 351,147
23 NET FINANCE COSTS
Group
2016US$’000
2015US$’000
Interest income:
– banks 1,801 2,466
– related corporations 2,590 1,828
– others 304 145
Finance income 4,695 4,439
Interest expense paid/payable to banks (32,512) (26,412)
Finance costs (32,512) (26,412)
Net finance costs recognised in profit or loss (27,817) (21,973)

ANNUAL REPORT 2016
125NOTES TO THE FINANCIAL STATEMENTSYear ended 31 December 2016
24 (LOSS)/PROFIT BEFORE INCOME TAX
The following items have been included in arriving at (loss)/profit before income tax:
Group
Note 2016US$’000
2015US$’000
Foreign exchange gain (8,144) (5,003)
Loss/(Gain) on disposal of:
- plant and equipment 5,116 –
- assets held for sale 10 (26,251) –
Gain from change in ownership interest in associates – (8,882)
Impairment losses on:
- plant and equipment 4 45,647 37,900
- trade receivables 9 25,219 43,228
Audit fees paid/payable to auditors of the Company 402 359
Non-audit fees paid/payable to auditors of the Company 15 24
Operating lease expense 41,972 31,671
Staff costs 8,607 10,936
Contributions to defined contribution plans, included in staff costs 805 769
Equity-settled share-based payment transactions, included in staff costs 21 1,968 2,121
Staff costs include key management personnel compensation and key executives compensation as disclosed in note 29.
25 INCOME TAX EXPENSE
Group
2016US$’000
2015US$’000
Current tax expense
Current year 17 198
Overprovision in respect of prior years (233) (181)
Foreign tax expense 3,347 1,115
3,131 1,132
Deferred tax expense
Origination and reversal of temporary differences (449) 449
Total tax expense 2,682 1,581

EZION HOLDINGS LIMITED
126 NOTES TO THE FINANCIAL STATEMENTSYear ended 31 December 2016
25 INCOME TAX EXPENSE (CONT’D)
Group
2016US$’000
2015US$’000
Reconciliation of effective tax rate
(Loss)/Profit before income tax (30,924) 38,365
Share of results of joint ventures and associates (net of tax) 2,041 (23,448)
(Loss)/Profit before income tax excluding share of results of joint ventures and associates (28,883) 14,917
Group
2016US$’000
2016US$’000
Tax calculated using Singapore tax rate of 17% (2015: 17%) (4,910) 2,536
Effect of tax rates in foreign jurisdictions (3,201) (3,232)
Income not subject to tax (23,617) (20,093)
Net tax exempt income under Section 13A of Income Tax Act (6,229) (12,986)
Non-deductible expenses 36,072 33,267
Foreign tax expense 3,347 1,115
Overprovision in respect of prior years (233) (181)
Current year losses for which no deferred tax asset was recognised 1,767 928
Others (314) 227
2,682 1,581
For the financial years ended 31 December 2016 and 2015, the effective applicable tax rate is lower than 17% as no provision is made for taxation for certain income in view of the exempt profits earned by the Group under Section 13A of the Income Tax Act during the year.
The Group has unrecognised deferred tax assets in respect of tax losses of US$7,837,000 (2015: US$6,070,000) at the balance sheet date. Deferred tax assets have not been recognised because the Group does not consider it probable that there will be future taxable profits of certain subsidiaries available to utilise these tax losses. These tax losses, which are available to set-off against future taxable income in the foreseeable future, are also subject to agreement by the tax authorities and compliance with tax regulations prevailing in the respective countries.

ANNUAL REPORT 2016
127NOTES TO THE FINANCIAL STATEMENTSYear ended 31 December 2016
26 EARNINGS PER SHARE
BASIC EARNINGS PER SHARE
The calculation of basic earnings per share for the year ended 31 December 2016 was based on:
Group
2016US$’000
2015US$’000
(Loss)/Profit attributable to owners of the Company (33,606) 36,784
Less:
Accrued perpetual securities distributions (7,634) (12,520)
(Loss)/Profit attributable to owners after adjustments of accrued perpetual securities distributions (41,240) 24,264
WEIGHTED AVERAGE NUMBER OF ORDINARY SHARES
2016’000
2015*’000
Issued ordinary shares at 1 January, excluding treasury shares 1,577,757 1,578,304
Effect of issue of new ordinary shares 211,995 23,855
Effect of exercise of options – 129
Weighted average number of ordinary shares during the year 1,789,752 1,602,288
DILUTED EARNINGS PER SHARE
The calculation of diluted earnings per share for the year ended 31 December 2016 was based on:
Group
2016US$’000
2015US$’000
(Loss)/Profit attributable to owners of the Company (diluted) (33,606) 36,784
Less:
Accrued perpetual securities distributions (7,634) (12,520)
(Loss)/Profit attributable to ordinary shareholders after adjustments of accrued perpetual securities distributions (diluted) (41,240) 24,264
EZION HOLDINGS LIMITED
128 NOTES TO THE FINANCIAL STATEMENTSYear ended 31 December 2016
26 EARNINGS PER SHARE (CONT’D)
WEIGHTED AVERAGE NUMBER OF ORDINARY SHARES (DILUTED)
2016’000
2015*’000
Weighted average number of ordinary shares (basic) 1,789,752 1,602,288
Effect of share options in issue 3,657 4,012
Effect of issue of redeemable exchangeable preference shares 19,788 19,788
Weighted average number of ordinary shares at 31 December 1,813,197 1,626,088
The average market value of the Company’s shares for purposes of calculating dilutive effect of share options was based on quoted market prices for the period during which the options were outstanding.
* Number of weighted average number of ordinary shares were restated due to retrospective adjustments for Rights Issue.
27 OPERATING SEGMENTS
The Group has two reportable segments, as described below, which are the Group’s strategic business units. The strategic business units offer different products and services, and are managed separately because they require different technology and marketing strategies. For each of the strategic business units, the Group’s key management reviews internal management reports on at least a quarterly basis. The following summary describes the operations in each of the Group’s reportable segments:
(a) Production and maintenance support: engaged in the owning, chartering and management of rigs and vessels involved in the production and maintenance phase of the oil and gas industry.
(b) Exploration and development support: engaged in the owning, chartering and management of rigs and vessels involved in the exploration and development phase of the oil and gas industry.
(c) Others: assets or investments involved in renewable energy and other oil and gas related industry.
The accounting policies of the reportable segments are the same as described in note 3(O).
Information regarding the results of each reportable segment is included below. Performance is measured based on segment profit before income tax, as included in the internal management reports that are reviewed by the Group’s key management. Segment profit is used to measure performance as management believes that such information is the most relevant in evaluating the results of certain segments relative to other entities that operate within these industries. Inter-segment pricing is determined on an arm’s length basis.

ANNUAL REPORT 2016
129NOTES TO THE FINANCIAL STATEMENTSYear ended 31 December 2016
27 OPERATING SEGMENTS (CONT’D)
Business segments
Production and maintenance
support
Exploration and development
support OthersTotal
operations
US$’000 US$’000 US$’000 US$’000
Year ended 31 December 2016External revenue 276,199 41,538 508 318,245
Inter-segment revenue 48,738 – 5,696 54,434
Total revenue for reportable segments 324,937 41,538 6,204 372,679
Elimination of inter-segment revenue (54,434)
Consolidated revenue 318,245
Reportable segment results from operating activities 46,762 2,611 507 49,880
Impairment loss on plant and equipment and provision for trade receivables (65,992) (4,874) – (70,866)
Other income 32,254 – – 32,254
Share of results of joint ventures and associates, net of tax 143 12,105 (14,289) (2,041)
Finance income 4,695 – – 4,695
Finance expense (27,058) (5,454) – (32,512)
Unallocated expenses (12,334)
Loss before income tax (30,924)
Income tax expense (2,682)
Loss for the year (33,606)
Reportable segment assets 2,369,125 316,048 – 2,685,173
Investment in joint ventures and associates 46,565 136,646 67,174 250,385
Unallocated assets 66,152
Total assets 3,001,710
Reportable segment liabilities 1,453,790 187,735 – 1,641,525
Unallocated liabilities 44,801
Total liabilities 1,686,326
Capital expenditure 114,175 4,268 – 118,443
Unallocated capital expenditure 133
Total capital expenditure 118,576
Other material non-cash items:Depreciation 117,808 32,511 – 150,319
Unallocated depreciation 293
Total depreciation 150,612
Net impairment losses on:- plant and equipment 44,915 732 – 45,647
- trade receivables 21,077 4,142 – 25,219

EZION HOLDINGS LIMITED
130 NOTES TO THE FINANCIAL STATEMENTSYear ended 31 December 2016
27 OPERATING SEGMENTS (CONT’D) Business segments (cont’d)
Production and maintenance
support
Exploration and development
support OthersTotal
operations
US$’000 US$’000 US$’000 US$’000
Year ended 31 December 2015External revenue 312,492 38,219 436 351,147
Inter-segment revenue 118,793 – 6,495 125,288
Total revenue for reportable segments 431,285 38,219 6,931 476,435
Elimination of inter-segment revenue (125,288)
Consolidated revenue 351,147
Reportable segment results from operating activities 107,231 55 436 107,722
Impairment loss on plant and equipment and provision for trade receivables (81,128) – – (81,128)
Other income 11,307 – 13,929 25,236
Share of results of joint ventures and associates, net of tax 8,819 19,024 (4,395) 23,448
Finance income 4,439 – – 4,439
Finance expense (21,019) (5,393) – (26,412)
Unallocated expenses (14,940)
Profit before income tax 38,365
Income tax expense (1,581)
Profit for the year 36,784
Reportable segment assets 2,354,330 323,976 – 2,678,306
Investment in joint ventures and associates 45,406 98,056 60,513 203,975
Unallocated assets 226,121
Total assets 3,108,402
Reportable segment liabilities 1,652,976 205,154 – 1,858,130
Unallocated liabilities 8,962
Total liabilities 1,867,092
Capital expenditure 402,120 30,666 – 432,786
Unallocated capital expenditure 187
Total capital expenditure 432,973
Other material non-cash items:Depreciation 103,659 30,865 – 134,524
Unallocated depreciation 349
Total depreciation 134,873
Net impairment losses on:- plant and equipment 37,900 – – 37,900
- trade receivables 43,228 – – 43,228

ANNUAL REPORT 2016
131NOTES TO THE FINANCIAL STATEMENTSYear ended 31 December 2016
27 OPERATING SEGMENTS (CONT’D)
Geographical segments
The businesses of the Group are operated in five principal geographical areas, namely, Singapore, India, Middle East, rest of Asia, Europe and other countries. In presenting information on the basis of geographical segments, segment revenue is based on the geographical location of customers. Segment assets are based on the geographical location where assets are registered.
Revenue Non-current assets(1)
2016US$’000
2015US$’000
2016US$’000
2015US$’000
Singapore 50,000 31,547 1,161,809 1,376,929
India 48,501 44,475 – –
Middle East 95,112 58,042 – –
Rest of Asia 77,736 129,622 556,306 430,218
Europe 30,393 62,166 384,579 368,322
Other countries 16,503 25,294 95,752 108,648
318,245 351,147 2,198,446 2,284,117
(1) Non-current assets presented consist of plant and equipment.
Major customers
During the financial year ended 31 December 2016, the Group had two (2015: one) customers in the Group’s production and maintenance support segment that contributed 10% or more of the Group’s total revenue. Revenue from the customers amounted to US$79,779,000 (2015: US$40,286,000) of the Group’s total revenue.
28 COMMITMENTS
(A) CAPITAL COMMITMENTS
Group
2016US$’000
2015US$’000
Contracted but not provided for:
Within 1 year 190,875 194,475
After 1 year but within 5 years 250,000 64,000
440,875 258,475

EZION HOLDINGS LIMITED
132 NOTES TO THE FINANCIAL STATEMENTSYear ended 31 December 2016
28 COMMITMENTS (CONT’D)
(A) CAPITAL COMMITMENTS (CONT’D)
The Group is committed to incur capital commitments of US$440,875,000, of which US$190,875,000 is due within the next twelve months. Out of the US$250,000,000 that is expected to be incurred after 1 year, the Group has postponed the delivery of its two contractual commitments amounting to US$186,000,000 to mutually agreed dates with the ship builders.
The Group has obtained in-principle approvals from its major lenders for the financing of US$141,130,000 for vessels with expected delivery in 2017 and US$35,750,000 for a vessel with expected delivery in 2018.
(B) OPERATING LEASE EXPENSE COMMITMENTS (AS LESSEE)
At the reporting date, the Group has commitments for future minimum lease payments under non-cancellable operating leases as follows:
Group
2016US$’000
2015US$’000
Within 1 year 38,935 26,912
After 1 year but within 5 years 85,610 56,560
124,545 83,472
Operating lease expense commitments at the reporting date represents rentals payable by the Group for its vessel charters and office space. The leases from vessel charter and office rental are for a period ranging from 1 to 4 years from 1 January 2017 to 31 December 2020 (2015: 1 January 2016 to 31 December 2019).
Included in the above future minimum lease payments under non-cancellable operating leases are amounts payable to the Group’s joint ventures and an affiliate within 1 year and after 1 year but within 5 years of US$16,608,000 (2015: US$25,988,000) and US$21,337,000 (2015: US$55,633,000) respectively.
(C) OPERATING LEASE INCOME COMMITMENTS (AS LESSOR)
The Group charters out its vessels. At the reporting date, the total future minimum lease receivables under non-cancellable operating lease rentals are as follows:
Group
2016US$’000
2015US$’000
Within 1 year 307,828 292,715
After 1 year but within 5 years 993,034 777,272
After 5 years 150,418 111,312
1,451,280 1,181,299

ANNUAL REPORT 2016
133NOTES TO THE FINANCIAL STATEMENTSYear ended 31 December 2016
28 COMMITMENTS (CONT’D)
(C) OPERATING LEASE INCOME COMMITMENTS (AS LESSOR) (CONT’D)
Operating lease income commitments represents rentals receivable from customers on the Group’s vessels charter. The lease terms are negotiated on fixed terms till expiry of the lease. Included in the above future minimum lease receivables under non-cancellable operating lease rentals are amounts arising from customers’ options to extend their vessel charter within 1 year, after 1 year but within 5 years and after 5 years of US$2,000,000 (2015: US$4,997,000), US$242,127,000 (2015: US$247,620,000) and US$75,209,000 (2015: US$101,588,000) respectively.
29 RELATED PARTIES
For the purposes of these financial statements, parties are considered to be related to the Group if the Group has the ability, directly or indirectly, to control the party or exercise significant influence over the party in making financial and operating decisions, or vice versa, or where the Group and the party are subject to common control or common significant influence. Related parties may be individuals or other entities.
Other than disclosed elsewhere in the financial statements, the transactions with related parties are as follows:
Key management personnel compensation and key executives compensation
Key management personnel compensation and key executives compensation comprised:
Group
2016US$’000
2015US$’000
Short-term employee benefits 3,498 6,075
Share-based payments 1,010 1,009
Other related party transactions
Group
2016US$’000
2015US$’000
Transactions with joint ventures
Interest income received and receivable 2,424 1,828
Offshore logistic support vessels, liftboats and rigs’ services costs paid and payable (19,436) (22,476)
Management fee income from joint ventures 206 206

EZION HOLDINGS LIMITED
134 NOTES TO THE FINANCIAL STATEMENTSYear ended 31 December 2016
29 RELATED PARTIES (CONT’D)
Other related party transactions (cont’d)
Group
2016US$’000
2015US$’000
Transactions with associates
Offshore logistic support vessels, liftboats and rigs’ services revenue received and receivable – 17,978
Management fee income from associates 302 230
30 ACCOUNTING ESTIMATES AND JUDGEMENTS
Estimates and judgement are continually evaluated and are based on historical experience and other factors, including expectations of future events that are believed to be reasonable under the circumstances.
Information about assumptions and estimation uncertainties that have a significant risk of resulting in a material adjustment within the next financial year is discussed as follows:
Impairment of plant and equipment
The Group assesses the impairment of plant and equipment whenever events or changes in circumstances indicate that the carrying value may not be recoverable. Factors considered important that could trigger an impairment review include the following:
• Extended periods of idle time;
• Inability to contract specific assets or groups of assets; and
• Significant adverse industry or economic trends.
The complexity of the estimation process and issues related to the assumptions, risks and uncertainties inherent in the application of the Group’s accounting estimates in relation to plant and equipment affect the amounts reported in the financial statements, especially the estimates of the expected useful economic lives and the carrying values of those assets. If business conditions were different, or if different assumptions were used in the application of this and other accounting estimates, it is likely that materially different amounts could be reported in the Group’s financial statements.
For the purposes of impairment assessment of vessels, each vessel is a separate CGU. A total of 67 (2015: 70) CGUs have been identified. Management assessed the recoverable amounts of the vessels based on their value in use if any indicators of impairment existed.

ANNUAL REPORT 2016
135NOTES TO THE FINANCIAL STATEMENTSYear ended 31 December 2016
30 ACCOUNTING ESTIMATES AND JUDGEMENTS (CONT’D)
The recoverable amounts of the CGUs were determined based on value in use calculations.
Based on the above assessment, the Group recognised impairment losses relating to 16 CGUs of US$11,477,000, US$22,453,000 and US$11,717,000 (2015: US$9,446,000, US$28,454,000 and US$Nil) for the vessels, rigs and vessel under construction respectively (note 4).
Impairment of trade receivables
Trade receivables are recorded at the invoiced amount and do not bear interest. The allowance for doubtful receivables is the Group’s best estimate of the amount of probable credit losses in the Group’s existing trade receivables.
Management uses judgement to determine the allowance for doubtful receivables which are supported by historical write-off, credit history of the customers and repayment records. The Group reviews its allowance for doubtful receivables monthly. Balances which are past due for more than 120 days are reviewed individually for collectability. Accounts balances are charged off against the allowance after all means of collection have been exhausted and the potential for recovery is considered remote. Actual results could differ from estimates.
31 FINANCIAL RISK MANAGEMENT
Overview
Risk management is integral to the whole business of the Group. The Group has a system of controls in place to create an acceptable balance between the cost of risks occurring and the cost of managing the risks. The management continually monitors the Group’s risk management process to ensure that an appropriate balance between risk and control is achieved. Risk management policies and systems are reviewed regularly to reflect changes in market conditions and the Group’s activities.
The Audit Committee oversees how management monitors compliance with the Group’s risk management policies and procedures and reviews the adequacy of the risk management framework in relation to the risks faced by the Group.
The Group’s principal financial instruments comprise cash and cash equivalents and bank loans. The main purpose of these financial instruments is to finance the Group’s operations. The other financial instruments such as trade and other payables are directly from its operations.

EZION HOLDINGS LIMITED
136 NOTES TO THE FINANCIAL STATEMENTSYear ended 31 December 2016
31 FINANCIAL RISK MANAGEMENT (CONT’D)
Credit risk
The Group’s maximum exposure to credit risk are carrying amounts of amounts due from joint ventures, other assets, trade receivables, and cash and cash equivalents.
The Group has a credit policy in place which establishes credit limits for customers and monitors their balances on an ongoing basis. Therefore, the Group does not expect to incur material credit losses. Cash and cash equivalents are placed with regulated financial institutions. Hence, minimal credit risk exists with respect to these assets.
The Group establishes an allowance for impairment that represents its estimate of incurred losses in respect of trade and other receivables. The main components of this allowance are a specific loss component that relates to individually significant exposures, and a collective loss component established for groups of similar assets in respect of losses that have been incurred but not yet identified. The collective loss allowance is determined based on historical data of payment statistics for similar financial assets.
The allowance account in respect of trade receivables is used to record impairment losses unless the Group is satisfied that no recovery of the amount owing is possible. At that point, the financial asset is considered irrecoverable and the amount charged to the allowance account is written off against the carrying amount of the impaired financial asset.
The Group has no significant concentration of credit risk except for six (2015: seven) third party trade receivables which accounts for approximately 60% (2015: 51%) of the total trade receivables as at 31 December 2016 and 2015.
Financial guarantees
The credit risk represents the loss that would be recognised upon a default by the parties to which the guarantees were given on behalf of. To mitigate these risks, management continually monitors the risks and has established processes including performing credit evaluations of the parties it is providing the guarantee on behalf of. Guarantees are only given to its subsidiaries and joint ventures.
Financial guarantees provided by the Company to its subsidiaries are eliminated in preparing the consolidated financial statements. Estimates of the Company’s obligations arising from financial guarantee contracts may be affected by future events, which cannot be predicted with any certainty. The assumptions may well vary from actual experience so that the actual liability may vary considerably from the best estimates.
Financial guarantees comprise guarantees granted by the Company to banks in respect of banking facilities of its subsidiaries and joint ventures. At the reporting date, the maximum exposure of the Group and of the Company in respect of financial guarantees amounting to US$153,999,000 (2015: US$182,152,000) and US$1,157,451,000 (2015: US$1,249,070,000) respectively.
At the reporting date, the Company does not consider it probable that a claim will be made against the Company under the financial guarantees granted to the subsidiaries and joint ventures.

ANNUAL REPORT 2016
137NOTES TO THE FINANCIAL STATEMENTSYear ended 31 December 2016
31 FINANCIAL RISK MANAGEMENT (CONT’D)
Liquidity risk
Liquidity risk is the risk that the Group will encounter difficulty in meeting the obligations associated with its financial liabilities that are settled by delivering cash or another financial asset. The Group’s approach to managing liquidity is to ensure, as far as possible, that it will always have sufficient level of cash and cash equivalents and bank facilities to meet its liabilities when due, under both normal and stressed conditions, without incurring unacceptable losses or risking damage to the Group’s reputation.
As at 31 December 2016, the Group has contractual capital commitments of US$440,875,000, of which US$190,875,000 is due within the next twelve months. The Group has obtained in-principle approvals from its major lenders for the financing of US$141,130,000 for vessels with expected delivery in 2017 and US$35,750,000 for a vessel with expected delivery in 2018. The Group is confident to complete the financing arrangements with the lenders in due course before the expected delivery of the vessels.
As at 31 December 2016, the Group has cash and cash equivalents amounting to US$204,953,000 (2015: US$229,756,000). As at 31 December 2016, the Group has undrawn banking facilities amounting to US$35,499,000 (2015: US$47,399,000). In addition, the Group has completed discussions with its major lenders to reduce its principal repayments to match the Group’s operating cash flows.
The Group believes that the repayment of its present and future obligations will occur as required and is confident that the cash flows generated from the Group’s operating activities and continuing credit facilities being made available to the Group will be sufficient to meet the repayment requirements.
Market risk
Market risk is the risk that changes in market prices, such as interest rates, foreign exchange rates and equity prices will affect the Group’s income or the value of its holdings of financial instruments. The objective of market risk management is to manage and control market risk exposures within acceptable parameters, while optimizing the return on risk.
Interest rate risk
The Group’s interest rate risk exposure relates primarily to its long-term debt obligations as they are subject to fluctuating interest rates that reset according to market rates change. The Group enters into and designates interest rate swaps as hedges of the variability in cash flows attributable to interest rate risk.
At 31 December 2016, the Group has interest rate swaps with total notional contract amount of US$225,000,000 (2015: US$202,500,000) whereby the Group has agreed with counterparties to exchange, at specified intervals, the difference between floating rate and fixed rate interest amounts calculated by reference to the agreed notional principal amounts of the secured and unsecured term loans.
At 31 December 2016, the Group has fixed deposits account with regulated banks that interest rate was fixed according to market rates.

EZION HOLDINGS LIMITED
138 NOTES TO THE FINANCIAL STATEMENTSYear ended 31 December 2016
31 FINANCIAL RISK MANAGEMENT (CONT’D)
Exposure to interest rate risk
At the reporting date, the interest rate profile of the Group’s interest-bearing financial interests, as reported to the management, was as follows:
Variable rate instruments
Group and Company
Nominal amount
2016US$’000
2015US$’000
Interest rate swaps 225,000 200,000
Group Company
Carrying amount Carrying amount
2016US$’000
2015US$’000
2016US$’000
2015US$’000
USD secured floating rate loans (959,725) (1,057,241) – –
SGD secured floating rate loan (41,054) (42,436) (41,054) (42,436)
USD unsecured floating rate loans (113,600) (120,750) (113,600) (120,750)
(1,114,379) (1,220,427) (154,654) (163,186)
Sensitivity analysis
The Group does not account for any fixed rate financial assets and liabilities at fair value through profit or loss. Therefore, a change in interest rates at the reporting dates would not affect profit or loss.
For the variable rate financial assets and liabilities, a change of 100 basis point (“bp”) in interest rate at the reporting date would increase/(decrease) profit before tax and equity by the pre-tax amounts shown below. This analysis assumes that all other variables, in particular foreign currency exchange rates, remain constant.

ANNUAL REPORT 2016
139NOTES TO THE FINANCIAL STATEMENTSYear ended 31 December 2016
31 FINANCIAL RISK MANAGEMENT (CONT’D)
Profit before tax Equity
100 bpIncreaseUS$’000
100 bpDecreaseUS$’000
100 bpIncreaseUS$’000
100 bpDecreaseUS$’000
Group
31 December 2016
Interest-bearing loans (11,144) 11,144 – –
Interest rate swaps 1,600 (1,600) 2,913 (2,913)
31 December 2015
Interest-bearing loans (12,204) 12,204 – –
Interest rate swaps 11 (11) 13 (13)
Company
31 December 2016
Interest-bearing loans (15,465) 15,465 – –
Interest rate swaps 1,600 (1,600) 2,913 (2,913)
31 December 2015
Interest-bearing loans (16,319) 16,319 – –
Interest rate swaps 11 (11) 13 (13)
Foreign currency risk
The Group has exposure to foreign currency risk as a result of its operations in several countries. The currencies giving rise to this risk are primarily US dollar (“USD”), Singapore dollar (“SGD”) and Australian dollar (“AUD”).
In respect of other monetary assets and liabilities held in currencies other than the functional currencies of respective entities, the Group ensures that the net exposure is kept to an acceptable level by buying currencies at spot rates, where necessary, to address short term imbalances.

EZION HOLDINGS LIMITED
140 NOTES TO THE FINANCIAL STATEMENTSYear ended 31 December 2016
31 FINANCIAL RISK MANAGEMENT (CONT’D)
The Group’s and the Company’s exposures to foreign currencies are as follows:
USDUS$’000
SGDUS$’000
AUDUS$’000
OthersUS$’000
TotalUS$’000
Group
31 December 2016
Loan to associate – 1,556 438 – 1,994
Trade receivables and other assets 2,054 2,687 2,551 – 7,292
Cash and cash equivalents 18 139,926 25 1,776 141,745
Trade and other payables (387) (20,740) (2,826) (2,110) (26,063)
Financial liabilities – (41,485) – – (41,485)
Notes payable – (372,040) – – (372,040)
1,685 (290,096) 188 (334) (288,557)
31 December 2015
Loan to associate – 1,579 425 – 2,004
Trade receivables and other assets – 4,040 2,429 107 6,576
Cash and cash equivalents 18 194,016 949 964 195,947
Trade and other payables (221) (28,594) (3,170) (1,627) (33,612)
Financial liabilities – (42,549) – – (42,549)
Notes payable – (378,691) – – (378,691)
(203) (250,199) 633 (556) (250,325)
SGDUS$’000
AUDUS$’000
OthersUS$’000
TotalUS$’000
Company
31 December 2016
Loan to associate 1,556 438 – 1,994
Trade receivables and other assets 2,453 245 – 2,698
Cash and cash equivalents 138,406 2 – 138,408
Trade and other payables (12,900) (12) (3) (12,915)
Financial liabilities (41,485) – – (41,485)
Notes payable (372,040) – – (372,040)
(284,010) 673 (3) (283,340)
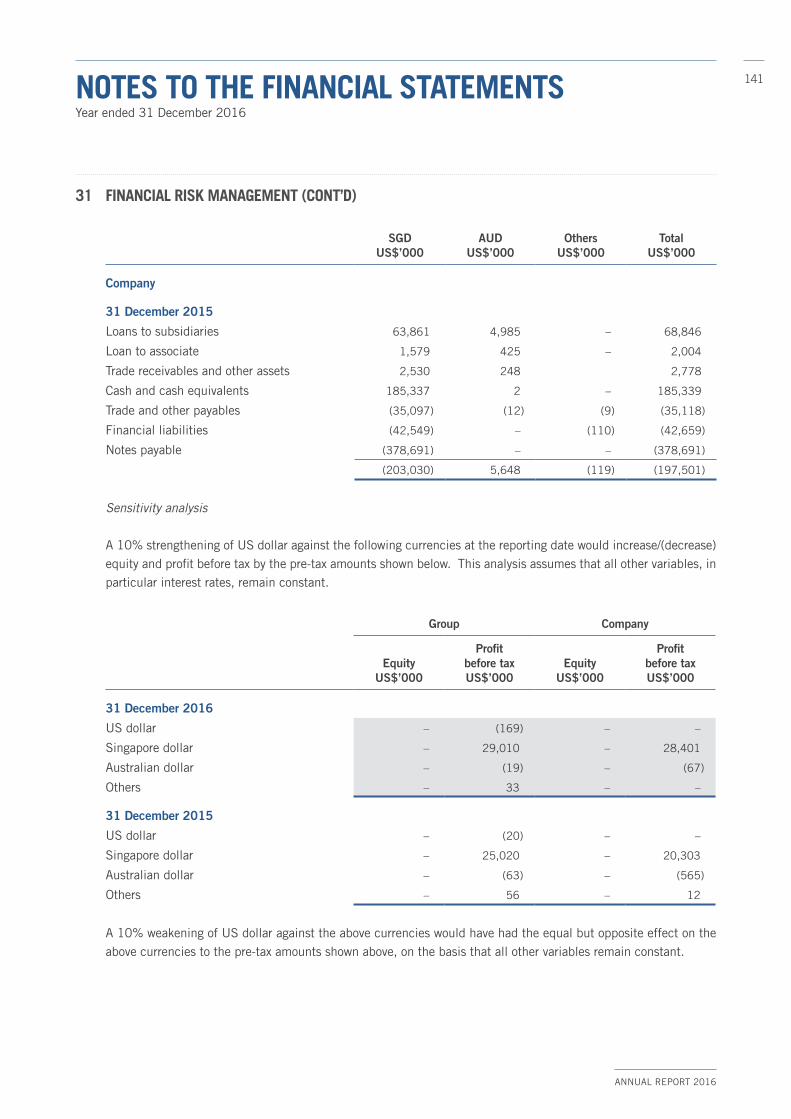
ANNUAL REPORT 2016
141NOTES TO THE FINANCIAL STATEMENTSYear ended 31 December 2016
31 FINANCIAL RISK MANAGEMENT (CONT’D)
SGDUS$’000
AUDUS$’000
OthersUS$’000
TotalUS$’000
Company
31 December 2015
Loans to subsidiaries 63,861 4,985 – 68,846
Loan to associate 1,579 425 – 2,004
Trade receivables and other assets 2,530 248 2,778
Cash and cash equivalents 185,337 2 – 185,339
Trade and other payables (35,097) (12) (9) (35,118)
Financial liabilities (42,549) – (110) (42,659)
Notes payable (378,691) – – (378,691)
(203,030) 5,648 (119) (197,501)
Sensitivity analysis
A 10% strengthening of US dollar against the following currencies at the reporting date would increase/(decrease) equity and profit before tax by the pre-tax amounts shown below. This analysis assumes that all other variables, in particular interest rates, remain constant.
Group Company
EquityUS$’000
Profit before taxUS$’000
EquityUS$’000
Profit before taxUS$’000
31 December 2016
US dollar – (169) – –
Singapore dollar – 29,010 – 28,401
Australian dollar – (19) – (67)
Others – 33 – –
31 December 2015
US dollar – (20) – –
Singapore dollar – 25,020 – 20,303
Australian dollar – (63) – (565)
Others – 56 – 12
A 10% weakening of US dollar against the above currencies would have had the equal but opposite effect on the above currencies to the pre-tax amounts shown above, on the basis that all other variables remain constant.

EZION HOLDINGS LIMITED
142 NOTES TO THE FINANCIAL STATEMENTSYear ended 31 December 2016
31
FINA
NCIA
L RI
SK M
ANAG
EMEN
T (C
ONT’
D)
Fa
ir va
lues
ver
sus
carr
ying
am
ount
s
Non
-der
ivat
ive
finan
cial
ass
ets
and
liabi
litie
s
The
carr
ying
am
ount
s of
the
Gro
up a
nd th
e Com
pany
’s fi
nanc
ial i
nstr
umen
ts o
ther
than
inte
rest
rate
sw
aps
used
for h
edgi
ng a
re c
arrie
d at
cos
t or a
mor
tised
co
st a
re n
ot m
ater
ially
diff
eren
t fr
om t
heir
fair
valu
es a
s at
31 D
ecem
ber
2016 a
nd 3
1 D
ecem
ber
2015 d
ue t
o th
eir
shor
t-te
rm n
atur
e an
d im
mat
eria
l ef
fect
s of
dis
coun
ting.
Fi
nanc
ial i
nstr
umen
ts b
y ca
tego
ry
Set
out
bel
ow i
s a
com
paris
on b
y ca
tego
ry o
f ca
rryi
ng a
mou
nts
of a
ll th
e G
roup
and
Com
pany
’s fi
nanc
ial
inst
rum
ents
tha
t ar
e ca
rrie
d in
the
fina
ncia
l st
atem
ents
:
Not
e
Fair
valu
e-he
dgin
g in
stru
men
tsU
S$’0
00
Loan
san
dre
ceiv
able
sU
S$’0
00
Oth
er fi
nanc
ial
liabi
litie
s w
ithin
sc
ope
of F
RS
39U
S$’0
00
Oth
er fi
nanc
ial
liabi
litie
s ou
tsid
e sc
ope
of F
RS
39U
S$’0
00
Tota
lca
rryi
ngam
ount
US$
’000
Fair
val
ueU
S$’0
00
Gro
up
31 D
ecem
ber
2016
Fina
ncia
l ass
ets
not
mea
sure
d at
fai
r va
lue
Oth
er a
sset
s(1)
8–
114,4
50
––
114,4
50
114,4
50
Trad
e re
ceiv
able
s9
–178,8
99
––
178,8
99
178,8
99
Cas
h an
d ca
sh e
quiv
alen
ts11
–204,9
53
––
204,9
53
204,9
53
Fina
ncia
l ass
et m
easu
red
at f
air
valu
eIn
tere
st r
ate
swap
s us
ed f
or h
edgi
ng16
2,1
31
––
–2,1
31
2,1
31
Fina
ncia
l lia
bilit
ies
not
mea
sure
d at
fai
r va
lue
Oth
er p
ayab
les(2
)16
––
(43,7
44)
–(4
3,7
44)
(43,7
44)
Trad
e pa
yabl
es20
––
(112,0
74)
–(1
12,0
74)
(112,0
74)
Fina
ncia
l lia
bilit
ies(3
)18
––
(1,1
19,0
75)
–(1
,119,0
75)
(1,1
19,0
75)
Fina
ncia
l lea
se li
abili
ties
18
––
–(4
7)
(47)
(47)
Not
es p
ayab
le17
––
(372,0
40)
–(3
72,0
40)
(252,1
07)

ANNUAL REPORT 2016
143NOTES TO THE FINANCIAL STATEMENTSYear ended 31 December 2016
31
FINA
NCIA
L RI
SK M
ANAG
EMEN
T (C
ONT’
D)
Fi
nanc
ial i
nstr
umen
ts b
y ca
tego
ry (
cont
’d)
Not
e
Fair
valu
e-he
dgin
g in
stru
men
tsU
S$’0
00
Loan
san
dre
ceiv
able
sU
S$’0
00
Oth
er fi
nanc
ial
liabi
litie
s w
ithin
sc
ope
of F
RS
39U
S$’0
00
Oth
er fi
nanc
ial
liabi
litie
s ou
tsid
e sc
ope
of F
RS
39U
S$’0
00
Tota
lca
rryi
ngam
ount
US$
’000
Fair
val
ueU
S$’0
00
31 D
ecem
ber
2015
Fina
ncia
l ass
ets
not
mea
sure
d at
fai
r va
lue
Oth
er a
sset
s(1)
8–
38,5
48
––
38,5
48
38,5
48
Trad
e re
ceiv
able
s9
–193,2
47
––
193,2
47
193,2
47
Cas
h an
d ca
sh e
quiv
alen
ts11
–229,7
56
––
229,7
56
229,7
56
Fina
ncia
l lia
bilit
y m
easu
red
at f
air
valu
eIn
tere
st r
ate
swap
s us
ed f
or h
edgi
ng16
(1,0
54)
––
–(1
,054)
(1,0
54)
Fina
ncia
l lia
bilit
ies
not m
easu
red
at fa
ir va
lue
Liab
ilitie
s re
latin
g to
ass
ets
held
for
sal
e–
–(4
2,6
58)
–(4
2,6
58)
(42,6
58)
Oth
er p
ayab
les(2
)16
––
(61,8
78)
–(6
1,8
78)
(60,2
87)
Trad
e pa
yabl
es20
––
(126,1
65)
–(1
26,1
65)
(126,1
65)
Fina
ncia
l lia
bilit
ies(3
)18
––
(1,2
26,2
42)
–(1
,226,2
42)
(1,2
26,2
42)
Fina
ncia
l lea
se li
abili
ties
18
––
–(1
13)
(113)
(113)
Not
es p
ayab
le17
––
(378,6
91)
–(3
78,6
91)
(365,0
91)
Com
pany
31 D
ecem
ber
2016
Fina
ncia
l ass
ets
not
mea
sure
d at
fai
r va
lue
Oth
er a
sset
s(1)
8–
67,9
22
––
67,9
22
67,9
22
Trad
e re
ceiv
able
s9
–9,5
99
––
9,5
99
9,5
59
Cas
h an
d ca
sh e
quiv
alen
ts11
–149,4
97
––
149,4
97
149,4
97
Fina
ncia
l ass
et m
easu
red
at f
air
valu
eIn
tere
st r
ate
swap
s us
ed f
or h
edgi
ng16
2,1
31
––
–2,1
31
2,1
31

EZION HOLDINGS LIMITED
144 NOTES TO THE FINANCIAL STATEMENTSYear ended 31 December 2016
31
FINA
NCIA
L RI
SK M
ANAG
EMEN
T (C
ONT’
D)
Fi
nanc
ial i
nstr
umen
ts b
y ca
tego
ry (
cont
’d)
Not
e
Fair
valu
e-
hedg
ing
inst
rum
ents
US$
’000
Loan
s
and
rece
ivab
les
US$
’000
Oth
er fi
nanc
ial
liabi
litie
s w
ithin
scop
e of
FR
S 39
US$
’000
Oth
er fi
nanc
ial
liabi
litie
s ou
tsid
e
scop
e of
FR
S 39
US$
’000
Tota
l
carr
ying
amou
nt
US$
’000
Fair
val
ue
US$
’000
Com
pany
31 D
ecem
ber
2016
Fina
ncia
l lia
bilit
ies
not
mea
sure
d at
fai
r va
lue
Oth
er p
ayab
les(2
)16
––
(180,7
02)
–(1
80,7
02)
(180,7
02)
Trad
e pa
yabl
es20
––
(198)
–(1
98)
(198)
Fina
ncia
l lia
bilit
ies(3
)18
––
(234,9
47)
–(2
34,9
47)
(234,9
47)
Fina
ncia
l lea
se li
abili
ties
18
––
–(4
7)
(47)
(47)
Not
es p
ayab
le17
––
(372,0
40)
–(3
72,0
40)
(252,1
07)
31 D
ecem
ber
2015
Fina
ncia
l ass
ets
not
mea
sure
d at
fai
r va
lue
Oth
er a
sset
s(1)
8–
48,7
81
––
48,7
81
48,7
81
Trad
e re
ceiv
able
s9
–8,0
77
––
8,0
77
8,0
77
Cas
h an
d ca
sh e
quiv
alen
ts11
–188,3
82
––
188,3
82
188,3
82
Fina
ncia
l lia
bilit
y m
easu
red
at f
air
valu
e
Inte
rest
rat
e sw
aps
used
for
hed
ging
16
(979)
––
–(9
79)
(979)
Fina
ncia
l lia
bilit
ies
not
mea
sure
d at
fai
r va
lue
Oth
er p
ayab
les(2
)16
––
(181,9
02)
–(1
81,9
02)
(181,9
02)
Trad
e pa
yabl
es20
––
(40)
–(4
0)
(40)
Fina
ncia
l lia
bilit
ies(3
)18
––
(272,8
88)
–(2
72,8
88)
(272,8
88)
Fina
ncia
l lea
se li
abili
ties
18
––
–(1
13)
(113)
(113)
Not
es p
ayab
le17
––
(378,6
91)
–(3
78,6
91)
(365,0
91)
(1)
Exc
lude
s ad
vanc
es t
o su
pplie
rs, p
repa
ymen
ts, i
nter
est
rate
sw
aps
used
for
hed
ging
and
ava
ilabl
e-fo
r-sal
e eq
uity
sec
uriti
es.
(2)
Exc
lude
s do
wnp
aym
ents
and
adv
ance
s fr
om c
usto
mer
s, in
tere
st r
ate
swap
s us
ed f
or h
edgi
ng a
nd d
efer
red
reve
nue.
(3)
Exc
lude
s fin
anci
al le
ase
liabi
litie
s.

ANNUAL REPORT 2016
145NOTES TO THE FINANCIAL STATEMENTSYear ended 31 December 2016
31 FINANCIAL RISK MANAGEMENT (CONT’D)
Fair value hierarchy
The tables below analyse fair value measurements for financial assets and financial liabilities, by the levels in the fair value hierarchy based on the inputs to valuation techniques. The different levels are defined as follows:
• Level 1: quoted prices (unadjusted) in active markets for identical assets or liabilities that the Group can access at the measurement date.
• Level 2: inputs other than quoted prices included within Level 1 that are observable for the asset or liability, either directly (i.e., as prices) or indirectly (i.e., derived from prices).
• Level 3: unobservable inputs for the asset or liability.
Financial assets and financial liabilities carried at fair value
Note Level 1US$’000
Level 2US$’000
Level 3US$’000
TotalUS$’000
Group
31 December 2016
Assets
Interest rate swaps used for hedging 16 – 2,131 – 2,131
31 December 2015
Liabilities
Interest rate swaps used for hedging 16 – (1,054) – (1,054)
Company
31 December 2016
Assets
Interest rate swaps used for hedging 16 – 2,131 – 2,131
31 December 2015
Liabilities
Interest rate swaps used for hedging 16 – (979) – (979)

EZION HOLDINGS LIMITED
146 NOTES TO THE FINANCIAL STATEMENTSYear ended 31 December 2016
31 FINANCIAL RISK MANAGEMENT (CONT’D)
Financial assets and financial liabilities not carried at fair value but for which fair values are disclosed*
Level 1US$’000
Level 2US$’000
Level 3US$’000
TotalUS$’000
Group
31 December 2016
Liabilities
Notes payable (252,107) – – (252,107)
31 December 2015
Liabilities
Notes payable (365,091) – – (365,091)
Company
31 December 2016
Liabilities
Notes payable (252,107) – – (252,107)
31 December 2015
Liabilities
Notes payable (365,091) – – (365,091)
* Excludes financial assets and financial liabilities whose carrying amounts measured on the amortised cost basis
approximate their fair value due to their short-term nature and where the effect of discounting immaterial.
Valuation techniques and significant unobservable inputs
The following tables show the valuation techniques used in measuring Level 2 fair values.
Financial instruments measured at fair value
Type Valuation techniqueSignificant
unobserved input
Inter-relationship between key unobserved inputs and fair value
measurements
Group and Company
Interest rate swaps used for hedging
Market comparison technique: The fair valuesare based on bank quotes.
Not applicable Not applicable

ANNUAL REPORT 2016
147NOTES TO THE FINANCIAL STATEMENTSYear ended 31 December 2016
32 SUBSEQUENT EVENT
On 28 March 2017, the Group made the following announcements:
(i) The Group entered into various sales and purchase agreements to acquire:
(a) 5,000 ordinary shares of US$1.00 each representing 50% equity interest in Strategic Offshore Limited (“SOL”), a company incorporated in Malta, at a cash consideration S$3.5 million (equivalent to approximately US$2.5 million). Prior to the acquisition, the Group owns 50% of equity interest in SOL; and
(b) 25,000 ordinary shares of US$1.00 each representing 50% equity interest in Strategic Excellence Limited (“SEL”), a company incorporated in Bahamas, at a cash consideration of S$1.5 million (equivalent to approximately US$1.1 million). Prior to the acquisition, the Group owns 50% of equity interest in SEL.
(ii) The Group established three wholly-owned subsidiaries in Labuan, Malaysia, namely Teras Atlas Limited (“TAL”), Teras Fortuna Limited (“TFL”), and Teras Orizont Limited (“TOL”), with total and paid-up capital of US2 each. The principal activities TAL, TFL and TOL are rig owning and provision of rig services.
(iii) The Group, through its indirect wholly-owned subsidiaries, TAL, TFL and TOL entered into various sales and purchase agreements to acquire certain assets from the subsidiaries of SOL, namely GSP Atlas Limited (“GAL”), Strategic Fortuna Limited (“SFL”) and GSP Orizont Limited (“GOL”) respectively, at an aggregate cash consideration of US$61.9 million.
On 31 March 2017, the Group entered into a Heads of Agreement with a joint venture partner to divest 50% of the above purchases at an aggregate consideration of US$70.0 million.
As a result of the combined transactions above, the Group expects no material impact to the financial position and income statement of the Group.

EZION HOLDINGS LIMITED
148 SHAREHOLDERS’ INFORMATIONAs at 17 March 2017
GENERAL INFORMATION ON SHARE CAPITAL
Total no. of issued shares : 2,073,843,405 (excluding treasury shares)Class of shares : Ordinary shareVoting rights : One vote per share (no vote for treasury shares)Number of treasury shares : 3,184,000 Percentage of treasury shares : 0.15% based on total number of issued shares (excluding treasury shares)Number of subsidiary holdings held : Nil
DISTRIBUTION OF SHAREHOLDINGS
Range of ShareholdingsNo. of
Shareholders % No. of Shares %
1 – 99 81 0.50 3,160 0.00
100 – 1,000 467 2.90 301,919 0.02
1,001 - 10,000 5,593 34.68 33,735,734 1.62
10,001 - 1,000,000 9,920 61.50 537,982,894 25.90
1,000,001 and above 68 0.42 1,505,003,698 72.46
16,129 100.00 2,077,027,405 100.00
TOP 20 SHAREHOLDERS
No. Name of Shareholder No. of Shares %**
1 Citibank Nominees Singapore Pte Ltd 331,749,861 16.00
2 DBS Nominees Pte Ltd 312,280,924 15.06
3 HSBC (Singapore) Nominees Pte Ltd 174,798,448 8.43
4 Raffles Nominees (Pte) Ltd 140,611,545 6.78
5 United Overseas Bank Nominees Pte Ltd 72,180,101 3.48
6 CIMB Securities (S) Pte Ltd 60,752,760 2.93
7 DBSN Services Pte Ltd 39,886,170 1.92
8 Maybank Kim Eng Securities (S) Pte Ltd 30,373,819 1.46
9 OCBC Securities Private Ltd 25,778,473 1.24
10 BNP Paribas Nominees Singapore Pte Ltd 25,557,300 1.23
11 Chew Thiam Keng 25,309,440 1.22
12 Evia Growth Opportunities II Ltd 25,244,826 1.22
13 Rotating Offshore Solutions Pte Ltd 22,747,156 1.10
14 UOB Kay Hian Pte Ltd 20,767,038 1.00
15 EDB Investments Pte Ltd 20,548,253 0.99
16 DB Nominees (S) Pte Ltd 20,028,254 0.97
17 Phillip Securities Pte Ltd 13,523,578 0.65
18 Venstar Investments Ltd 11,416,570 0.55
19 OCBC Nominees Singapore Pte Ltd 10,242,125 0.49
20 DBS Vickers Securities (S) Pte Ltd 9,877,600 0.48
1,393,674,241 67.20
** The percentage of issued ordinary shares is calculated based on the number of issued ordinary shares of the company as at 17 March 2017, excluding 3,184,000 ordinary shares held as treasury shares as at that date.

ANNUAL REPORT 2016
149SHAREHOLDERS’ INFORMATION As at 17 March 2017
SUBSTANTIAL SHAREHOLDERSAs per Register of Substantial Shareholders:
Direct Interest Deemed Interest
No. of Shares % No. of Shares %
Chan Fooi Peng(1) 37,724,000 1.82(7) 239,859,440 11.57(7)
Chew Thiam Keng(2) 27,259,440 1.31(7) 250,324,000 12.07(7)
Macarios Pte Ltd 152,600,000 7.36(7) – –
M&G Investment Management Limited(3) – – 98,217,700 6.16
M&G Limited(4) – – 98,217,700 6.16
M&G Group Limited(5) – – 98,217,700 6.16
Prudential Plc(6) – – 98,217,700 6.16
Notes:
(1) By virtue of shares held directly by Madam Chan Fooi Peng’s spouse, Mr Chew Thiam Keng, she is deemed to be interested in the shares held by Mr Chew Thiam Keng; and deemed interested in 60,000,000 shares held by White Ruby Worldwide Inc and 152,600,000 shares held by Macarios Pte Ltd.
(2) By virtue of shares held directly by Mr Chew Thiam Keng’s spouse, Madam Chan Fooi Peng, he is deemed to be interested in the shares held by Madam Chan Fooi Peng. 1,950,000 of the shares under Mr Chew Thiam Keng’s direct interest are registered under Citibank Nominees SG.
(3) M&G Investment Management Limited (“M&G Investment”) has deemed interest in the shares as it has discretionary power in the disposal rights over the shares as fund manager. The percentage shown, to the nearest 2 decimal places, was based on the form 3 received from M&G Investment as at 5 August 2016.
(4) M&G Investment is a wholly-owned subsidiary of M&G Limited. M&G Limited is deemed to have interest in the shares held by M&G Investment by virtue of the provisions of Section 7 of the Companies Act, Cap. 50. The percentage shown, to the nearest 2 decimal places, was based on the form 3 received from M&G Limited as at 5 August 2016.
(5) M&G Investment is a wholly-owned subsidiary of M&G Limited, which is in turn a wholly-owned subsidiary of M&G Group Limited. M&G Group Limited is deemed to have interest in the shares held by M&G Investment by virtue of the provisions of Section 7 of the Companies Act, Cap. 50. The percentage shown, to the nearest 2 decimal places, was based on the form 3 received from M&G Group Limited as at 5 August 2016.
(6) M&G Investment is a wholly-owned subsidiary of M&G Limited, which is in turn a wholly-owned subsidiary of M&G Group Limited. M&G Group Limited is ultimately owned by Prudential Plc. Prudential Plc is deemed to have interest in the shares held by M&G Investment by virtue of the provisions of Section 7 of the Companies Act, Cap. 50. The percentage shown, to the nearest 2 decimal places, was based on the form 3 received from Prudential Plc as at 5 August 2016.
(7) The percentage of shareholdings is computed based on the issued and paid-up share capital of the Company comprising 2,073,843,405 Shares (excluding Treasury Shares) as at 17 March 2017.
PERCENTAGE OF SHAREHOLDING HELD IN PUBLIC’S HANDS
Based on information made available to the Company as at 17 March 2017, approximately 80.16% of the Company’s shares (excluding treasury shares) was held in the hands of the public, and accordingly, Rule 723 of the SGX-ST Listing Manual is complied with.

EZION HOLDINGS LIMITED
150
No. of Warrants Outstanding : 355,087,144
DISTRIBUTION OF WARRANT HOLDINGS
Range of Warrant holdingsNo. of Warrant
holders % No. of Warrants %
1 - 99 459 3.71 21,183 0.00
100 - 1,000 2,371 19.15 1,267,528 0.36
1,001 - 10,000 7,881 63.66 26,140,371 7.36
10,001 - 1,000,000 1,640 13.25 78,891,694 22.22
1,000,001 and above 29 0.23 248,766,368 70.06
12,380 100.00 355,087,144 100.00
TOP 20 WARRANT HOLDERS
No. Name of Warrant holder No. of Warrants %
1 Citibank Nominees Singapore Pte Ltd 74,606,060 21.01
2 Chan Fooi Peng 32,161,248 9.06
3 DBS Nominees Pte Ltd 23,807,936 6.70
4 Raffles Nominees (Pte) Ltd 17,837,232 5.02
5 HSBC (Singapore) Nominees Pte Ltd 16,481,095 4.64
6 CIMB Securities (S) Pte Ltd 9,646,863 2.72
7 DBSN Services Pte Ltd 9,098,281 2.56
8 Maybank Kim Eng Securities (S) Pte Ltd 6,779,162 1.91
9 Evia Growth Opportunities II Ltd 5,619,498 1.58
10 Thio Sin Kiat 5,421,873 1.53
11 EDB Investments Pte Ltd 4,574,040 1.29
12 Chew Thiam Keng 4,333,754 1.22
13 Phillip Securities Pte Ltd 4,288,944 1.21
14 Rotating Offshore Solutions Pte Ltd 3,895,012 1.10
15 OCBC Securities Private Ltd 3,017,412 0.85
16 United Overseas Bank Nominees Pte Ltd 2,928,487 0.82
17 UOB Kay Hian Pte Ltd 2,774,376 0.78
18 DBS Vickers Securities (S) Pte Ltd 2,535,352 0.71
19 Lim Cher Khiang 2,227,737 0.63
20 Kim Chong Wah 2,000,000 0.56
234,034,362 65.90
STATISTICS OF WARRANT HOLDINGSAs at 17 March 2017

ANNUAL REPORT 2016
151
NOTICE IS HEREBY GIVEN that the Annual General Meeting of Ezion Holdings Limited (the “Company”) will be held at Ballroom 3, The Singapore Island Country Club, 180 Island Club Road, Singapore 578774 on Thursday, 27 April 2017 at 10.00 a.m. for the following purposes:
AS ORDINARY BUSINESS
1. To receive and adopt the Directors’ Statement and the Audited Financial Statements of the Company for the year ended 31 December 2016 together with the Independent Auditors’ Report thereon. (Resolution 1)
2. To re-elect Mr Chew Thiam Keng, a Director of the Company retiring pursuant to Article 107 of the Constitution of
the Company. (See Explanatory Note (i)) (Resolution 2)
3. To re-elect Mr Lim Thean Ee, a Director of the Company retiring pursuant to Article 107 of the Constitution of the Company. (See Explanatory Note (ii)) (Resolution 3)
4. To approve the payment of Directors’ fees of S$223,000.00 for the year ended 31 December 2016. (FY2015: S$223,000.00) (Resolution 4)
5. To re-appoint KPMG LLP as the Auditor of the Company and to authorise the Directors of the Company to fix their remuneration. (Resolution 5)
6. To transact any other ordinary business which may properly be transacted at an Annual General Meeting.
AS SPECIAL BUSINESS
To consider and if thought fit, to pass the following resolutions as Ordinary Resolutions, with or without any modifications: 7. Authority to issue shares in the capital of the Company
That pursuant to Section 161 of the Companies Act, Cap. 50 (the “Companies Act”) and Rule 806 of the Listing Manual of the Singapore Exchange Securities Trading Limited (“SGX-ST”), the Directors of the Company be hereby authorised and empowered to:
(a) (i) issue shares in the Company (“shares”) whether by way of rights, bonus or otherwise; and/or
(ii) make or grant offers, agreements or options (collectively, “Instruments”) that might or would require shares to be issued, including but not limited to the creation and issue of (as well as adjustments to) options, warrants, debentures or other instruments convertible into shares,
at any time and upon such terms and conditions and for such purposes and to such persons as the Directors of the Company may in their absolute discretion deem fit; and
(b) (notwithstanding the authority conferred by this Resolution may have ceased to be in force) issue shares in pursuance of any Instruments made or granted by the Directors of the Company while this Resolution was in force,
NOTICE OF ANNUAL GENERAL MEETING
EZION HOLDINGS LIMITED
152
provided that:
(1) the aggregate number of shares to be issued pursuant to this Resolution (including shares to be issued in pursuance of the Instruments, made or granted pursuant to this Resolution) shall not exceed fifty per centum (50%) of the total number of issued shares (excluding treasury shares and subsidiary holdings) in the capital of the Company (as calculated in accordance with sub-paragraph (2) below), of which the aggregate number of shares to be issued other than on a pro rata basis to existing shareholders of the Company shall not exceed twenty per centum (20%) of the total number of issued shares (excluding treasury shares and subsidiary holdings) in the capital of the Company (as calculated in accordance with sub-paragraph (2) below);
(2) (subject to such calculation as may be prescribed by the SGX-ST) for the purpose of determining the aggregate number of shares that may be issued under sub-paragraph (1) above, the total number of issued shares (excluding treasury shares and subsidiary holdings) shall be based on the total number of issued shares (excluding treasury shares and subsidiary holdings) in the capital of the Company at the time of the passing of this Resolution, after adjusting for:
(a) new shares arising from the conversion or exercise of any convertible securities;
(b) new shares arising from exercising share options or vesting of share awards which are outstanding or subsisting at the time of the passing of this Resolution, provided the options or awards were granted in compliance with Part VIII of Chapter 8 of the Listing Manual; and
(c) any subsequent bonus issue, consolidation or subdivision of shares;
(3) in exercising the authority conferred by this Resolution, the Company shall comply with the provisions of the Listing Manual of the SGX-ST for the time being in force (unless such compliance has been waived by the SGX-ST) and the Constitution of the Company; and
(4) unless revoked or varied by the Company in a general meeting, such authority shall continue in force until the conclusion of the next Annual General Meeting of the Company or the date by which the next Annual General Meeting of the Company is required by law to be held, whichever is earlier.
(See Explanatory Note (iii)) (Resolution 6) 8. Authority to issue shares under the Ezion Employee Share Plan
That the Directors of the Company be hereby authorised to offer and grant awards (“Awards”) in accordance with the provisions of the Ezion Employee Share Plan (the “Plan”) and to allot and issue or deliver from time to time such number of fully-paid shares as may be required to be issued or delivered pursuant to the vesting of the Awards under the Plan, provided that:
(i) the aggregate number of shares to be issued pursuant to the Plan shall not exceed three point-five per centum (3.5%) of the total issued share capital of the Company as at 31 March 2008; and
NOTICE OF ANNUAL GENERAL MEETING
ANNUAL REPORT 2016
153
(ii) the aggregate number of shares to be issued pursuant to the Plan, when added to the number of shares issued and issuable in respect of such Awards and other shares issued and/or issuable under other share-based incentive schemes of the Company, shall not exceed fifteen per centum (15%) of the total number of the issued shares (excluding treasury shares and subsidiary holdings) in the capital of the Company from time to time and that such authority shall, unless revoked or varied by the Company in a general meeting, continue in force until the conclusion of the next Annual General Meeting of the Company or the date by which the next Annual General Meeting of the Company is required by law to be held, whichever is earlier.
(See Explanatory Note (iv)) (Resolution 7)
9. Authority to issue shares under the Ezion Employee Share Option Scheme
That the Directors of the Company be hereby authorised and empowered to offer and grant options in accordance with the rules of the Ezion Employee Share Option Scheme (the “Scheme”) and to issue from time to time such number of shares in the capital of the Company as may be required to be issued pursuant to the exercise of options granted by the Company under the Scheme, whether granted during the subsistence of this authority or otherwise, provided always that the aggregate number of additional ordinary shares to be issued pursuant to the Scheme, when added to the number of shares issued and issuable in respect of such Scheme and other shares issued and/or issuable under other share-based incentive schemes of the Company, shall not exceed fifteen per centum (15%) of the total number of issued shares (excluding treasury shares and subsidiary holdings) in the capital of the Company from time to time and that such authority shall, unless revoked or varied by the Company in a general meeting, continue in force until the conclusion of the next Annual General Meeting of the Company or the date by which the next Annual General Meeting of the Company is required by law to be held, whichever is earlier.
(See Explanatory Note (v)) (Resolution 8)
10. Renewal of Share Buyback Mandate
That:
(a) for the purposes of Sections 76C and 76E of the Companies Act, and such other laws and regulations as may for the time being be applicable, approval be and is hereby given for the exercise by the Directors of the Company of all the powers of the Company to purchase or otherwise acquire issued ordinary shares in the share capital of the Company (“Shares”) not exceeding in aggregate the Prescribed Limit (as hereafter defined), at such price(s) as may be determined by the Directors from time to time up to the Maximum Price (as hereafter defined), whether by way of:
(i) on-market share purchases (“Market Purchase”), transacted on the SGX-ST; and/or
(ii) off-market share purchases (“Off-Market Purchase”) (if effected otherwise than on the SGX-ST) in accordance with an equal access scheme(s) as may be determined or formulated by the Directors as they may consider fit, which scheme(s) shall satisfy all the conditions prescribed by the Companies Act, and otherwise in accordance with all other laws, regulations and rules of the SGX-ST as may for the time being be applicable (the “Share BuyBack Mandate”);
(b) any Share that is purchased or otherwise acquired by the Company pursuant to the Share BuyBack Mandate shall, at the discretion of the Directors, either be cancelled or held in treasury and dealt with in accordance with the Companies Act;
NOTICE OF ANNUAL GENERAL MEETING
EZION HOLDINGS LIMITED
154
(c) unless varied or revoked by the Company in general meeting, the authority conferred on the Directors pursuant to the Share BuyBack Mandate may be exercised by the Directors at any time and from time to time during the period commencing from the passing of this Ordinary Resolution and the expiring on the earlier of:
(i) the date on which the next Annual General Meeting of the Company is held or required by law to be held;
(ii) the date on which the Share BuyBacks are carried out to the full extent mandated; or
(iii) the date on which the authority contained in the Share BuyBack Mandate is varied or revoked;
(d) in this Resolution:
“Prescribed Limit” means ten per centum (10%) of the total issued ordinary share capital of the Company as at the date of passing of this Ordinary Resolution, unless the Company has effected a reduction of the share capital of the Company in accordance with the applicable provisions of the Companies Act, at any time during the Relevant Period, in which event the total issued ordinary share capital of the Company shall be taken to be the amount of the issued ordinary share capital of the Company as altered (excluding any treasury shares and subsidiary holdings);
“Relevant Period” means the period commencing from the date on which the last Annual General Meeting of the Company was held and expiring on the date of the next Annual General Meeting of the Company is held or is required by law to be held, whichever is the earlier, after the date of this Ordinary Resolution;
“Maximum Price” in relation to a Share to be purchased, means an amount (excluding brokerage, stamp duties, applicable goods and services tax and other related expenses) not exceeding:
(i) in the case of a Market Purchase, 105% of the Average Closing Price;
(ii) in the case of an Off-Market Purchase, 120% of the Highest Last Dealt Price, where:
“Average Closing Price” means the average of the closing market prices of a Share over the last five (5) Market Days, on which transactions in the Shares were recorded, immediately preceding the date of making the Market Purchase or, as the case may be, the day of the making of an offer pursuant to the Off-Market Purchase, and deemed to be adjusted for any corporate action that occurs after the relevant five (5) Market Days;
“Day of the making of the offer” means the day on which the Company announces its intention to make an offer for the purchase of Shares from the shareholders of the Company, stating the purchase price (which shall not be more than the Maximum Price calculated on the foregoing basis) for each Share and the relevant terms of the equal access scheme for effecting the Off-Market Purchase;
“Highest Last Dealt Price” means the highest price transacted for a Share as recorded on the Market Day on which there were trades in the Shares immediately preceding the day of the making of the offer pursuant to the Off-Market Purchase; and
NOTICE OF ANNUAL GENERAL MEETING

ANNUAL REPORT 2016
155
“Market Day” means a day on which the SGX-ST is open for trading in securities; and
(e) the Directors of the Company and/or any of them be and are hereby authorised to complete and do all such acts and things (including, without limitation, executing such documents as may be required) as they may consider desirable, expedient or necessary to give effect to the transactions contemplated by this Resolution.
(See Explanatory Note (vi)) (Resolution 9)
By Order of the Board
Lee Tiong HockSecretarySingapore, 12 April 2017
Explanatory Notes:
(i) Mr Chew Thiam Keng will, upon re-election as a Director of the Company, continue to serve as Chief Executive Officer of the Company. Detailed information on Mr Chew can be found under the sections entitled ‘Board of Directors’ and ‘Corporate Governance Report’ in the Annual Report.
(ii) Mr Lim Thean Ee, upon re-election as a Director of the Company, remain as Chairman of the Remuneration Committee, member of the Audit Committee and the Nominating Committee and will be considered independent. Detailed information on Mr Lim can be found under the sections entitled ‘Board of Directors’ and ‘Corporate Governance Report’ in the Annual Report.
(iii) Resolution 6, if passed, will empower the Directors of the Company, effective until the conclusion of the next Annual General Meeting of the Company, or the date by which the next Annual General Meeting of the Company is required by law to be held or such authority is varied or revoked by the Company in a general meeting, whichever is the earlier, to issue shares, make or grant Instruments convertible into shares and to issue shares pursuant to such Instruments, up to a number not exceeding, in total, 50% of the total number of issued shares (excluding treasury shares and subsidiary holdings) in the capital of the Company, of which up to 20% may be issued other than on a pro-rata basis to shareholders.
For determining the aggregate number of shares that may be issued, the total number of issued shares (excluding treasury shares and subsidiary holdings) will be calculated based on the total number of issued shares (excluding treasury shares and subsidiary holdings) in the capital of the Company at the time this Ordinary Resolution is passed after adjusting for new shares arising from the conversion or exercise of any convertible securities or share options or vesting of share awards which are outstanding or subsisting at the time when this Ordinary Resolution is passed and any subsequent bonus issue, consolidation or subdivision of shares.
(iv) Resolution 7 is to authorise the Directors to offer and grant Awards under the Plan and to allot and issue shares pursuant to the vesting of Awards under the Plan, provided that the number of shares issued and issuable in respect of such Awards:
(a) shall not exceed three point-five per centum (3.5%) of the total issued share capital of the Company as at 31 March 2008; and
(b) the aggregate number of shares to be issued pursuant to the Plan, when added to the number of shares issued and issuable in respect of such Awards and other shares issued and/or issuable under other share-based incentive schemes of the Company, shall not exceed fifteen per centum (15%) of the issued shares of the Company from time to time.
Based on the issued share capital of the Company as at 31 March 2008, the total number of shares, which may be issued or issuable in respect of such Awards, is 22,539,230 shares.
NOTICE OF ANNUAL GENERAL MEETING

EZION HOLDINGS LIMITED
156
(v) Resolution 8, if passed, will empower the Directors of the Company, effective until the conclusion of the next Annual General Meeting of the Company, or the date by which the next Annual General Meeting of the Company is required by law to be held or such authority is varied or revoked by the Company in a general meeting, whichever is the earlier, to issue shares in the Company pursuant to the exercise of options granted or to be granted under the Scheme up to a number not exceeding in aggregate, when added to the number of shares issued and issuable in respect of such Awards and other shares issued and/or issuable under other share-based incentive schemes of the Company, fifteen per centum (15%) of the total number of issued shares (excluding treasury shares and subsidiary holdings) in the capital of the Company from time to time.
(vi) Resolution 9 is to renew the mandate to permit the Company to purchase or acquire issued ordinary shares in the capital of the Company on the terms and subject to the conditions of the Resolution. The actual amount of funding required for the Company to purchase or acquire its ordinary shares, and the impact on the Company’s financial position, cannot be ascertained as at the date of this Notice as these will depend on the number of ordinary shares purchased or acquired and the price at which such ordinary shares were purchased or acquired.
The illustrative financial effects of the purchase or acquisition of such ordinary shares by the Company pursuant to the proposed Share Buyback Mandate on the audited financial statements of the Group and the Company for the financial year ended 31 December 2016 are set out in greater detail in the Appendix, which is enclosed together with this Notice.
Notes:
1. Each of the resolutions to be put to the vote of members at the Annual General Meeting (the “Meeting”) (and at any adjournment thereof) will be voted on by way of a poll.
2. (a) A member who is not a relevant intermediary, is entitled to appoint one or two proxies to attend and vote at the Meeting.
(b) A member who is a relevant intermediary, is entitled to appoint more than two proxies to attend and vote at the Meeting, but each proxy must be appointed to exercise the rights attached to a different Share or Shares held by such member.
“Relevant intermediary” has the meaning ascribed to it in Section 181 of the Companies Act.
3. A proxy need not be a member of the Company.
4. The form of proxy in the case of an individual shall be signed by the appointor or his attorney, and in the case of a corporation, either under its common seal or under the hand of an officer or attorney duly authorised.
5. If the form of proxy is returned without any indication as to how the proxy shall vote, the proxy will vote or abstain as he thinks fit.
6. If no name is inserted in the space for the name of your proxy on the form of proxy, the Chairman of the Meeting will act as your proxy.
7. The form of proxy or other instruments of appointment shall not be treated as valid unless deposited at the Registered Office of the Company at 15 Hoe Chiang Road, #12-05 Tower Fifteen, Singapore 089316 not less than forty-eight (48) hours before the time appointed for holding the Meeting and at any adjournment thereof.
8. A Depositor’s name must appear on the Depository Register maintained by The Central Depository (Pte) Limited at least seventy-two (72) hours before the time fixed for holding the Meeting in order for the Depositor to be entitled to attend and vote at the Meeting.
PERSONAL DATA PRIVACY:
By submitting an instrument appointing a proxy(ies) and/or representative(s) to attend, speak and vote at the Meeting and/or any adjournment thereof, a member of the Company (i) consents to the collection, use and disclosure of the member’s personal data by the Company (or its agents) for the purpose of the processing and administration by the Company (or its agents) of proxies and representatives appointed for the Meeting (including any adjournment thereof) and the preparation and compilation of the attendance lists, minutes and other documents relating to the Meeting (including any adjournment thereof), and in order for the Company (or its agents) to comply with any applicable laws, listing rules, regulations and/or guidelines (collectively, the “Purposes”), (ii) warrants that where the member discloses the personal data of the member’s proxy(ies) and/or representative(s) to the Company (or its agents), the member has obtained the prior consent of such proxy(ies) and/or representative(s) for the collection, use and disclosure by the Company (or its agents) of the personal data of such proxy(ies) and/or representative(s) for the Purposes, and (iii) agrees that the member will indemnify the Company in respect of any penalties, liabilities, claims, demands, losses and damages as a result of the member’s breach of warranty.
NOTICE OF ANNUAL GENERAL MEETING

This page has been intentionally left blank

This page has been intentionally left blank
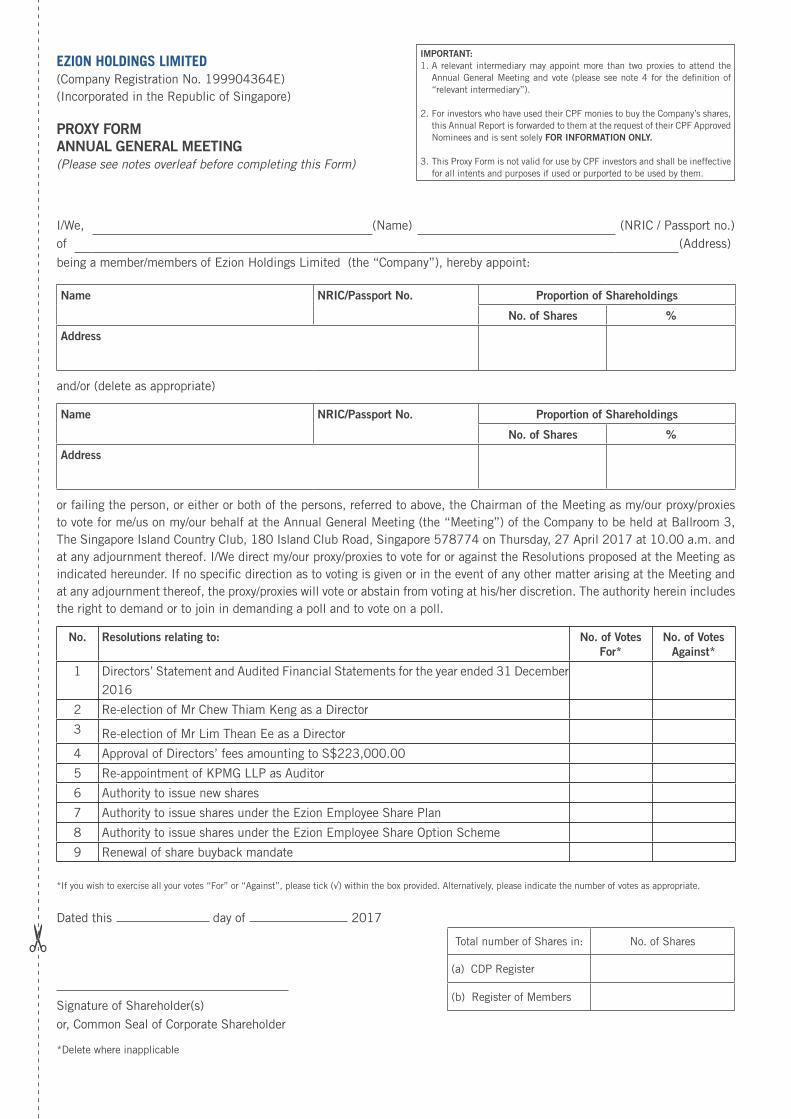
EZION HOLDINGS LIMITED(Company Registration No. 199904364E) (Incorporated in the Republic of Singapore)
PROXY FORMANNUAL GENERAL MEETING(Please see notes overleaf before completing this Form)
I/We, (Name) (NRIC / Passport no.)of (Address)
being a member/members of Ezion Holdings Limited (the “Company”), hereby appoint:
Name NRIC/Passport No. Proportion of Shareholdings
No. of Shares %
Address
and/or (delete as appropriate)
Name NRIC/Passport No. Proportion of Shareholdings
No. of Shares %
Address
or failing the person, or either or both of the persons, referred to above, the Chairman of the Meeting as my/our proxy/proxies to vote for me/us on my/our behalf at the Annual General Meeting (the “Meeting”) of the Company to be held at Ballroom 3, The Singapore Island Country Club, 180 Island Club Road, Singapore 578774 on Thursday, 27 April 2017 at 10.00 a.m. and at any adjournment thereof. I/We direct my/our proxy/proxies to vote for or against the Resolutions proposed at the Meeting as indicated hereunder. If no specific direction as to voting is given or in the event of any other matter arising at the Meeting and at any adjournment thereof, the proxy/proxies will vote or abstain from voting at his/her discretion. The authority herein includes the right to demand or to join in demanding a poll and to vote on a poll.
No. Resolutions relating to: No. of Votes For*
No. of Votes Against*
1 Directors’ Statement and Audited Financial Statements for the year ended 31 December 2016
2 Re-election of Mr Chew Thiam Keng as a Director
3 Re-election of Mr Lim Thean Ee as a Director
4 Approval of Directors’ fees amounting to S$223,000.00
5 Re-appointment of KPMG LLP as Auditor
6 Authority to issue new shares
7 Authority to issue shares under the Ezion Employee Share Plan
8 Authority to issue shares under the Ezion Employee Share Option Scheme
9 Renewal of share buyback mandate
*If you wish to exercise all your votes “For” or “Against”, please tick (√) within the box provided. Alternatively, please indicate the number of votes as appropriate.
Dated this day of 2017
Signature of Shareholder(s)or, Common Seal of Corporate Shareholder
*Delete where inapplicable
Total number of Shares in: No. of Shares
(a) CDP Register
(b) Register of Members
IMPORTANT:1. A relevant intermediary may appoint more than two proxies to attend the
Annual General Meeting and vote (please see note 4 for the definition of “relevant intermediary”).
2. For investors who have used their CPF monies to buy the Company’s shares, this Annual Report is forwarded to them at the request of their CPF Approved Nominees and is sent solely FOR INFORMATION ONLY.
3. This Proxy Form is not valid for use by CPF investors and shall be ineffective for all intents and purposes if used or purported to be used by them.

Notes :
1. Please insert the total number of Shares held by you. If you have Shares entered against your name in the Depository Register (as defined in Section 81SF of the Securities and Futures Act, Chapter 289), you should insert that number of Shares. If you have Shares registered in your name in the Register of Members, you should insert that number of Shares. If you have Shares entered against your name in the Depository Register and Shares registered in your name in the Register of Members, you should insert the aggregate number of Shares entered against your name in the Depository Register and registered in your name in the Register of Members. If no number is inserted, the instrument appointing a proxy or proxies shall be deemed to relate to all the Shares held by you.
2. A member of the Company entitled to attend and vote at a meeting of the Company is entitled to appoint one or two proxies to attend and vote in his/her stead. A proxy need not be a member of the Company.
3. Where a member appoints two proxies, the appointments shall be invalid unless he/she specifies the proportion of his/her shareholding (expressed as a percentage of the whole) to be represented by each proxy.
4. A member who is a relevant intermediary is entitled to appoint more than two proxies to attend and vote instead of the member, but each proxy must be appointed to exercise the rights attached to a different Share or Shares held by such member. Where such member appoints more than two proxies, the appointments shall be invalid unless the member specifies the number of Shares in relation to which each proxy has been appointed.
“Relevant intermediary” means:
(a) a banking corporation licensed under the Banking Act (Cap. 19) or a wholly-owned subsidiary of such a banking corporation, whose business includes the provision of nominee services and who holds shares in that capacity;
(b) a person holding a capital markets services licence to provide custodial services for securities under the Securities and Futures Act (Cap. 289) and who holds shares in that capacity; or
(c) the Central Provident Fund Board established by the Central Provident Fund Act (Cap. 36), in respect of shares purchased under the subsidiary legislation made under that Act providing for the making of investments from the contributions and interest standing to the credit of members of the Central Provident Fund, if the Board holds those shares in the capacity of an intermediary pursuant to or in accordance with that subsidiary legislation.
The Company SecretaryEzion Holdings Limited
15 Hoe Chiang Road Tower Fifteen #12-05,Singapore 089316
5. Completion and return of this instrument appointing a proxy shall not preclude a member from attending and voting at the Meeting. Any appointment of a proxy or proxies shall be deemed to be revoked if a member attends the meeting in person, and in such event, the Company reserves the right to refuse to admit any person or persons appointed under the instrument of proxy to the Meeting.
6. The instrument appointing a proxy or proxies must be deposited at the registered office of the Company at 15 Hoe Chiang Road, #12-05 Tower Fifteen Singapore 089316 not less than forty-eight (48) hours before the time appointed for the Meeting.
7. The instrument appointing a proxy or proxies must be under the hand of the appointor or of his attorney duly authorised in writing. Where the instrument appointing a proxy or proxies is executed by a corporation, it must be executed either under its seal or under the hand of an officer or attorney duly authorised. Where the instrument appointing a proxy or proxies is executed by an attorney on behalf of the appointor, the letter or power of attorney or a duly certified copy thereof must be lodged with the instrument.
8. A corporation which is a member may authorise by resolution of its directors or other governing body such person as it thinks fit to act as its representative at the Meeting, in accordance with Section 179 of the Companies Act, Chapter 50 of Singapore.
PERSONAL DATA PRIVACY:
By submitting an instrument appointing a proxy(ies) and/or representative(s), the member accepts and agrees to the personal data privacy terms set out in the notice of the Meeting dated 12 April 2017.
General:
The Company shall be entitled to reject the instrument appointing a proxy or proxies if it is incomplete, improperly completed or illegible, or where the true intentions of the appointor are not ascertainable from the instructions of the appointor specified in the instrument appointing a proxy or proxies. In addition, in the case of Shares entered in the Depository Register, the Company may reject any instrument appointing a proxy or proxies lodged if the member, being the appointor, is not shown to have Shares entered against his name in the Depository Register as at seventy-two (72) hours before the time appointed for holding the Meeting, as certified by The Central Depository (Pte) Limited to the Company.
AffixStamp

Designed and Produced by Rockstar Atelier

OVERCOMINGCHALLENGES
ANNUAL REPORT 2016
Co. Reg. No. 199904364E15 Hoe Chiang Road #12-05, Tower Fifteen Singapore 089316
Telephone: +65 6309 0555, Facsimile: +65 6222 7848, Email: [email protected] www.ezionholdings.com