Embed Size (px)
Citation preview

Overcoming Barriers between Hydro-economic Models and Policy Applications
Frank A. Ward, NM State University
ICID MeetingsSaskatoon, Saskatchewan
FAO-Organized SessionHydroeconomic modelling for transboundary river basin management :
Towards more integrated approaches
August 15, 2018

Issues • Allocation of water among competing uses, in transboundary basins, especially
agriculture, urban, and power: ongoing challenge.
• Any water use or source at any location in a basin affects use at different locations and time periods.
• Lots of moving and connected parts: science/policy
• Collaborative management and benefit sharing in TB basins difficult without basin scale analytical frameworks to inform policy design communicated to policymakers and diplomatic community.
• HEM: state of the arts decision support method to incorporate complex energy-water-food systems to track interacting elements
• Great potential to inform water-food-energy policy, esp. climate resilience policy
• Weak track record in doing so to date

• Climate resilience: Folke (2006) and Nelson et al (2007):
capacity for a social-ecological system to:
– absorb stresses and maintain function in the face of external
stresses imposed upon it by climate change
– adapt, reorganize, and evolve into more desirable
configurations that improve the sustainability of the system,
leaving it better prepared for future climate change impacts.
Climate Resilience

Barriers to HEM to informing policy debates
•Hard to track results of policy proposals through complex
systems, even when evidence is available
•Hard to quickly change assumptions or model structure
•Hard to present assumptions/results to ministry staff
•Desire: Policymakers want to know economic/physical impacts
of proposed policies (e.g., reservoir releases for
food/environment) in many time periods into the future.
•Question: What if benefits or costs of various water / energy /
food / environmental services change.

• Present lessons learned to overcome barriers
(bottlenecks) between HEMs and application
to basin policy design, e.g. improve climate
resilience to raise performance of water-food-
energy nexus
• Describe some success stories
Ends (Goals)

Approach
• Informal meta analysis
•Based on personal experience with HEMs since mid
1990s with academic and stakeholder audiences.

Going from complex optimization models to useable interfaces
• Learn today’s big policy debates, and imagine where they are going.
• Find out what measures could be implemented to deal with them.
• Find out constraints that block measures from working.
• Find out what it would take to relax or dissolve those constraints.
• Find out a way to translate a basin’s hydrology, economics, institutions,
infrastructure, and policy choices, and implementation measures into• Indices (year, location, economic sector)
• Data (observed or potential)
• Variables (unknowns)
• Objectives (what do you want to maximize, often DNPV, but not always)
• Constraints (e.g., US-Mexico 1906 treaty deliveries on RGR to Mexico)

Rio Grande HEM (USDA Funding, 2015-20)
Important Project Goal
Better understanding of the Rio Grande system from Elephant Butte to Presidio
How it operatesLet stakeholders experiment with operations Carries implications for how it could operate

Elephant Butte + Caballo Reservoirs
Mesilla Aquifer
Hueco Bolson Aquifer
2 San MarcialGages
Caballo Gage
El Paso Gage
Fort Quitman Gage
Historical Period: 1993-2013
Annual time steps
Verification/Calibration

Buckets

Change in Storage = Inflow - Outflow

Change in Storage = Inflow - Outflow

13
EBID
Project
Storage
Mesilla
Aquifer
LCU
MXID-
009
JMAS
Hueco
BolsonEP#1
Basin Schematic
US
MX
US
MXRio Grande/Bravo
NM
TXEPW
Rio Grande/Bravo
Withdrawals Returns
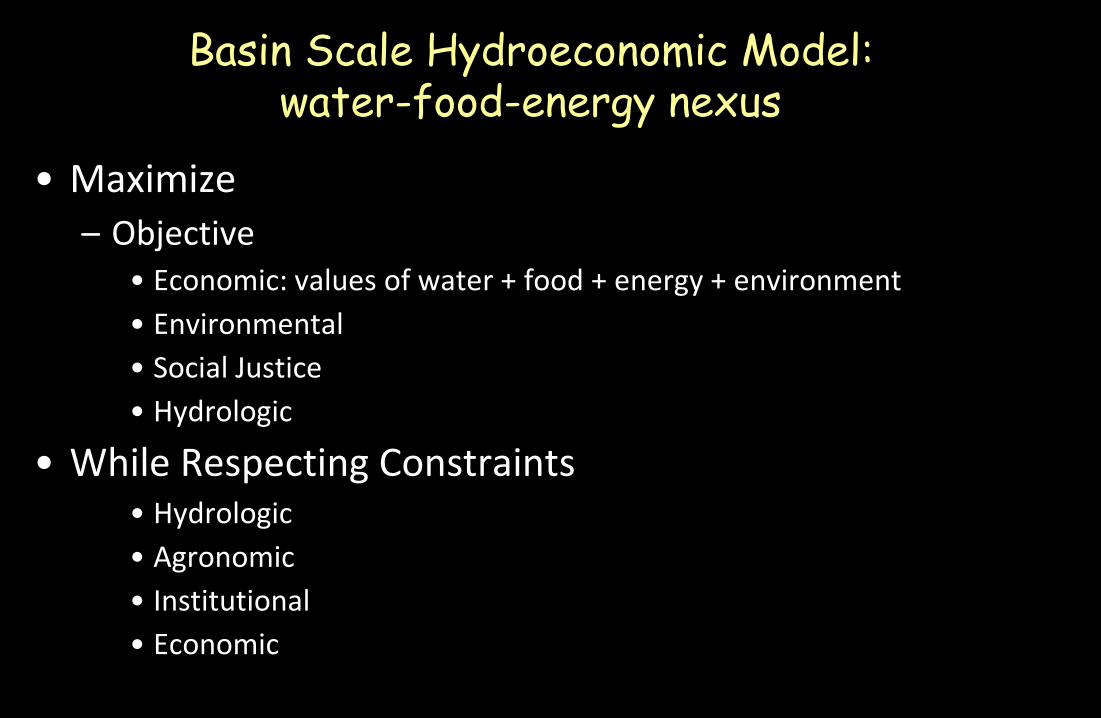
• Maximize– Objective
• Economic: values of water + food + energy + environment
• Environmental
• Social Justice
• Hydrologic
• While Respecting Constraints• Hydrologic
• Agronomic
• Institutional
• Economic
Basin Scale Hydroeconomic Model: water-food-energy nexus

Policy Assessment Framework
Scenario
Baseline Climate/policy
Alternative(i) climate/policy
HEM
Base Optimization of DNPV
Alter(i) Optimization of DNPV
Outcomes
Base water stocksBase water flowsBase farm incomeBase urban valuesBase DNPV
Alt water stocksAlt water flowsAlt farm incomeAlt urban valuesAlt DNPV
Base waterBase infrastructBase agBase urb useBase env flows
Alt waterAlt infrastructAlt agAlt urb useAlt urb flows
Conditions (data)

Model/Policy Connections
• Connections: HEM– Hydrologic: stocks, flows, over time, space
– Agronomic: acreage, water use, crops
– Demographic: urban income, population, demand
– Objective: optimizes total economic benefits from uses
– More Objs: e.g., human right to food, water, energy
– Institutional: rules that limit use or require delivery
• Gain insights into policies that best adapt to climate: resilient stress adaption measures – For basin as a whole or part, e.g. Rio Grande Basin
– For targeted users (farm, city, environment)

17
Sustainable Water Through Integrated Planning (SWIM) Platform
• Model users
– create their own scenarios
– modify data
• climate-water supply, infrastructure, economic data,
demographics, sustainability indicators
– run the model (about 30 seconds)
– get their own custom-made results
• Hydrologic
• Economic
• Social Justice
18
Sustainable Water Through Integrated Planning (SWIM) Platform
https://water.cybershare.utep.edu/
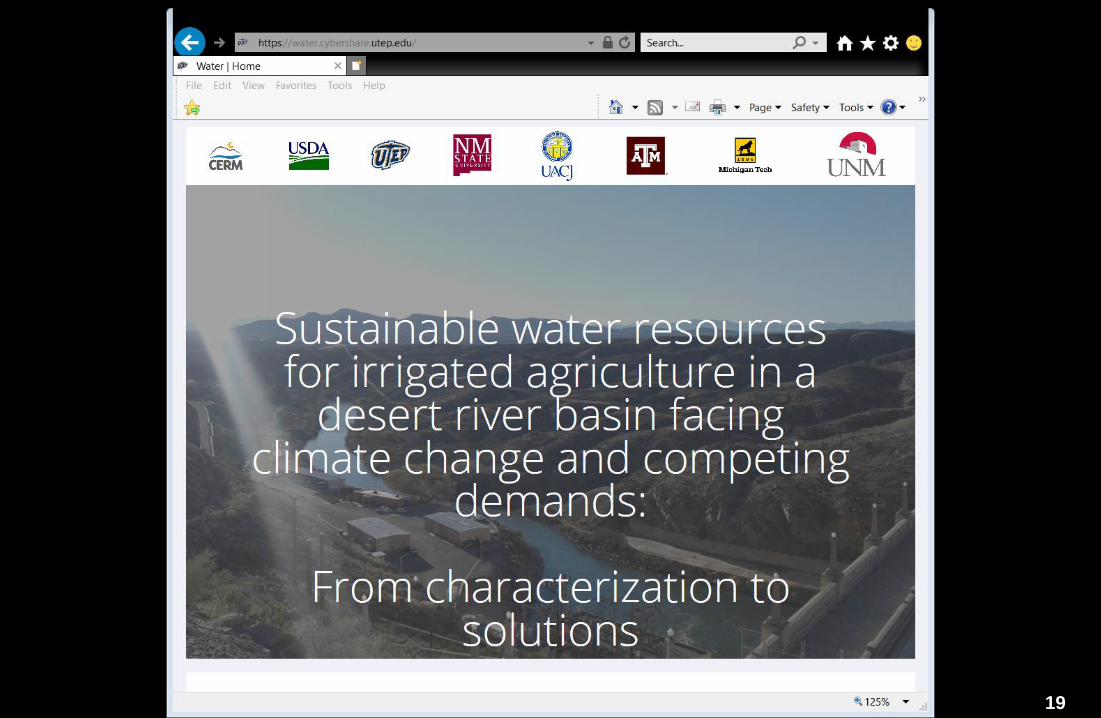
19

SWIM – Bucket Model Interface

21
1: Scenarios: Select Inflows, Population, Policy, Technology
• Observed Inflows at San Marcial Gauges– Uses observed historical inflows from 1994 to 2015. Inflow remains static after 2015,
i.e. 2015 average inflow is repeated up to 2033 (1994-2014).
– Custom percentage of observed annual average flow past the SM.
• Observed Inflows + Extended Drought – Uses observed historical inflows from 1994 to 2013. Appends 20 years of synthetic
drought from 2014-2033.
– Defined as the three year sequence of SM flows at the end of the baseline period (2011-
2013), repeated over and over for the 20 years following 2013.
• Moderate Stress Climate Scenario
• Big Stress Climate Scenario
• After putting all that in, click right hand button: NEXT

2: CustomizeAlter data we coded in model to, suit your beliefs
• Urban: Alter the population levels and growth rates and price elasticity of
demand
– For future, alter demand predictors like household size, lot size, income
• Agriculture: Alter cropped acreages by crop, price, cost, and yield. Watch
out for falling prices or increased costs, or crops will drop out of production.
– For future: account for consumer surplus, since growing crop supply
reduces prices and increases food security worldwide
• Sustainability: alter the ending proportion required levels of
– Reservoir Storage
– Aquifer storage
• After putting all that in, click right hand button: NEXT22

3: Review and Run
• Look at all the data you put in or accepted (check that you didn’t
build a beast)
• After you check and like input data, click right hand button: RUN
SCENARIO
• Model runs in about 30 seconds (300,000 variables to optimize, uses GAMS
software with CONOPT solver)
23

4: Model OutputsShows you what your management achieves
Best to run in pairs (altered v. base)
• Summary
• Urban
• Agriculture
• Storage
• Flows
• Map
24
5: ProvenanceShows data sources
25
• In progress

26
Plans for stakeholder presentations Aug/Sept 2018
• Evaluate time path of recovery of Elephant Butte Reservoir under various
constraints on reservoir releases
• Assess how that recovery path varies with alternative climate scenarios.
• Investigate least cost measures to bring EB to a set level at a set time period
• Show impacts of restrictions on groundwater pumping.
• Show impacts of alternative technologies, especially costs and quantities
available of various kinds of substitute water.

May 2018 stakeholder meeting, UT El Paso, TX, USA
• Growers loved interface but wanted to know more about the back end. Were
there real data and equations inside? Are we trying to hide something?
• Are we getting institutions right (e.g., project operating agreement ‘08)?
• Other Stakeholders: Let’s break it by asking it to do the impossible. Model has
a backstop technology (desal) that always comes to the rescue, no matter how
little water is available in the river and aquifers. But the cost is high.
• Policymakers want to see costs of water protection measures and size of
subsidies needed to reduce that cost and/or protect water users.
• Summer 2018 questions: What if surface inflows in RGR fall to zero next year.
What will be effect with and without subsidies of backstop technologies?
• Risk management: What if urban water supply is knocked out of commission?
How much should invest in backstop in case no inflow next year?
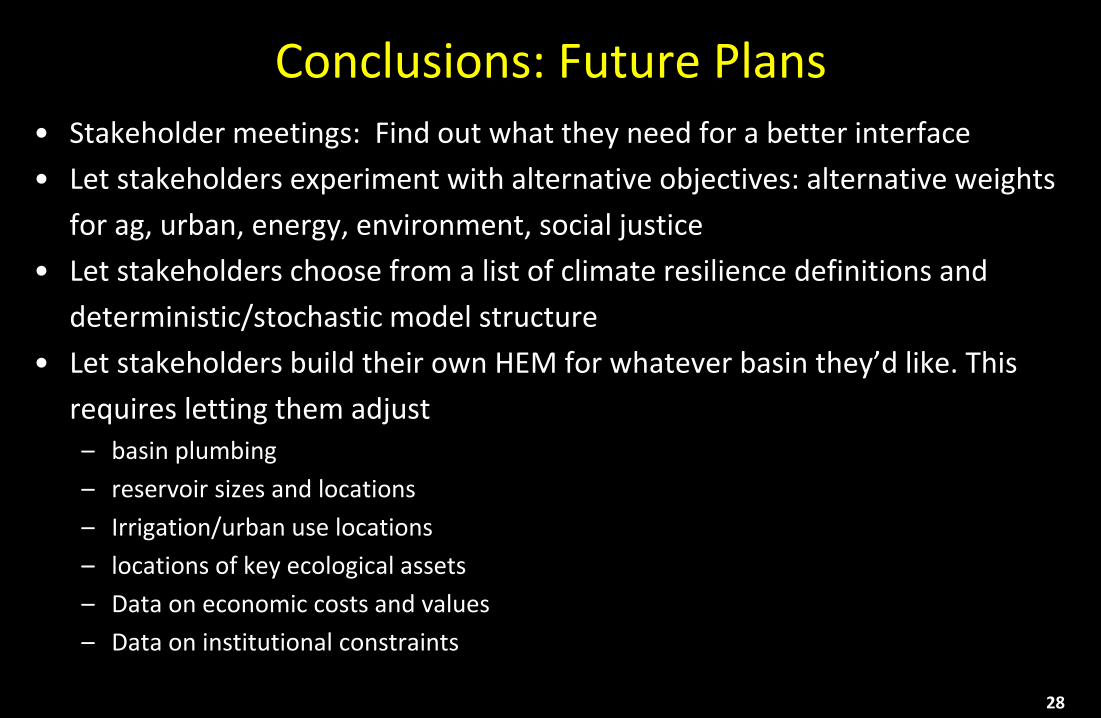
Conclusions: Future Plans• Stakeholder meetings: Find out what they need for a better interface
• Let stakeholders experiment with alternative objectives: alternative weights
for ag, urban, energy, environment, social justice
• Let stakeholders choose from a list of climate resilience definitions and
deterministic/stochastic model structure
• Let stakeholders build their own HEM for whatever basin they’d like. This
requires letting them adjust
– basin plumbing
– reservoir sizes and locations
– Irrigation/urban use locations
– locations of key ecological assets
– Data on economic costs and values
– Data on institutional constraints
28