Embed Size (px)
Citation preview

License and Terms: This document is copyright 2020 the Author(s); licensee Beilstein-Institut.
This is an open access publication under the terms of the Creative Commons Attribution License (https://creativecommons.org/licenses/by/4.0). Please note that the reuse,redistribution and reproduction in particular requires that the author(s) and source are credited.
The license is subject to the Beilstein Archives terms and conditions: https://www.beilstein-archives.org/xiv/terms.The definitive version of this work can be found at: doi: https://doi.org/10.3762/bxiv.2020.10.v1
This open access document is published as a preprint in the Beilstein Archives with doi: 10.3762/bxiv.2020.10.v1 and isconsidered to be an early communication for feedback before peer review. Before citing this document, please check if a final,peer-reviewed version has been published in the Beilstein Journal of Nanotechnology.
This document is not formatted, has not undergone copyediting or typesetting, and may contain errors, unsubstantiated scientificclaims or preliminary data.
Preprint Title Outstanding fuel cell performance of a fully platinum-freeelectrocatalysts using a cost-effective catalyst support material
Authors Priji Chandran and Sundara Ramaprabhu
Publication Date 17 Jan 2020
Article Type Full Research Paper
Supporting Information File 1 Priji-Supplementary Information-Beilstein Journal ofNanotechnology.doc; 1.0 MB
ORCID® iDs Sundara Ramaprabhu - https://orcid.org/0000-0002-7960-9470

1
Outstanding fuel cell performance of a fully platinum-free electrocatalysts using a
cost-effective catalyst support material
Priji Chandran and Sundara Ramaprabhu*
Alternative Energy and Nanotechnology Laboratory (AENL), Nano-Functional Materials and
Technology Centre (NFMTC), Department of Physics, Indian Institute of Technology Madras,
Chennai, Tamil Nadu, 600036, India.
*Email: [email protected]
Abstract
One of the effective way to increase the electrocatalytic activity of carbon based electrocatalyst
in a fuel cell is by in-situ incorporation of heteroatom into the carbon nanostructure. Herein, a
cost effective catalyst support material, nitrogen rich carbon nanostructure (NCNS) with high
surface area and tubular morphology was synthesized. NCNS supported palladium-alloy based
electrocatalyst (Pd3Co/NCNS) was successfully prepared and used on both sides of a fuel cell as
potential alternative to expensive Pt-based electrocatalysts. The large number of nitrogen-carbon
moieties present in NCNS served as anchoring sites for catalyst nanoparticles. Moreover, the
tubular morphology and high surface area plays an important role in enhanced electrochemical
activity of the prepared nanocomposite. The Pd-based bimetallic alloy dispersed on NCNS
exhibited high activity towards both oxidation of hydrogen and reduction of oxygen in acidic
medium. Thus, a fully Pt-free electrocatalyst was constructed using a cost effective
electrocatalyst. The peak power density achieved using Pd3Co/NCNS at both anode and cathode
simultaneously was found to be almost 25 % of the maximum power density attained using
commercial Pt/C on both sides, which is the maximum value reported so far in PEMFC without
using Pt on either sides.
2
Keywords
Nitrogen doped carbon; Heteroatom doping; ORR activity; Non-Pt catalyst; Carbonization.
Introduction
Energy has become the major concern in this century, which must be addressed to secure the
sustainability of technologies needed in daily life. To meet the future energy requirements
without environmental hazards, development and utilization of renewable energy resources is
neccessary. Polymer electrolyte membrane fuel cell (PEMFC) is considered to be the most
promising technology for the rapidly increasing energy demand [1,2]. The main advantages of
PEMFC are fast start up time, low operating temperature, high efficiency and low pollutant
emission [3,4]. For the advancement of fuel cell technology, the development of efficient
electrocatalyst for both anodic and cathodic reaction is of great importance [5].
One of the major challenges for commercialization of fuel cell is the high cost and scarcity of
platinum (Pt), which is the most commonly used catalyst in PEMFC. It can be overcome by
either alloying Pt with transition metal or replacing Pt with other elements which is having good
catalytic activity. Recently, palladium (Pd) based electrocatalysts has emerged as an alternative
to Pt-based system. Pd is more abundant than Pt and have good catalytic activity after Pt.
Moreover, many reports are available showing better electrocatalytic performance of Pd-TM
(TM = Transition metal) alloys in fuel cell application than Pd alone [6–9]. Takenaka et al. [10]
showed that among various Pd-TM ( TM = Fe, Cu, Ni, Co ) alloys, Pd-Co/ CNT showed higher
activity towards ORR reaction. Zhang et al. [5] demonstrated N-doped porous carbon
encapsulated PdCo alloy as highly durable and active electrocatalysts for both oxygen reduction
reaction and ethanol oxidation reaction. Moreover, the electrochemical performance of fuel cell
can be further improved by effective utilization of catalyst nanoparticles by choosing a proper

3
catalyst support material on which the nanoparticles can be homogeneously distributed without
agglomeration. A perfect catalyst support material should have large surface area, good electrical
conductivity and strong interaction between the catalysts [4].
Many ventures have been made to acquire high surface area electrocatalysts to achieve enhanced
fuel cell performance using less catalyst loadings. Moreover, the structure of the catalyst support
material and their interaction with the metal nanoparticles strongly influence the electrocatalytic
performance of a fuel cell. Among various carbon based support materials, graphene and carbon
nanotubes are most studied catalyst support material for fuel cell applications due to its
fascinating properties like large surface area and high electrical conductivity. However, the high
cost of production of these material limits its application in fuel cell. In addition to high
production cost, the synthesis of graphene and carbon nanotubes is a multistep process.
Therefore, it is necessary to have an efficient catalyst support material which is cost effective and
can be produced in a simple way along with high surface area and good electrical conductivity.
In this regard, carbon materials derived from conducting polymers appears to be a promising
candidate as catalyst support material in fuel cell applications due to its facile and cost effective
production compared to graphene and carbon nanotubes. Compared to carbon nanotubes, the
tubular polymer derived carbon nanomaterial can be prepared easily in ambient temperature
without using highly sophisticated methods in large quantity[11]. Moreover, the polymer derived
carbon nanostructures have good electrical conductivity due to the presence of heteroatom
nitrogen and high surface area due to its porous structure. In addition, nitrogen doping effectively
introduce active sites for nanoparticle dispersion and increases the interaction between catalyst
nanoparticles and support material [12]. It has been already proved that pyrolysis of conducting
polymers at high temperature is one of the most simple and efficient way to synthesize nitrogen
4
doped carbon nanostructure with required morphology [13,14]. Among the various carbon
nanomaterials derived from conducting polymers, one-dimensional nanostructures has gained
immense attraction as efficient support material due to its unique hollow 1D nanostructure.
Polypyrrole is the most studied material among conducting polymers. For instance, Zhang et al.
[15] used polypyrrole nanotubes as advanced support for metal nanoparticle dispersion without
surface functionalization. Xu et al. [16] decorated gold nanoparticle over polypyrrole nanotubes
prepared by in situ reduction process. Qiu et al. [11] studied the electrocatalytic oxidation of
methanol using Pt nanoparticles decorated over polypyrrole nanotubes functionalized with ionic
liquid as electrocatalyst. Sapurina et al. [17] has shown that noble metal supported nitrogen
doped carbon structure derived from conducting polymers has good catalytic activity.
The present study focuses on the development of non-Pt based electrocatalyst using cost
effective support material for both anodic and cathodic reaction in PEMFC. Nitrogen rich carbon
nanostructure (NCNS) were prepared by carbonization of polypyrrole nanotubes (PPNT) and
was used to disperse Pd3Co alloy nanoparticles using polyol reduction method. The nitrogen rich
catalyst support with tubular morphology and high surface area have significant influence on
catalyst nanoparticle dispersion thereby increasing its catalytic performance. The synthesized
material was characterized by both physical and electrochemical characterization methods. Thus
the evaluation of hydrogen oxidation reaction (HOR) and oxygen reduction reaction (ORR)
activity of Pd3Co/NCNS is reported and compared with the conventional electrodes of a fuel cell.
Experimental

5
Synthesis of electrocatalyst
Polypyrrole nanotubes (PPNT) were synthesized by the oxidation of pyrrole with ferric chloride
(FeCl3) in the presence of a template, methyl orange (MO). The synthesis method is briefly
explained as follows. A calculated amount of MO was dissolved in 500 ml of deionized (DI)
water followed by the addition of 60 mM FeCl3 solution in to it with continuous stirring. After
that, calculated amount of pyrrole was added to the solution in drops. Then, above suspension
was allowed to stir for 24 h. The solution was washed several times with dilute hydrochloric acid
and DI water till color of the solution changes from dark pink to colorless. Then the product was
dried in vacuum oven at 60 ºC to obtain PPNT. The obtained PPNT was pyrolysed in argon
atmosphere at 800 ºC for 2 h to form nitrogen rich carbon nanostructure (NCNS). The palladium-
cobalt alloy nanoparticles were dispersed over NCNS by well-known polyol reduction method
[18]. The schematic representation for the preparation of Pd3Co/NCNS is shown in Figure 1.
Physical Characterization
XRD patterns were recorded using Rigaku X-ray diffractometer using Cu Kα radiation source at
room temperature. Raman spectra were obtained with a Wi-Tec Raman spectrometer in the range
of 1000 – 2000 cm-1 at room temperature. The morphological and structural analysis of the
prepared samples was carried out using scanning electron microscopy (SEM) in Quanta-200
(FEG) and the transmission electron microscopic (TEM) images were recorded using Technai T-
20. The nitrogen adsorption/desorption studies to calculate the surface area of the synthesized
samples were carried out using Micromeritics ASAP 2020 instrument. The information regarding
thermal stability and the amount of metal catalyst loading was obtained from thermogravimetric
analysis (TGA) using SDTQ600 TA instruments. X-ray photoelectron spectroscopy (XPS) was

6
carried out to analyze the elemental composition and oxidation state of the elements present
using SPECS instrument and it was analyzed using PHOIBOS 100MCD analyzer.
Electrochemical measurements
The electrocatalytic activity of the synthesized samples were studied using cyclic voltammetry
(CV), linear sweep voltammetry (LSV), and rotating ring disk electrode (RRDE). All the
electrochemical half-cell measurements were carried out using a three electrode electrochemical
set up in Biologic SP300 instruments. The working electrode used was a glassy carbon electrode
coated with electrocatalyst ink. Platinum rod and saturated calomel electrode (SCE) was used as
counter and reference electrode, respectively. All half-cell measurements were carried out in 0.5
M H2SO4. Prior to the measurements, the electrocatalyst ink was prepared by dispersing 2.5 mg
of electrocatalyst in 150 µl of DI water and 5 µl of 5 wt % of nafion solution. The calculated
amount of electrocatalyst ink was drop-casted over well-polished glassy carbon electrode. Same
catalyst preparation method was followed for LSV and RRDE measurements to study the ORR
activity of the electrocatalysts.
PEMFC single-cell tests
The single-cell measurements were carried out using KPAS fuel cell test station. The
electrocatalyst ink was prepared by ultrasonicating the calculated amount of electrocatalyst in a
mixture of deionized (DI) water, isopropyl alcohol (IPA) and 5 wt % Nafion solution. The
electrodes were prepared by brush coating this ink over a gas diffusion layer (GDL) which is
single-sided teflonized carbon cloth (Nickunj Eximp Entp Pvt Ltd, India). After preparing the
electrodes, the membrane electrode assembly (MEA) was prepared by sandwiching a polymer
membrane (Nafion-212) in between anode and cathode. The MEAs were assembled between the
flow field plates made of graphite having serpentine geometry. The effective electrode area was

7
11.56 cm2. To control the hydrogen and oxygen gases in electrodes, mass flow controllers were
used. The water content in the membrane was maintained using humidifiers, which humidify the
incoming hydrogen and oxygen gas to the anode and cathode of the fuel cell.
Figure 1: Schematic representation for the preparation of Pd3Co/NCNS.
Results and discussion
Figure 2 shows the XRD pattern of NCNS, Pd/NCNS and Pd3Co/NCNS. In Figure 2a, the broad
peak centered around 2θ value of 25° can be ascribed to graphite (002) and broadness shows the
amorphous nature of PPNT [13]. Along with carbon peak, the peaks centered at 40.02°, 46.53°,
67.97°, 81.93° and 86.44° in XRD pattern of Pd/NCNS can be assigned to the (111), (200),
(220), (311) and (222) reflections of palladium, respectively, which in turn confirms the

8
successful deposition of Pd nanoparticles on NCNS. Whereas in case of XRD pattern of
Pd3Co/NCNS, the Pd peaks were shifted to higher angles compared to that of Pd/NCNS (shown
in enlarged version of XRD pattern of Pd/NCNS and Pd3Co/NCNS (Figure 2b), which is due to
lattice contraction caused by the addition of small Co atoms. Moreover, no separate signals can
be observed corresponding to Co, which further confirms the formation of Pd and Co alloy.
Figure 2: (a) XRD patterns of NCNS, Pd/NCNS and Pd3Co/NCNS and (b) Enlarged version of
XRD patterns of Pd3Co/NCNS and Pd/NCNS.
The Raman spectra of samples PPNT and NCNS are shown in Figure 3. The Raman spectrum of
PPNT does not show clear characteristic peak of graphitic carbon, only displayed the features
corresponding to polypyrrole structure. Whereas the spectrum of NCNS shows two sharp bands
at 1326 cm-1 and 1582 cm-1 which corresponds to the D and G bands of graphitic carbon,
respectively. The peak at 1326 cm-1 is due to the defects present in the carbon structure whereas
the peak at 1582 cm-1 is due to the vibration of Raman active sp2 bonded carbon atoms. Thus, the
Raman spectra of PPNT and NCNS confirm the formation of carbon materials by pyrolysis of
polypyrrole nanotubes.

9
Figure 3: Raman spectra of PPNT and NCNS.
Figure 4 shows the nitrogen adsorption and desorption isotherm for PPNT and NCNS. The BET
surface area calculated using BET analyzer is only 38 m2 g-1 for PPNT, whereas with pyrolysis,
the specific surface was increased to 220 m2 g-1 for NCNS. Thus, the pyrolysis of the polypyrrole
nanotubes at high temperature in Ar atmosphere leads to carbonization and the porous structure
was created by the removal of functional groups during the carbonization. Thus the method
adopted here to produce nitrogen rich porous carbon structure is very simple. Moreover, the high
surface area of NCNS facilitates to improve mass transport in fuel cell.

10
Figure 4: Nitrogen adsorption/desorption isotherm for PPNT and NCNS.
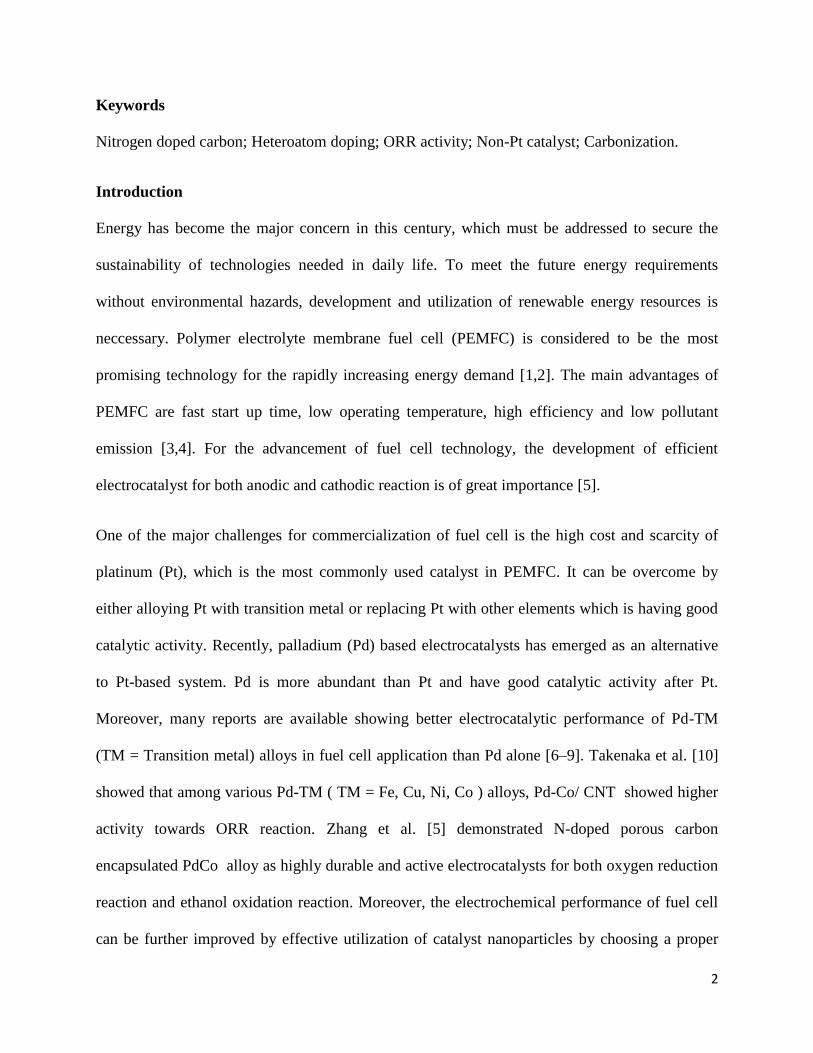
Thermogravimetric analysis was carried out to obtain the information regarding thermal stability
of the synthesized materials at zero air atmosphere from room temperature to 800 ̊C. The
thermogram of NCNS and Pd3Co/NCNS in Figure 5 shows an initial loss in weight at lower
temperature due to the presence of residual water content present in the samples. Further, the
rapid loss in weight observed at a temperature range of 400 – 500 ̊C is due to the decomposition
of carbonaceous species in presence of air. A residual weight of ̴ 10 wt% is present in NCNS,
which is due to the presence of impurities that is not washed off while filtering the sample. Thus,
from the TGA profile of Pd3Co/NCNS, the presence of ̴ 30 wt% of metal catalyst loading can be
confirmed.
11
Figure 5: Thermogravimetric curve of NCNS and Pd3Co/NCNS.
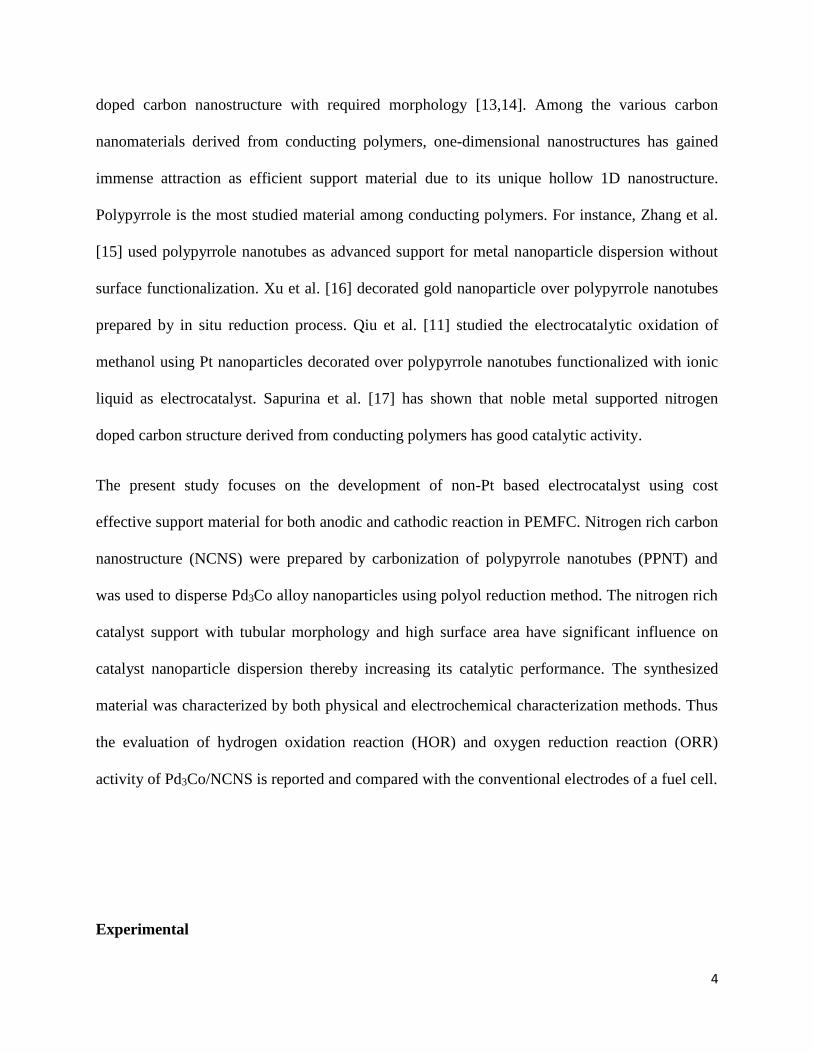
The morphological study of the synthesized samples was carried out using SEM and TEM.
Figure 6 (a, b) shows the SEM and TEM images of NCNS which clearly shows the one-
dimensional structure of NCNS. Figure 6 (c, d) depicts the SEM and TEM images of
Pd3Co/NCNS which exhibits homogeneous dispersion of uniform sized Pd3Co nanoparticles on
nitrogen rich carbon nanostructures. The homogeneous dispersion of catalyst nanoparticles can
be due to more number of nitrogen-carbon moieties present in the support material which acts as
active sites. Also, the presence of nitrogen atoms in the carbon structure helps in uniform
distribution of catalyst nanoparticles. Moreover, during carbonization, defects were created due
to the removal of functional groups which also serve as catalyst anchoring sites. The chemical
composition of the synthesized electrocatalyst Pd3Co/NCNS was determined from the elemental
mapping (Figure S1, Supplementary Information). The elemental mapping shows the presence of
carbon (C), nitrogen (N), palladium (Pd) and cobalt (Co) in Pd3Co/NCNS.
12
Figure 6: SEM and TEM image (a, b) of NCNS and (c, d) of Pd3Co/NCNS.
The chemical composition of the prepared electrocatalyst Pd3Co/NCNS was confirmed by
carrying out the X-ray photoelectron spectroscopy (XPS). Figure 7a shows the high resolution
XPS spectrum of C 1s orbital. A prominent peak centered at 284.09 eV in the deconvoluted
spectrum of C 1s corresponds to sp2 C=C bonding. Whereas, the two peaks centered at 285.65
eV and 288.09 eV corresponds to the sp2 C=N and sp3 C-N bonding, respectively [19]. The
deconvoluted spectrum of N 1s shown in Figure 7b consists of three peaks centered at 398.78
eV, 401.07 eV and 406.10 eV corresponds to the pyridinic N, quaternary N, and N-oxide
respectively [20,21]. From XPS analysis, the amount of nitrogen atoms doped in the reduced
graphene oxide structure was obtained as 4.57 atomic %. Figure 7c shows the deconvulted XPS
spectrum of Pd 3d which consists of four peaks. Among four peaks, the peaks centered at 335.65
eV and 341.42 eV correspond to the metallic Pd i.e. Pd0 3d5/2 and Pd0 3d3/2, respectively.
Whereas, the other two peaks corresponding to +2 oxidation state of palladium is centered at
337.75 eV (Pd+2 3d5/2) and at 343.58 eV (Pd+2 3d3/2) and it is formed due to the formation of Pd-

13
O bond or Pd-N bond [22] spectrum of Co 2p orbital of Pd3Co/NCNS is shown in Figure 7d. The
two peaks centered around 780.38 eV and 795.39 eV correspond to the Co 2p3/2 and Co 2p1/2
respectively [23–25].
Figure 7: XPS spectra of (a) C 1s, (b) N 1s, (c) Pd 3d and (d) Co 2p orbitals.
The cyclic voltammogram of Pd3Co/NCNS (Figure 8a) was recorded at a scan rate of 50 mV s-1
using saturated calomel electrode (SCE) as reference electrode. The peaks observed between -0.3
V and 0 V corresponds to the hydrogen desorption/adsorption peak. The anodic peak observed
above 0.5 V is due to the oxide formation on palladium surface, whereas the cathodic peak
observed in the voltage range of 0.45 V to 0.1 V is due to the reduction of Pd oxide to form

14
elemental Pd. Since Pd is hydrogen storage material, the electrochemical surface area (ECSA)
was calculated from the Pd-oxide reduction peak using the Equation (1).
[ ]*
H
M
QECSA
M Q (1)
Where, QH is the coulombic charge exchanged during reduction of Pd oxide, QM is the
adsorption charge for atomically smooth surface area. For Pd, the value of QM 0.42 mC cm-2 and
[M] is the electrocatalyst loading and ECSA is expressed in m2/g. The ECSA for Pd3Co/NCNS
was obtained to be 82 m2 g-1. The stability of the electrocatalyst Pd3Co/NCNS was tested by
taking CV measurements before and after 300 cycles (Figure 8b) and it was found that the
electrocatalyst is stable without much reduction in current density.
Figure 8: (a) Cyclic voltammogram of Pd3Co / NCNS and (b) Cyclic voltammogram of
Pd3Co/NCNS before and after 300 cycles.
The RDE measurements were carried out to probe the ORR performance of Pd3Co/NCNS.
Figure 9a depicts the LSV curve of Pd3Co/NCNS recorded at a scan rate of 5 mV s-1 in oxygen
saturated 0.5 M H2SO4 electrolyte solution at room temperature. To explore the kinetic

15
parameters, the electrode was allowed to rotate in different speeds. From LSV curves, it was
observed that the diffusion-limiting current rises with increase in speed of electrode rotation.
This can be due to more diffusion of oxygen towards the electrode with increase in rotation rate.
From LSV curve, the kinetic parameters related to ORR performance can be found out using
Koutecky-Levich (K-L) plot using K-L Equation (2).
2
1/ 2
1 1 1 1 1
k d Oj j j nFkC B (2)
where,
2 2
2/3 1/60.2 O OB nFC D (3)
where j, jk and jd is the experimentally measured current density, kinetic current density and
diffusion-limited current density, respectively. The electrode rotation speed (ω) is expressed in
rpm, k is the rate constant, F is the Faraday constant (96486 C mol-1), n is the electron transfer
number per molecule of oxygen in ORR, 2OD is the oxygen diffusion coefficient in electrolyte
(1.4×10⁻⁵ cm2 s-1), ʋ is the kinematic viscosity of the electrolyte (1×10⁻² cm s-1) and 2OC is the
concentration of oxygen in the electrolyte (1.1×10⁻⁶mol cm-3) in 0.5 M H2SO4 [26,27]. The
constant B in Equation (3) can be obtained from K-L plots (j-1 vs ω-1/2), from which the electron
transfer number (n) involved in ORR process can be calculated. Figure 9b shows the K-L lines of
Pd3Co/NCNS at different potentials along with the theoretical line for two electron (n =2) and
four electron (n = 4) process. It can be seen that the experimental K-L lines are almost parallel to
each other as well as to the theoretical n = 4 K-L line. Further, the n value calculated from slope
of the experimental K-L lines was found to be approximately 3.56. This suggests the ORR

16
catalyzed by Pd3Co/NCNS was via nearly four-electron transfer mechanism. The LSV curve of
Pd3Co/NCNS at 1600 rpm electrode rotation speed was compared with that of Pd3Co decorated
over another 1D carbon nanostructure, multiwalled carbon nanotubes (CNT) [18] and
commercial Pt/C [28] (Figure S2). It was observed that the Pt/C shows better ORR activity than
that of Pd-alloy based electrocatalysts. Whereas among Pd-based electrocatalysts, the onset
potential of Pd3Co/NCNS was better compared to Pd3Co/CNT which is an indication of
improved catalytic activity of Pd3Co/NCNS.
Figure 9: (a) LSV curve of Pd3Co/NCNS at different electrode rotation speed and (b) Koutecky-
Levich plot of Pd3Co/NCNS.
Further, for gathering more accurate information regarding the ORR reaction pathway, RRDE
measurements were performed. Figure 10a shows the RRDE curve of Pd3Co/NCNS at 1600 rpm
with 5 mV s-1 scan rate. The percentage amount of hydrogen peroxide (H2O2) produced and the
electron transfer number (n) during the ORR mechanism was calculated using the Equation (4)
and (5) [12].

17
2 2
200 /%
/
r
d r
i NH O
i i N
(4)
4
/
d
d r
in
i i N
(5)
where ir is the ring current, id is the disk current and N is the collection efficiency (0.37).
Figure 10: (a) RRDE curves of Pd3Co/NCNS at 1600 rpm and (b) Percentage of hydrogen
peroxide produced and electron transfer number during ORR of Pd3Co/NCNS.
The amount of hydrogen peroxide produced and electron transfer number during ORR by the
electrocatalyst Pd3Co/NCNS is shown in Figure 10b. The percentage of peroxide produced
varies from 6 % to 10 % in the potential range 0 V to 0.6 V. The calculated number of electrons
transferred during the ORR mechanism from RRDE was found to vary from 3.58 to 3.62 in the
potential range 0 V to 0.6 V vs SCE. Thus, Pd3Co/NCNS is a promising electrocatalyst for ORR
which follows nearly four electron pathway.
The fuel cell performance studies were carried out by preparing MEA 1using Pd3Co/NCNS as
anode electrocatalyst with commercial Pt/C as cathode and were labeled as MEA 1. Similarly,
18
MEA 2 was prepared by reversing anode and cathode. In addition to it, MEA 3 was prepared
using Pd3Co/NCNS at both anode and cathode. The catalyst loading of Pd3Co/NCNS was 0.5 mg
cm-2 and that of commercial Pt/C was 0.1 mg cm-2. Figure 11 (a-c) shows the polarization curves
of MEA 1, MEA 2 and MEA 3 at three different temperatures 40 ºC, 50 ºC and 60 ºC,
respectively.
Prior to the polarization studies, the electrodes were activated between open circuit potential and
0.1 V. Using MEA 1, the maximum power density of 374 mW cm-2 was obtained at 60 ºC.
Similarly, in case of MEA 2, the peak power density of 257 mW cm-2 was achieved. The
maximum power density of Pd3Co/NCNS as cathode electrocatalysts at 60 ⁰ C without back
pressure is higher than the performance of previously reported Pd based electrocatalysts [29–31].
The MEA 3 which is completely free from Pt showed maximum power density of 129 mW cm-2
at 60 ⁰ C, which is a very good performance without Pt on either electrode.Pd3Co/NCNS showed
enhanced performance compared to other similar reported work from our group, using same
catalyst alloy nanoparticles over different catalyst support materials with same catalyst metal
loading [18,28]. For comparison, another MEA was prepared and tested using Pd/NCNS as both
anode and cathode electrocatalyst, and the maximum power density obtained at 60 ⁰ C was 102
mW cm-2 (Figure S3). The fuel cell performance of Pd3Co/NCNS is further compared with the
performance of commercial Pt/C and shown in Figure S4 [18]. The maximum power density
value obtained using commercial Pt/C with 0.1 mg cm-2 catalyst loading on both sides was 515
mW cm-2. The peak power density attained using Pd3Co/NCNS at anode, cathode and at both
electrodes showed almost 73 %, 50 % and 25 % of maximum power density attained using
commercial Pt/C on both sides, respectively. Thus, the achievement of almost 25 % of maximum
power density of that of commercial Pt/C catalyst is the best value obtained so far using non-Pt

19
based electrocatalyst on both sides of a fuel cell. The maximum power density values obtained
using different MEAs at 60 ⁰ C are given in Table 1. The enhanced performance of
Pd3Co/NCNS can be attributed to the presence of more number of N-C moieties present in
NCNS which acts as active catalyst sites and improved electrical conductivity due to the
presence of nitrogen in addition to alloying effect. Moreover, nitrogen doping enhances the
interaction between catalyst nanoparticle and support material. In addition, the high surface area
with porous nature of NCNS helps in easy mass transfer thereby improving HOR and ORR.
Figure 11: Polarization curves of (a) Pd3Co/NCNS as anode electrocatalyst, (b) Pd3Co/NCNS as
cathode electrocatalyst and (c) Pd3Co/NCNS as both anode and cathode electrocatalyst at 40 ⁰ C,
50 ⁰ C and 60 ⁰ C temperature.

20
Table 1. Maximum power density obtained for different MEA’s at 60 ⁰ C temperature with Pt/C
loading of 0.1 mg cm-2 and Pd3Co/NCNS loading of 0.5 mg cm-2.
Sl.No. Anode Cathode Maximum Power density
at 60 ⁰ C (mW cm-2)
1.
2.
3.
4.
5
Pd3Co/NCNS
Pt/C
Pd3Co/NCNS
Pd/NCNS
Pt/C
Pt/C
Pd3Co/NCNS
Pd3Co/NCNS
Pd/NCNS
Pt/C
374
257
129
102
515
Conclusion
Nitrogen rich carbon nanostructure derived from conducting polymer was successfully
synthesized and employed as an efficient catalyst support material in PEMFC due to its facile
and cost effective production compared to commonly used carbon nanomaterials like graphene
and carbon nanotubes. Palladium-cobalt alloy based nanocomposite was prepared using NCNS
as catalyst support material. Both half-cell and single-cell measurements were carried using as-
synthesized nanocomposite. RDE and RRDE measurements showed that the ORR mechanism in
Pd3Co/NCNS proceeds via nearly four electron pathway. The peak power density achieved using
Pd3Co/NCNS at both anode and cathode simultaneously was almost 25 % of the maximum
power density attained using commercial Pt/C on both sides. The superior performance of
Pd3Co/NCNS is attributed to the presence of more number of N-C moieties in NCNS which acts
as active catalyst sites and improved electrical conductivity due to the presence of nitrogen. In
addition, high surface area of hollow porous structure helps in easy mass transfer thereby

21
improving HOR and ORR. Thus Pd3Co/NCNS has proved to be a promising cost-effective non-
Pt anode and cathode electrocatalyst in PEMFC with excellent catalytic performance.
Acknowledgements
Authors thank Indian Institute of Technology Madras for the financial support.
References
1. Takigami, M.; Kobayashi, R.; Ishii, T.; Imashiro, Y.; Ozaki, J.I. Beilstein J. Nanotechnol.
2019, 10,1391–1400. doi:10.3762/bjnano.10.137
2. Louisia, S; Thomas, R.J.Y.; Lecante, P.; Heitzmann, M.; Axet, M.R.; Jacques, P.; Serp, P.
Beilstein J. Nanotechnol. 2019, 10, 1251–1269. doi:10.3762/bjnano.10.125
3. Deng, R.; Xia, Z.; Sun, R.; Wang, S.; Sun, G. J. Energy Chem. 2020, 43, 33–39.
doi:10.1016/j.jechem.2019.07.015
4. Vinayan, B.P.; Nagar, R.; Rajalakshmi, N.; Ramaprabhu, S. Adv. Funct. Mater. 2012, 22,
3519–3526. doi:10.1002/adfm.201102544
5. Zhang, Z.; Liu, S.; Tian, X.; Wang, J.; Xu, P.; Xiao, F.; Wang, S. J. Mater. Chem. A 2017,
1–9. doi:10.1039/c7ta00710h
6. Qi, Y.; Wu, J.; Zhang, H.; Jiang, Y.; Jin, C.; Fu, M.; Yang, H.; Yang, D. Nanoscale 2014,
6, 7012. doi: 10.1039/c3nr06888a
7. Savadogo, O.; Lee, K.; Oishi, K.; Mitsushima, S.; Kamiya, N.; Ota, K.I. Electrochem.
commun. 2004, 6, 105–109.doi: 10.1016/j.elecom.2003.10.020

22
8. Wang, D.; Xin, H.L.; Wang, H.; Yu, Y.; Rus, E.; Muller, D.A.; Disalvo, F.J.; Abruña,
H.D. Chem. Mater. 2012, 24, 2274–2281.doi: 10.1021/cm203863d
9. Savadogo, O.; Varela, F.J.R. J. New Mater. Electrochem. Syst. 2008, 11, 69–74. doi:
10.1149/1.2214495
10. Takenaka, S.; Tsukamoto, T.; Matsune, H.; Kishida, M. Catal. Sci. Technol. 2013, 3,
2723.doi: 10.1039/c3cy00446e
11. Qiu, L.; Liu, B.; Peng, Y.; Yan, F. Chem. Commun. 2011, 47, 2934–2936. doi:
10.1039/c0cc04865h
12. Bau, Vincent Mirai Bo, Xiangjie Guo, L. J. Energy Chem. 2017, 26, 63–71. doi:
10.1016/j.jechem.2016.07.005
13. Puthusseri, D.; Ramaprabhu, S.. Int. J. Hydrogen Energy 2016, 41, 13163–13170. doi:
10.1016/j.ijhydene.2016.05.146
14. Shrestha, S.; Mustain, W.E. J. Electrochem.Soc. 2010,157, B1665-B1672. doi:
10.1149/1.3489412
15. Zhang, J.; Liu, X.; Zhang, L.; Cao, B.; Wu, S. Macromol. Rapid Commun.2013, 34, 528–
532. doi: 10.1002/marc.201200757
16. Xu, J.; Hu, J.; Quan, B.; Wei, Z. Macromol. Rapid.Commun. 2009, 30, 936–940.doi:
10.1002/marc.200800764
17. Trchova, M.; Kopecka, J.; Cieslar, M.; El-nasr, A.A.; Ayad, M.M. Synth. Met. 2016, 214,
14–22.doi: 10.1016/j.synthmet.2016.01.009

23
18. Chandran, P.; Ramaprabhu, S. Int. J. Hydrogen Energy 2018, 43, 1–11.doi:
10.1016/j.ijhydene.2018.08.066
19. Shende, R.; Sundara, R. Sol. Energy Mater. Sol. Cells 2015, 140, 9–16. doi:
10.1016/j.solmat.2015.03.012
20. Wickramaratne, N.P.; Xu, J.; Wang, M.; Zhu, L.; Dai, L.; Jaroniec, M. Chem. Mater.
2014, 26, 2820–2828. doi: 10.1021/cm5001895
21. Li, Z.; Gao, Q.; Zhang, H.; Tian, W.; Tan, Y.; Qian, W.; Liu, Z. Sci. Rep. 2017, 7, 1–9.
doi: 10.1038/srep43352
22. Qiu, X.; Zhang, H.; Dai, Y.; Zhang, F.; Wu, P.; Wu, P.; Tang, Y. Catalysts 2015, 5, 992–
1002. doi: 10.3390/catal5020992
23. Kuang, M.; Li, T.T.; Chen, H.; Zhang, S.M.; Zhang, L.L.; Zhang, Y.X. Nanotechnology
2015, 26, 1–9. doi: 10.1088/0957-4484/26/30/304002
24. Kocijan, A.; Milošev, I.; Pihlar, B. J. Mater. Sci. Mater. Med. 2004, 15, 643–650.doi:
10.1023/B:JMSM.0000030204.0861
25. Huang, J.; Qian, W.; Ma, H.; Zhang, H.; Ying, W. RSC Adv. 2017, 7, 33441–33449.doi:
10.1039/c7ra05887j
26. Chandran, P.; Puthusseri, D.; Ramaprabhu, S. Int. J. Hydrogen Energy 2019, 44, 4951–
4961.doi: 10.1016/j.ijhydene.2018.12.209

24
27. Zhang, L.; Qi, C.; Zhao, A.; Xu, G.; Xu, J.; Zhang, L. Appl Surf Sci. 2018, 445, 462–470.
doi: 10.1016/j.apsu sc.2018.03.145
28. Chandran, P.; Ghosh, A.; Ramaprabhu, S. Sci. Rep. 2018, 8, 3591. doi: 10.1038/s41598-
018-22001-9
29. Moreira, J.; Del Angel, P.; Ocampo, A.L.; Sebastián, P.J.; Montoya, J.A.; Castellanos,
R.H. Int. J. Hydrogen Energy 2004, 29, 915–920. doi: 10.1016/j.ijhydene.2003.06.003
30. Martinez-Casillas, D.C.; Vazquez-Huerta, G.; Perez-Robles, J.F.; Solorza-Feria, O. J.
Power Sources 2011, 196, 4468–4474.doi: 10.1016/j.jpowsour.20111.01.050
31. Martínez-Casillas, D.C.; Calderon, H.A.; Collins-Martínez, V.; Solorza-Feria, O. Int. J.
Hydrogen Energy 2013, 38, 12674–12680.doi: 10.1016/j.ijhydene.2012.11.066