Embed Size (px)
Citation preview

Outsourcing Markets in Services:International Business Trends, Patterns and Emerging Issues, and the Role of China and India
UNITED NATIONS INDUSTRIAL DEVELOPMENT ORGANIZATION
Printed in AustriaV.09-85640—August 2009—200
UNITED NATIONS INDUSTRIAL DEVELOPMENT ORGANIZATIONVienna International Centre, P.O. Box 300, 1400 Vienna, AustriaTelephone: (+43-1) 26026-0, Fax: (+43-1) 26926-69E-mail: [email protected], Internet: www.unido.org
R e s e a r c h a n d S t a t i s t i c s B r a n c h
w o r k i n g p a p e r 0 3 / 2 0 0 9


UNITED NATIONS INDUSTRIAL DEVELOPMENT ORGANIZATIONVienna, 2009
RESEARCH AND STATISTICS BRANCHWORKING PAPER 03/2009
Outsourcing Markets in Services:International Business Trends, Patterns and Emerging Issues, and the Role of China and India
Frank L. BartelsUnit Chief, Strategic Research and Regional Analyses Unit
UNIDO
Suman LedererUNIDO Consultant

The designations employed, descriptions and classifications of countries, and the presentation of the material in this document do not imply the expression of any opinion whatsoever on the part of the Secretariat of the United Nations Industrial Development Organization (UNIDO) concerning the legal status of any country, territory, city or area or of its authorities, or concerning the delimitation of its frontiers or boundaries, or its economic system or degree of development. The responsibility for opinions expressed rests solely with the authors, and publication does not constitute an endorsement by UNIDO of the opinions expressed. Although great care has been taken to maintain the accuracy of information herein, neither UNIDO nor its Member States assume any responsibility for consequences which may arise from the use of the material. This document may be freely quoted or reprinted but acknowledgement is requested. This document has been produced without formal United Nations editing. The views expressed in this document do not necessarily reflect the views of the Secretariat of the UNIDO. Terms such as “developed, “industrialized” and “developing” are intended for statistical convenience and do not necessarily express a judgment. Any indication of, or reference to, a country, institution or other legal entity does not constitute an endorsement. This document represents work in progress and is intended to generate comment and discussion.

iii
Contents
List of abbreviations ...................................................................................................................... iv
Abstract ........................................................................................................................................... v
Preamble ......................................................................................................................................... v
Introduction..................................................................................................................................... 1
1. The Global Context, Taxonomy and Estimates ...................................................................... 3
2. The Macroeconomic Context................................................................................................ 10
3. The Spatiality of Offshore Outsourcing................................................................................ 13
4. China and India Compared and Contrasted .......................................................................... 19
5. Services Offshore Outsourcing - Impacts and Implications ................................................. 24
6. Policy Issues.......................................................................................................................... 26
7. Concluding Remarks............................................................................................................. 35
References..................................................................................................................................... 39

iv
List of abbreviations
BPO business process outsourcing
BRICS Brazil, Russia, India, China, South Africa
CAGR compound annual growth rate
CIP Competitive Industrial Performance
EU European Union
FDI foreign direct investment
GATS General Agreement on Trade in Services
GDP gross domestic product
GF global factory
GSCs global supply chains
GVCs global value chains
HCLs higher-cost locations
HQs Headquarters
ICTs information and communications technologies
IOR Indian Ocean Rim
IINs integrated international networks (sourcing, technology, production, marketing
and servicing)
LCLs lower-cost locations
LSAs location-specific advantages
MNEs multinational enterprises
OECD Organization for Economic Cooperation and Development
OO offshoring and outsourcing
PIs policy instruments
R&D research and development
SOO services offshoring and outsourcing
UNIDO United Nations Industrial Development Organization

v
Abstract
The global context and estimates of the market for outsourcing, within the framework of
multinational enterprises’ foreign direct investment, are reviewed. The examination of geo-
economic spatiality of international involvement of multinational enterprises, including
outsourcing, shows stark gravitational asymmetries with the Triad economies of North
America, European Union and Japan as core, and South and East Asia as periphery
economies – particularly China and India. The impacts of outsourcing on policy issues and
responses are scrutinized to expose the key variables of policy craft.
Preamble
This working paper discusses the various dimensions of using direct investment and
contractual modalities to service global markets by firms in their internationalization. It is
observed that, while foreign direct investment continues to dominate international business,
international contracting – as outsourcing – is growing rapidly in significance as one of the
key cost-reducing elements in the strategic options of multinational enterprises.
While outsourcing markets are difficult to estimate, due to the escalating digitization of the
knowledge-based economy, there is an expectance that they will expand at compound annual
growth rates of between 15 per cent and 40 per cent, with China and India taking the lion’s
share of contracts outsourced to developing countries1. Considerable variation is found not
only in the spatial distribution of foreign direct investment and outsourcing but also in the
relative location-specific advantages of China and India, with respect to outsourcing.
Finally, the correlation of outsourcing to firm performance, which carries serious
implications for the crafting of host policies, is moderated by significant gaps between
expectations and actual firm economic results from outsourcing. Furthermore, the correlation
between outsourcing and firm performance is determined by complex non-monotonic
relationships at the level of certain key factors of what is outsourced, namely, asset
specificity, transaction frequency, technological uncertainty, as well as process and product
innovativeness. At relatively lower intensities regarding factor levels, outsourcing is
positively correlated with firm performance, and at relatively higher intensities factor levels,
1 These estimates do not necessarily reflect the current economic downturn which has tipped several key and leading economies into recession (see Martin Wolf, “Fixing bankrupt financial systems is just the beginning”, Financial Times, 29 April 2009, p. 9).

vi
outsourcing is negatively correlated with firm performance. Host policy to prevent this
inflexion in firm performance and hence the potential of the outsourcing of higher levels of
activity not being carried out by firms – requires attention to the upgrading of domestic
industry and local firm capabilities to enable them to execute progressively higher value-
added outsourcing.
1
Introduction
This working paper deals with the related phenomena ‘offshoring’ and ‘outsourcing’ (OO)2
(terms which represent changing preferences in terminology regarding the
internationalization of business). It does so using the well-established principles in the
discipline of international business, as well as the ‘lens’ provided by the empirical evidence
of foreign direct investment (FDI) by multinational enterprises (MNEs). This permits, first, a
view of offshore production as a general case of FDI involving entry modalities and
governance structures ranging from hierarchies to markets - from full ownership to control
without equity, and arm’s length relationships. Secondly, outsourcing can be viewed in terms
of market-based, or intermediated, transactions through contract [Williamson (1975)]. This is
in contrast to transactions (or more accurately transformations - that involve adding value to
either products or services) which are ‘internalized’ within the organizational boundaries,3
thereby within the internal governance structure of MNEs, and thus occluded from markets
[Buckley (1988)]. Internalized transactions are therefore subject to transfer pricing modalities
(from arm’s length to manipulative modalities) that are far removed from market-based
contractual relations [Yeaple (2003)].
It is increasingly apparent that despite the predominant role of MNEs’ FDI in integrating
global industrial dynamics, and the lexicon of managerial economics in explaining
globalization [Bartels and Pass (2000)], nuances are noticeable in the general characteristics
of FDI. This is especially so with regard to the evolving spatial distribution of FDI and the
value and supply inter-linkages within cross-border business transactions and trade. These
nuances range from emergent ‘new’ properties in the international, and inter-regional,
division of labour and vertical inter-industry trade [Yeats (2001)] to concerns about the
externalities from, and impact of, the decentralization of MNEs’ corporate functions.4 The
nuances also reflect the changing nature of competition. This represents a shift from
competitiveness as a uni-dimensional interpretation of business conflict to a multi-
2 In this paper the terms offshoring and outsourcing are used interchangeably with offshore outsourcing. 3 To avoid the transaction costs of Willaimsonian market failure, that is, the intractableness of complexity
and dynamism in the real world economy, the problem of small numbers (oligopoly), opportunism, information impactedness and asymmetries, asset specificities, and bounded rationality.
4 This decentralization of operations is from the ‘core’, or headquarters (HQs), to the periphery, or subsidiaries (subsidiarity) via mandates. See Birkinshaw (1996) for an analysis of HQs-subsidiary mandates in FDI and international location of production within the organizational boundaries of MNEs; and The Boston Consulting Group (2004) for a structural analysis of the international relocation of operations and services between the organizational boundaries of MNEs.

2
dimensional view of competition as a spectrum of (national and cross-border) cooperation
(strategic alliances, equity and non-equity joint ventures, subcontracting) [Dunning (1997);
Doz and Prahalad (1989)] and public-private sector partnerships within state-MNEs
contentions [Stopford, Strange and Henley (1991)]. This rapidly changing nature of
competition is co-evolving with shifts in tariff and non-tariff barriers to trade, as well as a
general fall in the level of protectionism.5 And finally, there are the subtleties of the so-called
knowledge-based economy and globalization, and their impact on the increasingly spatial
distribution of economic activity, which display simultaneous concentration of higher value
(capital) activities and dispersal of lower value (labour) operations.6
The remainder of this working paper is organized as follows. Section 1—The Global Context,
Taxonomy and Estimates—sketches the major trends in FDI that shape the emergent nuances
in OO. It also addresses the definitional issues and attempts to quantify the markets for
outsourcing. Section 2—The Macro-economic Context—delineates the key global trends of
services offshore outsourcing (SOO) as international contracting co-evolving with FDI.
Section 3—The Spatiality of Services Offshoring Outsourcing—maps the variety of SOO
activity and the distribution of that activity as patterns across geo-economic space. In
addition, it highlights the widening asymmetries within the landscape. Section 4—China and
India Compared and Contrasted—examines the current attention on these two hosts and their
relative competitiveness in terms of location-specific advantages (LSAs) with respect to OO.
It draws out salient features of the respective investment climates and challenges therein.
Section 5—Services Offshore Outsourcing - Impacts and Implications—looks at the
phenomena of SOO from the host perspective. It points to the domestic structural adjustments
necessary to attract and capture SOO. Section 6—Policy Issues—looks at the framework for
policy objectives and related policy instruments to capture increasing shares of the global
market for SOO. Section 7—Concluding Remarks—review the emerging global policy arena
for SOO.
5 The decreasing barriers to factor movements is partly a result of structural adjustment pressures for increased economic liberalization. The number of countries making regulatory changes to FDI regimes between 1991 and 2001 is cumulatively 652, averaging 59 per year. The number of pro-FDI changes is cumulatively 1,315, averaging 120 per year, whilst the number of anti-FDI changes is cumulatively 78, averaging 7 per year [see UNCTAD (2002), Box 1.2, p.7].
6 See American Electronics Association (2004) for the countervailing currents in the global division of labour.

3
1. The Global Context, Taxonomy and Estimates
The world is envisaged “as a grid of potential locations for value-adding activities, connected
by flows of information and products” [Buckley and Hashai (2004, p. 33)]. Within this grid
four major interrelated factors—akin to paradigm shifts—are shaping the emergent nuances
in internationalization [Laudicina (2004)]. They are:
(i) accelerations in technological advances, globalization, demographic
bifurcation in population dynamics between industrialized and developing
countries;
(ii) fragmenting consumer behaviour;
(iii) increasing demand on the environment and natural resources,
‘complexification’ of the regulatory environment; and
(iv) increased stakeholder activism.
The long-term impact of population ageing in the industrialized world7—labour shortages at
competitive productivity-adjusted cost—can only be met by technology and immigration, or
‘exporting jobs’. That entails the offshore outsourcing of increasingly sophisticated business
operations to the increasingly skilled labour pools of the more advanced emerging markets
and developing countries in Asia.
Offshore outsourcing—FDI hierarchies and markets—need to be appreciated, for the
purposes of economic and, consequently, industrial policy objectives, from the perspective of
FDI (host investment climate issues) and markets (host domestic industrial structures).
Definitions of FDI and contracting [Bartels (2004); Buckley and Casson (2002); Dunning
(2000); Buckley (1999)] are readily available in the literature.8 And in essence these
definitions will suffice to explain OO. However, the widely accepted terms offshoring9 and
outsourcing—and their coupling—require refining to assist the appreciation of the emergent
nuances in global production and servicing. Despite the long-term growth in FDI, the growth
7 The twenty-first century will experience unprecedented structural demographic change that could transform the world economy over the next several decades. Developed countries will experience increases in ageing population, while developing economies are likely to see a large increase in their working age populations. (See Proceedings of a Symposium Sponsored by the Federal Reserve Bank of Kansas City, Jackson Hole, Wyoming (2004.)
8 See, inter alia, Dunning J. H. (1958); UNIDO (2003a); and Freeman and Bartels (2004). 9 This term should not be confused with offshore which is used to describe the tax minimizing location of
banking and financial legal entities. Of course, the resulting spatial distribution of economic activity across sovereign borders enables international transfer pricing to contribute to MNEs global tax minimization strategies.

4
in offshore outsourcing may be attributed to MNEs’ perceptions and management of risk in
international business.
MNEs with predictably structured divisions locked into rigid linkages with other parts of the
same firm have evolved into a new international structure in an environment that is very
different from earlier times. This is very challenging from a policy perspective. With
competitive pressures increasing relentlessly, the questions asked by MNEs are, first, where
to locate productive assets and source contract manufacturing activity and services in a
manner that efficiently differentiates between locations and maximizes the difference
between manufacturing value added (and, ultimately, sales), services and locational cost
structures? Secondly, how should the assets and contract activity be coordinated and
controlled as a system? And thirdly, should the spatially differentiated manufacturing plants,
producing similar products, use similar technology and production processes. In other words,
how should capital/labour intensities be distributed across the system?
The location decision concerns the relative merits of the cost- and market-related advantages
between different locations. The control decision, for its part, concerns whether or not to
own, or to have an option on ownership [Trigeorgis (1996)] through collaboration (for
example, outsourcing, subcontracting, joint venture, strategic alliance with different firms).
The similar manufacturing process decision concerns horizontal integration and the effective
technology transfer between subsidiaries and service providers so as to enable rapid response
to competitors and market changes. In the new economic environment, the desire of MNEs
for flexibility militates against the rigid backward and forward vertical integration into input
factors or into distribution of the earlier era of MNEs organization. The more advantageous
alternatives are to subcontract production and servicing, and franchise sales through OO
(thereby distributing the associated risk profiles).
The new economic perspective for MNEs in managing international operations concentrates
managerial attention on: (i) the characteristics of volatility and uncertainty in markets; (ii) the
value of options and flexibility in entry modes for FDI; (iii) alliances, collaborative and
network forms of cooperation and competition; (iv) entrepreneurship within networks; (v)
managerial competence; and (vi) corporate and organizational cultures that are progressively
more adaptable to the demands of change. This set translates into flexibility of operations. In
other words, the ability to orchestrate the allocation, and re-allocation, of resources

5
efficiently, smoothly and rapidly in anticipation of, and in response to, change. The greater
the amplitude and frequency of change in the business environment, the greater this need for
organizational and operational flexibility. Table 1—Regional FDI inflows—shows the
persistent pattern of FDI, which underscores the structures of OO.
Table 1. Regional FDI inflows, selected years (Millions of US dollars)
Region 1980 1985 1990 1995 2000 2003 Industrialized countries 46,481 42,044 172,261 224,776 1,284,177 421,584 North Africa 132 1,422 1,135 866 2,600 2,215 Central Africa 184 681 -354 296 902 n.a. Western Africa -507 473 892 1,653 744 413 East and Southern Africa 305 168 514 953 1,807 721 Western Asia and Europe -3,349 955 2,587 157 3,560 7,075 Latin America 6,434 5,734 819 30,393 78,708 35,688 South and East Asia 2,480 4,387 16,897 65,328 135,990 80,521 Total 52,160 55,864 194,841 324,422 1,508,488 548,2 17 Source: UNIDO Statistics compiled from International Finance Statistics (from International Monetary
Fund) according to UNIDO list of countries and areas included in selected groupings in the International Yearbook of Industrial Statistics 2005.
The analysis indicated above highlights the issue of accelerated dynamic market entry and
exit as the strategic preference for MNEs. In a volatile environment, FDI can be seen as a
high-risk strategy particularly in the absence of location-specific compensating factors such
as a transparent and coherent business climate with the provision of both the ‘hard’ and ‘soft’
infrastructure to do business. Reflecting the flexibility inherent in spatially distributed
production networks, the ‘hub’ and ‘spoke’ strategies employed by MNEs enable
responsiveness to market decline by OO and divesting distribution assets to local partners
(exercising one of the options in joint venturing), while retaining production capacities with
high appropriabilities10 the output of which can be diverted to other markets. The
implications for developing countries are that their investment promotion agencies need to
fully understand the dynamics of these decisions by MNEs and incorporate them fully into
their development policy and FDI promotion strategy. Table 2—Regional FDI inflows—
reflects again the predominant pattern of international involvement. Since the mid-1990s, this
pattern has been hallmarked by the dominance of the industrialized countries and Asia.
10 Due to monopolistic-oligopolistic advantages that are derived, inter alia, from technological functions.

6
Table 2. Regional FDI inflows, selected years (Per centage of total)
Region 1980 1985 1990 1995 2000 2003
Industrialized countries 89.11 75.26 88.41 69.28 85.13 76.90
North Africa 0.25 2.55 0.58 0.27 0.17 0.40
Central Africa 0.35 1.22 -0.18 0.09 0.06 0.00
Western Africa -0.97 0.85 0.46 0.51 0.05 0.08
East and Southern Africa 0.58 0.30 0.26 0.29 0.12 0.13
Western Asia and Europe -6.42 1.71 1.33 0.05 0.24 1.29
Latin America 12.34 10.26 0.42 9.37 5.22 6.51
South and East Asia 4.76 7.85 8.72 20.14 9.01 14.69
Total 100.00 100.00 100.00 100.00 100.00 100.00
Source: UNIDO Statistics compiled from International Finance Statistics (from International Monetary Fund) according to UNIDO list of countries and areas included in selected groupings in the International Yearbook of Industrial Statistics.
Taking departure from taxonomies in the international business literature, offshoring is the
location, or relocation, of business activities or functions abroad. When the transfer to a
subsidiary of the firm occurs, then FDI takes place, and this can be regarded as ‘captive
offshoring’. Outsourcing is the buying in, from a third party, of business activities or
functions, which were hitherto provided by the firm itself, that is, contracting takes place.
Outsourcing may occur across international borders — in which case, is an example of
offshore outsourcing. However, “the use of the term outsourcing has not been standardized”
[Amiti and Wei (2004, p. 4)]. A taxonomy of OO is provided in table 3 below.11
Table 3. A taxonomy of OO Location of activity Hierarchy-based (internalized) Market-based (externalized)
Home country
In-house (at home) Outsourced to third-party provider
Foreign country Within MNE subsidiary of firm (captive offshoring) � Equivalent to FDI
Outsourced to third-party provider (local firm or subsidiary of other MNE), that is, OO
An elaboration of this taxonomy from the perspective of relocation to lower-cost locations
(LCLs), is provided, inter alia, by Amiti and Wei (2004), Kirkegaard (2004), van Welsum
(2004) and Mann (2003). The definitions, and taxonomy, permit an attempt at estimating the
11 It is germane to question whether these recent terms are significantly more useful in describing international business. The increased use of the terms may be a reaction against the empirical rigour and theoretical complexities in the literature on FDI and MNEs found in leading, and more econometric, international business journals. It is arguable that the terms can lead to confusion and may actually obscure issues in managerial economics and industrial organization concerning the firm’s ‘make’ or ‘buy’ and FDI decisions.

7
global markets for SOO, within the US$1,700 billion global services export market [Morgan
Stanley (2004)].
However, the problematics of what exactly constitutes a service—and thereby SOO—with its
various limitations and balance-of-payments measurement issues suggest caution in any such
estimation. Estimates of the value of SOO are likewise complicated, by definitional
delimitations, double counting and exclusion of some services [and inclusion of others not
strictly services — more akin to manufacturing (as manufacturing services)]. Table 4—
Estimates of SOO, 2005-2015—below provides some preliminary guides and indications.
Table 4. Estimates of SOO, selected years (Billions of US dollars) 1
2005 2010 2015 Gartner (2005) 160 McKinsey (2005) 142 Hewitt (2005) 135 Deloitte (2005) 2002 3563 Amiti and Wei (2004) 181 (2002)4 Notes: 1 Compiled from RTTS Statistics related to offshore outsourcing, http://www.rttsweb.com/services/outsourcing/stats.cfm, 31 March 2005. The Compound Annual Growth Rate (CAGR) ranges from 20 to 38 per cent. 2 Business process outsourcing (BPO). 3 Financial services. 4 The top six outsourcers (business services, computer, information services) in 2002, compiled from IMF Balance-of-Payments Statistics Yearbook.
The suggested range of estimates and the range of annual growth rates indicate potential for
error in calculating the value of the global OO market in services.12 Within these estimates,
however, the market size for China is expected to grow from US$317 million [at compound
annual growth rate (CAGR) of approximately 18 per cent] in 2005 to US$451 million in
200713 [A. T. Kearney (2004a)]. In contrast, India’s market share, for example, of business
process outsourcing (BPO) was estimated at US$2.4 billion in 2002-2003 [Ernst and Young
(2003)]; and is projected to rise by approximately 17 per cent CAGR to US$3.7 billion by
2008.14 By similar token, the growth in BPO offshoring by United States’ firms is anticipated
to increase by approximately 26 per cent CAGR, from US$24 billion to US$136 billion
between 2005 and 2015 [A. T. Kearney (2003a)].
12 According to Gartner Dataquest (June 2004), the global Information Technology services market grew by 6.2 per cent in 2003 to US$569 billion.
13 The total growth figures (offshore plus domestic outsourcing market) for China are expected to be US$905 million (2005) to US$1,289 million (2007), respectively.
14 India Infoline (2004).

8
A positive, as opposed to a normative, economic perspective is adopted for analysing the
trends, patterns and emerging issues in SOO. However, this is not to deny the developmental
impact, and hence, normative implications of job ‘losses’ and ‘gains’15 as a consequence of
an industrialized country firm selecting strategically to either ‘go offshore’ and establish an
overseas subsidiary, or to outsource (production) processes or (BPO, distribution) services to
a foreign service provider.16 It is fair to indicate that relatively little controversy surrounds
FDI and market-based transactions (domestic or international). Nevertheless, associations
with job ‘losses’ that accompany coverage of OO in general, and SOO in particular—
especially that of services from the Triad economies; and OECD States to developing
countries—elicit detectable emotional responses which attempt to defy the efficiency
arguments and logic of markets. These responses are sometimes framed into legislation to
restrict public sector SOO and services importation.17
From an FDI or international contracting perspective, OO are nothing new — with one
exception. The increasing complexity of techno-economic activity, which enabled the
‘componentization’ of production, that is, the slicing up of industry stages of production and
firm value chains into different sub-stages, and their subsequent global distribution18 over
geo-economic space but within the organizational boundaries of MNEs, is now having the
same impact on services [through digitization of data, information, statistics and knowledge
and information and communications technologies (ICTs)]. The relocation of international
production beginning circa 1975 is being added to by the international relocation of services
provision. This latter trend began in earnest circa 1990 and is continuing apace.19
The problem is that the impact—no longer on labour-intensive manufacturing (blue-collar
work)—is now increasingly felt by higher value-added labour-intensive servicing (white-
collar work).20 There is a range of socio-economic consequences and implications. Some of
15 See Financial Times (28 January 2004). 16 Dehaven (2004), and te Velde. (2004). 17 According to the National Foundation for American Policy at least 36 States in the United States have
introduced over 100 legislations to restrict the importation of services [Dehaven (2004)]. 18 G. Abonyi (2000) for an elucidation of the dynamics involved in the spatial distribution of manufacturing
value added. 19 See Financial Times (20 August 2003); Business Week (3 February 2003); and The Economist (13
November 2004) for analyses of the dynamics of offshore outsourcing which involves, inter alia, research, silicon chip design, engineering and financial analysis.
20 Between 2003 and 2004, 221,000 high-tech jobs in the United States were ‘lost’ to outsourcing, according to the U. S. Department of Labor Bureau of Labor Statistics [cited in Electronic Design (2005)].
9
these are analysed well, quite a number are weighed somewhat sensationally21 without due
acknowledgement to the macroeconomic case for either the efficiency and welfare gains that
arise from contracting, or the trade gains of FDI that arise from the empirics of revealed
comparative advantage. The economic ‘assault’ on white-collar service work is not trivial in
consequence. SOO represents, at a global level, dynamic structural change in the allocation of
resources and the international re-division of labour because of the relative cost profiles of
different competitive advantages [Porter (1990)]. Underlying this change are certain ‘drivers’
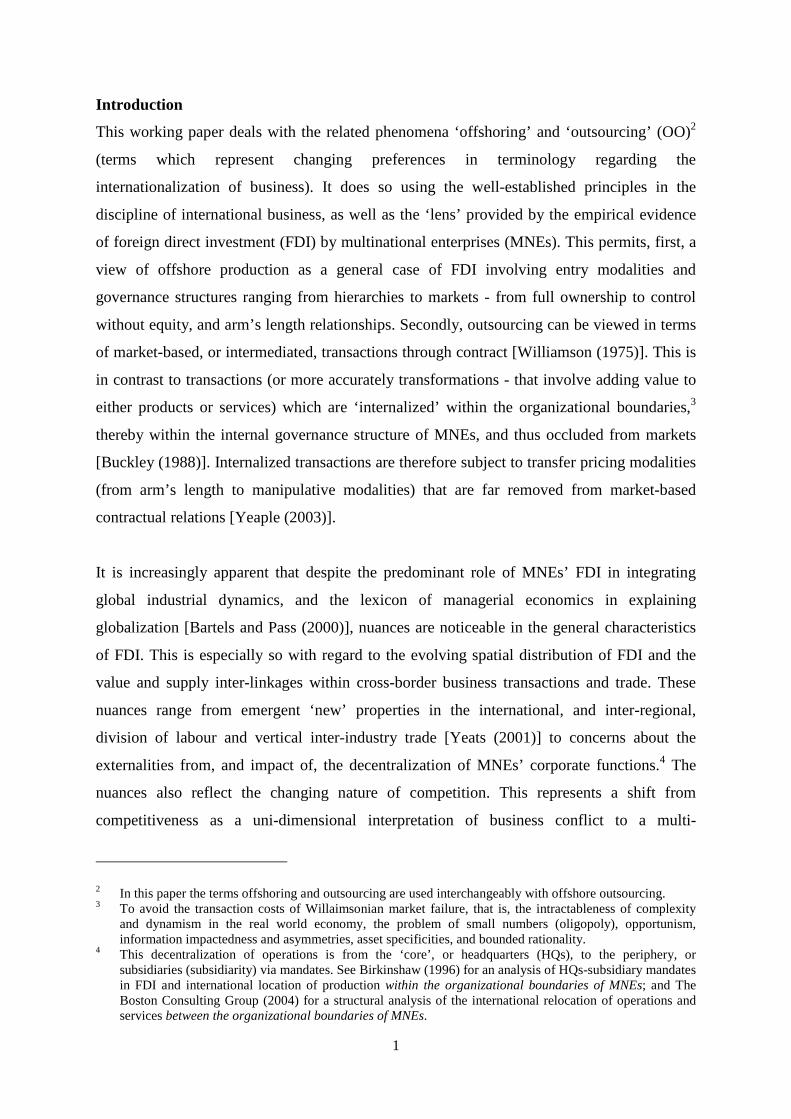
reinforcing the major factors referred to earlier. They are:
(i) the relatively rapid ageing profile of Triad economy populations;
(ii) rising skills profile22 of emerging markets economies in terms of productivity
adjusted costs of labour;23
(iii) digitization of services, and services provision, as ICT enabled services;
(iv) massive increase in ICT capacity;24
(v) widespread use of networked computers as a consequence of falling price of
computing power;25 and
(vi) increased market access.
The impact on white-collar jobs may be viewed as serious.26 However, when the balance-of-
payments dynamics of SOO is subjected to rigorous econometric analysis, the evidence does
not support the anxiety over job ‘losses’. In fact, the empirical data confirms that the
industrialized countries dominate overwhelmingly the ranks of SOO providers as well as the
21 Daniel Daianu (January 2005). 22 According to the U. S. National Science Foundation the world distribution of engineering graduates in 1999
was: China (21 per cent); European Union (15 per cent); Japan (11 per cent); Russia (9 per cent); India (9 per cent); and United States (7 per cent).
23 Low-cost countries have average hourly wage rates of less than US$5 compared to US$20 in OECD countries, according to The Boston Consulting Group (2004b).
24 As a direct result of the telecom infrastructure investment boom of about US$300 billion in the 1990s in anticipation of demand for the ‘information super highway’.
25 This steady drop in the price of computing power has been going on since at least 1910. Computing speed per dollar has doubled every three years (1910-1950), then every two years (1950-1965), and then every year (1966-2000). Accompanying this has been the falling costs of telecommunications hardware such as fibre optic cabling – in India, for example, which have fallen by 90 per cent since 1997 [The Economist, 13 November 2004].
26 To give an idea of the attention being focused on SOO, from January to May 2004, there were 2,634 reports in United States newspapers mostly highlighting the potential job losses. The United Kingdom had 380 reports in the same period [Amiti and Wei (2004)]. According to Gartner Inc., 30 per cent of technology jobs in the United States’ are ‘at risk’ from OO [Information Week, vol. 1033, 4 April 2005, p. 16]. The potential losses are not confined to the United States – reported production shifts out of the European Union amounted to over 40,000 in the first quarter of 2004 [Institute for International Economics, (2005)].

10
ranks of in-sourcing, that is, in both the exports and imports of services27 [Amiti and Wei
(2004, Tables 2 and 4)]. In other words, industrialized countries, far from outsourcing, are in
the position in which the rest of the world outsources more to them than the reverse.28
2. The Macroeconomic Context
There is little doubt that SOO have become increasingly complex not only in terms of
business decision-making, but also in terms of the consequent organizational articulation and
configuration necessary for implementing SOO decisions and strategies.29 It is crucial to
realize that the SOO phenomena is not new and has been an integral part of industrial logic
since the antecedents of the modern industrial revolution circa 1750 AD [Moore and Lewis
(2000)]. It is beyond the scope of this present paper to trace either the classical and neo-
classical economic arguments for specialization leading to wealth creation or the benefits of
‘Schumpeterian’ competitiveness, strategy and innovation. There is sufficient literature on
this subject [Ricart et al. (2004); Ghemawat (2002)]. Suffice it to say the macroeconomic
case for OO lies in arguments that point to increased trade in manufactures and services,30
cost reduction and increased productivity [Swenson (2004); Dunning (2003); Williamson
(1975)].
FDI, international subcontracting31 and OO represent the growth of international
specialization in the world economy in general, and increasing vertical intra-industry trade
within, and between, MNEs in particular [Antràs and Helpman (2003)]. To illustrate this
reality of industrial economics, the production of an “American” car is now so spatially
distributed—using various modalities of FDI, foreign market servicing strategies and SOO—
that 30 per cent of the car’s value is generated in the Republic of Korea, 17.5 per cent in
Japan, 7.5 per cent in Germany, 4 per cent each in Taiwan Province of China and Singapore,
2.5 per cent in the United Kingdom and 1.5 per cent each in Ireland and Barbados. This
27 The United States and the United Kingdom have run the world’s largest and second largest surpluses in services trade recently.
28 To put this into perspective, the United States services exports amounted to US$300 billion in 2002 compared to US$62 billion in services exports by both China and India combined [Dehaven (2004)].
29 See Paul J. Davies, Financial Times (18 April 2005) for a view of the difficulties in managing risks in OO; and William R. King, (2005) for an appreciation of the increasing value-added capabilities of third-party services providers and the management challenges these impose for outsourcers.
30 Deloitte Research (2003). 31 UNIDO SPX programme [www.unido.org/spx] encourages the formation of subcontracting networks and
clustering to enhance the rates and levels of specialization in developing countries thereby enabling leading industrial sectors and their firms to premium price as a function of specialization.

11
means that “only 37 percent of the production value ….. is generated in the United States”
[WTO (1998), cited in Antràs and Helpman (2003)]. This is the reality of the global factory
(GF) [Bartels (2005a); Buckley (2003)].
The rate of growth in the international disintegration of production and services, that is, an
increase in intermediate inputs [Fukao, Ishido and Ito (2003); Ito and Fukao (2003)], now
outpaces world trade growth. The disintegration, spatial distribution of production and SOO,
through technological advances and digitization, respectively [Bartel, Lach and Sicherman
(2005)], is counter-balanced by the integration of global trade.32 The integrating vectors of
the global economy are five-fold:
(i) since the 1960s, the rate of world trade growth has outpaced that of world
output growth;
(ii) between 1980 and 2000, the rate of FDI growth outpaced that of world trade
growth;
(iii) approximately three-quarters of world trade are held internally within the
international operations of MNEs.33 This is manifest as geo-spatially
distributed and operationally integrated, and managed as cross-border
collaborative intra- and inter-firm relations;
(iv) the growth of vertically integrated intra-industry trade, which accounts for
about 30 per cent of world trade, at about 40 per cent since 1975, has outpaced
that of FDI growth;34
(v) the growth of financial capitalism which has outpaced world output growth (at
least until ‘the great recession’ of 2008 arguably). That is, the ratio of global
financial assets to annual world output has soared from 109 per cent in 1980 to
32 Usefully described in terms of global value (or supply) chains as integrated international sourcing, technology, production, marketing and servicing networks with fourth- to first-tier suppliers under the (hierarchical) governance of leading buyer or supplier MNEs that constitute international trade.
33 Approximately 61,000 MNEs with over 900,000 subsidiaries spatially distributed within geo-economic space operationally constitute 65 per cent to 75 per cent of international business and world trade, according to UNCTAD, World Investment Report 2004 and World Investment Report 1995. This geo-spatiality is operationalized in part as cross-border collaborative inter-firm relations (mergers and acquisitions, joint ventures, strategic alliances, etc.)
34 See Dicken P. (2003); David Hummels, Jun Ishi and Kei-Mu Yi (1999); and UNIDO (2003a) for the growth of vertical specialization as share of exports at between 26 per cent and 82 per cent from Australia, Canada, France, United Kingdom and United States from 1970 to 1990.

12
316 per cent in 2005. In 2005, the global stock of core financial assets
reached $140,000 billion.35
MNEs, FDI, export-import trade in intermediate products and SOO, as well as the finance
capital that enables global trade, have therefore become the preponderant integrating factors
in the world economy. Furthermore, trade in intermediate products and SOO resulting from
FDI have become significant in improving the efficiency of resource allocation,
specialization, value-chain disaggregation and productivity in higher-cost locations (HCLs)
as well as LCLs [Feenstra (1998)]. Within this overall set of vectors, and given the increased
levels of liberalization (de-regulation) in the world environment (up to at least 200836) for
investment and trade, empirical evidence—which points to the shape of things to come—
suggests that the rate of growth of OO by United States’ firms since 1999 has outpaced the
growth of their foreign intra-firm sourcing [Antràs and Helpman (2003)].
Discussion of the macroeconomic context for SOO needs to consider also the
internationalization of firms and the ‘conflict of markets’ [UNIDO (2003b)] in intermediating
international involvement of firms.37 This means that, in parallel with the profusion of
regional trade agreements from less than five in 1960 to over 250 in force in 2002,
harmonization and integration of regional policies, as well as national employment, training
and their associated fiscal policies are crucial for the effective attraction of SOO. The gradual
reduction of barriers to factor mobility has given rise to integrated international sourcing,
technology, production, marketing and servicing integrated international networks (IINs)—
referred to as the global factory (GF)—in which SOO takes place. Empirical studies [Antràs
and Helpman (2003)] indicate that higher productivity MNEs source intermediate inputs from
developing countries — LCLs. In contrast, lower productivity firms outsource to
industrialized countries. The implications for the spatial distribution of SOO are an overall
reduction of the trading costs of intermediate products.
35 See “Unfettered finance is fast reshaping the global economy”, Martin Wolf, Financial Times, 18 June 2007. 36 See “Reform the architecture of regulation”, Henry Paulson, Financial Times, 18 March 2009, p. 9, for a
view of the rebalancing of policy towards re-regulation of capital and financial markets. 37 Whereas capital and financial markets are truly global in space and time, markets for goods and services are
overwhelmingly regional. In contrast, labour markets are predominantly national. Therefore SOO are predictably regional, or inter-regional, and are correlated with the regional characteristics of FDI flows and stocks. This carries major implications for policy.

13
The asymmetries in global inward FDI flows reflect those in SOO, and vice versa, and the
growth trends in SOO are unmistakable — notwithstanding the definitional issues and
measurement problems mentioned earlier. The partial migration of services from relatively
HCLs to LCLs, taking into account relative labour flexibilities and productivity adjusted
costs of labour across LCLs, is set to continue. And the General Agreement on Trade in
Services (GATS) is bound to accelerate the phenomenon. The current, and changing,
spatiality of industrial activity and its distribution across geo-economic space presents global,
as well as national, policy challenges for the role of FDI in general, and especially that of
SOO in industrialization.
3. The Spatiality of Offshore Outsourcing
Mapping the world of SOO is not an easy task. According to Antràs and Helpman (2003)
systematic analysis of the phenomenon is not readily available. Various proxies can be
evoked to illustrate the overall pattern and spatiality of the activity. One such proxy is the
number of industrial sectors in which firms operate. For United States’ manufacturing firms,
the number of four-digit international standard industrial classification (ISIC) sectors has
declined from an average of 2.72 to 1.81 between 1979 and 1997 [Fan and Lang (2000)].
This means less concentration and an increased dispersion of industrial activity. The
aggregate services that can be subject to OO range from items such as call centres, shared
service centres, BPO, value-added distribution and logistics, and research and development
(R&D), to any ‘knowledge work’ [Drucker (1989)] that can be digitized using ICT enabling
services (itself a service that is subject to OO). Each item has its own organizational
propensities in terms of strategy, operations and management, and relations between principal
and agent. It is the technological dimensions of these items which make circumscribing SOO
prone to multiple difficulties. Technologies and innovations are continuously expanding, and
thus changing the range of economic activities that can be digitized and are therefore subject
to OO.
Most probably, the most accurate indicators, or predictors, of the patterns in SOO are world
flows of inward FDI; and the balance-of-payments identities of trade in services. However,
these rather dry statistics arguably reflect neither the characteristics of locational dynamics
nor the evident asymmetries in the different spatial distributions of items of SOO across the
world. Furthermore, they do not reflect well the fact that FDI and international subcontracting
are subject to different policy and regulatory regimes across countries hosting SOO.

14
Nevertheless, such a view of global FDI flows demonstrates ‘gravitational’ asymmetries with
transatlantic and transpacific economies as global centres, while South and East Asian
economies dominate as centres in the global periphery [Krempel and Plümper (2003);
UNIDO (2005, 2003a)]. This view also reflects the internationalization and spatial
distribution of economic activity of MNEs, which has been sequential both in the
‘nationality’ of MNEs and in the geo-economic space occupied by them.38 This sequential
distribution has dynamized South and East Asia to the point that China, India and South-East
Asian economies have begun to capture most of the market for manufacturing and SOO
[Balasubramanian and Padhi (2005); Gandossy and Kao (2005); Meredith (2005); Deloitte
Research (2003)].
The gravitational asymmetries [Anderson and Wincoop (2001a, 2001b)] manifest at the
global level are reflected, at the micro-industrial level, by the functional integration of MNEs
HQs—subsidiary management, according to mandates for operations within IINs across
regional economic space [Giroud and Mirza (2004); Giroud (2003)] and the consequential
cluster of linkages that characterize industrial activity in South-East Asia [Fukao, Ishido and
Ito (2003); Ito and Fukao (2003)]. In recent years, increasing competition has been observed
for diminishing levels of global FDI.39 Simultaneously, there is increasingly dynamic cross-
border configuration, reconfiguration and articulation of the manufacturing assets and
servicing operations of international investors. The increasing complexity of FDI is
demonstrated by the integrated international sourcing, technology, production, marketing and
servicing networks of MNEs as inter-connected systems which are geo-economically and
spatially distributed. Furthermore, the distribution and performance of these networks are
operationally and contemporaneously managed through strategic relations (communication,
cooperation, coordination, command and control) between subsidiaries and third-party
suppliers using ICTs.
38 A long perspective of the international business of FDI (and manufacturing and services offshoring and outsourcing) since 1960 indicates stylistically (notwithstanding resource-seeking FDI in the Middle East and Africa) that these sequences are, respectively, MNEs from (a) North America, (b) Europe, (c) Japan, (d) South-East Asia, and (e) Brazil, Russia, India, China and South Africa; to areas of the (i) Transatlantic, (ii) Transpacific, (iii) South and East Asia (including the Indian Ocean Rim (IOR)), (iv) Latin America.
39 Global levels of inward FDI have fallen since the peak of US$1,400 billion in 2000, through US$800 billion (2001) and US$700 billion (2002) to US$560 billion (2003); and preliminary estimates suggest a modest increase to US$612 in 2004 according to UNCTAD (2005) before rising to another peak in 2007 of $1,833 billion [UNCTAD (2008)].

15
The systemic nature of MNEs networks leads to the emergence of asymmetric properties of,
and synergistic relations between, the constituent elements (HQs, regional HQs, subsidiaries
and outsource partner firms, etc.). In concert, the various network nodes responsible for
manufacturing value added transformations, and the inter-relationships accountable for
economic transactions, comprise what has been referred to as the ‘global factory’ (GF)
[Buckley (2003)]. This is illustrated stylistically in figure 1 below.
Figure 1. The Global Factory
DesignContractor
DesignEngineering
BrandingMarketing
BRAND OWNERBRAND OWNER
R&DContractor
CORE, NONCORE, NON--CORE FUNCTIONSCORE FUNCTIONS
Outsourced Parts Supplier
Hi-Tech Contract
Assembler
Low-Tech Parts
Supplier
Med-Tech ContractAssembly
Med-Tech Parts
Supplier
Low-tech PartsSupplier
Med-Tech PartsSupplier
DISTRIBUTED MANUFACTURINGDISTRIBUTED MANUFACTURING
Final Assembly, Adaptation,
Warehousing,Distribution
&Logistics
LOCAL LOCAL MARKET MARKET
ADAPTATIONADAPTATION
Hi-Tech Parts
Supplier
EngineeringContractor
INTEGRATED INTERNATIONAL INTEGRATED INTERNATIONAL SOURCINGSOURCING, , TECHNOLOGYTECHNOLOGY, , PRODUCTIONPRODUCTION, , MARKETINGMARKETING
& & SERVICINGSERVICING NETWORK OPERATIONSNETWORK OPERATIONS
FTZs
‘BORDERS’INTERNATIONAL,INTERNAL, INTRA-REGIONAL
THE INTEGRATED GLOBALGLOBAL FACTORYMNEsMNEs DISTRIBUTEDDISTRIBUTED OPERATIONS & SPATIALLY OPERATIONS & SPATIALLY COCO--ORDINATEDORDINATED FUNCTIONSFUNCTIONS
BPO
3PL
3PL
From the perspective of SOO, the key aspects of the GF are the intermediation of design,
R&D and engineering contracting, as well as BPO and third-party logistics40 in enabling the
flow of competitive innovation from supplier to market. The GF is co-evolving with the
policy environment. It is characterized by inter-changeability and is in dynamic tension with
its internal constituents, as well as with external forces of competition and cooperation. Thus
40 Depicted within the triangles in figure 1.

16
the shape, boundaries and extent of the GF and the industrial landscape it inhabits (and
forms) are continuously changing, resulting in a highly complex system that approaches ‘self-
organization’41 [Dagnino (2004); Fioretti and Visser (2004); Price (2004); Urry (2003);
Walby (2003); Krugman (1996)].
The complexity of the GF is therefore increasingly difficult to view through isolated
economic and management disciplines. It is even more testing to capture in terms of data and
information, as well as policy research and analysis, investment promotion, policy design and
implementation. This is especially so for developing countries and is due partly to the rapidly
changing characteristics of industry competition and factor markets, and partly to the
inadequate levels of capacity-building in some developing countries. Competition is evolving
into more internationally collaborative forms [Dunning (1997)]. Developing countries in
general, and particularly those marginalized from FDI flows and SOO, often lack high-
resolution instruments to calibrate and recalibrate their policies fast enough to keep pace with
the rapidly changing context and dynamics of the GF, international production and markets.
The dynamic changes in the spatial distribution of SOO are both absolute and relative, with
particular industrialized and developing country vectors. Given the GF and its relationships
with IINs, in absolute terms, the biggest outsourcers (and also insourcers) are the United
States, European Union, and the United Kingdom [Amiti and Wei (2004)]. China and India,
the focus of so much recent economic press coverage, are surprisingly ranked fourteenth and
sixth, respectively, as hosts to SOO [Amiti and Wei (2004)]. In relative terms, that is,
outsourcing (or insourcing) as a ratio of source (host) gross domestic product (GDP), China
and India as hosts to SOO are ranked seventy-ninth and twenty-first, respectively. This shows
that despite press attention to SOO, the shift, or export, of jobs to China and India42 is not
occurring at a rate, which a casual examination of the literature suggests as very rapid. This
situation is exemplified in table 5—Outsourcers—which shows the predominance of the
relatively HCLs of the industrialized countries.
41 Phenomena which appear to determine their own form and processes. 42 See M. Leanne Lachman (2003/04).

17
Table 5. Outsourcers, 2002
Rank
Country
Business services (BP) (millions of US dollars)
Rank
Country
Computer and info. services (millions of US dollars)
1 United States 40,929 1 Germany 6,124
2 Germany 30,13 2 United Kingdom 2,602
3 Japan 24,714 3 Japan 2,148
4 The Netherlands 21.038 4 The Netherlands 1,586
5 Italy 20,370 5 Spain 1,572
6 France 19,111 6 United States 1,547
9 United Kingdom 16,184 9 France 1,150
11 India 11,817 10 China P.R. 1,133
18 China P.R. 7,957 14 Russia 592
20 Russia 4,583
Source: IMF Balance-of-Payments Yearbook, cited in Amiti and Wei (2004). Fear of Service Outsourcing: Is it Justified? NBER.
Nevertheless, the emerging markets of the Indian Ocean Rim (IOR) and China are beginning
to attract SOO significantly; and this represents a potentially huge rate change in the next
decade. In this regard, regional and bilateral trade agreements entered into by these countries
have to be very carefully implemented and cohered in order to avoid regulatory
inconsistencies and the ‘spaghetti bowl’ problem of rules of origin and harmonization of
investment and trade provisions across the free trade areas which impact SOO [Bartels
(2004); Soesastro (2003)]. To illustrate that the industrialized countries also dominate
insourcing, table 6—Insourcers—indicates again the relatively lower rank of China vis-à-vis
India.
Table 6. Insourcers, 2002
Rank
Country
Business services (BP) (millions of US dollars)
Rank
Country
Computer and info. services (millions of US dollars)
1 United States 58,794 1 Ireland 10,426
2 United Kingdom 36,740 2 United Kingdom 5,675
3 Germany 27,907 3 United States 5,431
4 France 20,864 4 Germany 5,185
5 The Netherlands 20.074 5 Spain 2.487
6 India 18,630 10 France 1,191
8 Japan 17,401 11 Japan 1,140
14 China P.R. 10,419 12 China P.R. 638
29 Russia 2,012 25 Russia 137
Source: IMF Balance-of-Payments Yearbook, cited in Amiti and Wei (2004). Fear of Service Outsourcing: Is it Justified? NBER.

18
The gravitational asymmetries of world trade, and the cluster of hosts to SOO, indicate trends
with three broad patterns in the spatiality of OO. First, the Triad economic space has a
persistent predominance in outsourcing and insourcing. This is unlikely to change in the short
term. Secondly, there is a continuing shift in the global functions of the GF—oriented to both
manufacturing and services—to South and East Asia. The rate of this shift, in terms of CAGR
of SOO, is between 20 per cent and 40 per cent, depending on the specific type of service43 (it
should be borne in mind that while these figures seem high, they start from relatively low
levels).
The bulk of market share is likely to be taken in the future by China and India — with China
specializing in manufacturing services and ICT servicing, while India specializes in BPO,
ICTs and back-office functions. Thirdly, apart from a few exceptions,44 the developing
countries of Sub-Saharan Africa, Latin America and the least developed countries will remain
largely marginalized and isolated from this ‘third wave of globalization’ [Moore and Lewis
(2000)]. These trends and patterns in SOO are underpinned by the industrial logic of FDI.
The ‘drivers’ of SOO referred to earlier are the imperatives of achieving operational cost
savings—which in turn are a function of the productivity adjusted cost of labour in LCLs—
and gaining increased competitiveness.45
As competitiveness is ultimately a function of the combination of costs (resource utilization
efficiencies) and technological applications (innovation effectiveness), it is not surprising that
SOO is presently dominated by OECD countries and the emerging economies of South and
East Asia. These economies demonstrate superior performance46 in both categories of
competitiveness relative to others [UNIDO (2002)]. This is not to say that countries such as
South Africa and Australia, for example, are not significant in the spatial distribution of SOO
[Deloitte Research (2003)].
With respect to South and East Asia and the IOR, different countries are beginning to
specialize, with different policy objectives and policy instrument (PIs), in different types of
43 BPO CAGR is calculated as being approximately 9 per cent by NASSCOM, India. 44 Francophone call centres in Senegal, for example. 45 According to Roland Berger Consultants/UNCTAD (2004), a survey of 20 per cent of EU top 500 firms by
revenue, more than 80 per cent of respondent firms report cost savings of between 20 per cent and 40 per cent as a result of SOO.
46 See UNIDO (2002) Competitive Industrial Performance Index for various countries.

19
SOO. Regarding front/back office operations SOO, China, Malaysia, Philippines (and
Australia) are significant hosts. As with call centres and shared service centres, the dominant
hosts are found in the IOR. Financial SOO are hosted, in the main, by China, Hong Kong
(Specially Administered Region of China), Singapore and the United Arab Emirates. The
imperative to simultaneously reduce costs and move up the value-added ladder, means that
MNEs are increasingly using market and quasi-market mechanisms to transact product
development research. As a result, contract R&D (for product adaptation and development
rather than fundamental R&D) is increasingly performed in Australia, China, India,
Singapore and Taiwan Province of China.
This concentrated spatiality for routine office operations, financial services intermediation
and product R&D is in contrast to the wider spread of SOO regarding HQs.47 As a reflection
of the different market strategies pursued by different MNEs, HQs are spatially concentrated.
And again, with SOO oriented to distribution and logistics, the spatial distribution is globally
not as concentrated as BPO services and its associated business functions. The predominant
pattern in SOO reflects the underlying pattern of global value chains (GVCs) and supply
linkages of the nodal points in world FDI and trade flows. This is a persistent pattern, which
has recent nuances in the flows of FDI to China and outsourcing to India. Despite the contrast
in terms of FDI to China and India,48 these two countries appear to dominate discussions on
SOO.49
4. China and India Compared and Contrasted
A detailed socio-economic and technological ‘benchmark’ comparative analysis of these two
emerging market economies is beyond the scope of this present working paper. This section
points out the relative evolving merits of the two locations as hosts to SOO along a few key
macro- and micro-economic dimensions which represent:
47 According to UNCTAD (2004), between 2002 and 2004, over 1000 product R&D projects were offshored (involving both FDI and contract transactions). Most (739) were offshore outsourced to developing countries and countries with economies in transition; of which 563 were relocated in South and East Asia – with China and India gaining significantly. However, it should be recalled that the spatial distribution of R&D subsidiaries in 2004 favours numerically and overwhelmingly the industrialized countries: EU (1,387); United States (552); Japan (29); compared to Africa (4); Latin America and the Caribbean (40); South and East Asia (423).
48 Notwithstanding some measurement issues, China is hosting about US$50-60 billion FDI annually in contrast to India’s US$4-5 billion which in 2000 translated, respectively, in net FDI terms, to 3.9 per cent and 0.5 per cent GDP [A. T. Kearney (2003b); The Economist (2005)].
49 See A. T. Kearney (2004b).

20
(i) the ability to do business in the location, that is, comparative transaction costs;
(ii) the comparative investment climates;
(iii) comparative investor perceptions;
(iv) SOO decision-making; and
(v) UNIDO’s Competitive Industrial Performance (CIP) Index.50
The comparative analysis presented yields a number of broadly contrasting findings between
reality and perception.51 This has major implications for policy objectives, the policy regime
and PIs for attracting SOO. From the outset, the complexities of China and India should not
be underestimated, either in economical or institutional terms. Both countries are emerging
through economic transition towards the social market with legacies that are, to say the least,
challenging from a policy perspective. The complexities caution against a simplistic
interpretation of quantitative statistics and call for a deeper understanding of the underlying
socio-economic factors that determine business behaviour and the efficiencies of the
commercial environment in both countries.
As FDI and associated SOO are ultimately business decisions executed by independent
economic actors, the host locations, the transaction costs and the perceptions thereof, are of
paramount importance to the decision. Across a selected range of key variables pertinent to
transaction costs,52 China outperforms India. On average, the indices for China are twice as
better than those for India. In some cases, such as cost (percentage of per capita income) of
starting a business, cost (percentage of property value) of registering property and time to
resolve bankruptcies (years), China’s indices are over three and four times, respectively,
better than those of India. On the face of it, therefore, the regulatory environment constrains
business much more in India than in China, thus raising transaction costs to higher levels in
India relative to China.53 This is contrast to some reports on institutionally-related transaction
50 UNIDO (2002), Tables A3.1 and A3.2, pp. 177-180. 51 The volume of publications and benchmarking studies on China and India sometimes present contradictory
assessments of respective performance. 52 Starting a business, employing staff, property registration, contract enforcement, and closing a business
(resolving bankruptcies) [World Bank (2005)]. 53 As an example of relatively higher transaction costs in India, The Economist (2005), refers to the Bangalore
paradox of booming SOO and poor infrastructure adding to transactions costs.

21
costs in China [Clissold (2004); Morgan Stanley (2004)]. Subcontracting to China poses
some challenges that put upward pressure on transaction costs.54
A comparison of the two locations, from an FDI climate perspective, tends to confirm the
relative transaction costs across a selection of variables that capture the efficacy and
effectiveness of the investment climate. Again, China outperforms India in governance
(controlling corruption, political stability, time spent by senior management with
government) but not in the category, rule of law. In terms of cost of capital, infrastructure
(percentage share of firms with own generator) and availability of SOO suppliers, China
outperforms India between two and five times [World Bank (2003)]. China’s apparently
superior performance, in transaction costs and investment climate, is further consolidated by
the FDI Confidence Index [A. T. Kearney (2004b)] which places China in first, and India in
third, position in the ranking.
And yet, investor perceptions of senior corporate strategists from the world’s 1,000 largest
MNEs suggest that India outperforms China across the variables of (LSAs) crucial for
business, and reflects the human resources, managerial capacity and capability, rule of law,
transparency, socio-cultural barriers and the regulatory environment.55 The contrast of China
in first place in the FDI Confidence Index to its position relative to India in the ‘where to
locate offshore business processing’ is stark [A. T. Kearney (2004d)]. In all 11 cross-country
comparisons56 of composite cost, environment and people factors, India is rated first and
China eleventh. In terms of BPO, India outperforms China at 3.4 to 3.1; so too on
environment scores at 1.6 to 1.1. And again on the people factor alone, India is in first
position with a score of 2.3, in contrast to China’s eleventh position with a score of 1.0.
Again, in contrast to transaction costs and investment climate comparisons, in which China
outperforms India, the perception by investors of risk variables is greater for China than
India. Table 7—Investor perceptions of risk in China and India—shows the better
performance of India.
54 See Financial Times (2005) for an analysis of some of the problems for consumer MNEs sourcing from China.
55 Fifty-seven per cent of investors perceive India as having a more conducive and hence attractive, regulatory environment in contrast to 43 per cent for China [A. T. Kearney (2004b, p. 4)]; Ernst and Young (2003), which refers to India as “the preferred outsourcing destination”.
56 India, Canada, Brazil, Mexico, Philippines, Hungary, Ireland, Australia, Czech Republic, Russia and China.
22
Table 7. Investor perceptions of risk in China and India Percentage of investors perceiving high risk
Rank high risk
FDI confidence variable China India 1 Legal, regulatory environment 73 58 2 Corruption, lack of transparency 66 36 3 IPPRs,1 piracy 56 35 4 FOREX,2 capital controls 51 27
Notes: 1 Intellectual Property Protection Rights. 2 Foreign exchange. Source: A. T. Kearney, FDI Confidence Index, 2004b.
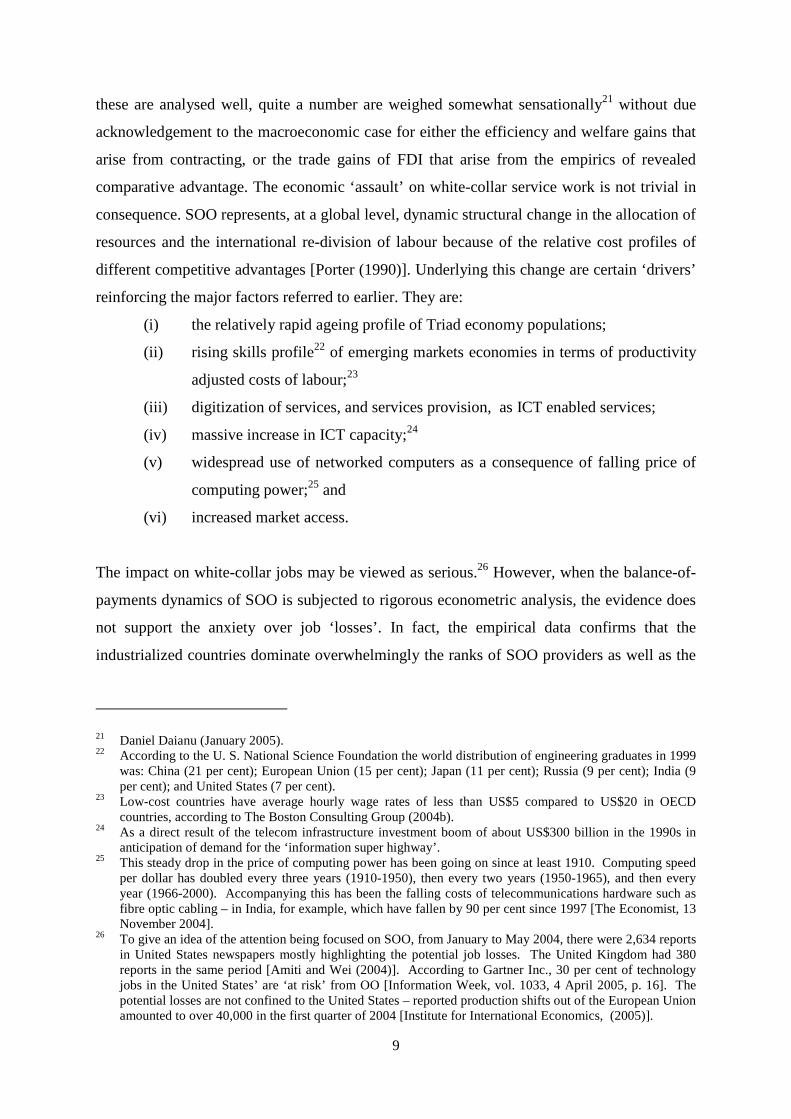
The contrasts in comparisons of China and India in which China outperforms India in
quantitative measures, and vice versa in qualitative measures, of LSAs raises interesting
questions and points for consideration. Notwithstanding methodological issues of reliability,
reproducibility and validity in these measures, do the quantitative statistics conceal
inconsistencies or rigidities in China’s implementation of policy? Are there quantitative
differences between officially-communicated variable measures and actual measures? Does
the ‘on-ground’ actual business experience of MNEs and investors influence their responses
to surveys? What is the extent of intra- and inter-country correlation among the relevant
variables across the benchmarking surveys?57 The answer to the last question would point to
the significance of the FDI and SOO inflow elasticities of the variables [Christiansen (2004)]
for policy decision-making. And to what extent do the qualitative statistics conceal
managerial and operational flexibilities in India’s business environment? In the business of
FDI and SOO, what is relatively more valuable — efficiency (doing things right), or
effectiveness (doing the right things)? Investor perceptions of variables not related to market
size suggest that effectiveness may be more valuable, at least in the short to medium term.58
Perhaps a more revealing comparative dimension of relative performance in SOO regarding
China and India is the offshore decision itself. Table 8—Offshore decision-making location
performance—indicates the relative performance of the two locations on key decision
variables.
57 See A. T. Kearney (2004b); A.T. Kearney (2004); Fraser Institute (2004); Heritage Foundation (2005); Transparency International (2004); UNDP (2003); UNIDO (2002); World Economic Forum (WEF) (2000); World Bank (2005).
58 At a broader level, China’s specialization in manufacturing FDI and India’s on SOO carry different implications for structural adjustment and the ability of industry to manage assets and the periodic transitions up the value-added ladder [See Martin Wolf, India and China, Financial Times (2005)]; and according to The Economist (2004) the global market for white-collar work, India “rules supreme”.

23
Table 8. Offshore decision-making location perform ance 1 Offshore decision-making variable China India Human resource skills (‘people’ score) 1.36 2.09 Business environment (‘business’ score) 0.93 1.31 Financial structure (‘financial’ score) 3.32 3.72 Employee retention NA2 0.13 Language skills 0.07 0.21 Education 0.21 0.25 Labour market availability 0.60 0.47 BPO experience 0.48 1.03 Intellectual property protection rights NA2 0.18 Cultural adaptability 0.10 0.10 Infrastructure 0.15 0.20 Country risk 0.68 0.83 Tax and regulatory environment 0.09 0.30 Infrastructure costs 0.23 0.23 Compensation 3.00 3.19 Notes: 1 - Measured on a Weighted Likert Scale 1 to 4 (1 = Poor and 4 = Good) hence some scores below 1. 2 - Not Available. Source: A. T. Kearney (2004c).
China outperforms India in the eyes of investor SOO decision-making in only one category—
labour market availability—notwithstanding emerging labour shortages in China’s Pearl
Delta Provinces [A. T. Kearney (2004b)].
In considering the UNIDO Competitive Industrial Performance (CIP) Index, table 9 discloses
the competitiveness of the respective national industrial capabilities—in terms of industrial
capacity (quantity of output performance) and industrial complexity (ability to upgrade the
quality of output performance)—and indicates the superior performance of China over the
decade 1985 to 1995. While India outranked China in the 1980s, by the mid-1990s, China
had begun to outpace India in industrial complexity. This implies a potential for China to
continue adding to its ability to attract especially manufacturing OO and to a lesser extent
SOO for the reasons indicated earlier.
These findings point to the complexities involved in assessing the relative merits of China
and India as SOO destinations. Two further comparisons, with qualifications, assist in
drawing some tentative conclusions. A measure of the attractiveness as offshore destinations
of 25 countries’ correlation of ‘Business’ and ‘People’ scores with ‘Financial’ score places
China in quadrant High Financial-Low Business/Low People.59 In contrast, India is in the
High Financial-High Business/High People quadrant [A. T. Kearney (2004c)] — and is the
only country out of the 25 in this quadrant. Out of 115 leading MNEs, 67 per cent have
59 Along with (in descending order of attractiveness) Malaysia, Brazil, Mexico, Argentina, Philippines, Russia, Thailand, Turkey and Viet Nam.

24
offshore operations in India in contrast to 35 per cent in China.60 The risk perception profile
appears higher for China than India.
Table 9. Ranking of economies by basic indicators of industrial performance and by Competitive Industrial Performance (CIP) Index, 199 8 and 1985
Index of Competitive Industrial Performance 1998 Economy (Overall CIP Index Rank in 80 countries)
Manufacturing value added per capita index (a)
(a)+ Manufactured exports per capita
index (b)
(b)+ Share of medium- and high-tech activities in
manufacturing value added index (c)
(c)+ Share of medium- and high-tech products in
manufactured exports- final index (d) – Overall CIP Index
China (37) 0.034 0.019 0.017 0.126 India (50) 0.007 0.004 0.004 0.054 Index of Competitive Industrial Performance 1985
Economy (Overall CIP Index Rank in 80 countries)
Manufacturing value added per capita index (a)
(a)+ Manufactured exports per capita
index (b)
(b)+ Share of medium- and high-tech activities in
manufacturing value added index (c)
(c)+ Share of medium-and high-tech products in
manufactured exports- final index (d) – Overall CIP Index
China (63) 0.024 0.012 0.011 0.021 India (50) 0.009 0.005 0.004 0.034 Source: UNIDO Scoreboard data set, UNIDO Industrial Development Report 2002/2003.
However, an alternative, and perhaps an even more useful, view of China and India is not at
the country level but at the level of dynamic cities—in the sense of Marshallian industrial
districts61—which are the actual hosts to SOO. This view reduces the two giants to a handful
of dynamic cities, which dominate SOO in the South and East Asian developing countries.62
At this industrial district level of analysis, the metropolitan differences between China and
India, across the variables examined, are most probably much less than the quantitative
statistics and qualitative perceptions suggest. And this seems to converge with the view that
in overall macroeconomic performance China has advantages over India, but in micro-
economic performance India has advantages over China.63
5. Services Offshore Outsourcing - Impacts and Implications
The impacts and implications of the vector dynamics in SOO are potentially profound for
developing country hosts. These are essentially the same as for FDI for which there is a rich
60 The industries include: communications; high-tech; automotive; chemicals; consumer goods; and financial services [A. T. Kearney (2004c)]. This is notwithstanding the acknowledged role of FDI in China’s export performance, which is approximately six times that of India.
61 Marshall (1920). 62 China’s Beijing, Dalian, Hong Kong SAR, Shanghai (in which about a 1,000 start-ups in 2002 were in
services industries), Shenzhen, Taipei TPC; and Cheng Du, Hangzhou, Wuhan and Xi’an. India’s Bangalore, Chennai, Delhi, Hyderabad and Mumbai.
63 See Newsweek, Fareed Zakaria (2005).

25
body of literature dating back to the late 1950s available to inform policy.64 The impacts and
implications are invariably, first, oriented to the balance of costs and benefits of, and to the
policy regime requisite for attracting, SOO. Secondly, they are oriented to the social,
technological, economical and political environmental prerequisites for SOO. Thirdly, from
the perspective of the separation of ownership and control in outsourcing, they are oriented to
the assets and input factors necessary to provide the services. Given the relationships in SOO
between principal and agent, empirical evidence of contract enforcement in China (and India)
shows relatively lower levels of enforcement in southern coastal areas and relatively higher
levels in the northern coastal areas [Feenstra and Hanson (2003)].
The SOO continuum, from hierarchies to markets, at the level of contracts carries
implications for employment (notwithstanding the balance-of-payments merchandise trade
statistics). The employment statistics for SOO are not known accurately. Estimates in 2004,
partly based on output of graduates, range from 980,000 in China, to 650,000—750,000 in
India, with CAGR of 18.5 per cent and 17.5 per cent, respectively.65 No assessment of the
quality and conditions of employment within SOO is made. Such evaluations go to the heart
of the issue of whether the jobs created are capable of being upgraded not only through the
competitive evolution of service providers but also via the transfer, from outsourcer to
outsource, of progressively higher levels of technologically-intensive operations. This
possibility depends on a raft of policies that comprise the host FDI and domestic investment
regimes, as well as policies for upgrading ‘soft’ and ‘hard’ infrastructure, and the knowledge
base of the economy.
FDI and SOO ultimately represent economic competitive exchange as individual firms in
HCLs relocate non-core activities to LCLs, in order to capture scale and scope economies
[Alvarez et al. (2003)]. These comprise advantages of:
• access to supplier expertise
• improved quality
• cost reductions
64 See, inter alia, Dunning (1958); Dunning (2000); UNIDO (2003a); and Freeman and Bartels (2004). 65 Te Velde (2004) and Dossani (2004) indicate that these employees deliver service work of which 80-90 per
cent outsourced to India alone comes from the United Kingdom and the United States.

26
The exchange produces learning effects in the developing country host locations and
accelerates the pace of globalization.66
However, the most important impact (and implication) of SOO concerns the ‘cascading’ of
industrial capacity across developing countries in South and East Asia [Boston Consulting
Group (2004, Exhibit II)]. This increases the rate at which the forces of competition operate67
[Porter (1990)]. First, this leads to issues of which policy objectives and what kind of PIs
should be designed to attract SOO? Secondly, how and when should the PIs be sequenced in
time and economic space?
6. Policy Issues
There is intense policy competition for the benefits and positive externalities of FDI and SOO
[Oman (2000)]. The international business of SOO cannot be fully addressed without
reference to two aspects of the GF that determine policy at macro- and micro-economic
levels. First, as previously mentioned, are GVCs and global supply chains (GSCs). GVCs
execute the sequential intermediation of related production and servicing functions while
GSCs execute the operational activities that deliver products to end-users. The spatiality of
GVCs and GSCs gives rise to overlapping networks of production and servicing already
depicted in figure 1—The GF—of which OO are increasingly becoming key (or real) options
in the business strategies of MNEs.68 For MNEs managing their international operations
means concentrating on: (i) volatility and uncertainty; (ii) options and flexibility; (iii)
network forms of cooperation and competition; and (iv) entrepreneurship, managed partly
with OO operations.
The second concerns the firm-level managerial performance and challenges of SOO. At the
macroeconomic level, the policy challenges revolve around the question of how to insert
local suppliers into the interstices of GVCs and the GF of MNEs? A comprehensive
66 The learning results and increased capacity of India hosting significant amounts of SOO is that local firms like TCS, WIPRO, INFOSYS and HCL Tech are sufficiently competitive to make FDI in the European Union and North America [The Economist (2004)].
67 The correlation of GDP/capita growth and time since the beginning of industrialization tracks the countries of South and East Asia onto an ‘S’ curve with four distinct transitions in the structure of GDP: primary resource-driven development; labour-intensive manufacturing (with FDI) driven development; capital-intensive manufacturing (with FDI) driven development; and innovation- and service-driven development [Morgan Stanley (2004); UNIDO (2003a,b)].
68 See the real options approach [Roemer (2004); Chen and Funke (2003); Xiuyun (2003); Nordal (2000); Trigeorgis (1996)].

27
understanding of firm relationships is vital for this purpose [Vestring, Rouse and Reinert
(2005); UNIDO (2004)]. The GF is co-evolving with the policy environment within which
the MNE organizes its global production through spatially coordinated functions. This is
characterized by inter-changeability and is in dynamic tension with its internal constituents,
as well as external forces of competition and cooperation. This context and process are highly
complex and its comprehensiveness, with respect to intra- and inter-firm transactions,
requires attention by policy makers. The understanding of this phenomenon appears to be
extremely necessary for host countries in order for them to put in place effective policies.
There is indeed an increasing need for the host policy environment to reflect the GF of
MNEs.
At the micro level, policy makers have to bear in mind that, while the global strategies of
MNEs are evolving and manifest in the dynamic configuration and reconfiguration of the GF,
the previous separated patterns of FDI by firms (in sequential time and place and, hitherto,
more predictable modes of entry) have been replaced by parallel modes of market entry and
servicing. These modes have multifaceted international patterns of inter- and intra-firm
cooperative arrangements described as ‘alliance capitalism’ (which includes SOO modalities
of joint ventures, strategic alliances, co-production and marketing, co-R&D, contract design
and manufacturing with equity and non-equity formalities). This is stylistically illustrated in
figure 2.
In this context, policy makers need to move beyond the idea of attracting FDI and SOO with
the lure of cheap labour and unsophisticated tax incentives.69 These new operational patterns
are characterized by international networked systems of industrial sourcing, technology,
production, marketing and servicing, and place a serious challenge on policy-making.
Economic and industrial policies of host countries have to be both appropriate and well
sequenced if they wish to succeed in capturing the kind of FDI and SOO that would boost
their industrial development.
69 The productivity adjusted cost of labour skills, and the credibility and predictability of the tax system (both direct and indirect), inter alia, are what is increasingly taken into account in location decisions of MNEs.

28
Figure 2. Parallel modes of FDI entry in internatio nal patterns of ‘Alliance Capitalism’
HOM E ACTIVITIES ONLY
DIRECT EXPORTING
FOREIGNAGENT
FOREIGN PRODUCTION & M ARKETING SUBSID IARY
INTER- & INTRA-F IRM CO -O PERATIVE
ARRANG EM EN TS
�Licensing
�Franchising
�Co-Production
�Co-M arketing
�Co-R &D
�Value-Cha in Co-operation
�Supply-Chain Co-operation
�Consortia
�Technical Co-operation
� International
Joint Ventures
� International
Strategic Alliances
FO REIG NDISTRIBUTO R
FOREIGN SALES SUB
These policy issues are related to trends and patterns of spatiality in FDI in which MNEs not
only consider home and host country characteristics when they decide to invest, but also third
country locations [Blonigen et al. (2004)]. In fact, there is a spatial correlation between FDI
in a particular country and in alternative countries or regions. There is also empirical
evidence that regions surrounded by large markets tend to attract more FDI.70 It is worth
noting that third country locations acquire significance in MNEs’ decision-making, especially
when their investments deal with vertical integration, as they will be motivated to take
advantage of the comparative advantages of different locations. Since FDI decisions are
multilateral and multivariate by nature, the interdependence between host destinations is
gaining magnitude in MNEs’ decision-making and hence should be increasingly factored into
the crafting of developing countries’ PIs as well as their implementation.
The relationship between outsourcing and the firm’s market performance, measured by rate
of revenue growth and return on sales, is not uni-directionally simple. Some 50 per cent of
large North American, European and Asian firms are “dissatisfied” with the results of
outsourcing. Only 6 per cent are “extremely satisfied” [Gottfredson and Puryear (2005)]. To
a certain extent, this must reflect the balance of host LSAs (and policy disadvantages) as well
70 This carries major implications for PIs and FDI law operationalized at the regional level and various dimensions of FDI policy, which exploit differentiated factor conditions and costs across the geo-economic space of the region. In addition, robust regional institutions are crucial to workable PIs.

29
as corporate strategic deficiencies in formulating outsourcing operations comprehensively.
The view from the alliance, GVCs and GSCs perspectives suggest that, within OO in general,
and particularly in SOO, durable arm’s length supply relationships and strategic partnerships
(that is, quasi-markets and quasi-hierarchies, respectively) are not cohered well by firms, in
terms of contractual specificities, contingent adaptabilities and contractual obligations [Dyer,
Cho and Chu (1998)]. These incoherencies expand as the strategic salience of what is
outsourced increases, and as the host location-specific disadvantages multiply, especially in
the dimension legal system [Luo (2005)].
Furthermore, at the micro-economic level, apart from the risk factors in the business location
environment, a number of issues require attention.71 Some are within the control of host
policy makers; others are the concern of SOO managers. However, because of the co-
evolution of policy and action, there can never be an unambiguously clear-cut separation of
responsibilities. It should be recalled that many SOO fail to meet expectations [Alvarez et al.
(2003)]. The differences between expected and actual results of SOO across a range of
variables are illustrated in table 10—SOO expectations and actual scale differences—are
quite remarkable.
Table 10. SOO expectations and actual scale differ ences
Rank
SOO variable Scale point difference between
expectation and actuality (percentage) 1 Access to vendor expertise -26 2 Improved delivery quality -24 3 Cost reduction -17 4 Increased focus on core business -13 5 Improved balance sheet - 5
Source: Alvarez et al. (2003).
Table 10 conceals an inherently contra-indicative variation, which points further to the
challenges of SOO. The appealing rationale given for OO is to reduce costs — and this
should feed through to the balance sheet of the firm. However, it is in the variables which
enable reduced costs that the greatest gaps between expectations and results are seen; and yet
the gap for improved balance sheet is the smallest. Those for accessing vendor expertise and
improved delivery (the just-in-time dimensions of lean production and servicing)—which
71 Infrastructure quality, security, labour skills, geo-political climate, cultural adaptability, linguistic barriers, the principal-agent problem, site accessing, trust, increasing switching costs, home labour backlash.

30
should be the elements of innovation at lower cost—have the largest gaps between
expectation and actuality.
The key reasons for this remarkable contra-indication and difference between expectations
and the reality of SOO are due to the moderating influence and impact of factors of asset
specificity or inseparability, transaction frequency, technological uncertainty and production
process innovativeness on outsourcing for the market performance of the firm in question.
Evidence indicates that SOO is non-monotonic with respect to the firm’s market performance
moderated by the level of asset specificity, or inseparability, in services provision and
frequency of transaction [Murray and Kotabe (1999)]. In other words, at lower levels of asset
specificity, market performance (market share, revenue growth rate, return on investment,
and return on equity) increases with increasing SOO. Also higher transaction frequency at
relatively lower levels of asset specificity of what is outsourced tends to be non-
monotonically related to market performance. However, at relatively higher levels of asset
specificity, market performance decreases with increasing SOO.
Furthermore, recent empirical research points to the factors of technological uncertainty and
innovativeness having a non-monotonic relationship on outsourcing performance. On the one
hand, at relatively low levels of technological uncertainty (that is, with industrially mature
technologies) increasing the amount, or rate, of outsourcing is positively correlated with firm
performance. However, with relatively higher levels of technological uncertainty, increasing
the amount, or rate, of outsourcing becomes negatively correlated with firm performance. On
the other hand, at relatively low levels of product, or process, innovativeness (that is, with
low appropriability and low tacit assets) increasing the amount, or rate, of outsourcing is
positively correlated with firm performance. But, at relatively higher levels of innovativeness
(in what is outsourced) outsourcing becomes negatively correlated with firm performance.
The gaps in expectations and reality may therefore be attributed: first, to the inability of SOO
managers to judge accurately and price the extent of outsourcing; secondly, to what should,
and should not, be outsourced; and thirdly, to the inability to assess accurately the business
characteristics of the outsourcee [Murray, Kotabe and Zhou (2005)].

31
Supporting this failure of SOO to live up to expectations is table 11—Most critical challenges
in SOO—shows the critical challenges to the management of SOO.72
Table 11. Most critical challenges in SOO Rank Critical challenge variable Percentage of resp ondents
1 Weak control of costs and operational performance 32
2 Excessive standardization (i.e. high inflexibility of operations) 31
3 Outsourcees unresponsive to changing business needs 28
Bearing in mind the indications from table 11 above, the problems herein stem from the fact
that the whole point of SOO is to deliver economies of scale — and hence cost reductions.
However, the business set to achieve this is, in several instances, incompatible with the
ability to deliver economies of scope — which are to do with operational flexibility and the
ability to apply what is learnt in one business dimension to another. Host policy makers
cannot micro manage this aspect of SOO. This is the responsibility of managers engaged in
SOO. Nonetheless, policy-making needs to be informed of these challenges as they may point
to, for example, underlying deficiencies in host industry technological training incentives and
schemes, infrastructure ‘bottle-necks’ or a commercial regulatory regime that is overly
restrictive in dispute settlement. (See section 4 regarding the variables on which China and
India perform relatively less well.)
Here an analysis of the policy dimensions of PIs is made. It is important to note here that
governments of developing countries choose PIs—generalized as incentives73—to attract FDI
and SOO in relation to their overall economic development goals. Thus, different dimensions
of incentives can be depicted. First, incentives can be either general or specific (with
discretionary functions). A second dimension is the durability of incentives. Indeed,
according to host country’s priorities, incentives could be either permanent or temporal.
However, pragmatically speaking, PIs related to incentives need to change in their duration
so as to encourage the kinds of FDI, SOO and industrial specialization the country desires.
Therefore, it is useful to think of PIs as windows of opportunity which open and close.
72 Booz Allen Hamilton Survey of 100 U. S. companies, 2002, cited in Booz Allen Hamilton (2003). 73 Not to be confused with the special category of incentives named fiscal or financial incentives.

32
Notwithstanding Marshallian districts, another dimension exists at the geographic—or
spatial—level since investment policies can target FDI and SOO either at a local or at a
national or regional level. Local incentives can be used to promote specific regions of a
country that are poorer or in greater need of development. Further, incentives can be used to
attract foreign investors to the whole economy or only to certain sectors or subsectors,
according again to specific needs. In the past, this has carried the rubric ‘negative’ or
‘positive’ lists which cordoned off strategic sectors of the economy to foreign investors and
reserved others for national firms.74 Finally, at the firm level, incentives can focus either on
all FDI, or only on specific investors.
These dimensions are depicted in figure 3—Framework for operationalizing FDI policy
dimensions and instruments—which shows the scope of the challenges. To say that policy
craft—creating policy coherence out of the conflicting demands from modal neutrality,
market contestability,75 as well as scaling and measuring the factors and variables which must
be considered in policy research and analysis—is a challenge, is an understatement. This
paper makes early reference to the growing importance of investment and business climate
benchmarking as a guide to policy-making.
However, econometrically, as every factor or variable (or their combinations) has its own
FDI-inflow and -stock elasticity, investment promotion agencies and policy makers with
limited resources should concentrate their policy craft on those FDI and SOO factors and
variables with the highest FDI elasticities [Christiansen (2004)].76 In rank order, these are: (i)
growth competitiveness which combines macroeconomic and technology variables, with a
FDI inflow elasticity of 0.63; (ii) economic freedom, combining government intervention,
property rights, wages/prices and regulation variables with a FDI inflow-elasticity of 0.56;
74 See Arkady Ostrovsky and Kevin Morrison, Financial Times (2005) for a contemporary illustration of this phenomenon.
75 Policy coherence refers to the degree of internal consistency of objectives, FDI and SOO policies and interpretation of policies, in their regulatory form, across a range of issues and at different levels of government. Modal neutrality describes policies that allow foreign investors to decide for themselves how best to serve the markets they enter. Market contestability embodies the ability of both foreign and domestic investors to compete on a level playing field for all the factors of production.
76 For example, the FDI stock elasticities of GDP per capita range from 0.89 to 0.96 implying that a 10 per cent increase in a country’s GDP per capita would result in a 10 per cent increase in inward FDI stock. Likewise, the FDI inflow-elasticity of a host country’s competitiveness (scaled 1 to 5) at 0.63 implies that an increase of 1 point in the scale would result in an increase of 88 per cent inward FDI ceteris paribus. See Christiansen (2004) for other FDI-elasticities (economic freedom, taxation, regulation, infrastructure, human resources).

33
(iii) taxation and regulation with a FDI inflow elasticity of -0.50; (iv) quality of
telecommunication services with FDI inflow elasticity of -0.28;77 and (v) labour market
regulation with FDI inflow elasticity of -0.26. Furthermore, these elasticities have short-
medium- and long-term adjustments rates. This approach begins to lay out the choices
available to policy makers in designing viable PIs in a systematic manner based on rigorous
analysis. Hence, from a fourth-generation investment promotion perspective [Bartels
(2005b)], a focus on the macroeconomic environment stability and technology policies to
increase the rates of innovation and transfer using PIs that facilitate licensing and franchising,
for example, would be needed. In a similar vein, harmonizing taxation regulation across
regional space would be a viable policy.
Figure 3. Framework for operationalizing FDI OO po licy dimensions and instruments
PO L IC YC R A FT
PO L IC YLEG A L
PO L IC YIN ST ’S
FD I-O OFA C T O R S
&V A R IA B L E S
PO LIC YSC A LE
M E A SU RE S
PO LIC YR E SEA R C H
&A N A L YSIS
G E N E R A L – SPEC IFICPE R M A N E N T – TE M PO R A L
N A T IO N A L – RE G IO N A L (L O C A L )
E C O N O M Y W ID E – SE C T O R S (SU B -SE C T O R S)A LL IN V E ST O R S - SPE C IFIC IN VE ST O R S
FISC A L – N O N -FISC A L
SH O R TSH O R T --, M ED IU M, M ED IU M -- & L O N G& L O N G --T E R M A D JU STM E NT A C R O SS E C O N O M IC SPA C ET E R M A D JU STM E NT A C R O SS E C O N O M IC SPA C E
M E TA -M A C R O -M E SO -M IC R O -F IR M -LEV EL
M ETA -M A C R O -M ESO -M IC R O -F IR M -L EV EL
All these elements and issues in figure 3 reflect the need for sequencing and switching PIs
and incentives, both in space and time. In other words, while FDI policy-making is
increasingly more complex and diverse, host governments, according to their development
needs, have to adapt to the MNEs dynamic activities by sequencing and switching (in a
predictable manner) their FDI and SOO PIs. Moreover, these different policy dimensions also
77 The measurement scale is from 1 to 5 representing increasing poor quality, hence the negative sign on regression coefficient.

34
indicate the importance for host governments to create different levels of policies: the meta or
supra-national level, the macro or national level, the meso or regional and cluster level, the
micro or industrial sector and subsector level and the firm level of organizational strategy and
competitiveness [UNIDO (2005)]. The complexity of FDI host policy-making is obviously
high. Nevertheless, policy dimensions have to be chosen and established in harmony with
general development goals set up by host governments.
Ultimately, it could be argued that all these dimensions collapse into one dimension regarding
incentives. In fact, incentives can be fiscal or non-fiscal [Oman (2000); UNIDO (2003a)], as
selectively illustrated in the table 12—Fiscal and non-fiscal incentives—below. As can be
noticed, non-fiscal incentives are constituted by financial and non-financial incentives.
Table 12. Fiscal and non-fiscal incentives Fiscal incentives Non-fiscal incentives
Tax holidays Depreciation methods
Tax-free imports Development Banks’ loan policies
Tax exemptions R&D support
Environmental standards support
Labour training support
Government subsidies
Whereas industrialized countries typically utilize financial incentives, such as grants,
developing countries usually use fiscal incentives, such as reductions, in the base rate of
corporate income tax, tax holidays and import-duty exemptions and drawbacks [Oman
(2000)]. Incentives are widely used to attract MNEs and thus create a climate of policy
competition for FDI. Fiscal incentives might be successful for attracting MNEs, but
incentives-based competition also creates some problems. Indeed, the first problem of
incentives is that they represent opportunity cost of resources to host governments. Secondly,
there can be a significant lack of transparency regarding incentives, which leaves space for
corruption and other kinds of rent-seeking behaviour. Finally, given the dimension choices in
figure 3, incentives also provoke market distortions. Among them, the major ones are the fact
that incentives tend to favour large corporate investors to the detriment of small ones, as well
as foreign over the domestic companies because of their lower risk profile and higher
bargaining power. The distortion would tend to disappear (over time) in countries adopting
35
fourth-generation IPs, as they would treat foreign and domestic firms equally, with regard to
incentives.
The policy craft for capturing SOO is therefore contextualized by an overall reference to the
industrialization strategy and the roles of industrial (and trade) policies [UNIDO (2002)]. The
policy response to the challenge of attracting SOO encompasses a combination of short- and
long-term legislation, upgrading of the ‘people’, ‘business’ and ‘financial’ infrastructure of
an economy in order to reduce the transactions costs of doing business, on the one hand. And,
on the other hand, of increasing the level of transparency to avoid rent-seeking and regulatory
capture. This policy posture enables the economy to structurally adjust as competitively as
possible.
First on the list of policy measures is boosting innovation and skills — to enable the domestic
economy to intermediate in SOO provision for GVCs and networks that cohere to the GF.
Secondly, as SOO represent the processing of intellectual capital, for example, in the form of
BPO, policies to strengthen intellectual property rights protection are crucial for attracting
SOO and FDI [Atkinson (2004)]. Thirdly, selective fiscal incentive polices should be
designed to accelerate capital asset restructuring, through accounting identities such as
depreciation and training exemptions. Together these will further facilitate the transfers of
R&D services.78
7. Concluding Remarks
The highly complex dynamics of FDI, OO and SOO present the challenges of a rapidly
changing global industrial landscape for policy makers. Over the past four industrial
development decades, the international involvement of MNEs in business and economic
development [UNIDO (2000)] has shifted from ‘stand-alone’ FDI to network forms of
collaboration; and from managing the ownership of assets (capital and technologically
intense) to managing the ownership of relationships (trust and contractually intense
relationships). This has been accompanied by a shift to the East for labour-intensive activity
and, along with technological advances of digitization, an increased reliance on OO of non-
78 This is notwithstanding the mixed results from analytical studies on the utility of tax incentives as policy measures to attract FDI and SOO to developing countries [See Hall and van Reenen (1999)].

36
core business functions. Now there is evidence of globally both increased competition and
collaboration within the industrial relationships of FDI, MNEs, their GVCs and IINs.
The trends and patterns identified in OO point to significant changes in what is outsourced
and where it is offshored. The period 1970-1980 witnessed OO of labour-intensive
production, particularly an international relocation of labour-intensive manufacturing. The
period 1980-1990 saw the international relocation of services (starting with labour-intensive
activities). During the current decade, the relocation of more value-added business processes
and services, such as architectural subcontracting, customer management and contract R&D,
began significantly [Narayan (2004)].
The implications of SOO for host locations attempting to change the composition of their
GDP and upgrade their industrial and service sectors to enable them to act as services
providers to MNEs are serious. Without policy attention to the variables on which MNEs are
surveyed, with respect to their internationalization, policy craft will be severely constrained.
The overarching enabling conditions for attracting FDI and SOO are ultimately oriented
towards modal neutrality79 and asset security (due to the ownership of capital and intellectual
assets). And, as MNEs increasingly shift the basis of their international involvement from
owning assets to owning relationships—the essence of collaborative forms of
internationalization and hence of outsourcing—the operational conditions for attracting FDI
and SOO will need to be increasingly focused on market contestability80 and contracting
security (legal and regulatory environment).
The debate on externalities (spillovers) of FDI relative to those of SOO is essentially an
argument on the extent of spillovers and their distribution. Of course, crucial questions shape
the discussion. Who benefits? And, at what level of aggregation? Are the spillovers captured
by outsourcer (investor) or outsourcee (host local firm providing the service)? And in what
relative amounts? Whatever the answers, and their qualifications, first, it is beyond question
that SOO is set to grow significantly over the long-term as a key cost-reducing element in the
international strategies of MNEs. This provides a series of evolving higher-level service
79 Modal neutrality describes policies that allow foreign investors to decide for themselves how best to serve the markets they enter.
80 Market contestability embodies the ability of both foreign and domestic investors to compete on a level playing field for all the factors of production.

37
value-added opportunities for emerging market economies, especially for the group of
countries known as ‘BRICS’,81 as well as for some other more advanced developing
countries. However, most developing countries, without rapid structural adjustment to
enhance the performance of their domestic sectors, will miss out on the international
relocation of services. Secondly, the increasing digitization of knowledge-intensive activities
means that key SOO for R&D, regional HQs location, call centres and shared services, and
distribution and logistics will continue to be technologically relatively easy. The corollary of
this is that developing countries need to accelerate their output of knowledge workers (while
preventing a brain-drain to the Triad economies) able to handle digitized knowledge work, as
well as upgrade their ‘soft’ and ‘hard’ infrastructure. Thirdly, the relationship between
activities subject to outsourcing, from where it is outsourced and where it is offshored will
remain complex. It will depend on the evolution of the types of business processes, their core
value to the outsourcer (and potential value to the outsourcee — as a potential competitor),
evolving cost structures and the efficiency of the service provider. It will also depend on the
risk-adjusted, LSAs and the attractiveness of the business environment of the host economy.
The policy responses of developing countries to the new shift in international business need
to incorporate the dynamics of the GF, which now represents the role of MNEs in the world
economy [Bartels (2005a)]. And a crucial aspect of this understanding concerns the
governance structures82 of the international operations of MNEs. This issue is evident, for
example, in the case of SOO, which involves technology transfer to the service provider in
order to overcome the ‘liability of foreignness’ by upgrading quality, for example [Zaheer
(1995)]. Internationalization of firms’ operations is taking on nuances brought on by the
increased risks of globalization, increased corporate vulnerabilities and higher frequency
volatility in the competitive landscape. There is also increasing outward FDI and SOO by
MNEs from the more advanced developing countries [UNCTAD (2002)]. The MNEs’
corporate response to these increased risks is a redistribution of assets and relationships.
Capital is being concentrated in the Triad economies, while relationships (supply and non-
core business functions) are being relocated, through real options, in South and East Asia.
81 Brazil, Russia, India, China, and South Africa. 82 These involve the allocation of rights (sourcing, technology, production, marketing, servicing); inter-
organizational interface management; and coordination and control of operations.

38
The key issue on the policy agenda for developing countries in other regions is how they craft
domestic industrial policies, sufficiently rapidly, to enable local firms to grow, and be
assisted to grow in technological capacity and knowledge-based capability to perform
increasingly sophisticated corporate business functions once carried out as white-collar work
in industrialized countries.

39
References
Abonyi, G., 2000, “Linking Asia Together”, The Asian Wall Street Journal, 5 December.
American Electronics Association, 2004, Offshore Outsourcing in an Increasingly
Competitive and Rapidly Changing World: A High-tech Perspective, March.
A.T. Kearney (2004), Offshore Location Attractiveness Index: Making Offshore Decisions,
Chicago: A. T. Kearney.
A. T. Kearney, 2004a, The Changing face of China: China as an Offshore Destination for IT
and Business Process Outsourcing, Chicago: A. T. Kearney.
A. T. Kearney, 2004b, “India and China spar over FDI like David and Goliath” FDI
Confidence Index, The Global Business Policy Council, vol. 7, October, Chicago: A.
T. Kearney.
A. T. Kearney, 2004c, Making Offshore Decisions: A. T. Kearney’s 2004 Offshore Location
Attractiveness Index, Chicago: A. T. Kearney.
A. T. Kearney, 2004d, Where to Locate: Selecting A Country for Offshore Business
Processing, Chicago: A. T. Kearney.
A. T. Kearney, 2003a, Business Process Offshoring, Online Survey Results, September.
A. T. Kearney, 2003b, The Economist, A Survey of India and China, 5 March.
Alvarez, E., Couto, V., Disher, C., and Gupta, A.., 2003, Business Process Outsourcing and
Offshoring, Booz Allen Hamilton.
Amiti, M., and Wei, S. J, 2004, Fear of Service Outsourcing: Is It Justified?, NBER Working
Paper 10808, September.
Anderson, J. E., and van Wincoop, E., 2001a, Gravity with Gravitas: A Solution to the
Border Puzzle. NBER Working Paper, No. 8079, January.
Anderson, J. E., and van Wincoop, E., 2001b, Borders, Trade and Welfare, NBER Working
Paper, No. 8515, October.
Antràs, P., and Helpman, E., 2003, Global Sourcing, NBER Working Paper 10082,
November.
Atkinson, R., 2004, Meeting the Offshoring Challenge, Progressive Policy Institute, Policy
Report, July.
Balasubramanian R., and Padhi, A, 2005, The Next Wave in U. S. Offshoring, The McKinsey
Quarterly, No. 1.
Bartel, A., Lach, S., and Sicherman, N., 2005, Outsourcing and Technological Change,
NBER Working Paper 11158, February.
40
Bartels, F. L., 2005a, The Evolving Nature of FDI Industrial Organisation and Challenges for
Policy and Practice, Working Paper IWPS 001/05, UNIDO Expert Group Meeting,
Foreign Direct Investment in Southeast Asia: Experience and Future Policy
Implications for Developing Countries, 21 – 23 March 2005, Bangkok, Thailand,
http://www.unido.org/file-storage/download/?file%5fid=33493.
Bartels, F. L., 2005b, ‘Advantages’ and ‘Disadvantages’ of FDI Policy Instruments, Session
No. 4 Paper, UNIDO Expert Group Meeting, Foreign Direct Investment in Southeast
Asia: Experience and Future Policy Implications for Developing Countries, 21 – 23
March 2005, Bangkok, Thailand, http://www.unido.org/file-
storage/download/?file%5fid=34564.
Bartels, F. L., 2004, The Future of Intra-regional Foreign Investment Patterns in Southeast
Asia in The Future of Foreign Direct Investment in Southeast Asia, Nick J. Freeman
and Frank L. Bartels, Eds., London: Routledge Curzon.
Bartels, F. L., and Pass, C.L., 2000, International Business: A competitiveness Approach,
Singapore: Prentice Hall.
Birkinshaw, J., 1996, How Multinational Subsidiary Mandates are Gained and Lost, Journal
of International Business Studies, vol. 27, No. 3, 3rd Qtr, pp. 467-495.
Blonigen, B.A., Davies, R.B., Waddell, G.R., and Naugthon, H.T., 2004, FDI in Space:
Spatial Autoregressive Relationships in Foreign Direct Investment, NBER, Working
Paper 10939, Cambridge.
Booz Allen Hamilton, 2003, Business Process Outsourcing and Offshoring.
Boston Consulting Group, 2004, Exhibit II.
Boston Consulting Group, 2004, Capturing Global Advantage, BCG Report, April.
Buckley, P. J., 2003, “FDI and Growth for Developing Countries: MNEs and Challenges of
the New Economy”, Keynote Speech & Paper, UNIDO General Conference, 1-5
December 2003, Round-table 5: Promoting investment in developing countries (with
special reference to Africa): Challenges, opportunities and experience, Proceedings
of the Industrial Development Forum and Associated Round Tables, Vienna: UNIDO.
Buckley, P. J., 1999, Multinational Firms, Cooperation and Competition in the World
Economy, New York: St. Martin’s Press.
Buckley, P. J., 1988, The Limits of Explanation: Testing the Internalization Theory of
Multinational Enterprise, Journal of International Business Studies, vol. 19, No. 2,
Summer, pp. 191-193.

41
Buckley, P. J., and Casson, M., 2002, The Future of the Multinational Enterprise: 25th
Anniversary Edition, London: Palgrave Macmillan.
Buckley, P. J., and Hashai, N., 2004, A Global System View of Firm Boundaries, Journal of
International Business Studies, vol. 35, No. 1, pp. 33-45.
Business Week, 2003, The New Global Job Shift: A New Round of Globalization is Sending
Upscale Jobs Offshore, 3 February, pp. 36-48, p. 72.
Chen, Yu-Fu, and Funke, M., 2003, Option Value, Policy Uncertainty, and the Foreign Direct
Investment Decision, HWWA, Discussion Paper, No. 234, Hamburg Institute of
International Economics, June.
Christiansen, H., 2004, ODA and Investment for Development: What Guidance can be Drawn
from Investment Climate Scoreboards?, OECD, Working Papers on International
Investment No 2004/2005, November.
Clissold, T., 2004, Mr. China, London: Robinson.
Dagnino, G. B., 2004, Complex systems as key drivers for the emergence of a resource- and
capability-based interorganizational network, ECO Emergence, Special Double Issue,
vol. 6, Nos. 1-2, Fall, pp. 61-69.
Daianu, D., 2005, Who Fears Outsourcing and Offshoring? Southeast European Times, 31
January.
Davies, P.J. 2005, Get a Grip on all the Links in the Chain: Outsourcing, Financial Times, 18
April, p. 5.
Dehaven, T., 2004, There They Go Again: The Truth About “Exporting Jobs”, National
Taxpayers Union, NTU Policy Paper No. 115, 29 September.
Deloitte Research, 2003, The Cusp of A Revolution: How Offshoring Will Transform The
Financial Services Industry, London: Deloitte Touche Tohmatsu.
Dicken, P., 2003, Global Shift: Reshaping the Global Economic Map in the 21st Century
London: Sage, p. 53.
Dossani, R., 2004, The Impact of Services Offshoring, Asia-Pacific Research Centre,
Stanford University, Mimeo.
Doz, Y., and Prahalad, C. K., 1989, Collaborate with your competitions and win, Harvard
Business Review, January/February, pp. 133-139.
Drucker, P. F., 1989, The New Realities, Oxford: Heinemann.
Dunning, J. H., 2003, Some antecedents of internalization theory, Journal of International
Business Studies, vol. 34, No. 2, March, pp. 108-115.

42
Dunning, J. H., 2000, The Eclectic Paradigm as an Envelope for Economic and Business
Theories of MNE Activity, International Business Review, vol. 9, No. 2, pp. 163-190.
Dunning, J. H., 1997, Alliance Capitalism and Global Business, London: Routledge.
Dunning, J. H., 1993, Multinational Enterprise and The Global Economy, Wokingham:
Addison Wesley.
Dunning, J. H., 1958, American Investment in British Manufacturing Industry, London:
George Allen and Unwin.
Dyer, J. H., Cho, D. S., and Chu, W., 1998, Strategic Supplier Segmentation: The Next “Best
Practise” in Supply Chain Management, California Management Review, vol. 40, No.
2, Winter, pp. 57-77.
Ernst & Young, 2003, Survey on Offshore Outsourcing in India, New Delhi: Ernst & Young.
Fan, J. P. H., and Lang, L. H. P., 2000, The Measurement of Relatedness: An Application to
Corporate Diversification, Journal of Business, vol. 73, No. 4, pp. 629-660.
Feenstra, R. C., 1998, Integration of Trade and Disintegration of Production in The Global
Economy, Journal of Economic Perspectives, vol. 12, No. 4, pp. 31-50.
Feenstra, R. C., and Hanson G. H., 2003, Ownership and Control in Outsourcing to China:
Estimating the Property Rights Theory of The Firm, NBER Working Paper 10198,
December.
Financial Times, 2005, Laying a false trail, 22 April, p. 13.
Financial Times, 2004, Outsourcing: ‘The Logic is Inescapable’, 28 January, p. 11.
Financial Times, 2003, Outsourcing: Service industries go global how high-wage
professionals are migrating to low-cost countries, 20 August, p. 11.
Freeman, N. J., and Bartels, F. L., 2004, The Future of Foreign Investment in Southeast Asia,
Eds. London Routledge Curzon.
Fioretti, G., and Visser, B., 2004, A cognitive interpretation of organizational complexity,
E:CO Emergence, Special Double Issue, vol. 6, Nos. 1-2, Fall, pp. 11-23.
Fraser Institute, 2004 Annual Report, Economic Freedom of the World, Vancouver.
Fukao, K., Ishido, H., and Ito, K., 2003, Vertical Intra-Industry Trade and Foreign Direct
Investment in East Asia, Discussion Paper Series A, No.434, The Institute of
Economic Research, Hitotsubashi, Japan, January.
Gandossy, R. P., and Kao, T., 2005, Overseas Connections, Across The Board, vol. 42, No. 1,
January/February, pp. 38-42.
Gartner Inc., 2005, Information Week, vol. 1033, 4 April, p. 16.
Gartner Inc., 2004, Gartner Dataquest.

43
Ghemawat, P., 2002, Competition and Business Strategy in Historical Perspective, Business
History Review, vol. 76, Spring, pp. 37-74
Giroud, A., 2003, Transnational Corporations Technology and Economic Development:
Backward Linkages and Knowledge Transfer in Southeast Asia, Cheltenham,
Northampton: Edward Elgar.
Giroud, A., and Mirza, H., 2004, Multinational Enterprises and Local Input linkages in
Southeast Asia, Working Paper, No. 04/41, School of Business, University of
Bradford, U. K., November.
Global Demographic Change: Economic Impacts and Policy Challenges, Proceedings of a
symposium Sponsored by the Federal Reserve Bank of Kansas City, Jackson Hole,
Wyoming, 26-28 August 2004.
Gottfredson, M., and Puryear, R., 2005, Capability Sourcing: From Periphery to the Core,
Results Brief, Bain & Co., 25 February.
Hall, B. H., and van Reenen, J., 1999, How effective are Fiscal Incentives for R&D? A
Review of the Evidence, Research Policy, vol. 29, No. 4-5, pp. 449-469.
Heritage Foundation, 2005, 2005 Index of Economic Freedom, IMD, 2003.
Hummels, D., Ishi, J., and Yi, K-Mu., 2001, The Nature and Growth of Vertical
Specialization in World Trade, Journal of International Economics, vol. 54, No. 1,
pp.75-96.
Hummels, D., Ishi, J., and Yi, K-Mu., 1999, The Nature and Growth of Vertical
Specialization in World Trade, FRBNY, Mimeo.
IMD, 2003, The World Competitiveness Yearbook 2003, Geneva.
India Infoline, 2004, IT Happens Only in India, http://www.indiainfoline.com
Institute for International Economics, 2005, Working Paper, WP 05-1, March, Table 3, p. 31.
Ito, K., and Fukao, K., 2003, Vertical Intra-Industry Trade and Division of Labor in East
Asia, Discussion Paper Series A, No.444, The Institute of Economic Research,
Hitotsubashi, Japan, October.
King, W.R., 2005, Outsourcing becomes more complex, Information Systems Management,
vol. 22, No. 2, pp. 89-90.
Kirkegaard, J. F., 2004, Outsourcing: Stains on the White Collar?, Mimeo, Institute for
International Economics, February, Washington D. C.: Institute for International
Economics.

44
Krempel, L., and Plümper, T., 2003, Exploring the Dynamics of International Trade by
Combining the Comparative Advantages of Multivariate Statistics and Network
Visualizations, Journal of Social Structure (JoSS), vol. 4, No. 1, pp. 1-22.
Krugman, P., 1996, The self-organizing Economy, Cambridge, Mass: Blackwell.
Lachman, L. M., 2003/04, The New Exports: Office Jobs, Issue Paper Series, Urban Land
Institute, Columbia Business School.
Laudicina, P. A., 2004, World Out of Balance, New York: McGraw-Hill.
Luo, Y., 2005, Transnational Characteristics, Institutional Environment and Joint Venture
Contracts, Journal of International Business Studies, vol. 36, No. 2, March, pp. 209-
230.
Mann, C. L., 2003, Globalization of IT Services and White Collar Jobs: The Next Wave of
Productivity Growth, International Economics Policy Brief 03-11, December,
Washington D. C.: Institute for International Economics.
Marshall, A., 1920, Principles of Economics, 8th Ed., London: Macmillan.
McKinsey Global Institue, 2003, Offshoring. Is it a win-win game? August. San Francisco:
McKinsey & Co.
Meredith, R., 2005, The Next Wave of Offshoring, Far Eastern Economic Review, vol. 168,
No. 3, March, pp. 19-24.
Moore, K., and Lewis D., 2000, Foundations of Corporate Empire: Is History Repeating
Itself?, London: Prentice Hall.
Morgan Stanley, 2004, India and China: A Special Economic Analysis, Equity Research,
Hong Kong: Morgan Stanley.
Murray, J. Y., Kotabe, M., and Zhou, J. N., 2005, Strategic Alliance-based Sourcing and
Market Performance: Evidence from Foreign Firms Operating in China, Journal of
International Business Studies, vol. 36, No. 2, March, pp. 187-208.
Murray, J. Y., and Kotabe, M., 1999, Sourcing Strategies of U. S. Service Companies: A
Modified Transaction-Cost Analysis, Strategic Management Journal, vol. 20, No. 9,
September, p. 791-809.
Narayan, S., 2004, Globalization of Service Activities: The View from India, Policy Brief
No. 7, The William Davidson Institute, University of Michigan Business School,
September.
Nordal, K. B., 2001, Country risk, country risk indices and valuation of FDI: A real options
approach, Emerging Markets Review, vol. 2, pp. 197-217.

45
Oman, C., 2000, Policy Competition and Foreign Direct Investment: A Study of Competition
Among Governments to Attract FDI, Paris: OECD.
Ostrovsky, A. and Morrison, K., 2005, “Foreign Groups Face Ban from Bidding for Russian
Resources”, Financial Times, 11 February, p. 1.
Paulson, H., 2009, “Reform the architecture of regulation”, Financial Times, 18 March, p. 9.
Porter, M., 1990, The Competitive Advantage of Nations, London: Macmillan.
Price, I., 2004, Complexity, complicatedness and complexity: A new science behind
organizational intervention?, E:CO Emergence, Special Double Issue, vol. 6, Nos. 1-
2, Fall, pp. 40-48.
Ricart, J. E., Enright, M., Ghemawat, P., Hart, S. L., and Khanna, T., 2004, New frontiers in
international strategy, Journal of International Business Studies, vol. 35, No. 3, pp.
175-200.
Roemer, E., 2004, Real Options and the Theory of the Firm, Working Paper, No. 04/28,
School of Management, Bradford University, U. K., September.
Roland Berger Consultants, 2004, Service Offshoring Takes Off in Europe – In Search of
Improved Competitiveness, World Investment Report 2004, UNCTAD.
Real-Time Technology Solutions, Inc. (RTTS),
http:www.rttsweb.com/services/outsourcing.stats.cfm accessed on 31 March 2005.
Soesastro, H., 2003, An ASEAN Economic Community and ASEAN+3: How do they fit
together?, Pacific Economic Papers, No. 338, Australia-Japan Research Centre, The
Australian National University.
Stopford, J., Strange, S., and Henley, J.S., 1991, Rival States, Rival Firms: Competition for
World Market Shares, Cambridge: Cambridge University Press.
Swenson, D. L., 2004, Overseas Assembly and Country Sourcing Choices, NBER Working
Paper 10697, August.
Te Velde, D. W., 2004, The Wider Developmental Impact of Offshoring Choices, MBER
Working Paper 10697, August.
The Economist, 2005, Special Report: Outsourcing and IT in India, 23 April.
The Economist, 2004, A World of Work: A Survey of Outsourcing, 13 November, p. 8.
Transparency International, 2004, Framework Document: Background Paper to the
Corruption Perceptions Index, Passau.
Trigeorgis, L., 1996, Real Option: Managerial Flexibility And Strategy in Resource
Allocation, Cambridge, Mass.: MIT press.
UNCTAD, 2005, [UNCTAD/PRESS/PR/2005/002, 11 January].

46
UNCTAD, 2004, World Investment Report 2004: The Shift Towards Services, Geneva:
UNCTAD.
UNCTAD, 2002, World Investment Report: Transnational Corporations and Export
Competitiveness, Geneva: UNCTAD.
UNCTAD, 1995, World Investment Report 1995: Transnational Corporations and
Competitiveness, Geneva: UNCTAD.
UNCTAD, 2008, World Investment Report 2008, Transnational Corporations, and the
Infrastructure Challenge, Geneva: UNCTAD.
UNDP, 2003, Human Development Report: Millennium Development Goals: A compact
among nations to end human poverty, New York.
UNIDO, 2005, Foreign Direct Investment in Southeast Asia: Past experience and future
policy implications for developing countries, Report of The UNIDO Expert Group
Meeting (EGM), Bangkok 21-23 March 2005.
UNIDO, 2004, Inserting Local Industries into Global Value Chains and Global Production
Networks, Vienna: UNIDO.
UNIDO, 2003a, Guidelines for Investment promotion Agencies: Foreign Direct Investment
Flows to Developing Countries, Vienna: UNIDO.
UNIDO, 2003b, General Conference, 1-5 December 2003, Round-table 5: Promoting
investment in developing countries (with special reference to Africa): Challenges,
opportunities and experience, Proceedings of the Industrial Development Forum and
Associated Round Tables, Vienna: UNIDO.
UNIDO, 2002, Industrial Development Report 2002/2003: Competing through Innovation
and Learning, Vienna: UNIDO.
UNIDO, 2000, African Industry 2000: The Challenge of Going Global, Vienna: UNIDO.
Urry, J., 2003, Global Complexity, Cambridge: Polity.
U.S. Department of Labor, 2005, Bureau of Labor Statistics, Electronic Design , vol. 53, No.
8, 14 April. p. 25.
Van Welsum, D., 2004, In Search of “Offshoring”: Evidence from U. S. Imports of Services,
Birkbeck Economics Working Paper 2004 2, London: Birkbeck College.
Vestring, T., Rouse, T., and Reinert, U., 2005, Hedge Your Offshoring Bets, MIT Sloan
Management Review, vol. 46, No. 3, Spring, pp. 27-29.
Walby, S., 2003, Complexity Theory, Globalisation and Diversity, Conference Paper, British
Sociological Association Conference, University of York, U. K., April.
Williamson, O. E., 1975, Markets and Hierarchies, New York: Free Press.

47
Wolf, M., 2005, “India and China”, Financial Times, 23 February, p. 13.
Wolf, M., 2007. “Unfettered finance is fast reshaping the global economy”, Financial Times,
18 June, p.9.
Martin, W., 2009, “Fixing bankrupt financial systems is just the beginning”, Financial Times,
29 April, p. 9.
World Bank, 2005, Doing Business in 2005, Washington D.C.: IBRD/World Bank/OUP.
http://rru.worldbank.org/DoingBusiness.
World Bank, 2003, Improving the Investment Climate in China, World Bank/IFC,
Washington D. C.: World Bank
World Economic Forum, 2000, Global Competitiveness Report, Geneva.
WTO, 1998, Annual Report, Geneva: WTO.
Xiuyun, Z., 2003, Foreign Direct Investment Evaluation: A real options perspective, Journal
of Doing Business Across Borders, vol. 2, No. 1, May, pp. 15-36.
Yeats, A.J., 2001, Just How Big is Global Production Sharing?, in Sven W. Arndt and
Henryk Kierzkowski, Eds., Fragmentation: New Production patterns in The World
Economy, Oxford: Oxford University Press.
Yeaple, S. R., 2003, The complex integration strategies of multinationals and cross-country
dependencies in the structure of foreign direct investment, Journal of International
Economics, vol. 60, No. 2, p. 293, August.
Zaheer, S., 1995, Overcoming The Liability of Foreignness, Academy of Management
Journal, vol. 38, No. 2, pp. 341-363.


Outsourcing Markets in Services:International Business Trends, Patterns and Emerging Issues, and the Role of China and India
UNITED NATIONS INDUSTRIAL DEVELOPMENT ORGANIZATION
Printed in AustriaV.09-85640—August 2009—200
UNITED NATIONS INDUSTRIAL DEVELOPMENT ORGANIZATIONVienna International Centre, P.O. Box 300, 1400 Vienna, AustriaTelephone: (+43-1) 26026-0, Fax: (+43-1) 26926-69E-mail: [email protected], Internet: www.unido.org
R e s e a r c h a n d S t a t i s t i c s B r a n c h
w o r k i n g p a p e r 0 3 / 2 0 0 9