Embed Size (px)
Citation preview

1
Outline of SME White Paper FY2003
1. Contents
Part 1 Current Trends of SMEs-Analyzes severe economic and financial situation facing SMEs
Part 2 Revitalization of Japanese Economy and the Role of SMEs-Analyzes strengths of SMEs, which have supported the Japanese economy over the
long term -Analyzes challenges to building an economy where businesses can startup, close,
revitalize and revive themselves easily. -Analyzes challenges to creating a new SME network as a form of management
innovation -Analyzes facilitating accounting methods that give consideration to enterprise
qualities that cannot be evaluated by financial data alone
-Recognizing the strength of SMEs that have overcome various difficulties and have supported the growth of the Japanese economy, and clarifying that SMEs are the driver of economic revitalization in Japan.
-Grasping the trends of the latest business start-ups. Considering realities of bankruptcies, revival of bankrupted owners and conditions for business reconstruction by using large-scale, wide-ranging surveys of bankrupted owners. Also, looking into realities of those who are willing to close businesses through surveys of industrial regions.
-Finding ways for subcontractors to survive by adjusting to global procurement etc. Analyzing various conditions for successful horizontal cooperation among SMEs, and collaboration between SMEs and academia. Identifying conditions for successful joint activities to increase the attractiveness of shopping areas.
-Reevaluating the role of regional financial institutions in SME financing amid contracted lending by big banks. Identifying the effects on SMEs of recent financial environmental changes including mergers and bankruptcies of financial institutions. Searching for ways to enhance SMEs’ fund-raising capacity through, for example, diversification of fund providers.
2. Features

2
Part 1 - Current Trends of SMEs
1. Overall Economic Trends of SMEs-The business performances of SMEs signaled some recovery in the first half of 2002
before easing or leveling off in the rest of the year. A performance gap expanded between manufacturers supported by rising exports and non-manufacturing industries hit by weak domestic demand.
Source: SME Agency/JASMEC, Survey of Business Conditions in the Small Business Sector(Notes) 1. Business conditions diffusion index = percentage for improvement - percentage for deterioration
2. Shaded parts in the figure indicate recession periods (the same for figures below).
Figure 1-1 Changes in SME Business Confidence- Leveling off from mid-2002 -
▲ 43.5
▲ 35.2
▲ 46.8
▲ 60
▲ 50
▲ 40
▲ 30
▲ 20
▲ 10
0
10
1990 1991 1992 1993 1994 1995 1996 1997 1998 1999 2000 2001 2002
製造業
非製造業
全産業
Manufacturing
All industries
Non-manufacturing
- Production of SME manufacturers bottomed out in the beginning of 2002 and expanded on the back of robust electrical and transportation machinery production before slowing down from the autumn. While overall production of Japan’s manufacturing industries recovered from the previous trough of the economic cycle in December 1998, SME manufacturers’ production remained below their trough level. A production gap thus has expanded between large and SME manufacturers.
92.0
89.8
93.1
98.1
95.996.1
90
95
100
105
110
(95年=100 季調済)
~中小製造業の生産は98年末の水準を依然下回っている~
第1-2図 中小製造業の生産の推移
製造業全体
中小製造業
Figure 1-2 Changes in Production of SME Manufacturers- Production of SME manufacturers still remained below the late 1998 level -
Overall manufacturers
SME manufacturers
(100 for 1995, seasonally adjusted)
85
1993 1994 1995 1996 1997 1998 1999 2000 2001 2002
(年月)資料:経済産業省「鉱工業生産指数」、中小企業庁「規模別製造工業生産指数」Sources: METI, Index of Industrial Production; SME Agency, Manufacturing Production Indices by Size of Firm

3
2. Financial Environment Surrounding SMEs
- The financial position has deteriorated for SMEs over the long term while leveling off for large enterprises.
▲ 33.1
8.0
▲ 40
▲ 30
▲ 20
▲ 10
0
10
20
30
90 91 92 93 94 95 96 97 98 99 00 01 02
(年期)資料 : 大企業は、日本銀行「企業短期経済観測調査」、中小企業は、中小企業庁・中小企業総合事業団「中小企業景況調査」(注) 1.大企業は、「楽である」-「苦しい」。 中小企業は、前年同期に比べて「好転した」-前年同期に比べて「悪化した」
大企業
中小企業
Figure 1-3 SME Financial Position DI (All Industries)- Deteriorating over the long term -
Sources: Bank of Japan, Short-Term Economic Survey of Enterprises in Japan for large enterprises; SME Agency/JASMEC,Survey of Business Conditions in the Small Business Sector for SMEs
(Notes) 1. DI for large enterprises = percentage for “easy”- percentage for “difficult”DI for SMEs = percentage for “improvement” from a year earlier - percentage for “deterioration”
2. Shaded parts in the figure indicate recession periods
SMEs
Large enterprises
(Year and quarter)
- The lending attitude Diffusion Index of financial institutions has continued to deteriorate over the long term. When the business conditions DI improved briefly in 2002, the lending attitude DI remained low without any signal of the recovery.
第1-4図 金融機関の貸出態度DI(全産業・中小企業)~長期的に悪化傾向~
▲ 22.0
▲ 10.0
17.1
7.4
▲ 9.0
▲ 30
▲ 20
▲ 10
0
10
20
30
40
Ⅰ1984
Ⅰ1985
Ⅰ1986
Ⅰ1987
Ⅰ1988
Ⅰ1989
Ⅰ1990
Ⅰ1991
Ⅰ1992
Ⅰ1993
Ⅰ1994
Ⅰ1995
Ⅰ1996
Ⅰ1997
Ⅰ1998
Ⅰ1999
Ⅰ2000
Ⅰ2001
Ⅰ2002
貸出態度DI
資料:日本銀行「企業短期経済観測」
(注)金融機関の貸出態度DI=「緩い」-「厳しい」
(年期)
Source: Bank of Japan, Short-Term Economic Survey of Enterprises in Japan(Note) Lending attitude DI of financial institutions = percentage for “easy” - percentage for “tight.”
Figure 1-4 Lending Attitude DI of Financial Institutions (for SMEs in all industries)- Long-term deterioration -Lending attitude DI
(Year and quarter)

4
- Outstanding loans to SMEs declined at large private financial banks. On the other hand, those to SMEs remained rather steady at government financial institutions.
Figure 1-6 Breakdown of Government Financial Institutions’ Loans to SMEs- Equipment investment loans declined while safety net loans increased -
17,576
14,30215,031
16,615
0
2,000
4,000
6,000
8,000
10,000
12,000
14,000
16,000
18,000
Equipment investment loans Safety net loans
(¥100 million) 2001 2002
Source: SME Agency(Notes)1. Changes in equipment investment and safety net loans provided by Japan Finance Corporation for Small Business, Shoko Chukin Bank (long-term loans alone) and National Life Finance Corporation.2. Safety net loans were created in December 2000 to smoothly provide funds to SMEs faced with bankruptcies of trading partners or financial institutions.
82.4
91.9
87.8
93.3
85.7
93.895.6
98.2
80DEC ’00
MAR’01
Jun Sep Dec MAR’02
Jun Sep Dec
Large banks
Regional and second regional banks
Shinkin credit associations and Shinso credit cooperatives
Government-affiliated financial institutions
(100 for the end of December 2000)
Large banks
Regional and second regional banks
Shinkin credit associations and Shinso credit
cooperatives
Government-affiliated financial institutions
Sources: Bank of Japan, Financial and Economic Statistics Monthly; SME Agency, Monthly SME Survey(Notes)1. Large banks cover city, trust and long-term credit banks, and trust and overseas branch accounts of domestic banks.2. Government financial institutions cover Shoko Chukin Bank, Japan Finance Corporation for Small Business and National Life Finance Corporation.
Figure 1-5 Changes in Outstanding Loans to SMEs
100
90
-Nearly 50% of enterprises plan to reduce their outstanding borrowings. This tendency is promoted by the fact that enterprises become more cautious about borrowing plans after having loan applications rejected by financial. The rejections are assumed to invite a spiral of decline in loan applications.
Figure 1-7 Enterprises’ Borrowing Plans for Coming Year (All Industries)
- Nearly 50% plan to reduce outstanding borrowings -Percentage share of responding enterprises
44.5
11.0
4.9
05
101520253035404550
48.7
54.9
46.7
52.7
38.6
43.8
Enterprises whose loan applications were accepted as they are
Enterprises whose loan applications were rejected or reduced
Enterprises whose loan applications were accepted as they are
Enterprises whose loan applications were rejected or reduced
Enterprises whose loan applications were accepted as they are
Enterprises whose loan applications were rejected or reduced
Percentage of enterprises planning to reduce borrowings (%)
Less than 30 years
Between 31 and 50 years
More than 50 years
Age of Enterprises
Banks’ response to loan applications in the past year
Figure 1-6 Banks’ Response to Loan Applications and Enterprises’Future Borrowings Plans (All Industries)
(Enterprises’ Borrowings Reduction Plans by Banks’ Response to Loan Applications)
Reducing outstanding borrowings
Maintaining outstanding borrowings
Increasing outstanding borrowings
30 35 40 45 50 55 60Source: SME Agency, Survey of the Business Financing Environment (November 2002)
Source: SME Agency, Survey of the Business Financing Environment (November 2002)(Note)In addition, 39.7% said “Taking flexible actions in response to specific situations.”

5
-Amid unforeseeability about the future, investments by SME manufacturers have become more dependent on their cash flow levels, leading to lower investment.
Business investment decline (in tens of thousands of yen) accompanying a ¥1 million drop in cash flow
Figure 1-9 Cash Flow’s Impact on Business Investment (SME Manufacturers)- Cash flow levels have had a growing impact on business investment levels -
250▲
3. SME Bankruptcies
Source: METI, Basic Survey of Japanese Business Structure and Activity (FY 1996-2001)(Note) Annual cash flow = (annual recurring profit) x 1/2 + (annual depreciation cost)
-The number of SME bankruptcies in FY2002 was at a high level, above 18,000, which is the sixth highest in history. Under the prolonged economic slowdown, recession-type bankruptcies accounted for a greater share. The number of this type hit the worst level ever.
Figure 1-10 SME Bankruptcies and Their Liabilities- Recent annual bankruptcies remained high -
18,687
15,135
18,749
16,29314,73114,970
13,96514,440
18,497 18,819
14,05513,660
10,25712,217
9,9708,6188,618 8,737 8,868
13,026
7.87.36.6
8.1
6.8
5.8
5.04.7
4.14.7
93 94 95 96 97 98 99 00 01 020.0
1.0
2.0
3.0
4.0
5.0
6.0
(73.6%)
Source: Tokyo Shoko Research, Ltd., Bankruptcy White Paper(Notes)1. The number of bankruptcies covers bankrupt enterprises with liabilities of ¥10 million or more. SMEs are corporations and individuals with capital slipping below ¥100 million.2. Figures in parentheses are recession-caused bankruptcies’ percentage shares of total failures.
(CY)
Number of bankruptcies (left scale)
Recession-caused bankruptcies and their share of total (left scale)
Total liabilities (right scale)
(59.2%) (61.3%) (57.8%)(59.8%)
(60.6%)
(64.3%)
(66.8%)
(69.4%) (71.3%) 5.0
0
2,000
4,000
6,000
8,000
10,000
12,000
14,000
16,000
18,000
20,000
7.0
8.0
9.0
(Enterprises) (In trillions of yen)
▲216
200▲
150▲
▲101▲90100▲ ▲80
▲5250▲
01997 1998 1999 2000 2001 (FY)

6
<Part 2> Revitalization of the Japanese Economy and the Role of SMEs<Strengths and Performances of SMEs>
-Industrial shipments jumped 20-fold from 1960 to 2000 in Japan. In spite of dramatic changes including high economic growth, two oil crises and the steep appreciation of the yen, the position of SME manufacturers, as measured by value added and the number of employees, has remained very stable for a long time. SMEs have thus contributed to Japan’s economic development.
-SMEs have performed better than large enterprises in areas of limited production of diversified products and in areas where demand fluctuates wildly. These areas grow more important for improvement of national income. While large enterprises have undertaken primarily mass production, SMEs have focused on limited production of diversified products. This is one form of business division.
Table 2-2 Cases Where SMEs Specialize in Limited Production of Diversified Products in Certain Industry or Product Categories
51.2%(1970)
56.7%(2000)
47.3%(1960)
88.0%(1991)
88.4%(1981)
84.2%(1972)
88.6%(1999)82.7%
(1960)
30%
40%
100%
1960Sources: METI, Census of Manufactures (Industries); Ministry of Public Management, Home Affairs, Posts and Telecommunications, Establishment and Enterprise Census of Japan(Notes)1. For the share of value added, business offices with four to 299 employees are classified as SMEs.2. For the share of employees, business offices with one to 299 employees are classified as SMEs.
(CY)
Share of value added
Share of employees
0%
Large Enterprises SMEs
Electrical audio machine and instrument manufacturing
Popular, low-priced and other general-purpose products for mass production and sales (minicomponent stereo
sets, etc.)
High-value-added products featuring better-quality sound and other improvements for audio enthusiasts (More-than-one-million-yen luxury audio amplifiers,
components, etc.)
Robot manufacturingRobots for which certain levels of demand are expected
for production lines in automobile, electronics and electrical machinery industries (welding, painting,
assembling, mounting and other robots)
Special robots for research purposes (research robots, robot components, etc.)
Medical equipment manufacturing
Products whose development and improvement require massive funds and many experts (artificial
organs, X-ray systems, etc.)
Custom-made products meeting various specifications as required by hospitals and other users (thermatological
systems, low-frequency massage devices, electric potential treatment instruments, components, etc.)
Bond adhesive manufacturing
Products for which certain levels of demand are expected, including bonds for building material
plywood (urea resin bonds)
Products that can be used in various ways depending on bonding purposes (packaging, bookbinding,
woodworking, etc.), bonding strength and bonding forms (hot-melt bonds)
Waste disposal equipment manufacturing
Large machines for waste disposal plants of local governments (bulky waste disposal machines, sludge
treatment machines, etc.)Machines for diversified treatments for recycling
purposes (PET bottle compression machines, garbage treatment machines, etc.)
Figure 2-1 Changes in Position of SME Manufacturers (Their Share of Value Added and Employees)- SME manufacturers’ share of value added has remained very stable for a long time -
90%
80%
70%
60%
55.8% 55.5%50%
(1980) (1990)
1962 1964 1966 1968 1970 1972 1974 1976 1978 1980 1982 1984 1986 1988 1990 1992 1994 1996 1998 2000

7
Figure 2-3 Features of Products as Divided by Employment Size (Manufacturing)- Enterprises with smaller employment sizes tend to undertake limited production of diversified products -
55.9
36.3
28.5
23.4
44.1
63.1
70.9
73.5
0.6
3.1
0.6
0.0
0 1 100
301人~
101~300人
51~100人
~50人
Source: Shoko Research Institute/Shoko Chukin Bank, “The 5th Fact-finding Survey on Structural Changes of Machinery and Metal Industries (2000)
(%)
(Employment size) Concentrating on mass production products
Concentrating on limited production of diversified products
Concentrating on production of samples
Figure 2-4 Life Cycles of Goods and Services as Divided by Employment Size (Manufacturing)
- Enterprises with smaller employment sizes tend to produce products and services with shorter life cycles -
15.8
13.2
12.1
18.3
23.8
20.9
24.5
21.8
24.6
29.9
63.2
62.3
66.1
57.0
46.3
(Employment size)One year or less One to three years More than three years
Figure 2-5 SMEs’ Major Competitors (Manufacturing)– SMEs work well in areas that are different from those for
large enterprises –
50
60
70
80
(%)
Source: SME Agency, Fact-finding Survey on Business Management Strategy (November 2002)
Competitors are SMEs
Competitors are large enterprises
67.9
0 20 30 40 50 60 70 80 90
40
30 25.8
20
0~20人10
21~50人0
51~100人
101~300人
301人~
0 10 20 30 40 50 60 100
Source: SME Agency, Fact-finding Survey on Business Management Strategy (November 2002)(%)70 80 90
-SMEs do not necessarily maintain the same size in the area of limited production of diversified products. They grow through the development of new products.
Figure 2-6 New Product Development’s Effect on Employment Growth (1998-2002) (Manufacturing)- Enterprises that tackle the development of new products increase employment faster -
3.0(Employment growth: %)
2.7
2.5
2.0
1.5
1.11.0
0.5 0.40.50.2
0.00-20 employees 21-50 employees 51-100 employees 101-300 employees 301employees -
Source: SME Agency, Fact-finding Survey on Business Management Strategy (November 2002)(Note) The figure pays attention to a gap between an average employment increase for enterprises tackling new product development and that for all enterprises, as divided by employment size.
(Employment size)

8
-Growing SMEs indicate that it is important a) to employ external workers such as shifting from family enterprises to non-family enterprises, and b) to develop sophisticated technologies that meet their markets.
Figure 2-8 Sophistication of Goods or Services, and Return on Assets (Manufacturing, wholesale and retail industries)
- Enterprise earnings indicate that goods or services do not necessarily have to be highly advanced -
0.09
▲ 0.51▲ 0.04
0.26
▲ 0.60
▲ 0.40
▲ 0.20
0.00
0.20
0.40
Return on assets(Deviation from
average)
Figure 2-7 Employment Growth Rates for Family and Non-family Enterprises (Manufacturing, wholesale and retail
industries)- Employment grows faster for non-family enterprises than for
family enterprises -
1.271.80
0.51
▲ 0.33 ▲ 0.47 ▲ 0.200.0
0.5
1.0
1.5
2.0
Employment growth rate (Deviation from average)(%)
Non-family enterprises
Family enterprises
New to the
world
New to
Japan
New to a
market
New to an
enterprise▲ 0.5 Sophistication of
goods or servicesSource: SME Agency, Fact-finding Survey on Business Management Strategy (November 2002)(Note) In the survey, responding enterprises were asked to choose from four alternatives-(1) New to the world, (2) New to Japan, (3) New to a market, and (4) New to an enterprise-regarding the sophistication of their mainstay goods or services.
▲ 1.051-100 employees 101-200 employees 201-300 employees
Sources: METI, Basic Survey of Commercial and Manufacturing Structure and Activity (2000) (reedited and processed); SME Agency, Fact-finding Survey on Business Management Strategy
-SMEs have provided lots of innovations to society through the development of new products during their growth.
<Examples of innovations by SMEs that have been widely applied>- Shredder: Devised by then Meikoshokai Co. President Takagi in 1960, based on noodle-making machines.- Fish finder: Invented by radio repair brothers Seiko and Seiken Furuno (Furuno Denki Shokai) in
Nagasaki Prefecture in 1948.- Integrated security service: Started by Makoto Iida of Secom Co. along with his friend Juichi Toda in
1961. Expanded business through security, etc. for construction site forOlympic Games.
- Karaoke (sing-along) machine: Invented by bandsman Daisuke Inoue in 1971.- Mechanical pencil: Invented by Tokuji Hayakawa of Hayakawa Kyodai Shokai in 1915. After his
company failed due to the occurrence of the Great Kanto Earthquake,Hayakawa launched an electrical appliance manufacturer that developed intoSharp Corp.
-SMEs with such strengths have been and will be expected to lead the revitalization of the Japanese economy through the creation of innovations and jobs.

9
<Building an economy where businesses can be started-up, closed, revitalized with ease>1. Current Start-up Trend and Relevant Problems in Japan
-Start-up rate is still in a slump in Japan. Compared to other areas, the rate is higher not only in the IT sector and other advanced areas, but also in daily life- and community-based sectors such as nursing care and recycling.
(Descriptions of sectors)
Figure 3-2 Top Five Sectors in terms of Start-up Rate (yearly average, 1999-2001)- Sectors related to IT and the aging of the population had high start-up rates -
61.7
27.9 25.4 24.119.1
0.010.020.030.040.050.060.070.0
Source: Ministry of Public Management, Home Affairs, Posts and Telecommunications, Establishment and Enterprise Census of Japan (reedited and processed)
(Notes)1. Business initiation rate = Number of annual average initiations / Number of business establishments in the 1999 survey x 100 (%)2. The calculations here covered sectors that had 10,000 or more business establishments each at the time of the 2001 census.
(%)
第3-1図 開廃業率の推移(非一次産業、年平均)~1980年代以降、低下する開業率~
3.13.6
2.7
3.5
4.3
5.95.9
4.03.83.8
4.5
5.6
3.2
4.0
0.0
1.0
2.0
3.0
4.0
5.0
6.0
7.0
75~78 78~81 81~86 86~91 91~96 96~99 99~01
資料:総務省「事業所・企業統計調査」 (年)
(%)
開業率
廃業率
Figure 3-1 Changes in Start-ups and Closure Rates(non-primary industries, annual average)
- The start-up rate has declined since the 1980s -(%)
Start-up rate
Closure rate
Source: Ministry of Public Management, Home Affairs, Posts and Telecommunications, Establishment and Enterprise Census of Japan
(CY)
Telecommunications ancillary services Software
developmentAged people’s
welfareUsed goods retail
(cannot be classified otherwise)
Daily life-based services (cannot by
classified otherwise)
Food processing, marriage agencies, tourist information providers, chauffeur services, etc.
Daily life-related services (cannot by classified otherwise)
Retailers of used clothing, furniture, etc.Used goods retail (cannot be classified otherwise)
Nursery homes for aged people, day-service centers for aged people
Aged people’s welfare
Commissioned software development, package software development
Software development
Mobile telecommunication centers (cellular phone shops, etc.), etc.
Telecommunication ancillary services

10
-The rates of would-be entrepreneurs are higher in the 20s and 30s age groups and lower in older age groups. On the other hand, the higher the age, the higher the rate of start-up. As a result, the rates of start-up accomplishments are lower at younger ages. There is a large gap between wishes and realities among young people.
0.230.39 0.42 0.37
0.58
3.96 3.97
2.81
1.23
1.72
47.4
21.8
15.1
9.8
5.8
4.50 50.0(%) (%)
Rate of would-be entrepreneurs(left scale)
Rate of startup accomplishments
(left scale)Rate of start-ups
(right scale)
Figure 3-3 Rates of Would-be Entrepreneurs, Start-ups and Startup Accomplishments (males, by age group)- Young people wish to form start-ups, but many of them cannot reach that goal -
45.04.00
40.03.5035.0
3.0030.0
2.5025.0
2.0020.0
1.5015.0
1.00 10.0
0.50 5.0
0.00 0.0
Less than 30 30s 40s More than 5950sSource: Ministry of Public Management, Home Affairs, Posts and Telecommunications, Employment Status Survey (1997)
(reedited and processed)(Notes)1. Start-ups are limited to those who had earlier been permanent employees.
Would-be entrepreneurs are limited to those who are permanent employees.2. Rate of start-up (would-be) entrepreneurs = number of start-up (would-be) entrepreneurs / number of permanent employees x 1003. Rate of startup accomplishments = number of start-up entrepreneurs / number of would-be entrepreneurs x 100
-Obstacles to start-up of would-be entrepreneurs include the issues of finance, marketing and technical/expertise knowledge. Young people especially face financial problems and shortages of technical/expertise knowledge.
Figure 3-4. Problems of Would-be Entrepreneurs’ Start-up (by age group)- Fund-raising problems indicate an age gap -(%)
69.2
34.6 34.630.9
57.3
38.2 39.3
19.1
51.6
37.6
31.229.0
52.4
38.1
31.3
23.8
39.6 39.6
22.626.4
0.0
Less than 30 30s 40s 50s More than 59
Source: Japan Chamber of Commerce and Industry, Central Federation of Societies of Commerce and Industry,Follow-up Survey of Business Initiation Training Participants in Fiscal 2000 and 2001 (June 2002) (reedited and processed)(Note) The percentage total may exceed 100 since each respondent was allowed to choose plural alternatives.
Fund-raising Marketing (marketing know-how, trading partner and
customer exploration problems)
Shortages in technical/expertise
Personnel(staff and partners)
80.0
70.0
60.0
50.0
40.0
30.0
20.0
10.0
11
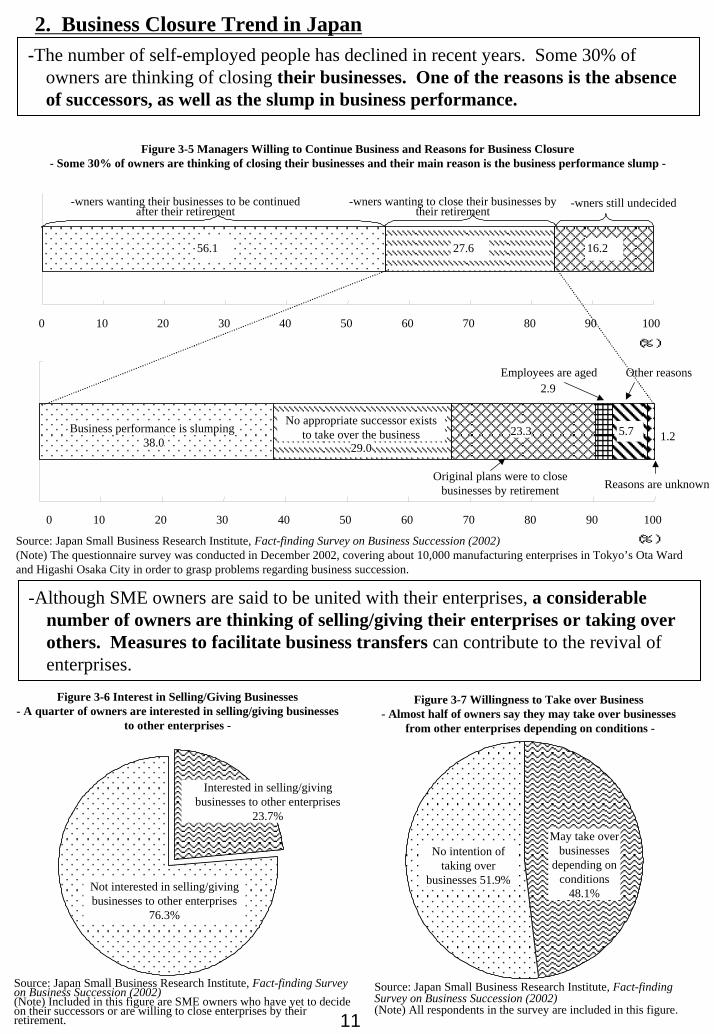
2. Business Closure Trend in Japan -The number of self-employed people has declined in recent years. Some 30% of
owners are thinking of closing their businesses. One of the reasons is the absence of successors, as well as the slump in business performance.
Figure 3-5 Managers Willing to Continue Business and Reasons for Business Closure- Some 30% of owners are thinking of closing their businesses and their main reason is the business performance slump -
56.1 27.6 16.2
0 10 20 30 40 50 90 100
(%)
-wners wanting their businesses to be continued after their retirement
-wners wanting to close their businesses by their retirement
-wners still undecided
5.7Business performance is slumping38.0
No appropriate successor exists to take over the business
29.023.3
2.9Employees are aged Other reasons
Reasons are unknownOriginal plans were to close
businesses by retirement
60 70 80
1.2
0 10 20 30 40 50 60 70 80 90 100
Source: Japan Small Business Research Institute, Fact-finding Survey on Business Succession (2002)(Note) The questionnaire survey was conducted in December 2002, covering about 10,000 manufacturing enterprises in Tokyo’s Ota Ward and Higashi Osaka City in order to grasp problems regarding business succession.
(%)
-Although SME owners are said to be united with their enterprises, a considerable number of owners are thinking of selling/giving their enterprises or taking over others. Measures to facilitate business transfers can contribute to the revival of enterprises.
Figure 3-6 Interest in Selling/Giving Businesses- A quarter of owners are interested in selling/giving businesses
to other enterprises -
Not interested in selling/giving businesses to other enterprises
76.3%
Interested in selling/giving businesses to other enterprises
23.7%
Source: Japan Small Business Research Institute, Fact-finding Survey on Business Succession (2002)(Note) Included in this figure are SME owners who have yet to decide on their successors or are willing to close enterprises by theirretirement.
Figure 3-7 Willingness to Take over Business- Almost half of owners say they may take over businesses
from other enterprises depending on conditions -
No intention of taking over
businesses 51.9%
May take over businesses
depending on conditions
48.1%
Source: Japan Small Business Research Institute, Fact-finding Survey on Business Succession (2002)(Note) All respondents in the survey are included in this figure.

12
3. Bankruptcies and Revival (from a Poll of 1,500 Owners of Bankrupt Enterprises)
-Enterprises bankrupted tend to take stopgap measures against temporary financial difficulties and refrain from taking more important measures which aim to improve the soundness of their business accounts.
Figure 3-8 Bankruptcy-avoiding Measures of Bankrupt and Surviving Enterprises(Comparison of enterprises with recurring profit and excess liabilities for the latest fiscal year)
- Bankrupt enterprises focus on tentative financing more than surviving enterprises -
0102030405060708090
100
Enhancement of marketing and sales activities
Develop and improve goods/services
Review distribution and sales channels
Raise unit sales and order prices or request to do so
Lower purchasing and outsourcing costs or request to do so
Reduce the numbers of managers and employees
Cut pay for managers and employeesOther cost-cutting measures
Review conditions of payment and receipt or request to do so
Request investment/loans from financial institutions and trading partners
Request investment/loans from their family members/acquaintances
Put their personal assets into their enterprises
Put their personal borrowings into their enterprises
Bankrupt enterprises Surviving Enterprises
Measures by Bankruptenterprises
Measures by surviving enterprises
(%)
Measures against
temporary financial
difficulties
Measures to improve the soundness of business accounts
Reduce or change businesses including business transferSell idle assets and equipment
-Thirty two % of bankrupt enterprises continue their operations. Companies that find it easiest to continue business are those that had expanding business and high turnover before bankruptcy. On the other hand, companies that find it easiest to produce profits after bankruptcy are those that did so before bankruptcy. Conditions for business continuation and profitability are not the same.
Sources: Small Business Institute, Fact-finding Survey on Business Rechallenge (2002), Fact-finding Survey on Overcoming Difficulties (2002)(Note) The total exceeds 100 as respondents were allowed to select plural alternatives.
Figure 3-9 Business continuation by Bankrupt Enterprises- Many enterprises continue businesses after bankruptcy -
Suspensionof operations
13.8%
Continuation of operations
32.0%
Closure of businesses
54.2%
Figure 3-10 Sales just before Bankruptcy and Continuation of Business Operations
- The proportion of businesses with rising turnovers that continue operations after bankruptcy is high -
43.3
31.0
30.1
56.7
69.0
69.9
0 10 20 30 40 50 60 70 80 9 100
Rising
Stable
Falling
(%)
Continuation of operations Suspension of operations
Sales trend just before
bankruptcies
0
Source: Small Business Institute, Fact-finding Survey on Business Rechallenge (2002)Source: Small Business Institute,
Fact-finding Survey on Business Rechallenge (2002)

13
Figure 3-11 Business Performances of Enterprises Continuing Operations after Bankruptcy- Enterprises that had made profits before bankruptcy tend to do so after it -
Source: Small Business Institute, Fact-finding Survey on Business Rechallenge (2002)(%)
100
58.4
20.8
20.8
32.1
50.0
17.9
33.1
34.7
32.2 Loss
Break-even
Profit
Business performances
after bankruptcy
-Owners cannot ask for financial support from anyone except their family members or acquaintances after bankruptcy. Facilitation of flexible responses by financial institutions is as a policy issue.
0.5
1.7
2.4
3.9
12.0
12.5
20.7
34.2
34.2
0 5 10
Loan facilities of local governments
Borrowings from private financial institutions
Borrowings from government financial institutions
Investment and borrowings from parent enterprises
Investment from individuals and corporations supporting business operations
Investment and borrowings from trading partners
Investment and borrowings from managers’friends and acquaintances
Investment and borrowings from managers’family members and relatives
Bankrupt enterprise managers’ personal funds
(%)
Private networks
Institutional financing
Figure 3-12 Means to Raise Funds for Continuation of Business Operations after Bankruptcy- Continuation of operations after bankruptcy depends on private networks -
15 20 25 30 35 40
Source: Small Business Institute, Fact-finding Survey on Business Rechallenge (2002)(Note) The total exceeds 100 as respondents were allowed to select plural alternatives.
0
10
20
30
40
50
60
70
80
90
Profits in the last FY Loss only in the last FY Losses in the last two FYs
Recurring balance before bankruptcy

14
-Forty three % of owners of failed enterprises are bankrupt. But about 14% of them have restarted enterprises.
Figure 3-13 Measures Taken by Bankrupt Enterprise Owners to Liquidate Personal Liabilities – More than 40% go bankrupt –
None of measures were taken 15.9%
Negotiations with creditors not through
lawyers 13.5%
Negotiations with creditors through lawyers 21.5%
Personal rehabilitation procedures 1.7%
Bankruptcy procedures
43.4%
N/A 3.9%
Source: Small Business Institute, Fact-finding Survey on Business Rechallenge (2002)
(Note) Included in this figure are all respondents in the survey.
Figure 3-14 Bankrupt Owners’ Restart of Enterprises- Of bankrupt enterprise owners who personally went
bankrupt, 13.7% have restarted -
86.3%
Restart 13.7%
Source: Small Business Institute, Fact-finding Survey on Business Rechallenge (2002)
(Note)Included in this figure are bankrupt enterprise managers who said they had gone bankrupt personally.
-Bankrupt enterprise owners depend more on family members, friends and acquaintances for financing when restarting enterprises than when starting-up. Expansion of institutional financing for restarts is a policy issue.
Figure 3-15 Fund-raising Means for Start-ups and Restarts- Compared to start-ups, entrepreneurs depend more on private networks when restarting -
31.3
18.0
0.0
0.7
1.3
0.7
27.9
14.1
15.6
2.7
20.4
5.6
13.7
27.9
0.7
0.0
0 10 20 30 40 50 60 70 80 90 100
Bankrupt enterprise owners’personal funds
Investment and borrowings from owners’ friends and acquaintances
Investment from parent enterprises
Loan facilities of local governments
Borrowings from government financial institutionsBorrowings from private financial institutionsInvestment and borrowings from venture capitals and foundations
(%)Sources: SME Agency, Survey on Environment for Start-ups (December 2001)
Small Business Institute, Fact-finding Survey on Business Rechallenge (2002)(Note) The total exceeds 100 as respondents were allowed to select plural altnernatives.
Included in restarts are bankrupt enterprise managers who have successfully restarted enterprises.
Private networks
Institutional financing
80.9Investment and borrowings from owners’ family members and relatives 41.3
30.0
Investment and borrowings from individuals and corporations supporting business operations Restart
Start-up9.3Investment from trading partners

15
<Accounting Methods that Consider Enterprise Qualities that Cannot Be Measured by Financial Data Alone>
-SMEs depend on borrowing more than large enterprises.Figure 4-1 Fund-raising Structure (FY 2001, by employment size, non-primary industries (the same applies below))
– Larger enterprises have less borrowing and more equity capital –
11.8
20.7
21.8
27.1
12.3
20.5
29.7
39.7
12.5
16.1
8.8
3.6
21.4
16.2
17.5
17.1
8.7
0.9
2.9
33.2
25.6
19.2
12.20.3
0% 10% 20% 30% 40% 50% 60% 70% 80% 90% 100%
Number of employees Short-term borrowings Long-term borrowings Operating liabilities Others Bonds
Source: Ministry of Finance, FY 2001 Financial Statements Statistics of Corporations (reedited and processed)(Notes)1. Each fund-raising category was divided by “liabilities, capital and outstanding discount bills” to determine its share.2. Operating liabilities (inter-business credits) cover bills payable and trade accounts payable. “Others” include outstanding discount bills and reserves.
Borrowings 66.8%
Borrowings 24.1%
Borrowings 41.2%
Borrowings 51.5%
Self capital
0-20 employees
21-100 employees
101-300 employees
301employees -
-On the other hand, the smaller the enterprise, the more difficult it is to borrow the requested amount from banks and the higher the interest rate is.
18.2%
Number of employees
301employees -
101-300 employees
21-100 employees
0-20 employees
Figure 4-2 Percentage Shares for Enterprises Failing to Get Loans from Their Respective Main Banks (By employment size)- Smaller enterprises have more difficulties in getting loans -
Share for enterprises failing to get loans 10.2%
5.3%
2.8%
0.0% 2.0% 4.0% 6.0% 8.0% 10.0% 12.0% 14.0% 16.0% 18.0% 20.0%Source: SME Agency, Survey on Business Financing Environment (November 2002)
(Note) “Enterprises failing to get loans” are those who selected “rejection or reduction of loan requests” when they were asked to select main banks’ most frequent response to their loan requests in the past year.
Figure 4-3 Interest Rates on Short-term Borrowings from Main Banks (by employment size)- Higher short-term borrowing rates for smaller enterprises -
0.47
0.01
0.6
Deviation from an average short-term rate (%)
Average short-term borrowing rate
0.4
0.2
0.0
▲ 0.2
▲ 0.4▲ 0.42
▲ 0.6
▲ 0.700-20 employees 21-100 employees▲ 0.8 101-300 employees Number of employees301employees -
Source: SME Agency, Survey on Business Financing Environment (November 2002)(Notes) 1. Deviation of interest rates on short-term main-bank loans from the average short-term loan rate at the end of October 2002.
2. For any enterprise that had no short-term borrowings at the end of October 2002, the latest short-term borrowing rate was used. For any enterprise that had plural short-term borrowing rates, the highest rate was used.

16
-Keys for SMEs to borrow money smoothly are a) to actively disclose corporate information and b) to build continuous long term relationships where SMEs can communicate more than just financial data to their banks.
Figure 4-4 Shares for Enterprises Failing to Get Loans (in the presence and absence of voluntary information submission)Enterprises that voluntarily submit information to banks can get loans more easily -
Main bank category
-It is also important for SMEs to diversify partner banks in order to prepare for the case that they fail to get loans from main banks. In such cases, regional banks and government financial institutions could play unique roles.
Voluntarily submitted information18.7%Large banksDid not voluntarily submit information
6.9%
12.4%Regional and second-tier regional banks 7.1%
Shinkin banks credit associations and shinsocredit cooperatives
19.9%8.1%
0.0% 5.0% 10.0% 15.0% 20.0%Source: SME Agency, Survey on Business Financing Environment (November 2002)
Figure 4-5 Share of Enterprises Failing to Get Loans (by the number of years of continuous trade with main banks)
25.0%
Number of years of continuous trade with main banks
Source: SME Agency, Survey on Business Fina
14.6%
14.9%
ncing Environment (November 2002)
Share of enterprises failingto get loans
Up to 10 years
11-20 years
11.6%21-30 years
8.2%31-50 years
7.3%Over 50 years
0.0% 2.0% 4.0% 6.0% 8.0% 10.0% 12.0% 14.0% 16.0%
Figure 4-6 Alternative Banks for Enterprises Failing to Get Loans from Main Banks (by main bank category)- Alternative banks for these enterprises include regional and second-tier regional banks, and government financial
institutions for SMEs -
22.5%
13.3%
12.3%
31.3%
31.9%
28.8%
25.9%
27.5%39.2%
8.8%
9.4%
31.9%Large banks
Main bank category Large banksRegional and second-tier regional banks
Shinkin banks credit associations and shinso credit cooperativesGovernment financial institutions for SMEs
Others36.0%Regional and second-tier
regional banks 32.4%
Shinkin banks credit associations and shinsocredit cooperatives
37.5%
0.0% 5.0% 10.0% 15.0% 20.0% 25.0% 30.0% 35.0% 40.0% 45.0% 50.0%Source: SME Agency, Survey on Business Financing Environment (November 2002)

17
-As for interest rates, SMEs that voluntarily submit information to main banks and build long-term business relationships can get lower interest rates on borrowingsthan those that do not do so. Knowledge of interest rates is also important for SMEs.
Figure 4-7 Short-term Borrowings Rates (in the presence and absence of voluntary information submission) - Interest rates on borrowings are lower for enterprises that voluntarily submit information to banks -
Deviation from average short-term interest rate (%)
0.8
▲ 0.14
0.19
0.660.56Voluntarily submitted
information Did not voluntarily submit information
0.6
0.4
0.2
0.0▲ 0.01
▲ 0.2
▲ 0.4Regional and second
regional banksShinkin banks credit associations and
shinso credit cooperatives▲ 0.48
▲ 0.6Large banks Main bank category
Source: SME Agency, Survey on Business Financing Environment (November 2002)
Figure 4-8 Short-term Borrowing Rates (by number of years ofcontinuous trade with main banks)- Interest rates are lower for enterprises that have longer trading relations with main banks -
0.21
0.09
Deviation from average short-term interest rate (%)0.3 0.24
0.2
0.1
0.0
▲ 0.1
▲ 0.15▲ 0.2
▲ 0.3▲ 0.29
▲ 0.4Up to 10 years 11-20 years 21-30 years 31-50 years Over 50 years
Number of years for continuous trade with main banksSource: SME Agency, Survey on Business Financing Environment (November 2002)
Figure 4-9 Short-term Borrowing Rates (in the presence and absence of interest rate knowledge)- Interest rates are lower for enterprises that have sufficient interest rate knowledge -
0.530.6
Deviation from average short-term interest rate (%)
Rich in interest rate knowledge
Poor in interest rate knowledge
0.40.20 0.180.2
0.0
▲ 0.2▲ 0.24▲ 0.26
▲ 0.4
▲ 0.6 ▲ 0.52 ▲ 0.55
▲ 0.8 ▲ 0.74
▲ 1.00-20 employees 21-100 employees 101-300 employees 301employees -
Number of employeesSource: SME Agency, Survey on Business Financing Environment (November 2002)(Note) Enterprises that are “rich in interest rate knowledge” are those that know the deviation of their short-term borrowings rates from bank-fixed short-term prime lending rates.
18
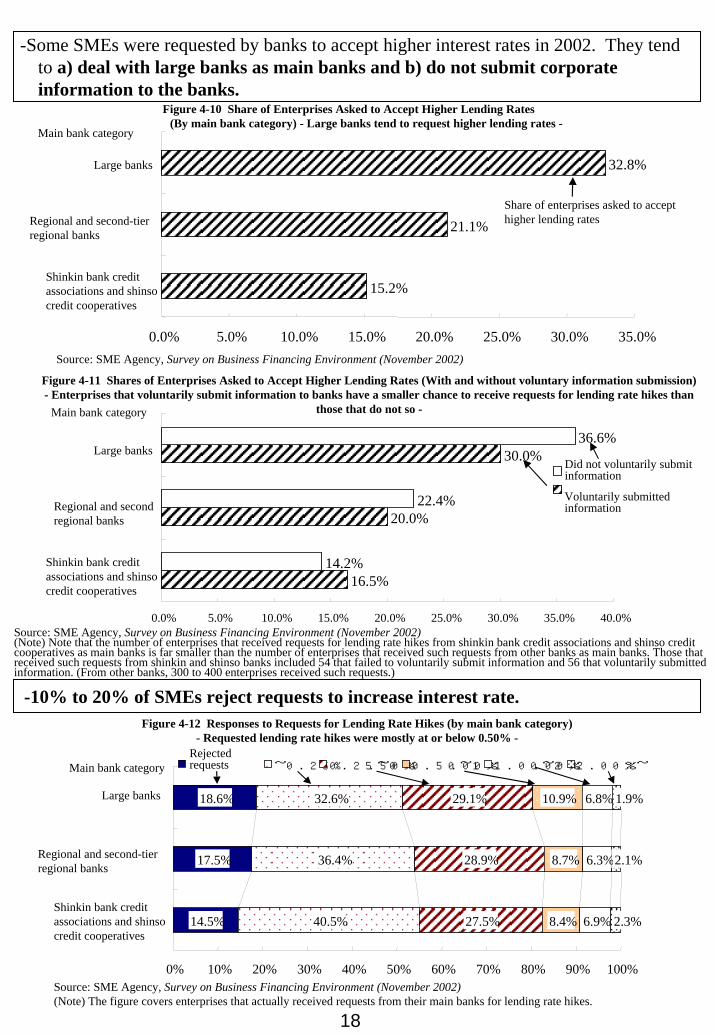
-Some SMEs were requested by banks to accept higher interest rates in 2002. They tend to a) deal with large banks as main banks and b) do not submit corporate information to the banks.
Figure 4-10 Share of Enterprises Asked to Accept Higher Lending Rates (By main bank category) - Large banks tend to request higher lending rates -
15.2%
21.1%
Shinkin bank credit associations and shinsocredit cooperatives
Regional and second-tier regional banks
Large banks
Main bank category
Share of enterprises asked to accept higher lending rates
32.8%
0.0% 5.0% 10.0% 15.0% 20.0% 25.0% 30.0% 35.0%Source: SME Agency, Survey on Business Financing Environment (November 2002)
Figure 4-11 Shares of Enterprises Asked to Accept Higher Lending Rates (With and without voluntary information submission)- Enterprises that voluntarily submit information to banks have a smaller chance to receive requests for lending rate hikes than
those that do not so -Main bank category
-10% to 20% of SMEs reject requests to increase interest rate.
Source: SME Agency, Survey on Business Financing Environment (November 2002)(Note) Note that the number of enterprises that received requests for lending rate hikes from shinkin bank credit associations and shinso credit cooperatives as main banks is far smaller than the number of enterprises that received such requests from other banks as main banks. Those that received such requests from shinkin and shinso banks included 54 that failed to voluntarily submit information and 56 that voluntarily submitted information. (From other banks, 300 to 400 enterprises received such requests.)
14.2%
30.0%36.6%
Did not voluntarily submitinformation
Large banks
Voluntarily submitted information
16.5%
20.0%22.4%Regional and second
regional banks
Shinkin bank credit associations and shinsocredit cooperatives
0.0% 5.0% 10.0% 15.0% 20.0% 25.0% 30.0% 35.0% 40.0%
Figure 4-12 Responses to Requests for Lending Rate Hikes (by main bank category)- Requested lending rate hikes were mostly at or below 0.50% -
14.5%
17.5%
18.6%
40.5%
36.4%
32.6%
27.5%
28.9%
29.1%
8.4%
8.7%
10.9%
6.9%
6.3%
6.8%
2.3%
2.1%
1.9%
Rejected requests ~0.25% 0.25~0.50% 0.50~1.00% 1.00~2.00% 2.00%~Main bank category
Large banks
Regional and second-tier regional banks
Shinkin bank credit associations and shinsocredit cooperatives
0% 10% 20% 30% 40% 50% 60% 70% 80% 90% 100%Source: SME Agency, Survey on Business Financing Environment (November 2002)(Note) The figure covers enterprises that actually received requests from their main banks for lending rate hikes.

19
- Main banks which have experienced mergers tend to tighten their lending attitudes. For enterprises, it is more difficult to borrow money from such banks than from other banks. SME policy is necessary in respect of bank mergers.
Figure 4-13 Shares of Enterprises Failing to Procure Loans (from main banks with and without merger experiences)
- Enterprises whose main banks have experienced mergers have a greater chance to have their loan requests rejected -
26.4%
1.9%
4.6%
9.4%
17.0%Up to 20
Employment size Without merger experiencesWith merger experiences
21-10013.8%
101-300 6.8%
Over 300 3.9%
0.0% 5.0% 10.0% 15.0% 20.0% 25.0% 30.0%
Source: SME Agency, Survey on Business Financing Environment (November 2002)(Note) Merger experiences are those since 1997.
- A failure of a main bank has especially negative effects on small enterprises.
Figure 4-14 Effects of Main Bank Failures on Borrowers (by employment size)- Main bank failures have negative effects on many enterprises -
36.4%
31.8%
32.9%
47.1%
59.1%
59.1%
64.4%
48.6%
9.1%
4.3%
4.5%
2.7%
Employment size Negative effects No effect Positive effects
Up to 20
21-100
101-300
Over 300
100%0% 10% 20% 30% 40% 50% 60% 70% 80% 90%
Source: SME Agency, Survey on Business Financing Environment (November 2002)(Note) Negative effects mean tighter lending attitudes and terms by failed main banks,
and disadvantages and inconveniences for borrowers. Positive effects mean the opposite.

20
-An analysis of financial data from 250,000 SMEs shows that, even if SMEs had been experiencing ordinary losses or liability overflows, many of them achieved profits in a few years or solved liability overflows by their sales efforts in a severe situation. Financial institutions should develop their capacity to identify capabilities that do not appear in financial statements of SMEs.
any SMEs recover from losses to and return to healthy -
68.6%
47.7%
14.4%
9.1%
2.1%
1.9%
14.7%
24.4%
3.0%
39.1%
5.9%
33.4%
4.8%
12.3%
33.2%
24.8%
8.8%
9.6%
19.6%
22.3%Liability overflow
and ordinary losses
Liability overflows
Ordinary losses
Healthy
FY1998 financial conditions
FY 2001 financial conditions
Source: SME Credit Risk Database (Subject to tabulation were 251,490 enterprises that had data for fiscal 1998 and 2001, and about default)(Notes) 1. Healthy operation means without ordinary losses and liability overflows. 2.Default means SMEs with debt repayments in arrears for more than
three months in principle, those assessed as de-facto or clearly bankrupt by banks, or those subjected to subrogation by credit guarantee associations.
Healthy Ordinary losses Liability overflows Liability overflows
and ordinary losses
Default
Recovering enterprises 47.7%
Recovering enterprises 16.5%
Recovering enterprises 44.4%
Figure 4-15 Financial Data in FY 1998 and 2001 -M
-Banks put priority on outward criteria such as financial statements and security packages. On the other hand, they are reluctant to look into business strengths and weaknesses of SMEs, growth potential and other aspects. Therefore, financial institutions need to enhance their capacities as “connoisseurs” who place value on aspects which do not appear on the financial statements in order to facilitate financial supply to various SMEs.
Figure 4-16 Priority Aspects for Banks in Screening SME Loan Requests-Many banks put priority on financial statements and credit guarantees -
Source: Small Business Institute, Survey of SME Loans (January 2003)(Note) The total exceeds 100 as respondents were allowed to select plural alternatives.
4%0.9%
39.4%
20.8%
3.4%
58.2%
8.3%22.2%
15.3%6.4% 9.0%15.1%
39.7%64.7%
23.9% 23.1%
0.0% Industry Category
Size
Debt redem
ptioncapacity
Safety
Profitability
Grow
th potential
Real estate collateral
Non-real estate
physical collateral
Guarantee by credit
guarantee association
Personal guarantee
Representatives’
personality
Representatives’
personal assets
Representatives’
bankruptcy history
Business foundation
Business strengths and
weak points
Frequency and quality of inform
ation disclosure
Outsider assessm
ent
Main bank or not
Moves of other banks
Attribute Financial data Safeguard Qualitative information Bank transaction conditions
80.0%
60.0%43.6%
-Rigid lending attitudes by financial institutions can lead them to lose SMEs that can be promising customers. This might be a key loss to the institutions.
Figure 4-17 Main Banks’ Responses and Share of Enterprises that Changed Main Banks
Share of enterprises that changed main banks in 2002
-SMEs that were confronted with negative responses by main banks to loan requests tend to change main banks -
0.4%
1.6%
0.0% 0.2% 0.4% 0.6% 0.8% 1.0% 1.2% 1.4% 1.6% 1.8%
Accepted loan requests
Rejected loan requestsMain banks’
responses in 2001
Sources: SME Agency, Survey on Fund-Raising Environment for Enterprises (December 2001), Survey on Business Financing Environment (November 2002)(Note) The gap is sufficiently significant in terms of statistics.
8.20.0%26.0%
38.1%40.0%

21
-More than 80% of enterprise financing is conducted by deposit-taking financial institutions such as banks. Insurance companies, pension funds and non-banks are also used. Although bank loans are mainly backed by land collateral, SMEs have trade accounts receivable and notes in equivalent amounts to land assets.
Figure 4-18 Breakdown of Outstanding Loans to Enterprises by Category of Financial Institutions (As of the end of September 2002)
-Deposit-taking financial institutions account for about 80% of loans to enterprises-Non-bank lenders(Finance companies)
4.6%Others 3.9%
Source: Bank of Japan, Flow of Funds
Deposit-taking financial Institutions 83.7%
Insurance companies and pension funds 7.8%
Assets owned by SMEs(capitalized at 100 million JPY or less)
Cash and deposits 77.2 trillionTrade accounts receivable and notes
85.3 triLand 74.1 tr
-The SME Agency has tackled the diversification of financing for SMEs. It has implemented the guarantee system for loans backed by trade accounts receivablesince December 2001. Also, it has supported the securitization of accounts receivable in cooperation with government financial institutions since February 2003. It is important for SMEs to make use of such new financing methods.
SMEs
LoansFinancial institutions
Trade accounts receivable
Transfer Collateral (Quasi-co-sharing)
Credit GuaranteeAssociations
Trading partners
Partial Guarantee
The Credit Guarantee Association guarantees the loan that a financial institution provides to an SME which transfers trade accounts receivable as collateral to the Association and the institution.
Figure 4-19 Outline of Guarantee System for Loans backed by Trade Accounts Receivable
(Borrowers)
(Lenders )
(Buyers) (Sellers/Suppliers)
SME Financialinstitutions
TransferAccounts receivable
Accounts receivable
UnderwritingSecurities
Providing funds as necessary
Accepting securities ascollateral
SME
Purchaser
Purchaser
1. An SME transfers/entrusts accounts receivable to a financial institution for financing.2. The institution issues securities backed by the accounts receivable.3. Shoko Chukin Bank underwrites a part of the securities.4. Bank of Japan accepts a part of the securities as eligible collateral.(This process makes it easier for investors to get funds by securities.)
Figure 4-20 Outline of Support for Securitization of Trade Accounts Receivable
Shoko Chukin Bank
Investors
BanksBank
of Japan
22
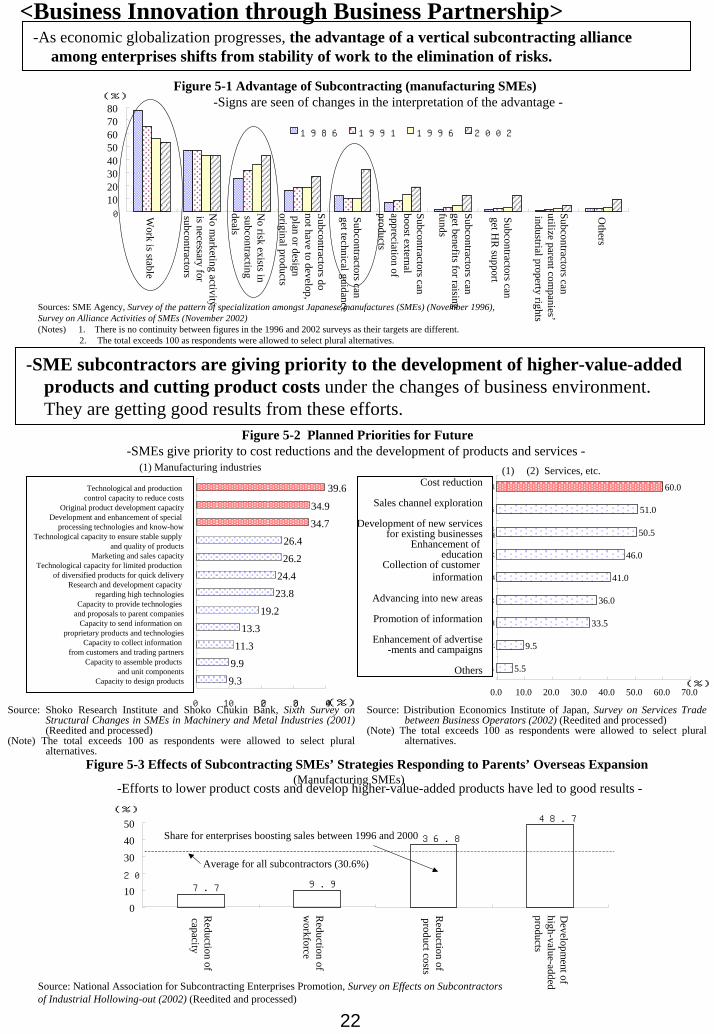
<Business Innovation through Business Partnership>
-SME subcontractors are giving priority to the development of higher-value-added products and cutting product costs under the changes of business environment. They are getting good results from these efforts.
(1) (2) Services, etc.
Source: Shoko Research Institute and Shoko Chukin Bank, Sixth Survey on Structural Changes in SMEs in Machinery and Metal Industries (2001)(Reedited and processed)
(Note) The total exceeds 100 as respondents were allowed to select plural alternatives.
Source: Distribution Economics Institute of Japan, Survey on Services Trade between Business Operators (2002) (Reedited and processed)
(Note) The total exceeds 100 as respondents were allowed to select plural alternatives.
0
1020304050607080
Work is stable
No m
arketing activityis necessary forsubcontractors
No risk exists in
subcontracting deals
Subcontractors donot have to develop,plan or design original products
Subcontractors can get technical guidance
Subcontractors can boost external appreciation of products
Subcontractors canget benefits for raising funds
Subcontractors can get H
R support
Subcontractors can utilize parent com
panies’industrial property rights
Others
(%)
1986 1991 1996 2002
Sources: SME Agency, Survey of the pattern of specialization amongst Japanese manufactures (SMEs) (November 1996), Survey on Alliance Activities of SMEs (November 2002)(Notes) 1. There is no continuity between figures in the 1996 and 2002 surveys as their targets are different.
2. The total exceeds 100 as respondents were allowed to select plural alternatives.
34.9
34.726.4
26.2
24.4
23.8
19.2
13.3
11.3
9.99.3
0 10 20 30 40(%)
60.0
51.0
50.5
46.0
41.0
36.0
33.5
9.5
5.5
0.0 10.0 20.0 30.0 40.0 50.0 60.0 70.0
コ ス ト 低 減
販 路 開 拓
現 行 事 業 に お け る新 サ ー ビ ス の 開 発
教 育 の 徹 底
顧 客 情 報 の 収 集
新 分 野 進 出
情 報 化 の 推 進
広 告 宣 伝 の 強 化
そ の 他
(%)
Cost reduction
Sales channel exploration
Development of new servicesfor existing businesses
Enhancement of education
Collection of customer information
Advancing into new areas
Promotion of information
Enhancement of advertise-ments and campaigns
Others
7.7 9.9
36.8
48.7
Reduction of
capacity
Reduction of
workforce
Reduction of
product costs
Developm
ent of high-value-added products
(%)
Source: National Association for Subcontracting Enterprises Promotion, Survey on Effects on Subcontractors of Industrial Hollowing-out (2002) (Reedited and processed)
Average for all subcontractors (30.6%)
Share for enterprises boosting sales between 1996 and 2000
Figure 5-3 Effects of Subcontracting SMEs’ Strategies Responding to Parents’ Overseas Expansion(Manufacturing SMEs)
-Efforts to lower product costs and develop higher-value-added products have led to good results -
-As economic globalization progresses, the advantage of a vertical subcontracting alliance among enterprises shifts from stability of work to the elimination of risks.
Figure 5-1 Advantage of Subcontracting (manufacturing SMEs)-Signs are seen of changes in the interpretation of the advantage -
Figure 5-2 Planned Priorities for Future-SMEs give priority to cost reductions and the development of products and services -
(1) Manufacturing industries
39.6Technological and production control capacity to reduce costs
Original product development capacityDevelopment and enhancement of special
processing technologies and know-howTechnological capacity to ensure stable supply
and quality of productsMarketing and sales capacity
Technological capacity for limited production of diversified products for quick delivery
Research and development capacity regarding high technologies
Capacity to provide technologies and proposals to parent companies
Capacity to send information on proprietary products and technologies
Capacity to collect information from customers and trading partners
Capacity to assemble products and unit components
Capacity to design products
504030
20
100

23
-Business cooperation activities in the form of horizontal partnership among enterprises have various purposes. Cooperative purchasing and cooperative R&D can improve the performance of SMEs.
Figure 5-4 Purposes of Category-wise Business Cooperation Deals(Manufacturing, wholesale and retail SMEs)
61.2
39.0
24.327.8
15.0
26.3
27.3
14.8
23.0
10.7
11.2
Covering knowledge and know-how shortfallsCovering knowledge and know-how shortfallsSynergy effects of participants’ combined business resourcesEnhancement of positions against competitors and trading partnersReducing business risksSaving time for business operations
- A single category of deals has diversified purposes -
Cooperative R&D
48.1Cooperative buying
0.0 10.0 20.0 30.0 40.0 70.0(%)Source: SME Agency, Survey on Alliance Activities of SMEs (November 2002)
(Note) The total exceeds 100 as respondents were allowed to select plural alternatives.Figure 5-5 Effects of Business Cooperation Activities (Manufacturing, wholesale and retail SMEs)
50.0 60.0
-Business cooperation activities can improve enterprise performances -(%)
-SMEs that participated in inter-industry exchange programs tend to try business cooperation activities. In this sense, inter-industry exchange programs can work as a seedbed for business cooperation.
Figure 5-6 Share for Inter-industry Exchange Program Participants engaged in Business Cooperation(Manufacturing, wholesale and retail SMEs)-Inter-industry exchange programs can work as a seedbed for business cooperation.
37.7
20.8
Inter-industry exchange program participants
Enterprises other than inter-industry exchange program participants
Share for enterprises engaged in business cooperation
0.0 5.0 10.0 15.0 20.0 25.0 30.0 35.0 40.0(%)Source: SME Agency, Survey on Alliance Activities of SME (November 2002)
30.4
24.8
46.6
53.9
Shares for enterprises that improved operating profit on sales60.0Shares for enterprises that boosted sales
50.0
40.0
30.0
20.0
10.0
0.0Cooperative R&D No cooperative R&D Cooperative buying No cooperative buying
Source: SME Agency, Survey on Alliance Activities of SMEs (November 2002)(Note) Enterprises that boosted sales are those whose sales increased from fiscal 1997 to 2001. Enterprises that improved operating profit on
sales are those whose operating profit improved during the same period (including those whose operating loss narrowed).
24
第5-8図 産学連携に取り組む企業と成果を上げている企業の属性の違い(製造業・中小企業)~成果を上げる企業の方が取り組みにくい状況にある~
▲ 8▲ 6▲ 4▲ 2
02468
10
Less
than
30y
ears
30-3
9 ye
ars
40-4
9 ye
ars
50-5
9 ye
ars
60-6
9 ye
ars
70-7
9 ye
ars
80 y
ears
or m
ore
50 o
r few
er
51-1
00
101-
300
Mor
e th
an 3
00
(%)
010
2030405060(%)
Sources: METI, Basic Survey of Japanese Business Structure and Activities (1998) (Reedited and processed); METI and SME Agency, Basic Survey of Commercial and Manufacturing Structure and Activity (1998) (Reedited and processed); Survey on Business Management Strategies (November 2002)(Note) The deviation from average sales growth is the gap between the average sales growth for all enterprises conducting business-academia collaboration and the average for enterprises in each category.
Enterprise Age Employment SizeWhether managers are in charge of development
Deviation from average sales growth after launchingbusiness-academia collaboration (left scale)
Share for enterprises launching business-academia collaboration(right scale)
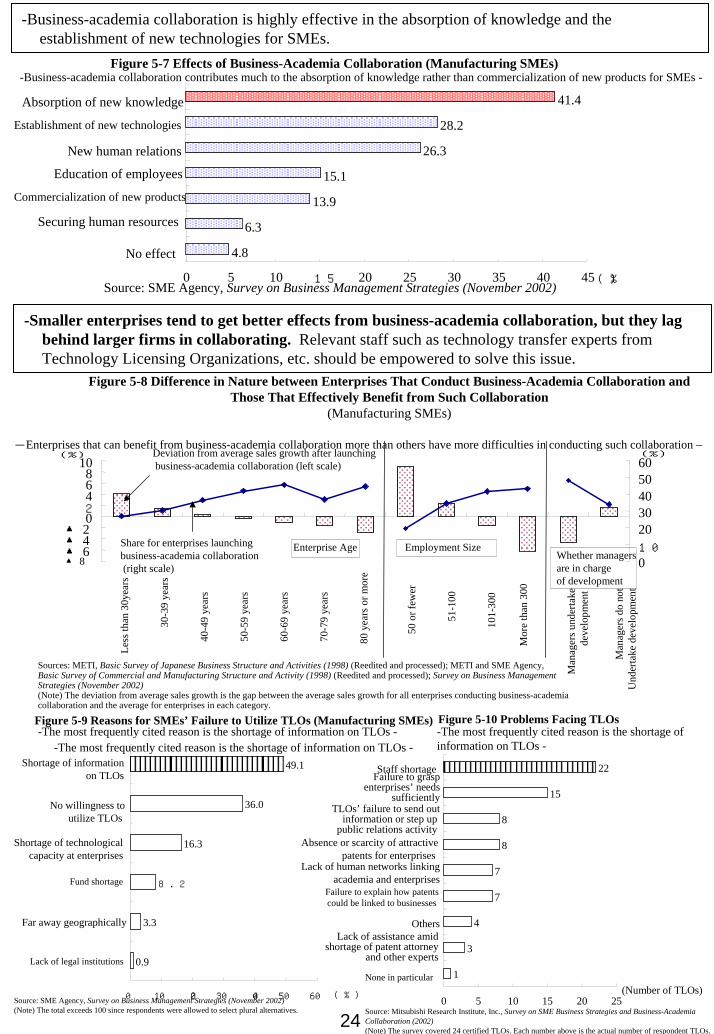
Figure 5-8 Difference in Nature between Enterprises That Conduct Business-Academia Collaboration and Those That Effectively Benefit from Such Collaboration
(Manufacturing SMEs)
-Enterprises that can benefit from business-academia collaboration more than others have more difficulties in conducting such collaboration –
-Business-academia collaboration is highly effective in the absorption of knowledge and the establishment of new technologies for SMEs.
-Smaller enterprises tend to get better effects from business-academia collaboration, but they lag behind larger firms in collaborating. Relevant staff such as technology transfer experts from Technology Licensing Organizations, etc. should be empowered to solve this issue.
Figure 5-9 Reasons for SMEs’ Failure to Utilize TLOs (Manufacturing SMEs)-The most frequently cited reason is the shortage of information on TLOs -
49.1
8.2
3.3
0.9
0 10 20 30 40 50 60
Far away geographically
Lack of legal institutions
Source: SME Agency, Survey on Business Management Strategies (November 2002)(Note) The total exceeds 100 since respondents were allowed to select plural alternatives.
Figure 5-10 Problems Facing TLOs
15
7
0 5 10 15 20 25
Staff shortageFailure to grasp
enterprises’ needs sufficiently
TLOs’ failure to send outinformation or step up
public relations activityAbsence or scarcity of attractive
patents for enterprisesLack of human networks linking
academia and enterprisesFailure to explain how patents could be linked to businesses
OthersLack of assistance amid
shortage of patent attorney and other experts
None in particular(Number of TLOs)
Source: Mitsubishi Research Institute, Inc., Survey on SME Business Strategies and Business-Academia Collaboration (2002)(Note) The survey covered 24 certified TLOs. Each number above is the actual number of respondent TLOs.
41.4
28.2
26.3
15.1
13.9
6.3
4.8
0 5 10 15 20 25 30 35 40 45
Absorption of new knowledge
Establishment of new technologies
New human relations
Education of employees
Commercialization of new products
Securing human resources
No effect
(%)Source: SME Agency, Survey on Business Management Strategies (November 2002)
Figure 5-7 Effects of Business-Academia Collaboration (Manufacturing SMEs)-Business-academia collaboration contributes much to the absorption of knowledge rather than commercialization of new products for SMEs -
Man
ager
s und
erta
kede
velo
pmen
t
Man
ager
s do
not
Und
erta
kede
velo
pmen
t
-The most frequently cited reason is the shortage of information on TLOs --The most frequently cited reason is the shortage of information on TLOs -
Shortage of information on TLOs
22
36.0No willingness toutilize TLOs 8
Shortage of technological capacity at enterprises
16.3 8
Fund shortage
7
4
3
1
(%)

25
-One of the major reasons for opening shops is the availability of incentives for utilization of vacancies in shopping areas in small and medium-sized rural cities.
Figure 5-11 New Market Participants’ Reasons for Opening Stores
-In shopping areas in small and medium-sized rural cities, the availability of incentives for utilization of vacant stores is a major reason -
Shopping streets’ strong attractiveness for visitors
Specific business types or categories are promising
Absence of competitors on a shopping street
Part of a multi-store strategy
Part of business diversificationIncentives for utilization of vacancies
on shopping streetsPositive solicitation by shopping area associations
Advice by business diagnosis and other consultants
Seminars, workshops and other self-development opportunities
Others
For all shopping areas
For shopping areas in small and medium-sized rural cities
Good location of store sites
0 10 20 30 40 50 60(%)
Source: Shoko Research Institute, Survey on Store Openings and Closings on Shopping Streets (2002)(Notes) 1. Small and medium-sized rural cities are cities with population of less than 200,000.
2. The total exceeds 100 since respondents were allowed to select plural alternatives.
-The combination of utilization of internal resources and the facilitation of business environments promotes vitalization of shopping areas.
Figure 5-12 New Store Openings by Categories of Activity
- Activities for the utilization of internal resources and the facilitation of businessenvironments vitalize shopping areas -
外部資源呼び込み型を実施
内部資源活用型を実施
事業環境整備型を実施
Campaigns for attracting outside resources(Inviting outsiders to open new stores)
Campaigns for utilizing internalresources (Assistance for transforming
existing stores, associations’development and management)facilities that attract visitors, etc.)
Campaigns for developing businessenvironments
(Unique events, assistance for storeopenings, etc.)
2.7いずれも実施していない Average for all shopping areas(3.4)
No campaign
3.5
4.8
3.8
0 1 2 3 4 5Source: Shoko Research Institute, Survey on Store Openings and Closings on Shopping Streets (2002) (Reedited and processed)
(Notes)1. For each shopping street, the number of new store openings in the past five years is converted into a number per 100 stores. Then, an average is calculated for each
campaign category.2. Since respondents were allowed to select plural alternative categories, the above figures fail to specify if respondents conducting campaigns for attracting outsideresources implemented campaigns for utilizing internal resources.
(stores)
26
(Conclusion)
Road to Revitalization and “Entrepreneur Society”
- SMEs are diversified and change dynamically. Even in the severe business environment, some SMEs can quickly revive their performance. However, not all SMEs have necessarily achieved this. Only SMEs that steadily implement innovations and enhance their profitability can survive and revive. The establishment of an “entrepreneur society,” which produces a large number of such SMEs, will lead to the revitalization of the Japanese economy.