Embed Size (px)
Citation preview


OUTLINE
Microarrays Processing Microarray Data
– K- Means Clustering– Hierarchical Clustering– SOM

Microarrays
Gene Expression:– We see difference between cels because of
differential gene expression,– Gene is expressed by transcribing DNA intosingle-
stranded mRNA,– mRNA is later translated into a protein,– Microarrays measure the level of mRNA
expression
Microarrays
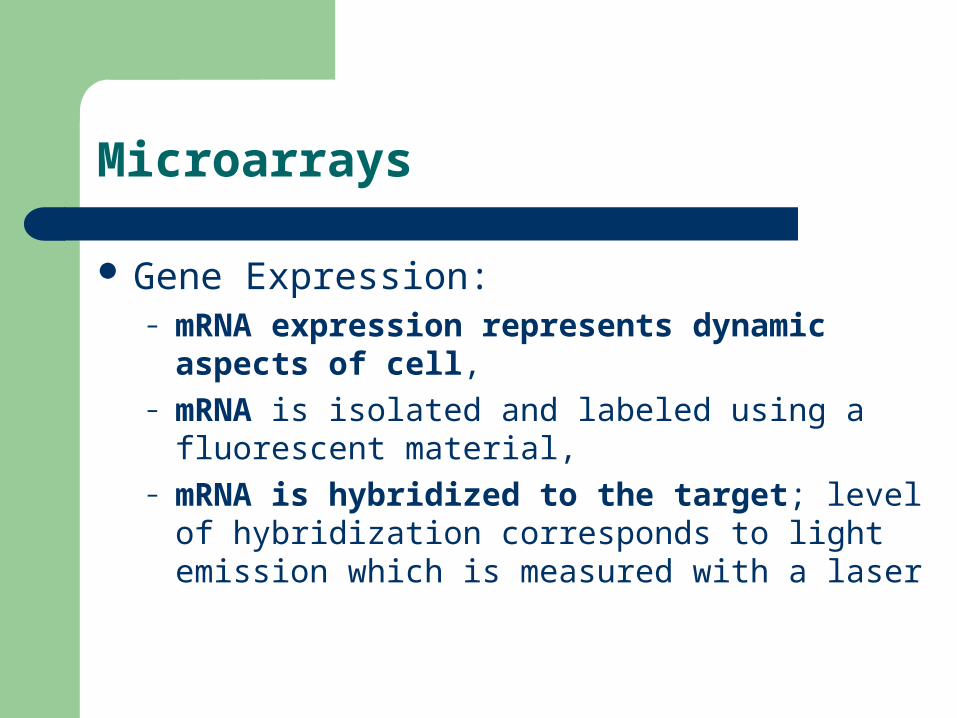
Gene Expression:– mRNA expression represents dynamic aspects of
cell,– mRNA is isolated and labeled using a fluorescent
material,– mRNA is hybridized to the target; level of
hybridization corresponds to light emission which is measured with a laser

Microarrays

Microarrays

Microarrays

Microarrays

Microarrays
Animation (by A. Malcolm Campbell):
– http://www.bio.davidson.edu/Courses/genomics/chip/chip.html

Microarrays
Sample Application (oncotypeDX):
http://www.oncotypedx.com/en-US/Breast.aspx

Microarrays
Sample Application (oncotypeDX):
– VIDEO
http://www.oncotypedx.com/en-US/Breast.aspx

Processing Microarray Data
Problems:– Extract data from microarrays,– Analyze the meaning of the multiple arrays.

Processing Microarray Data

Processing Microarray Data
Differentiating gene expression:
– R = G not differentiated
– R > G up-regulated
– R < G down regulated

Processing Microarray Data
Problems:– Extract data from microarrays,– Analyze the meaning of the multiple arrays.

Processing Microarray Data
Characteristics of microarray data:– Experiment = (gene1, gene2,…, geneN )– Gene = (experiment1, experiment2, …, experimentM)– N is often on the order of 104
– M is often on the order of 101

Processing Microarray Data
Microarray data:

Processing Microarray Data
Data Analysis:– Clustering:
What genes have similar functions, Subdivide genes or experiments into meaningful classes.
– Classification: Can we correctly classify an unknown experiment or gene
into a known class? FOR EXAMPLE: Can we make better treatment decisions for
a cancer patient based on gene expression profile?

Processing Microarray Data
Clustering:– Find classes in the data,– Identify new classes,– Identify gene correlations,– Methods:
K-means clustering, Hierarchical clustering, Self Organizing Maps (SOM)

Processing Microarray Data
Distance Measures:– Euclidean Distance:
– Manhattan Distance:

Processing Microarray Data
K-means Clustering:– Break the data into K clusters,– Start with random partitioning,– Improve it by iterating.

Processing Microarray Data
K-means Clustering:– Select # of clusters, say k,– Repeat
Select k random centroids, {m1, m2,…, mk}, Assign points (genes in this case) to the cluster of closest
centroid by using a distance measure, Compute new centroids, {m1, m2,…, mk},
– until no change to any centroid.

Processing Microarray Data
K-means Clustering:
Processing Microarray Data
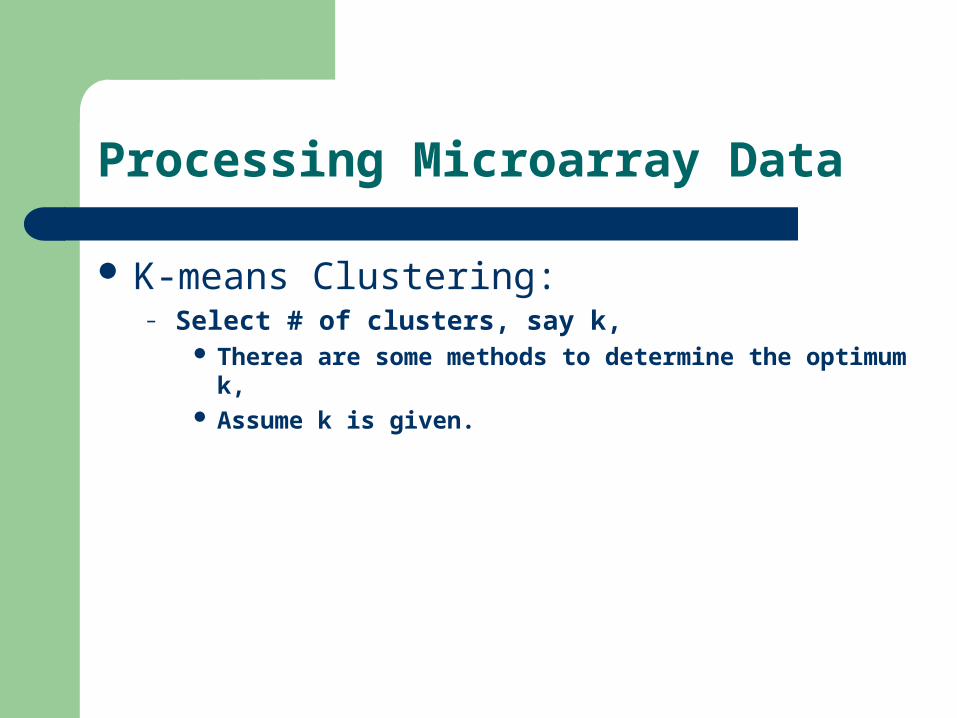
K-means Clustering:– Select # of clusters, say k,
Therea are some methods to determine the optimum k, Assume k is given.

Processing Microarray Data
K-means Clustering:– Select k random centroids, {m1, m2,…, mk},
Just randomly assign the centroids.

Processing Microarray Data
K-means Clustering:– Assign points (genes in this case) to the cluster of closest
centroid by using a distance measure, Use the following formula to find the closest centroid to the
gene gi:
Then assign gene gi to the closest centroid.
),(min ijj gmd

Processing Microarray Data
K-means Clustering:– Compute new centroids, {m1, m2,…, mk},
Find the average in the cluster:
Where:– mc: centroid of the cluster c,– Nc: the number of points in cluster c,– gi: the points in cluster c.
cN
ii
cc g
Nm
1
1
Processing Microarray Data
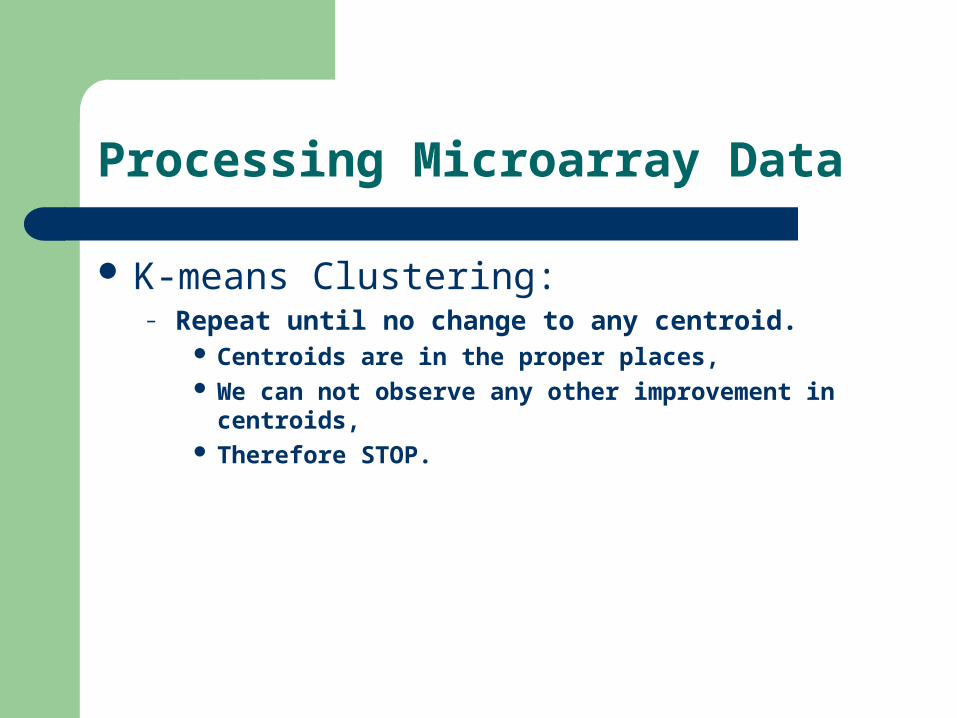
K-means Clustering:– Repeat until no change to any centroid.
Centroids are in the proper places, We can not observe any other improvement in centroids, Therefore STOP.
Processing Microarray Data
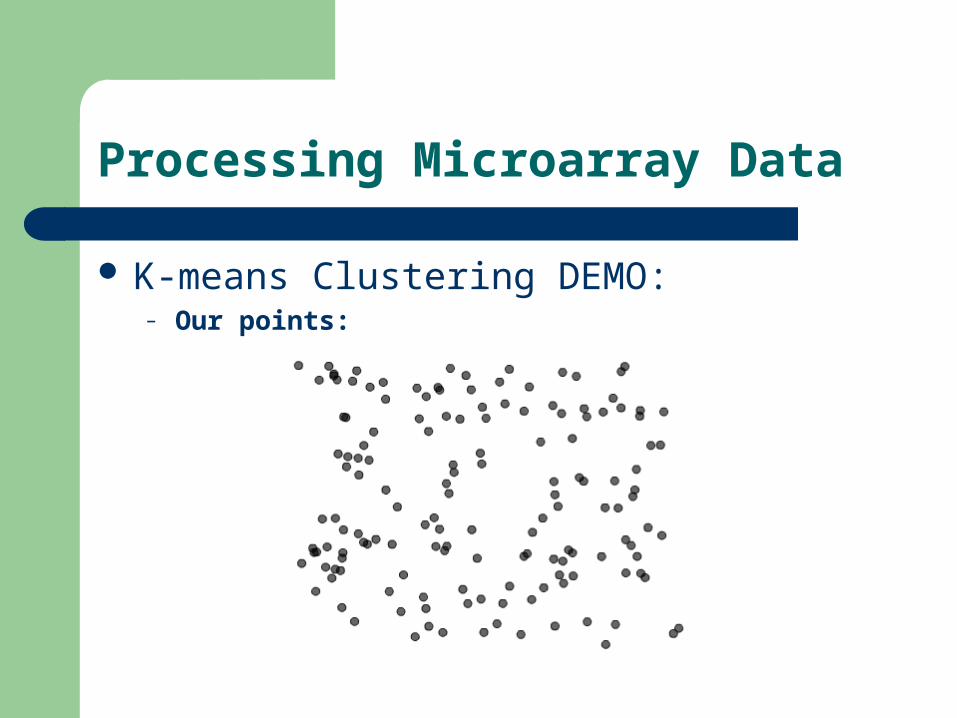
K-means Clustering DEMO:– Our points:

Processing Microarray Data
K-means Clustering DEMO:– Centroids (4 centroids, squares):

Processing Microarray Data
K-means Clustering DEMO:– Assign each point to the closest centroid:

Processing Microarray Data
K-means Clustering DEMO:– Re evaluate the centroids:

Processing Microarray Data
K-means Clustering DEMO:– Iterate until no change.

Processing Microarray Data
K-means Clustering DEMO 2:

Processing Microarray Data
Hierarchical Clustering:– Similar to costruction of phylogenetic tree,– A distance matrix for all genes are constructed based
on distances between their expression profiles.– Neighbor-joining or UPGMA can be applied on this
matrix to get a hierarchical cluster.– Single linkage, complete linkage, average linkage
clustering

Processing Microarray Data
Hierarchical Clustering:– Single linkage: the distance between two clusters is
given by the value of the shortest link between the clusters

Processing Microarray Data
Hierarchical Clustering:– Complete linkage: the distance between two clusters
is given by the value of the longest link between the clusters

Processing Microarray Data
Hierarchical Clustering:– Average linkage: the distance between two clusters is
defined as the average of distances between all pairs of objects
– like UPGMA

Processing Microarray Data
Hierarchical Clustering:– Linkage Criteria:

Processing Microarray Data
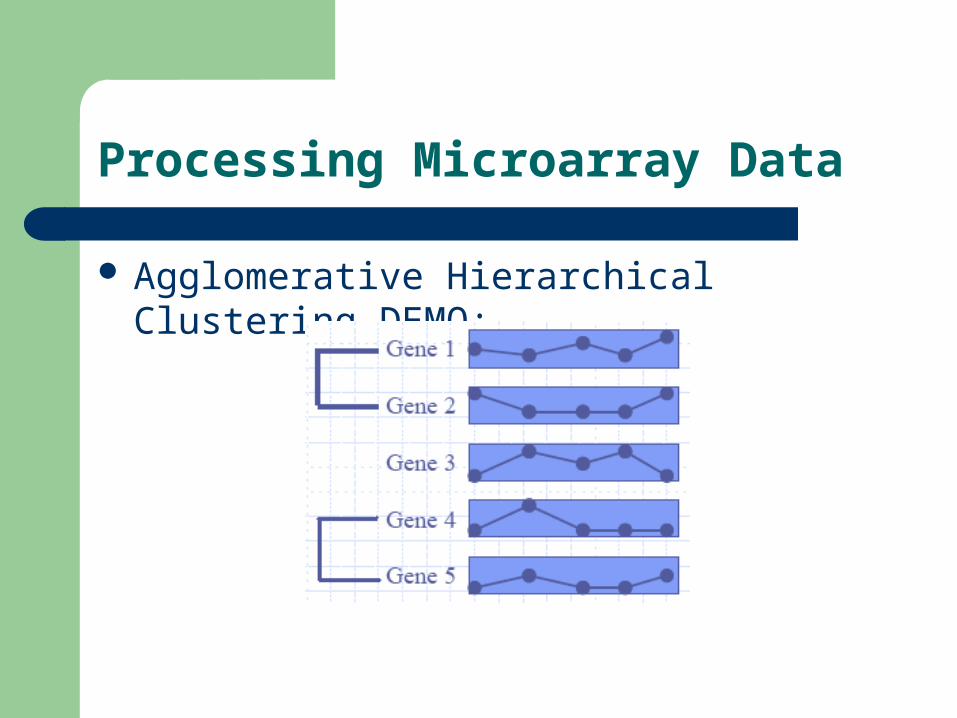
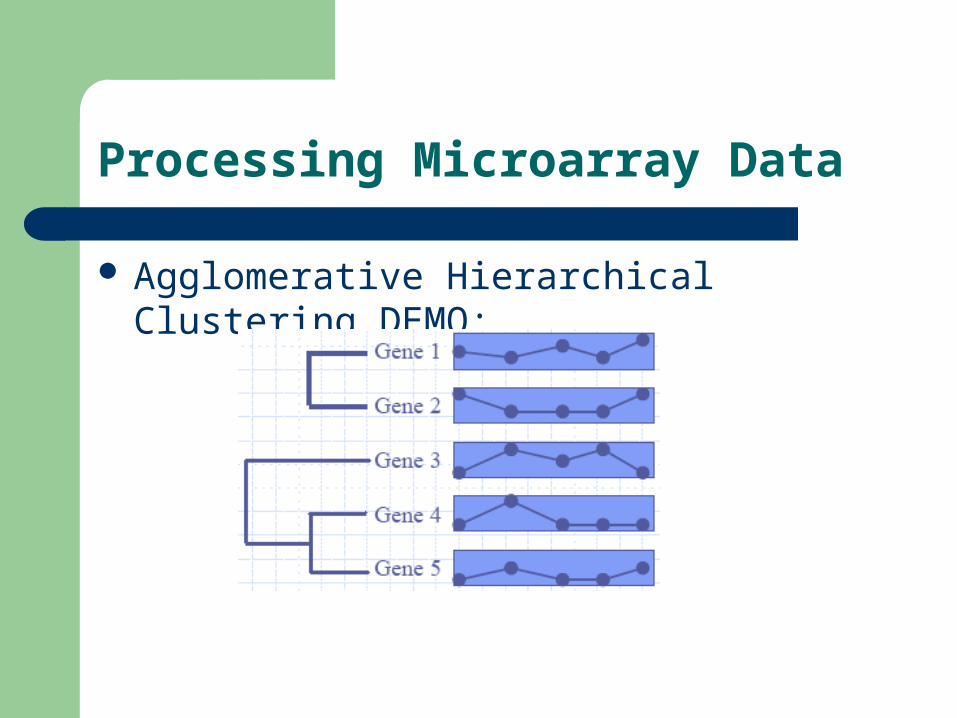
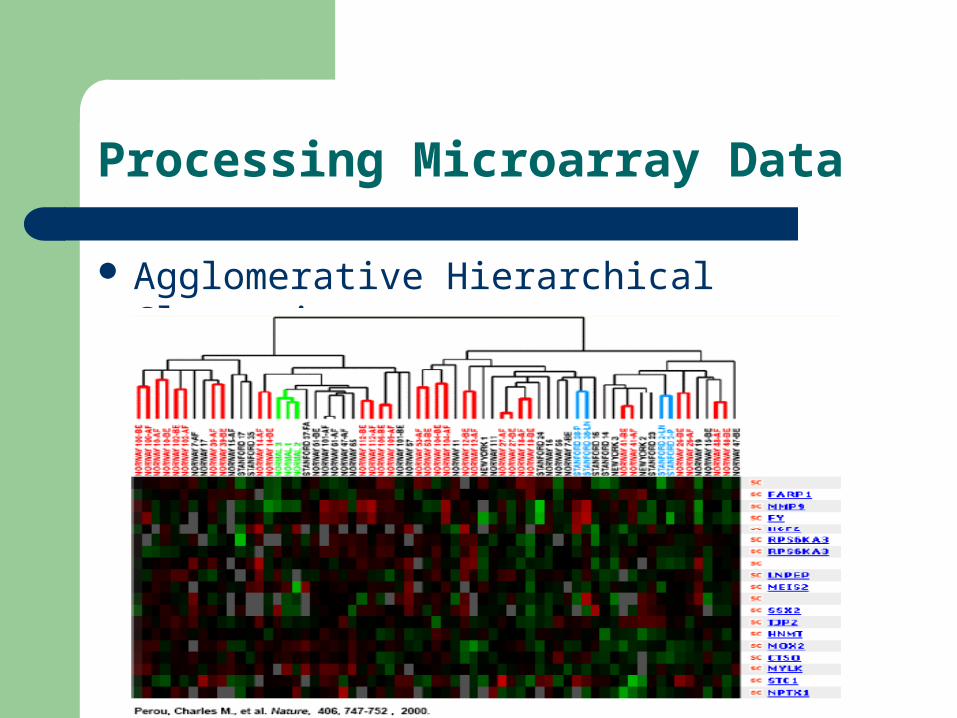
Agglomerative Hierarchical Clustering:

Processing Microarray Data
Agglomerative Hierarchical Clustering:

Processing Microarray Data
Agglomerative Hierarchical Clustering DEMO:

Processing Microarray Data
Agglomerative Hierarchical Clustering DEMO:
Processing Microarray Data
Agglomerative Hierarchical Clustering DEMO:

Processing Microarray Data
Agglomerative Hierarchical Clustering DEMO:

Processing Microarray Data
Agglomerative Hierarchical Clustering DEMO:
Processing Microarray Data
Agglomerative Hierarchical Clustering DEMO:

Processing Microarray Data
Agglomerative Hierarchical Clustering DEMO:

Processing Microarray Data
Agglomerative Hierarchical Clustering:
Processing Microarray Data
Agglomerative Hierarchical Clustering:

Processing Microarray Data
Self-Organizing Feature Maps:– by Teuvo Kohonen, – a data visualization technique which helps to
understand high dimensional data by reducing the dimensions of data to a map.

Processing Microarray Data
Self-Organizing Feature Maps:– humans simply cannot visualize high dimensional data
as is,– SOM help us understand this high dimensional data.

Processing Microarray Data
Self-Organizing Feature Maps:– Based on competitive learning,– SOM helps us by producing a map of usually 1 or 2
dimensions,– SOM plot the similarities of the data by grouping– similar data items together.

Processing Microarray Data
Self-Organizing Feature Maps:
Processing Microarray Data
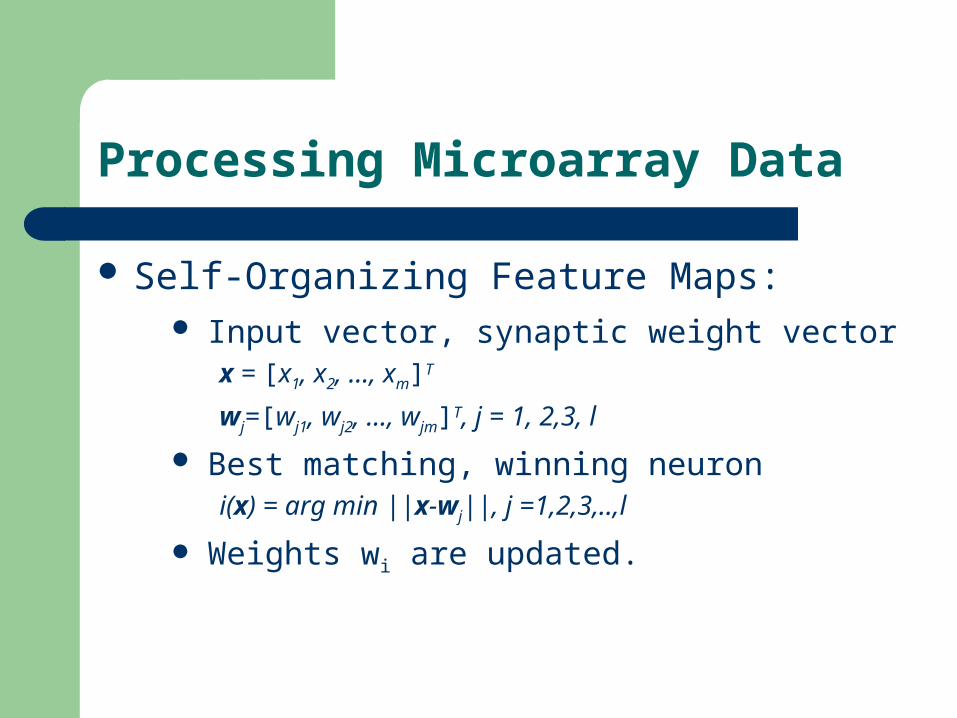
Self-Organizing Feature Maps: Input vector, synaptic weight vector
x = [x1, x2, …, xm]T
wj=[wj1, wj2, …, wjm]T, j = 1, 2,3, l
Best matching, winning neuroni(x) = arg min ||x-wj||, j =1,2,3,..,l
Weights wi are updated.

Processing Microarray Data
Self-Organizing Feature Maps (EXAMPLE):– Assume that we want to cluster the countries
according to their economic potential,– Countries has N properties (like export - import
amounts, population …)

Processing Microarray Data
Self-Organizing Feature Maps (EXAMPLE):– Each country is a point in N dimension,– It means each country is a vetor of size N,– We want to cluster the countries according to the
similarities in economical potential.

Processing Microarray Data
Self-Organizing Feature Maps (EXAMPLE):

Processing Microarray Data
Self-Organizing Feature Maps (EXAMPLE):

Processing Microarray Data
Self-Organizing Feature Maps:– Similarly SOM is used to analyze microarray data,– Similar genes can be observed easily by this way.
References
M. Zvelebil, J. O. Baum, “Understanding Bioinformatics”, 2008, Garland Science
Andreas D. Baxevanis, B.F. Francis Ouellette, “Bioinformatics: A practical guide to the analysis of genes and proteins”, 2001, Wiley.
Barbara Resch, “Hidden Markov Models - A Tutorial for the Course Computational Intelligence”, 2010.
Pattern Classification (2nd ed) by R. O. Duda, P. E. Hart and D. G. Stork, John Wiley & Sons, 2000


![Clustering of Microarray Data Reveals Transcript Patterns · Clustering of Microarray Data Reveals Transcript Patterns Associated with Somatic Embryogenesis in Soybean1[w] Franc¸oise](https://img.dokumen.tips/doc/110x75/5ed2c7ccae2cb511b17808ae/clustering-of-microarray-data-reveals-transcript-clustering-of-microarray-data-reveals.jpg)