Embed Size (px)
Citation preview

PARTICIPATION TOPLINE REPORT 2017
OUTDOOR RECREATION
Photo credit: Pogo Park, an Outdoor Foundation-supported organization that teaches environmental education to a park poor neighborhood in Northern California.

PARTICIPATION TOPLINE REPORT 1
134.4 138.4 135.9 137.8 137.9 141.1 141.9 142.6 142.4141.4 144.0
11.6 11.4 11.210.1 10.1
11.5 12.4 12.1 11.8 11.7 11.0
48.6%48.9%48.6%50.0%49.1% 49.4% 49.4% 49.2%
2006 2007 2008 2009 2010 2011 2012 2013 2014
48.4% 48.4% 48.6%
2015 2016
2016 Outdoor ParticipationAges6+
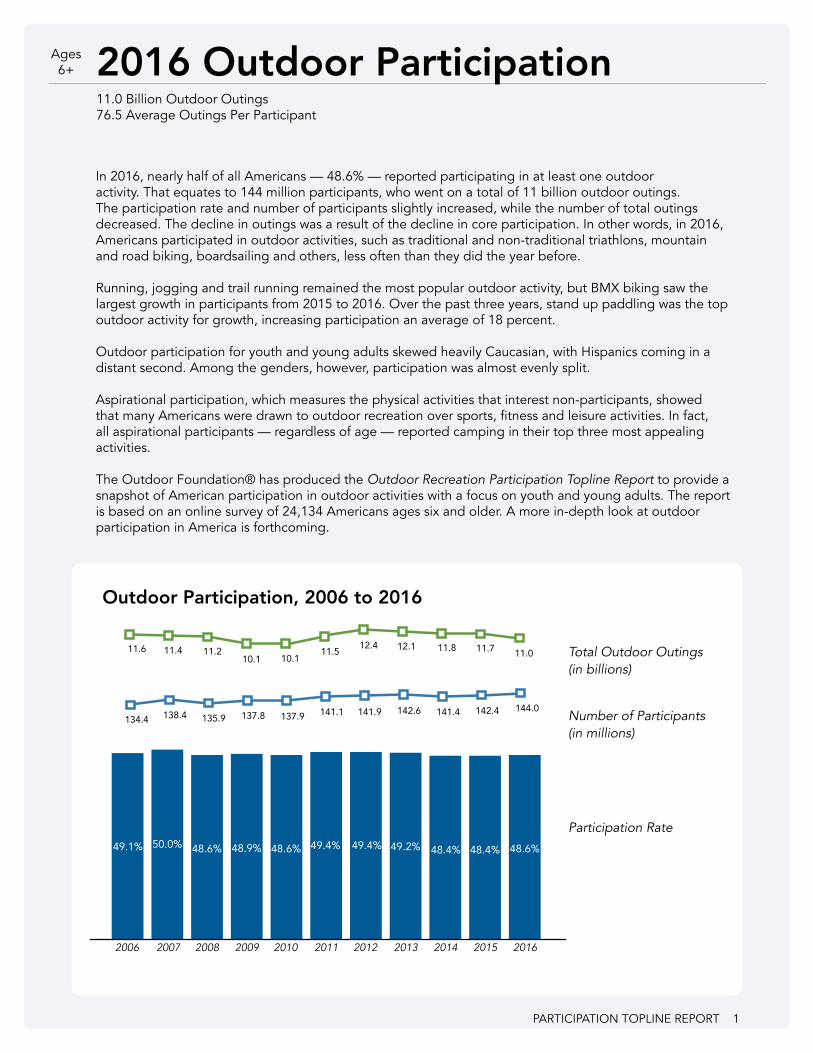
11.0 Billion Outdoor Outings76.5 Average Outings Per Participant
In 2016, nearly half of all Americans — 48.6% — reported participating in at least one outdoor activity. That equates to 144 million participants, who went on a total of 11 billion outdoor outings. The participation rate and number of participants slightly increased, while the number of total outings decreased. The decline in outings was a result of the decline in core participation. In other words, in 2016, Americans participated in outdoor activities, such as traditional and non-traditional triathlons, mountain and road biking, boardsailing and others, less often than they did the year before.
Running, jogging and trail running remained the most popular outdoor activity, but BMX biking saw the largest growth in participants from 2015 to 2016. Over the past three years, stand up paddling was the top outdoor activity for growth, increasing participation an average of 18 percent.
Outdoor participation for youth and young adults skewed heavily Caucasian, with Hispanics coming in a distant second. Among the genders, however, participation was almost evenly split.
Aspirational participation, which measures the physical activities that interest non-participants, showed that many Americans were drawn to outdoor recreation over sports, fitness and leisure activities. In fact, all aspirational participants — regardless of age — reported camping in their top three most appealing activities.
The Outdoor Foundation® has produced the Outdoor Recreation Participation Topline Report to provide a snapshot of American participation in outdoor activities with a focus on youth and young adults. The report is based on an online survey of 24,134 Americans ages six and older. A more in-depth look at outdoor participation in America is forthcoming.
Total Outdoor Outings(in billions)
Number of Participants(in millions)
Participation Rate
Outdoor Participation, 2006 to 2016

2 PARTICIPATION TOPLINE REPORT
Ages 6-12 Ages 13-17 Ages 18-24 Ages 25-44 Ages 45+
62%62%64%
67%
78%
63% 63%64%
61%60% 60% 60% 59%61%
64%
69%
62%
56% 56%55%54%
58% 57%55%
57% 57% 58% 57%56%
54%54%53%
54%
48%
55%
38%39%38%39%37% 38% 38% 38% 38%
62%
‘10 ‘11 ‘12 2016‘09‘08‘07‘06 ‘13 ‘14 ‘15‘14 ‘10 ‘11 ‘12 2016‘09‘08‘07‘06 ‘13 ‘14 ‘15‘14 ‘10 ‘11 ‘12 2016‘09‘08‘07‘06 ‘13 ‘14 ‘15‘14 ‘10 ‘11 ‘12 2016‘09‘08‘07‘06 ‘13 ‘14 ‘15‘14 ‘10 ‘11 ‘12 2016‘09‘08‘07‘06 ‘13 ‘14 ‘15‘14‘10 ‘11 ‘12 2016‘09‘08‘07‘06 ‘13 ‘14 ‘15‘14
63% 63%
60%59%
56%57%
56% 56%
37%37%
Most Popular Youth Outdoor Activities By Participation Rate, Ages 6 to 24
1. Running, Jogging and Trail Running 25.3% of youth, 20.3 million participants
2. Bicycling (Road, Mountain and BMX) 22.6% of youth, 18.2 million participants
3. Fishing (Fresh, Salt and Fly) 19.5% of youth, 15.6 million participants
4. Camping (Car, Backyard and RV) 19.0% of youth, 15.3 million participants
5. Hiking 15.5% of youth, 12.5 million participants
Favorite Youth Outdoor Activities By Frequency of Participation, Ages 6 to 24
1. Running, Jogging and Trail Running 81.3 average outings per runner, 1.7 billion total outings
2. Bicycling (Road, Mountain and BMX) 58.0 average outings per cyclist, 1.1 billion total outings
3. Fishing (Fresh, Salt and Fly) 16.1 average outings per fishing participant, 251.4 million total outings
4. Skateboarding 46.8 average outings per skateboarder, 212.2 million total outings
5. Camping (Car, Backyard and RV) 12.4 average outings per camper, 189.0 million total outings
Youth & Young Adult ParticipationAges6 to 24
4.1 Billion Outdoor Outings83.8 Average Outings Per Participant

PARTICIPATION TOPLINE REPORT 3
2007 2008 2009 2010 2011 2012 2013 2014 2015 2016
Male 52% 50% 57% 53% 53% 52% 50% 50% 51% 51%
Female 48% 50% 43% 47% 47% 49% 50% 50% 49% 49%
2007 2008 2009 2010 2011 2012 2013 2014 2015 2016
6 to 12 33% 29% 37% 36% 36% 38% 38% 38% 39% 39%
13 to 17 24% 25% 30% 30% 30% 26% 26% 27% 28% 28%
18 to 24 44% 46% 34% 34% 34% 36% 36% 34% 33% 33%
2007 2008 2009 2010 2011 2012 2013 2014 2015 2016
African American/Black 8% 8% 8% 11% 7% 11% 11% 10% 8% 9%
Asian/Pacific Islander 4% 6% 5% 6% 6% 7% 7% 7% 7% 7%
Caucasian/White, non-Hispanic 77% 75% 78% 71% 76% 71% 68% 70% 71% 70%
Hispanic 7% 7% 7% 9% 8% 8% 10% 10% 12% 12%
Other 4% 4% 3% 4% 4% 4% 3% 3% 2% 2%
2007 2008 2009 2010 2011 2012 2013 2014 2015 2016
New England 5% 5% 5% 5% 4% 5% 5% 4% 4% 4%
Middle Atlantic 15% 14% 12% 13% 13% 13% 13% 13% 13% 14%
East North Central 17% 17% 17% 17% 17% 16% 17% 17% 17% 16%
West North Central 7% 7% 8% 7% 7% 8% 7% 7% 7% 7%
South Atlantic 18% 19% 18% 17% 18% 18% 18% 19% 19% 19%
East South Central 5% 6% 7% 6% 6% 6% 6% 6% 6% 6%
West South Central 9% 9% 10% 10% 11% 10% 11% 11% 10% 11%
Mountain 8% 8% 8% 9% 9% 8% 8% 9% 8% 8%
Pacific 16% 15% 15% 16% 16% 16% 15% 14% 15% 16%
Gender
Age
Census Region
Race/Ethnicity
Youth & Young Adult Participant DemographicsAges6 to 24

Aspirational Participants, Ages 13-17 1. Camping 16.5%
2. Swimming For Fitness 16.1%
3. Bicycling 14.7%
4. Basketball 14.6%
5. Running/Jogging 13.1%
6. Soccer 12.6%
7. Fishing 11.9%
8. Football 11.3%
9. Swimming on a team 11.2%
10. Hiking 10.9%
4 PARTICIPATION TOPLINE REPORT
Aspirational participation measures non-participants’ interest in specific outdoor recreation, sports, fitness and leisure activities. When comparing the types of activities that appeal to non-participants, many aspirational participants reported being drawn to outdoor activities. In fact, youth and young adults in every age group reported camping as their top interest. Bicycling was another outdoor activity that non-participants in each age cohort were interested in trying.
Aspirational Participants, Ages 6-12 Physical Activity Interest Rate
1. Camping 16%
2. Basketball 14%
3. Fishing 13%
4. Soccer 13%
5. Swimming for Fitness 12%
6. Bicycling 12%
7. Running/Jogging 11%
8. Football 11%
9. Swimming on a Team 10%
10. Martial Arts 10%
Aspirational Participants, Ages 18-24 Physical Activity Interest Rate
1. Camping 18%
2. Bicycling 16%
3. Backpacking 14%
4. Martial Arts 14%
5. Climbing 12%
6. Working Out with Weights 12%
7. Hiking 11%
8. Swimming for Fitness 11%
9. Working Out with Machines 11%
10. Kayaking 10%
Aspirational Participants, Ages 13-17 Physical Activity Interest Rate
1. Camping 13%
2. Swimming for Fitness 10%
3. Running/Jogging 9%
4. Fishing 9%
5. Bicycling 9%
6. Working Out with Machines 8%
7. Hiking 7%
8. Basketball 7%
9. Football 7%
10. Martial Arts 7%
Aspirational Youth & Young Adult ParticipationAges6 to 24

PARTICIPATION TOPLINE REPORT 5
Most Popular Adult Outdoor Activities By Participation Rate, Ages 25+
1. Running, Jogging and Trail Running 14.8% of adults, 32.0 million participants
2. Fishing (Fresh, Salt and Fly) 14.6% of adults, 31.5 million participants
3. Hiking 13.7% of adults, 29.7 million participants
4. Bicycling (Road, Mountain and BMX) 12.8% of adults, 27.7 million participants
5. Camping (Car, Backyard, Backpacking and RV) 11.7% of adults, 25.2 million participants
Favorite Adult Outdoor Activities By Frequency of Participation, Ages 25+
1. Running, Jogging and Trail Running 81.0 average outings per runner, 2.6 billion total outings
2. Bicycling (Road, Mountain and BMX) 76.0 average outings per cyclist, 1.4 billion total outings
3. Fishing 40.1 average outings per fishing participant, 627.9 million total outings
3. Hiking 98.2 average outings per hiker, 445.3 million total outings
4. Wildlife Viewing 25.2 average outings per wildlife viewer, 384.6 million total outings
Ages 6-12 Ages 13-17 Ages 18-24 Ages 25-44 Ages 45+
62%62%64%
67%
78%
63% 63%64%
61%60% 60% 60% 59%61%
64%
69%
62%
56% 56%55%54%
58% 57%55%
57% 57% 58% 57%56%
54%54%53%
54%
48%
55%
38%39%38%39%37% 38% 38% 38% 38%
62%
‘10 ‘11 ‘12 2016‘09‘08‘07‘06 ‘13 ‘14 ‘15‘14 ‘10 ‘11 ‘12 2016‘09‘08‘07‘06 ‘13 ‘14 ‘15‘14 ‘10 ‘11 ‘12 2016‘09‘08‘07‘06 ‘13 ‘14 ‘15‘14 ‘10 ‘11 ‘12 2016‘09‘08‘07‘06 ‘13 ‘14 ‘15‘14 ‘10 ‘11 ‘12 2016‘09‘08‘07‘06 ‘13 ‘14 ‘15‘14‘10 ‘11 ‘12 2016‘09‘08‘07‘06 ‘13 ‘14 ‘15‘14
63% 63%
60%59%
56%57%
56% 56%
37%37%
Adult ParticipationAges25+
6.9 Billion Outdoor Outings72.8 Average Outings Per Participant

6 PARTICIPATION TOPLINE REPORT
Aspirational Adult ParticipationLike youth and young adult aspirational participants, adult aspirational participants were also particularly interested in outdoor activities. Camping ranked as the number one or two most popular activity out of a range of outdoor, sports, fitness and leisure activities. Running/jogging, hiking, backpacking, canoeing and fishing also rated in the top ten most appealing activities among every age group, signaling that there is a significant opportunity for the outdoor industry to engage these non-participants.
Aspirational Participants, Ages 25-34 Physical Activity Interest Rate
1. Swimming For Fitness 16%
2. Camping 15%
3. Bicycling 13%
4. Running/Jogging 11%
5. Hiking 11%
6. Backpacking 11%
7. Canoeing 11%
8. Fishing 10%
9. Working Out with Machines 10%
10. Working Out with Weights 9%
Aspirational Participants, Ages 45+ Physical Activity Interest Rate
1. Camping 11%
2. Birdwatching /Wildlife Viewing 11%
3. Fishing 10%
4. Bicycling 10%
5. Swimming for Fitness 10%
6. Hiking 9%
7. Working Out with Machines 8%
8. Canoeing 7%
9. Working Out with Weights 7%
10. Backpacking 5%
Aspirational Participants, Ages 35-44 Physical Activity Interest Rate
1. Camping 14%
2. Bicycling 13%
3. Swimming for Fitness 13%
4. Hiking 11%
5. Working Out with Weights 10%
6. Fishing 9%
7. Running/Jogging 9%
8. Working Out with Machines 9%
9. Canoeing 9%
10. Backpacking 8%
Ages25+

PARTICIPATION TOPLINE REPORT 7
15%
12%
11%
13%
9%
8%
7%
6%
5%
6%
18%
13% 13%
11%10% 10%
8%
6%
8%7%
Positive outdoor trends details the activities that saw the most growth in participation. Over the past three years, stand up paddling was the top outdoor activity for growth, increasing participation an average of 18 percent from 2013 to 2016. Although still adding new participants, growth for the activitiy slowed compared to previous years. From 2015 to 2016, BMX biking saw the most growth in participation. This activity, along with cross country skiing, were among the top activities for growth over a one year- and three-year period.
Top Outdoor Activities for Growth
Stan
d U
p Pa
ddlin
g
Cro
ss C
ount
ry S
kiin
g
BM
X B
icyc
ling
Adv
entu
re R
acin
g
Boa
rdsa
iling
/Win
dsur
fing
Kay
ak F
ishi
ng
Trai
l Run
ning
Non
-tra
ditio
nal/
Off-
road
Tria
thlo
n
Hik
ing
Trad
ition
al/
Ice
Clim
bing
3-Ye
ar A
vera
ge C
hang
e1-
Year
Cha
nge
BM
X B
icyc
ling
Hik
ing
Cro
ss C
ount
ry S
kiin
g
Tele
mar
king
Trad
ition
al/
Ice
Clim
bing
RV C
ampi
ng
Stan
d U
p Pa
ddlin
g
Fly
Fish
ing
Kay
akin
g
Trai
l Run
ning
2016 Positive Outdoor TrendsAges6+

8 PARTICIPATION TOPLINE REPORT
2006 2007 2008 2009 2010 2011 2012 2013 2014 2015 20163-Year
Change
Adventure Racing 725 698 920 1,089 1,339 1,065 2,170 2,213 2,368 2,864 2,999 35.5%
Backpacking Overnight - More Than 1/4 Mile From Vehicle/Home 7,067 6,637 7,867 7,647 8,349 7,095 8,771 9,069 10,101 10,100 10,151 11.9%
Bicycling (BMX) 1,655 1,887 1,904 1,811 2,369 1,547 2,175 2,168 2,350 2,690 3,104 43.2%
Bicycling (Mountain/Non-Paved Surface) 6,751 6,892 7,592 7,142 7,161 6,816 7,714 8,542 8,044 8,316 8,615 0.9%
Bicycling (Road/Paved Surface) 38,457 38,940 38,114 40,140 39,320 40,349 39,232 40,888 39,725 38,280 38,365 -6.2%
Birdwatching More Than 1/4 Mile From Home/Vehicle 11,070 13,476 14,399 13,294 13,339 12,794 14,275 14,152 13,179 13,093 11,589 -18.1%
Boardsailing/Windsurfing 938 1,118 1,307 1,128 1,617 1,151 1,593 1,324 1,562 1,766 1,737 31.2%
Camping (RV) 16,946 16,168 16,517 17,436 15,865 16,698 15,108 14,556 14,633 14,699 15,855 8.9%
Camping (Within 1/4 Mile of Vehicle/Home) 35,618 31,375 33,686 34,338 30,996 32,925 29,982 29,269 28,660 27,742 26,467 -9.6%
Canoeing 9,154 9,797 9,935 10,058 10,553 9,787 9,839 10,153 10,044 10,236 10,046 -1.1%
Climbing (Sport/Indoor/Boulder) 4,728 4,514 4,769 4,313 4,770 4,119 4,592 4,745 4,536 4,684 4,905 3.4%
Climbing (Traditional/Ice/Mountaineering) 1,586 2,062 2,288 1,835 2,198 1,609 2,189 2,319 2,457 2,571 2,790 20.3%
Fishing (Fly) 6,071 5,756 5,941 5,568 5,478 5,683 6,012 5,878 5,842 6,089 6,456 9.8%
Fishing (Freshwater/Other) 43,100 43,859 40,331 40,961 38,860 38,868 39,135 37,796 37,821 37,682 38,121 0.9%
Fishing (Saltwater) 12,466 14,437 13,804 12,303 11,809 11,983 12,017 11,790 11,817 11,975 12,266 4.0%
Hiking (Day) 29,863 29,965 32,511 32,572 32,496 34,491 34,545 34,378 36,222 37,232 42,128 22.5%
Hunting (Bow) 3,875 3,818 3,722 4,226 3,908 4,633 4,075 4,079 4,411 4,564 4,427 8.5%
Hunting (Handgun) 2,525 2,595 2,873 2,276 2,709 2,671 3,553 3,198 3,091 3,400 3,512 9.8%
Hunting (Rifle) 11,242 10,635 10,344 11,114 10,150 10,807 10,164 9,792 10,081 10,778 10,797 10.3%
Hunting (Shotgun) 8,987 8,545 8,731 8,490 8,062 8,678 8,174 7,894 8,220 8,438 8,271 4.8%
Kayak Fishing n/a n/a n/a n/a 1,044 1,201 1,409 1,798 2,074 2,265 2,371 31.8%
Kayaking (Recreational) 4,134 5,070 6,240 6,212 6,465 8,229 8,144 8,716 8,855 9,499 10,017 14.9%
Kayaking (Sea/Touring) 1,136 1,485 1,780 1,771 2,144 2,029 2,446 2,694 2,912 3,079 3,124 16.0%
Kayaking (White Water) 828 1,207 1,242 1,369 1,842 1,546 1,878 2,146 2,351 2,518 2,552 18.9%
Rafting 3,609 4,340 4,651 4,318 4,460 3,821 3,690 3,836 3,781 3,883 3,428 -10.6%
Running/Jogging 38,559 41,064 41,130 43,892 49,408 50,713 52,187 54,188 51,127 48,496 47,384 -12.6%
Sailing 3,390 3,786 4,226 4,342 3,869 3,725 3,958 3,915 3,924 4,099 4,095 4.6%
Scuba Diving 2,965 2,965 3,216 2,723 3,153 2,579 2,982 3,174 3,145 3,274 3,111 -2.0%
Skateboarding 10,130 8,429 7,807 7,352 6,808 5,827 6,627 6,350 6,582 6,436 6,442 1.5%
Skiing (Alpine/Downhill) n/a 10,362 10,346 10,919 11,504 10,201 8,243 8,044 8,649 9,378 9,267 12.4%
Skiing (Cross-Country) n/a 3,530 3,848 4,157 4,530 3,641 3,307 3,377 3,820 4,146 4,640 40.3%
Skiing (Freestyle) n/a 2,817 2,711 2,950 3,647 4,318 5,357 4,007 4,564 4,465 4,640 2.7%
Snorkeling 8,395 9,294 10,296 9,358 9,305 9,318 8,011 8,700 8,752 8,874 8,717 0.2%
Snowboarding n/a 6,841 7,159 7,421 8,196 7,579 7,351 6,418 6,785 7,676 7,602 3.4%
Snowshoeing n/a 2,400 2,922 3,431 3,823 4,111 4,029 3,012 3,501 3,885 3,533 -12.3%
Stand Up Paddling n/a n/a n/a n/a 1,050 1,242 1,542 1,993 2,751 3,020 3,220 61.6%
Surfing 2,170 2,206 2,607 2,403 2,767 2,195 2,895 2,658 2,721 2,701 2,793 5.1%
Telemarking (Downhill) n/a 1,173 1,435 1,482 1,821 2,099 2,766 1,732 2,188 2,569 2,848 3.0%
Trail Running 4,558 4,216 4,857 4,833 5,136 5,610 6,003 6,792 7,531 8,139 8,582 26.4%
Outdoor Participation by ActivityAges6+
** All participation numbers in this table are in the thousands (000).
8 PARTICIPATION TOPLINE REPORT

PARTICIPATION TOPLINE REPORT 9
Triathlon (Non-Traditional/Off-Road) 281 483 543 634 798 819 1,075 1,390 1,411 1,744 1,705 5.0%
Triathlon (Traditional/Road) 640 798 943 1,148 1,593 1,686 1,789 2,262 2,203 2,498 2,374 22.6%
Wakeboarding 3,046 3,521 3,544 3,577 3,645 3,389 3,348 3,316 3,125 3,226 2,912 -12.2%
Wildlife Viewing More Than 1/4 Mile From Home/Vehicle 20,294 22,974 24,113 21,291 21,025 21,964 22,999 21,359 21,110 20,718 20,746 -2.9%
MethodDuring the 2016 calendar year, a total of 24,134 online interviews were carried out with a nationwide sample of individuals and households from the US Online Panel of over one million people operated by Synovate/IPSOS. A total of 11,453 individual and 12,681 household surveys were completed. The total panel is maintained to be representative of the US population for people ages six and older. Over sampling of ethnic groups took place to boost response from typically under responding groups.
The 2016 participation survey sample size of 24,134 completed interviews provides a high degree of statistical accuracy. All surveys are subject to some level of standard error — that is, the degree to which the results might differ from those obtained by a complete census of every person in the US. A sport with a participation rate of five percent has a confidence interval of plus or minus 0.31 percentage points at the 95 percent confidence level.
A weighting technique was used to balance the data to reflect the total US population ages six and above. The following variables were used: gender, age, income, household size, region, population density and panel join date. The total population figure used was 296,251,344 people ages six and older.
Founded in 2000, the Outdoor Foundation is a national not-for-profit organization dedicated to inspiring and growing future generations of outdoor leaders and enthusiasts. Through youth engagement, community grant-making and groundbreaking research, the Foundation works with young leaders and partners to mobilize a major cultural shift that leads all Americans to the great outdoors. Visit us at outdoorfoundation.org.
© 2017, All Rights Reserved. ® The Outdoor Foundation and The Outdoor Foundation logo are registered trademarks of The Outdoor Foundation.
The Outdoor Foundation 419 7th Street, NW, Suite 401 | Washington, DC 20004 | 202.271.3252 www.outdoorfoundation.org
About The Outdoor Foundation
About the Physical Activity Council (PAC)The survey that forms the basis of the Topline Report is produced by the Physical Activity Council (PAC), which is a partnership of leading organizations in the US sports, fitness and leisure industries. While the overall aim of the survey is to establish levels of activity and identify key trends in sports, fitness and recreation participation, each partner produces detailed reports on their specific areas of interest. Partners include: the Outdoor Foundation (OF); National Golf Foundation (NGF); Snowsports Industries America (SIA); Tennis Industry Association (TIA); USA Football; United States Tennis Association (USTA), International Health, Racquet and Sportsclub Association (IHRSA); Sports and Fitness Industry Association (SFIA); and USA Football.

© 2017, All Rights Reserved
This report is made possible through the generous support of our donors:
Thank You
Absolute Outdoor Inc | ACV Consulting | Adventure Cycling Association | Adventure Hardware | Adventure Medical Kits | Alaska Air Visa | Alchemy Design and Engineering LLC | Allett | Alpenglow Adv. Sports | Alpharetta Outfitters | Alta Group Inc | Amaterrace Inc. | Amble Magazine (Amblemag.com) | Amfit Inc | Appalachian Outfitters | ATRunner, Corp. | Backpacker’s Pantry / American Outdoor Products Inc | Bearcub Outfitters | Beaumont Products (Dermatone) | Bedrock Sandals LLC | bel air fashions | Bending Branches | Bezzy Inc | The Bike Cooperative and CCA Sports Retail Services | Bill’s Base Camp | bluesign technologies ag | Blue Water Ropes & Equip | Boatgirl LLC | Boker USA Inc. | Bolt Threads | Boquist International Marketing, Inc. | Buff, Inc. | Burley Design LLC | Burton Snowboards/RED/Anon | Cairn | Campman | Canfield’s Sporting Goods | Cannon Clay | Carl Zeiss Sports Optics | Cascade Designs | Chain Yarn Corporation | Chemours | ChicoBag | Chums-Beyond Coastal | Clif Bar & Company | Clothing Arts | Coast Products | Colorado Yurt Company | COLDPRUF Base Layer | The Coleman Company | CoolVisions by FiberVisions | Costa Del Mar Sunglasses | CRANE’S STORE | Craghoppers LLC | Crazy Ivan Enterprises | Dakota Grizzly | Dakota Watch Company | Darn Tough Vermont | DATUM | Davidson River Outfitters | DCurve USA | Deckers - Ugg and Teva | Diamond Brand Gear | Diyang Merino Textile Ltd | DrinkTanks | Duofold | Dupont Sorona | Eagle Creek | Eagles Nest Outfitters | Eastside Sports | Ecoxgear | ELEVENPINE / 11 Pine Inc. | Electronic Interconnect | Element Brand | Endurance Enterprises Inc | eVent fabrics | Evolve Sports & Designs | Ex Fty | Exotac Inc | Exped | E-Z UP International | Feathered Friends | Film Festival Flix | Fireside Industries, Inc. | Fisher Space Pen Co. | Fitter International Inc. | Fjallraven | Flagstaff Climbing | FOG Territory | Four Corners School of Outdoor Education | Foundton Company Ltd | FTC America | Garmont Intl. North America, Inc. | GEAR AID | Gear Well | Goal Zero | Goodhew LLC | goTenna Inc | GR GEAR | Gramicci | Granite Marketing, Inc. | Grayl | Great Outdoor Provision Co | GU Energy Gel | Hammock Bliss | Hanwag | Holland & Hart LLP | Hillsound Equipment Inc | HippyTree | HO YU Textile Co., Ltd. | Hydro Flask | Indigenous Design Corp. | Inov-8, Inc. | International Recreational Products LLC | Invista | www.itrekkers.com | Jack’s Plastic Welding | JAM Collective | Jana Designs | JanSport | Jiangsu Acome HK Outdoor Products Company | Joules USA Inc. | Kamik | Kampgrounds of America / KOA | Kayak Distribution | Kevin Brew Sales | Kelloggs & Lawerence | Kenyon Consumer Products | Kenyon Consumer Products | Killtec NA, Inc. | KOLON FASHION MATERIAL, INC | L.C. Industries Inc. | Leatherman Tool Group | NPD Group - Sports & Leisure Trends | Levitation 49 | Lifetime Products Inc | Lightspeed Outdoors | LINE SPORTS & ENTERTAINMENT | Lisle Apparel, LLC | LUNA Sandals | Luna Packaging LLC | Mad Rock | Madison Creek Outfitters | Malone Auto Racks | Markovitz Consulting | Maroon Bell Outdoor LLC | Maschmedt & Associates | Masterfit Enterprises | Maven Outdoor Equipment | Mazamas | MHT MidSpan | Michael Best & Friedrich | Microban Products Company | Minus | 33 Merino Wool Clothing | Montana Outdoor Radio Show | Mondo Marketing Inc. | Morsel Munk LLC | Mountain House | Mountain Khakis | Mountain News | MUSTANG SURVIVAL | National Geographic Maps | National Park Service | Nation’s Best Sports | Native Eyewear | Nester Hosiery / Farm To Feet | Nexgen Packaging LLC | Nifco America Corp. | Nolah Sleep LLC | The North Face | NuDown | Nuf Said Advertising | Nuun & Co. | Nuu-Muu LLC | O. A. R. S. | Oboz Footwear | Opinel USA | OPR | OpSec Security | Optic Nerve / Mountain Shades | Origin Design & Communications | OROS | Ortlieb USA LLC | Osprey Packs | Outdoor Sports Marketing | Outdoor Specialty Group LLC | Paceline Products Inc | Pacific Edge Indoor Climbing Facility | Pau Hana Surf Supply | Pertex | Pelican International | Perkins Coie LLP | Pigeon Mountain Industries Inc | Pinneco Research Limited | PlumRiver LLC | Point 6 LLC | Police Security Flashlights | Polartec, LLC | prAna | Primus | PrimaLoft Inc. | The Printed Image | Prism Designs, Inc | Prolific Business Solutions | Pro-Tec Athletics | Purple Orange Brand Communications | Rab USA | Rad Roller LLC | Redington | Red Paddle Co North America | RedRoller, Inc. | REI | RepSpark | Rinsekit | Robert W. Baird & Co. | Rocky Mountain Rafts | Ross Automatics, LLC | Rowman + Littlefield | Rsport | Ryan Michael Trading | Sanitized USA Inc. | Sanitas Sales Group | Saucony | Sauce Headwear | Sea to Summit | Seals Sprayskirts | Seattle Sports | Shoes on the Web | Shoulders of Giants | Shuksan Trading | SIDFACTOR | Sierra Trading Post, Inc | Simms Fishing Products | SJ Creations Inc. | Smartwool | SOAR Communications | Sorini, Samet & Associates | Sperry Top-Sider | Spikeball Inc. | The Sports Alley Ltd. | Star Arrow Company | STORMDFX | Strongback Chairs | Summit Sales, Inc. | Summit Distribution | Sunday Afternoons, Inc. | Surf Technicians LLC | Sustainable Down Source / Down Decor | swrve| Tasc Performance, Inc. | Tenkara USA | tentree | Terramar Sports | TEXSPORT | The American Alpine Club | The Conservation Fund | Thermore | Thomas Bates / Bates Accessories, Inc. | Thrive Creative Labs | Thule | Toad&Co | TomTom | Travel Country Outdoors | Travelon | TrailHeads | Trailtopia LLC | Trek Light Gear | TSL Snowshoes, LLC | Twenty Two Designs, LLC | Ugly Mugz | Uinta Brewing | Ultimate Direction Inc | Unlikely Hero | US Gearheads | Vasque / Red Wing Shoe Company | Vetex NV | Vibram USA | Victorinox Swiss Army Brand Inc. | VSSL Outdoor Utility Tools | Waypoint Outdoor | Werner Paddles | Western Mountaineering | Western Rise | The Whiting Group | Wicked Mountain Outfitters | wiild | Wild Places | WindWarrior LLC | Winthrop Mountain Sports | Wolverine / Wolverine World Wide | World T.E.A.M. Sports | Wow Sports LLC. | WSI-Sales LLC | Yaleet Inc/Naot | Yeti Coolers | Zamst | Zamberlan USA | ZANheadgear & Bobster Eyewear | ZEAL Optics