Embed Size (px)
Citation preview

Outcomes Working Group Webinar 13:
Building the Systems for Outcomes Management, the example of Komida,
Indonesia 27 July 2016
SPEAKERS Calum Scott, Opportunity International
Ruslianah Syafiie, KOMIDA Yamini Annadanam, Ankuram Social Ventures
Frances Sinha, OWG Facilitator
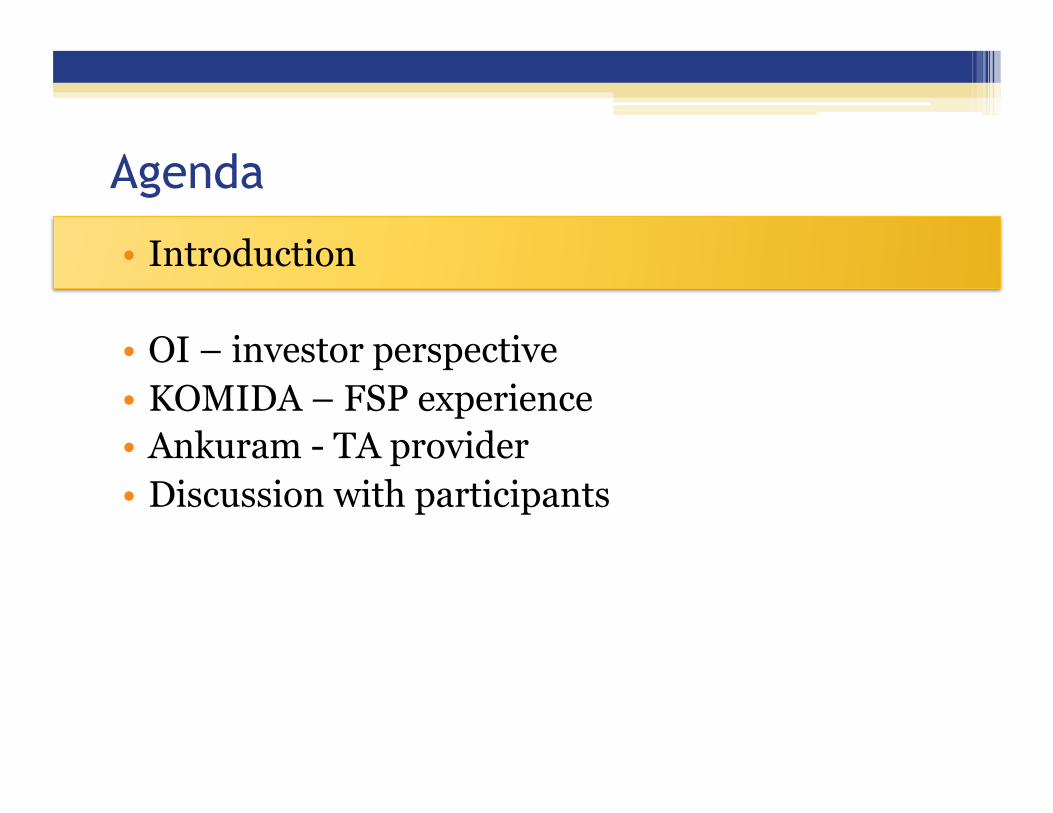
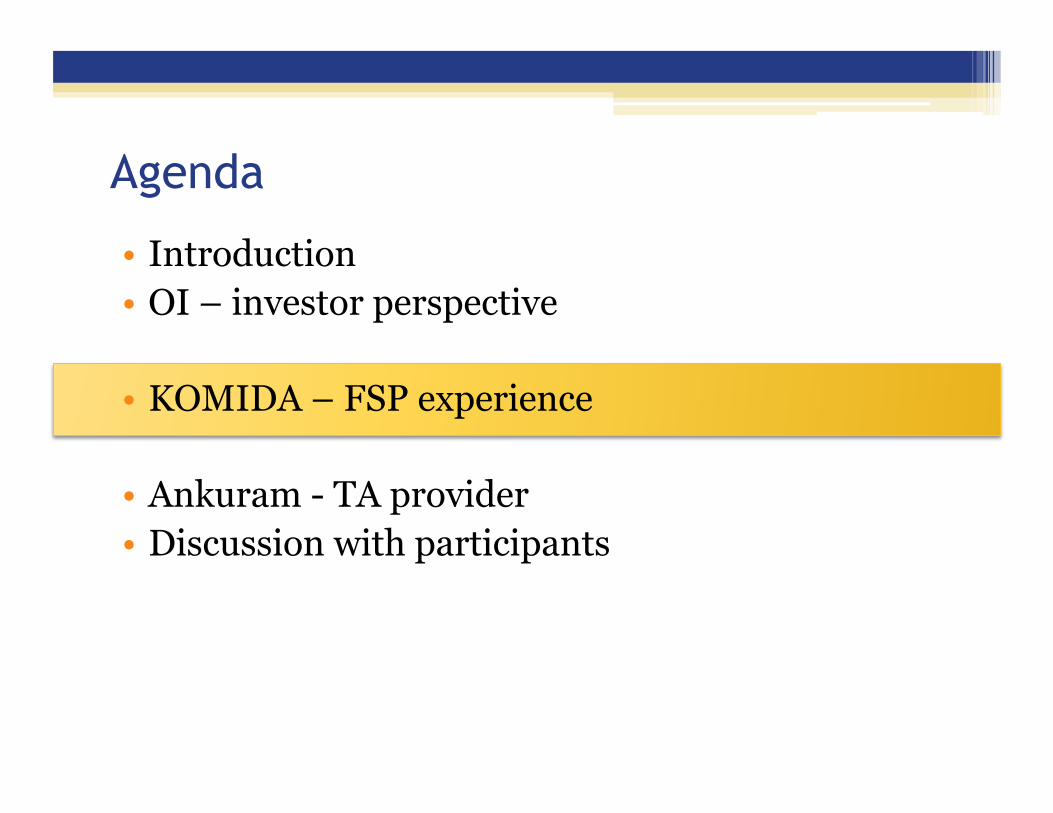
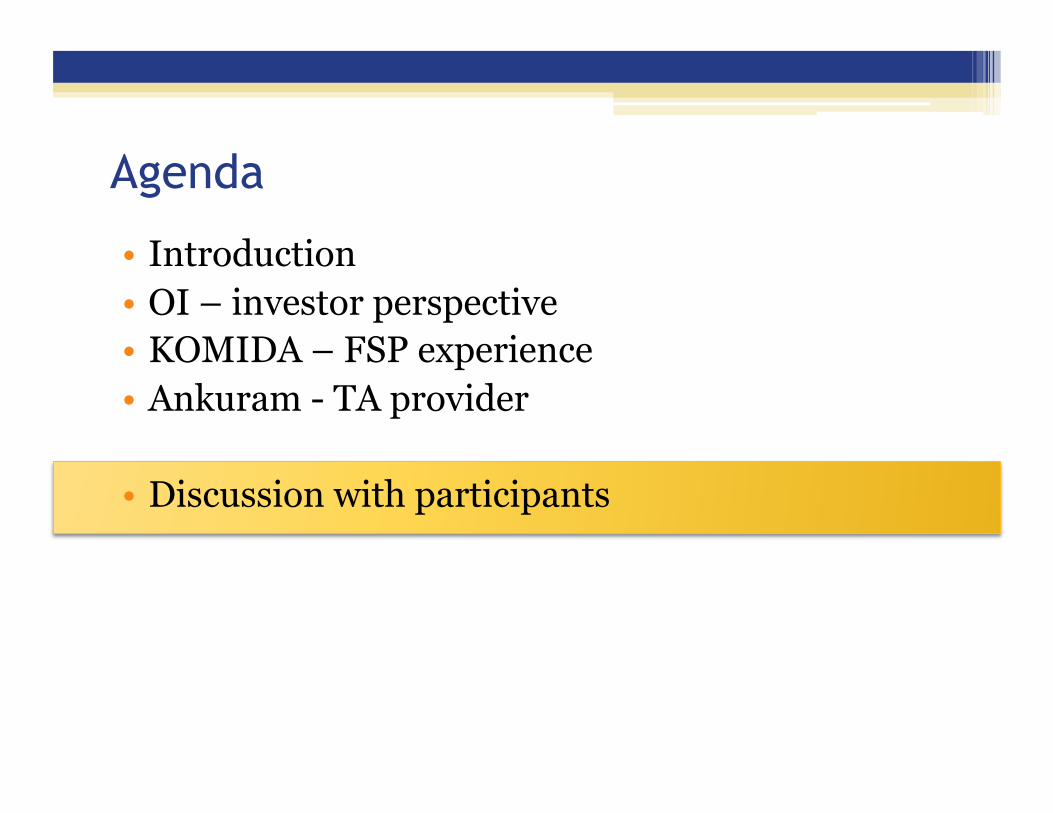
Agenda
• Introduction
• OI – investor perspective • KOMIDA – FSP experience • Ankuram - TA provider • Discussion with participants

Our speakers today
Veena Yamini Annadanam Founder, Ankuram Social Ventures
Calum Scott Global Impact Director, Opportunity International
Ruslianah Syafiie Manager SPM & Reporting, KOMIDA

Agenda
• Introduction
• OI – investor perspective
• KOMIDA – FSP experience • Ankuram - TA provider • Discussion with participants

Opportunity SPM Strategy • Promoting best practices in social microfinance across our
network of partners: ▫ Client protection principles ▫ Universal Standards for SPM ▫ Monitoring client outcomes (PPI + other
indicators) ▫ Social Performance Reporting (SPI4)
• Network strategy and investment based on social data • Transparency in reporting to Opportunity funders • Innovation in M&E and working with the sector
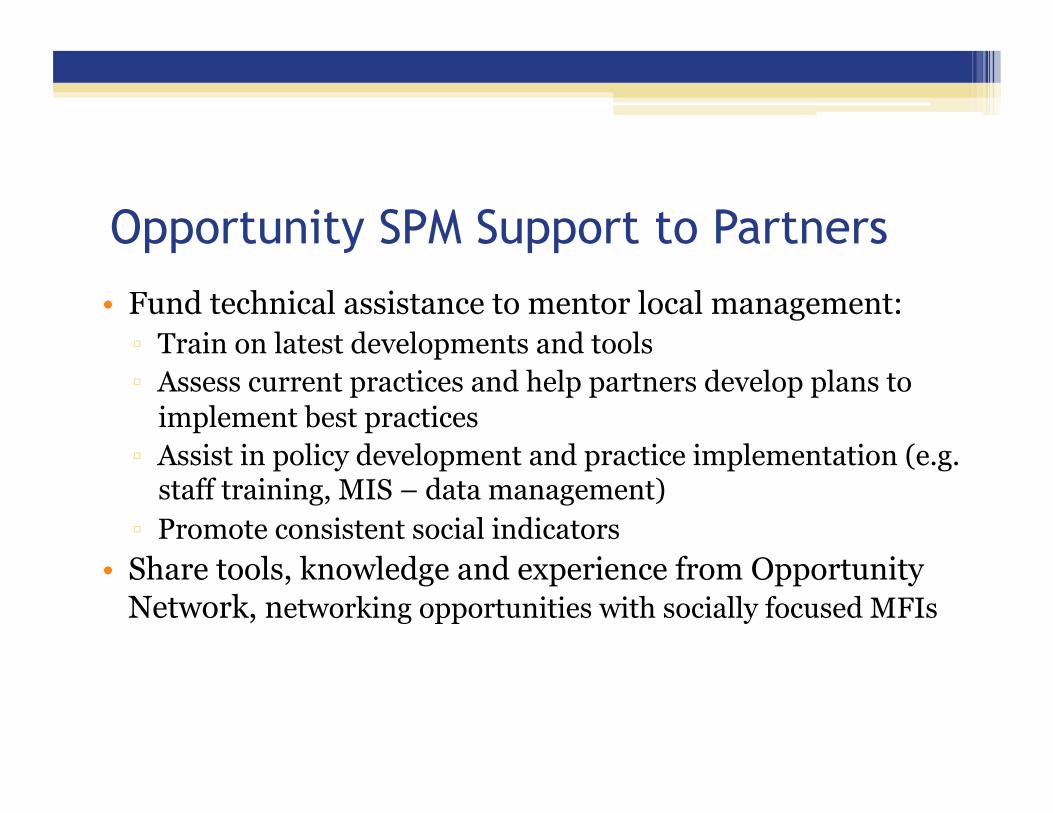
Opportunity SPM Support to Partners • Fund technical assistance to mentor local management: ▫ Train on latest developments and tools ▫ Assess current practices and help partners develop plans to
implement best practices ▫ Assist in policy development and practice implementation (e.g.
staff training, MIS – data management) ▫ Promote consistent social indicators
• Share tools, knowledge and experience from Opportunity Network, networking opportunities with socially focused MFIs
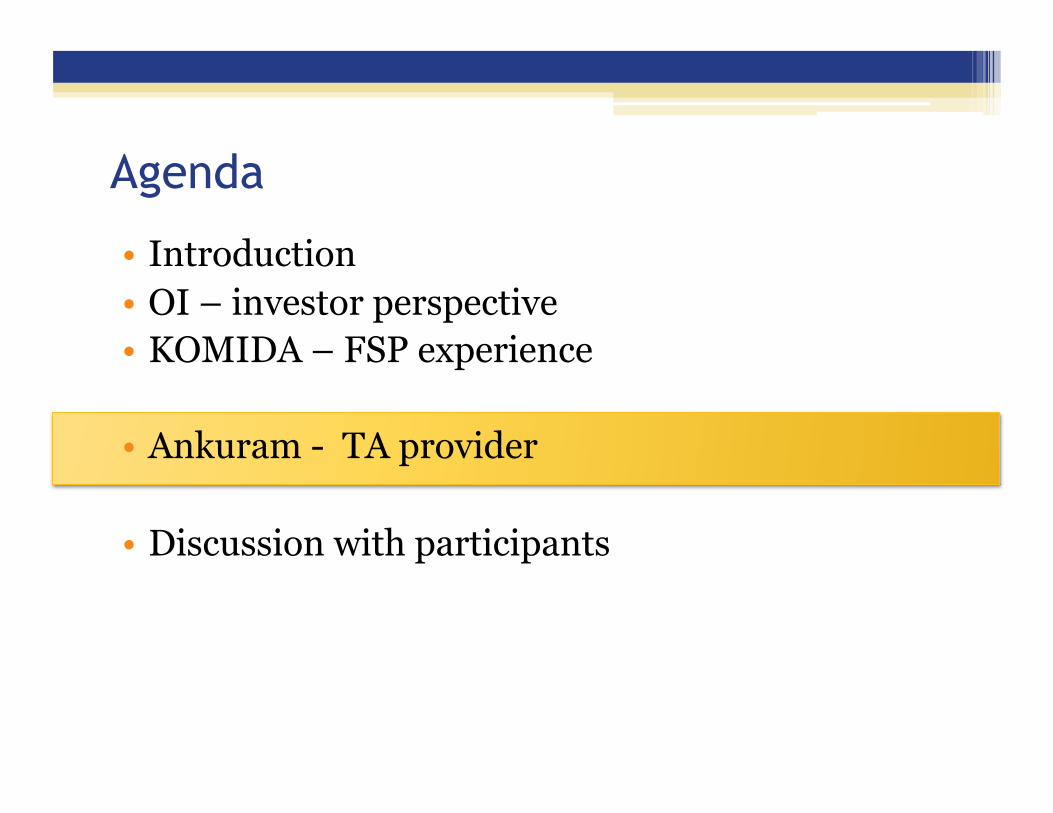
Agenda
• Introduction • OI – investor perspective
• KOMIDA – FSP experience
• Ankuram - TA provider • Discussion with participants
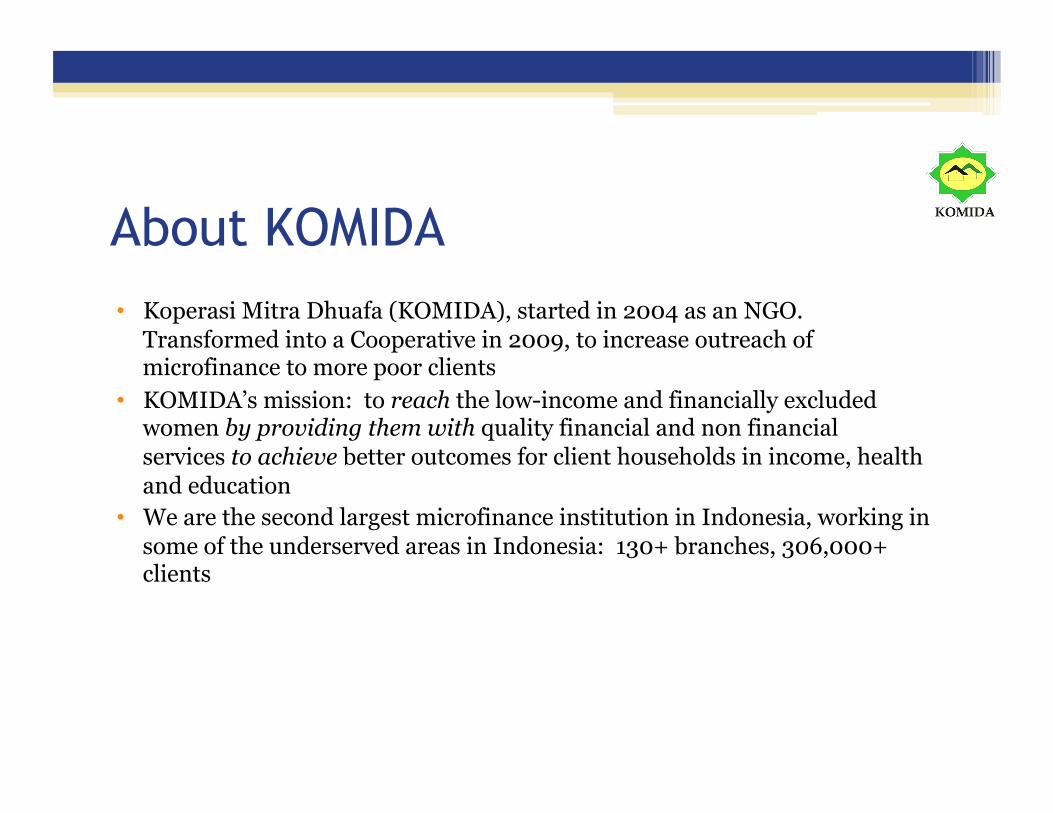
About KOMIDA • Koperasi Mitra Dhuafa (KOMIDA), started in 2004 as an NGO.
Transformed into a Cooperative in 2009, to increase outreach of microfinance to more poor clients
• KOMIDA’s mission: to reach the low-income and financially excluded women by providing them with quality financial and non financial services to achieve better outcomes for client households in income, health and education
• We are the second largest microfinance institution in Indonesia, working in some of the underserved areas in Indonesia: 130+ branches, 306,000+ clients
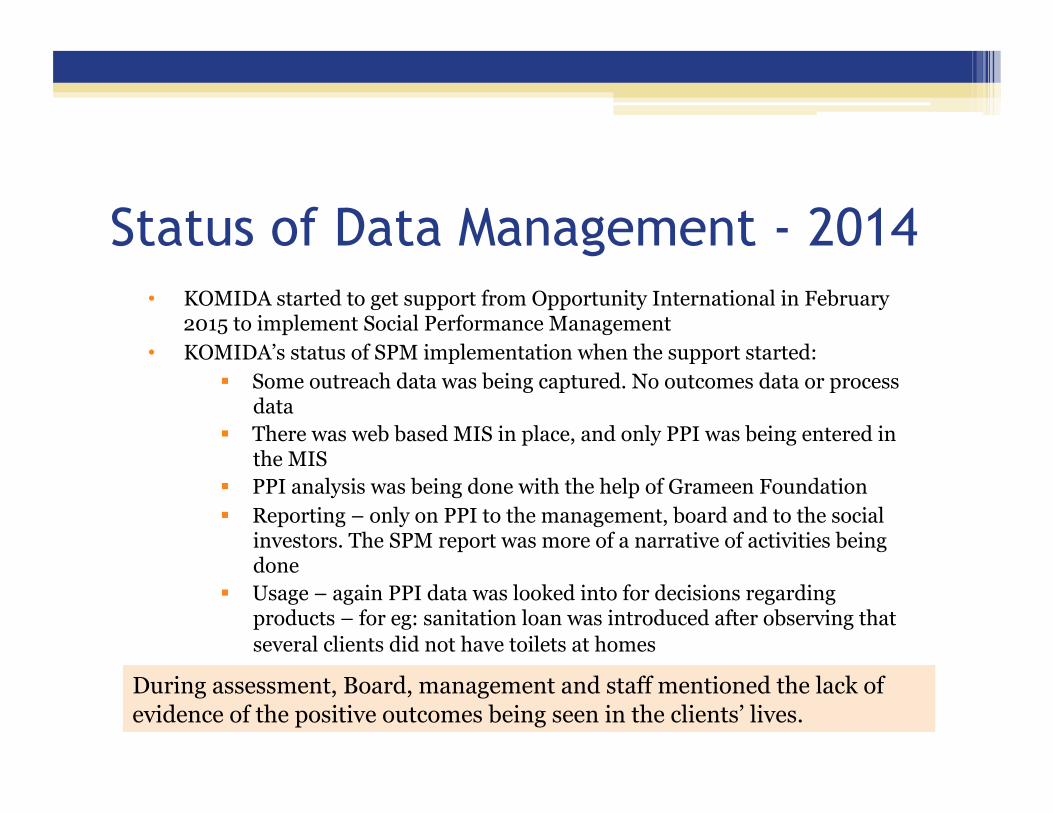
Status of Data Management - 2014 • KOMIDA started to get support from Opportunity International in February
2015 to implement Social Performance Management • KOMIDA’s status of SPM implementation when the support started:
! Some outreach data was being captured. No outcomes data or process data
! There was web based MIS in place, and only PPI was being entered in the MIS
! PPI analysis was being done with the help of Grameen Foundation ! Reporting – only on PPI to the management, board and to the social
investors. The SPM report was more of a narrative of activities being done
! Usage – again PPI data was looked into for decisions regarding products – for eg: sanitation loan was introduced after observing that several clients did not have toilets at homes
During assessment, Board, management and staff mentioned the lack of evidence of the positive outcomes being seen in the clients’ lives.

What are the Outcome Indicators selected?
Income 1. % of clients who report an
increase in the household incomes after joining KOMIDA
2. % increase in the average savings balance with KOMIDA and use of savings (saving types with KOMIDA)
3. % of clients who moved to the next level of poverty line
4. % of clients who report an increased ability to pay for key household and life cycle expenditure
Education 1. % of children / girl
children in school age (6-18) who are attending school regularly
2. Of clients with children (6-18 years), % whose children have the possibility of going to college or university
• KOMIDA has selected the following outcome indicators based on the mission, social goals and OI’s SPM dashboard
• Social Goal 3: Bring better outcomes for clients’ households in income, health & education
Health 1. % of clients who have access to a
toilet (own or community shared) 2. % of clients who have access to their
own drinking water 3. % of clients who report increase in
awareness on health 4. % of clients who report having
experienced a serious medical condition / illness in the last 6 months within their household
5. Of those with a serious medical condition, % of clients that reported having access to a qualified health practitioner or health facility for treatment for this illness / condition

Current Situation – 2016 • KOMIDA started data collection on baseline for outcome indicators • Verification/quality of data checks are done – but need to make this robust • Made changes in the MIS for data entry, started to enter the data in the MIS • Starting the analysis and reporting
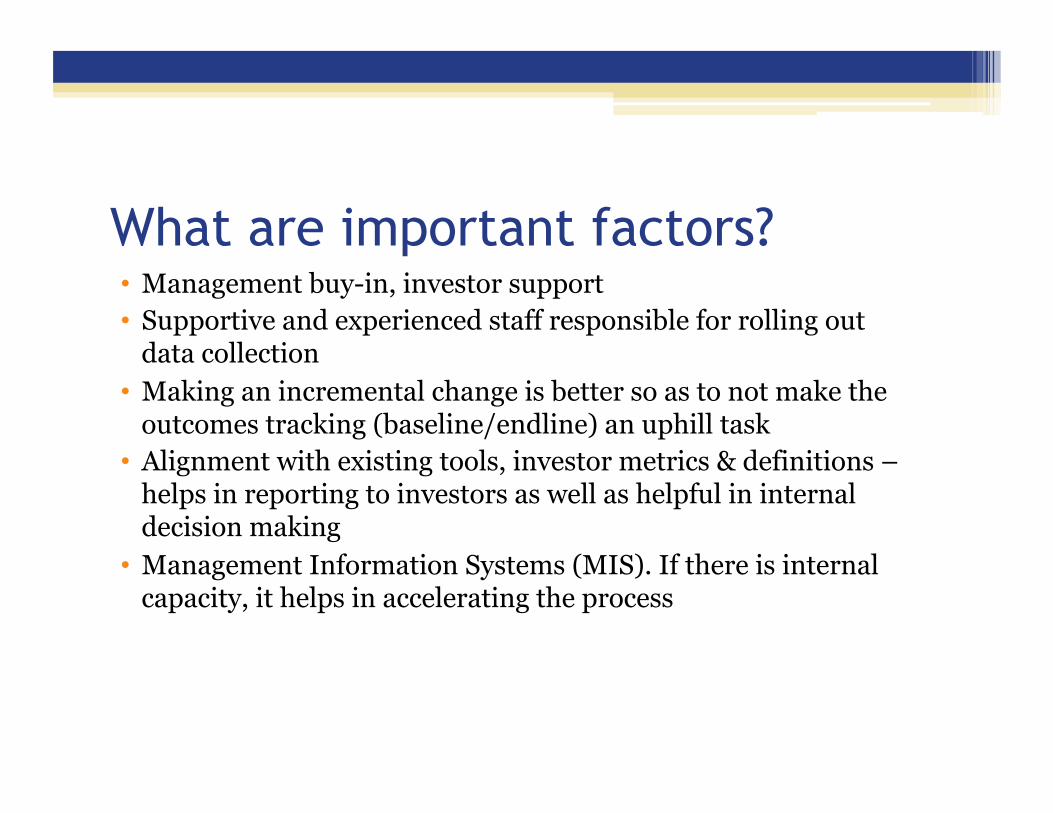
What are important factors? • Management buy-in, investor support • Supportive and experienced staff responsible for rolling out
data collection • Making an incremental change is better so as to not make the
outcomes tracking (baseline/endline) an uphill task • Alignment with existing tools, investor metrics & definitions –
helps in reporting to investors as well as helpful in internal decision making
• Management Information Systems (MIS). If there is internal capacity, it helps in accelerating the process
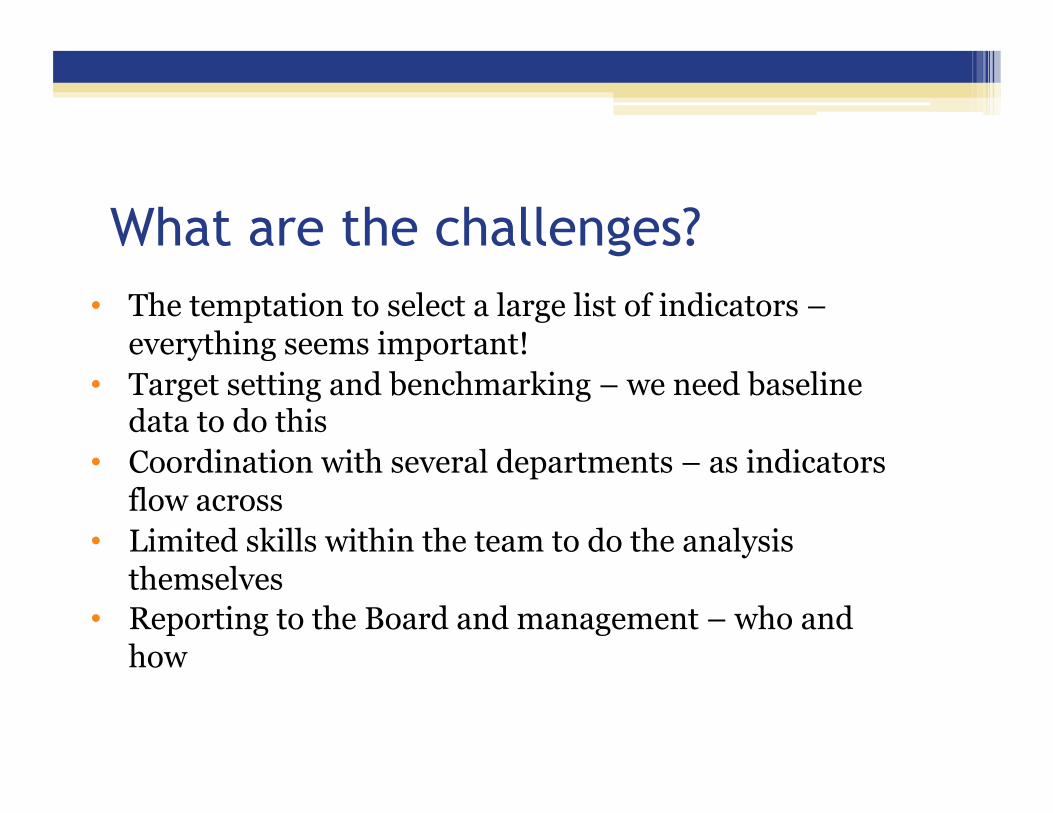
What are the challenges? • The temptation to select a large list of indicators –
everything seems important! • Target setting and benchmarking – we need baseline
data to do this • Coordination with several departments – as indicators
flow across • Limited skills within the team to do the analysis
themselves • Reporting to the Board and management – who and
how
Agenda
• Introduction • OI – investor perspective • KOMIDA – FSP experience
• Ankuram - TA provider
• Discussion with participants
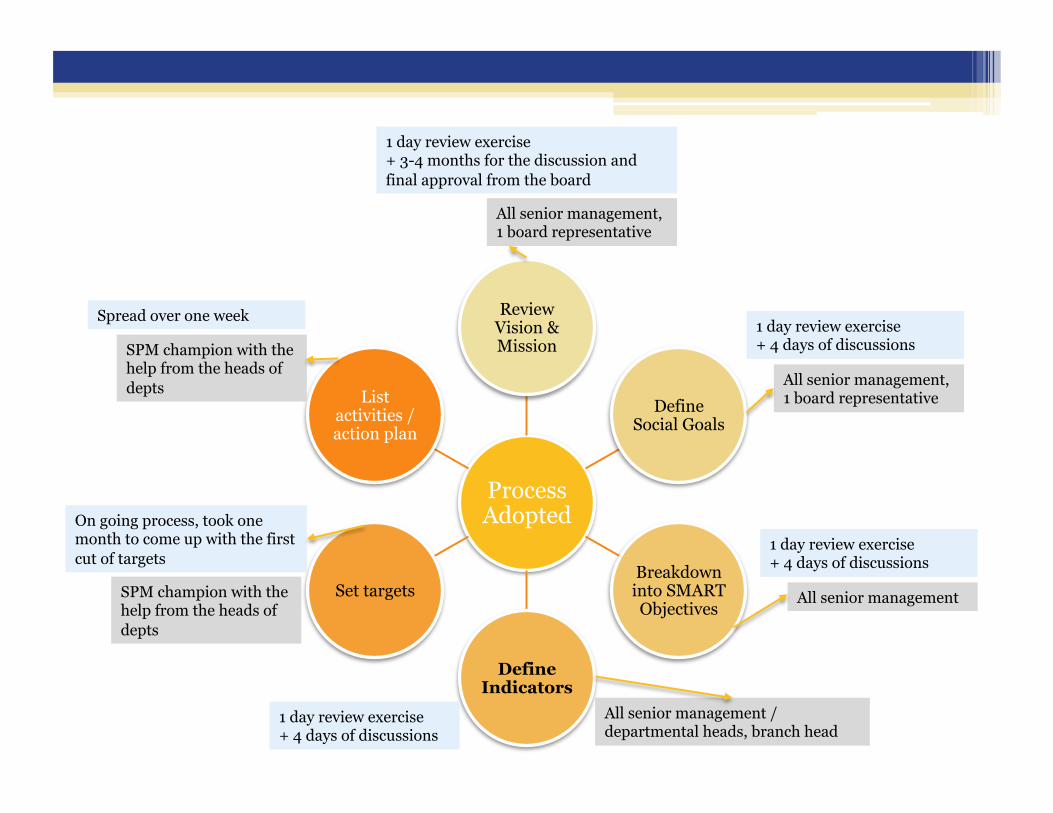
Process Adopted
Review Vision & Mission
Define Social Goals
Breakdown into SMART Objectives
Define Indicators
Set targets
List activities / action plan
1 day review exercise + 3-4 months for the discussion and final approval from the board
All senior management, 1 board representative
1 day review exercise + 4 days of discussions
All senior management, 1 board representative
1 day review exercise + 4 days of discussions
All senior management
1 day review exercise + 4 days of discussions
All senior management / departmental heads, branch head
On going process, took one month to come up with the first cut of targets
SPM champion with the help from the heads of depts
Spread over one week
SPM champion with the help from the heads of depts

Tools Used • Social indicator short listing tool • Indicator mapping tool / Sources of data • Data management plan
--- • For data collection (only outcome indicators): • Modified the housing index sheet • PPI and other social indicators included along with the PPI
questions

Data Management Plan Format
Social Indicators
1A.2 Data collection (Proposed) for Client Level
Data
1A.3 Data
verification and
audit
1A.4 Data
storage
1A.5 Manage/analyse
data
1A.6 Reporting data
Proposed Data
collection tool / form
Data collection
type (Census/ sample)
Data collection frequency
(e.g. continuous,
monthly, annually)
Individual (s)
responsible for
collecting data
Data verification
(How, by whom)
Where is data stored?
Individual(s) responsible
for managing/ analysing data
Reporting audience
Reporting method/
document
Frequency
Includes both baseline and change data related reports
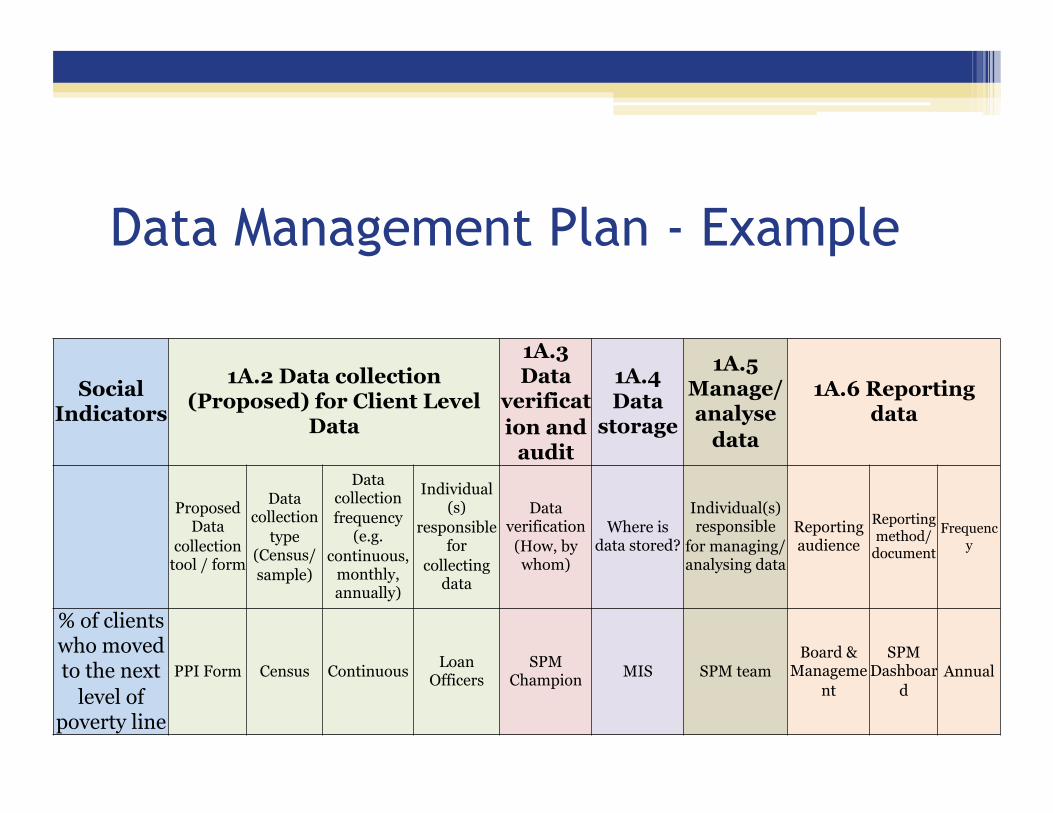
Data Management Plan - Example
Social Indicators
1A.2 Data collection (Proposed) for Client Level
Data
1A.3 Data
verification and
audit
1A.4 Data
storage
1A.5 Manage/analyse
data
1A.6 Reporting data
Proposed Data
collection tool / form
Data collection
type (Census/ sample)
Data collection frequency
(e.g. continuous,
monthly, annually)
Individual (s)
responsible for
collecting data
Data verification
(How, by whom)
Where is data stored?
Individual(s) responsible
for managing/ analysing data
Reporting audience
Reporting method/
document
Frequency
% of clients who moved to the next
level of poverty line
PPI Form Census Continuous Loan Officers
SPM Champion MIS SPM team
Board & Manageme
nt
SPM Dashboar
d Annual
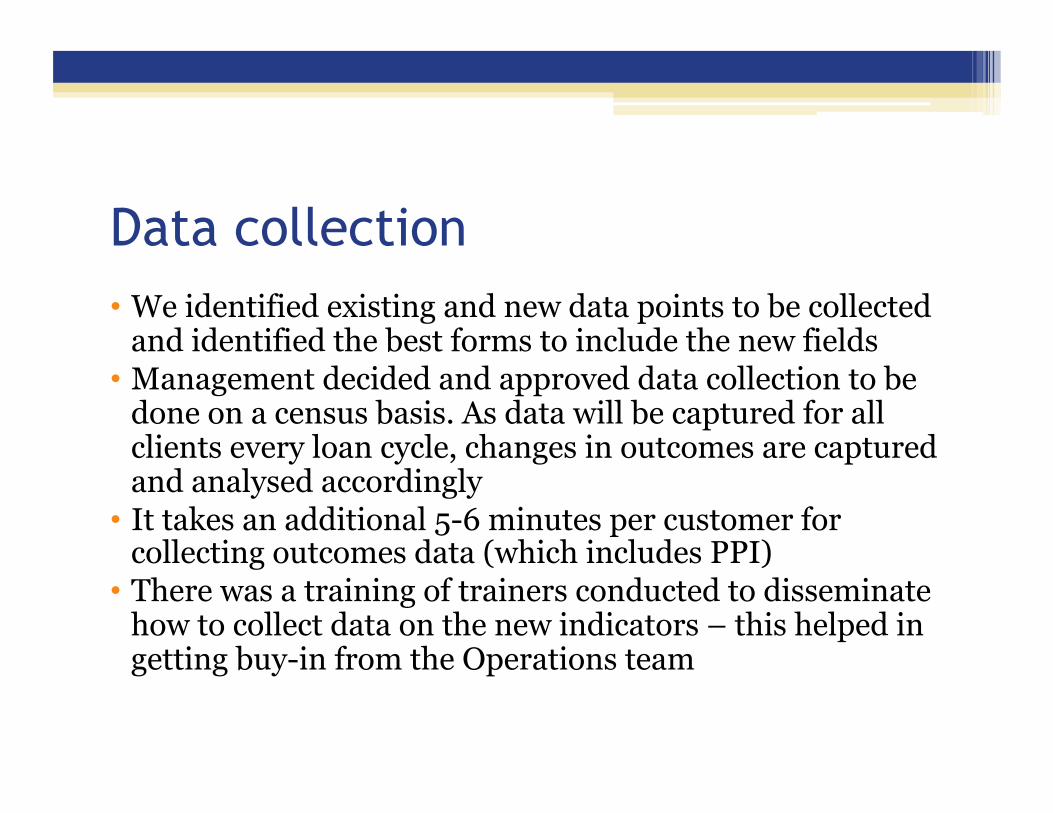
Data collection • We identified existing and new data points to be collected
and identified the best forms to include the new fields • Management decided and approved data collection to be
done on a census basis. As data will be captured for all clients every loan cycle, changes in outcomes are captured and analysed accordingly
• It takes an additional 5-6 minutes per customer for collecting outcomes data (which includes PPI)
• There was a training of trainers conducted to disseminate how to collect data on the new indicators – this helped in getting buy-in from the Operations team

Data Entry • All the outcome indicators are collected on a
census basis, and hence the MIS was tweaked to accommodate all the data points
• MIS Officer at the branch is responsible for entering the data
• The branch manager ensures 100% of the data is entered and verifies the quality of data at first level
• SPM champion conducts random checks to validate and ensure quality of data as final check
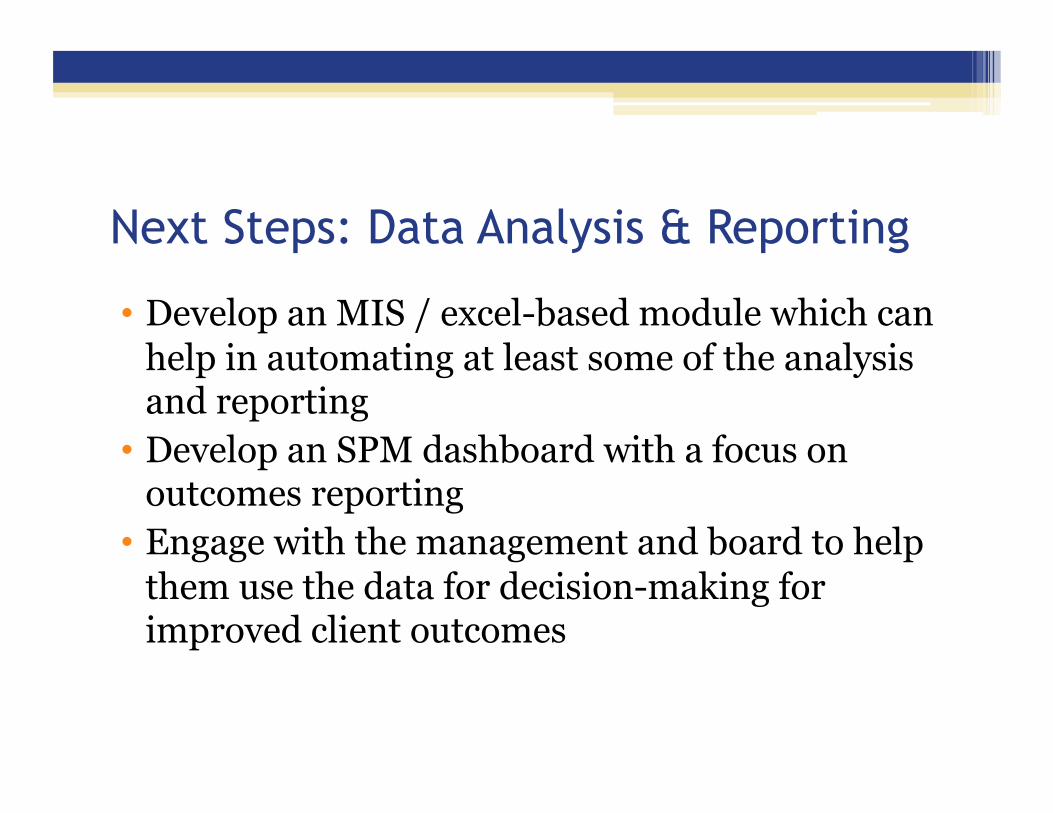
Next Steps: Data Analysis & Reporting
• Develop an MIS / excel-based module which can help in automating at least some of the analysis and reporting
• Develop an SPM dashboard with a focus on outcomes reporting
• Engage with the management and board to help them use the data for decision-making for improved client outcomes
Agenda
• Introduction • OI – investor perspective • KOMIDA – FSP experience • Ankuram - TA provider
• Discussion with participants

Thank you
• For follow up, please contact: [email protected], [email protected]
• Please note: presentations and recordings from all Outcomes Working Group Meetings are being posted to the SPTF website, working groups page: http://sptf.info/sp-task-force/working-groups