Embed Size (px)
Citation preview

Walden University Walden University
ScholarWorks ScholarWorks
Walden Dissertations and Doctoral Studies Walden Dissertations and Doctoral Studies Collection
2020
Outcomes of a School-Wide Mathematics Intervention Outcomes of a School-Wide Mathematics Intervention
Lisa M. Garrett Walden University
Follow this and additional works at: https://scholarworks.waldenu.edu/dissertations
Part of the Education Commons
This Dissertation is brought to you for free and open access by the Walden Dissertations and Doctoral Studies Collection at ScholarWorks. It has been accepted for inclusion in Walden Dissertations and Doctoral Studies by an authorized administrator of ScholarWorks. For more information, please contact [email protected].

Walden University
College of Education
This is to certify that the doctoral study by
Lisa Monique Garrett
has been found to be complete and satisfactory in all respects,
and that any and all revisions required by
the review committee have been made.
Review Committee
Dr. Keith Wright, Committee Chairperson, Education Faculty
Dr. Dannett Babb, Committee Member, Education Faculty
Dr. Richard Hammett, University Reviewer, Education Faculty
Chief Academic Officer and Provost
Sue Subocz, Ph.D.
Walden University
2020

Abstract
Outcomes of a School-Wide Mathematics Intervention
by
Lisa Monique Garrett
MA, State University of New York at Buffalo, 2008
BS, University of New Mexico, 1998
Project Study Submitted in Partial Fulfillment
of the Requirements for the Degree of
Doctor of Education
Walden University
August 2020

Abstract
In response to students’ poor algebra achievement, Midtown High School, a pseudonym,
implemented a school-wide math intervention and enrichment program during the 2014-
2015 school year. The purpose of this mixed-methods study was to assess the influence
of the intervention on Algebra I and Algebra II end-of-course (EOC) exam achievement
scores as well as explore math teachers’ perspectives of the intervention program. The
theoretical foundation was constructivism. A consensus sample using archival data from
all 419 high school students taking Algebra before the intervention 2013-2014 and after
the intervention 2014-2015 and 2015-2016 were used with teacher interviews for
triangulation. ANOVA results indicated a significant difference between the treatment
and comparison groups, F(1,403) = 12.91, p = .00. As related to Algebra I, the
intervention group performed significantly lower than the comparison group (M = 40.99
and M = 52.26, respectively). There were no significant differences found for Algebra II
EOC scores for either the 2014-2015 or 2015-2016 school years. Qualitatively, the most
notable theme was inadequate implementation fidelity of the intervention program, which
helped explain the lower Algebra I performance of the treatment group. Based on these
results, a policy recommendation was developed for the school to create and implement a
systematic process for measuring academic intervention implementation fidelity, to
include creating a leadership team and the introduction of a systematic process for
improving measurement fidelity. Following policy recommendations could lead to social
change by improving high school mathematics achievement, thereby improving high
school graduation rates and increasing postsecondary opportunities.

Outcomes of a School-Wide Mathematics Intervention
by
Lisa Monique Garrett
MA, State University of New York at Buffalo, 2008
BS, University of New Mexico, 1998
Project Study Submitted in Partial Fulfillment
of the Requirements for the Degree of
Doctor of Education
Walden University
August 2020

Acknowledgments
I owe thanks for the success of my project to my family, my professors, and my
colleagues. To my family and colleagues, thank you for your support and encouragement.
In particular, many thanks to my daughter Stephanie for helping me with formatting and
other technicalities. Dr. Keith Wright, my committee chairperson, thank you for your
continued support throughout this process, your help in negotiating with my district for
access to the data, and for your assistance with the data analysis. I also immensely
enjoyed our conversations. I appreciate the help and support from Dr. Dannett Babb, my
committee member, and Dr. Richard Hammett, my university research reviewer, as well.
Thank you all.

i
Table of Contents
List of Tables ..................................................................................................................... iv
List of Figures .................................................................................................................... vi
Section 1: The Problem ........................................................................................................1
The Local Problem .........................................................................................................1
Rationale ........................................................................................................................6
Definition of Terms........................................................................................................8
Significance of the Study .............................................................................................10
Research Questions and Hypotheses ...........................................................................11
Review of the Literature ..............................................................................................14
Theoretical Foundation ......................................................................................... 15
Conceptual Framework ......................................................................................... 16
Review of the Broader Problem ............................................................................ 17
Critical Foundations for Algebra Success............................................................. 21
Instructional Strategies.......................................................................................... 24
Instructional Strategies for Struggling Learners ................................................... 29
Interventions ......................................................................................................... 32
Motivation for Mathematics Success .................................................................... 34
Implications..................................................................................................................36
Summary ......................................................................................................................36
Section 2: The Methodology ..............................................................................................38
Mixed Method Design and Approach ..........................................................................38
Setting and Sample ......................................................................................................39
ii
Data Collection Strategies............................................................................................41
Quantitative Sequence .......................................................................................... 41
Qualitative Sequence ............................................................................................ 42
Data Analysis ...............................................................................................................43
Assumptions and Limitations ......................................................................................44
Data Analysis Results ..................................................................................................46
Quantitative Findings ............................................................................................ 52
Qualitative Findings .............................................................................................. 62
Summary of Quantitative and Qualitative Results.......................................................67
Section 3: The Project ........................................................................................................69
Introduction ..................................................................................................................69
Description and Goals ........................................................................................... 69
Rationale ......................................................................................................................70
Review of the Literature ..............................................................................................72
Implementation Fidelity ........................................................................................ 72
Applications in Educational Research .................................................................. 76
Classroom Applications ........................................................................................ 80
Fidelity Assessment .............................................................................................. 86
Fidelity Measurement Tools ................................................................................. 91
Project Description.......................................................................................................94
Needed Resources and Existing Supports............................................................. 94
Potential Barriers and Solutions............................................................................ 95
Implementation ..................................................................................................... 95

iii
Roles and Responsibilities .................................................................................... 96
Project Evaluation Plan ................................................................................................97
Project Implications .....................................................................................................97
School Community ............................................................................................... 98
Societal .................................................................................................................. 98
Conclusion ...................................................................................................................99
Section 4: Reflections and Conclusions ...........................................................................100
Introduction ................................................................................................................100
Project Strengths and Limitations ..............................................................................100
Recommendations for Alternative Approaches .........................................................101
Scholarship, Project Development and Evaluation, and Leadership and
Change ...........................................................................................................102
Reflection on Importance of the Work ......................................................................105
Implications, Applications, and Directions for Future Research ...............................106
Conclusion .................................................................................................................107
References ........................................................................................................................108
Appendix A: The Project .................................................................................................133
Appendix B: Interview Protocol ......................................................................................185
Appendix C: Data Use Agreement ..................................................................................187
Appendix D: Evaluation and Feedback Survey ...............................................................190

iv
List of Tables
Table 1. Algebra I and Algebra II EOC Percentage Trends for MHS .................................3
Table 2. MHS Student Population Demographics (%) ......................................................40
Table 3. MHS Student Population Ethnicity (%)...............................................................40
Table 4. Standardized Differences (Covariates) for Research Question 1
(QNRQ1)................................................................................................................50
Table 5. Standardized Differences (Covariates) for Research Question 2
(QNRQ2)................................................................................................................51
Table 6. Standardized Differences (Covariates) for Research Question 3
(QNRQ3)................................................................................................................52
Table 7. Estimated Marginal Means for the Actual End of Course Algebra I State
Assessment for QNRQ1.1 ......................................................................................54
Table 8. Analysis of Variance Summary: Tests of Between-Subjects Effects for
QNRQ1.1 ...............................................................................................................55
Table 9. Posthoc Tests for Ethnicity for QNRQ1.1 ...........................................................55
Table 10. Estimated Marginal Means for the Actual End of Course Algebra I State
Assessment for QNRQ1.2 ......................................................................................57
Table 11. Analysis of Variance Summary: Tests of Between-Subjects Effects for
QNRQ1.2 ...............................................................................................................58
Table 12. Estimated Marginal Means for the Actual End of Course Algebra I State
Assessment for QNRQ1.3 ......................................................................................59
Table 13. Analysis of Variance Summary: Tests of Between-Subjects Effects
QNRQ1.3 ...............................................................................................................59

v
Table 14. Estimated Marginal Means for the Actual End of Course Algebra II
State Assessment for QNRQ2 ................................................................................60
Table 15. Analysis of Variance Summary: Tests of Between-Subjects Effects for
QNRQ2 ..................................................................................................................61
Table 16. Estimated Marginal Means for the Actual End-of-Year Algebra II State
Assessment for QNRQ3 .........................................................................................62
Table 17. Analysis of Variance Summary: Tests of Between-Subjects Effects for
QNRQ3 ..................................................................................................................62
Table 18. Personal Beliefs of Interviewed Teachers .........................................................64

vi
List of Figures
Figure 1. Algebra I EOC proficiency trend comparisons for TN, Midtown District, and
MHS .....................................................................................................................................5
Figure 2. Algebra II EOC proficiency trend comparisons for TN, Midtown District, and
MHS .....................................................................................................................................6

1
Section 1: The Problem
The Local Problem
In response to concerns regarding school-wide math outcomes on state Algebra I
and Algebra II End of Course (EOC) exams, Midtown High School (MHS), a pseudonym
for an urban high school in Tennessee (TN), developed and implemented a school-wide
math intervention and enrichment program during the 2014-2015 school year (Jefferson,
2013). However, the effectiveness of the program on student performance after
implementation was unknown as a whole as well as by specific subgroups, including
gender, students served by special education, ethnicity, and economically disadvantaged
students. TN underperformed in mathematics based on both the National Assessment of
Educational Progress (NAEP) and the American College Testing (ACT) assessment.
Also, TN underperformed on proficiency rates on their EOC exam scores. Furthermore,
MHS underperformed in comparison to other TN high schools (Broderick, 2016;
Tennessee Department of Education [TDOE], n.d.-a; U.S. Department of Education
[USDOE], 2013).
TN public schools participate in the NAEP assessments, and only 17% of 12th
graders from TN scored at the proficient level or higher in mathematics on the NAEP
assessments (USDOE, 2013). Also, TN requires all students to take the ACT in their 11th
grade year (ACT, 2015). In 2015, 30% of students in TN met the national benchmark in
mathematics as measured by the ACT while 42% of students nationally met the national
benchmark (Broderick, 2016). Additionally, TN requires all high school students
receiving a high school diploma to complete four years of mathematics, to include one

2
year of each of the following: (a) Algebra I, (b) Geometry, and (c) Algebra II or (a)
Integrated Math I, (b) Integrated Math II, and (c) Integrated Math III (TDOE, n.d.-a). The
Integrated Math course series integrates algebra, geometry, statistics, and trigonometry as
appropriate into each of the courses for more holistic and relevant math instruction
(TDOE, n.d.-a). Currently, both Algebra I and Algebra II require an EOC exam
developed by the state, which is worth 25% of student second-semester grades in those
courses (TDOE, n.d.-a). EOC assessment scores are the State of Tennessee’s summative
assessment scores and used for decision-making at the state, district, and school level
(TDOE, n.d.-a).
On average, in TN, 63.4% of students scored proficient or higher on the Algebra I
EOC in 2014, while only 47.9% of students scored proficient or higher on the Algebra II
EOC (TDOE, n.d.-a). MHS fell below that state average, with 47.2% of students scoring
proficient or higher on the Algebra I EOC in 2014 and 39.9% of students scoring
proficient or higher on the Algebra II EOC, as detailed in Table 1 (TDOE, n.d.-a). The
leadership at MHS sought to focus on student growth in mathematics, as measured by the
Tennessee Value-Added Assessment System (TVAAS), which is based on EOC scores
and used by the state to measure growth (assistant principal, personal communication,
May 15, 2015). Proficiency levels for MHS are delineated in Table 1.
An examination of Algebra I proficiency trends indicated MHS had a higher
percentage of students scoring Below Basic than both the district and the state and a
much lower percentage of students scoring Advanced than the state in both 2013 and
2014 (TDOE, n.d.-a). An examination of Algebra II proficiency trends yielded similar

3
results; MHS had a higher percentage of students scoring Below Basic than both the
district and the state and a lower percentage of students scoring Advanced than the
district in both 2013 and 2014 (TDOE, n.d.-a). Comparisons between MHS, their district,
and the state of Tennessee are shown in Figures 1 and 2.
Table 1
Algebra I and Algebra II EOC Percentage Trends for MHS
Class/Year Below Basic Basic Proficient Advanced
Algebra I 2012 33.0 46.4 16.7 3.9
Algebra I 2013 23.4 23.0 35.7 17.9
Algebra I 2014 23.8 29.0 31.8 15.4
Algebra II 2013 52.4 30.8 13.8 3.0
Algebra II 2014 19.7 40.4 31.1 8.8
Note: (TDOE, n.d.-a)
A school mathematics leader expressed concerns about poor math preparation in
earlier grades, citing poor assessment scores on the Tennessee Comprehensive
Assessment Program (TCAP) by entering freshmen, as a contributing factor to poor high
school math achievement overall (MHS Mathematics Department head, personal
communication, January 5, 2015). Other factors contributing to low student achievement
included poor Algebra I EOC scores for upper-level students and a lack of student
motivation for success in high school mathematics (MHS Mathematics Department head,
personal communication, January 5, 2015; TDOE, n.d.-a). In 2014-2015, MHS
implemented a school-wide intervention and enrichment program, designed by school
staff to address student under-preparedness and lack of motivation, for mathematics

4
achievement (Jefferson, 2013). The school’s goal, according to school leadership
(assistant principal, personal communication, May 15, 2015), was to improve student
math proficiency (i.e., Below Basic, Basic, Proficient, and Advanced) on math EOC
exams. Interventions have been shown to improve secondary school achievement in
reading and mathematics (Cortes, Goodman, & Nomi, 2014; Regional Education
Laboratory West [RELW], 2015; Sarfo, Eshun, Elen, & Adentwi, 2014; Vaughn &
Fletcher, 2012; Vaughn & Swanson, 2015). Additionally, school-wide interventions have
been shown to be effective for raising overall student performance (Cortes et al., 2014;
RELW, 2015; Sarfo et al., 2014; Vaughn & Fletcher, 2012).
The school-wide intervention developed by MHS used a tiered approach based on
the previous year’s end of year state math assessment data (Jefferson, 2013). Students
scoring basic or higher on the previous year’s state math assessment received enrichment
designed to hone problem solving skills while teaching relevance (MHS Mathematics
Department head, personal communication, January 5, 2015). Moderately struggling
students received additional course instruction aimed at re-teaching specific topics and
skills (MHS Mathematics Department head, personal communication, January 5, 2015).
Severely struggling students and students with disabilities participated in computer-based
skills intervention (MHS Mathematics Department head, personal communication,
January 5, 2015). All students participated in the intervention for one hour each week
(MHS Mathematics Department head, personal communication, January 5, 2015).
Additionally, there was a school motto that was shared school-wide each morning and
afternoon, and a school problem of the week that all students worked in their math

5
classes. The students also discussed these problems in other classes, if the math problems
were relevant to those classes (MHS Mathematics Department head, personal
communication, January 5, 2015).
Figure 1: Algebra I EOC proficiency trend comparisons for TN, Midtown District, and
MHS. (TDOE, n.d.-a)
0
5
10
15
20
25
30
35
40
Below
Basic
Basic Proficient Advanced Below
Basic
Basic Proficient Advanced
2013 2014
Per
centa
ge
Axis Title
Algebra I
State District School

6
Figure 2. Algebra II EOC proficiency trend comparisons for TN, Midtown
District, and MHS. (TDOE, n.d.-a)
Although student growth improved considerably in the 2014-2015 school year,
the school did not meet their goal of a TVAAS greater than 1 in mathematics (TDOE,
n.d.-a). It was unknown as to whether or not the improved achievement was significant.
In other words, the benefit to subgroups such as students served by special education,
economically disadvantaged students, whether there were gender and ethnic subgroup
differences, and whether there were grade level and class level differences.
Comprehensively understanding the impact of the intervention and enrichment program
on student growth and achievement, enables school staff to improve their intervention
efforts, hopefully, leading to greater student growth.
Rationale
MHS is located within a large urban school district, is situated in the southwest
section of the district, and is fairly high performing in comparison to other
0
10
20
30
40
50
60
Below
Basic
Basic Proficient Advanced Below
Basic
Basic Proficient Advanced
2013 2014
Pe
rce
nta
ge
Axis Title
Algebra II
State District School

7
comprehensive high schools within the district (TDOE, n.d.-a). The district is 72.7% low
income, with 15.3% of students English Language Learners (ELL) and 12.4% of students
with disabilities (TDOE, n.d.-a). The value-added district data indicated that while
predicted growth was achieved for Algebra I for the 2013-2014 school year and the 3-
year gains were above expectations, predicted growth was not achieved for Algebra II for
the 2013-2014 school year. Also, the 3-year gains were below expectations (TDOE, n.d.-
a). MHS is 56.7% low income, with 7.4% of students classified as ELL and 16.6% of
students with disabilities (TDOE, n.d.-a). Specifically, MHS did not meet their targeted
achievement in Algebra I, 56.5% proficient or higher. While they performed considerably
higher than their targeted achievement in Algebra II, 22% proficient or higher, they still
fell below the state average of 47.9% proficient or higher (TDOE, n.d.-a). In response,
school administrators decided to expand a freshman intervention and enrichment weekly
class to the entire school, to focus on math improvement (Jefferson, 2013).
The intervention and enrichment program employed at MHS had three levels: (a)
computer-based intervention, Study Island, at an instructional level to build basic math
skills and fill in achievement gaps for low-performing students receiving special
education services; (b) teacher led intervention to build algebra skills in areas of struggle,
provide individual guidance, and provide more opportunities for problem solving practice
for students who scored below basic on their previous state math assessment; and (c)
teacher led enrichment to build relevance and expand problem solving capabilities for
students who scored basic or higher on their previous state math assessment. This
program was designed based on many of the tenets of constructivism: constructing

8
knowledge through discovery and background knowledge, developing conceptual
understanding through problem solving, interactive teaching through individual feedback
and guidance, specifically designed activities involving realistic problems, and a learner-
centered approach (Narode, 1987; Pitt & Kirkwood, 2010; Prendergast & Donoghue,
2014; Sharma, 2014). Given that the design of the intervention and enrichment program
was based on many of the guiding principles of constructivism, it seems appropriate to
use constructivism as a framework for studying the outcomes of the program.
The purpose of this mixed-methods study was two-fold. First, I wanted to assess
whether there were differences in student algebra achievement after implementing a
school-wide intervention and enrichment program at MHS in Algebra I and Algebra II
achievement and student growth in mathematics. Quantitative methods were used to test
for significant improvements among the student subgroups (i.e., ethnicity, special
education status, socioeconomic status, and gender). Second, qualitative interviews were
conducted to explore teacher perspectives about the efficacy of the intervention program.
Definition of Terms
Algebra: A mathematical topic of study that includes, among other related topics,
“the arithmetic of signed numbers, solutions of linear equations, quadratic equations, and
systems of linear and/or quadratic equations, and the manipulation of polynomials,
including factoring and rules of exponents” (Katz, 2007, pp. 185-186).
Common Core State Standards (CCSS): New standards built on the best of high-
quality math standards from states across the country and drawn from the most
important international models for mathematical practice (Common Core State

9
Standards Initiative [CCSSI], 2015). CCSS “concentrates on a clear set of math skills
and concepts. Students will learn concepts in a more organized way both during the
school year and across grades. The standards encourage students to solve real-world
problems” (CCSSI, 2015, para 5).
Economically Disadvantaged Students: Up through the 2014-2015 school year,
students were classified as economically disadvantaged according to the free or reduced-
price lunch status. This changed in the 2015-2016 school year in TN as some districts
began in the 2014-2015 school year to provide free meals to all students. In 2015-2016,
the following students were considered economically disadvantaged: (a) students
identified as receiving food stamps, (b) students who participated in the Temporary
Assistance for Needy Families program, (c) students who are homeless, (d) students who
are foster children, and (e) those who are Head Start participants (USDOE, 2012; Wilson,
2016).
Enrichment: Enrichment refers to the learning environment a student experiences
while at school. Enrichment can be measured, and there are many ways to further the
enrichment of students (IAC Publishing, 2017).
Integrated Math: A mathematics educational approach that integrates multiple
mathematical areas. Each high school math course covers topics in algebra, geometry,
statistics, and other appropriate subject matter (Mathnasium, 2018).
Intervention: Differentiated and targeted instructional practices utilizing data-
based decision making to inform instruction (Patterson & Musselman, 2015).

10
Proficiency: Proficiency refers to measurements on standardized tests, such as
proficiency levels, scales, and cut-off scores (Great Schools Partnership, 2014).
Student Performance: Knowledge and skills mastered by students in a course or
subject area, usually measured by assessments and based on predetermined educational
criteria (Lee, 2019).
Significance of the Study
Completing Algebra II in ninth grade is a significant predictor of postsecondary
success, according to the College & Career Readiness & Success Center (CCRS, 2013).
Similarly, completing Algebra II in high school increases the chances of attending
college and being prepared for technology-based jobs that may or may not require college
coursework (ACT, 2007; Kim, Kim, DesJardins, & McCall, 2015a). Additionally,
passing Algebra I significantly increases the probability of graduating from high school,
broadening employment opportunities, and improving wages (Schachter, 2013).
This study addressed a local problem, algebra achievement at an urban public
high school, MHS. This project study was unique as the purpose was to study the impact
of a school-wide mathematics intervention program developed by school staff and
implemented at MHS during the 2014-2015 school year. The results of this study
provided information about the effects of the intervention on student algebra achievement
and student growth in mathematics, enabling MHS to continue to improve algebra
intervention efforts and allowing other high schools to learn through MHS’s efforts. Of
specific interest were the impacts of the intervention on economically disadvantaged
students, ethnically diverse students, female students, and students served by special

11
education. Given that United States high school students, TN state students specifically,
perform poorly in mathematics, evidence of how such a school-wide intervention and
enrichment program impacted student algebra achievement outcomes in mathematics
could inform future intervention and enrichment efforts (TDOE, n.d.-a; USDOE, 2013).
Research Questions and Hypotheses
In response to their students’ poor algebra achievement, MHS implemented a
school-wide math intervention and enrichment program during the 2014-2015 school
year. The purpose of this study was to assess the efficacy of the intervention by
comparing Algebra I and Algebra II EOC exam achievement scores before and after
intervention implementation and by exploring math teachers’ perspectives of the
intervention program. The purpose of research questions is to state the specific questions
researchers strive to answer (Creswell, 2012). In accordance with the framework for this
study, the research was guided by three quantitative (QN) and one qualitative (QL)
research questions. The quantitative elements of the study were guided by the following
quantitative questions and hypotheses.
QNRQ1 – What is the difference in student achievement as measured by the
Algebra I EOC from the 2014-2015 school year, the year after the school-wide
intervention and enrichment program was implemented, and the 2013-2014 school year,
the year before implementation?
H01: There is no difference in student Algebra I achievement scores between the
2013-2014 school year and the 2014-2015 school year.
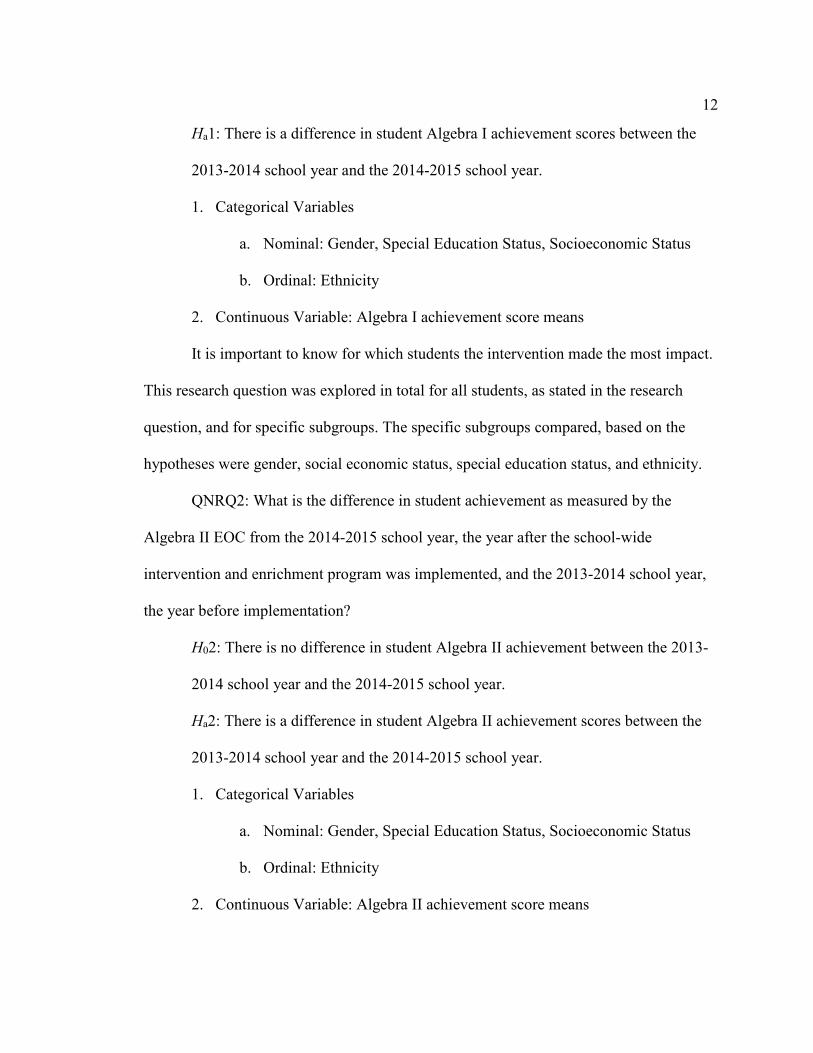
12
Ha1: There is a difference in student Algebra I achievement scores between the
2013-2014 school year and the 2014-2015 school year.
1. Categorical Variables
a. Nominal: Gender, Special Education Status, Socioeconomic Status
b. Ordinal: Ethnicity
2. Continuous Variable: Algebra I achievement score means
It is important to know for which students the intervention made the most impact.
This research question was explored in total for all students, as stated in the research
question, and for specific subgroups. The specific subgroups compared, based on the
hypotheses were gender, social economic status, special education status, and ethnicity.
QNRQ2: What is the difference in student achievement as measured by the
Algebra II EOC from the 2014-2015 school year, the year after the school-wide
intervention and enrichment program was implemented, and the 2013-2014 school year,
the year before implementation?
H02: There is no difference in student Algebra II achievement between the 2013-
2014 school year and the 2014-2015 school year.
Ha2: There is a difference in student Algebra II achievement scores between the
2013-2014 school year and the 2014-2015 school year.
1. Categorical Variables
a. Nominal: Gender, Special Education Status, Socioeconomic Status
b. Ordinal: Ethnicity
2. Continuous Variable: Algebra II achievement score means

13
It is important to know for which students the intervention made the most impact.
This research question was explored in total for all students, as stated in the research
question, and for specific subgroups. The specific subgroups compared, based on the
hypotheses, were gender, social economic status, special education status, and ethnicity.
QNRQ3: What is the difference in student achievement as measured by the
Algebra II EOC from the 2015-2016 school year, two years after the school-wide
intervention and enrichment program was implemented, and as the 2013-2014 school
year, the year before implementation?
H03: There is no difference in student Algebra II achievement scores between the
2013-2014 school year and the 2015-2016 school year.
Ha3: There is a difference in student Algebra II achievement scores between the
2013-2014 school year and the 2015-2016 school year.
1. Categorical Variables
a. Nominal: Gender, Special Education Status, Socioeconomic Status
b. Ordinal: Ethnicity
2. Continuous Variable: Algebra II achievement score means
It is important to know for which students the intervention was sustained into the
2015-2016 school year. This research question was explored in total for all students, as
stated in the research question, and for specific subgroups. The specific subgroups
compared, based on the hypotheses, were gender, social economic status, special
education status, and ethnicity.

14
While quantitative research data are important for understanding research
phenomenon from an objective perspective, the individual perspectives of those involved
are often most illuminative (Creswell, 2012). Therefore, a QL research question was
developed to pursue a mixed-methods approach. The QL research question (QLRQ1) for
this study sought to explore the efficacy of the intervention program from the
perspectives of math teachers who were responsible for the program.
QLRQ1: What are MHS math teachers’ perceptions about the efficacy of the
intervention and enrichment program?
The following issue subquestions characterize the specific issues explored when
during the investigation of QLRQ1. They are as follows:
1. What are MHS math teachers’ perceptions of program activities?
2. What are MHS math teachers’ perceptions of implementation fidelity?
3. What are MHS math teachers’ perceptions of student classroom engagement
during math class?
4. What are MHS math teachers’ perceptions of the overall effectiveness of the
program for improving student achievement?
These issue subquestions provided a means for a thorough exploration of the qualitative
research question QLRQ1.
Review of the Literature
Improving algebra proficiency and achievement is a complex and multifaceted
undertaking. This review of literature addresses this complexity through several sections
beginning with the theoretical framework and conceptual foundation for the study and

15
then followed by a review of the broader problem. After these foundations are laid, what
follows is a review of the literature on (a) foundations for success in algebra, (b)
secondary mathematics and algebra instructional practices for typical learners, (c)
secondary mathematics and algebra instructional practices for struggling learners, (d)
secondary mathematics and algebra interventions, and (e) motivational strategies for
secondary mathematics and algebra students. This organization allows the reader, after
delving into the theoretical foundation and national problem, to gain a basic
understanding of the following: (a) what is necessary for success in algebra; (b) how to
teach algebra and secondary mathematics students; (c) how to intervene with struggling
algebra and secondary mathematics students; and (d) how to motivate algebra and
secondary mathematics students toward higher achievement.
Theoretical Foundation
Constructivism formed the theoretical basis for this study. The basic tenets of this
theory applied to education suggest that students should develop the capacity to construct
knowledge and to defend their constructions (see Gash, 2017; Narode, 1987; Tahir,
2010). Using a constructivist framework, teachers act as facilitators, providing resources,
individual guidance, and feedback to students (Narode, 1987; Pitt & Kirkwood, 2010;
Sharma, 2014; Tahir, 2010). Conceptual understanding, through problem solving, is
emphasized under the constructivist framework and the questioning of assumptions from
various perspectives is expected (Gash, 2017; Narode, 1987; Tahir, 2010). Given the
current emphasis on conceptual understanding, reasoning with and creating with
equations, and problem solving in algebra curriculum, as proposed by the CCSS,

16
constructivism is an appropriate framework from which to examine math intervention
and instruction (CCSSI, 2015).
Conceptual Framework
Piaget’s theory of cognitive development, in particular, his description of the
formal operations stage, provided a conceptual model as well as enhance the theoretical
framework (see Furth & Wachs, 1975; Inhelder & Piaget, 1958; Niaz, 1989; Ojose, 2008;
Tahir, 2010). Piaget is considered a forefather of constructivism and his analysis of the
intellectual development of children generally supports the basic tenets of constructivism
(Gash, 2014; Gash, 2017; Narode, 1987). Piaget’s theory is particularly relevant for any
study of secondary mathematics, as formal operations include such necessary cognitive
abilities for math achievement as thinking in abstractions and logical reasoning (Ewing,
Foster, & Whittington, 2011; Niaz, 1989; Ojose, 2008). Active experience, an influence
on cognitive development, can be provided by teachers through various classroom
activities (Ewing et al., 2011; Tahir, 2010). Social interaction, another influence on
cognitive development according to Piagetian theory, can be facilitated through
classroom activities and through the relationship students build with their teachers
(Ewing et al., 2011; Inhelder & Piaget, 1958; Prendergast & Donoghue, 2014). As both
experiential learning and social interaction are both aspects of current educational
pedagogy, Piaget’s theory continues to support current educational strategies with
adolescents and is appropriate for theoretical support of this study (Didem & Mehmet,
2019; Slavich & Zimbardo, 2012).

17
Review of the Broader Problem
Topics included in this section include the importance of success in algebra for
postsecondary outcomes and national data on secondary math achievement and readiness
for college and career. Search terms included but were not limited to algebra instruction,
math intervention, algebra, secondary math instruction, and secondary math
intervention. The research reported here was found via education research databases such
as ERIC, SAGE, and Education Source; Google Scholar; books; and article and book
chapter requests through Walden’s library.
Improved algebra achievement in high school is currently a goal at many
American high schools. While improved algebra achievement is currently a goal, whether
or not it is a good or even a necessary goal, is debated in the literature. Gaertner, Kim,
DesJardins, and McClarty (2014) found that completing Algebra II is more important for
college outcomes than career outcomes, and Kim et al. (2015a) found that completing
Algebra II only slightly increases the probability of attending college. Additionally,
Wilder (2013) suggested that success in college algebra, while predicting college success,
does not improve student cognitive skills. Regardless, according to Schachter (2013),
students’ inability to pass Algebra I is often the reason they leave school, affecting
minority students most. Given that indicators of high school and postsecondary success
include completing without remediation Algebra I in eighth grade, Algebra II in ninth
grade, and 3 more years of advanced math culminating in either Pre-Calculus or
Calculus, students unable to pass Algebra I are predicted to have limited secondary and
postsecondary success (CCRS, 2013; RELW, 2015). Specifically, repeating Algebra I in

18
ninth grade after failing in eighth grade has not been shown to create substantial gains in
algebra proficiency (RELW, 2015). Moreover, the groups most likely to fail algebra in
the eighth grade are economically disadvantaged students, Hispanic students, and ELL
students (RELW, 2015). Additionally, while race, class, and skill gaps have narrowed
across several secondary math courses, including Algebra II, inequalities in calculus
completion remain relatively unchanged. This suggests that while more students may be
completing advanced high school courses, they are not attaining the necessary skills to
complete a calculus course (Domina & Saldana, 2012; Kolluri, 2018). In summary, while
secondary math achievement improves from taking algebra, overall school success is not
necessarily improved or potentially harmed, and inequities among student groups
continue to exist (Domina & Saldana, 2012; Kolluri, 2018; RELW, 2015; Schachter,
2013).
The Nation’s Report Card showed that only 26% of 12th graders scored proficient
or higher on the NAEP assessments in 2013, and the national average on the NAEP
assessments remained unchanged from 2009 to 2013 (USDOE, 2013). Specifically,
students who score proficient or higher on the NAEP assessment score 176 or more
points out of 300 points (National Center for Education Statistics [NCES], 2015).
Algebra is a core content area of the NAEP assessment and is a building block for several
of the other core content areas, such as statistics and geometry (Executive Office of the
President [EOP], 2014; Katz, 2007; USDOE, 2013). According to the ACT and the
Council of the Great City Schools (2007), while not all students plan to attend college
after high school, there is an increase in technology-based jobs requiring skills similar to

19
those of college-bound students. This logically leads to the conclusion that a college
readiness curriculum, including algebra courses, should be provided to all high school
students (ACT, 2007). In support of this conclusion is evidence that high school students
who participate in and master the college readiness curriculum are more likely to enroll in
and complete postsecondary college coursework (ACT, 2007; RELW, 2015). According
to the 2014 annual report by Achieve (2015), Closing the Expectations Gap, 23 states and
the District of Columbia now require all high school students to enroll in a college
preparatory curriculum, which includes four years of mathematics, including 2 years of
algebra. However, in 2015, only 42% of students taking the ACT met the ACT College
Readiness Benchmark in mathematics, a score of 19, declining from 45% in 2011 (ACT,
2015; CCRS, 2013). Economically disadvantaged students are less likely to meet this
benchmark (ACT, 2015; EOP, 2014). The mathematics portion of the ACT primarily
assesses students’ preparedness to obtain a grade of C or higher in college algebra (ACT,
2015). This indicates that only 42% of students taking the ACT are prepared to earn at
least a C in college algebra (ACT, 2015).
Determined to improve educational outcomes for all students, Chicago Public
Schools implemented a college readiness curriculum for all students in 1997, and the
results are not all positive for all students, particularly in regards to algebra outcomes
(Allensworth & Nomi, 2009; Nomi & Raudenbush, 2016). In a study examining the
effects of raising graduation requirements, no observable benefits were found for
enrolling in Algebra I instead of remedial math, and there were multiple adverse effects.
These effects were higher absenteeism, higher math failure rates, and decreased math
20
grades (Allensworth & Nomi, 2009; Allensworth, Nomi, Montgomery, & Lee, 2009;
Nomi & Raudenbush, 2016). Additionally, math skill levels for high-skill students were
negatively impacted by the policy in schools where previously, there had been several
remedial math students. De-tracking created more heterogeneous classrooms and
therefore lowered the overall math ability in those algebra classes (Nomi, 2010; Nomi &
Raudenbush, 2016). Conclusions from this research suggested that requiring college
preparatory curriculum alone does not positively impact student achievement, but that
factors such as student engagement, classroom climate, instructional quality, and student
motivation also contribute to student algebra outcomes (Allensworth & Nomi, 2009;
Allensworth et al., 2009; Nomi, 2010; Nomi & Raudenbush, 2016; Simon, Stoelinga,
Bush-Richards, De Sena, & Dwyer, 2018). Mazzeo (2010), in a policy brief on Chicago
Public Schools’ efforts, stated
This raises an important point: As long as students are minimally engaged in their
courses and attend school irregularly, policymakers should not expect substantial
improvements in learning. Getting the content and structure of courses right is just
the first step. Real improvement in learning will require states and districts to
develop strategies that get students excited about learning, attending class
regularly, and working hard in their courses. (pp. 10-11)
Findings from both the NAEP and ACT data and this research point to both school and
district level multidisciplinary concerns in need of improvement for the improvement of
algebra achievement to be achieved (Allensworth & Nomi, 2009; Allensworth et al.,
2009; Mazzeo, 2010; Nomi, 2010; Nomi & Raudenbush, 2016; Simon et al., 2018).

21
Critical Foundations for Algebra Success
Student engagement, motivation, and success in algebra are positively linked to
student preparation for algebra (Durik, Hulleman, & Harackiewicz, 2015; Witzel, 2016).
Student success in algebra is a culmination of success in understanding a variety of
foundational mathematical topics, and a gap in understanding of any of these topics can
lead to struggles in algebra (Witzel, 2016). The major topics covered in high school
algebra are as follows: symbols and expressions, linear equations, quadratic equations,
combinatorics and finite probability, functions, algebra, and polynomials
(VanDerHeyden & Allsopp, 2014; Witzel, 2016). Readiness to study these topics requires
mastery of specific arithmetic and geometry skills and concepts (VanDerHeyden &
Allsopp, 2014; Witzel, 2016).
Witzel (2016) lists the following as critical foundations for success on the major
topics covered in high school algebra: (a) whole-number operations; (b) identify,
represent, and compare fractions and decimals; (c) rational-number operations; (d)
properties and measures of two- and three- dimensional shapes; and (e) similar triangles
and slopes. Similarly, the CCSS topics emphasized in elementary school as essential for
high school math success include counting and cardinality, operations and algebraic
thinking, number and operations in base ten, number and operations – fractions,
measurement and data, and geometry (CCSSI, 2015; VanDerHeyden & Allsopp, 2014).
In middle school, the topics emphasized are geometry, ratio and proportional
relationships, the number system, expressions and equations, functions, and statistics and
probability (CCSSI, 2015; VanDerHeyden & Allsopp, 2014). These topics, as well as

22
operations and algebraic thinking, are expanded upon in high school coursework to
include algebra (VanDerHeyden & Allsopp, 2014).
More specifically, success in algebra requires number sense, or conceptual
understanding of numeracy skills (Witzel, 2016). Having number sense proceeds a
conceptual understanding of computation, and fluent calculation, both necessary for
success in algebra as calculation fluency allows students to focus their attention on
conceptual understanding of new topics (Siegler et al., 2012; Witzel, 2016). Success with
whole number division specifically is highly correlated with success in high school
mathematics, including algebra (Siegler et al., 2012). Some common problematic
computational misconceptions include the belief that the equals sign indicates which
operation to perform and that negative signs only represent subtraction (Barbieri, Miller-
Cotto, & Booth, 2019; Booth, Barbieri, Eyer, & Pare-Blagoev, 2014). Order of
operations, in general, is a source of difficulty for students (Barbieri et al., 2019; Booth et
al., 2014). Students also inappropriately apply the commutative property, associative
property, distributive property, and sometimes use the wrong operations (Booth et al.,
2014). While not prominent errors among algebra students, these errors are indicative of
students who struggle significantly in high school mathematics (Barbieri et al., 2019;
Booth et al., 2014). Additionally, conceptually understanding fractions as well as
computational proficiency with fractions is essential for algebra readiness, and many
consider proficiency with fractions to be the most necessary arithmetic skill for success in
algebra (Purwadi, Sudiarta, & Suparta, 2019; Siegler et al., 2012; Torbeyns, Schneider,
Xin, & Siegler, 2015; Witzel, 2016).

23
Other skills considered important for success in algebra are related to the
abstraction that students are introduced to in algebra course work. Students often struggle
with the notion that variables can only represent one value and misunderstand the concept
of like terms (Barbieri et al., 2019; Booth et al., 2014). These misconceptions lead to
combining unlike terms, deleting or adding a variable, and solving for only one variable
(Barbieri et al., 2019; Booth et al., 2014). Problem solving skills, also related to
abstraction, are necessary for successful algebra problem solving (Bouck & Bouck, 2016;
Xin et al., 2011). Word problems require students to interpret the problem, construct the
problem, as well as complete the necessary computations (Bouck & Bouck, 2016).
Specific skills necessary for solving word problems include fluent reading skills,
language skills to include strong vocabulary, working memory, nonverbal problem
solving skills, and fluent computation skills (Bouck & Bouck, 2016; Walkington,
Clinton, & Shivraj, 2018). In algebra specifically, students, to construct the problem,
need to represent the information in a word problem symbolically in equations, building
on the aforementioned skills (Bouck, & Bouck, 2016; Walkington et al., 2018; Xin et al.,
2011).
Strong reading and language skills are not only essential for problem solving, they
are also necessary for reading math textbooks (Massey & Riley, 2013; Wei, Lenz, &
Blackorby, 2016). Reading skills are considered by many a strong predictor of success in
secondary math (Massey & Riley, 2013; Wei et al., 2016). The combination of natural
language and symbolic language presented in math textbooks is unique to math and some
science texts and requires students to comprehend and use language differently than in

24
other academic classes (Massey & Riley, 2013; Wei et al., 2016). In summary, there are
many critical foundational skills necessary for success in algebra, with strong reading and
number sense skills being essential.
Instructional Strategies
To build upon acquired foundational skills necessary for success in algebra,
effective teachers must choose evidence-based instructional strategies and adapt them
based on the content and student needs (VanDerHeyden & Allsopp, 2014). The
recommended process for teaching a new math concept involves following the CCSS
learning standards, using student data, building conceptual understanding, developing
problem solving skills, fostering fluency, and creating opportunities for generalization
(VanDerHeyden & Allsopp, 2014). VanDerHeyden and Allsopp (2014), suggested the
following indicators that a math teacher is effective: (a) integrates activities to cultivate
conceptual comprehension; (b) offers adequate opportunities to build fluency and
generalization of conceptual comprehension and skills; and (c) uses explicit, systematic
instructional strategies that reinforce mathematical knowledge gains for students who
need more intensive instruction.
Evidenced-based practices that build mathematical reasoning and problem solving
include: (a) requiring students to justify their reasoning; (b) using mistakes as an
opportunity for learning; (c) using problems to help students learn new concepts; (d)
allowing students to explore new problems on their own as an introduction to new
material; and (e) choosing relevant problems (Seeley, 2016a). Similarly, instructional

25
practices recommended by the National Council of Teachers of Mathematics (NCTM)
include the following:
Establish mathematics goals to focus learning, implement tasks that promote
reasoning and problem solving, use and connect mathematical representations,
facilitate meaningful mathematical discourse, pose purposeful questions, build
procedural fluency from conceptual understanding, support productive struggle in
learning mathematics, and elicit and use evidence of student thinking. (NCTM,
2014, p.10)
These practices engage students in a discussion about their work and reasoning, creating
a student-centered classroom, rather than a teacher-centered approach based on lecture
and practice (NCTM, 2014; Seeley, 2016b). One recommended way to create a student-
centered classroom is to use the You-We-I model (Seeley, 2016a). The model represents
the following instructional process: Students (You) first explore a problem; the class
(We) then has a teacher-directed discussion about what they did, their reasoning, and
what they learned; and then the teacher (I) helps students connect their work to the
mathematical content and procedures in the lesson (Seeley, 2016a). Using a model such
as this also allows students opportunities to engage in productive struggle, strengthen
reasoning skills, and learn multiple strategies for solving problems, which expands
problem solving skills while accommodating diverse learners (Lynch & Star, 2016;
NCTM, 2014; Seeley, 2016a).
Some educators argue the most important outcome for students in their
mathematics education is to develop mathematical habits of mind (Matsura, Sword,

26
Piecham, Stevens, & Cuoco, 2013; Seeley, 2016a). Defined by Seeley (2016a), this
means “the ability to think mathematically, analyze situations, understand relationships,
and adapt what they know to solve a wide range of problems” (p. 13). These habits of
mind include: (a) performing thought experiments; (b) finding, articulating, and
explaining patterns; (c) creating and using representations; (d) generalizing from
examples; (e) articulating generality in precise language; and (f) expecting mathematics
to make sense (Cuoco, Goldenberg, & Mark, 2010; Seeley, 2016a). Additionally,
mathematical habits of mind are closely aligned with CCSS, in particular, the Common
Core Standards for Mathematical Practice (Matsura et al., 2013). These mathematical
practices, for all secondary math instruction, according to the National Council of
Teachers of Mathematics (2014) include the following: (a) comprehend problems and
persist in solving them; (b) think conceptually and quantitatively; (c) build feasible
arguments and evaluate others’ reasoning; (d) model mathematically; (e) use suitable
tools purposefully; (f) focus on accuracy; (g) seek and utilize structure; and (h) seek and
convey uniformity in reiterated reasoning. These mathematics instructional practices are
essential for effective and comprehensive secondary mathematics instruction.
Algebra students specifically need opportunities to struggle with concepts so they
can make conceptual connections with algebraic procedures, allowing for the
development of both conceptual understanding and procedural fluency (American
Institutes for Research [AIR], 2014b). Rakes, Valentine, McGatha, and Ronau (2010)
found the development of conceptual understanding in algebra improved student algebra
achievement more than developing procedural understanding. Similarly, key findings by

27
the AIR (2014b) on algebra instruction suggested critical features, to focus on conceptual
understanding, for effective instruction in Algebra I. The features included: (a) content
specific activities for teaching algebraic symbols; (b) comparison of solution methods to
increase algebraic reasoning; (c) risk taking through prediction, investigation, and
justification to increase learning; (d) technology support for mathematical exploration;
and (e) content that includes modeling activities. Clearly, effective algebra instruction
would include these elements.
Additional evidence of improving student algebra achievement through building
conceptual understanding is found in studies on teaching specific algebra constructs.
Developing student awareness of the structural similarity between arithmetic and
algebraic expressions has been shown to support student learning of transformations
(Banerjee & Subramaniam, 2012; Schuler-Meyer, 2017). Using prediction questions to
prompt reflection and discussion to begin lessons provokes students to connect learned
ideas when learning linear and exponential functions (Kasmer & Kim, 2012). Wittmann,
Flood, and Black (2013) show that students who solve problems efficiently treat terms in
an equation like physical objects; they use spatial reasoning to manipulate mathematical
terms more so than mathematical language, exhibiting a conceptual understanding of
algebraic procedures.
Algebra instruction should also be systematic and explicit to be effective (Hughes,
2016; Rakes et al., 2010; VanDerHeyden & Allsopp, 2014). Systematic instruction
naturally builds on the natural progression of skills requiring teachers to plan for the
learning of skills, as well as the application, maintenance, and generalization of those

28
skills (Hughes, 2016). Strategies for systematic instruction include: (a) showing multiple
examples of similarly structured problems, (b) discussing why and how each step was
completed, (c) using non-examples to show when not to use specific skills, (d) having
students rework problems, (e) using examples of worked problems with common errors,
(f) teaching to mastery, and (g) providing a range of application examples to support the
transfer of new skills to new situations (Hughes, 2016). Explicit algebra instruction
engages students through communicating purpose and relevancy, modeling with
questioning and discussion, interactive problem solving with teacher feedback, guided
practice of the learned skills while discussing why something works, and independent
practice of the learned skills (Hughes, 2016). Additional, evidence-based
recommendations from the IES Practice Guide include using worked problems to involve
students in examining algebraic reasoning, teaching students to apply the structure of
algebraic representations, and teaching students to choose different algebraic strategies
when problem solving (National Center for Education Evaluation and Regional
Assistance [NCEE], 2015).
Technology used for math and algebra instruction improves student achievement
(Derderian, 2014; EOP, 2014; Kim, Chang, Choi, Park, & Kim, 2016; NCTM, 2014;
Rakes et al., 2010). Kim, et al. (2016) showed that when students regularly used
computers for school work, the students exhibited high mathematics self-efficacy and had
higher mathematics performance than students who did not regularly use computers for
school work. Classroom connectivity technology or wireless communication systems that
connect graphing calculators with teacher computers, increase student interaction with

29
algebra content, increase opportunities for class discourse around algebra concepts, and
improve teacher formative assessment opportunities. All of these are associated with
improved student achievement (Hegedus, Dalton, & Tapper, 2015; Irving et al., 2016;
Pape et al., 2013). Further, classroom connectivity technology significantly impacts
student conceptual learning and procedural learning (Derderian, 2014; Hegedus et al.,
2015). This in conjunction with direct, explicit instruction with a focus on conceptual
understanding drawing on evidence-based instructional practices, makes for effective
secondary math and algebra instruction (AIR, 2014b; Derderian, 2014; Hegedus et al.,
2015; Hughes, 2016; NCTM, 2014; Rakes et al., 2010; VanDerHeyden & Allsopp, 2014).
Instructional Strategies for Struggling Learners
Students who struggle with mathematics, like typical students, benefit from
instruction well aligned with the CCSS and instruction that is focused on the foundational
skills for their grade level (Allsopp, Ingen, Simsek, & Haley, 2016; EOP, 2014; Powell,
Fuchs, & Fuchs, 2013; Van Baxtel, 2016). Economically disadvantaged, struggling
students profit from increased instructional time and differentiation of instruction within
the classroom to be successful (EOP, 2014). Intensive math intervention furthers
struggling students’ mathematical knowledge (RELW, 2015).
Many struggling students benefit from skill prioritization (Powell et al., 2013;
Van Baxtel, 2016). One strategy is to use a mountain hike analogy (Powell et al., 2013).
A CCSS cluster is at the summit of the mountain with standards and foundational skills
that fall below the cluster integrated such that their mastery leads to mastery of the cluster
(Powell et al., 2013). To create such a mountain or prioritization of skills, each struggling

30
student should be assessed to determine their specific needs (Powell et al., 2013). Once
the mountains have been created, evidenced-based instruction that is logically sequenced
to teach the identified foundational skills should be utilized while still providing
instruction on the cluster, enabling students to make connections between the skills and
the concepts (Powell et al., 2013; Van Baxtel, 2016).
Another instructional strategy that shows efficacy with struggling secondary
students includes a three-part instructional strategy where students work conceptually at
three different levels: concrete, representational, and abstract, referred to as CRA
(Allsopp et al., 2016; Derderian, 2014; Montague & Jitendra, 2012). Students who
struggle with mathematics often struggle when having to apply concepts at an abstract
level. CRA allows students to move easily from one level to the other, working toward an
understanding of the abstractness of mathematics (Derderian, 2014). Instructional
strategies that improve CRA levels include individualized mathematics, adjusted speech,
daily re-looping of previously learned material, ecological approach, explicit timing, and
explicit vocabulary building (Derderian, 2014). Allsopp et al. (2016) recommends a
specific algebra instructional process for struggling students utilizing CRA, which
includes the following steps: identify target algebra content and mathematical practices,
represent the problem, teach for understanding, differentiate instruction, and teach for
proficiency, and build fluency.
A third approach for working with struggling math students combines direct
instruction with strategy instruction (Freeman-Green, O’Brien, Wood, & Hitt, 2015;
Montague & Jitendra, 2012). This approach is organized, teacher-oriented, and most

31
appropriate for improving basic math skills necessary for algebra (Freeman-Green et al.,
2015; Montague & Jitendra, 2012). Components of this approach include sequencing
instruction, drill and practice, segmentation, student/teacher dialogue, processing task
demands using sequencing and prompting, technology, modeling problem solving tasks,
small group instruction, strategy cues (e.g., mnemonics), and supplements to instruction
(e.g., tutors and homework) (Freeman-Green et al., 2015; Montague & Jitendra, 2012;
Witzel, 2016).
Additionally, Response to Intervention (RTI) approach, recommended for
struggling secondary math students, is a three-tiered approach where the majority of
student needs are met in Tier 1 or classroom instruction (Derderian, 2014; Little &
Dieker, 2016). Struggling students are placed in either Tier 2 or Tier 3, based on
formative assessment data. They will receive small group instruction and interventions on
their skills deficits during an intervention period or block of the day, enabling them to
fully access classroom math instruction (Derderian, 2014; Little & Dieker, 2016). Data
should continue to be collected through frequent formative assessment or progress
monitoring (Derderian, 2014; Lembke, Strickland, & Powell, 2016; Little & Dieker,
2016). Once students make sufficient progress, they can be transitioned out of the tiered
intervention classes (Derderian, 2014; Little & Dieker, 2016). Some recommended
practices for intervention classes include multi-sensory instruction, explicit instruction in
task sequencing, student verbalization of reasoning, a variety of visuals, purposeful
prompting, mnemonics, peer-mediated learning, and frequent student feedback (Allsopp
et al., 2016; Derderian, 2014; Little & Dieker, 2016). In summary, a RTI approach is

32
recommended for providing math intervention and recommended intervention practices
specific to secondary students include skill prioritization, CRA, and strategy instruction.
Interventions
Struggling learners in algebra and mathematics can benefit from specific
interventions (Cortes et al., 2014; RELW, 2015; Sarfo et al., 2014; Vaughn & Fletcher,
2012; Vaughn & Swanson, 2015). There are some defined intervention practices for
secondary students struggling with mathematics, although working with interventions at
the secondary level is often challenging (Patterson & Musselman, 2015). According to
Chodura, Kuhn, and Holling (2015), computer-based interventions with human tutors,
and direct or assisted instruction all emerged as effective practices in their meta-analysis.
Direct instruction is particularly effective as an intervention for arithmetic skills
(Chodura et al., 2015). Montague and Jitendra (2012), advocate for instructional
strategies based on direct instruction such as CRA, Cognitive Strategy Instruction (CSI)
or Solve It! which is based on CSI, and Schema-Based Instruction (SBI). Solve It! is a
cognitive strategy intervention for math problem solving skills (Freeman-Green et al.,
2015; Krawec, Huang, Montague, Kressler, & de Alba, 2012; Montague & Jitendra,
2012). Additionally, What Works Clearinghouse lists five interventions for high school
math students and a total of seven interventions for secondary math students (IES, n.d.).
Only three of these interventions, the University of Chicago School Mathematics Project
6-12 Curriculum, Cognitive Tutor, and Core-Plus Mathematics, have a positive
effectiveness rating; however, these ratings are based on only a small amount of evidence
(Institute of Education Sciences [IES], n.d.). Using a Response to Intervention (RTI)

33
framework for delivering the intervention to secondary students is recommended as a
means of grouping students using data to determine their intervention content and
intensity (Hunt & Little, 2014; Patterson & Musselman, 2015).
Interventions specific to algebra instruction encompass interventions that have
been generalized from both general intervention and mathematics interventions, as well
as interventions specific to algebra. Specific to generalized interventions that are
evidenced-based for algebra include heterogeneous peer-tutoring, CRA, and using
incorrectly worked examples (Agrawal & Morin, 2016; Barbieri & Booth, 2016; Purwadi
et al., 2019; Sarfo et al., 2014; Whorley & Naresh, 2014). In intervention form, CRA has
been specifically designed according to nine highlighted events of instruction to provide
effective systematic intervention for algebra students (Purwadi et al., 2019; Sarfo et al.,
2014). Additionally, a specific intervention evidenced to be effective in one study,
AlgebraByExample, was developed based on the effective strategy of using both correct
and incorrect worked examples (Booth et al., 2015).
Some intervention strategies currently applied to algebra intervention include
supporting reasoning through personalization, visualization strategies to include algebra
tiles and multiplication grids, and functional thinking (Day, 2014; Linsell, Cavanaugh, &
Tahir, 2013; Maenpaa, 2013; Walkington, 2013; Walkington & Bernacki, 2018; Wilkie,
2014). Personalization or matching students’ out of school interests and experiences to
instruction improves problem solving performance as students better understand the
context of the problems they are attempting to solve, allowing for informal reasoning and
more productive strategies (Linsell et al., 2013; Walkington & Bernacki, 2018). Students

34
are also better able to write appropriate algebraic equations from word problems,
allowing for better success at solving the word problems (Linsell et al., 2013;
Walkington, 2013). Visualization of algebraic tasks aids in the conceptual understanding
of algebraic tasks improving students' ability to solve algebra problems (Baroudi, 2015;
Wilkie, 2014). Many algebra tasks can be represented as patterns, aiding students in
working, and understanding the problems (Baroudi, 2015). Both algebra tiles and
multiplication grids can be used to help students visualize algebra patterns (Day, 2014;
Maenpaa, 2013). Additionally, using functional thinking, or thinking that is focused on
the relationships between variables, in instruction or during an intervention builds a
conceptual understanding of how variables work and help students better understand
algebraic notation (Linsell et al., 2013; Wilkie, 2014). To summarize, there are a variety
of evidence-based intervention strategies for secondary algebra students to include both
computer-based and direct instruction practices.
Motivation for Mathematics Success
Instructional practices and intervention for struggling students culminating in
improvement in secondary math achievement are more likely if secondary students are
motivated to understand math and motivated to improve their math achievement.
Motivation is, in part, derived from interest, which develops from the interactions among
students, teachers, and content (Bong, Lee, & Woo, 2015; Matthews, 2018; Prendergast
& Donoghue, 2014; Turner, Kackar-Cam, & Trucano, 2015). Math instruction can be
designed to promote interest, improving student engagement and achievement (Durik et
al., 2015; Kim, Jiang, & Song, 2015b; Prendergast & Donoghue, 2014). Interest in math

35
is considered a stronger motivator than the utility of math; however, the utility of math is
motivating for some students, particularly those of perceived higher ability (Durik et al.,
2015; Kim, et al., 2015b). Additionally, those students who have a perceived higher
ability in math are most likely to have a high interest in math (Durik et al., 2015).
One way to raise interest in math content is to improve situational interest or
interest in the specific task or discussion (Durik et al., 2015; Matthews, 2018; Prendergast
& O’Donoghue, 2014; Prendergast & Treacy, 2018; Turner, et al., 2015). Humor and
novelty are two ways to increase situational interest (Durik et al., 2015). Tasks designed
to with opportunities connections among ideas, meaningful tasks, discovery tasks,
scaffolding, and providing a rationale for relevance also increase situational interest
(Matthews, 2018; Prendergast & Donoghue, 2014; Prendergast & Treacy, 2018; Turner et
al., 2015). One specific example is to use student interests for algebraic modeling,
allowing students to make choices based on their interests when developing their word
problems (Whaley, 2012).
The research-based instructional strategies employed by MHS for the intervention
and enrichment program were grounded in constructivist theory. The research-based
instructional strategies were differentiated based on student needs, determined by data-
based decision-making. The research questions were centered around the efficacy of the
implemented research-based instructional strategies and improved mathematical
achievement of algebra students who participated in the intervention and enrichment
program.
36
Implications
My hope is that the information gleaned from the data analysis provided direction
in developing and improving interventions specific to struggling high school algebra
students. This direction could either take the form of developing a framework for algebra
intervention, policy regarding algebra intervention, or a specific curriculum for a specific
group of students struggling in algebra. For example, a school policy recommendation
regarding intervention with low-income students or female students would be the result
of this study, depending on the findings from the study. Possibly, a specific intervention
curriculum for algebra for ELL students would be developed from this study’s results.
Also, an improvement in the implementation of intervention could possibly be developed
based on this study’s results. There are several possibilities for the project, given the
nature of this study.
Summary
Currently, improving algebra achievement is a priority across the country to
improve postsecondary outcomes for students. Good algebra instruction is rooted in
constructivism and Piagetian theory, allowing the student the opportunity to construct
new knowledge from work on relevant and engaging problems. Success in algebra
depends on such sound foundational skills as reading, number sense, fractions, and
calculation fluency, to name a few items from a sizable list. Effective instructional
practices, based on the CCSS, both exploratory and explicit in nature, differentiated for
the needs of the students, coupled with effective data-based interventions for struggling
learners, are essential for improving algebra outcomes. Improving student interest and
37
motivation in mathematics is equally important in improving student success in algebra.
It is the hope that the current research project added to what is already known and lead to
a greater understanding of algebra intervention and student motivation on improving
algebra outcomes.
38
Section 2: The Methodology
Mixed Method Design and Approach
The purpose of this study was to investigate the impact of an intervention and
enrichment program on student achievement, so a mixed methods approach is appropriate
to evaluate both quantitative and qualitative data (see Creswell, 2012). A quantitative
methodology to examine archival data was used to address the research questions and
purpose. Quantitative methods are necessary to appropriately analyze factual archival
data to determine the existence of significant outcomes (Creswell, 2012; Lodico,
Spaulding, & Voegtle, 2006). Descriptive statistics were used to describe the data.
Propensity matching was used to minimize selection bias and ensure that treatment and
control groups are equated on key covariates. Factorial analysis of variance (ANOVA)
was used to analyze the EOC Algebra data, specifically, the group means (see Creswell,
2012; Harris & Horst, 2016; Lodico et al., 2006; TDOE, n.d.-a).
Qualitative methods were used to address the qualitative research question,
related subquestions, and purpose. Qualitative methods are necessary to appropriately
collect, code, and analyze teacher interview information (Creswell, 2012; Lodico et al.,
2006). This information was collected for triangulation and to better understand the
impact of the intervention on student achievement in the classroom from the perspective
of math teachers (see Creswell, 2012; Lodico et al., 2006). Teacher interviews were
conducted concurrently with the analysis of the quantitative archived data collection. The
qualitative outcomes, once coded and organized based on themes, were compared with
the quantitative results for triangulation purposes and integrated with the quantitative

39
results for a complete understanding of the impact of this intervention and enrichment
program (see Creswell, 2012; Lodico et al., 2006).
Setting and Sample
The population under study included students at MHS taking Algebra 1 and
Algebra II. Given that the purpose was to determine the impact of the intervention and
enrichment intervention on schoolwide algebra achievement and growth, the entire
population, approximately 300 students, were involved in the study of each research
question. Given that the entire population of interest was included in the study, the
sample size was considered sufficient for the study (see Creswell, 2012).
Criteria for participation were enrollment in a high school algebra course at MHS
and participation in either the Algebra I EOC or Algebra II EOC. All high school
freshmen pursuing a high school diploma must enroll in Algebra I or Algebra IA unless
they completed Algebra I as an eighth-grade student, in which case they enroll in Algebra
II. Sophomores must enroll in Algebra II or Algebra IB unless they have already
completed Algebra II. Those sophomores enrolled in Algebra IB must enroll in Algebra
II during either their junior or senior year, with the junior year recommended. MHS is a
diverse school, with more than half the student population being students of color and, at
a minimum, at least 40% economically disadvantaged (TDOE, n.d.-a). Demographic
details for each year are detailed in Tables 2 and 3.
The treatment group under study were those students at MHS who completed
Algebra I and Algebra II. The control group under study were those students in the school
district who completed Algebra I and Algebra II, but were not exposed to the math

40
intervention. The district’s research department provided the de-identified data for all
students in the district who met the criteria for answering the research questions. 1:1
propensity score nearest neighbor matching without replacement was used to form the
final treatment and control groups. The sample of students used in the analyses was based
on the matched groups. The unmatched (N) and matched (n) for the groups for each
research question are in Tables 4 through 6.
Table 2
MHS Student Population Demographics (%)
Year Economically
Disadvantaged EL Learners
Special
Education Female
2013-2014 56.7 7.4 16.6 46.0
2014-2015 68.0 6.3 15.3 45.0
2015-2016 39.0 6.0 17.0 45.0
Note: (MNPS, n.d.; TDOE, n.d.-a)
Table 3
MHS Student Population Ethnicity (%)
Year White African
American Hispanic Asian
Native
American
2013-2014 46.7 37.1 8.8 7.0 .4
2014-2015 46.0 34.9 10.8 7.8 .5
2015-2016 45.0 36.0 12.0 8.0 0
Note: (TDOE, n.d.-a)
A small sample of three math teachers, who taught math at MHS during the 2014-
2015 school year was recruited for the purpose of conducting teacher interviews. The

41
sampling method used was convenience sampling, as the study was limited to teacher
availability and willingness to participate (see Creswell, 2012; Lodico et al., 2006). The
type of math class and intervention group instructed that year was noted, but was not an
inclusionary criterion for participation. Interview participants’ personal information, such
as name and participation status, was kept confidential by coding the participants. All
participants were provided with informed consent forms and consented to participate with
their signatures. Interview participants were informed of their right to withdraw from the
study at any time, to minimize any harm that participation might cause. None of the
participants withdrew.
Data Collection Strategies
Quantitative Sequence
Student EOC scores, for both Algebra I and Algebra II, were the data source for
this study. The Tennessee EOC exams were developed by a team of professional writers
experienced in algebra content, and the items were field tested, reviewed, and edited
(TDOE, n.d.-a). Test directions were developed in a similar way (TDOE, n.d.-a). The test
developer and publisher for the 2013-2014 and 2014-2015 Algebra EOC’s were Pearson
Education (TDOE, n.d.-a). The Tennessee EOC exams, for the year 2015-2016, were
revised and testing procedures updated to align with CCSS (TDOE, n.d.-a). The test
developer and publisher for the 2015-2016 school year was Measure, Inc. Test items
reflected state curriculum standards for both Algebra I and Algebra II (TDOE, n.d.-a).
Accommodations were allowed for students with disabilities and EL students (TDOE,
n.d.-a). Student EOC achievement scores were found on the state TVAAS website and

42
the district’s database. The de-identified raw data used in this study are available by
request from the researcher.
Qualitative Sequence
Teacher interview data were collected using an interview protocol, found in
Appendix B, adapted from Creswell (2012). The questions were designed to collect
teachers’ impressions of the impact of the intervention and enrichment program, their
students’ preparedness for high school math, and their beliefs about effective math
instruction. Participants were recruited through an email invitation from the MHS staff
list of the 2014-2015 school year. Interview sessions lasted approximately 30 minutes
and were tape recorded for improved transcription and validity purposes (see Creswell,
2012; Lodico et al., 2006). Member checking occurred throughout the interview sessions
to ensure the accuracy and completeness of the responses, improving the validity of
outcomes (Creswell, 2012; Lodico et al., 2006). The data and emerging themes from the
interviews were organized using a cataloging system for organization and enhanced
interpretation (Creswell, 2012; Lodico et al., 2006).
During the study, I worked with teachers, administrators, and other staff at MHS,
but I am not employed by the school. I am employed by Student Support Services at the
Board of Education as a school psychologist. I do not report to anyone at MHS, nor am I
evaluated by anyone at MHS. I also do not evaluate anyone at MHS or have any
influence on their evaluations, retention, or tenure. I had recognition and awareness of my
responsibility to be especially careful in my data collection and analysis to provide the
school with objective results.

43
Data Analysis
Archival data, Algebra I and Algebra II EOC achievement scores, and teacher
interviews, were used to answer the research questions. Access to the data set was
granted upon district approval for the project. Once my proposal was approved by
Walden University, the process for district approval began. The requirements for district
approval included a proposal, a data use agreement (Appendix C), interview protocol
(Appendix B), consent form, recruitment email, submission, and IRB approval.
To better determine the impact of the intervention and enrichment program,
propensity matching using districtwide data was performed to form a comparison group.
1:1 propensity score nearest neighbor matches without replacement were used to match
students using the following key variables: ethnicity, gender, course enrollment,
projected EOC score, special education status, eighth grade TCAP math score, and
socioeconomic status (see Harris & Horst, 2016). Student level matching helped establish
baseline equivalence by statistically controlling for key variables such as grade, gender,
ethnicity, free and reduced lunch, and student achievement. The large pool of comparison
students within the district increased the likelihood of constructing a valid, well matched
comparison group (see Harris & Horst, 2016).
For each quantitative research question, the data was analyzed in total but also
disaggregated by subgroups. The subgroups under study were gender, social economic
status, special education status, and ethnicity. Algebra I and Algebra II EOC achievement
scores are continuous data (see Creswell, 2012; TDOE, n.d.-a ; Triola, 2012). Descriptive
statistics to include mean scores were computed for each subgroup as well as the total

44
group for analysis (see Creswell, 2012; Lodico et al., 2006). I used ANOVA for each
subgroup as well as the total group to test each quantitative research question (see
Creswell, 2012; Lodico et al., 2006; Triola, 2012).
The teacher interviews were reviewed, transcribed, and then coded into
categories, constructing detailed descriptions of the teacher's perspectives and any events
referenced (see Creswell, 2012; Lodico et al., 2006). I further analyzed these descriptions
with the intent of identifying themes in the data. These themes were compared with the
quantitative results for the purpose of triangulation to see if the results are similar,
strengthening the overall validity of the study, as well as used to understand better the
impact of the intervention and enrichment program on classroom achievement. Both the
quantitative results and qualitative outcomes were integrated for a complete
understanding of any change in student achievement as a result of the intervention and
enrichment program.
Assumptions and Limitations
There are various assumptions that should be described. First, I assumed that
students were appropriately placed in intervention classes based on state summative
testing, course benchmark assessment, and special education data. I also assumed that
teachers provided appropriate, targeted instruction during those intervention classes,
based on course performance data and individual instructional needs. It was assumed the
demographics of students in each course match those of the school. Lastly, I made the
assumption that the course EOC exams were administered with fidelity, with student

45
accommodations given as appropriate. Should any of these assumptions be false, the
construct validity of the study results would be questionable (see Creswell, 2012).
Like any research study, there were a few limitations. One limitation of this study
was that the study was only conducted in one school and not various schools, limiting the
generalizability of the results to other high schools or districts (see Creswell, 2012;
Lodico et al., 2006). Another limitation was that the school district is an urban school
district, also limiting the generalizability of the results to other high schools or districts
(see Creswell, 2012; Lodico et al., 2006). A third limitation was researcher bias arising
from personal interests unknowingly influencing the results, particularly the qualitative
results (see Creswell, 2012). Finally, in investigating QNRQ3, the scores were based on a
different standardized exam due to a switch by the district. Although the new exam was
aligned psychometrically with content and statistical specifications with the previous
exam students would have taken, this is still a limitation.
A few limitations emerged during data analysis. The small sample size available
for analysis for QNRQ3 was a limitation, limiting the inferences drawn from the results
(see Lodico et al., 2006). Additionally, neither QNRQ2 nor QNRQ3 were analyzed for
the subgroups of ethnicity, special education status, and socioeconomic status due to the
violation of homogeneity of variance. The violation of this assumption prevented the
analysis of these variables for both questions pertaining to Algebra II EOC performance
(see Statistics Solutions, n.d.; Triola, 2012).

46
Data Analysis Results
A convergent mixed method design was appropriately employed for analyzing
and presenting the data was appropriate because the interview data were collected
concurrently with the analysis of the archived data (see Creswell, 2012). The interview
results were used for triangulation, strengthening the external validity of the study results,
and were integrated with the quantitative analysis results for a complete understanding of
any change in student achievement (see Creswell, 2012; Lodico et al., 2006). Quantitative
findings were presented first, with qualitative findings next, and then the integration of
the findings. Before the presentation of the results, the quantitative data collection
analyses based on propensity methods were discussed.
For the quantitative analyses, archival data were obtained without identifying
information, such as student names, from the participating school district in March 2019.
The data included the student information from the treatment high school and student
information from the rest of the district, for the purpose of matching the data to create a
control group. Propensity score analysis, generally, was used to parallel a randomized
study within a nonrandomized study by creating a comparison group (see Nicholas &
Gulliford, 2008; Pan & Bai, 2015). This technique reduces bias in nonrandomized studies
by matching the distributions of the covariates or observed characteristics between the
two groups (Nicholas & Gulliford, 2008; Pan & Bai, 2015). Propensity score matching is
the process of matching each participant in the treatment group with another participant
not receiving the treatment with the same or similar propensity score (Nicholas &
Gulliford, 2008; Pan & Bai, 2015). Propensity score nearest neighbor one-to-one

47
matching without replacement was used to match students using the following covariates;
gender, ethnicity, special education status, socioeconomic status, and projected end-of-
year algebra score based on the standardized state assessment exam. The propensity
matching procedures were carried out using the R program MatchIt (see Ho, Imai, King,
& Stuart, 2007).
The selection of covariates is not a trivial process, and only those covariates
known to influence the outcome should be included (Harris & Horst, 2016; Pan & Bai,
2015). Nearest neighbor one-to-one matching without replacement using MathIt in R,
matched each participant with another participant in the control group at the closest
distance (see Harris & Horst, 2016; Pan & Bai, 2015). Without replacement refers to
removing the comparison group participant from the pool of potential matches once they
have been matched with a treatment group participant (Harris & Horst, 2016; Pan & Bai,
2015). Nearest neighbor matching is considered the most commonly used method for
matching in the behavioral sciences, and while there are quality control concerns, it is
sufficient for creating balanced matched groups (Harris & Horst, 2016; Pan & Bai, 2015).
Several assumptions needed to be met when using propensity score analysis. The
first was that the treatment assignment and response are conditionally independent (see
Pan & Bai, 2015). The second assumed common support between the treatment and
comparison groups (see Harris & Horst, 2016; Pan & Bai, 2015). Common support,
according to Harris and Horst (2016), refers to "the extent to which intervention group
participants and nonparticipants overlap in their distributions of propensity scores” (p. 7).
Another assumption, for causal inferencing using propensity scores, stated that “the

48
observation on one unit should be unaffected by the particular assignments of treatment
to the other units” (Cox, 1958, p. 19; Pan & Bai, 2015). For this study, these assumptions
were met, so that the treatment assignment was independent of the response, there was
mutual support between the groups, and that observations on the comparison group units
were unaffected by the observations on the treatment group units (see Creswell, 2012;
Lodico et al., 2006; Pan & Bai, 2015).
The quality evaluation of the propensity matching is critically important for
making inferences from the results. It is the process in which the quality of the covariate
balance is evaluated, either statistically or graphically (Pan & Bai, 2015). The
standardized difference based on a statistical effect size was used for this study. The
standardized difference as a statistical measure is commonly used for the purpose of
propensity score matching evaluation, because it does not depend on sample size (Pan &
Bai, 2015). The standardized difference for each covariate was calculated before (i.e.
unmatched groups) and calculated after matching (i.e. matched groups). The rule of
thumb often used to assess the quality of the matching, hence, covariate balance are, (a) a
value less than .10 indicates the covariate balance is more than adequate; (b) a value
between .10 to .20 indicates moderately acceptable balance, not too troublesome; and (c)
a value greater than .20 would indicate a serious imbalance. As can be seen in Tables 4-6,
the propensity score matching produced balanced covariate results for all three research
questions. For all of the values after matching, the standardized mean difference was
below .20, and mostly well below the serious threshold of .20.

49
Regarding the qualitative data collection and analysis, three teachers were
interviewed in May 2019 using the developed interview protocol, which is found in
Appendix B. Consent forms were reviewed and signed, and the interviews were
completed within 20 minutes. The interviews were recorded and transcribed for accuracy.
Two of the teachers, Teacher 1 and Teacher 2, were White males who taught standard
and honors level mathematics courses at MHS, and Teacher 3 was an African American
female who taught special education mathematics courses. All three math teachers taught
a math intervention during the 2014-2015 school year, and one teacher was intricately
involved in developing enrichment resources for the teachers instructing the math
enrichment that year. Four of the interview questions inquired about their personal beliefs
as they related to math instruction, their motivational strategies, and their students'
preparedness for high school math. Four questions were specific to the
intervention/enrichment program. The interview questions were derived based on
QLRQ1 and approved by the IRB, number 11-27-17-0384949. Interview responses were
analyzed for common themes.

50
Table 4
Standardized Differences (Covariates) for Research Question 1 (QNRQ1)
Unmatched Matched
TRT CTRL STD TRT CTRL STD
N 282 5770 211 211 Gender Male (%) 55 50 0.10 51 51 0.00
Female (%) 45 50 0.10 49 49 0.00
Ethnicity White (%) 43 27 0.34 44 46 0.04
Black (%) 37 47 0.20 36 36 0.00
Hispanic (%) 12 21 0.24 11 11 0.00
Asian (%) 8 5 0.12 9 7 0.07
Special Educ.
Status No (%) 85 90 0.15 95 96 0.05
Yes (%) 15 10 0.15 5 4 0.05
Socioeconomic
Status No (%) 47 46 0.02 50 50 0.00
Yes (%) 53 54 0.02 50 50 0.00
Algebra
Projected
(Mean (SD)) 44 (25) 47 (28) 0.11 48 (24) 48 (24) 0.00
Note. TRT = treatment; CTRL = control; STD = standardized mean difference

51
Table 5
Standardized Differences (Covariates) for Research Question 2 (QNRQ2)
Unmatched Matched
TRT CTRL STD TRT CTRL STD
N 391 4710 333 333 Gender Male (%) 51 49 0.04 51 49 0.04
Female (%) 49 51 0.04 49 51 0.04
Ethnicity White (%) 49 31 0.37 48 50 0.04
Black (%) 32 47 0.31 33 34 0.02
Hispanic (%) 12 17 0.14 12 12 0.00
Asian (%) 7 5 0.08 7 4 0.13
Special Educ.
Status No (%) 91 93 0.07 90 89 0.03
Yes (%) 9 7 0.07 10 11 0.03
Socioeconomic
Status No (%) 63 54 0.18 62 61 0.02
Yes (%) 37 46 0.18 38 39 0.02
Algebra
Projected
(Mean (SD)) 39 (25) 39 (27) 0.00 39 (25) 37 (25) 0.08
Note. TRT = treatment; CTRL = control; STD = standardized mean difference

52
Table 6
Standardized Differences (Covariates) for Research Question 3 (QNRQ3)
Unmatched Matched
TRT CNTRL STD TRT CNTRL STD
N 29 322 25 25 Gender Male (%) 52 44 0.16 52 44 0.16
Female (%) 48 56 0.16 48 56 0.16
Ethnicity White (%) 45 27 0.38 48 56 0.16
Black (%) 24 52 0.60 28 24 0.09
Hispanic (%) 14 18 0.11 12 8 0.13
Asian (%) 17 3 0.48 12 12 0.00
Special Educ.
Status No (%) 97 89 0.32 96 96 0.00
Yes (%) 3 11 0.32 4 4 0.00
Socioeconomic
Status No (%) 52 48 0.08 52 56 0.08
Yes (%) 48 52 0.08 48 44 0.08
Algebra
Projected
(Mean (SD)) 32 (21) 36 (24) 0.13 33 (21) 37 (26) 0.17
Note. TRT = treatment; CTRL = control; STD = standardized mean difference
Quantitative Findings
Outcome analysis after propensity matching can be completed on matched data as
if it were the original data (see Nicholas & Gulliford, 2008; Pan & Bai, 2015). The
outcome analyses for all research questions were conducted using a factorial analysis of

53
variance (ANOVA). Given the rich dataset provided by the school district, and missing
data at random assumed, there were many subparts to each research question that could
be analyzed. The outcome variable (dependent variable) for all of the research questions,
was a standardized measure based on EOC exam scores.
Research Question 1.1 (QNRQ1.1). There were three subparts to this research
question based on the covariates of gender, ethnicity, special education status, and
socioeconomic status. Given there were more than one statistical analysis conducted
using the same set of data, the Bonferroni method was used to determine the alpha level
to avoid a type I error, falsely flagging a significant result (Armstrong, 2014). Because
there were three analyses of variances conducted for QNRQ1, an alpha level of .02 was
used to determine significance for each analysis of variance. The first research question
subpart 1 (QNRQ1.1), a 2 x 2 x 4 three-way analysis of variance was conducted to
investigate the treatment effect based on group (treatment, control), gender (male,
female), and ethnicity (White, Black, Hispanic, Asian). The outcome variable was the
actual Algebra I EOC score from the 2014-15 testing year. Tables 7-9 are associated with
QNRQ1.1. Levene’s test of homogeneity of variance was not significant, F(15,403) =
1.16, p = .301, indicating that the assumption of equal variances was tenable. It is
appropriate to proceed with the results from the analysis of variance. As can be seen in
Table 8, none of the interactions were significant; therefore, simple effects testing was
not required, and the discussion could focus on the main effects. The main effect of group
was significant, F(1,403) = 12.91, p = .00, the main effect of ethnicity was significant,

54
F(3,403) = 8.50, p = .00, and the main effect of gender was not significant, F(1,403) =
.04, p = .835.
Given that the groups only had two levels, post-hoc testing was not required, the
treatment group performed significantly lower than the control group on the actual
Algebra I EOC state assessment (M = 40.99 and M = 52.26 respectively), see Table 7.
The main effect of ethnicity had four levels; therefore, post-hoc testing based on Tukey
was conducted. In Table 7, the marginal means are provided, and Table 9, the post-hoc
testing results can be found. As seen in Table 9, black students scored significantly lower
than all other ethnicity groups. There were no other group differences based on ethnicity.
Table 7
Estimated Marginal Means for the Actual End of Course Algebra I State Assessment for
QNRQ1.1
N Mean
Std.
Error
Group *Treatment 209 40.99 2.17
**Control 210 52.26 2.26
Gender
Male 213 46.95 2.31
Female 206 46.30 2.12
Ethnicity
White 189 45.04 1.79
Black 151 36.07 1.98
Hispanic 47 49.44 3.64
Asian 32 55.95 4.36
* One American Indian and One Pacific Islander observation removed (n < 5)
** One Pacific Islander observation remove (n <5)
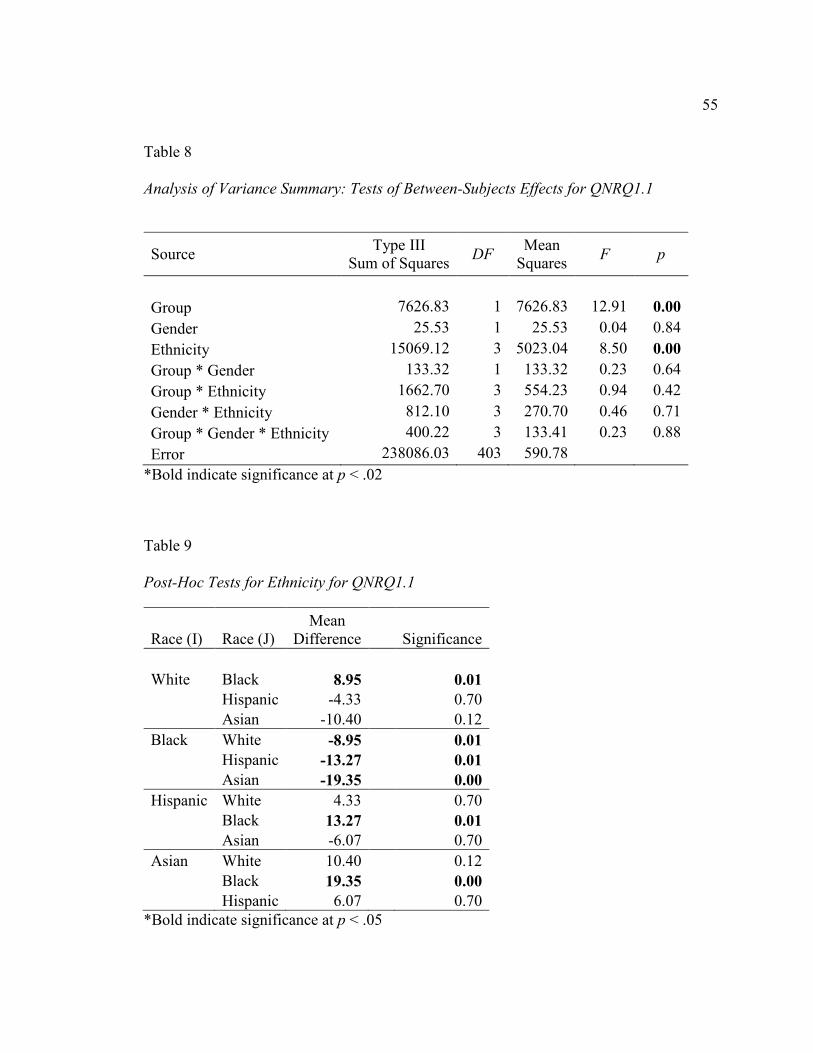
55
Table 8
Analysis of Variance Summary: Tests of Between-Subjects Effects for QNRQ1.1
Source Type III
Sum of Squares DF
Mean
Squares F p
Group 7626.83 1 7626.83 12.91 0.00
Gender 25.53 1 25.53 0.04 0.84
Ethnicity 15069.12 3 5023.04 8.50 0.00
Group * Gender 133.32 1 133.32 0.23 0.64
Group * Ethnicity 1662.70 3 554.23 0.94 0.42
Gender * Ethnicity 812.10 3 270.70 0.46 0.71
Group * Gender * Ethnicity 400.22 3 133.41 0.23 0.88
Error 238086.03 403 590.78
*Bold indicate significance at p < .02
Table 9
Post-Hoc Tests for Ethnicity for QNRQ1.1
Race (I) Race (J)
Mean
Difference Significance
White Black 8.95 0.01
Hispanic -4.33 0.70
Asian -10.40 0.12
Black White -8.95 0.01
Hispanic -13.27 0.01
Asian -19.35 0.00
Hispanic White 4.33 0.70
Black 13.27 0.01
Asian -6.07 0.70
Asian White 10.40 0.12
Black 19.35 0.00
Hispanic 6.07 0.70
*Bold indicate significance at p < .05

56
Research Question 1.2 (QNRQ1.2). The first research question subpart 2
(QNRQ1.2), a 2 x 2 x 2 three-way analysis of variance was conducted to investigate the
treatment effect based on group (treatment, control), gender (male, female), and special
education status (no, yes). The outcome variable was the actual Algebra I EOC exam
score from the 2014-15 testing year. Tables 10 and 11 are associated with QNRQ1.2.
Levene’s test of homogeneity of variance was not significant, F(7,411) = 1.28, p = .258,
indicating that the assumption of equal variances was tenable. It was appropriate to
proceed with the results from the analysis of variance. As can be seen in Table 11, none
of the interactions were significant; therefore, simple effects testing was not required, and
the discussion could focus on the main effects. The main effect of special education
status was significant, F(1,411) = 9.10, p = .00. The main effects of group and gender
were not significant. Given that special education status only had two levels, post-hoc
testing was not required, the students not considered with any special education status
performed significantly higher than the students who were considered eligible for a
special education status on the actual Algebra I EOC state assessment (M = 43.90 and M
= 23.82 respectively), see Table 10.
Research Question 1.3 (QNRQ1.3). The first research question subpart 3
(QNRQ1.3), a 2 x 2 x 2 three-way analysis of variance was conducted to investigate the
treatment effect based on group (treatment, control), gender (male, female), and
socioeconomic status (no, yes). The outcome variable was the actual Algebra I EOC
exam score from the 2014-15 testing year. Tables 12 and 13 are associated with
QNRQ1.3. Levene’s test of homogeneity of variance was not significant, F(7,411) =
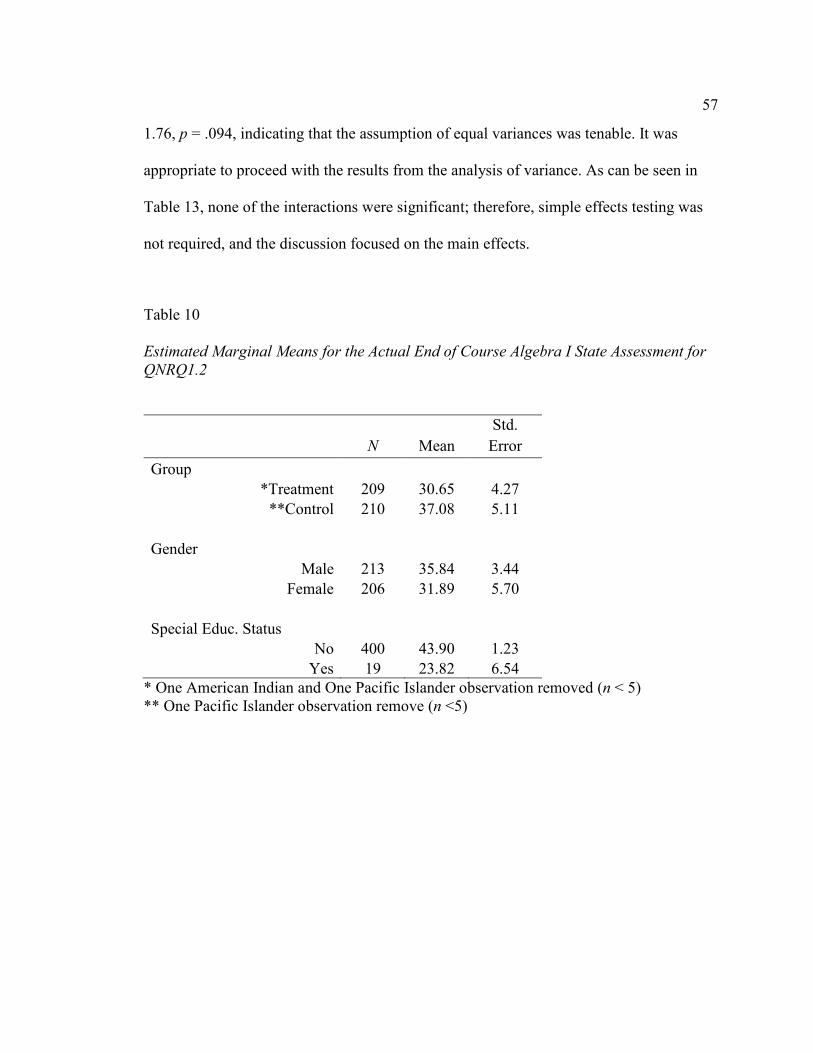
57
1.76, p = .094, indicating that the assumption of equal variances was tenable. It was
appropriate to proceed with the results from the analysis of variance. As can be seen in
Table 13, none of the interactions were significant; therefore, simple effects testing was
not required, and the discussion focused on the main effects.
Table 10
Estimated Marginal Means for the Actual End of Course Algebra I State Assessment for
QNRQ1.2
N Mean
Std.
Error
Group *Treatment 209 30.65 4.27
**Control 210 37.08 5.11
Gender Male 213 35.84 3.44
Female 206 31.89 5.70
Special Educ. Status
No 400 43.90 1.23
Yes 19 23.82 6.54
* One American Indian and One Pacific Islander observation removed (n < 5)
** One Pacific Islander observation remove (n <5)

58
Table 11
Analysis of Variance Summary: Tests of Between-Subjects Effects for QNRQ1.2
Source Type III
Sum of Squares DF
Mean
Squares F p
Group 568.09 1 568.09 0.93 0.34
Gender 213.89 1 213.89 0.35 0.55
Special Educ. Status 5537.26 1 5537.26 9.10 0.00
Group * Gender 0.33 1 0.33 0.00 0.98
Group * Special Educ. Status 624.64 1 624.64 1.03 0.31
Gender * Special Educ. Status 325.21 1 325.21 0.53 0.47
Group * Gender * Special Educ. Status 5.54 1 5.54 0.01 0.92
Error 250139.97 411 608.61
*Bold indicate significance at p < .02
The main effect of group was significant, F(1,411) = 27.71, p = .00. The main
effect of socioeconomic status was not significant, F(1,411) = 4.79, p = .03. The main
effect of gender was not significant. Given that group and special education status only
had two levels, post-hoc testing was not required. The students not considered with any
financial aid need based status performed higher than the students who were considered
eligible for financial assistance status on the actual Algebra I EOC state assessment (M =
45.82 and M = 40.52 respectively), see Table 12. The results (p = .03) could not be
considered significant given the conservative p-value used for significance of .02. In
addition, as related to treatment versus control group after controlling for socioeconomic
status, students in the control group outperformed students in the treatment group on the
actual Algebra I EOC state assessment (M = 49.55 and M = 36.80 respectively), see
Table 12.

59
Table 12
Estimated Marginal Means for the Actual End of Course Algebra I State Assessment for
QNRQ1.3
N Mean
Std.
Error
Group *Treatment 209 36.80 1.72
**Control 210 49.55 1.71
Gender
Male 213 42.50 1.70
Female 206 43.85 1.73
Socioeconomic
Status No 210 45.82 1.71
Yes 209 40.52 1.71
* One American Indian and One Pacific Islander observation removed (n < 5)
** One Pacific Islander observation remove (n <5)
Table 13
Analysis of Variance Summary: Tests of Between-Subjects Effects QNRQ1.3
Source Type III
Sum of Squares DF
Mean
Squares F p
Group 17011.32 1 17011.32 27.71 0.00
Gender 192.80 1 192.80 0.31 0.58
Socioeconomic Status 2937.44 1 2937.44 4.79 0.03
Group * Gender 25.90 1 25.90 0.04 0.84
Group * Socioeconomic Status 336.61 1 336.61 0.55 0.46
Gender * Socioeconomic Status 109.74 1 109.74 0.18 0.67
Group * Gender * Socioeconomic Status 740.19 1 740.19 1.21 0.27
Error 252275.89 411 613.81
*Bold indicate significance at p < .02

60
Research Question 2 (QNRQ2). Due to the violation of homogeneity of variance
when considering ethnicity, special education status and socioeconomic status, these
variables were not investigated for this research question. In answering QNRQ2, a 2 x 2
two-way analysis of variance was conducted to investigate the treatment effect based on
group (treatment, control), and gender (male, female). The outcome variable was the
actual Algebra II EOC exam score from the 2014-15 testing year. Tables 14 and 15 are
associated with QNRQ2. Levene’s test of homogeneity of variance was not significant,
F(3,661) = 2.41, p = .066, indicating that the assumption of equal variances was tenable.
It was appropriate, therefore, to proceed with the results from the analysis of variance. As
can be seen in Table 15 the two-way interaction was not significant; therefore, simple
effects testing was not required, and the discussion could focus on the main effects. The
main effects of group and gender were not significant, see Table 15, and the estimated
marginal means are provided in Table 14.
Table 14
Estimated Marginal Means for the Actual End of Course Algebra II State Assessment for
QNRQ2
N Mean
Std.
Error
Group *Treatment 332 40.80 1.46
Control 333 38.89 1.45
Gender
Male 330 39.39 1.46
Female 335 40.29 1.45
* One Pacific Islander observation removed (n < 5)

61
Table 15
Analysis of Variance Summary: Tests of Between-Subjects Effects for QNRQ2
Source
Type III
Sum of
Squares
DF Mean
Squares F p
Group 606.92 1 606.92 0.86 0.35
Gender 133.18 1 133.18 0.19 0.66
Group * Gender 131.35 1 131.35 0.19 0.67
Error 464897.28 661 703.32
*Bold indicate significance at p < .05
Research Question 3 (QNRQ3). Due to the violation of homogeneity of variance
when considering ethnicity, special education status and socioeconomic status, these
variables were not investigated for this research question. Furthermore, the small sample
size available for this research question did not lend itself to sub-group analyses beyond
gender, see Table 6. In answering research question three (QNRQ3), a 2 x 2 two-way
analysis of variance was conducted to investigate the treatment effect based on group
(treatment, control), and gender (male, female). The outcome variable was the actual
Algebra II EOC exam score from the 2015-16 testing year. Tables 16 and 17 are
associated with QNRQ3. Levene’s test of homogeneity of variance was not significant,
F(3,46) = 1.15, p = .339, indicating that the assumption of equal variances was tenable. It
was appropriate, therefore, to proceed with the results from the analysis of variance. As
can be seen in Table 17, the two-way interaction was not significant; therefore, simple
effects testing not required, and the discussion could focus on the main effects. The main
effects of group and gender were not significant, see Table 17, and the estimated
marginal means are provided in Table 16.

62
Table 16
Estimated Marginal Means for the Actual End-of-Year Algebra II State Assessment for
QNRQ3
N Mean
Std.
Error
Group Treatment 25 32.25 5.00
Control 25 35.27 5.03
Gender
Male 24 33.87 5.11
Female 26 33.65 4.91
Table 17
Analysis of Variance Summary: Tests of Between-Subjects Effects for QNRQ3
Source Type III
Sum of Squares DF
Mean
Squares F p
Group 112.57 1 112.57 0.18 0.67
Gender 0.61 1 0.61 0.00 0.98
Group * Gender 324.78 1 324.78 0.52 0.47
Error 28648.33 46 622.79
*Bold indicate significance at p < .05
Qualitative Findings
The qualitative results were insightful and at times diverse regarding the strengths
and weaknesses of the intervention and enrichment program. The teachers (N = 3) were
all actively engaged in the interview and appeared interested and at times, passionate in
their responses. They all appeared to hold to specific personal beliefs about their craft and
defended their beliefs at length. Teachers’ personal beliefs are summarized in Table 18.

63
Teacher 2 and Teacher 3 strongly believed that research-based instruction was
necessary for effective math instruction. Teacher 1, who differed, described himself as a
“discrete math kind of person” and subscribed more to teaching the process. Teacher 3
believed that relevance was important and stated that it was necessary to get student buy-
in to do the math. Teacher 1 and Teacher 2 did not believe relevance was necessary and
had similar reasons and examples related to learning math. Teacher 1 said, “I think of
mathematics as more of like working your muscles, your intellectual muscles.” Teacher 2
believed that math is a tool that students need to learn to use and that math’s relevance is
later discovered in further course study and in science applications. He went on to say,
The conversation we should have with kids is more about, you know, to come to
school is an opportunity machine. And if I’m going to give you all of the
opportunities that are available, I need to teach you a broad range of topics, And I
can’t just say this is relevant to you right now.
Motivational strategies utilized by the teachers were varied. Teacher 3 said she
focused on building students’ confidence about their skills, by showing students that
math goes in steps, that new material really was just adding to what they already knew,
and that if students followed the process, they could solve any problem. Teacher 1 was
similar, in that he showed students the process and stuck to the practical material versus
the conceptual material. Teacher 2 simply stated, “Giving them tasks with high cognitive
demand.” He went on to explain these were usually open-ended tasks students worked on
in groups and felt it was essential to build these activities into your instruction for at least
ten minutes at day.

64
Teacher reports of student preparedness for high school mathematics were varied.
Teacher 1 said 80% of his students were prepared. Teacher 2 said 60% were prepared
mathematically, but only 20% were prepared for the rigor of a high school math
classroom. Teacher 3, who worked only with special education students, reported that
only 10% of her students were prepared for high school mathematics. The missing
content skills, for students not prepared, reported by these teachers include basic math
facts, regrouping for subtraction, division, fractions, and the ability to generalize.
Table 18
Personal Beliefs of Interviewed Teachers
Question Yes No
Is it possible to have an effective math classroom without the
implementation of research-based methods? 2 1
Is relevance important in high school math instruction? 1 2
The interview questions specifically related to the teacher perceptions about the
intervention and enrichment program efficacy, including classroom changes attributed to
the intervention/enrichment program, implementation fidelity, and impact on student
achievement. Effective elements, as reported by the teachers, included the following: (a)
math problem of the week; (b) the computer-based program, Study Island; (c) classroom
instruction for lower to mid-level students that included scaffolding to course content; (d)
good resources for enrichment; and (e) math instruction by a different instructor who may
present material in a different way. Ineffective elements centered mostly on the
enrichment aspect of the program, with the exception of the mention that some
intervention teachers were simply working from materials designed for younger students,

65
which did not match the maturity level of the students actually taught. Concerns
regarding the enrichment include: (a) enrichment students were not pushed enough as
they had already met the standard; (b) non-math content teachers led the enrichment
sections; and (c) while the lesson plans for the enrichment were well developed, the
teachers leading these sections did use plans created by someone else.
When asked about changes in his classroom attributable to the
intervention/enrichment program, Teacher 1 said he really was not sure if there were any
and that it was difficult to tell. He did say that when reviewing for EOC exams, students
seemed more familiar with content as they remembered many of the problems from the
problem of the week, but outside of that, he was unsure. Both Teacher 2 and Teacher 3
expressed that student engagement in the classroom improved, particularly among the
lower and mid-level students. Teacher 2 believed that due to scaffolding in the
interventions, which filled in content gaps, students were more willing to engage the
mathematics. Teacher 3 said that students were simply more willing to ask questions and
that they were better understanding that there was more than one way to do the math. She
attributed this change to students having more time to do some “figuring out” and self-
correction during the intervention classes, as well as having the opportunity to have a
different teacher than their regular course teacher, providing different possible strategies.
Teachers reported concerns with implementation fidelity. Teacher 1, stated, “I
would like to think so, but, you know, I wasn’t in everyone’s classroom.” Teacher 2 and
Teacher 3 were more specific and consistent across six concerns, which included: (a) not
all enrichment teachers accessed support from math teachers or provided resources; (b)

66
not enough data from the enrichment sections was tracked; (c) it was difficult to keep
teachers accountable; (d) there was no way to keep students accountable other than
coursework grades and benchmark performance; (e) not all teachers bought into the
intervention/enrichment program; and (f) while support, materials, and direction were
provided, there was no formal PD session to really introduce and explain the program.
Responses from teachers were varied when asked about whether the intervention
and enrichment program was effective in improving math achievement. Teacher 3
believed the program was effective in improving math achievement. Teacher 2 believed
the program was effective for the lower students, but not overall. His reasons were based
on the lack of implementation fidelity and that enrichment piece did not really work well.
Teacher 1 was unsure and believed it was difficult to gauge.
Upon analysis, a few distinct themes emerged, however, the main theme was the
trouble with implementation fidelity of the intervention and enrichment program. This
was discussed throughout the interviews, particularly by Teacher 2 and Teacher 3, in
relation to the enrichment aspect of the program, as well as teacher accountability and
teacher buy-in. Another major theme was the effectiveness for lower-performing math
students, which surfaced across questions. Specific issues mentioned were improved
course engagement for these students and effective elements such as Study Island,
teacher scaffolding of interventions to coursework to fill in gaps, and a greater
understanding of multiple methods for problem solving. Additionally, the enrichment
sessions were not generally considered effective according to the teachers’ reports for
various reasons, to include that many non-math teachers taught these sections from

67
prepared resources, there was a lack of data tracking from these sections, and that many
activities may have been fun or interesting, but possibly were not impactful on actual
math achievement.
Summary of Quantitative and Qualitative Results
A few main effects were found for QNRQ1 (EOC Algebra I scores comparing pre
intervention [2013/2014] to post intervention [2014/2015] school years). First, the
treatment group performed significantly lower than the control group. When analyzing
subgroups, black students performed significantly lower than the other ethnicities, and
both low socioeconomic status students and students receiving special education services
performed significantly lower than those of typical or high socioeconomic status and
students not receiving special education services, respectively. The results (p = .03) for
socioeconomic status could not be considered significant given the conservative p-value
used for significance testing of .02 suggested by the Bonferroni method for analyzing
these data using a three-way ANOVA. These results were not indicative of a positive
effect for the intervention and enrichment program on Algebra I students. No main
effects were found for QNRQ2 (EOC Algebra II scores comparing pre intervention to
post intervention for the first year of implementation [2013/2014 to 2014/2015]) or
QNRQ3 (EOC Algebra II scores comparing pre intervention to post intervention for the
second year of implementation [2013/2014 to 2014/2015]). However, it was noteworthy
that MHS was previously performing below the district on Algebra II EOC outcomes,
and these results suggest that MHS students performed consistently with their peers, so it
is possible that gains for Algebra II students were made during the 2014-2015 school

68
year. Additionally, based on previous student outcomes, while no main effect was found
for the treatment group in QNRQ3, residual effects of the intervention and enrichment
program cannot be ruled out.
Qualitatively, a few themes emerged. The most notable was the lack of
implementation fidelity of the intervention and enrichment program, along with the
effectiveness for lower-performing students and the lack of effectiveness for the
enrichment sessions, which targeted higher-performing students, as related by the three
math intervention teachers who were interviewed. Based on the qualitative findings
related to a lack of implementation fidelity, a policy paper focusing on implementation
fidelity was deemed the most appropriate project genre.

69
Section 3: The Project
Introduction
In Section 1, I reviewed national and state data that demonstrated a lack of
proficiency in algebra skills among high school students, as well as the professional
literature on best practices in high school math instruction and intervention. In Section 2,
I discussed the methodology for the study, the analysis methods, and the quantitative and
qualitative results. In this section, I discuss my project, to include a detailed description,
goals for the project, the rationale for genre selection, a review of professional literature,
and a detailed discussion of the implementation of my project.
Description and Goals
The policy recommendation for establishing a process for fidelity monitoring of
academic interventions was directly derived from MHS’s attempt at improving math
achievement through a school-wide intervention and enrichment program. Despite
MHS’s efforts, the results indicated that no gains in algebra achievement were realized on
TN EOC assessments. Results of teacher interviews indicated that implementation
fidelity was poor and was a major factor in the lack of improvement. I concluded, based
on the findings that for MHS to improve student achievement, the school should
implement a systematic process for assessing implementation fidelity for all implemented
academic interventions (see Harn, Damico, & Stoolmiller, 2017).
There are several steps for developing and implementing a systematic process for
assessing implementation fidelity, to include establishing a leadership team, securing
teacher buy-in, purchasing resources, providing professional development as needed,

70
determining fidelity assessment tools and assessment schedule, conducting fidelity
assessment, and providing teacher feedback and coaching (TDOE, 2016). Currently,
MHS does not have a prescribed leadership team to begin the development of a fidelity
assessment process. Therefore, the school administration should establish a leadership
team to facilitate the development and implementation of a systematic process for
assessing implementation fidelity based on these research findings results (TDOE, 2016).
The anticipated outcome of developing and implementing a systematic process for
assessing implementation fidelity would be improved intervention implementation,
resulting in improved academic outcomes for students (McKenna & Parenti, 2017;
Missett & Foster, 2015). By developing and implementing such as process, MHS will
establish long-term implementation capability within their school so that teachers are
better able to implement evidence-based interventions with a high level of fidelity and to
extend their implementation to other settings and contexts (see McIntosh & Goodman,
2016; Sugai, Simonsen, Freeman, & La Salle, 2016). The policy recommendation could
provide the structure necessary for building such capacity for implementation at MHS
and improving student achievement.
Rationale
The purpose of this study was to assess whether there were differences in student
algebra achievement after implementing a school-wide intervention and enrichment
program at MHS in regards to student outcomes in Algebra I and Algebra II achievement.
I also interviewed math teachers who taught some of the math interventions, in part, to
determine the strengths and weaknesses of the school-wide intervention and enrichment

71
program. My goal as a researcher was to determine whether or not achievement gains
were realized and why. Based on the data analysis, I developed a policy recommendation
for MHS for developing and implementing a systematic process for measuring
implementation fidelity of academic interventions. The research findings indicated that
no achievement improvement was realized from the school-wide intervention and
enrichment program and also, that implementation fidelity was not measured or
monitored. Therefore, MHS could benefit from focusing on measuring and ultimately
improving the fidelity of implemented academic interventions.
I developed an interview protocol, found in Appendix B, for teachers that
specifically asked about the strengths and weaknesses of the intervention and enrichment
program. When asked specifically, “Do you believe the intervention/enrichment program
was implemented with fidelity?” none of the three teachers gave a solidly affirmative
answer and two teachers listed specific concerns with fidelity, which included (a) not all
enrichment teachers accessed support from math teachers or provided resources; (b) not
enough data from the enrichment sections was tracked; (c) it was difficult to keep
teachers accountable; (d) there was no way to keep students accountable other than
coursework grades and benchmark performance; (e) not all teachers bought into the
intervention/enrichment program; and (f) while support, materials, and direction were
provided, there was no formal PD session to really introduce and explain the program. A
systematic process for measuring fidelity coupled with a leadership team responsible for
supporting the process would ensure that teachers improved invention implementation.

72
Review of the Literature
Only 17% of 12th graders from TN scored at the proficient level or higher in
mathematics on the NAEP assessments, and in 2015, 30% of students in TN met the
national benchmark in mathematics as measured by the ACT while 42% of students
nationally met the benchmark (Broderick, 2016; USDOE, 2013). Improving academic
achievement across grade levels is a high priority in TN schools, as TN is currently
performing below national standards (Broderick, 2016; USDOE, 2013). To improve
academic achievement, evidenced-based instructional strategies and interventions need to
be implemented with fidelity (McKenna & Parenti, 2017; Missett & Foster, 2015).
Implementation fidelity is defined and explored from the perspective of educational
research and classroom applications in this literature review. Additionally, assessment of
fidelity and measurement tools are both examined.
Topics covered in this review of literature focus on the necessity of
implementation fidelity in education improvement efforts, from educational research to
applied practices in the classroom. Search terms included but were not limited to
implementation fidelity, intervention implementation, fidelity, fidelity checks, and fidelity
rubrics. Education research databases and indices were searched including ERIC, SAGE,
Education Source; and Google Scholar; purchased books; and articles requested through
the Walden Library.
Implementation Fidelity
Implementation fidelity can be defined in a variety of ways; however, most
definitions can be distilled to the basic idea that implementation fidelity is “the degree to

73
which a program model is instituted as intended” (Dhillon, Darrow, & Meyers, 2015, p.
9; Harn et al., 2017; Yeaton & Sechrest, 1981). To be more specific, implementation
fidelity is defined by Anderson “as the similarity between enacted practice and the
benchmark of program designers’ specifications” (2017, p. 1291; Missett & Foster,
2015). When applied to an education setting involving intervention, it is defined “as the
extent to which an intervention is delivered as intended by end users in an authentic
education setting” (McKenna & Parenti, 2017; Roberts, 2017, p. 1). AIR (2015)
specifically references educators in its definition, “Fidelity refers to how closely
prescribed procedures are followed and, in the context of schools, the degree to which
educators implement program, assessments, and implementation plans the way they were
intended.” These definitions do not fully encompass the extent or quality of
implementation fidelity, therefore necessitating further definition through a variety of
models (Anderson, 2017; Dhillon et al., 2015).
One model of implementation fidelity focuses on five different constructs:
adherence, exposure, quality of delivery, participant responsiveness, and program
differentiation (Dane & Schneider, 1998; Dhillon et al., 2015; Favre & Knight, 2016).
Adherence refers to what some deem is the basic definition of implementation fidelity, as
to whether or not an intervention or program is being implemented as designed and it
relates to teacher professional development (Carroll et al., 2007; Dane & Schneider,
1998; Favre & Knight, 2016). Exposure is defined by the amount of intervention or
programming being delivered, as prescribed by design (Carroll et al., 2007; Dane &
Schneider, 1998; Favre & Knight, 2016). Quality of delivery is described as the manner

74
in which an intervention or program is delivered (Carroll et al., 2007; Dane & Schneider,
1998; Harn et al., 2017). Participant responsiveness refers to the measurement of
participant engagement and participation in the lesson (Carroll et al., 2007; Dane &
Schneider, 1998; Favre & Knight, 2016; Harn et al., 2017). Program differentiation can
be described as the identification of essential intervention or program elements and,
according to some, measures something distinctly different from alternative programs
(Carroll et al., 2007; Dane & Schneider, 1998; Dhillon et al., 2015; Favre & Knight,
2016).
Another model is based on three components, excluding participant
responsiveness and program differentiation: strength, integrity, and effectiveness of
treatment (Dhillon et al., 2015; Yeaton & Sechrest, 1981). This model prioritizes the
elements directly related to treatment as opposed to the more comprehensive model with
five constructs (Carroll et al., 2007; Dhillon et al., 2015; Yeaton & Sechrest, 1981).
Strength is described in Yeaton and Sechrest as the “likelihood the treatment could have
its intended outcome” (1981, p. 156). Integrity aligns with adherence and is described as
the “degree to which a treatment is delivered as intended” (Dane & Schneider, 1998;
Yeaton & Sechrest, 1981, p. 160). Effectiveness comprises several elements to include
statistical effectiveness, practice standards, social validation, and cost benefits (Yeaton &
Sechrest, 1981).
Other models have been proposed, based on fit to specific contexts, adding to
practice and research in those contexts (Guo et al., 2016). In early literacy, for example, a
three-factor model consisting of adherence and dosage, participant responsiveness, and

75
program differentiation was found to best fit the data for implementation fidelity (Guo et
al., 2016). Additionally, it was found that program differentiation significantly impacted
early-literacy gains (Guo et al., 2016). In mathematics, often, the focus is on adherence
only to measure implementation fidelity (Nelson, Van Norman, Parker, & Cormier,
2019).
The alignment of implementation constructs is complicated further by differences
in emphasis on aspects of fidelity to be considered (Carroll et al., 2007; Dhillon et al.,
2015). Some emphasize intervention fidelity and organizational fidelity, described by
others as fidelity to structure and fidelity to processes or interactions (Dhillon et al., 2015;
McKenna & Parenti, 2017). Fidelity to structure or intervention fidelity, both refer to
practitioner adherence to program or intervention core component delivery, time
allocation, and intervention completion (Anderson, 2017; Dhillon et al., 2015; Harn et al.,
2017; McKenna & Parenti, 2017). Fidelity to processes or interactions refers to the
quality of processes or interactions when implementing an intervention and is often
considered in an educational setting, the quality of instruction and the quality of teacher-
student interaction during the intervention (Anderson, 2017; Dhillon et al., 2015; Harn et
al., 2017; McKenna & Parenti, 2017). Organizational fidelity focuses on the
implementation of program supports, such as instructor or interventionist training
(Dhillon et al., 2015). To summarize, generally, implementation fidelity either by
definition, model, or aspect, describes how well a program or aspect of a program is
implemented as designed.

76
Applications in Educational Research
One focus of implementation fidelity in educational research is research in
designing and evaluating educational interventions and practices aimed at improving
student achievement (Allor & Stokes, 2017; Meyers & Brandt, 2015; Missett & Foster,
2015; Roberts, 2017). Implementation fidelity is essential in such educational research to
accurately interpret treatment results of an intervention or educational practice, as well as
assess the generalizability of such practices and determine improvements in
implementation (Dhillon et al., 2015; Meyers & Brandt, 2015; Missett & Foster, 2015;
Murrah, Kosovich, & Hulleman, 2017). As a result, implementation fidelity should be
measured when evaluating interventions and educational practices, involving substantial
planning to avoid reliability and validity concerns (Dhillon et al., 2015; Missett & Foster,
2015; Murrah et al., 2017).
There are a variety of reasons that implementation fidelity would be measured in
educational research (Anderson, 2017). Program evaluation or studies evaluating the
efficacy of policy or understanding how much of a program, dosage, or fidelity of
structure is essential to understanding the program or policy’s impact (Anderson, 2017;
Dhillon et al., 2015; Guo et al., 2016; McKenna & Parenti, 2017). Other research
investigates the processes through which policies or programs are implemented, or
fidelity of process (Anderson, 2017; Dhillon et al., 2015; McKenna & Parenti, 2017). An
example would be a study on how teachers adjust a practice or program to fit their
school’s needs (Anderson, 2017). Additionally, there are studies that attempt to explain
relationships between different facets of implementation as a process and an outcome

77
(Anderson, 2017). An example would be a study that examines the significance of
teacher buy-in to maintaining program delivery (Anderson, 2017).
One five-step process for measuring implementation fidelity of an intervention
includes defining the intervention logic models, identifying fidelity measures, conducting
psychometric analyses, conducting within and between-group fidelity analyses, and
linking fidelity to outcomes (Murrah et al., 2017). There are three models to define in the
first step to include the actual intervention model, or the intervention black box
(Kosovich, 2013; Murrah et al., 2017). The intervention black box is comprised of the
intervention processes or core components of the intervention, the psychological
processes or proximal changes in participants, and the outcomes or desired changes
(Doabler et al., 2016; Kosovich, 2013; Murrah et al., 2017). The next model, the change
logic model, according to Murrah et al., is “a conceptual representation of the
intervention organized in the hypothesized causal order of events” (2017, p. 40). This
model includes all of the components of the intervention black box and aids researchers
in developing the third model, the operational logic model (Dhillon et al., 2015; Doabler
et al., 2016; Murrah et al., 2017; Nelson, Cordray, Hulleman, Darrow, & Sommer, 2012).
The operational logic model “identifies which indicators the researchers deem important
for measuring the core components” (Murrah et al., 2017, pp. 40-41). The operational
logic model clarifies for researchers what needs to be measured and what types of
measures are needed to appropriately analyze implementation fidelity for a specific
intervention (Crawford, Freeman, Huscroft-D’Angelo, Fuentes, & Higgins, 2019; Dhillon
et al., 2015; Killion, 2016; Kisa & Correnti, 2015; Murrah et al., 2017).

78
When the components to be measured are determined, the next step is identifying
fidelity measures (Dhillon et al., 2015; Murrah et al., 2017). Appropriate evidence to
support the use of each measure should be determined, aligning to the intended use of the
measure and with the logic model (Lakin & Rambo-Hernandez, 2019; Murrah et al.,
2017). Each treatment component should be measured, both directly and indirectly, using
observational data, self-report data, checklists, interviews, or data logs, for example
(Dhillon et al., 2015; Missett & Foster, 2015; Murrah et al., 2017). After the measures
have been chosen, psychometric analyses, the next step, should be conducted for each
fidelity measure, gathering reliability and dimensionality information (Crawford et al.,
2019; Kosovich, 2013; Murrah et al., 2017; Nelson et al., 2012). First, researchers
determine whether there will be a single fidelity index, combining the individual
measures, which is most common, or if there will be sub-scales of fidelity directly
corresponding to different components (Harn et al., 2017; Murrah et al., 2017). Once that
has been determined, researchers can concentrate on scale reliability (Murrah et al., 2017;
Nelson et al., 2012). Piloting fidelity measurement instruments is necessary to determine
validity and reliability data and refining the instruments, as necessary (Crawford et al.,
2019; Lakin & Rambo-Hernandez, 2019).
After the fidelity measures have been determined to be appropriate, the next step,
within and between-group fidelity analyses can begin (Murrah et al., 2017). Within-group
analyses describe “how well the intervention was implemented as well as how
implementation may have varied across individuals and groups” (Murrah et al., 2017, p.
44). Between-group analyses contrast treatment and control groups and can be managed

79
by using an Achieved Relative Strength index (ARS; Murrah et al., 2017). ARS is often
used to compare one group’s level of measured fidelity to that of other groups or a
predetermined absolute standard (Murrah et al., 2017). Once the analyses are complete,
researchers can focus on the last step, linking fidelity to outcomes (Dhillon et al., 2015;
Murrah et al., 2017). There are varied methodologies for linking fidelity to outcomes,
including analysis of variance (ANOVA) and hierarchical linear modeling (HLM)
(Dhillon et al., 2015). Theoretically, there should be appropriate correlations between
outcomes and fidelity measures, so linking the two should provide valuable information
on the impact of measured components on outcomes, the impact of fidelity on
intervention effects, and subgroup effects for different measured components (Murrah et
al., 2017).
Measuring implementation fidelity should be incorporated into intervention
program design to include continuing intervention evaluation for the purposes of
intervention improvement and continued development (Allor & Stokes, 2017; Crawford
et al., 2019; Meyers & Brandt, 2015; Roberts, 2017). There are three stages in designing
an intervention, to include development, efficacy or replication, and effectiveness, and
each stage has different implementation fidelity activities (Allor & Stokes, 2017). The
development stage mainly comprises developing prototype fidelity measures, piloting
those measures, refining the measures, and assessing their reliability and validity (Allor
& Stokes, 2017; Crawford et al., 2019). During the efficacy state, fidelity data is
collected and analyzed throughout trials, to determine necessary levels of implementation
for effectiveness and whether and how implementation could be improved (Allor &

80
Stokes, 2017). During the effectiveness stage, fidelity data is collected and analyzed
throughout trials to guide future research, determine levels of implementation for routine
practice, and, if needed, determine why differences exist from previous studies (Allor &
Stokes, 2017). In summary, implementation fidelity is essential for the development and
evaluation of educational interventions and practices, even though the process is technical
and lengthy, and should be embedded in the design process.
Classroom Applications
Classroom applications of implementation fidelity include both teacher instruction
and intervention applications, given current education policy requirements for evidence-
based practices in classrooms to improve student achievement (McKenna & Parenti,
2017; Missett & Foster, 2015). Teachers are encouraged to implement programs with
fidelity because these programs were deemed evidence-based and achieved positive
results for students under those conditions prescribed by the program (Quinn & Kim,
2017). Classroom or core instruction that is not aligned with evidence-based practices or
implemented as designed with fidelity may negatively impact student academic
performance, resulting in unnecessary and inappropriate student referrals for additional
intervention, whether through a specific multi-tiered intervention system (MTSS), like
response to intervention (RTI) or positive behavior intervention system (PBIS), or special
education (King-Sears, Walker, & Barry, 2018; McKenna & Parenti, 2017). Therefore,
establishing and maintaining a high level of fidelity implementation of evidence-based
practices in core instruction or regular classroom instruction is essential to improving the
academic performance of all students and necessary for preventing unnecessary student

81
referrals for more intensive intervention (King-Sears et al., 2018; Mages, 2017; McKenna
& Parenti, 2017; Sugai et al., 2016).
In the classroom environment, implementation fidelity of interventions is often
thought of as treatment fidelity, which is critical in determining whether changes in
academic performance are due to the intervention (DeFouw, Codding, Collier-Meek, &
Gould, 2018; Gresham, 2017; Lakin & Rambo-Hernandez, 2019; McKenna & Parenti,
2017). Treatment fidelity, according to Gresham, “refers to the methodological strategies
used to monitor and improve the reliability and validity of academic and behavioral
interventions in schools” (2017, p. 22). Treatment fidelity is comprised of treatment
adherence, interventionist competence, treatment differentiation, and treatment receipt
(Anderson, 2017; Gresham, 2017). Treatment adherence consists of treatment component
adherence and session/daily adherence or accuracy and consistency (Gresham, 2017;
Nelson et al., 2019). Interventionist competence can be defined as the experience and
skill of the interventionist delivering the intervention, and treatment differentiation
involve distinguishing treatments being used along theoretical dimensions (Gresham,
2017). Treatment receipt is comprised of intervention dosage, student understanding of
the intervention, and student receptiveness to the intervention (Gresham, 2017).
Generally, schools have increasingly implemented MTSS, RTI, or PBIS processes
for service delivery, which utilizes a student’s lack of progress to a research-based
intervention to determine whether or not to change, modify or intensify the intervention
(AIR, 2015; DeFouw et al., 2018; Gresham, 2017; McKenna & Parenti, 2017). The
MTSS approach is based on the idea that a change in performance, academic or
82
behavioral, is a function of intervention and student access to evidence-based
instructional practices, in the classroom and the intervention is critical to MTSS, RTI, or
PBIS implementation (Gresham, 2017; McKenna & Parenti, 2017; Sugai et al., 2016). As
such, implementation fidelity measurement within the MTSS service delivery model is
essential to determining whether or not a student’s lack of progress warrants alterations to
the student’s intervention program (AIR, 2015; DeFouw et al., 2018; Gresham, 2017;
King-Sears et al., 2018; McKenna & Parenti, 2017). The MTSS approach aims to
establish content proficiency and long-term implementation capability within school
buildings with teachers so that teachers have better opportunity to implement evidence-
based programs and interventions with high levels of fidelity and to better adapt and
extend their implementation over time and to other settings and contexts (McIntosh &
Goodman, 2016; Sugai et al., 2016). To accomplish this level of MTSS implementation
with fidelity, schools must build capacity for implementation (Sugai et al., 2016).
Implementation fidelity is critical for the delivery of special education services
and directly impacts student performance (Boardman et al., 2016; Brock & Carter, 2017;
King-Sears et al., 2018; McKenna & Parenti, 2017). Given that high levels of
implementation fidelity are correlated with improved student outcomes, it is critical that
these students receive the benefit of evidence-based practices implemented with fidelity
for the opportunity for improved performance (Boardman et al., 2016; Brock & Carter,
2017; King-Sears et al., 2018; McKenna & Parenti, 2017). Low levels of implementation
fidelity may result in lower levels of student performance and may also result in not
providing appropriate opportunities for special education students to develop necessary

83
skills (Boardman et al., 2016; King-Sears et al., 2018; McKenna & Ciullo, 2016;
McKenna & Parenti, 2017). However, teachers and researchers report concerns about the
implementation of evidence-based interventions for special education students,
suggesting a need for effective professional development for teachers (Brock & Carter,
2017). Additionally, implementation fidelity is also a consideration when managing
student behavior and discipline and can impact such special education processes as
manifestation determinations (McKenna & Parenti, 2017; Walker & Hott, 2016).
An alternative classroom application process is the practice of adapting evidence-
based practices to local contexts (Quinn & Kim, 2017). Structured adaptations, which
maintain core principles while adapting program components, are effective for students
when teachers are experienced with implementing the program with fidelity as designed
(Quinn & Kim, 2017). Adaptive practices have not been found to be effective for teachers
inexperienced with the program (Quinn & Kim, 2017).
The two categories of factors related to treatment fidelity are variables related to
the intervention and variables related to the interventionist (Gresham, 2017). Variables
related to the intervention include (a) ease of implementation, (b) materials and resources
required for implementation, and (c) intervention complexity (Anderson, 2017; Gresham,
2017; Troyer, 2017). Interventions which are difficult to implement or require a high
degree of effort are less likely to be implemented with high levels of fidelity, as are
overly complex interventions, than easier, simpler interventions (Balu & Doolittle, 2016;
Gresham, 2017; McKenna & Parenti, 2017; Troyer, 2017). Additionally, treatments that
require materials and resources not typically found in school classrooms are less likely to

84
be implemented with high levels of fidelity as treatments with more common materials
(Anderson, 2017; Gresham, 2017; McKenna & Parenti, 2017). Variables related to the
interventionist include (a) number of interventionists, (b) perception of effectiveness, and
(c) motivation (Favre & Knight, 2016; Gresham, 2017; Lakin & Rambo-Hernandez,
2019). Treatments requiring more than one interventionist are less likely to be
implemented with high levels of fidelity than those with only one interventionist
(Gresham, 2017). Interventionists are more likely to implement treatment with high
levels of fidelity if they believe the treatment to be effective and if they are motivated to
invest their time and efforts into implementing the treatment (Favre & Knight, 2016;
Gresham, 2017; Lakin & Rambo-Hernandez, 2019; McKenna & Parenti, 2017;
Schechter, Kazakoff, Bundschuh, Prescott, & Macaruso, 2017). Belief in treatment or
program effectiveness and teacher or interventionist motivation increases teacher
engagement, which improves implementation fidelity (Lakin & Rambo-Hernandez, 2019;
Schechter et al., 2017).
Implementation fidelity of evidence-based practices is achieved in part, through
effective and rigorous professional development aimed at not only providing
opportunities for teachers to learn new programs but to support teachers in changing,
developing and maintaining effective practices for both typical students and students with
disabilities across all subject areas (Balu & Doolittle, 2016; Brock & Carter, 2017;
Killion, 2016; King-Sears et al., 2018; Mages, 2017; Sugai et al., 2016; Troyer, 2017).
Evidence suggests that how teachers are trained may be more important than the number
of hours spent training, and both the content and process of professional learning

85
opportunities are equally significant in supporting teachers in the implementation of new
evidence-based practices (Brock & Carter, 2017; Killion, 2016; Kisa & Correnti, 2015;
Troyer, 2017). The level of implementation fidelity is higher when the outcomes of
professional development are explicitly described and aligned with evidence-based
practices. Also, for student outcomes and when professional development utilizes
strategies for both content knowledge and transfer to practice, to include training,
modeling, coaching, opportunities to plan instruction, performance feedback, and other
supports (Brock & Carter, 2017; Fallon, Collier-Meek, Maggin, Sanetti, & Johnson,
2015; Killion, 2016; King-Sears et al., 2018; Kisa & Correnti, 2015; Troyer, 2017). One
process for implementation or fidelity coaching involves five steps, to include (1)
modeling the intervention, (2) sharing the fidelity protocol, (3) coaching prior to
implementation, (4) observing during implementation, and (5) reflecting with the
interventionist using fidelity data (King-Sears et al., 2018).
Another element of program or intervention implementation fidelity is often
defined as student factors, such as student behavior and attendance (Balu & Doolittle,
2016; Grover, 2016; LaRusso, Donovan, & Snow, 2016). However, these factors could
be redefined as school factors, like classroom management, parent engagement, alternate
disciplinary practices, and school climate, and addressed through school improvement
efforts in these areas (Balu & Doolittle, 2016). Another threat to intervention
implementation fidelity is often the school schedule and schedule interruptions, as the
time allotted often does not meet the needs of the intervention or the students (Balu &
Doolittle, 2016; Grover, 2016; LaRusso et al., 2016). Testing and test preparation often
86
interfere with implementation fidelity, as well (LaRusso et al., 2016). Additionally,
intervention components that are structured and teacher-led rather than intervention
components requiring adaptations and group interaction are more likely to be
implemented with higher fidelity (Balu & Doolittle, 2016; Grover, 2016).
School-level threats to implementation fidelity include misalignment with
classroom and school need; competing initiatives that while having overlapping goals, do
not have overlapping implementation plans; multiple new program/curricula
implementations at the same time; and leadership policies that are not supportive or
prioritize implementation (LaRusso et al., 2016; Sugai et al., 2016). One way to address
school level threats is through capacity development based on basic teaching and learning
tenets, system implementation standards, and distributed leadership principles (Sugai et
al., 2016). Capacity development entails developing and establishing competent and
sustainable school systems where academic and behavioral practices are culturally
responsive, implemented with high levels of fidelity, continuously adapted using data,
supported through regular professional development, coordinated at the school and
district levels, officially authorized by school and district leadership, and sustained over
time (OSEP Technical Assistance Center on Positive Behavioral Interventions and
Supports, 2015a; Sugai et al., 2016).
Fidelity Assessment
Fidelity is measured in a variety of ways, and measurement methods are not fully
understood (Harn et al., 2017; Hauk, Salguero, & Kaser, 2016). One common way to
approach fidelity assessment is to describe methods used for measuring fidelity of

87
structure and fidelity of process (Harn et al., 2017; Hauk et al., 2016; Lakin & Rambo-
Hernandez, 2019). Structural areas include intervention delivery to include adherence or
differentiation, dosage or time allocation, and intervention completion (Anderson, 2017;
Dhillon et al., 2015; Harn et al., 2017; McKenna & Parenti, 2017). Often these areas are
assessed using direct observations, but some, such as dosage and intervention completion,
can be measured through self-report or attendance logs (Harn et al., 2017; Lakin &
Rambo-Hernandez, 2019; McKenna & Parenti, 2017). Fidelity of process assessment is
more complex due to the qualitative nature of the assessment (Harn et al., 2017; Lakin &
Rambo-Hernandez, 2019). Quality factors involved include how well the interventionist
appeared to comprehend the lesson and content, availability of materials, teacher
response to student questions, language use, student engagement, the opportunity for
student response, the accuracy of student response, and behavior management (Harn et
al., 2017; Lakin & Rambo-Hernandez, 2019). Program-specific direct observations, focus
groups, and teacher interviews are good data sources for the analysis of process areas
(Harn et al., 2017; Lakin & Rambo-Hernandez, 2019). Measurement reliability is more of
a concern when assessing fidelity of process; however, fidelity of process is important as
it is considered by some as more directly related to student outcomes than fidelity of
structure (Boardman et al., 2016; Harn et al., 2017). Student outcomes in reading and
math are not predicted similarly using these fidelity measures, as reading outcomes were
better predicted using fidelity of process, and math outcomes were better predicted by
fidelity of structure (Boardman et al., 2016; Harn et al., 2017).
88
Another method of fidelity assessment involves a multidimensional approach
where both the structural and process aspects of fidelity are measured simultaneously
(Harn et al., 2017). This method is focused on measuring program dosage and program
delivery and is considered a better representation of implementation fidelity than either a
structural or process measure (Harn et al., 2017). Student outcomes in math were
predicted by multidimensional methods similar to structural methods, but there was no
advantage to these methods in reading outcomes (Harn et al., 2017).
Direct and indirect assessment methods are both appropriate when measuring
treatment fidelity within classrooms, and there are advantages and disadvantages
associated with either of them (Gresham, 2017; Missett & Foster, 2015). Time and place
of the actual intervention is often the determining factor of which method is used
(Gresham, 2017). Direct assessment methods consist of systematic observations of the
delivered intervention within the classroom setting, often using an observation rubric
developed specifically for the intervention employed, as well as audio recordings of the
delivered intervention (Foorman, Dombek, & Smith, 2016; Gresham, 2017; Harn et al.,
2017; McKenna & Parenti, 2017). This method is useful in that multiple different
treatment components can be observed as well as the quality of delivery and student
responsiveness, to include student behavior (Foorman et al., 2016; Gresham, 2017; Harn
et al., 2017). As a result, content validity is critical for this type of assessment and is
dependent on the number of observations and the length of observations (Gresham, 2017;
Lakin & Rambo-Hernandez, 2019). One limitation of systematic observations is the high
number of observations required to achieve a valid and appropriate measure (Gresham,

89
2017). Indirect methods often include surveys, checklists, and intervention logs,
measuring fidelity after the intervention or treatment has already occurred (Gresham,
2017; McKenna & Parenti, 2017).
It is difficult to discern when to assess fidelity given the many purposes of
measuring implementation fidelity (Harn et al., 2017). When assessing fidelity early in
the implementation process, while it is likely to be low, the information gained is useful
to determining professional development needs and providing instruction and support
(Brock & Carter, 2017; Foorman et al., 2016; Harn et al., 2017). However, assessing
early in implementation is not sufficient as fidelity should improve with additional
supports and more teacher practice (Harn et al., 2017). Only assessing fidelity once upon
implementation is not an adequate measure, given the contextual variability in schools,
such as school schedule and attendance, and the need to provide continuous coaching
support to teachers (Foorman et al., 2016; Harn et al., 2017). These circumstances
indicate the importance of measuring implementation fidelity of an intervention at
various stages of implementation, for instructional support, and maintenance purposes
(Foorman et al., 2016; Harn et al., 2017). Therefore, schools should use a systematic
process to assess implementation fidelity (Harn et al., 2017).
There is variability in what constitutes an acceptable level of fidelity when
implementing evidence-based practices and interventions, and this variability is
dependent on unique components of practices and interventions (Harn et al., 2017; Hauk
et al., 2016; King-Sears et al., 2018; Lakin & Rambo-Hernandez, 2019). First, there are
threshold effects when higher levels of fidelity do not lead to improved student outcomes

90
(Harn et al., 2017). Features of the intervention program or practice and variation in
subpopulations, may both lead to threshold effects (Harn et al., 2017; Lakin & Rambo-
Hernandez, 2019). For example, more explicitly defined program components may
impact outcomes more positively than programs with less specified components at lower
fidelity levels (Harn et al., 2017). Second, there is a need for program flexibility to
support differentiation of instruction and culturally responsive classrooms (Lakin &
Rambo-Hernandez, 2019). Therefore, appropriate levels of flexibility should be built into
both the structural and process components to allow teachers to exercise professional
judgment for the context of the program (Lakin & Rambo-Hernandez, 2019).
Additionally, the differential impact of implementation fidelity on student outcomes has
been found by the level of risk or intervention intensity, ethnic groups, and gender (Harn
et al., 2017). For example, higher levels of fidelity may be more necessary for more at-
risk students or those in the most intensive interventions than those students at lower risk
levels (Boardman et al., 2016; Harn et al., 2017).
There are several threats to the reliability of intervention or treatment fidelity
measurement to include reactivity of observations, interventionist drift, the complexity of
treatment, and interventionist expectancies and feedback (Favre & Knight, 2016;
Gresham, 2017; Harn et al., 2017; McKenna & Parenti, 2017). Reactivity of observations
refers to the phenomenon of those being observed, the interventionist, in this case,
knowing they are being observed and reacting by delivering the intervention or treatment
with more integrity than is typical (Gresham, 2017; Harn et al., 2017). One way to
improve reliability and reduce the reactivity effect is to conduct observations on a

91
random schedule (Gresham, 2017). Interventionist drift refers to the tendency
interventionists demonstrate to change their delivery of treatment over time (Favre &
Knight, 2016; Gresham, 2017). Ways to improve reliability and prevent drift are to
provide performance feedback to interventionists, either formally or through informal
debriefing, and to ensure professional development is adequate for teachers to adjust their
efficacy beliefs (Favre & Knight, 2016; Gresham, 2017). The complexity of treatment
refers to the number of steps and difficulty of implementation of a treatment protocol
(Gresham, 2017). Interventionist expectancies and feedback both denote behavioral
reactions of the interventionist impacting reliability (Gresham, 2017; McKenna & Ciullo,
2016; McKenna & Parenti, 2017). Interventionists who expect an intervention to be
effective are more likely to implement that intervention with more fidelity than those who
do not expect the intervention to be effective (Favre & Knight, 2016; Gresham, 2017;
Lakin & Rambo-Hernandez, 2019; McKenna & Parenti, 2017). Also, interventionists
who receive regular, detailed performance feedback implemented intervention with much
greater fidelity than those who were not provided such feedback (Brock & Carter, 2017;
Fallon et al., 2015; Gresham, 2017; McKenna & Ciullo, 2016; McKenna & Parenti,
2017).
Fidelity Measurement Tools
Selecting appropriate fidelity measures, and confirming validity and reliability, to
evaluate the fidelity of implementation is an important step in the process (Lakin &
Rambo-Hernandez, 2019; Murrah et al., 2017). There are existing fidelity measures, and
these measures often already have validity and reliability data to review (Ibrahim &

92
Sidani, 2015; Lakin & Rambo-Hernandez, 2019). Another advantage is that these
measures can have a strong theoretical basis making them more credible (Lakin &
Rambo-Hernandez, 2019). However, identifying such measures is complex as validity
and reliability is not always wholly measured, all facets of fidelity may not be measured,
and appropriateness can depend on participant characteristics (Ibrahim & Sidani, 2015;
Lakin & Rambo-Hernandez, 2019; Lewis et al., 2015).
One review of fidelity measures found that adherence and interventionist
competence were aptly measured by the reviewed measures; however, participant
engagement and exposure were not (Ibrahim & Sidani, 2015). Additionally, it was found
that few measurement studies report explicitly enough to measure use and to evaluate
intervention differentiation (Ibrahim & Sidani, 2015). Another review of fidelity
measures across eight constructs found that from 104 fidelity instruments, fewer than ten
measures demonstrated evidence from more than two of those constructs, with only one
measure demonstrating psychometric strength on all six assessment criteria (Lewis et al.,
2015). The constructs include acceptability, adoption, appropriateness, cost, feasibility,
fidelity, penetration, and sustainability (Lewis et al., 2015). The six assessment criteria
include internal consistency, structural validity, predictive validity, norms,
responsiveness, and usability (Lewis et al., 2015). Conclusions from both reviews
indicated a need for further development of psychometrically sound measures that
improve the psychometric quality of existing and new measures and account for all facets
of the fidelity of intervention implementation (Ibrahim & Sidani, 2015; Lewis et al.,
2015).
93
Participant characteristics, such as academic levels, gender, and ethnicity, can
impact the appropriateness of fidelity measures (Harn et al., 2017; Lakin & Rambo-
Hernandez, 2019). Using an intervention outcomes measure validated in the general
population in a gifted education environment or for high-risk students can pose problems,
for example (Harn et al., 2017; Lakin & Rambo-Hernandez, 2019). Problems posed in the
gifted education environment include greater than expected measurement error, a ceiling
effect, and regression to the mean (Lakin & Rambo-Hernandez, 2019).
To improve upon the fidelity of implementation measurement, it may be
appropriate to develop new measures should measurement problems exist or if the
existing measure does not align with the intervention’s goals (Lakin & Rambo-
Hernandez, 2019). The development of fidelity measures, at a minimum, involves
gathering validity evidence, use expert guidance in writing or have an expert review the
measurement items, and conducting a pilot test of the measures (Crawford et al., 2019;
Lakin & Rambo-Hernandez, 2019). The collection of validity evidence should be aligned
with the purposes of the intervention or evaluation (Lakin & Rambo-Hernandez, 2019).
Additional resources for fidelity measures in education include the National
Center on Intensive Intervention, the Center on Response to Intervention, and in the state
of Tennessee, the Response to Instruction and Intervention Framework (AIR, 2014a;
AIR, 2015; TDOE, n.d.-b). Measurement tools available include individualization
checklist, progress monitoring checklist, intensive intervention review log, data-based
individualization implementation rubric, data meeting plan fidelity checklist,
implementation logs, RTI fidelity of implementation rubric, and RTI essentials worksheet

94
(AIR, 2014a; AIR, 2015). The Response to Instruction and Intervention Framework
contains sections across all tier of intervention and instruction on fidelity monitoring
(TDOE, n.d.-b). Generally, multiple types of fidelity measures are widely available as
well as resources to develop fidelity measures should that be needed.
Project Description
I developed a policy recommendation on measuring fidelity of implemented
academic interventions, based on analysis of assessment scores and teacher interviews.
These recommendations will be shared with the administration of MHS as well as
members of the research department at the district board office. School administration
should proceed with creating a leadership team and fine-tuning these recommendations
before sharing with school staff. This document can also be shared with other
stakeholders, such as district personnel, school staff, parents, and other high school
administrators within the district.
Needed Resources and Existing Supports
MHS tried to implement school-wide math intervention and enrichment to
improve student outcomes but was unsuccessful. Currently, the school uses a Response to
Instruction and Intervention (RTI2) Framework to deliver academic intervention to
students per state requirement (TDOE, 2016). Through the statewide implementation of
RTI2, the state has provided fidelity documents, state training, and an implementation
guide to assist schools with implementation. Additionally, the district provides ongoing
training and intervention training, as well. However, finding and purchasing district
approved interventions that engage high school students is still a challenge as well as

95
providing ongoing professional development and coaching to teachers providing
intervention.
Potential Barriers and Solutions
Potential barriers were identified in the project, the primary one being teacher
buy-in, which is essential for successful intervention implementation with fidelity.
Additional barriers include student attendance and student behavior. I propose several
professional development strategies for improving teacher buy-in, in addition to
establishing school-wide achievement improvement goals and giving teachers voice
regarding school-wide goals and their needs (Greene, 2016). I also propose additional
coaching for teachers struggling with student attendance and behavior during
interventions, in addition to the current established school-wide attendance and behavior
practices (Balu & Doolittle, 2016; King-Sears et al., 2018). I also propose additional
communication between the school and parents, as recommended in the RTI2
Implementation Guide, for gaining parent support in reinforcing student attendance and
behavior in intervention classes (TDOE, 2016).
Implementation
I developed a recommendation for developing and implementing a systematic
process for measuring fidelity of implemented academic interventions. This process is
based on research and state recommendations, as outlined in the RTI2 Implementation
Guide. The goal for this project is to have a leadership team in place to develop and
implement a process for measuring implementation fidelity within MHS. This will
provide needed structure and accountability to the school’s intervention process, as well

96
as a needed coaching resource to teachers who are providing intervention, all improving
intervention implementation.
The policy recommendations will be presented to MHS’s administration and
related leadership. I will propose that the recommendations be transformed into an
implementation plan and presented to the leadership team, once established. The policy
and practice changes can be presented to school staff at the beginning of the school year,
during a time already scheduled for professional development.
Roles and Responsibilities
As part of this project student, I developed a policy recommendation to facilitate
measuring academic intervention implementation fidelity and, ultimately, improve
intervention implementation and student outcomes. I will be presenting the
recommendations to MHS’s administration and related leadership, with the
recommendation that they follow the guidance of the state RTI2 Implementation Guide
with adaptation for their school’s individual needs by a school-level leadership team.
After the presentation, I will distribute a formative evaluation to the administrators for
their completion after thoroughly reviewing the policy recommendations. The goal of this
recommendation is the development of a systematic process for assessing fidelity of
implemented academic interventions. While I may be able to assist in MHS’s
development of such a process, the responsibility of the actual development and
implementation of the process will be that of the leadership team, once established.

97
Project Evaluation Plan
I developed a policy recommendation, found in Appendix A, for measuring
fidelity for implemented academic interventions at MHS. The evaluation focuses on the
actual project and not on goals or student outcomes as a result of the project. A formative
evaluation will be used to evaluate the policy recommendation, as formative evaluations
are used when policies or projects are in the early stages of implementation. Formative
evaluations can be used to make modifications or revisions for improvement and also for
progress monitoring purposes, providing staff feedback (Stetler et al., 2006). I will
present the policy recommendations to MHS’s administration and related leadership,
such as Special Education Lead and Dean of Students, after which, I will distribute a
survey, found in Appendix D, for their completion after thoroughly reviewing the policy
recommendations (Thomas, 2018). The response from this evaluation will be used to
determine the understandability and relevance of the policy recommendations, as well as
whether or not the recommendations can or will be implemented.
Project Implications
This policy recommendation could benefit teachers, administration, and, most
importantly, students at MHS. Other district high schools could also benefit, as MHS, if
successful, could serve as a model school for other schools in the district to emulate. This
recommendation will serve as a guide, backed by research, to school leaders and teachers,
on developing and implementing a systematic process for measuring fidelity of
implemented academic interventions. This project may be especially beneficial to
students, particularly struggling students, as the implementation of this process could
98
result in improved academic achievement outcomes (Harn et al., 2017; Sugai et al.,
2016).
School Community
Measuring fidelity of implemented interventions has been shown to improve the
fidelity of intervention implementation. This occurs by analyzing the data collected and
providing feedback to teachers, coaching, and other professional development as needed
(Balu & Doolittle, 2016; King-Sears et al., 2018). Additionally, by measuring such
student factors as attendance, behavior, and academic skill progress, parent
communication regarding student progress is enhanced, and parents are better able to
reinforce school efforts. Thus, systematically measuring fidelity improves the school
community as a whole and builds capacity for extensions of intervention implementation,
in addition to improving student academic achievement outcomes through improved
academic interventions (Harn et al., 2017; Sugai et al., 2016).
Societal
This policy recommendation could serve as a model for other district and state
high schools still struggling with systematically measuring fidelity of their implemented
academic interventions. It can help other high schools determine what is missing from
their own practices so that they can improve their own implementation and fidelity
monitoring process. As academic interventions are more widely implemented with
fidelity in high schools, student academic achievement could improve, leading to
improved high school graduation and postsecondary entrance rates. Another benefit could

99
be improved adult literacy rates, leading to potentially lower incarcerations rates, as
people are better able to access employment (Michan, 2016).
Conclusion
The purpose of this project was to develop a policy recommendation to develop
and implement a systematic process for measuring fidelity of implemented academic
interventions at MHS. This section includes a rationale for the project rationale and
review of literature, both based on my research results, as well as project description,
project evaluation, and project implications. Needed resources, existing supports, and
potential barriers and possible solutions are detailed, and a plan for implementation and
evaluation is described. This project has implications for both the school community, the
district community, and beyond. The next section focuses on my reflections on the
project study and my conclusions.
100
Section 4: Reflections and Conclusions
Introduction
I addressed the lack of improvement in student achievement after implementing a
school-wide math intervention and enrichment program by making a policy
recommendation on implementation fidelity for academic interventions. Specifically, my
recommendation, based on the research results and literature review from Section 3, is to
develop and implement a systematic process for measuring implementation fidelity for
the purpose of improving intervention implementation. In this section, I will discuss
project strengths, limitations, alternative approaches, and implications and directions for
future research. I will also reflect on my own professional and scholarly development
through this project and the general importance of this work.
Project Strengths and Limitations
I used a mixed-methods design for this project study to address a local problem
with high school algebra achievement. Using the study findings, I created a policy
recommendation to improve the implementation fidelity of academic interventions at
MHS. The policy recommendation was based upon data collection and analysis from
Section 2, as well as current literature on implementation fidelity.
This policy recommendation is a guide for MHS to develop and implement a
systematic process for measuring the fidelity of implemented academic interventions.
One strength of this recommendation is that the school leadership team will be
developing and implementing the process based on MHS needs. Another advantage of
this recommendation is that it allows for additional professional development and
101
mentoring support for staff, improving implementation, and staff buy-in. The process
recommended is founded on continual data collection, resulting in continued problem
solving around continuous improvement, building capacity for intervention within MHS,
another strength. Additionally, the recommendation is based on TN state guidelines,
allowing MHS to better collaborate with other high schools as they strive to make
improvements.
One limitation of the policy recommendation is that it is assumed that intervention
resources and training will be available prior to the start of school. It is also assumed that
teacher turnover will not interrupt the process of assigning teachers to be interventionists,
so they can prepare and attend professional development. Additionally, it is assumed that
the leadership team will have ample time prior to the school year to develop the fidelity
monitoring schedule, choose tools, and prepare the professional development for the
beginning of the year.
Recommendations for Alternative Approaches
While lack of implementation fidelity was an emerging theme in the qualitative
analysis, there were other noted concerns with the intervention and enrichment program.
One was that some teachers did not take advantage of offered mentoring or resources for
their intervention block. Another potential concern that emerged from the literature
review was the amount of time for the intervention or dosage.
Another way to address the lack of improvement after the intervention would be
to require more rigorous professional development for those teachers providing
intervention as well as additional resources to include prepared interventions with

102
scripted lessons. The intervention and enrichment program was developed by staff
members, and while mentoring was encouraged, it was not required. Additionally, some
staff members did not use the provided materials and instead created their own. This lack
of preparedness may have impacted the lack of improvement in student outcomes. The
necessity of proper professional development and resources was addressed in the policy
recommendation, as they are necessary for implementation fidelity; however, the
improvement of professional development could be made without implementing
systematic fidelity monitoring, and student academic outcomes could improve.
Additionally, the dosage was most likely a factor impacting student outcomes.
The intervention and enrichment program was implemented for 1 hour a week. More
frequent intervention blocks, upping the intervention dosage, may have improved student
outcomes for the intervention and enrichment program. However, increasing the dosage
without improving implementation fidelity would not likely have made a long-lasting
impact on student outcomes. Poor intervention implementation fidelity is actualized as
decreased intervention dosage, suggesting that the more efficient way to increase dosage
would be to improve implementation fidelity.
Scholarship, Project Development and Evaluation, and Leadership and Change
The research process is very complex, which I did not fully appreciate until going
through this process personally. I learned many things, from the specifics of library
research to improved writing skills to negotiating with stakeholders for data access. I also
learned new things about statistics, as well as how to approach a mixed-methods study.
103
Additionally, I learned to organize my time better and juggle work and family
responsibilities.
While having conducted literature reviews in the past, I never previously
conducted such thorough, extensive, or current literature reviews as required for this
process. And previously, the literature reviews were essentially just for the sake of the
exercise and not connected to research questions or to specifically better understand a
problem and to formulate potential solutions, which is quite different conceptually than
conducting one simply for the exercise. Additionally, I had never conducted such
extensive research using an online library and online resources, which was another
growth experience.
This project was my second scholarly research experience, but the first one where
I had to formulate research questions and hypotheses myself, in relation to the problem as
well as the actual available data. I also had the experience of learning how to integrate
quantitative and qualitative results in a mixed-methods design, along with the specifics of
each piece, such as writing an interview protocol, transcribing interviews, analyzing
interview data, and propensity matching. Acquiring the archived data from my school
district was a learning experience in negotiation in that I had to prove the value of my
project before my district would allow me access to the archived data I needed for my
research.
This was the first time I had to take research and apply what was learned to
develop a product based on research. Prior to this experience, I really had little
knowledge of how policies were developed or formed, so to create a policy

104
recommendation from the research was quite interesting and meaningful if for nothing
other than what I learned. To form my policy recommendation, I also learned about
change processes to include the supports and resources needed for effective and lasting
change as they pertained to my project.
My personal growth as a scholar, practitioner, and project developer involved
making priorities, time organization, persistence when dealing with adversity, the value
of stakeholder input, and embracing setbacks in addition to honing my research and
writing skills, and the learning detailed above in developing this project. My current
employment involves working hours beyond the workday, usually writing reports. I had
to learn to balance my writing responsibilities between work and this project and
prioritize those responsibilities based on due dates related to federal timelines and
semester plan goals. I had to learn to organize my time such that I still met my family
responsibilities as well. Additionally, the process to acquire access to district archived
data is quite involved and time consuming, requiring me to defend my project to the
district research committee eventually and amend my proposal and project to include
qualitative data collection and analysis, and more extensive quantitative analysis. From
what appeared to be setbacks, my project is much more comprehensive, allowing me to
develop a much better policy recommendation than I would have developed from my
original project. From this, I learned the value of stakeholder input, but also to embrace
setbacks as they are inevitably part of the project development process. Overall, my
growth as a scholar, practitioner, and project developer is substantial in a variety of ways,

105
which I have detailed. Lastly, my respect for my fellow researchers and their abilities has
grown immensely through this process.
Reflection on Importance of the Work
The purpose of this study was to assess whether there were differences in student
outcomes in Algebra I and Algebra II achievement, as measured by the Algebra I and
Algebra II EOC exam achievement scores, after implementing this school-wide
intervention and enrichment program at MHS. Also, to gather teacher impressions and
program strengths and weaknesses, using teacher interview data. The goal of the project,
based on the research results, was to develop a policy recommendation for MHS to
develop and implement a systematic process for measuring academic intervention
implementation fidelity, for the purposes of improving student academic achievement at
MHS. The need for such a policy recommendation was revealed in the teacher
interviews, where, after careful analysis, the lack of accountability and lack of fidelity
emerged as a theme. A systematic process for measuring fidelity of implementation is
necessary for continual intervention implementation improvement, necessary for the
improvement of student academic outcomes, given that the current process for academic
intervention at MHS is an RTI process (AIR, 2015; DeFouw et al., 2018; Gresham, 2017;
Harn et al., 2017; King-Sears et al., 2018; McKenna & Parenti, 2017). Should MHS
implement the policy recommendation, implementation of academic interventions should
improve, and as a result, student academic outcomes, such as academic proficiency, will
improve. Improving student academic outcomes leads to improved postsecondary and
employment opportunities for students resulting in social change (ACT, 2007).

106
Implications, Applications, and Directions for Future Research
There are both local and national implications, applications, and directions for
future research, regarding high school academic achievement and measuring fidelity of
intervention implementation. At MHS, once the policy recommendation is implemented,
fidelity and academic achievement data should continue to be collected and analyzed to
make data-driven recommendations for continued improvement of student outcomes.
Additionally, other district high schools should develop a similar systematic process, if
not already in place, for measuring implementation fidelity, collect data, and also work
toward implementation improvements to improve student academic outcomes.
The use of propensity matching in studying academic student outcomes in schools
is not widely utilized by school districts but could be more widely utilized in studies to
improve study validity by creating control groups to elevate studies to experimental
research (Pan & Bai, 2015). This analysis method allows school developed intervention
processes to be researched as experimental studies without actually conducting an
experiment and the possible harm caused to participants that are inherent in experimental
studies (see Creswell, 2012; Pan & Bai, 2015). The broader use of propensity matching
by districts could aide data-based decisions at the district level, resulting in improved
student outcomes.
Nationally, RTI and MTSS systems are being actively implemented at the
elementary level, but the implementation of these systems is not as widely utilized at the
high school level. Generally, there is much less confidence among educators on the
success of these processes at the high school level, and the lack of student motivation,

107
often perceived as an unyielding barrier to fidelity, is generally more pronounced at the
high school level (Ehren, n.d.). Given these factors, more research on the impact of
intervention implementation fidelity within these systems at the high school level would
be valuable in advancing the use of academic interventions at the high school level to
improve student outcomes.
Conclusion
This study began with a school developed math intervention and enrichment
program for all students and ended with a policy recommendation for the school to
develop and implement a systematic process for measuring fidelity to improve
intervention implementation fidelity. The journey from the beginning to the actual project
was filled with multiple learning opportunities, many unexpected. The impact of this
work and growth has the potential to improve academic outcomes for the students at
MHS, and also potentially, for students at other high schools, also struggling to
implement interventions with fidelity.
Generally, the overall experience was enlightening as I came to understand from a
research perspective, how interconnected and important all stakeholders are for school
improvement to occur. Additionally, my respect for educational researchers has grown as
I have wrestled with the complexities of this work first hand. My transformation into a
practitioner-scholar will continue as I apply what I have learned from this journey to my
current position and future opportunities, advocating for social change.

108
References
Achieve. (2015). Closing the Expectations Gap: 2014 Annual Report. Retrieved from
http://www.achieve.org/closing-expectations-gap-report-released
ACT. (2007). Benefits of a high school core curriculum for students in urban high
schools. Council of the Great City Schools and ACT, Inc. Retrieved from
http://www.act.org/research/policymakers/pdf/core_curriculum.pdf
ACT. (2015). The condition of college & career readiness 2015. ACT, Inc. Retrieved
from http://www.act.org/content/act/en/research/condition-of-college-and-career-
readiness-report-2015.html?page=0&chapter=0
Agrawal, J., & Morin, L. L. (2016). Evidence-based practices: Applications of concrete
representational abstract framework across math concepts for students with
mathematics disabilities. Learning Disabilities Research & Practice, 31(1), 34-
44. doi:10.1111/ldrp.12093
Allensworth, E. M., & Nomi, T. (2009). College-preparatory curriculum for all: The
consequences of raising mathematics graduation requirements on students’
course taking and outcomes in Chicago. Paper presented at the 2009 SREE
Conference, Washington, DC.
Allensworth, E. M., Nomi, T., Montgomery, N., & Lee, V. E. (2009). College
preparatory curriculum for all: Academic consequences of requiring Algebra and
English I for ninth graders in Chicago. Educational Evaluation and Policy
Analysis, 31(4), 367-391.
Allor, J. H., & Stokes, L. (2017). Measuring treatment fidelity with reliability and

109
validity across a program of intervention research: Practical and theoretical
considerations. In G. Roberts, S. Vaughn, S. N. Beretvas, & V. Wong (Eds.),
Treatment fidelity in studies of educational intervention (pp. 130-147). New York,
NY: Routledge.
Allsopp, D. H., Ingen, S., Simsek, O., & Haley, K. C. (2016). Building to algebra: Big
ideas, barriers, and effective practices. In B. S. Witzel (Ed.), Bridging the gap
between arithmetic & algebra (pp. 7-20). Fredericksburg, VA: Sheridan Books,
Inc.
American Institutes for Research. (2014a). RTI fidelity of implementation rubric.
Retrieved from https://files.eric.ed.gov/fulltext/ED561905.pdf
American Institutes for Research. (2014b). Promoting student success in Algebra I:
Instructional practices to support student success in Algebra I (Research Brief).
Washington, DC: T. M. Smith.
American Institutes for Research. (2015). Fidelity and implementation resources.
Retrieved from https://intensiveintervention.org/implementation-support/fidelity-
resources
Anderson, E. R. (2017). Accommodating change: Relating fidelity of implementation to
program fit in educational reforms. American Educational Research Journal,
54(6), 1288-1315. doi:10.3102/0002831217718164
Armstrong, R. A. (2014). When to use the Bonferroni correction. Journal of the College
of Optometrists, 34, 502-508.
Balu, R., & Doolittle, E. (2016). Commentary: Learning from variations in fidelity of

110
implementation. In B. Foorman (Ed.), Challenges to implementing effective
reading intervention schools. New Directions for Child and Adolescent
Development, 154, 105-108. doi:10.1002/cad.20173
Banerjee, R., & Subramaniam, K. (2012). Evolution of a teaching approach for beginning
algebra. Educational Studies in Mathematics, 80(3), 351-367.
doi:10.1007/s10649-011-9353-y
Barbieri, C., & Booth, J. L. (2016). Support for struggling students in algebra:
Contributions of incorrect worked examples. Learning and Individual
Differences, 48(1), 36-44. doi:10.1016/j.lindif.2016.04.001
Barbieri, C. A., Miller-Cotto, D., & Booth, J. L. (2019). Lessoning the load of
misconceptions: Design-based principles for algebra learning. Journal of the
Learning Sciences, 28(3), 381-417. doi:10.1080/10508406.2019.1573428
Baroudi, Z. (2015). Thinking visually about algebra. Australian Mathematics Trust,
71(1), 18-23.
Boardman, A. G., Buckley, P., Vaughn, S., Roberts, G., Scornavacco, K., & Klinger, J.
(2016). Relationship between implementation of Collaborative Strategic Reading
and student outcomes for adolescents with disabilities. Journal of Learning
Disabilities, 49, 644-657. doi:10.1177/0022219416640784
Bong, M., Lee, S. K., & Woo, Y. K. (2015). The roles of interest and self-efficacy in the
decision to pursue mathematics and science. In K.A. Renniger, M. Nieswandt, &
S. Hidi (Eds.), Interest in mathematics and science learning (pp. 33-48).
Washington, DC: AERA.

111
Booth, J. L., Barbieri, C., Eyer, F., & Pare-Blagoev, E. J. (2014). Persistent and
pernicious errors in algebraic problem solving. Journal of Problem Solving, 7(1),
10-23. doi:10.7771/1932-6246.1161
Booth, J. L., Cooper, L. A., Donovan, M. S., Huyghe, A., Koedinger, K. R., & Pare-
Blagoev, E. J. (2015). Design-based research within the constraints of practice:
Algebra by example. Journal of Education for Students Placed at Risk, 20(1-2),
79-100. doi:10.1080/10824669.2014.986674
Bouck, E. C., & Bouck, M. K. (2016). Mathematical problem-solving. In B. S. Witzel
(Ed.), Bridging the gap between arithmetic & algebra (pp. 119-137).
Fredericksburg, VA: Sheridan Books, Inc.
Brock, M. E., & Carter, E. W. (2017). A meta-analysis of educator training to improve
implementation of interventions for students with disabilities. Remedial and
Special Education, 38(3), 131-144. doi:10.1177/0741932516653477
Broderick, T. (2016, March 10). Average ACT score by state [Web log post]. Retrieved
from https://magoosh.com/hs/act/2016/average-act-score-by-state/
Carroll, C., Patterson, M., Wood, S., Booth, A., Rick, J., & Balain, S. (2007). A
conceptual framework for implementation fidelity. Implementation Science,
2(40), 1-9. doi:10.1186/1748-5908-2-40
Chodura, S., Kuhn, J. T., & Holling, H. (2015). Interventions for children with
mathematical difficulties: A meta-analysis. Zeitschrift für Psychologie, 223(2),
129-144. doi:10.1027/2151-2604/a000211
College & Career Readiness & Success. (2013). Predictors of postsecondary success.
112
College & Career Readiness & Success Center at American Institutes for
Research. Retrieved from http://www.ccrscenter.org/products-
resources/predictors-postsecondary-success
Common Core State Standards Initiative. (2015). Math standards. Retrieved from
http://www.corestandards.org/Math/
Cortes, K. E., Goodman, J. S., & Nomi, T. (2014). Intensive math instruction and
educational attainment: Long-run impacts of double-dose algebra. Journal of
Human Resources, 50(1), 108-158.
Cox, D. R. (1958). The planning of experiments. New York: Wiley.
Crawford, L., Freeman, B., Huscroft-D’Angelo, J., Fuentes, S. Q., & Higgins, K. N.
(2019). Implementation fidelity and the design of a fractions intervention.
Learning Disability Quarterly, 42(4), 217-230. doi:10.1177/0731948719840774
Creswell, J. W. (2012). Educational research: Planning, conducting, and evaluating
quantitative and qualitative research, custom edition. Boston, MA: Pearson
Education, Inc.
Cuoco, A., Goldenberg, E. P., & Mark, J. (2010). Contemporary curriculum issues:
Organizing a curriculum around mathematical habits of mind, Mathematics
Teacher, 103(9), 682-688.
Dane, A., & Schneider, B. (1998). Program integrity in primary and early secondary
prevention: Are implementation effects out of control. Clinical Psychology
Review, 18(1), 23-45. doi:10.1016/S0272-7358(97)00043-3.
Day, L. (2014). Algebra tiles Australia: A concrete, visual, area-based model (2nd ed).

113
WA: A-Z Type
DeFouw, E. R., Codding, R. S., Collier-Meek, M. A., & Gould, K. M. (2018). Examining
dimensions of treatment intensity and treatment fidelity in mathematics
intervention research for students at risk. Remedial and Special Education, 40(5),
298-312. doi:10.1177/0741932518774801
Derderian, A. (2014). Best practices in service provision in mathematics for students with
learning difficulties/high incidence disabilities (RTI, specific strategies, specific
interventions). Journal of Scientific Research & Reports, 3(20), 2665-2684.
Dhillon, S., Darrow, C., & Meyers, C. V. (2015). Introduction to implementation fidelity.
In C. V. Meyers & W. C. Brandt (Eds.), Implementation fidelity in education
research: Designer and evaluator considerations (pp. 8-22). New York, NY:
Routledge.
Didem, E., & Mehmet, T. (2019). The relationship between teacher classroom leadership
and learner autonomy: The case of EFL classrooms. Cumhuriyet International
Journal of Education, 8(3), 752-770. doi:10.30703/cje.549344
Doabler, C. T., Clarke, B., Stoolmiller, M., Kosty, D. B., Fien, H., Smolkowski, K., &
Baker, S. K. (2016). Explicit instructional interactions: Exploring the black box of
a tier 2 mathematics intervention. Remedial and Special Education, 38(2), 98-110.
doi:10.1177/0741932516654219
Domina, T., & Saldana, J. (2012). Does raising the bar level the playing field?
Mathematics curricular intensification and inequality in American high schools,
1982-2004. American Educational Research Journal, 49(4), 685-708.

114
doi:10.3102/0002831211426347
Durik, A. M., Hulleman, C. S., & Harackiewicz, J. M. (2015). One size fits some:
Instructional enhancements to promote interest. In K.A. Renniger, M. Nieswandt,
& S. Hidi (Eds.), Interest in mathematics and science learning (pp. 49-62).
Washington, DC: AERA.
Ehren, B. J. (n.d.). Response to intervention in secondary schools: Is it on your radar
screen? Retrieved from http://ww.rtinetwork.org/learn/rti-in-secondary-schools
Ewing, J. C., Foster, D. D., & Whittington, M. S. (2011). Explaining student cognition
during class sessions in the context of Piaget’s theory of cognitive development.
NACTA Journal, March, 68-75.
Executive Office of the President. (2014, January). Increasing college opportunity for
low-income students: Promising models and a call to action. Retrieved from
https://www.whitehouse.gov/sites/default/files/docs/white_house_report_on_incre
asing_college_opportunity_for_low-income_students_1-16-2014_final.pdf
Fallon, L. M., Collier-Meek, M. A., Maggin, D. M., Sanetti, L. M., & Johnson, A. H.
(2015). Is performance feedback for educators an evidence-based practice? A
systematic review and evaluation based on single-case research. Exceptional
Children, 81, 227-246. doi:10.1177/0014402914551738
Favre, D. E., & Knight, S. L. (2016). Teacher efficacy calibration in education reform:
When highly efficacious teachers don’t spell “implement.” International Journal
of Educational Reform 25(4), 361-383.
Foorman, B., Dombek, J., & Smith, K. (2016). Seven elements important to successful

115
implementation of early literacy intervention. In B. Foorman (Ed.), Challenges to
implementing effective reading intervention in schools. New Directions for Child
and Adolescent Development, 154, 49-65.
Freeman-Green, S. M., O’Brien, C., Wood, C. L., & Hitt, S. B. (2015). Effects of the
SOLVE strategy on the mathematical problem solving skills of secondary
students with learning disabilities. Learning Disabilities Research & Practice,
30(2), 76-90.
Furth, H. G., & Wachs, H. (1975). Thinking goes to school: Piaget’s theory in practice.
New York, NY: Oxford University Press.
Gaertner, M. N., Kim, J., DesJardins, S. L., & McClarty, K. L. (2014). Preparing students
for college and careers: The causal role of Algebra II. Research in Higher
Education, 55, 143-165. doi:10.1007/s11162-013-9322-7
Gash, H. (2014). Constructing constructivism. Constructivist Foundations, 9(3), 302-310.
Gash, H. (2017). Maths and neurophenomenology. Constructivist Foundations, 13(1),
182-183.
Great Schools Partnership. (2014, July 14). Re: Proficiency. Retrieved April 6, 2020,
from https://www.edglossary.org/proficiency/
Greene, J. (2016). Four ways to ensure teacher buy-in. Kickboard. Retrieved from
https://www.kickboardforschools.com
Gresham, F. M. (2017). Features of fidelity in schools and classrooms: Constructs and
measurement. In G. Roberts, S. Vaughn, S. N. Beretvas, & V. Wong (Eds.),
Treatment fidelity in studies of educational intervention (pp. 22-38). New York,
116
NY: Routledge.
Grover, V. (2016). Commentary: Implementing interventions: Building a shared
understanding of why. In B. Foorman (Ed.), Challenges to implementing effective
reading intervention schools. New Directions for Child and Adolescent
Development, 154, 109-112. doi:10.1002/cad.20174
Guo, Y., Dynia, J. M., Logan, J. A. R., Justice, L. M., Breit-Smith, A., & Kaderavek, J.
N. (2016). Fidelity of implementation of an early-literacy intervention:
Dimensionality and contribution to children’s intervention outcomes. Early
Childhood Research Quarterly, 37, 165-174. doi:10.1016/j.ecresq.2016.06.001
Harn, B. A., Damico, D. P., & Stoolmiller, M. (2017). Examining the variation of fidelity
across an intervention: Implications for measuring and evaluating student
learning. Preventing School Failure: Alternative Education for Children and
Youth, 61(4), 289-302. doi:10.1080/1045988X.2016.1275504
Harris, H., & Horst, S. J. (2016). A brief guide to decisions at each step of the propensity
score matching process. Practical Assessment, Research & Evaluation, 21(4), 1-
12. Available online: http://pareonline.net/getvn.asp?v=21&n=4
Hauk, S., Salguero, K., & Kaser, J. (2016). How “good” is “good enough”? Exploring
fidelity of implementation for a web-based activity and testing system in
developmental algebra instruction. In T. Fukawa-Conelly, N. Infante, K. Keene,
& M. Zandieh (Eds.), Proceedings of the 19th Annual Conference on Research in
Undergraduate Mathematics Education, Pittsburgh, PA.
Hegedus, S. J., Dalton, S., & Tapper, J. R. (2015). The impact of technology-enhanced

117
curriculum on learning advanced algebra in US school classrooms. Educational
Technology Research and Development, 63(2), 2013-228. doi:10.1007/s11423-
015-9371-z
Ho, D., Imai, K., King, G., & Stuart, E. (2007). Matching as nonparametric preprocessing
for reducing model dependence in parametric causal inference. Political
Analysis, 15(3): 199-236.
Hughes, E. M. (2016). Core algebra instruction. In B. S. Witzel (Ed.), Bridging the gap
between arithmetic & algebra (pp. 51-67). Fredericksburg, VA: Sheridan Books,
Inc.
Hunt, J. H., & Little, M. E. (2014). Intensifying interventions for students by identifying
and remediating conceptual understandings in mathematics. TEACHING
Exceptional Children, 46(6), 187-196. doi:10.1177/0040059914534617
IAC Publishing. (2017). Reference: What is enrichment in education? Retrieved from
https://www.reference.com/education/enrichment-education-97b82e3ee6d27452
Ibrahim, S., & Sidani, S. (2015). Fidelity of intervention implementation: A review of
instruments. Health, 7, 1687-1693. DOI: 10.4236/health.2015.712183
Inhelder, B., & Piaget, J. (1958). The growth of logical thinking: From childhood to
adolescence. New York, NY, US: Basic Books. doi:10.1037/10034-018
Institute of Education Sciences. (n.d.). What works clearinghouse: Find what works:
Mathematics achievement. Retrieved from
http://ies.ed.gov/ncee/wwc/findwhatworks.aspx
Irving, K. E., Pape, S. J., Owens, D. T., Abrahamson, L., Dilver, D., & Sanalan, V. A.

118
(2016). Classroom connectivity and Algebra I achievement: A three-year
longitudinal study. Journal of Computers in Mathematics and Science Teaching,
35(2), 131-151.
Jefferson, C. (2013). Organizational change plan for Hillwood High School. Unpublished
manuscript, Lipscomb University, Nashville, TN.
Kasmer, L. A., & Kim, O. K. (2012). The nature of student predictions and learning
opportunities in middle school algebra. Educational Studies in Mathematics,
79(2), 175-191. doi:10.1007/s10649-011-9336-z
Katz, V. J. (2007). Stages in the history of algebra with implications for teaching.
Educational Studies in Mathematics, 66, 185-201. doi:10.1007/s10649-006-9023-
7
Killion, J. (2016). Implementation fidelity affects the degree of change in teacher
practice. JSD, 37(3), 56-59.
Kim, S., Chang, M., Choi, N., Park, J., & Kim, H. (2016). The direct and indirect effects
of computer uses on student success in math. International Journal of Cyber
Behavior, Psychology and Learning, 6(3), 48-64.
doi:10.4018/IJCBPL.2016070104
Kim, J., Kim, J., DesJardins, S. L., & McCall, B. P. (2015a). Completing Algebra II in
high school: Does it increase college access and success? The Journal of Higher
Education, 86(4), 628-662.
Kim, S., Jiang, Y., & Song, J. (2015b). The effects of interest and utility value on
mathematics engagement and achievement. In K.A. Renniger, M. Nieswandt, &

119
S. Hidi (Eds.), Interest in mathematics and science learning (pp. 63-78).
Washington, DC: AERA.
King-Sears, M. E., Walker, J. D., & Barry, C. (2018). Measuring teachers’ intervention
fidelity. Intervention in School and Clinic, 54(2), 89-96.
doi:10.1177/1053451218765229
Kisa, Z., & Correnti, R. (2015). Examining implementation fidelity in America’s Choice
schools: A longitudinal analysis of changes in professional development
associated with changes in teacher practice. Educational Evaluation and Policy
Analysis, 37(4), 437-457. doi:10.3102/0162373714557519
Kolluri, S. (2018). Advanced placement: The dual challenge of equal access and
effectiveness. Review of Educational Research, 88(5), 671-711.
doi:10.3102/0034654318787268
Kosovich, J. J. (2013). Assessing intervention fidelity in a randomized field experiment:
Illuminating the black box. Unpublished master’s these, James Madison
University: Harrisonburg, VA.
Krawec, J., Huang, J., Montague, M., Kressler, B., & de Alba, A. M. (2012). The effects
of cognitive instruction on knowledge of math problem-solving processes of
middle school students with learning disabilities. Learning Disability Quarterly,
36(2), 80-92. doi:10.1177/0731948712463368
Lakin, J. M., & Rambo-Hernandez, K. (2019). Fidelity of implementation: Understanding
why and when programs work. Gifted Child Today, 42(4), 205-214.
doi:10.1177/1076217519862327

120
LaRusso, M. D., Donovan, S., & Snow, C. (2016). Implementation challenges for tier one
and tier two school-based programs for early adolescents. New Directions for
Child & Adolescent Development, 6(154), 11-30. doi:10.1002/cad.20179
Lee, Y. (2019, September 26). Re: What is academic performance? [Online forum
comment]. Retrieved from https://www.quora.com/What-is-academic-
performance
Lembke, E. S., Strickland, T. K., & Powell, S. R. (2016). Monitoring student progress to
determine instructional effectiveness. In B. S. Witzel (Ed.), Bridging the gap
between arithmetic & algebra (pp. 7-20). Fredericksburg, VA: Sheridan Books,
Inc.
Lewis, C. C., Fischer, S., Weiner, B. J., Stanick, C., Kim, M., & Martinez, R. G. (2015).
Outcomes for implementation science: An enhanced systematic review of
instruments using evidence-based rating criteria. Implementation Science,
10(155). doi:10.1186/s13012-015-0342-x
Linsell, C., Cavanaugh, M., & Tahir, S. (2013). Using meaningful contexts to promote
understanding of pronumerals. Australian Mathematical Trust, 69(1), 33-40.
Little, M. E., & Dieker, L. A. (2016). Intensifying instruction and interventions within
multi-tiered systems of support. In B. S. Witzel (Ed.), Bridging the gap between
arithmetic & algebra (pp. 7-20). Fredericksburg, VA: Sheridan Books, Inc.
Lodico, M. G., Spaulding, D. T., & Voegtle, K. H. (2006). Methods in educational
research: From theory to practice. San Francisco, CA: Jossey-Bass.
Lynch, K., & Star, J. (2016). Teachers’ views about multiple strategies in middle and

121
high school mathematics. Mathematical Thinking and Learning, 16(2), 85-108.
doi:10.1080/10986065.2014.889501
Maenpaa, M. (2013). Using multiplication grids within algebra. Australian Mathematics
Trust, 69(1), 8-9.
Mages, W. K. (2017). Practice makes perfectible: The impact of training and rehearsal on
program fidelity. Youth Theatre Journal, 31(1), 7-22.
doi:10.1080/08929092.2017.1298542
Massey, D., & Riley, L. (2013). Reading math textbooks: An algebra teacher’s patterns
of thinking. Journal of Adolescent & Adult Literacy, 56(7), 577-586.
doi:10.1002/JAAL.187
Mathnasium. (2018, October 2). Re: What is integrated math or “IM?” [Web log
comment]. Retrieved from https://www.mathnasium.com/pointloma-news-what-
is-integrated-math-or-im
Matsura, R., Sword, S., Piecham, M., Stevens, G., & Cuoco, A. (2013). Mathematical
habits of mind for teaching: Using language in algebra classrooms. The
Mathematics Enthusiast, 10(3), 735-776.
Matthews, J. S. (2018). When am I ever going to use this in the real world? Cognitive
flexibility and urban adolescents’ negotiation of the value of mathematics.
Journal of Educational Psychology, 110(5), 726-746. doi:10.1037/edu0000242
Mazzeo, C. (2010). College prep for all? What we’ve learned from Chicago’s efforts.
Policy Brief, 1-13. Retrieved from http://ccsr.uchicago.edu/publications/college-
prep-all-what-weve-learned-chicagos-efforts

122
McIntosh, K., & Goodman, S. (2016). Integrated multi-tiered systems of support:
Blending RTI and PBIS. New York, NY: The Guilford Press.
McKenna, J., & Ciullo, S. (2016). Typical reading instructional practices provided to
students with emotional and behavioral disorders in a residential and day school:
A mixed methods study. Residential Treatment for Children & Youth, (33), 225-
246. doi:10.1080/0886571X.2016.1207217
McKenna, J. W., & Parenti, M. (2017). Fidelity assessment to improve teacher
instruction and school decision making. Journal of Applied School Psychology,
33(4), 331-346. doi:10.1080/15377903.2017.1316334
Metro Nashville Public Schools. (n.d.). Program Profile. Retrieved from Data
Warehouse, November 11, 2016.
Meyers, C. V., & Brandt, W. C. (2015). Introducing this book on implementation fidelity
in education research. In C. V. Meyers & W. C. Brandt (Eds.), Implementation
Fidelity in Education Research: Designer and Evaluator Considerations (pp. 1-
7). New York, NY: Routledge.
Michan, C. (2016, April 1). Uncovering mass incarceration’s literacy disparity: Literacy
is a key metric for how our society sets some groups up to fail [Web Briefing].
Retrieved from https://www.prisonpolicy.org/blog/2016/04/01/literacy/
Missett, T. C., & Foster, L. H. (2015). Searching for evidence-based practice: A survey of
empirical studies on curricular interventions measuring and reporting fidelity of
implementation published during 2004-2013. Journal of Advanced Academics,
26(2), 96-111. doi:10.1177/1932202X15577206

123
Montague, M., & Jitendra, A. K. (2012). Research-based mathematics instruction for
students with learning disabilities. In H. Forgasz & F. Rivera (Eds.), Towards
equity in mathematics education: Gender, culture, and diversity (pp. 481-502).
Springer Berlin Heidelberg. doi:10.1007/978-3-642-27702-3_44
Murrah, W. M., Kosovich, J., & Hulleman, C. (2017). A framework for incorporating
intervention fidelity in educational evaluation studies. In G. Robers, S. Vaughn, S.
N. Beretvas, & V. Wong (Eds.), Treatment Fidelity in Studies of Educational
Intervention (pp. 39-60). New York, NY: Routledge.
Narode, R. B. (1987, January). Constructivism in math and science instruction. Retrieved
from ERIC database. (ED290616).
National Center for Education Evaluation and Regional Assistance. (2015, April).
Teaching strategies for improving algebra knowledge in middle and high school
students. Retrieved from http://ies.ed.gov/ncee/wwc/PracticeGuide/20
National Center for Education Statistics. (2015). The NAEP achievement levels by grade.
Retrieved from https://nces.ed.gov/nationsreportcard/mathematics/achieve.aspx
National Council of Teachers of Mathematics. (2014). Principles to actions: Ensuring
mathematical success for all. Reston, VA: S. Leinwand, D. J. Brahier, & D.
Huinaker.
Nelson, M. C., Cordray, D. S., Hulleman, C. S., Darrow, C. L., & Sommer, E. C. (2012).
A procedure for assessing intervention fidelity in experiments testing educational
and behavioral interventions. The Journal of Behavioral Health Services &
Research, 39(4), 374-396. doi:10.1007/s11414-012-9295-x

124
Nelson, P. M., Van Norman, E. R., Parker, D. C., & Cormier, D. C. (2019). An
examination of interventionist implementation fidelity and content knowledge as
predictors of math intervention effectiveness. Journal of Applied School
Psychology, 35(3), 234-256.
Niaz, M. (1989). Translation of algebraic equations and its relation to formal
operational reasoning. Paper presented at the 62nd Annual Meeting of the
National Association for Research in Science Teaching, San Francisco, CA,
March 30 – April 1, 1989.
Nicholas, J., & Gulliford, M. C. (2008). Commentary: What is a propensity score? British
Journal of General Practice, 58(555), 687. doi:10.3399/bjgp08X342471
Nomi, T. (2010). The unintended consequences of an Algebra-for-All policy on high-skill
students: The effects on instructional organization and students’ academic
outcomes. Paper presented at the 2010 SREE Conference, Washington, DC,
March 4 – March 6, 2010.
Nomi, T., & Raudenbush, S. W. (2016). Making a success of “algebra for all”.
Educational Evaluation & Policy Analysis, 38(2), 431-451.
Ojose, B. (2008). Applying Piaget’s theory of cognitive development to mathematics
instruction. The Mathematics Educator, 18(1), 26-30.
OSEP Technical Assistance Center on Positive Behavioral Interventions and Supports.
(2015a). Positive behavioral interventions and supports implementation
blueprint: Part 1 – Foundations and support information. Retrieved from
http://www.pbis.org

125
Pan, W., & Bai, H. (Ed.). (2015) Propensity Score Analysis: Fundamentals and
Developments. New York, NY: Guildford Press.
Pape, S. J., Irving, K. E., Owens, D. T., Boscardin, C. K., Sanalan, V. A., Abrahamson,
A. L., Kaya, S., Shin, H. S., & Silver, D. (2013). Classroom connectivity in
Algebra I classrooms: Results of a randomized trial. Effective Education, 2(4), 1-
21. doi:10.1080/19415532.2013.841059
Patterson, L. G., & Musselman, M. (2015). Response to intervention in middle and high
school mathematics. In P. Epler (Ed.), Examining response to intervention (RTI)
models in secondary intervention (pp. 129-155). Hershey, PA: IGI Global.
doi:10.4018/978-1-4666-8516-1.ch006
Pitt, J., & Kirkwood, K. (2010). How can I improve junior level mathematics
achievement using constructivism? The Ontario Action Researcher, 10(3), 1-7.
Powell, S. R., Fuchs, L. S., & Fuchs, D. (2013). Reaching the mountaintop: Addressing
the Common Core Standards in mathematics for students with mathematics
difficulties. Learning Disabilities Research & Practice, 28(1), 38-48.
Prendergast, M., & Donoghue, J. (2014). ‘Students enjoyed and talked about the classes
in the corridors’: Pedagogical framework promoting interest in algebra.
International Journal of Mathematical Education in Science and Technology,
46(6), 795-812. doi:10.1080/0020739X.2013.877603
Prendergast, M., & Treacy, P. (2018). Curriculum reform in Irish secondary schools – A
focus on algebra. Journal of Curriculum Studies, 50(1), 125-143.
doi:10.1080/00220272

126
Purwadi, M. A., Sudiarta, G. P., & Suparta, I. N. (2019). The effect of Concrete-Pictorial-
Abstract strategy toward students’ mathematical conceptual understanding and
mathematical representation of fractions. International Journal of Instruction,
12(1), 1113-1126.
Quinn, D. M., & Kim, J. S. (2017). Scaffolding fidelity and adaptation in educational
program implementation: Experimental evidence from a literacy intervention.
American Educational Research Journal, 54(6), 1187-1220.
doi:10.3102/0002831217717692
Rakes, C. R., Valentine, J. C., McGatha, M. B., & Ronau, R. N. (2010). Methods of
instructional improvement in algebra: A systematic review and meta-analysis.
Review of Educational Research, 80(3), 372-400.
doi:10.3102/0034654310374880
Regional Education Laboratory West. (2015). Opening a gateway to college access:
Algebra at the right time (Research Brief). San Francisco, CA: WestEd: J. Snipes
& N. Finkelstein.
Roberts, G. (2017). Implementation fidelity and educational science: An introduction. In
G. Roberts, S. Vaughn, S. N. Beretvas, & V. Wong (Eds.), Treatment Fidelity in
Studies of Educational Intervention (pp. 1-21). New York, NY: Routledge.
Sarfo, F. K., Eshun, G., Elen, J., & Adentwi, K. I. (2014). Towards the solution of
abysmal performance in mathematics in junior high schools: Comparing the
pedagogical potential of two designed interventions. Electronic Journal of
Research in Educational Psychology, 12(3), 763-784.

127
Schachter, R. (2013). Solving our algebra problem: Getting all students through Algebra I
to improve graduation rates. District Administration, May, 43-46.
Schechter, R. L., Kazakoff, E. R., Bundschuh, K., Prescott, J. E., & Macaruso, P. (2017).
Exploring the impact of engaged teachers on implementation fidelity and reading
skill gains in a blended learning reading program. Reading Psychology, 38(6),
553-579. doi:10.1080/02702711.2017.1306602
Schuler-Meyer, A. (2017). Student’s development of structure sense for the distributive
law. Educational Studies in Mathematics, 96, 17-32. doi:10.1007/s10649-017-
9765-4
Seeley, C. L. (2016a). Making Sense of math: How to help every student become a
mathematical thinker and problem solver. Alexandria, VA: ASCD.
Seeley, C. L. (2016b). Building a math-positive culture: How to support great math
teaching in your school. Alexandria, VA: ASCD.
Sharma, R. K. (2014). Constructivism – An approach to enhance participatory teaching
learning. Gyanodaya, 7(2), 12-17.
Siegler, R. S., Duncan, G. J., Davis-Kean, P. E., Duckworth, K., Claessens, A., Engel,
M., Susperreguy, M. I., & Chen, M. (2012). Early predictors of high school
mathematics achievement. Psychological Science, 23(7), 691-697.
doi:10.1177/095679761244010
Simon, T., Stoelinga, T. M., Bush-Richards, A. M., De Sena, D. L., & Dwyer, T. J.
(2018). An intensification approach to double-block algebra: A pilot
implementation of intensified algebra in a large urban school district. Journal of

128
Education Research, 111(1), 95-107. doi:10.1080/00220671.2016.1209454
Slavich, G. M., & Zimbardo, P. G. (2012). Transformational teaching: Theoretical
underpinnings, basic principles, and core methods. Educational Psychology
Review, 24, 569-608. doi:10.1007/s10648-012-9199-6l
Statistics Solutions. (n.d.). The assumptions of homogeneity of variance [Web log post].
Retrieved from https://www.statisticssolutions.com/the-assumption-of-
homogeneity-of-variance/
Stetler, C. B., Legro, M. W., Wallace, C. M., Bowman, C., Guihan, M., Hagedorn, H.,
Kimmel, B., Sharp, N. D., & Smith, J. L. (2006). The role of formative evaluation
in implementation research and the QUERI experience. Journal of General
Internal Medicine, 21(2), 1-8. doi:10.1111/j.1525-1497.2006.00355.x
Sugai, G., Simonsen, B., Freeman, J., & La Salle, J. (2016). Capacity development and
multi-tiered systems of support: Guiding principles. Australasian Journal of
Special Education, 40(2). 80-98. doi:10.1017/jse.2016.11
Tahir, A. Q. (2010). Constructivism as instructional model of science teaching. Journal
of Educational Research, 13(1), 6-19.
Tennessee Department of Education. (n.d.-a). Report Card. Retrieved from
http://www.tn.gov/education/data/report_card/index.shtml
Tennessee Department of Education. (n.d.-b). Response to Instruction and Intervention
Framework. Retrieved from https://www.tn.gov/content/dam/tn/education/special-
education/rti/rti2_manual.pdf
Tennessee Department of Education. (2016). Response to Instruction and Intervention

129
Implementation Guide. Retrieved from
https://preprod.tn.gov/content/dam/tn/education/special-
education/rti/rti2_implementation_guide.pdf
Thomas, G. (2018). Teacher assessments of school-wide positive behavioral interventions
and supports (Unpublished doctoral dissertation). Walden University,
Minneapolis, MN.
Torbeyns, J., Schneider, M., Xin, Z., & Siegler, R. S. (2015). Bridging the gap: Fraction
understanding is central to mathematics achievement in students from three
different continents. Learning and Instruction, 37(6), 5-13.
Triola, M. F. (2012). Elementary statistics, custom edition. San Francisco, CA: Pearson
Education, Inc.
Troyer, M. (2017). Teacher implementation of an adolescent reading program. Teaching
and Teacher Education, 65, 21-33. doi:10.1016/j.tate.2017.03.005
Turner, J. C., Kackar-Cam, H. Z., & Trucano, M. (2015). Teachers learning how to
support student interest in mathematics and science. In K.A. Renniger, M.
Nieswandt, & S. Hidi (Eds.), Interest in mathematics and science learning (pp.
243-257). Washington, DC: AERA.
U.S. Department of Education, Institute or Education Services, National Center for
Education Statistics, & National Assessment of Educational Progress. (2013).
Mathematics and reading: Grade 12 assessments. Retrieved from
http://www.nationsreportcard.gov/reading_math_g12_2013/#/
U.S. Department of Education, Office of Planning, Evaluation and Policy Development,

130
Performance Information Service. (2012). Free and Reduced-Price Lunch
Eligibility Data in EDFacts: A White Paper on Current Status and Potential
Changes, Washington D.C., 2012.
Van Baxtel, J. M. (2016). Reason: A self-instruction strategy for twice-exceptional
learners struggling with Common Core mathematics. TEACHING Exceptional
Children, 49(1), 66-73. doi:10.1177/0040049916662252
VanDerHeyden, A., & Allsopp, D. (2014). Innovation configuration for mathematics
(Document No. IC-6). Retrieved from University of Florida, Collaboration for
Effective Educator, Development, Accountability, and Reform Center website:
http://ceedar.education.ufl.edu/tools/innovation-configuration/
Vaughn, S., & Fletcher, J. M. (2012). Response to intervention with secondary school
students with reading difficulties. Journal of Learning Disabilities, 45(3), 244-
256. doi:10.1177/0022219412442157
Vaughn, S., & Swanson, E. A. (2015). Special education research advances knowledge in
education. Exceptional Children, 82(1), 11-24. DOI: 10.1177/0014402915598781
Walker, J., & Hott, B. (2016). Navigating the manifestation determination process: A
teacher’s perspective. Beyond Behavior, 24(3), 38-48.
doi:10.1177/107429561502400306
Walkington, C. (2013). Using learning technologies to personalize instruction to student
interests: The impact of relevant contexts on performance and learning outcomes.
Journal of Educational Psychology, 105(4), 932–945. doi:10.1037/ a0031882
Walkington, C., & Bernacki, M. L. (2018). Personalization of instruction: Design

131
dimensions & implications for cognition. Journal of Experimental Education,
86(1), 50-68. doi:10.80/00220973.2017.1380590
Walkington, C., Clinton, V., & Shivraj, P. (2018). How readability factors are
differentially associated with performance for students of different backgrounds
when solving mathematics word problems. American Education Research
Journal, 55(2), 362-414. doi:10.3102/00028312177737028
Wei, X., Lenz, K. B., & Blackorby, J. (2016). Math growth trajectories of students with
disabilities: Disability category, gender, racial, and socioeconomic status
differences from ages 7 to 17. Remedial and Special Education, 34(3), 154-165.
doi:10.1177/0741932512448253
Whaley, K. A. (2012). Using students’ interests as algebraic models. Mathematics
Teaching in the Middle School, 17(6), 372-378.
Whorley, J., & Naresh, N. (2014, November). Heterogeneous peer-tutoring: An
intervention that fosters collaborations and empowers learners. Middle School
Journal, 26-32.
Wilder, S. (2013). Algebra: The key to student success, or just another hurdle? Ohio
Journal of School Mathematics (67), 48-56.
Wilkie, K. J. (2014). Learning to like algebra through looking: Developing upper primary
students’ functional thinking with visualisations of growing patterns. Australian
Primary Mathematics Classroom, 19(4), 24-33.
Wilson, J. P. (2016). Defining Tennessee education: A glossary of education terms,
Volume I. Retrieved from http://www.comptroller.tn.gov/OREA/
132
Wittmann, M. C., Flood, V. J., & Black, K. E. (2013). Algebraic manipulation as motion
within a landscape. Educational Studies in Mathematics, 82(2), 169-181.
doi:10.1007/s10649-012-9428-2
Witzel, B. S. (2016). Students with math difficulties and the arithmetic to algebra gap. In
B. S. Witzel (Ed.), Bridging the gap between arithmetic & algebra (pp. 7-20).
Fredericksburg, VA: Sheridan Books, Inc.
Xin, Y. P., Zhang, D., Park, J. Y., Tom, K., Whipple, A., & Si, L. (2011). A comparison
of two mathematics problem-solving strategies: Facilitate algebra-readiness. The
Journal of Educational Research, 104(6), 381-395.
doi:10.1080/00220671.2010.487080
Yeaton, W. H., & Sechrest, L. (1981). Critical dimensions in the choice and maintenance
of successful treatments: Strength, integrity, and effectiveness. Journal of
Consulting and Clinical Psychology, 49(2), 156-167. doi:10.1037//0022-
006X.49.2.156

133
Appendix A: The Project
Implementing Fidelity Assessment into the Intervention Process
A Policy Recommendation White Paper
Lisa Garrett
Walden University

134
Project Table of Contents
Introduction of the Local Problem ...................................................................................136
Method .............................................................................................................................137
Research Questions ....................................................................................................137
Data Collection ..........................................................................................................139
Analysis and Results ..................................................................................................139
Explanation of the Results .........................................................................................143
Review of Literature ........................................................................................................146
Classroom Applications .............................................................................................147
Measuring Fidelity .....................................................................................................150
Fidelity Assessment Tools .........................................................................................152
Recommendations for Improving Implementation Fidelity ............................................153
School Leadership Team............................................................................................154
Teacher Buy-In ..........................................................................................................156
Policy Implementation .....................................................................................................157
Monitoring Implementation Fidelity..........................................................................158
Student Factors...........................................................................................................161
Conclusion .......................................................................................................................162
References ........................................................................................................................164
Project Appendix A: Intervention Walk-Through ...........................................................169
Project Appendix B: Five-Minute Direct Observation ....................................................170
Project Appendix C: Direct Observation Rubric .............................................................171

135
Project Appendix D: Observation Checklist..…………………………………………..173
Project Appendix E: Fidelity Checklist ...........................................................................174
Project Appendix F: Intervention Log .............................................................................176
Project Appendix G: Intervention and Attendance Log ..................................................178
Project Appendix H: Sample Parent Letter for Reading Intervention .............................179
Project Appendix I: Sample Parent Letter for Math Intervention....................................180
Project Appendix J: Sample Progress Monitoring Letter for Reading Intervention ........181
Project Appendix K: Sample Progress Monitoring Letter for Math Intervention ...........183

136
Introduction of the Local Problem
Midtown High School (MHS), a pseudonym for an urban high school located in
Tennessee, developed and implemented a school-wide intervention and enrichment
program, during the 2014-2015 school year, to improve student math achievement in
response to underachievement in comparison to other TN high schools (Jefferson, 2013;
TDOE, n.d.-a). On average, in TN, 63.4% of students scored proficient or higher on the
Algebra I EOC in 2014, while only 47.9% of students scored proficient or higher on the
Algebra II EOC (TDOE, n.d.-a). MHS fell below that state average, with 47.2% of
students scoring proficient or higher on the Algebra I EOC in 2014 and 39.9% of students
scoring proficient or higher on the Algebra II EOC (TDOE, n.d.-a). Additionally, an
examination of Algebra I proficiency trends indicated MHS had a higher percentage of
students scoring Below Basic than both the district and the state and a much lower
percentage of students scoring Advanced than the state in both 2013 and 2014 (TDOE,
n.d.-a). An examination of Algebra II proficiency trends yielded similar results; MHS had
a higher percentage of students scoring Below Basic than both the district and the state
and a lower percentage of students scoring Advanced than the district in both 2013 and
2014 (TDOE, n.d.-a).
The implemented intervention and enrichment program was designed to address
student under-preparedness and lack of motivation for mathematics achievement
(Jefferson, 2013). The school’s goal was to improve student math proficiency (i.e., Below
Basic, Basic, Proficient, and Advanced) on math EOC exams (Jefferson, (personal
communication, May 15, 2015). The program used a tiered approach based on students’

137
previous year-end state math assessment scores with more advanced students receiving
math enrichment activities designed to hone problem solving skills while demonstrating
relevance. Struggling students received targeted intervention dependent on their needs,
ranging from computer-based basic skills instruction to re-teaching grade-level skills.
However, the effectiveness of the program was unknown, either as a whole or as by
specific subgroups: gender, students served by special education, ethnicity, English
language (ELL) learners, and economically disadvantaged students.
Quantitative research was conducted to determine the significance of the change
in student math achievement, as a whole as, well as by subgroup, after the
implementation of the intervention and enrichment program, using the 2014-2015 EOC
results. Three math teachers from the 2014-2015 school year were interviewed to obtain
their input on the impact of the intervention and enrichment program. The interview
results indicated varied beliefs regarding the program’s effectiveness; however, the main
theme was problems with implementation fidelity of the program. Therefore, MHS could
benefit from focusing more efforts on implementation fidelity of math and other
interventions being conducted within the school. This policy recommendation focuses on
simple practices at the school level to improve the implementation fidelity of intervention
programs.
Method
Research Questions
MHS implemented a school-wide math intervention and enrichment program, to
improve student achievement as measured by the end of Course (EOC) state assessment

138
results for Algebra I and Algebra II. The effectiveness of the program was unknown, as a
whole or by subgroups: gender, students served by special education, ethnicity, and
economically disadvantaged students. These efforts were a priority as MHS’s math
achievement fell below that of the state and district averages, and improvement was
essential to prepare students for postsecondary opportunities. This policy
recommendation was formed based on the findings from these research questions:
1. What is the difference in student achievement as measured by the Algebra I
EOC from the 2014-2015 school year, the year after the school-wide
intervention and enrichment program was implemented, and the 2013-2014
school year, the year before implementation?
2. What is the difference in student achievement as measured by the Algebra II
EOC from the 2014-2015 school year, the year after the school-wide
intervention and enrichment program was implemented, and the 2013-2014
school year, the year before implementation?
3. What is the difference in student achievement as measured by the Algebra II
EOC from the 2015-2016 school year, two years after the school-wide
intervention and enrichment program was implemented, and as the 2013-2014
school year, the year before implementation?
4. What are MHS math teachers’ perceptions of the efficacy of the intervention
and enrichment program?
A mixed-methods approach was used to address the research questions. Specifically,
quantitative archival data was evaluated along with qualitative data collected through

139
teacher interviews. The purpose was to determine the effectiveness of the intervention
program implemented in 2014 to improve math performance and then recommend
improvements to the intervention and enrichment program based on findings.
Data Collection
This policy recommendation is derived from both the quantitative data analysis
results and the qualitative thematic analysis of the teacher interviews. Based on teacher
input, as well as Algebra EOC results, the intent is to improve the implementation of
interventions such that student achievement improvements are more fully realized at
MHS. The quantitative data was archived EOC Algebra I and Algebra II assessment
results. Interview data were collected from three math teachers who provided math
intervention during the 2014-2015 school year.
Analysis and Results
The quantitative data were analyzed using inferential statistics. Propensity
matching was used to minimize selection bias and to ensure that treatment and control
groups were equated on key covariates. Factorial analysis of variance (ANOVA) tests
were used to analyze the EOC Algebra state assessment data; specifically, the group
means. The qualitative data collected from the teacher interviews were coded and
analyzed for themes. The quantitative and qualitative results were compared for
triangulation purposes. Both quantitative and qualitative results were used to answer the
research questions.
To better determine the impact of the intervention and enrichment program,
propensity matching using districtwide data was performed to form a comparison group.
140
1:1 propensity score nearest neighbor matches without replacement was used to match
students using the following key variables: ethnicity, gender, course enrollment,
projected EOC score, special education status, 8th grade TCAP math score, and
socioeconomic status (see Harris & Horst, 2016). Student level matching helped establish
baseline equivalence by statistically controlling for key variables such as grade, gender,
ethnicity, free and reduced lunch, and student achievement. The large pool of comparison
students within the district increased the likelihood of constructing a valid, well matched
comparison group (see Harris & Horst, 2016).
RQ1 Results. There were three subparts to research question one given the
covariates of gender, ethnicity, special education status, and socioeconomic status. Given
there were more than one statistical analyses conducted using the same set of data, the
Bonferroni method was used to determine the alpha level to avoid a type I error, falsely
flagging a significant result (Armstrong, 2014). Since there were three analyses of
variances conducted for RQ1, an alpha level of .02 was used to determine significance for
each analysis of variance. The first research question subpart 1 (RQ1.1), a 2 x 2 x 4 three-
way analysis of variance was conducted to investigate the treatment effect based on
group (treatment, control), gender (male, female), and ethnicity (White, Black, Hispanic,
Asian). The outcome variable was the actual EOC Algebra I score from the 2014-15
testing year. The main effect of group was significant, F(1,403) = 12.91, p = .00, the
main effect of ethnicity was significant, F(3,403) = 8.50, p = .00, and the main effect of
gender was not significant, F(1,403) = .04, p = .835. Given that group only had two
levels, post-hoc testing was not required. The treatment group performed significantly

141
lower than the control group on the actual Algebra I EOC state assessment (M = 40.99
and M = 52.26, respectively). The main effect of ethnicity had four levels; therefore, post-
hoc testing based on Tukey was conducted. Results of the post-hoc testing indicated that
black students scored significantly lower than all other ethnicity groups. There were no
other group differences based on ethnicity.
The first research question subpart 2 (RQ1.2), a 2 x 2 x 2 three-way analysis of
variance was conducted to investigate the treatment effect based on group (treatment,
control), gender (male, female), and special education status (no, yes). The outcome
variable was the actual EOC Algebra I score from the 2014-15 testing year. The main
effect of special education status was significant, F(1,411) = 9.10, p = .00. The main
effects of group and gender were not significant. Given that special education status only
had two levels, post-hoc testing was not required. The students not considered with any
special education status performed significantly higher than the students who were
considered eligible for a special education status on the actual Algebra I EOC state
assessment (M = 43.90 and M = 23.82 respectively).
The first research question subpart 3 (RQ1.3), a 2 x 2 x 2 three-way analysis of
variance was conducted to investigate the treatment effect based on group (treatment,
control), gender (male, female), and socioeconomic status (no, yes). The outcome
variable was the actual EOC Algebra I score from the 2014-15 testing year. The main
effect of group was significant, F(1,411) = 27.71, p = .00. The main effect of
socioeconomic status was not significant, F(1,411) = 4.79, p = .03. The results (p = .03)
could not be considered significant given the conservative p-value used for significance

142
.02. The main effect of gender was not significant. Given that group and special
education status only had two levels, post-hoc testing was not required. The students not
considered with any financial aid need-based status performed significantly higher than
the students who were considered eligible for financial assistance, based status on the
actual Algebra I EOC state assessment (M = 45.82 and M = 40.52 respectively).
Additionally, as related to treatment versus control group after controlling for
socioeconomic status, students in the control group outperformed students in the
treatment group on the actual Algebra I EOC state assessment (M = 49.55 and M = 36.80
respectively).
RQ2 Results. Due to the violation of homogeneity of variance when considering
ethnicity, special education status, and socioeconomic status, these variables were not
investigated for this research question. In answering research question two (RQ2), a 2 x 2
two-way analysis of variance was conducted to investigate the treatment effect based on
group (treatment, control), and gender (male, female). The outcome variable was the
actual EOC Algebra II state assessment score from the 2014-15 testing year. The main
effects of group and gender were not significant.
RQ3 Results. Due to the violation of homogeneity of variance when considering
ethnicity, special education status, and socioeconomic status, these variables were not
investigated for this research question. Furthermore, the small sample size available for
this research question did not lend itself to sub-group analyses beyond gender. In
answering research question three (RQ3), a 2 x 2 two-way analysis of variance was
conducted to investigate the treatment effect based on group (treatment, control), and
143
gender (male, female). The outcome variable was the actual EOC Algebra II state
assessment score from the 2015-16 testing year. The main effects of group and gender
were not significant.
RQ4. Three math teachers were interviewed, and the interviews were transcribed
and analyzed. The teachers were all actively engaged in the interview and appeared
interested and, at times, passionate in their responses. They all appeared to hold to
specific personal beliefs about their craft and defended their beliefs at length. As a result,
interviews were considered reliable, and no information provided was not included in the
analysis. Analysis of the results revealed a few distinct themes; however, the central
theme was the trouble with the implementation fidelity of the intervention and
enrichment program. This theme was discussed throughout the interviews, particularly by
Teacher 2 and Teacher 3, concerning the enrichment aspect of the program, as well as
teacher accountability and teacher buy-in. Another major theme was the effectiveness for
lower-performing math students, which surfaced across questions. Specific things
mentioned were improved course engagement for these students and useful elements such
as Study Island, teacher scaffolding of interventions to coursework to fill in gaps, and a
greater understanding of multiple methods for problem solving. Additionally, the
enrichment sessions were not generally considered effective according to the teachers’
reports for various reasons.
Explanation of the Results
From the quantitative analysis results, the main effects have been identified, and
from the qualitative results, major themes emerged. Based on these results, strengths and

144
weaknesses were identified and compared to identify changes needed to improve
academic intervention at MHS. The explanation of the results in this regard follows.
RQ1. Based on the quantitative results, the intervention and enrichment program
did not result in positive change for Algebra I performance on the EOC state assessment.
In fact, the treatment group performed significantly lower than the control group, even
after controlling for socioeconomic status. While this may appear as if the treatment had
a harmful effect, this cannot be assumed as MHS was performing below the district prior
to treatment implementation, as they had a higher percentage of students scoring Below
Basic than the district the previous two years (TDOE, n.d.-a). It was found that black
students performed significantly lower than all other ethnic groups, again consistent with
past performance. It should be acknowledged that there were no differences between the
other ethnicities. Given that over 10% of students at MHS are Hispanic, this should be
considered positive, especially since some of these students are EL students (TDOE, n.d.-
a). Students receiving special education services were found to perform significantly
below students not receiving special education services, consistent with past
performance. Also, students eligible for financial assistance performed below those not
eligible for financial assistance, again consistent with past performance. Also, it was
positive that no difference was found between genders, suggesting equal performance for
male and female students. Therefore, these results suggested that the treatment caused no
positive change in Algebra I achievement; however, Hispanic student performance was
consistent or higher than other ethnicities, and the performance of males and females
could be considered equivalent.
145
RQ2. Generally, it was found that the program or treatment did not result in
positive change for Algebra II EOC state assessment performance. There was no
significant difference between the treatment and control groups. However, the lack of
difference may be an indicator of growth, as again, MHS in the previous two years
performed below the district in Algebra II EOC performance. MHS had a higher
percentage of students scoring Below Basic than the district and a lower percentage of
students scoring Advanced than the district (TDOE, n.d.-a). Additionally, it was positive
that no difference was found between genders, suggesting equal performance for male
and female students. These results for Algebra II EOC performance, despite the lack of
significant positive change, were hopeful as in the two previous years, MHS students
performed below district expectations and now appear to be more consistent with district
performance. Additionally, the performance of males and females appeared to be
equivalent.
RQ3. Quantitative results are suggestive of no positive change for Algebra II
EOC state assessment performance for the 2015-2016 school year. There was no
significant difference between the treatment and control groups or between males and
females. Given the small sample size, these results were interpreted with caution, and
inferences drawn were limited. For the students who participated in the treatment during
the 2014-2015 school year, it could not be determined whether or not there were residual
effects of the treatment. While there appeared to have been no positive change, the
treatment group from 2014-2015 performed significantly below the control group on the
Algebra I EOC state assessment. Therefore, it was logical that they subsequently

146
performed significantly below the control group on the Algebra II EOC state assessment
the following year; however, no differences were found. There are many possible
explanations for this; however, residual effects of intervention and enrichment program
could not be ruled out. Also, no difference between male and female students indicated
equivalent performance between the genders.
RQ4. Strengths and weaknesses were highlighted throughout the interview
sessions. One prominent theme was the benefit for lower-performing math students.
Positive effects listed by teachers included improved classroom engagement in regular
courses, as well as the use of Study Island for basic skills, teacher scaffolding of
interventions to coursework to fill in gaps, and a greater understanding of multiple
methods for problem solving. However, the enrichment activities were not seen as
beneficial, so no benefits were found for higher-performing math students. Overall, the
major theme that emerged, suggesting a need for improvement, was a lack of
implementation fidelity. Teachers mentioned several concerns with fidelity; however,
consistently, teacher accountability and teacher buy-in were expressed, indicating a need
for improvement in intervention implementation fidelity. In summary, teachers indicated
benefits for lower-performing students, no benefits for higher-performing students, and
an overall concern for implementation fidelity, particularly with teacher accountability
and teacher buy-in.
Review of Literature
Teacher instruction and classroom interventions need to be implemented with
high levels of fidelity to ensure that evidence-based practices are being delivered to

147
students and will improve student outcomes (King-Sears, Walker, & Barry, 2018; Mages,
2017; McKenna & Parenti, 2017; Sugai, Simonsen, Freeman, & La Salle, 2016).
Intervention implementation fidelity should be measured throughout implementation so
that improvements to implementation can be made as determined, to ensure continuous
improvement for students and that high levels of fidelity can be achieved and maintained
(Foorman, Dombek, & Smith, 2016; Harn, Damico, & Stoolmiller, 2017). For fidelity
measurement to be done effectively, schools should use a systematic process to assess
fidelity of intervention implementation (Harn et al., 2017).
Classroom Applications
Classroom applications of implementation fidelity, refer to the fidelity of both
classroom instruction and implemented interventions, given current policy for evidence-
based practices in education to improve student outcomes (McKenna & Parenti, 2017;
Missett & Foster, 2015). In the classroom environment, implementation fidelity of
interventions is often thought of as treatment fidelity, which according to Gresham,
“refers to the methodological strategies used to monitor and improve the reliability and
validity of academic and behavioral interventions in schools” (2017, p. 22). Treatment
fidelity is comprised of treatment adherence, interventionist competence, treatment
differentiation, and treatment receipt (Anderson, 2017; Gresham, 2017).
To fully describe the components of treatment fidelity, they are defined here.
Treatment adherence consists of treatment component adherence and session/daily
adherence or accuracy and consistency (Gresham, 2017). Interventionist competence can
be defined as the experience and skill of the interventionist delivering the intervention

148
(Gresham, 2017). Treatment differentiation involves distinguishing treatments being used
along theoretical dimensions (Gresham, 2017). Treatment receipt is comprised of
intervention dosage, student understanding of the intervention, and student receptiveness
to the intervention (Gresham, 2017).
Increasingly, schools have implemented tiered intervention practices, such as
Response to Intervention (RTI), Positive Behavior Intervention Support (PBIS), and
Multi-Tiered Systems of Support (MTSS), as evidence-based processes for implementing
interventions with students, which utilize a student’s lack of progress to a research-based
intervention to determine whether or not to change, modify or intensify the intervention
(AIR, 2015; DeFouw, Codding, Collier-Meek, & Gould, 2018; Gresham, 2017; McKenna
& Parenti, 2017). As such, implementation fidelity measurement within these processes is
essential to determining whether or not a student’s lack of progress warrants alterations to
the student’s intervention program (AIR, 2015; DeFouw et al., 2018; Gresham, 2017;
King-Sears et al., 2018; McKenna & Parenti, 2017). The purpose of these processes is to
establish content proficiency and long-term implementation capability within school
buildings and with teachers so that teachers have a better opportunity to implement
evidence-based programs and interventions with high levels of fidelity. Also, to better
adapt and extend their implementation over time and to other settings and contexts
(McIntosh & Goodman, 2016; Sugai et al., 2016). To accomplish this level of process
and intervention implementation with fidelity, schools must build capacity for
implementation (Sugai et al., 2016).

149
Multiple factors impact treatment fidelity, including factors related to the
intervention, interventionist, and students (Balu & Doolittle, 2016; Gresham, 2017).
Factors related to the intervention include (a) ease of implementation, (b) materials and
resources required for implementation, and (c) intervention complexity (Anderson, 2017;
Gresham, 2017; Troyer, 2017). Factors related to the interventionist include: (a) number
of interventionists, (b) perception of effectiveness, and (c) motivation (Favre & Knight,
2016; Gresham, 2017; Lakin & Rambo-Hernandez, 2019). Student factors include
student behavior and attendance; however, these factors could be redefined as school
factors, like classroom management, parent engagement, alternate disciplinary practices,
and school climate and addressed through school improvement efforts in these areas
(Balu & Doolittle, 2016).
Implementation fidelity of evidence-based practices is achieved in part, through
effective and rigorous professional development aimed at providing opportunities for
teachers to learn new programs, and also to support teachers in changing, developing and
maintaining effective practices for students across all subject areas (Balu & Doolittle,
2016; King-Sears et al., 2018; Mages, 2017; Sugai et al., 2016; Troyer, 2017). Necessary
components for supporting teachers in intervention implementation in addition to
professional development or training include modeling, coaching, opportunities to plan
instruction, and performance feedback (Brock & Carter, 2017; King-Sears et al., 2018;
Troyer, 2017). One model for supporting teachers during implementation or fidelity
coaching involves five steps, to include (1) modeling the intervention, (2) sharing the
fidelity protocol, (3) coaching before implementation, (4) observing during

150
implementation, and (5) reflecting with the interventionist using fidelity data (King-Sears
et al., 2018).
Measuring Fidelity
One common way to approach fidelity assessment is to describe methods used for
measuring fidelity of structure and fidelity of process (Harn et al., 2017; Hauk, Salguero,
& Kaser, 2016; Lakin & Rambo-Hernandez, 2019). Structural areas include intervention
delivery to include adherence or differentiation, dosage or time allocation, and
intervention completion (Anderson, 2017; Dhillon, Darrow, & Meyers, 2015; Harn et al.,
2017; McKenna & Parenti, 2017). Process areas can include how well the interventionist
appeared to comprehend the lesson and content, availability of materials, teacher
response to student questions, language use, student engagement, the opportunity for
student response, the accuracy of student response, and behavior management (Harn et
al., 2017; Lakin & Rambo-Hernandez, 2019).
Structural areas are often assessed using direct observations, but some areas, such
as dosage and intervention completion, can be measured through self-report or attendance
logs (Harn et al., 2017; Lakin & Rambo-Hernandez, 2019; McKenna & Parenti, 2017).
Process areas can be evaluated through program-specific direct observations, focus
groups, and teacher interviews (Harn et al., 2017; Lakin & Rambo-Hernandez, 2019).
Student outcomes in reading and math are not predicted similarly using these fidelity
measures, as reading outcomes were better predicted by assessing process areas, and
math outcomes were better predicted by assessing structural areas (Boardman et al.,
2016; Harn et al., 2017).

151
Direct systematic observations are a useful tool in that multiple different
treatment components can be observed as well as the quality of delivery and student
responsiveness, to include student behavior (Foorman et al., 2016; Gresham, 2017; Harn
et al., 2017). As a result, content validity is critical for this type of assessment and is
dependent on the number of observations and the length of observations (Gresham, 2017;
Lakin & Rambo-Hernandez, 2019). One limitation of systematic observations is the high
number of observations required to achieve a valid and appropriate measure (Gresham,
2017). Therefore, indirect methods, including surveys, checklists, and intervention logs,
may be used to supplement direct observational data (Gresham, 2017; McKenna &
Parenti, 2017).
Determining when and how often to assess fidelity is difficult and not easily done
(Harn et al., 2017). Only assessing fidelity once upon implementation is not adequate,
given the contextual variability in schools, such as school schedule and attendance, and
the need to provide continuous coaching support to teachers (Foorman et al., 2016; Harn
et al., 2017). Therefore, it is important to measure implementation fidelity of an
intervention at various stages of implementation, for instructional support and
maintenance purposes (Foorman et al., 2016; Harn et al., 2017).
Additionally, there is variability in what constitutes an acceptable level of fidelity
when implementing evidence-based practices and interventions, and this variability is
dependent on unique components of practices and interventions (Harn et al., 2017; Hauk
et al., 2016; King-Sears et al., 2018; Lakin & Rambo-Hernandez, 2019). Specifically,
there are threshold effects when higher levels of fidelity do not lead to improved student

152
outcomes (Harn et al., 2017). Features of the intervention program or practice and
variation in subpopulations, may both lead to threshold effects (Harn et al., 2017; Lakin
& Rambo-Hernandez, 2019). There is also a need for program flexibility to support
differentiation of instruction and culturally responsive classrooms, both essential for
effective intervention implementation (Lakin & Rambo-Hernandez, 2019). Therefore,
appropriate levels of flexibility should be built into both the structural and process areas
to allow teachers to exercise professional judgment for the context of the program (Lakin
& Rambo-Hernandez, 2019).
Fidelity Assessment Tools
Selecting appropriate fidelity measures, to include confirming validity and
reliability, to evaluate the fidelity of implementation is important for developing a
systematic process to assess fidelity (Lakin & Rambo-Hernandez, 2019; Murrah,
Kosovich, & Hulleman, 2017). There are existing fidelity measures, and these measures
often already have validity and reliability data to review (Ibrahim & Sidani, 2015; Lakin
& Rambo-Hernandez, 2019). However, conclusions from two reviews of fidelity
measures indicated a need for further development of psychometrically sound measures
that improve the psychometric quality of existing and new measures and account for all
facets of the fidelity of intervention implementation (Ibrahim & Sidani, 2015; Lewis et
al., 2015).
To improve upon the fidelity of implementation measurement, it may be
appropriate to develop new measures should measurement problems exist or if the
existing measure does not align with the intervention’s goals (Lakin & Rambo-

153
Hernandez, 2019). The development of fidelity measures, at a minimum, involves
gathering validity evidence, using expert guidance in writing or the review of the
measurement items, and conducting a pilot test of the measures (Crawford, Freeman,
Huscroft-D’Angelo, Fuentes, & Higgins, 2019; Lakin & Rambo-Hernandez, 2019).
Additional resources for fidelity measures in education include the National Center on
Intensive Intervention, the Center on Response to Intervention, and in the state of
Tennessee, the Response to Instruction and Intervention Framework (American Institutes
for Research [AIR], 2014; AIR, 2015; TDOE, n.d.-b). Measurement tools available
include individualization checklist, progress monitoring checklist, intensive intervention
review log, data-based individualization implementation rubric, data meeting plan fidelity
checklist, implementation logs, RTI fidelity of implementation rubric, and RTI essentials
worksheet (AIR, 2014; AIR, 2015).
Recommendations for Improving Implementation Fidelity
The following recommendations of how to improve intervention implementation
at MHS were made after careful consideration of the study findings and current research.
I recommend that MHS develop a plan to assess the fidelity of interventions being
implemented systematically. The plan should include the areas of weakness in
implementation fidelity reported by the teachers. There are several steps involved with
assessing fidelity of intervention fidelity, as well as a variety of measures involved. The
focus of this recommendation is for academic interventions; however, a similar process
should be developed for behavioral interventions. Additionally, since the implementation
of the school-wide mathematics intervention and enrichment, MHS’s district has adopted

154
a Response to Instruction and Intervention Framework (RTI2) for academic
interventions, per direction from the state, and is attempting to blend those practices with
behavior interventions using an MTSS process. Despite this and other improvements, as
before, no plan for systematically measuring fidelity of intervention implementation has
been developed or implemented at the school level. According to the state RTI2
Implementation Guide, consistent with the current literature, there should be a school
leadership team designated to develop a systematic process for fidelity assessment and
complete fidelity monitoring (TDOE, 2016). Therefore, MHS should create a leadership
team and develop a systematic process for monitoring the fidelity of implemented
interventions. The details of this recommendation follow.
School Leadership Team
MHS is striving to improve academic achievement, particularly in mathematics,
but also in other academic areas. Evidence-based practices, in both classroom and
academic intervention, need to be implemented with fidelity for improvement in student
outcomes; however, to accomplish a high level of implementation fidelity, schools need
to build capacity for implementation (Sugai et al., 2016). To build such capacity, a school
leadership team is needed to increase teacher buy-in and to develop systematic processes
for implementation and around measuring fidelity of implementation (Harn et al., 2017;
Sugai et al., 2016; TDOE, 2016). Through a collaborative approach, the team can collect
and analyze data, identify challenges, and provide coaching support to teachers providing
intervention. The team can also, through collaborative inquiry, prescribe a structure,

155
fitting MHS’s characteristics, for measuring fidelity and supporting teachers in their
intervention practices.
Based on the recommendations from the RTI2 Implementation Guide, the team
should consist of the administrator or his/her designee, instructional leads and/or coaches,
classroom teachers, special education teachers, school psychologists, and school
counselors. Given the personnel currently serving MHS, I propose a leadership team
consisting of the following:
• Executive principal
• Dean of Students
• Special Education Lead
• EL Coach
• Intervention Coach
• School Psychologist
• ELA and Math Department Heads
• School Counseling Lead
The school leadership team should have a chair or facilitator, which is commonly the
Dean of Students’ role (TDOE, 2016). The facilitator is responsible for scheduling
meetings, organizing the student achievement data, and facilitating the meetings (TDOE,
2016). The school leadership team should use FASTBridge data, a web-based program
used for progress monitoring student progress in interventions, fidelity monitoring data,
student attendance data, and teacher feedback to make decisions resulting in improved
processes to support teachers and ultimately improved intervention implementation. The

156
school leadership team will be responsible for creating a systematic plan for fidelity
monitoring, to include who will do the monitoring, which measurement tools to use, how
frequently monitoring should occur, and who will be responsible for compiling the
monitoring data.
Teacher Buy-In
Teacher buy-in is essential for achieving high levels of intervention
implementation fidelity. However, teacher buy-in for academic intervention, particularly
at the high school level, is often difficult to obtain, given the complexities inherent in
high school environments that can become barriers for successful implementation. Some
of these potential barriers include student attendance, student behavior, school schedule,
and access to intervention resources and materials (Balu & Doolittle, 2016). Given these
concerns, the school leadership team will need to make a concerted effort to obtain
teacher buy-in.
There are ways to secure teacher buy-in through professional development at the
beginning of the year (Greene, 2016). My purpose is not to develop professional
development, but to only provide professional development suggestions to improve
teacher buy-in. The first suggestion is to validate the need for academic improvement,
through sharing of the previous year’s academic data and then to collaborate around a
common goal. Teachers should know their academic data, the successes, and areas where
there is still room for improvement. They should also know their students, as in how
many will come into their classes with the pre-requisite skills necessary to learn new
material. Once they have the data, teachers should be given time to meet collaboratively

157
within departments to engage the data and reflect upon it, in preparation for how to
engage students (Greene, 2016). After having time to discuss and reflect upon the data,
the staff should come back together and determine a growth goal school-wide for
students in the areas of math, ELA, science, and history, as well as graduation rate.
Allowing teachers to participate in establishing goals, helps secure buy-in (Greene,
2016).
Once the staff has established school-wide goals, the school leadership team
should meet with those teachers who will be providing math and literacy intervention to
students, and they should look at the progress monitoring and other academic data for
those students who received academic intervention the previous year, to include incoming
9th-grade students. Intervention teachers should collaborate within their department to
also discuss and reflect on the data. The process is similar, in that they should come back
together as a group and determine growth goals, and based on those goals, consider their
intervention resources and training needs. Giving these teachers voice regarding their
goals and needs, will gain their effort and support, as well as communicate the leadership
teams’ commitment to supporting them (Greene, 2016).
Policy Implementation
The Leadership Team is responsible for determining the structure for
implementing academic interventions and developing a plan to ensure implementation
fidelity, according to the RTI2 Implementation Guide (TDOE, 2016). TN determined that
TN schools would implement academic interventions using the RTI2 Framework in the
summer of 2013, and the implementation would be gradual, beginning with elementary

158
schools. High schools were to implement the RTI2 Framework during the 2015-2016
school year. The implementation of RTI2 varies depending on the needs of each school,
but the RTI2 Implementation Guide lays out a basic plan, along with support documents
to aid with implementation (TDOE, 2016).
The first step for fidelity implementation is for MHS’s Leadership Team to meet
in the spring to determine the intervention needs of the school regarding resources. If
materials need to be purchased, MHS’s principal, with the guidance of the Intervention
Coach, will purchase the needed materials. Second, the school’s principal can then assign
teachers to provide academic intervention and ensure they receive the appropriate
professional development before the next school year. This professional development
should provide overall information on the intervention process to include progress
monitoring, fidelity monitoring, et cetera, as well as specific instruction on the
intervention they are implementing. To effectively choose teachers, members of the
Leadership Team will need to look at student data and estimate the number of students
requiring academic intervention for the upcoming school year, while preparing for
adjustments in the fall given student needs.
Monitoring Implementation Fidelity
The next steps are specific to monitoring implementation fidelity to improve
intervention implementation. The Leadership Team needs to decide how they are going
to monitor fidelity and how frequently. Once that is determined, the Leadership Team
should designate who is going to do the monitoring and follow-up coaching. The RTI2
Implementation Guide recommends monitoring both intervention planning, intervention
159
instruction, and student attendance, as well as student progress (TDOE, 2016). The RTI2
Implementation Guide also recommends student progress checks twice every quarter at
data team meetings and intervention planning and instruction checks once every quarter
(TDOE, 2016). Student attendance and participation monitoring is ongoing and discussed
at data team meetings, as needed (TDOE, 2016).
The RTI2 Implementation Guide provides several different fidelity check
measures for observation purposes that are fairly generic to most academic interventions
(TDOE, 2016). There is an Intervention Walk-Through, 5 Minute Direct Observation,
Direct Observation Rubric, and Observation Checklist for Tier II interventions (TDOE,
2016). These sample forms can be found in Project Appendices A-D. There are also
sample fidelity check measures for specific Tier III interventions, based on the generic
ones offered for the Tier II interventions, as well as a generic Tier III Fidelity Checklist,
found in Project Appendix E, and Intervention Walk-Through, similar to the previously
mentioned one (TDOE, 2016). There could also be fidelity measures included with the
purchased interventions that could be used or adapted to fit MHS’s needs. The
Leadership Team should choose which fidelity checks to use and when. For example, the
interventionists are all directly observed when first implementing a new intervention to
provide better feedback when coaching. Then fade the direct observations to once a year
and use the walk-throughs or checklists for the other fidelity checks, as the teachers
require less feedback than when they began. Teachers providing intervention should be
given copies of the fidelity checks and rubrics, so they are aware of the expectations
before they are observed.
160
The RTI2 Implementation Guide designates the school principal and the team
facilitator for completing fidelity monitoring (TDOE, 2016). At MHS, the Executive
Principal, Dean of Students, and Special Education Lead could conduct the fidelity
checks, assuming all held supervisory certification. The Leadership Team would need to
establish a schedule for completing the fidelity checks and notify the teachers involved of
the schedule and type of check being completed.
Student attendance and participation should be documented daily on either an
Attendance Log or Intervention Log, of which there are generic forms provided in the
RTI2 Implementation Guide (TDOE, 2016). Sample forms can be found in Project
Appendices F and G. This is particularly important in the high school environment, to
document actual participation in the intervention, as some students may be in the room
but not engaged, or come in to be counted for attendance purposes, but then leave the
classroom. These types of problems can be addressed individually by the data team if
documented, or by the Leadership Team, if a more systematic problem. The Leadership
Team needs to decide how student attendance and participation will be documented and
provide the appropriate documents to the teachers implementing the intervention.
The Leadership Team is, in part, comprised of instructional coaches, the EL
Coach, Special Education Lead, and Intervention Coach. These persons, with the
assistance of the Department Heads, of both the English and Math departments, can serve
as coaches for the teachers providing intervention, as needed. The Leadership Team
should meet after the first set of fidelity checks are completed to discuss successes and
concerns and to determine coaching needs. The team facilitator, or Dean of Students, is

161
responsible for assimilating this data for the Leadership Team to review. Additionally,
the teachers should receive feedback from the fidelity checks so that they know what
went well and what their focus should be for improving implementation (King-Sears et
al., 2018).
Student Factors
Student factors to consider include attendance and behavior, and can be addressed
through classroom management, parent engagement, and school climate (Balu &
Doolittle, 2016). Student attendance and behavior can be monitored by completing an
Attendance Log or Intervention Log, and generic forms can be found in the RTI2
Implementation Guide (TDOE, 2016). Additionally, student attendance and behavior
should be supported by school-wide rules and expectations that are defined in the school
handbook and reinforced by school practices.
Once student attendance and behavior data have been collected for a few weeks,
specific concerns regarding attendance and behavior can be noted at the first data team
meeting. If the problem persists utilizing school-side strategies, one of the instructional
coaches should work with the teacher to establish a plan of action to improve that
student’s attendance and behavior (Balu & Doolittle, 2016; King-Sears et al., 2018).
Classroom management concerns should be noted during the first set of fidelity checks
and subsequently discussed by the Leadership Team. Instructional coaches should work
with teachers struggling to manage student behavior while implementing interventions to
improve student participation and implementation fidelity (Balu & Doolittle, 2016; King-
Sears et al., 2018).

162
Student attendance and behavior are also reinforced by engaging parents in the
intervention process. One way to do this is to communicate student progress to parents,
specific to the intervention. There are basic form letters in the RTI2 Implementation
Guide that can be used to communicate progress to parents, and it is recommended that
these be sent home with progress reports and report cards (TDOE, 2016). Sample letters
can be found in Project Appendices H and I. It is also recommended to send home a letter
at the beginning of the school year, informing parents that their student is being placed in
an intervention and why (TDOE, 2016). Generic versions of this letter can be found in
the RTI2 Implementation Guide (TDOE, 2016). Sample letters can be found in Project
Appendices J and K. Information about specific interventions should also be provided to
parents through information sessions at Parent-Teacher Association meetings. The
Leadership Team must decide which letters to use and what information to share with
parents.
Conclusion
Despite the benefits for low performing math students, MHS’s intervention and
enrichment program was not effective in significantly improving Algebra I EOC and
Algebra II EOC state assessment performance, when compared with a control group.
Residual effects of the intervention and implementation program are not evident, but also
cannot be completely ruled out, given the small sample size. The lack of implementation
fidelity emerged as a major theme and was cited as a concern in teacher interviews,
prompting this policy recommendation, as poor fidelity of intervention implementation
can have a negative impact on student improvement initiatives. This policy

163
recommendation to create a school leadership team to develop and implement a
systematic process for measuring fidelity of academic intervention implementation, based
on state guidelines, as well as, implementing practices to secure teacher buy-in, should
bring about systematic and individual changes that improve intervention implementation
and improve MHS’s capacity for intervention implementation. Consequently,
improvements in student academic achievement will be realized.

164
References
American Institutes for Research. (2014). RTI fidelity of implementation rubric.
Retrieved from https://files.eric.ed.gov/fulltext/ED561905.pdf
American Institutes for Research. (2015). Fidelity and implementation resources.
Retrieved from https://intensiveintervention.org/implementation-support/fidelity-
resources
Anderson, E. R. (2017). Accommodating change: Relating fidelity of implementation to
program fit in educational reforms. American Educational Research Journal,
54(6), 1288-1315. doi:10.3102/0002831217718164
Balu, R., & Doolittle, E. (2016). Commentary: Learning from variations in fidelity of
implementation. In B. Foorman (Ed.), Challenges to implementing effective
reading intervention schools. New Directions for Child and Adolescent
Development, 154, 105-108. doi:10.1002/cad.20173
Boardman, A. G., Buckley, P., Vaughn, S., Roberts, G., Scornavacco, K., & Klinger, J.
(2016). Relationship between implementation of Collaborative Strategic Reading
and student outcomes for adolescents with disabilities. Journal of Learning
Disabilities, 49, 644-657. doi:10.1177/0022219416640784
Brock, M. E., & Carter, E. W. (2017). A meta-analysis of educator training to improve
implementation of interventions for students with disabilities. Remedial and
Special Education, 38(3), 131-144. doi:10.1177/0741932516653477
Crawford, L., Freeman, B., Huscroft-D’Angelo, J., Fuentes, S. Q., & Higgins, K. N.
(2019). Implementation fidelity and the design of a fractions intervention.

165
Learning Disability Quarterly, 42(4), 217-230. doi:10.1177/0731948719840774
DeFouw, E. R., Codding, R. S., Collier-Meek, M. A., & Gould, K. M. (2018). Examining
dimensions of treatment intensity and treatment fidelity in mathematics
intervention research for students at risk. Remedial and Special Education, 40(5),
298-312. doi:10.1177/0741932518774801
Dhillon, S., Darrow, C., & Meyers, C. V. (2015). Introduction to implementation fidelity.
In C. V. Meyers & W. C. Brandt (Eds.), Implementation fidelity in education
research: Designer and evaluator considerations (pp. 8-22). New York, NY:
Routledge.
Favre, D. E., & Knight, S. L. (2016). Teacher efficacy calibration in education reform:
When highly efficacious teachers don’t spell “implement.” International Journal
of Educational Reform 25(4), 361-383.
Greene, J. (2016). Four ways to ensure teacher buy-in. Kickboard. Retrieved from
https://www.kickboardforschools.com
Foorman, B., Dombek, J., & Smith, K. (2016). Seven elements important to successful
implementation of early literacy intervention. In B. Foorman (Ed.), Challenges to
implementing effective reading intervention in schools. New Directions for Child
and Adolescent Development, 154, 49-65.
Gresham, F. M. (2017). Features of fidelity in schools and classrooms: Constructs and
measurement. In G. Robers, S. Vaughn, S. N. Beretvas, & V. Wong (Eds.),
Treatment fidelity in studies of educational intervention (pp. 22-38). New York,
NY: Routledge.

166
Harn, B. A., Damico, D. P., & Stoolmiller, M. (2017). Examining the variation of fidelity
across an intervention: Implications for measuring and evaluating student
learning. Preventing School Failure: Alternative Education for Children and
Youth, 61(4), 289-302. doi:10.1080/1045988X.2016.1275504
Harris, H., & Horst, S. J. (2016). A brief guide to decisions at each step of the propensity
score matching process. Practical Assessment, Research & Evaluation, 21(4), 1-
12. Available online: http://pareonline.net/getvn.asp?v=21&n=4
Hauk, S., Salguero, K., & Kaser, J. (2016). How “good” is “good enough”? Exploring
fidelity of implementation for a web-based activity and testing system in
developmental algebra instruction. In T. Fukawa-Conelly, N. Infante, K. Keene,
& M. Zandieh (Eds.), Proceeding of the 19th Annual Conference on Research in
Undergraduate Mathematics Education, Pittsburgh, PA.
Jefferson, C. (2013). Organizational change plan for Hillwood High School. Unpublished
manuscript, Lipscomb University, Nashville, TN.
King-Sears, M. E., Walker, J. D., & Barry, C. (2018). Measuring teachers’ intervention
fidelity. Intervention in School and Clinic, 54(2), 89-96. DOI:
10.1177/1053451218765229
Kolluri, S. (2018). Advanced placement: The dual challenge of equal access and
effectiveness. Review of Educational Research, 88(5), 671-711.
Lakin, J. M., & Rambo-Hernandez, K. (2019). Fidelity of implementation: Understanding
why and when programs work. Gifted Child Today, 42(4), 205-214.
doi:10.1177/1076217519862327

167
Lewis, C. C., Fischer, S., Weiner, B. J., Stanick, C., Kim, M., & Martinez, R. G. (2015).
Outcomes for implementation science: An enhanced systematic review of
instruments using evidence-based rating criteria. Implementation Science,
10(155). doi:10.1186/s13012-015-342-x
Mages, W. K. (2017). Practice makes perfectible: The impact of training and rehearsal on
program fidelity. Youth Theatre Journal, 31(1), 7-22.
doi:10.1080/08929092.2017.1298542
McKenna, J. W., & Parenti, M. (2017). Fidelity assessment to improve teacher
instruction and school decision making. Journal of Applied School Psychology,
33(4), 331-346. doi:10.1080/15377903.2017.1316334
Missett, T. C., & Foster, L. H. (2015). Searching for evidence-based practice: A survey of
empirical studies on curricular interventions measuring and reporting fidelity of
implementation published during 2004-2013. Journal of Advanced Academics,
26(2), 96-111. doi:10.1177/1932202X15577206
Murrah, W. M., Kosovich, J., & Hulleman, C. (2017). A framework for incorporating
intervention fidelity in educational evaluation studies. In G. Robers, S. Vaughn, S.
N. Beretvas, & V. Wong (Eds.), Treatment Fidelity in Studies of Educational
Intervention (pp. 39-60). New York, NY: Routledge.
Sugai, G. Simonsen, B., Freeman, J., & La Salle, J. (2016). Capacity development and
multi-tiered systems of support: Guiding principles. Australasian Journal of
Special Education, 40(2). 80-98. doi:10.1017/jse.2016.11
Tennessee Department of Education. (n.d.-a). Report Card. Retrieved from

168
http://www.tn.gov/education/data/report_card/index.shtml
Tennessee Department of Education. (n.d.-b). Response to Instruction and Intervention
Framework. Retrieved from https://www.tn.gov/content/dam/tn/education/special-
education/rti/rti2_manual.pdf
Tennessee Department of Education. (2016). Response to Instruction and Intervention
Implementation Guide. Retrieved from
https://preprod.tn.gov/content/dam/tn/education/special-
education/rti/rti2_implementation_guide.pdf
Troyer, M. (2017). Teacher implementation of an adolescent reading program. Teaching
and Teacher Education, 65, 21-33. doi:10.1016/j.tate.2017.03.005
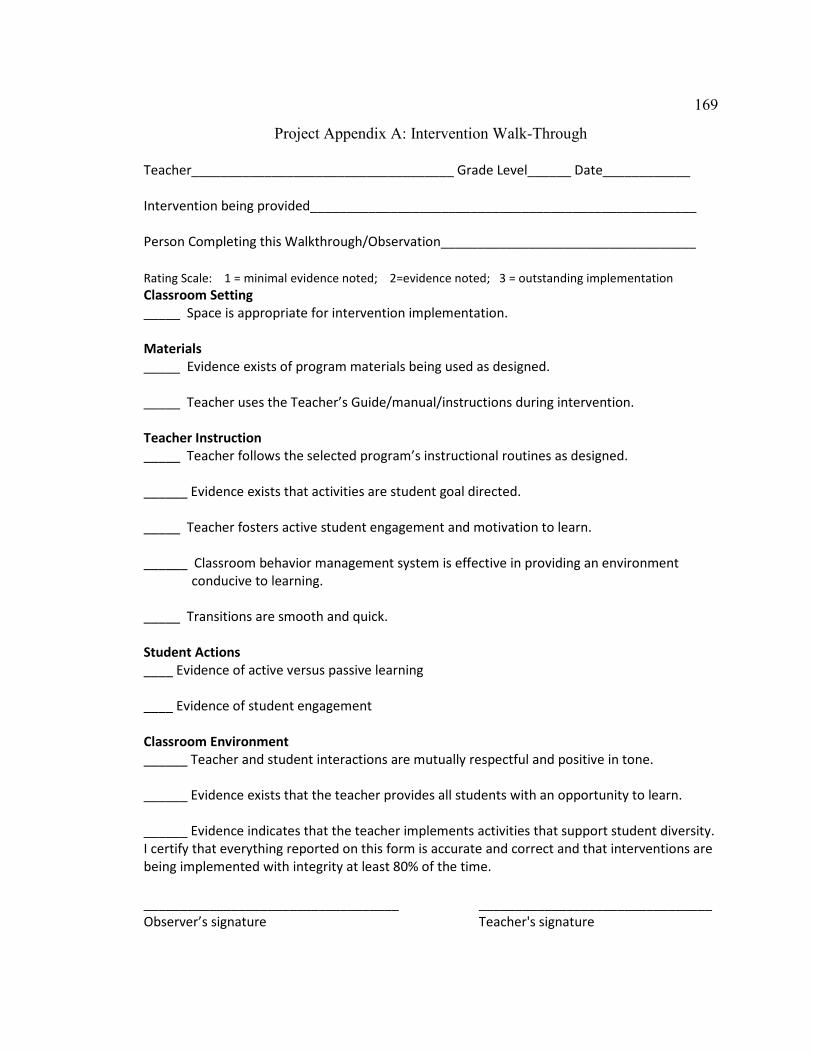
169
Project Appendix A: Intervention Walk-Through
Teacher____________________________________ Grade Level______ Date____________
Intervention being provided_____________________________________________________
Person Completing this Walkthrough/Observation___________________________________
Rating Scale: 1 = minimal evidence noted; 2=evidence noted; 3 = outstanding implementation
Classroom Setting
_____ Space is appropriate for intervention implementation.
Materials
_____ Evidence exists of program materials being used as designed.
_____ Teacher uses the Teacher’s Guide/manual/instructions during intervention.
Teacher Instruction
_____ Teacher follows the selected program’s instructional routines as designed.
______ Evidence exists that activities are student goal directed.
_____ Teacher fosters active student engagement and motivation to learn.
______ Classroom behavior management system is effective in providing an environment
conducive to learning.
_____ Transitions are smooth and quick.
Student Actions
____ Evidence of active versus passive learning
____ Evidence of student engagement
Classroom Environment
______ Teacher and student interactions are mutually respectful and positive in tone.
______ Evidence exists that the teacher provides all students with an opportunity to learn.
______ Evidence indicates that the teacher implements activities that support student diversity.
I certify that everything reported on this form is accurate and correct and that interventions are
being implemented with integrity at least 80% of the time.
___________________________________ ________________________________
Observer’s signature Teacher's signature

170
Project Appendix B: Five-Minute Direct Observation
Instructor: Date/Time
Observed by: Area of Intervention:
Program/Skill: Number of students in group:
WHAT TO LOOK FOR NOTES
Active engagement of
all students
Modeling of
instructional tasks
Multiple chance to
practice tasks
Explicit instruction
Corrective feedback
Materials organized and
readily available
Engagement of students
in independent activities
Encouragement/direct
praise
Needed intervention
provided
Intervention began and
ended on time
Positive #1
Positive #2
Suggested Changes
Next Steps
I certify that everything reported on this form is accurate and correct and that interventions are
being implemented with integrity at least 80% of the time.
signature

171
Project Appendix C: Direct Observation Rubric
Observer: __Interventionist:
School: Grade:
Start Time: End Time:
Program: Skill(s):
Focus Criteria
3 2 1 0
Structure and
Delivery of Tier
II/III Intervention
SCORE:_________
Adherence to
precision to fully
implement
procedures as
prescribed. All
components are
used to deliver a
high intensity
intervention.
Correct time
schedule is
followed to
provide optimal
intervention
during the time
allocated.
Intervention is
delivered as
designed.
Interventionist
and students are
engaged. Pace is
effective and
students are
actively involved.
Correct materials
are used.
Intervention time
is focused and
uninterrupted.
Lesson is
delivered as
designed.
Interventionist
and students are
in correct places
but materials are
not at hand.
Interventionist
appears
unprepared. Time
delay to
effectively begin
intervention time.
Some
interruptions
noted. No clear
plan for the
lesson.
Intervention not
occurring at
scheduled time
and no manual
or lesson plans
used
Management
SCORE:_________
Enthusiastic
delivery by
interventionist.
Correct and
effective
management in
place.
Interventionist
and students
effectively
making use of
time. Structure of
intervention
provides
effective pacing
and optimal use
materials.
Good delivery by
interventionist.
Management is
effective. A few
difficulties noted
during
implementation.
Most students
engaged in
learning. Structure
guides
intervention time
with occasional
lapses in time.
Poor delivery by
interventionist.
The
interventionist
does not follow
set procedures for
effective
implementation.
Several students
off task. Structure
lacks coherence.
Ineffective
delivery by
interventionist.
Students are not
engaged.
Interventionist
does not guide
structure for
intervention.

172
Sample Tier II Direct Observation Rubric (page 2)
Observations:
Strengths:
Concerns:
Results Checklist YES NO
Post observation review of fidelity check
Review of areas of concern addressed, if any were
indicated
Plans for improvement established in areas identified
I certify that everything reported on this form is accurate and correct and that interventions are
being implemented with integrity at least 80% of the time.
signature
Progress
Monitoring,
Documentation,
and
Communication
SCORE:_________
Progress
monitoring is
completed once
every other week
and clearly
documented on
all forms.
Communication
of assessment
results with
teachers and
parents exceeds
the minimum
requirements.
Documentation
of interventions
and progress is
very clear to
understand and
well organized
and
systematically
communicated.
Progress
monitoring is
generally
accurate.
Communication
with teacher and
parents happens
at least twice
each nine weeks.
Documentation of
interventions and
student progress
is adequately
communicated.
Progress
monitoring is
sporadic. There is
not a clear system
for
communicating
results with the
teacher or
parents. Limited
documentation of
interventions or
progress is noted.
Progress is rarely
communicated.
Progress
monitoring is not
occurring. No
communication
with teachers or
parents. No
documentation
of interventions
or progress.

173
Project Appendix D: Observation Checklist
Observer: Interventionist:
School: Grade:
Start Time: End Time:
Program: Skill(s):
The Tier II Intervention is:
Description Yes No
Provided by or supervised by a highly qualified teacher with
training in area of intervention
Targeting one specific area of need/deficit/skill
Targeting as a skill that was identified as an area of need by an
assessment
Occurring in addition to Tier I instruction
Delivered in a small-group format
Delivered with fidelity
Delivered with evidence based materials
Provided the appropriate amount of time daily
Provided the appropriate amount of time weekly
Progress monitored at least every other week
I certify that everything reported on this form is accurate and correct and that interventions are being
implemented with integrity at least 80% of the time.
signature

174
Project Appendix E: Fidelity Checklist
Instructor: Date/Time:
Observed by: Area of Intervention:
Lesson Number: Number of students in group:
Start and Stop Time: Total Time of Observation:
High level of implementation=2 Inconsistent level of implementation=1 Low level of implementation=0
AREA Level of
Implementation
Comments
Materials and Time
Teacher and student materials ready
2 1 0
Teacher organized and familiar with
lesson
2 1 0
Instruction/Presentation
Follows steps and wording in lessons
2 1 0
Uses clear signals
2 1 0
Provides students many opportunities to
respond
2 1 0
Models skills/strategies appropriately
and with ease
2 1 0
Corrects all errors using correct
technique
2 1 0
Provides students with adequate think
time
2 1 0
Presents individual turns
2 1 0
Moves quickly from one exercise to the
next
2 1 0
Maintains good pacing
2 1 0
Ensures students are firm on content
prior to moving forward 2 1 0
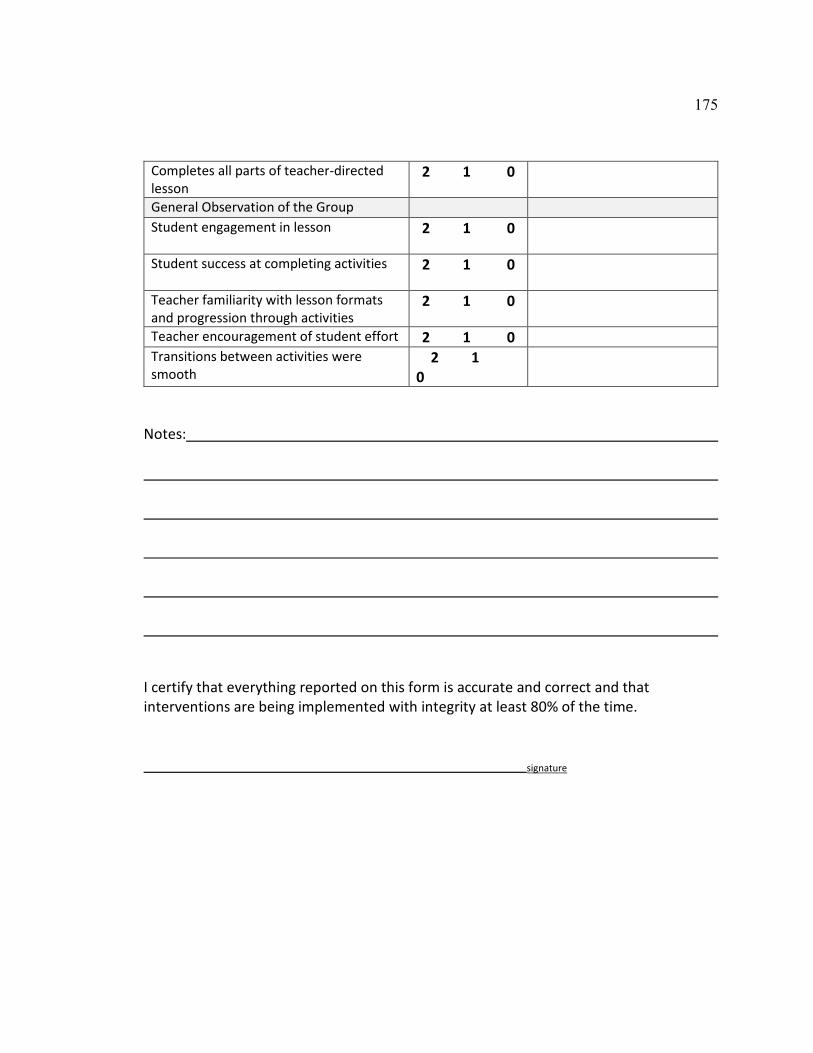
175
Completes all parts of teacher-directed
lesson
2 1 0
General Observation of the Group
Student engagement in lesson
2 1 0
Student success at completing activities
2 1 0
Teacher familiarity with lesson formats
and progression through activities
2 1 0
Teacher encouragement of student effort 2 1 0
Transitions between activities were
smooth
2 1
0
Notes:
I certify that everything reported on this form is accurate and correct and that
interventions are being implemented with integrity at least 80% of the time.
signature

176
Project Appendix F: Intervention Log
Name of Student: _Teacher: ________________Month of:
Week Date/Time * Intervention
Used
Skill area
addressed
Observations/Notes
(optional)
Week 1
Monday
Tuesday
Wednesday
Thursday
Friday
Week 2
Monday
Tuesday
Wednesday
Thursday
Friday
Week 3
Monday
Tuesday
Wednesday
Thursday
Friday
Week 4
Monday
Tuesday
Wednesday
Thursday
Friday
Week 5
Monday
Tuesday
Wednesday
Thursday
Friday * Insert name of intervention program or code from action plan

177
Progress Monitoring scores **Please attach progress monitoring graphs before RTI²
meetings
Week 1 ________Week 2 _____ __Week 3 ______Week 4 _________
Week 5 ____
Intervention Fidelity Statement: I certify that the above noted
strategies/interventions were conducted as described.
__________________________
Teacher Signature

178
Project Appendix G: Intervention and Attendance Log
Student Grade Level Month Year
School Program Skill
Person Providing Intervention
Time M T W T F Wkly
Total
s
M T W T F Wkly
Totals M T W T F Wkly
Totals
Date Lesson
Number
Student
Attendance
Time M T W T F Wkly
Total
s
M T W T F Wkly
Totals M T W T F Wkly
Totals
Date Lesson
Number
Student
Attendance
Month to Date Lesson Gains
Number of school days this month______
Number of lessons taught ______
Out of _________ days
Comments:
I certify that everything reported on this form is accurate and
correct and that interventions are being implemented with integrity
at least 80% of the time.
(signature)
Use the Following Key:
A= Student Absent
P= Student Present
TA=Teacher Absent
T= Testing
R= Reteach
O=Other (Please explain under
comments)
FM=Fidelity Monitored
Skills in Question:
L = Language
PA=Phonemic Awareness
P = Phonics
F = Fluency
V = Vocabulary
C = Comprehension
W=Written Expression
MC=Math Calculation
MP=Math Problem Solving

179
Project Appendix H: Sample Parent Letter for Reading Intervention
Insert District or School Name
Reading/Language Arts 6-12
Response to Intervention (RTI) Parent Letter
Tier I to Tier II
Student:
Date:
Dear Parent,
Each semester, every student at (insert school name) is given a universal screening
assessment to determine his/her reading abilities. Your child’s scores show that he/she
is struggling in reading. Along with the universal screening, your child’s progress has
been monitored every two weeks or more. Although he/she is receiving
English/Language Arts instruction daily in Tier I, he/she has still not shown enough
improvement. Your child will now receive an additional (insert number of minutes)
minutes of reading interventions each day. This Tier II intervention will be done in small
groups with trained personnel using research based materials. Your child’s progress will
be monitored every other week. Additional assessments maybe completed in order to
inform instruction and intervention. You will receive information on your child’s
progress. It is our goal to provide the best instruction and materials to help your child
succeed.
We encourage you, as the parent or guardian, to encourage your child to read regularly
at home, reading a variety of materials. Be sure to encourage your child to do his/her
best and let them know you believe in his/her ability to improve. If you have questions
or would like more information, please contact your child’s teacher.
Respectfully,
Insert Signature
Insert District/School Contact Information

180
Project Appendix I: Sample Parent Letter for Math Intervention
Insert District or School Name
Math 6-12
Response to Intervention (RTI) Parent Letter
Tier I to Tier II
Student:
Date:
Dear Parent,
Each semester, every student at (insert school name) is given a universal screening
assessment to determine his/her math abilities. Your child’s scores show that he/she is
struggling in math. Along with the universal screening, your child’s progress has been
monitored every two weeks or more. Although he/she is receiving math instruction daily
in Tier I, he/she has still not shown enough improvement. Your child will now receive an
additional (insert number of minutes) minutes of math interventions each day. This Tier
II intervention will be done in small groups with trained personnel using research based
materials. Your child’s progress will be monitored every other week. Additional
assessments maybe completed in order to inform instruction and intervention. You will
receive information on your child’s progress. It is our goal to provide the best instruction
and materials to help your child succeed.
We encourage you, as the parent or guardian, to ask your child to share his/her math
work with you regularly. Be sure to encourage your child to do his/her best and let them
know you believe in his/her ability to improve. If you have questions or would like more
information, please contact your child’s teacher.
Respectfully,
Insert Signature
Insert District/School Contact Information

181
Project Appendix J: Sample Progress Monitoring Letter for Reading Intervention
Insert District or School Name
Reading/Language Arts 6-12
Response to Intervention (RTI)
Progress Monitoring Letter
Dear Parent,
A letter previously notified you that your student is receiving additional reading
interventions. During this intervention period, your child has been receiving small group,
systematic intervention in reading. Your child has had his/her progress monitored every
other week using assessments that are specific to the intervention being used. Attached
you will find a copy of your child’s progress monitoring. All progress monitoring is
reported using a graph so that you can see the progress your child is making.
Based on our progress measurements, we believe your child is:
Making good progress and we plan to discontinue the additional
intervention.
Making good progress and we plan to decrease the amount of additional
intervention time being provided.
Making some progress and we plan to continue the intervention at this time.
Making limited progress and we plan to consider changes in the intervention
that we are providing.
Making insufficient progress and we plan to change the intervention plan at
this time. Further assessment and/or a parent meeting may be necessary.
Middle School/High School students who struggle in any subject area may become
discouraged. We will continue to encourage your child to be at school every day, give
his/her best effort and ask questions when he/she does not understand. Please
continue to do the same at home. Your belief in your child’s ability to improve is of great
importance to him/her.

182
As the school staff, we are pleased to have this opportunity to provide your child with
this needed assistance. If you have additional questions or concerns, please contact
your child’s teacher.
Respectfully,
Insert Signature
Insert District or School Contact Information

183
Project Appendix K: Sample Progress Monitoring Letter for Math Intervention
Insert District or School Name
Math 6-12
Response to Intervention (RTI)
Progress Monitoring Letter
Dear Parent,
A letter previously notified you that your student is receiving additional math
interventions. During this intervention period, your child has been receiving small group,
systematic intervention in math. Your child has had his/her progress monitored every
other week using assessments that are specific to the intervention being used. Attached
you will find a copy of your child’s progress monitoring. All progress monitoring is
reported using a graph so that you can see the progress your child is making.
Based on our progress measurements, we believe your child is:
Making good progress and we plan to discontinue the additional
intervention.
Making good progress and we plan to decrease the amount of additional
intervention time being provided.
Making some progress and we plan to continue the intervention at this time.
Making limited progress and we plan to consider changes in the intervention
that we are providing.
Making insufficient progress and we plan to change the intervention plan at
this time. Further assessment and/or a parent meeting may be necessary.
Middle School/High School students who struggle in any subject area may become
discouraged. We will continue to encourage your child to be at school every day, give
his/her best effort and ask questions when he/she does not understand. Please
continue to do the same at home. Your belief in your child’s ability to improve is of great
importance to him/her.
184
As the school staff, we are pleased to have this opportunity to provide your child with
this needed assistance. If you have additional questions or concerns, please contact
your child’s teacher.
Respectfully,
Insert Signature
Insert District or School Contact Information

185
Appendix B: Interview Protocol
(Adapted from Creswell, 2012)
Project: Outcomes of a School-Wide Mathematics Intervention
Time of Interview:
Date: Place:
Interviewer:
Interviewee:
Position of Interviewee:
The purpose of this study is to assess whether there are differences in student outcomes in
Algebra I and Algebra II achievement, as measured by the Algebra I and Algebra II EOC
exam proficiency levels and raw scores, after implementing this school-wide intervention
and enrichment program. The goal of this interview is to gain a deeper understanding of
how math teachers viewed the effects of the school-wide intervention and enrichment
program. All data collected will be confidential, and your names will not be used
throughout the whole data analysis. The researcher will use coded names (Teacher A,
Teacher B, Teacher C) while coding, triangulating, and reporting any data for my project
study. This interview should take around twenty minutes.
Questions:
1. In your opinion, is it possible to have an effective math classroom without the
implementation of research-based instructional strategies?
2. Describe the intervention/enrichment activities you believe were most effective and
why. Which activities were not effective?
3. What changes did you observe in your math classes that you believe were a result of
the intervention/enrichment program?
4. What strategies do you use to motivate math students to achieve at higher levels?
5. In your opinion, is relevance important in high school math instructions?
6. Do you believe the intervention/enrichment program was implemented with fidelity?
Explain.

186
7. In your opinion, what percentage of your students are prepared for high school math?
What skills are those students missing?
8. In your opinion, was the intervention/enrichment program effective in improving
math achievement? Why or why not?

187
Appendix C: Data Use Agreement
This Data Use Agreement (“Agreement”), effective as of December 1, 2017, is
entered into by and between Lisa M. Garrett and Metro Nashville Public Schools. The
purpose of this Agreement is to provide Data Recipient with access to a Limited Data Set
(“LDS”) for use in research in accord with the HIPAA and FERPA Regulations.
1. Definitions. Unless otherwise specified in this Agreement, all capitalized terms used
in this Agreement not otherwise defined have the meaning established for
purposes of the “HIPAA Regulations” codified at Title 45 parts 160 through 164
of the United States Code of Federal Regulations, as amended from time to time.
2. Preparation of the LDS. Data Provider shall prepare and furnish to Data Recipient a
LDS in accord with any applicable HIPAA or FERPA Regulations
Data Fields in the LDS. No direct identifiers such as names may be included in the
Limited Data Set (LDS). The researcher will also not name the organization in the
doctoral project report that is published in Proquest. In preparing the LDS, Data Provider
or shall include the data fields specified as follows, which are the minimum necessary to
accomplish the research: Algebra I scores for students enrolled at Hillwood High School
in 2013-2014 and 2014-2015, Algebra II EOC scores for students enrolled at Hillwood
High School in 2013-2014, 2014-2015, and 2015-2016, and associated demographics of
these students to include: gender, special education participation, EL participation, and
economic disadvantage status.
3. Responsibilities of Data Recipient. Data Recipient agrees to:
a. Use or disclose the LDS only as permitted by this Agreement or as required by law;
b. Use appropriate safeguards to prevent use or disclosure of the LDS other than as
permitted by this Agreement or required by law;
c. Report to Data Provider any use or disclosure of the LDS of which it becomes aware that
is not permitted by this Agreement or required by law;
d. Require any of its subcontractors or agents that receive or have access to the LDS to
agree to the same restrictions and conditions on the use and/or disclosure of the LDS that
apply to Data Recipient under this Agreement; and
e. Not use the information in the LDS to identify or contact the individuals who are data
subjects.
4. Permitted Uses and Disclosures of the LDS. Data Recipient may use and/or disclose
the LDS for its research activities only.

188
5. Term and Termination.
a. Term. The term of this Agreement shall commence as of the Effective Date and shall
continue for so long as Data Recipient retains the LDS, unless sooner terminated as set
forth in this Agreement.
b. Termination by Data Recipient. Data Recipient may terminate this agreement at any time
by notifying the Data Provider and returning or destroying the LDS.
c. Termination by Data Provider. Data Provider may terminate this agreement at any time
by providing thirty (30) days prior written notice to Data Recipient.
d. For Breach. Data Provider shall provide written notice to Data Recipient within ten (10)
days of any determination that Data Recipient has breached a material term of this
Agreement. Data Provider shall afford Data Recipient an opportunity to cure said alleged
material breach upon mutually agreeable terms. Failure to agree on mutually agreeable
terms for cure within thirty (30) days shall be grounds for the immediate termination of
this Agreement by Data Provider.
e. Effect of Termination. Sections 1, 4, 5, 6(e) and 7 of this Agreement shall survive any
termination of this Agreement under subsections c or d.
6. Miscellaneous.
a. Change in Law. The parties agree to negotiate in good faith to amend this Agreement to
comport with changes in federal law that materially alter either or both parties’
obligations under this Agreement. Provided however, that if the parties are unable to
agree to mutually acceptable amendment(s) by the compliance date of the change in
applicable law or regulations, either Party may terminate this Agreement as provided in
section 6.
b. Construction of Terms. The terms of this Agreement shall be construed to give effect to
applicable federal interpretative guidance regarding the HIPAA Regulations.
c. No Third Party Beneficiaries. Nothing in this Agreement shall confer upon any person
other than the parties and their respective successors or assigns, any rights, remedies,
obligations, or liabilities whatsoever.
d. Counterparts. This Agreement may be executed in one or more counterparts, each of
which shall be deemed an original, but all of which together shall constitute one and the
same instrument.
e. Headings. The headings and other captions in this Agreement are for convenience and
reference only and shall not be used in interpreting, construing or enforcing any of the
provisions of this Agreement.

189
IN WITNESS WHEREOF, each of the undersigned has caused this Agreement to be duly
executed in its name and on its behalf.
DATA PROVIDER DATA RECIPIENT
Signed: Signed:
Print Name: Print Name:
Print Title: Print Title:
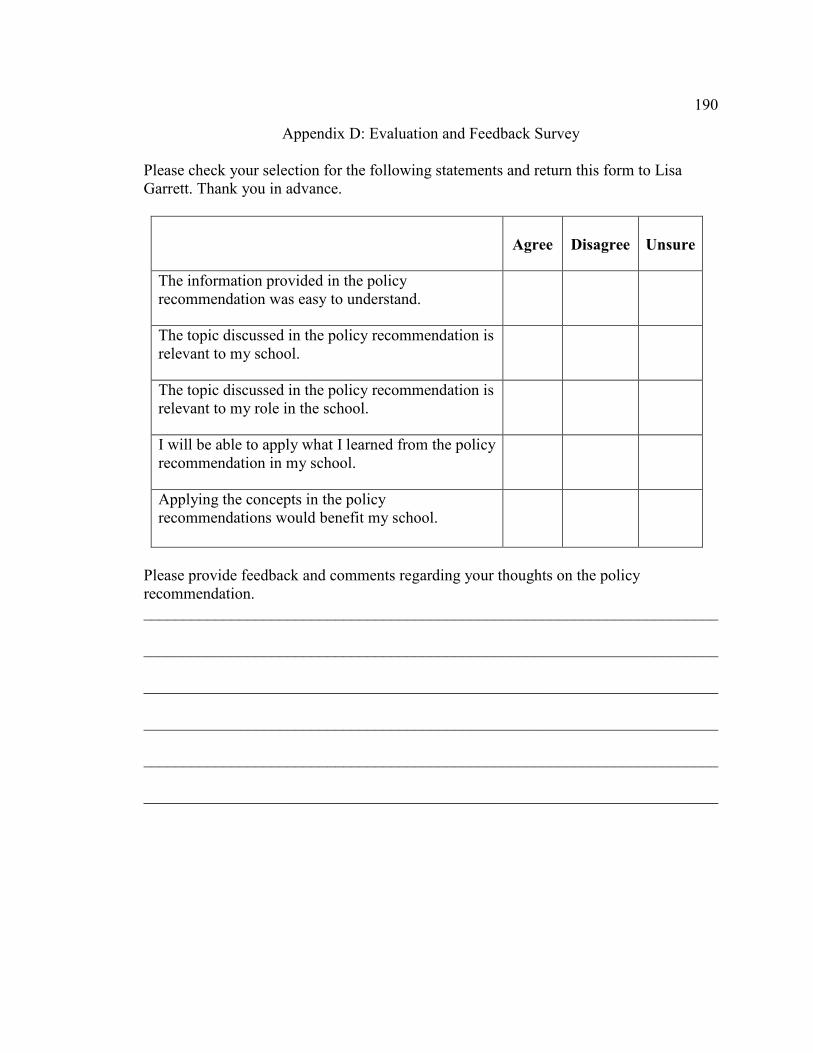
190
Appendix D: Evaluation and Feedback Survey
Please check your selection for the following statements and return this form to Lisa
Garrett. Thank you in advance.
Agree
Disagree
Unsure
The information provided in the policy
recommendation was easy to understand.
The topic discussed in the policy recommendation is
relevant to my school.
The topic discussed in the policy recommendation is
relevant to my role in the school.
I will be able to apply what I learned from the policy
recommendation in my school.
Applying the concepts in the policy
recommendations would benefit my school.
Please provide feedback and comments regarding your thoughts on the policy
recommendation.
________________________________________________________________________
________________________________________________________________________
________________________________________________________________________
________________________________________________________________________
________________________________________________________________________
________________________________________________________________________