Embed Size (px)
Citation preview

ARTICLE IN PRESS
JOURNAL OFSOUND ANDVIBRATION
0022-460X/$ - s
doi:10.1016/j.js
�CorrespondTel.: +4631 77
E-mail addr
Journal of Sound and Vibration 293 (2006) 795–806
www.elsevier.com/locate/jsvi
Out-of-round railway wheels—assessment of wheel treadirregularities in train traffic
Anders Johanssona,b,�
aDepartment of Applied Mechanics, Chalmers University of Technology, SE-412 96 Goteborg, SwedenbEpsilon HighTech AB, Lindholmspiren 9, SE-417 56 Goteborg, Sweden
Accepted 26 August 2005
Available online 13 February 2006
Abstract
Results from an extensive wheel measurement campaign performed in Sweden are given and discussed. Out-of-
roundness (OOR), transverse profile and surface hardness of 99 wheels on passenger trains (X2 and intercity), freight
trains, commuter trains (Regina) and underground trains (C20) were measured. Both tread and disc braked wheels were
investigated. The selected wheels had travelled a distance of more than 100000 km, and the measurements were conducted
when the train wagons/coaches had been taken out of traffic for maintenance, most of them due to reasons other than
wheel OOR. Mechanical contact measurement methods were used. The highest roughness levels (higher than 20 dB re 1 mmfor some wheels) were found on powered high-speed (X2) train wheels. The previously known polygonalization of C20
underground wheels is quantified. It is also verified that an initial irregularity is formed due to the clamping in a three-jaw
chuck during profiling of new C20 wheels. Magnitudes and wavelength contents of measured wheel roughness are
compared with corresponding measurements of rail roughness.
r 2006 Elsevier Ltd. All rights reserved.
1. Introduction
Since there is an increasing demand for high-speed intercity and commuter train traffic, noise from railwayoperation is becoming an increasingly important source of annoyance in society. Freight traffic with highertrain speeds also contributes to increasing noise levels. One solution to the problem is to install noise barriers.However, this is expensive and it disturbs the aesthetic impression of railways for both passengers and peopleliving near railway lines. Research to find means of noise reduction is motivated by stricter legislationconcerning allowable noise levels. At train speeds below around 250 km/h, the total railway noise level isdominated by noise generated by the dynamic wheel–rail interaction. Thus, aerodynamically generated noiseplays a minor role in this speed range.
The source of railway rolling noise is vibrations induced by low amplitude, short-pitch undulations (surfaceroughness, waviness, corrugation) on wheel treads and rail heads. Two other types of railway noise are impact
ee front matter r 2006 Elsevier Ltd. All rights reserved.
v.2005.08.048
ing author. Department of Applied Mechanics, Chalmers University of Technology, SE-412 96 Goteborg, Sweden.
2 15 00; fax: +4631 772 38 27.
ess: [email protected].

ARTICLE IN PRESS
Nomenclature
k number of one-third octave band [di-mensionless]
Lkr roughness level for one-third octave band
k [dB re 1 mm]Lk
r;n roughness level for wheel number n andone-third octave band k [dB re 1 mm]
Lk
r mean roughness level for one wheelcategory for one-third octave band k
[dB re 1 mm]n wheel number within one wheel category
[dimensionless]N number of wheels within one category
[dimensionless]rðxÞ wheel irregularity/roughness profile
[m]rref reference value for wheel roughness [m]~rk root mean square value of the roughness
profile [m]
~rk;mean mean root mean square roughness valuefor all wheels within one category forone-third octave band k [m]
~rk;n root mean square value for wheel num-ber n and one-third octave band k [m]
rðlyÞ amplitude of harmonic OOR order withwavelength ly [m]
~ry root mean square irregularity value forharmonic order y [m]
R0 mean wheel radius [m]RðxÞ wheel radius as function of circumferen-
tial coordinate [m]x circumferential coordinate [m]y harmonic order of OOR [dimensionless]lk centre wavelength for one-third octave
band k [m]ly wavelength for yth harmonic order of the
OOR [m]j rotational angle around the wheel cir-
cumference [rad]
A. Johansson / Journal of Sound and Vibration 293 (2006) 795–806796
noise (generated for example by a wheel flat or by a wheel passing a rail joint) and squeal noise (generated bylateral stick-slip excitation in sharp curves). A review of the modelling of wheel–rail noise generation is givenby Thompson and Jones [1]. Rolling noise covers the frequency interval 100–5000Hz, with the highest levels inthe interval 500–2500Hz. For frequencies below 500Hz, the main contribution to the noise is radiated by thesleepers, whereas for frequencies between approximately 500Hz and 1–2 kHz, rail vibration is the dominatingsource. Stiffer rail pads increase the frequency interval where sleeper noise is significant. For frequencies above1–2 kHz, there is a dominating contribution from wheel vibrations. An experimental procedure to assessrolling noise using a full-scale test rig is described by Hartung and Vernersson [2]. With reasonable accuracy, itcan be argued that there is a linear relationship between sound power level and total roughness level [3,4]. Thetotal roughness level is obtained by energetically adding the wheel and rail roughness levels.
Wheel polygonalization may cause severe damage to wheelset and track components. Another type of wheelirregularity is surface or subsurface initiated cracking due to rolling contact fatigue. In this case, a part of thewheel tread may flake off, or a crack may propagate inwards to cause a complete failure of the wheel. For asurvey of different wheel irregularities, see Johansson [5]. Causes of periodic wheel (and rail) irregularities andproper countermeasures are surveyed by Nielsen et al. [6]. Damage due to fatigue cracking is discussed byEkberg and Kabo [7].
The present investigation was initiated since typical levels of different wheel irregularities occurring inSwedish traffic were not known. An investigation, similar to this one, had been performed earlier in TheNetherlands by Dings and Dittrich [3]. In the autumn of 2002, an extensive measurement campaign wastherefore launched in Sweden. Railway wheels used in freight, commuter (Regina), passenger (X2 and intercitytrains) and underground (C20) traffic were investigated. Both tread and disc braked wheels were measured.The randomly selected wheels had travelled a distance of more than 100000 km, and the measurements wereconducted when the train wagons/coaches had been taken out of traffic for maintenance, most of them forreasons other than wheel OOR. In total, 99 wheels were measured in order to obtain a representativeindication of OOR existing in current traffic in Sweden. The only requirement used in the selection process wasthe minimum travelled distance of 100000 km.
The measured data were obtained by using mechanical contact measurement methods. Wheel irregularitieswere measured around the complete wheel circumference at three lateral positions on the tread: the nominalcontact position and 10mm to each side of this position [8]. Magnitudes and wavelength contents of measured

ARTICLE IN PRESSA. Johansson / Journal of Sound and Vibration 293 (2006) 795–806 797
wheel OOR are compared with corresponding measurements of rail roughness, obtained by using the methoddescribed by Grassie et al. in Ref. [9]. The change in transverse profile due to wear and plastic deformation wasstudied. Measurements were also performed to determine the hardness of the wheel tread.
2. Description of the measured wheel types
A summary of the measured wheel types is given in Table 1. It was decided to investigate wheels from twotypes of freight bogies. The Y25 bogie is considered as a ‘‘stiff’’ bogie concerning motion in the lateral andlongitudinal directions, whereas the G66 bogie is more flexible. Both bogie types have only primarysuspension, i.e. no secondary suspension. On the freight wagons, the so called 2Bgu tread brakes are used. Thismeans that from opposite sides of the wheel, two brake blocks are pressed on to the wheel tread. For passengertrain wheels, only one brake block is used and it is pressed on to one side of the wheel (so-called 1Bg treadbrake). Cast iron blocks are used for all the (tread braked) wheel categories except for C20, where compositeblocks are used.
For powered X2 and C20 wheelsets, most of the braking is applied using disc brakes and/or dynamic brakes(electric braking using the traction motor), whereas a so called scrubber brake is designed to keep the wheeltread clean and to remove some irregularities.
In total, 99 wheels were measured. The numbers of wheels within the categories presented in Table 1 are:C20 new (4), C20 worn (5+15), powered X2 (10), trailer X2 (5), tread braked passenger (6), disc brakedpassenger (6), Regina (12), G66 freight (14) and Y25 freight (22). Worn C20 wheels were measured on twodifferent occasions.
For C20 wheels, a polygonalization problem was known before the start of the measurement campaign.Therefore, a number of trains/wheelsets with known large irregularities were selected. The requirement ontravelled distance (100000 km) was also fulfilled in these cases. In addition, recently manufactured wheels weremeasured in order to study initial irregularities. These selection rules mean that the results presented may notbe representative for the whole fleet of C20 trains.
3. Description of the measurement procedures
Three different measurement techniques were used in the investigation of wheel OOR, transverse wheelprofile and surface hardness. All three methods are based on mechanical contact between the measuringprobes and the wheel surface, followed by subsequent analyses of measured data.
Table 1
Summary of properties of the wheels measured in the campaign
Wheel Nominal diameter
(mm)
Brake type Bogie type Train speed
[km/h]
Axle load
[tonnes]
Traffic type
C20 new 780 Dynamic/scrubber Powered 80 9.9/12.5 Underground
C20 worn 780 Dynamic/scrubber Powered 80 9.9/12.5 Underground
X2 1100 Disc/dynamic/
scrubber
Powered 200 18.8 Intercity
X2 880 Disc Trailer 200 13.6/18 Intercity
Passenger 1020 Block MD80 (Trailer) 160 16 Intercity
Passenger 920 Disc ASEA 84S
(Trailer)
160 16 Intercity
Regina 840 Disc Powered 200 18 Commuter traffic
Freight 920 Double block G66 100 22.5 Freight traffic
Freight 920 Double block Y25 100 22.5 Freight traffic
The values for train speed and axle load are the allowed maxima. Each row in the table is treated as one category when analyzing the
measured data. The nominal diameter is the diameter of a new wheel. For the C20 axle loads, the lower value is for the end bogies, while
the higher value is for the middle bogies. A C20 train unit with three coaches has in total four bogies.

ARTICLE IN PRESS
Fig. 2. Out-of-roundness measurement on a powered Regina wheelset.
Line 2, nominal contact point (ncp) Line 3, ncp +10 mm
Line 1, ncp -10 mm
70 mm
R(x)R0 x
ϕ
• • •
(a) (b)
Fig. 1. (a) Principle sketch of wheel and measurement variables. Radial profile R(x), mean wheel radius R0, circumferential distance x and
corresponding angle j. The deviation from the mean radius, rðxÞ ¼ RðxÞ2R0, is measured. (b) Positions of OOR measurement probes on
the wheel tread.
A. Johansson / Journal of Sound and Vibration 293 (2006) 795–806798
Three probes in mechanical contact with the wheel tread measured the deviation from the mean radius,rðxÞ ¼ RðxÞ � R0, see Fig. 1(a). The centre probe was positioned at the nominal contact point (ncp) 70mmfrom the flange side of the wheel, see Fig. 1(b). The other probes were positioned 10mm to each sideof the nominal contact point with Line 1 (probe 1) always positioned closest to the flange side of thewheel. The wheel was rotated by hand approximately two revolutions with the same circumferential startingposition for both the left and the right wheel in the wheelset. The deviations from the nominal radius wereregistered by the probes and stored on a portable computer (Fig. 2). The measurement method has a samplingdistance of 0.5mm and an amplitude resolution of 0.06 mm [8]. The equipment is shown in Fig. 2. Thetechnique requires that the wheelset is lifted, and that the brakes are released, so that the wheelset can berotated freely.
The transverse profile was measured by use of the MiniProf equipment and the hardness was measuredusing the EquoTip (EQUO—Energy-QUOtient) equipment. For all wheels, the transverse profile andhardness were measured at the circumferential starting point of the OOR measurement. For some selected C20wheels, measurements were performed at several positions around the circumference of the wheel. The selectedpositions corresponded to maxima and minima of the measured OOR. The hardness measurements wereperformed at the same lateral positions as the OOR measurement lines. For each hardness measurementposition, three measurements were performed (at slightly different positions) to enable a calculation of a meanvalue for a statistically more correct value.

ARTICLE IN PRESSA. Johansson / Journal of Sound and Vibration 293 (2006) 795–806 799
4. Analysis of measured OOR data
In this section, the analysis methods of the measured data will be described. The OOR analyses wereperformed by ØDS using the software LabView, although similar results were obtained at Chalmers using thesame raw data and Matlab. The OOR (raw data) was analyzed to obtain: (i) roughness levels and (ii) harmonicOOR order levels.
4.1. Roughness levels
From the measurements, the roughness/irregularity rðxÞ [m] was obtained as a function of thecircumferential coordinate x [m], see Fig. 1(a). The roughness level Lk
r is defined by
Lkr ¼ 10� log10f~r
2k=r2ref g ½dB re 1mm�. (1)
Here ~r2k [m2] is the mean square value of the roughness profile r(x) [m] evaluated in one-third octave band k
with centre wavelength
lk ¼ 0:01� 10k=10 ½m�; k ¼ �10;�9; . . . ; 14; 15 ½dimensionless�. (2)
Amplitudes for different wavelengths were determined by the discrete Fourier transform (DFT). The squaresof the amplitudes of the resulting narrow band spectrum were then summed and multiplied by the factor 1/2 toobtain the mean square value ð~r2k ½m
2�Þ in each one-third octave band. A windowing technique (Tukey, cosine-tapered window) was used together with a number of overlapping DFTs of the same signal. Pits and spikeswere removed from the raw data using an algorithm similar to the one described by Dings and van Lier [10].Using the definition of roughness level Lk
r , an effective roughness amplitude (root-mean-square, rms, value) of10 mm gives a roughness level of 20 dB, whereas 1 mm corresponds to 0 dB.
4.2. Harmonic OOR order levels
To obtain the contributions to the irregularity from different harmonic orders y ¼ 1,2,3,y [dimensionless]of the OOR, the DFT was used. However, the length of the measured signal was now chosen as one wheelrevolution to give wavelengths corresponding exactly to the OOR orders that are defined by ly ¼ 2pR0=y ½m�.Here R0 [m] is the mean wheel radius obtained from the OOR measurements. The results from the orderanalysis are presented as rms-values, i.e. ~ry ¼ rðlyÞ=
ffiffiffi2p½m�, where r is the amplitude obtained by the DFT.
Further details on the measurement procedures and the analyses of measured data are given in Ref. [11].
5. Results and discussion
In this section, some results are presented for the different types of wheels included in the investigation.
5.1. Out-of-roundness
The results from the OOR measurements are presented as raw data, harmonic order (irregularity) levels androughness levels (one-third octave band spectra). For the irregularity spectra, orders 1–20 have beendetermined, corresponding to wavelengths in the interval 120mm–3.46m depending on wheel diameter. Forthe roughness spectra, centre wavelengths ranging from 1.6 to 315mm are included. The irregularity- androughness- spectra are thus overlapping in some sense. However, it should be observed that for the roughnessspectra, contributions from several wavelengths in each one-third octave band have been summed.
Examples of results for a G66 freight train wheel are presented in Fig. 3. The upper graph presents measuredraw data. The different lines (almost coincident in the upper graph) represent the different measured positions,with ‘‘Line 1’’ being closest to the flange for all the wheels. The middle graph presents the irregularityspectrum, i.e. wavelength decomposition into different OOR orders. The first order corresponds to aneccentricity of the wheel, the second to an ovality, etc. The lower graph presents the roughness spectrum.

ARTICLE IN PRESS
0 1000 2000 3000 4000 5000−0.4
−0.2
0
0.2
0.4
Circumferential coordinate [mm]
Rad
ial d
evia
tion
[mm
]
Line 1Line 2Line 3
0 2 4 6 8 10 12 14 16 18 200
20
40
Irre
gula
rity
[dB
re
1 µm
]
Order no [−]
Line 1Line 2Line 3
0.0010.010.11−10
0
10
20
Wavelength [m]
Rou
ghne
ss [
dB r
e 1
µm]
Line 1Line 2Line 3
(c)
(b)
(a)
Fig. 3. Examples of measured OOR results for a G66 freight train wheel (two wheel revolutions): (a) raw data, (b) irregularity spectrum
and (c) roughness spectrum. The three lines in the upper graph (a) are almost coincident.
A. Johansson / Journal of Sound and Vibration 293 (2006) 795–806800
From these graphs it can be seen that this particular freight train wheel suffers from a large eccentricity andhigh roughness levels for wavelengths in the interval 30–80mm.
The results from several different wheels of the same type, and from different probe positions, have beenaveraged energetically. This means that the roughness levels Lk
r;n [dB re 1 mm] were converted into mean squarevalues ~r2k;n ½m
2� (one-third octave band k [dimensionless], wheel number n [dimensionless]), arithmetic meanevaluated (i.e. ~r2k;mean ¼ ð1=NÞ
PNn¼1 ~r
2k;n ½m
2�), and then transformed back to roughness levels (Lk
r [dB re 1 mm]).The energetic averaging of results from the lateral measurement positions is justified by the size of thewheel–rail contact patch and its lateral motion during vehicle–track/wheel–rail interaction. Energeticallyaveraged results for the different wheel categories are shown in Figs. 4–7. In Fig. 7, also maximum andminimum measured values have been included. For comparison with reported roughness levels, the curveaccording to prEN ISO3095 [12], has been included as a dashed line. This curve defines a proposed limit forrail roughness in the case of acoustic type testing of new vehicles, representing a very smooth rail. Note thatthe total roughness level spectrum is obtained by energetically adding wheel and rail roughness levels, i.e.summing mean square values of wheel and rail roughness in each one-third octave band.
5.1.1. New and worn C20 wheels
For new C20 wheels, see Fig. 4, there are large contributions from orders 1–4, 6 and 9 to the totalirregularity. On these new wheels, the three equidistant positions where the wheel was clamped during themanufacturing were marked. Comparison with the OOR measurements (raw data) indicates that the threeminima in the OOR correspond to the clamping positions, which leads to the conclusion that initial

ARTICLE IN PRESS
0.0010.010.11−15
−10
−5
0
5
10
15
20
25
Wavelength [m]
Rou
ghne
ss [
dB r
e 1
µm]
0 2 4 6 8 10 12 14 16 18 20−20
−10
0
10
20
30
40
Irre
gula
rity
[dB
re
1 µm
]
Order no [−]
C20 − new wheelsC20 − worn wheelsISO3095
C20 − new wheelsC20 − worn wheels
(a)
(b)
Fig. 4. Comparison of results for new and worn C20 wheels: (a) irregularity spectrum and (b) roughness spectrum.
A. Johansson / Journal of Sound and Vibration 293 (2006) 795–806 801
irregularities are formed due to the clamping in a three-jaw chuck. After turning, when the clamping loadshave been released, the wheel rim returns to its undeformed shape causing minima in the initial irregularity tobe formed at the three clamping positions around the circumference of the wheel. From the measured data, itis also observed that the lowest levels in the irregularity spectrum are found for the line closest to the flange.This is in accordance with the production technique at Lucchini, where the wheels are clamped on the field sideduring the last phase of the profiling.
Studying the irregularity spectra for worn C20 wheels in Fig. 4, it is observed that the irregularity containsthe largest contributions from orders 1–8. From the measured data it was also observed that the highestharmonic order levels for worn C20 wheels are approximately the same for all three lines. Compared withworn wheels, roughness levels are higher for new wheels for wavelengths shorter than 30mm. The cause of thepolygonalization on C20 wheels is further discussed in Ref. [5].
5.1.2. Wheels on tread braked freight trains
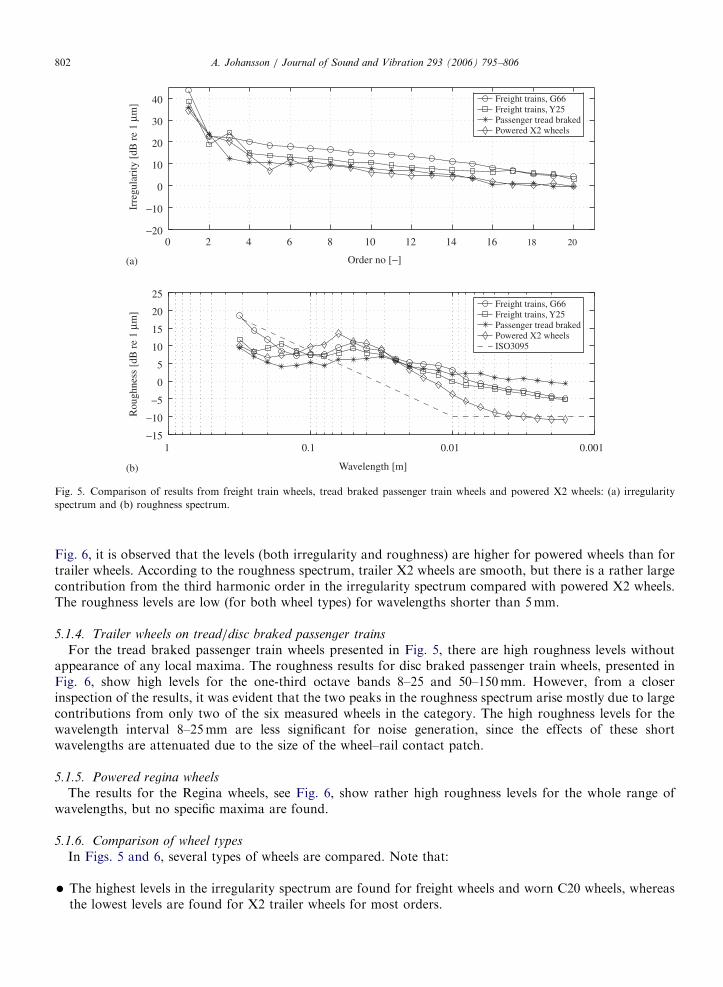
For the two types of freight train wheels investigated, the results are shown in Fig. 5. The results for the twodifferent bogie types G66 and Y25 are rather similar. However, the irregularity and roughness levels are higherfor G66. Both types suffer from large eccentricities. For Y25 wheels, there is a significant contribution to thetotal irregularity from the third harmonic order. In the wavelength interval 30–80mm, there are highroughness levels, which are caused by tread braking [13].
5.1.3. Powered and trailer X2 wheels
In Fig. 5, it can be seen that the mean roughness levels for powered X2 high-speed train wheels are similar inlevel to, and for some wavelengths even higher than, freight train wheels running at a much lower train speed.The roughness levels are greater than 10 dB re 1 mm in the range 30–80mm. These high roughness levels aremost likely caused by tread braking using the cast-iron scrubber brake. It was found that the scrubber brake isused as a service brake rather than as a scrubber brake only, as was intended in the original design [14]. From
ARTICLE IN PRESS
0.0010.010.11−15
−10
−5
0
5
10
15
20
25
Wavelength [m]
Rou
ghne
ss [
dB r
e 1
µm]
0 2 4 6 8 10 12 14 16 18 20−20
−10
0
10
20
30
40
Irre
gula
rity
[dB
re
1 µm
]
Order no [−]
Freight trains, G66Freight trains, Y25Passenger tread brakedPowered X2 wheelsISO3095
Freight trains, G66Freight trains, Y25Passenger tread brakedPowered X2 wheels
(b)
(a)
Fig. 5. Comparison of results from freight train wheels, tread braked passenger train wheels and powered X2 wheels: (a) irregularity
spectrum and (b) roughness spectrum.
A. Johansson / Journal of Sound and Vibration 293 (2006) 795–806802
Fig. 6, it is observed that the levels (both irregularity and roughness) are higher for powered wheels than fortrailer wheels. According to the roughness spectrum, trailer X2 wheels are smooth, but there is a rather largecontribution from the third harmonic order in the irregularity spectrum compared with powered X2 wheels.The roughness levels are low (for both wheel types) for wavelengths shorter than 5mm.
5.1.4. Trailer wheels on tread/disc braked passenger trains
For the tread braked passenger train wheels presented in Fig. 5, there are high roughness levels withoutappearance of any local maxima. The roughness results for disc braked passenger train wheels, presented inFig. 6, show high levels for the one-third octave bands 8–25 and 50–150mm. However, from a closerinspection of the results, it was evident that the two peaks in the roughness spectrum arise mostly due to largecontributions from only two of the six measured wheels in the category. The high roughness levels for thewavelength interval 8–25mm are less significant for noise generation, since the effects of these shortwavelengths are attenuated due to the size of the wheel–rail contact patch.
5.1.5. Powered regina wheels
The results for the Regina wheels, see Fig. 6, show rather high roughness levels for the whole range ofwavelengths, but no specific maxima are found.
5.1.6. Comparison of wheel types
In Figs. 5 and 6, several types of wheels are compared. Note that:
�
The highest levels in the irregularity spectrum are found for freight wheels and worn C20 wheels, whereasthe lowest levels are found for X2 trailer wheels for most orders.
ARTICLE IN PRESS
0.0010.010.11−15
−10
−5
0
5
10
15
20
25
Wavelength [m]
Rou
ghne
ss [
dB r
e 1
µm]
0 2 4 6 8 10 12 14 16 18 20−20
−10
0
10
20
30
40
Irre
gula
rity
[dB
re
1 µm
]
Order no [−]
Powered X2 wheelsTrailer X2 wheelsRegina wheelsC20 wornPassenger disc brakedISO3095
Powered X2 wheelsTrailer X2 wheelsRegina wheelsC20 wornPassenger disc braked
(b)
(a)
Fig. 6. Comparison of results from X2 wheels, Regina wheels, worn C20 wheels and disc braked passenger train wheels: (a) irregularity
spectrum and (b) roughness spectrum.
A. Johansson / Journal of Sound and Vibration 293 (2006) 795–806 803
�
All the different wheel types show a rather high eccentricity level (i.e. a high level for order one). � Depending on wavelength interval, the highest roughness levels are found for either passenger wheels orpowered X2 wheels.
� The lowest roughness levels are obtained for X2 trailer wheels (for wavelengths420mm) and for worn C20wheels (for wavelengths o20mm).
5.1.7. Comparison with measurements of rail roughness
Fig. 7 shows a comparison between rail roughness and wheel roughness for powered X2 wheels. The railroughness was obtained using the corrugation analysis trolley (CAT) [9] with a sampling distance of 1mm onUIC60 rails on the main line between Stockholm and Goteborg. Banverket has selected several test sites formonitoring of rail roughness. The chosen positions were based on earlier measurements of wheel–rail contactforces using an X2 train equipped with wheels instrumented with strain gauges. Results from two test sites ona tangent track are shown in Fig. 7, one with a severely corrugated rail and one with a smooth, recentlyground rail. The measured distance was 500m for both rails. From the comparison, it is observed that themaximum roughness levels for powered X2 wheels are similar to roughness levels on a severely corrugated rail.It should be noted that the presented maximum and minimum levels originate from different wheels and thatsuch a worst case scenario (i.e. the maximum values for every one-third octave band or order) has not beenmeasured on one single wheel. The influence of wheel/rail corrugation on rolling contact fatigue in wheels isstudied by Nielsen et al. [15].
5.2. Transverse profile
The transverse distribution of wear depth was obtained by subtracting the nominal profile from the wornone, assuming that no wear takes place on the top of the flange. For most of the wheels, there is a weak

ARTICLE IN PRESS
0.0010.010.11−15
−10
−5
0
5
10
15
20
25
Wavelength [m]
Rou
ghne
ss [
dB r
e 1
µm]
Maximum valueMean valueMinimum valueCorrugated railSmooth railISO3095
Fig. 7. Comparison between roughness levels from smooth and corrugated UIC60 rails and roughness levels from powered X2 wheels
(given as maximum, mean and minimum values). The rail roughness was measured on a section of a Swedish track where high wheel–rail
contact forces had been measured earlier using an X2 test train, and on a section with a recently ground rail.
A. Johansson / Journal of Sound and Vibration 293 (2006) 795–806804
maximum in the transverse distribution of wear depth at approximately 90mm from the flange side of thewheel. Some exceptions are freight train wheels and Regina wheels, where the amount of wear is fairlyconstant over the tread. For some of the worn C20 wheels, measurements were performed at several positionsaround the wheel circumference, corresponding to maxima and minima of the OOR. The wear distributionwas found to be similar for these positions, although the magnitude was different corresponding to themaxima and minima due to the OOR. The measurements indicate that the amount of wear is larger for theY25 bogie than the G66 bogie, although the observed difference may partly be explained by different travelleddistances since last reprofiling. This is also in accordance with expectations since the Y25 bogie has a stiffer(lateral and longitudinal) primary suspension than the G66 bogie. Further results from the measurements oftransverse profiles are given in Ref. [11].
5.3. Surface hardness
The highest hardness values were obtained for tread braked passenger train wheels, while the lowest valueswere measured on disc braked passenger train wheels. All the values were in the interval 290–390 Brinell. Theminimum requirement for hardness 50mm below the wheel tread for disc braked passenger and X2 wheels is 235Brinell and 250 Brinell, respectively [16]. Higher hardness values are obtained at the wheel tread due to rimquenching (i.e. heating the wheel and cooling of the wheel tread) during manufacturing. The wheel tread materialalso hardens during operation. Further results from the measurements of hardness are given in Ref. [11].
6. Concluding remarks
An overview of wheel irregularities occurring in different types of train traffic in Sweden has been given. Thepreviously known polygonalization of underground (C20) wheels was quantified. Freight train wheels and

ARTICLE IN PRESSA. Johansson / Journal of Sound and Vibration 293 (2006) 795–806 805
powered X2 wheels had high roughness levels for wavelengths in the approximate range 30–80mm. The highroughness levels are caused by tread braking using cast-iron brake blocks. High eccentricity levels were foundon most of the wheels, with the highest amplitudes for freight wheels. It has been shown that an initialirregularity on new C20 wheels is formed due to the clamping in a three-jaw chuck during profiling.Comparisons of wheel roughness with rail roughness measured on a severely corrugated rail and a smooth,recently ground rail showed that the maximum roughness levels measured on the powered X2 wheels exceededthe levels for the severely corrugated rail. However, the mean roughness spectrum evaluated for 10 such wheelswas found to be at a level between the smooth and corrugated rail for most of the wavelengths. To increase thestatistical certainty of the presented results, it is recommended to perform more similar measurements,especially on powered X2 wheels and passenger train wheels. With reference to the measured high roughnesslevels on powered X2 wheels, the present study shows that the use of the cast-iron scrubber brake as a servicebrake should be avoided. If the present braking practice is not altered, the maintenance (turning) intervalneeds to be reduced.
A weak maximum in the transverse distribution of wear depth at approximately 90mm from the flange side(tread wear) was observed for X2, passenger and C20 wheels. The transverse profiles for polygonal C20 wheelswere found to be similar around the wheel circumference.
The hardness values varied between 290 and 390 Brinell. The highest values were found for tread brakedpassenger train wheels, whereas the lowest values were found for disc braked passenger train wheels. Thevalues obtained are all above the minimum requirements for new wheels.
Acknowledgements
This work was performed at the Department of Applied Mechanics, Chalmers University of Technology inGoteborg, Sweden. It forms part of the activities in the Centre of Excellence CHARMEC (CHAlmers RailwayMEChanics, www.charmec.chalmers.se).
The measurements were performed in a collaboration between CHARMEC and Ødegaard & Danneskiold-Samsøe (ØDS). From CHARMEC, Mr. Hans Johansson and Dr. Jens Nielsen took part in the planning andexecution of the measurements. Personnel at the following companies/locations (workshops) in Swedencontributed to the measurements: Bombardier Transportation Sweden/Vasteras, Banverket/Tomteboda(Stockholm), SweMaint/Norrkoping, TrainMaint/Hagalund (Stockholm) and Bombardier TransportationSweden/Hogdalen (Stockholm). The C20 measurements were planned and performed in cooperation withMr. Magnus Lundgren of Bombardier Transportation Sweden. Mr. Jan Spannar of the Swedish National RailAdministration (Banverket) provided the measured rail roughness data. The project was supervised byDr. Jens Nielsen of Chalmers Applied Mechanics. Professor Roger Lunden gave valuable comments on themanuscript.
References
[1] D.J. Thompson, C.J.C. Jones, A review of the modelling of wheel/rail noise generation, Journal of Sound and Vibration 231 (3) (2000)
519–536.
[2] C.F. Hartung, T. Vernersson, A full-scale test rig for railway rolling noise—simulation and measurements of dynamic wheelset–track
interaction, Journal of Sound and Vibration 267 (3) (2003) 549–563.
[3] P.C. Dings, M.G. Dittrich, Roughness on Dutch railway wheels and rails, Journal of Sound and Vibration 193 (1) (1996) 103–112.
[4] D.J. Thompson, On the relationship between wheel and rail surface roughness and rolling noise, Journal of Sound and Vibration 193
(1) (1996) 149–160.
[5] A. Johansson, Out-of-round Railway Wheels—causes and consequences, an investigation including field tests, out-of-roundness
measurements and numerical simulations, Dortoral Dissertation, Department of Applied Mechanics, Chalmers University of
Technology, Goteborg, Sweden, 2005.
[6] J.C.O. Nielsen, R. Lunden, A. Johansson, T. Vernersson, Train–track interaction and mechanisms of irregular wear on wheel and rail
surfaces, Vehicle System Dynamics 40 (1–3) (2003) 3–54.
[7] A. Ekberg, E. Kabo, Fatigue of railway wheels and rails under rolling contact—an overview, Wear 258 (7–8) (2005) 1288–1300.
[8] Ødegaard & Danneskiold-Samsøe (ØDS), A presentation of the company on the web address www.odegaard.dk, 2004.
[9] S.L. Grassie, M.J. Saxon, J.D. Smith, Measurement of longitudinal rail irregularities and criteria for acceptable grinding, Journal of
Sound and Vibration 227 (5) (1999) 949–964.

ARTICLE IN PRESSA. Johansson / Journal of Sound and Vibration 293 (2006) 795–806806
[10] P. Dings, S. van Lier, Measurement and presentation of wheel and rail roughness, in: Proceedings of the Third World Congress on Rail
Research (WCCR 1997), Florence, Italy, 1997, 10pp.
[11] A. Johansson, Out-of-round railway wheels—measurements of out-of-roundness, transverse profile and surface hardness, Research
Report 2004:1, Department of Applied Mechanics, Chalmers University of Technology, Goteborg, Sweden, 2003, 40pp.
[12] CEN/TC256, Railway applications—acoustics—measurements of noise emitted by railbound vehicles, Preliminary European Norm
prEN ISO 3095, September 2003, 35pp.
[13] T. Vernersson, M. Petersson, M. Hiensch, Thermally induced roughness of tread braked railway wheels, in: Proceedings of the 12th
International Wheelset Congress, Qingdao, China, 1998, 8pp.
[14] J. Agren, Bombardier Transportation Sweden, personal communication, 2004.
[15] J.C.O. Nielsen, A. Ekberg, R. Lunden, Influence of short-pitch wheel/rail corrugation on rolling contact fatigue of railway wheels,
Proceedings of the Institution of Mechanical Engineers, Part F: Journal of Rail and Rapid Transit, 219, 177–187, 2005.
[16] P. Gullers, Interfleet Technology (formerly TrainTech Engineering Sweden), personal communication, 2004.