Embed Size (px)
Citation preview

2010 AnnuAl RepoRt
Our cOmpetitive advantageshelping customers win

We create a broad array of interior protective packaging solutions, using
molded and fabricated foams, vacuum-formed plastics, and molded
fiber. We also provide engineered component solutions, using the
latest laminating, molding, and fabricating technologies. We market
these solutions through our three brands: United Foam, Molded Fiber,
and Simco Automotive.
Our customers include leading companies in six target markets:
Medical & Scientific, Automotive, Computers & Electronics,
Aerospace & Defense, Consumer, and Industrial. Learn more about
us at www.ufpt.com.
UFP Technologies, Inc. (Nasdaq: UFPT) is a leading supplier of custom-engineered packaging solutions and component products.
2010 annual report
Contents
2 President’s Letter
4 A Culture of Innovation
5 Diversity of Markets,
Materials and Capabilities
6 A Strong Competitive Platform
7 A Proven Strategy for Success
8 Selected Financial Data
10 Management’s Discussion
and Analysis of Financial
Condition and Results
of Operations
15 Financial Statements
36 Stockholder Information

32
2010 was an exciting year that illustrated
the effectiveness of our strategy and our
team’s ability to execute. Our revenue
grew 22%; 10% was organic growth, and
12% came from the three acquisitions we
completed during 2009. Our operating
income grew an impressive 76%, as
greater economies of scale and improved
plant efficiencies helped us to leverage our
revenue increase into record profits for the
year. We’ve seen a strong start to 2011
as well.
Looking ahead, we’re energized about
the many promising growth opportunities
we see for UFP. I believe we have three
key elements that will help ensure our
continued success.
1. Identified opportunities that are a
strong fit with our core competencies.
2. The resources and infrastructure to
capitalize on those opportunities.
3. The ability to defend and grow the
business, and the associated margins,
we’ve worked so hard to earn.
IdentIfIed opportunItIes
Acquisitions
We see many exciting acquisition
opportunities that can help us continue to
grow our business. We have a substantial
database of strong acquisition candidates,
and a reputation for smoothly integrating
companies that contribute quickly to our
bottom line. The customers, employees,
and owners of our new partners acknowledge
their positive experiences in joining forces
with UFP. As a result, acquisition candidates
are now contacting us to discuss potential
transactions. It’s a clear win-win for all
parties. Each acquisition brings UFP new
products, new capabilities, new customers,
and greater economies of scale. This, in turn,
enhances our ability to share best practices
across the company and maximize the
effectiveness and efficiency of our plants.
Strategic market focus
We have identified six best-fit strategic
markets for UFP – medical & scientific,
automotive, computer & electronics,
aerospace & defense, consumer, and
industrial. Drilling down further, we have
identified the most appropriate segments
within those markets, the most promising
customers within those segments, and
the best fit applications for those targeted
customers. The result is a very focused
“opportunity roadmap” that guides the
efforts of our sales and engineering teams
as they work to grow the business. By
concentrating on sophisticated applications
where we can add the most value, we have
been able to increase our margins, and
improve the quality and volume of our book
of business.
resources and Infrastructure
In the following pages, we will describe
some of the key differentiators that will help
us capitalize on these growth opportunities.
These include our technically skilled team
of innovators, our diverse capabilities, our
twelve well-equipped factories, our key
vendor partnerships, and more. I hope you
take a few moments to review the attributes
that will help us deliver even more value
to the 3,000-plus customers we currently
serve, and attract many new customers
as well.
GrowInG exIstInG busIness
At UFP, we have 28 active patents, more
new patent filings in process, and proprietary
positions on many important materials. We
also have a reputation for highly engineered
solutions and very efficient manufacturing.
These factors combine to explain why UFP
has been so successful in maintaining and
growing the business our creative engineers
have helped us earn. In fact, many of our
customers have been with us for decades.
We seek to secure long-term contracts
from customers. In exchange, we commit
to make continuous improvements in the
production of their solutions. In this way,
we have been able to steadily grow market
share, and maintain or improve margins
by continuously taking costs out of our
operations. Full pricing in year 1 helps to
finance the engineering work, specialized
equipment, tooling, and other resources
needed to develop a superior solution. In
subsequent years, more competitive pricing
makes it difficult for competitors to take that
business away.
Also, because our solutions tend to be very
complex and precisely engineered, they are
difficult for competitors to replicate. And we
often use custom equipment, designed and
built by our own engineers, to manufacture
a specific solution. This provides yet another
barrier to entry for competitors.
In conclusion, we are pleased with our
progress, and very optimistic about the
opportunities ahead and our competitive
position. With our strong balance sheet,
deep bench of talented professionals,
and proven strategy, we feel confident
in our ability to continue delivering value
to our cherished customers and to you,
our shareholders.
As always, we appreciate your support,
and thank you for your continued interest
in our Company.
Sincerely,
R. Jeffrey Bailly
Chairman and CEO
Dear Fellow ShareholDer,
We are pleased with our progress, and very optimistic about the opportunities ahead and our competitive position.
Our operating income grew an impressive 76%, as greater economies of scale and improved plant efficiencies helped us to leverage our revenue increase into record profits for the year.
SALES
2006
2005
2007
2008
2009
2010
$93,7
49
$83,9
62
$93,5
95
$110
,032
$99,2
31
$120
,766
OPERATING INCOME
2006
2005
2007
2008
2009
2010
$5,05
4
$2,17
1
$7,24
7
$8,42
5
$8,18
0
$14,3
80
NET INCOME
2006
2005
2007
2008
2009
2010
$2,51
5$659
$4,15
9
$5,11
6
$5,92
9
$9,24
7
SHAREHOLDERS EQUITY
2006
2005
2007
2008
2009
2010
$19,2
41
$15,3
95
$24,8
27
$31,8
90
$39,0
05
$50,2
26

54
Better. Stronger. Lighter. Simpler. More cost-effective. In today’s economy, customers
are always challenging us to make good solutions great and great solutions greater.
We take pride in our ability to meet these challenges, and solve complex packaging
and component issues with the highest levels of quality and precision.
It’s all part of our entrepreneurial culture, in which continuous improvement is simply
the norm. Our people are passionate about innovation. A more elegant design, a more
effective material, a more efficient process … these objectives are part of every project.
Our people understand that, and have the freedom and resources to innovate and deliver.
To us, a culture of innovation isn’t just about great products. It’s also about integrity,
service, and putting customers first. We’ve doubled our sales over the last decade,
from just over $61 million in 2001 to just under $121 million in 2010 – and
quadrupled them in the last two decades. Our highly skilled, highly motivated people
are a big reason why. As we continue to grow, our customers can trust them to provide
the quality, creativity and commitment that will always set UFP apart.
a Culture oF innovation DiverSity oF marketS, materialS anD CapabilitieS
The talent and experience of our engineering team give UFP a major competitive edge. Customers know we have deep resources on hand to produce innovative solutions to their product and packaging needs.
ENGINEERING BY THE NUMBERS
8%% oF UFP emPloyees
dediCaTed To engineering
46ToTal nUmber oF
engineering emPloyees
12 yearsaverage TenUre wiTh UFP
Our customers demand sophisticated designs and efficient execution. Our sales growth is a direct result of our ability to meet that demand.
with our longstanding relationships with many of the world’s top material suppliers, customers trust us to identify the latest and best materials for their applications, and keep them on the leading edge of innovation.
Our diversity is another reason for our success and an important way we help customers
succeed. With our broad array of materials, products, and processes, we offer our
customers a vast range of solutions; we can approach every problem with a blank sheet
of paper, and identify the technologies and materials that will provide a strong solution.
Often, we will create an innovative solution for one industry, then apply the lessons
learned to another. As we share that knowledge systematically across the company, it
helps us to utilize different materials in creative ways, and match the latest materials
to our customers’ most critical needs. This gives us a unique ability to provide an
impressive range of products and services, and constantly offer the latest material
innovations to our customers.
Our diversity and versatility also help us adapt easily to changing market conditions,
and shift resources to where they’re needed most at any given time. Because we do not
depend on any particular sector, customers can depend on UFP to be a solid, stable
partner whether the overall economy is healthy or struggling.
We serve many leading companies across six main target markets. These diverse opportunities help insulate us from market downturns, and give us a wide base of product knowledge and design expertise.

76
Twelve well-equipped plants across the United States give UFP excellent geographic
coverage and strong economies of scale. For example, our size helps us negotiate lower
raw material costs and keep our prices very competitive. And it helps us deliver more
solutions from locations near our customers, often reducing lead times and freight costs.
Of course, it’s the quality of those plants that matters most to customers. We’re always
looking to make smart investments that upgrade our capabilities, whether to increase
manufacturing output, incorporate new advanced materials, enhance quality systems,
or service new applications. UFP has fifteen quality certifications throughout our network
of facilities, including ISO 9001:2008, ISO 13485:2003, ISO/TS 16949:2009, and
ISO 14001:2004. We’ve also invested $11.5 million in capital equipment over the last
five years to enhance our capabilities and improve efficiencies. These types of strategic
improvements all serve to continually strengthen our overall platform.
One of our key strategic tenets is to leverage our size by sharing best practices from
plant to plant. If a team in one facility learns how to improve a process or provide a new
service, the rest of the company will learn about it too. In this way, we can continually
sharpen our competitive edge, plant by plant, year after year.
a Strong Competitive platForm a proven Strategy For SuCCeSS
our medical manufacturing infrastructure now includes clean room and clean environment manufacturing in six of our twelve locations.
OUR PlaNT lOcaTIONS
alabama, CaliFornia, Colorado,
Florida, georgia, illinois, iowa,
massaChUseTTs, miChigan,
new Jersey, Texas
Our strategy that has delivered a 27% per year increase in shareholder equity over
the last five years has been very consistent. One key piece is acquisitions. More
specifically, it’s our ability to identify and purchase companies that are an excellent
cultural fit, and enhance our ability to serve customers. After three important 2009
acquisitions, 2010 was about integrating those companies, and reaping the benefits of
higher sales volume, cost-saving synergies, and best practice sharing. Together these
acquisitions have improved our bottom line, expanded our capabilities, and strengthened
our competitive position.
Another key piece is marketing to our sweet spot – focusing on opportunities where our
products and services add the most value. We target our sales and marketing resources
to high-growth opportunities that are best suited to our engineering, materials, and
conversion skills. This helps us to attract new customers, increase the value we bring to
current ones – and further differentiate UFP from the competition.
whether new products, new markets, new plants, new skills, or new materials, all of our acquisitions have brought competitive advantages we did not have before.
2000 aCquiSition:
Simco Automotive
2002 aCquiSition:
Excel Foam
2008 aCquiSition:
Stephenson & Lawyer
2009 aCquiSition:
Foamade Industries
2009 aCquiSition:
Advanced Materials Group
We’re always working to improve the quality of our products and services, enhance the efficiency of our processes, and increase the value we bring to customers.
With our very strong balance sheet and growing cash reserves, we are well positioned to invest in additional acquisition opportunities in the coming years.
2009 aCquiSition:
EN Murray Co.
98
SeleCteD FinanCial Data
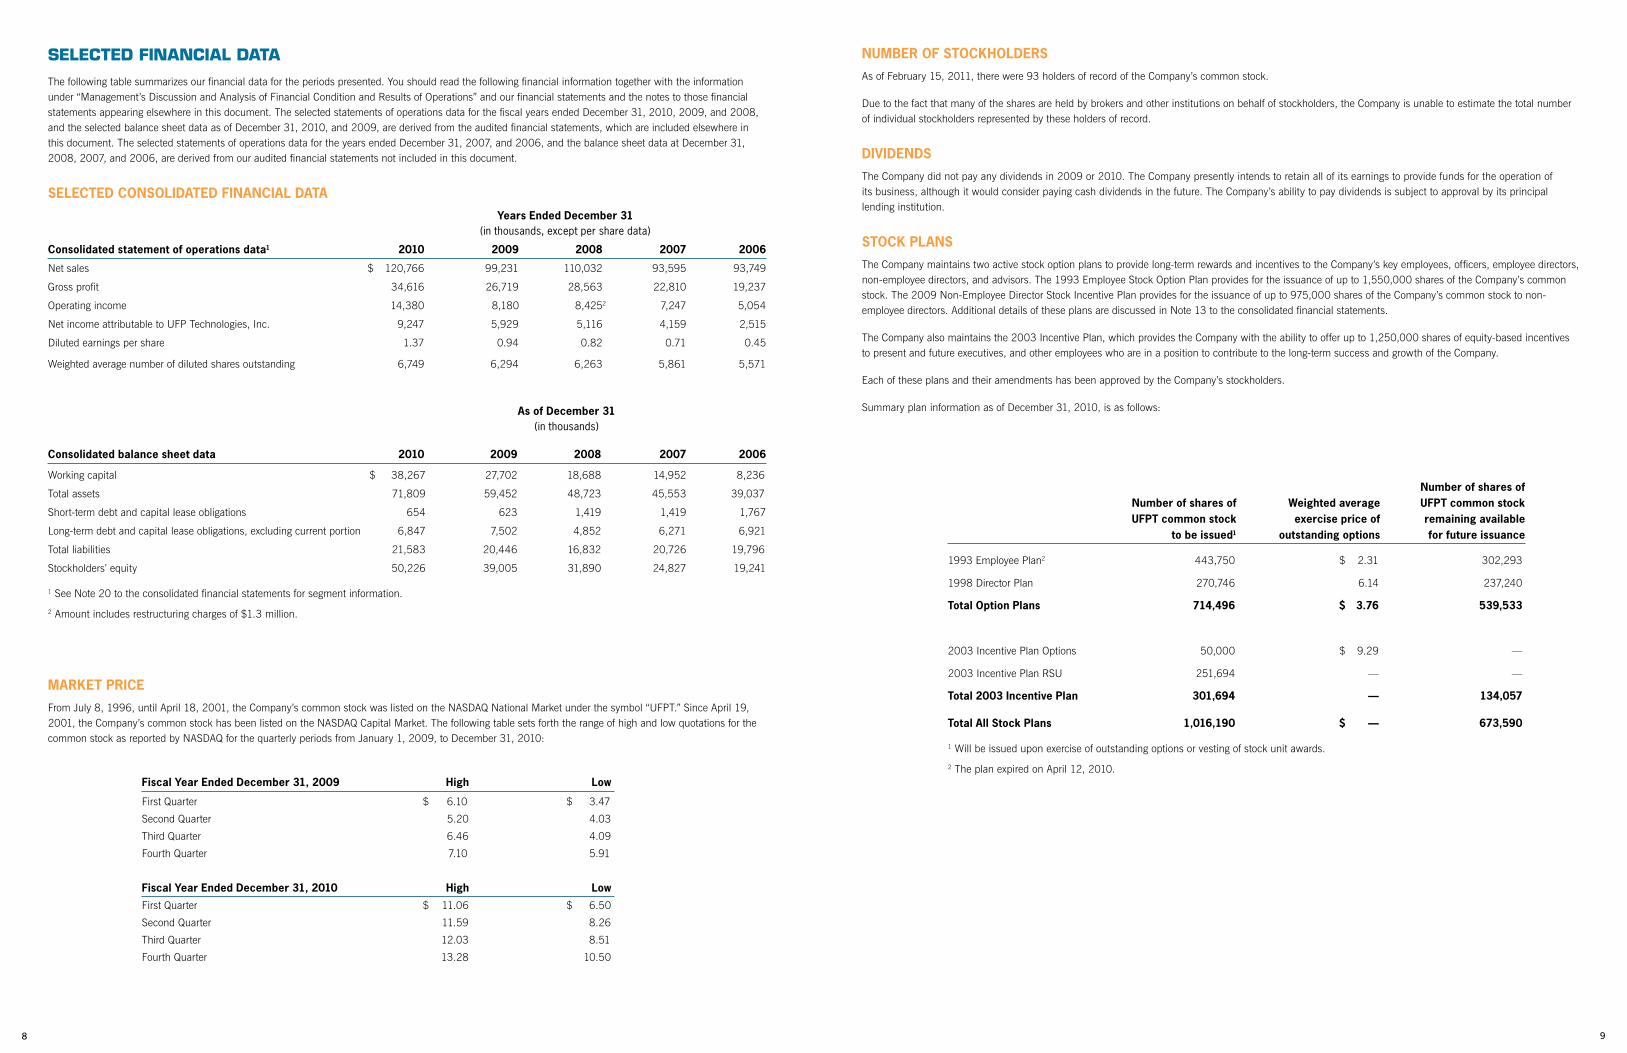
The following table summarizes our financial data for the periods presented. You should read the following financial information together with the information under “Management’s Discussion and Analysis of Financial Condition and Results of Operations” and our financial statements and the notes to those financial statements appearing elsewhere in this document. The selected statements of operations data for the fiscal years ended December 31, 2010, 2009, and 2008, and the selected balance sheet data as of December 31, 2010, and 2009, are derived from the audited financial statements, which are included elsewhere in this document. The selected statements of operations data for the years ended December 31, 2007, and 2006, and the balance sheet data at December 31, 2008, 2007, and 2006, are derived from our audited financial statements not included in this document.
selected consolIdated fInancIal data
Years ended december 31 (in thousands, except per share data)
consolidated statement of operations data1 2010 2009 2008 2007 2006
Net sales $ 120,766 99,231 110,032 93,595 93,749
Gross profit 34,616 26,719 28,563 22,810 19,237
Operating income 14,380 8,180 8,4252 7,247 5,054
Net income attributable to UFP Technologies, Inc. 9,247 5,929 5,116 4,159 2,515
Diluted earnings per share 1.37 0.94 0.82 0.71 0.45
Weighted average number of diluted shares outstanding 6,749 6,294 6,263 5,861 5,571
as of december 31 (in thousands)
consolidated balance sheet data 2010 2009 2008 2007 2006
Working capital $ 38,267 27,702 18,688 14,952 8,236
Total assets 71,809 59,452 48,723 45,553 39,037
Short-term debt and capital lease obligations 654 623 1,419 1,419 1,767
Long-term debt and capital lease obligations, excluding current portion 6,847 7,502 4,852 6,271 6,921
Total liabilities 21,583 20,446 16,832 20,726 19,796
Stockholders’ equity 50,226 39,005 31,890 24,827 19,241
1 See Note 20 to the consolidated financial statements for segment information.
2 Amount includes restructuring charges of $1.3 million.
Market prIce
From July 8, 1996, until April 18, 2001, the Company’s common stock was listed on the NASDAQ National Market under the symbol “UFPT.” Since April 19, 2001, the Company’s common stock has been listed on the NASDAQ Capital Market. The following table sets forth the range of high and low quotations for the common stock as reported by NASDAQ for the quarterly periods from January 1, 2009, to December 31, 2010:
fiscal Year ended december 31, 2009 High low
First Quarter $ 6.10 $ 3.47
Second Quarter 5.20 4.03
Third Quarter 6.46 4.09
Fourth Quarter 7.10 5.91
fiscal Year ended december 31, 2010 High low
First Quarter $ 11.06 $ 6.50
Second Quarter 11.59 8.26
Third Quarter 12.03 8.51
Fourth Quarter 13.28 10.50
nuMber of stockHolders
As of February 15, 2011, there were 93 holders of record of the Company’s common stock.
Due to the fact that many of the shares are held by brokers and other institutions on behalf of stockholders, the Company is unable to estimate the total number of individual stockholders represented by these holders of record.
dIvIdends
The Company did not pay any dividends in 2009 or 2010. The Company presently intends to retain all of its earnings to provide funds for the operation of its business, although it would consider paying cash dividends in the future. The Company’s ability to pay dividends is subject to approval by its principal lending institution.
stock plans
The Company maintains two active stock option plans to provide long-term rewards and incentives to the Company’s key employees, officers, employee directors, non-employee directors, and advisors. The 1993 Employee Stock Option Plan provides for the issuance of up to 1,550,000 shares of the Company’s common stock. The 2009 Non-Employee Director Stock Incentive Plan provides for the issuance of up to 975,000 shares of the Company’s common stock to non-employee directors. Additional details of these plans are discussed in Note 13 to the consolidated financial statements.
The Company also maintains the 2003 Incentive Plan, which provides the Company with the ability to offer up to 1,250,000 shares of equity-based incentives to present and future executives, and other employees who are in a position to contribute to the long-term success and growth of the Company.
Each of these plans and their amendments has been approved by the Company’s stockholders.
Summary plan information as of December 31, 2010, is as follows:
number of shares of number of shares of weighted average ufpt common stock ufpt common stock exercise price of remaining available to be issued1 outstanding options for future issuance
1993 Employee Plan2 443,750 $ 2.31 302,293
1998 Director Plan 270,746 6.14 237,240
total option plans 714,496 $ 3.76 539,533
2003 Incentive Plan Options 50,000 $ 9.29 —
2003 Incentive Plan RSU 251,694 — —
total 2003 Incentive plan 301,694 — 134,057
total all stock plans 1,016,190 $ — 673,590
1 Will be issued upon exercise of outstanding options or vesting of stock unit awards.
2 The plan expired on April 12, 2010.

1110
ManaGeMent’s dIscussIon and analYsIs of fInancIal condItIon and results of operatIons
overvIew
UFP Technologies is an innovative designer and custom converter of foams, plastics, and fiber products. The Company serves a myriad of markets, but specifically targets opportunities in the automotive, computer and electronics, medical, aerospace and defense, industrial, and consumer markets.
On March 9, 2009, the Company acquired selected assets of the Hillsdale, Michigan, operations of Foamade Industries, Inc. (“Foamade”), a business specializing in the fabrication of technical urethane foams for a myriad of industries. The Company transitioned the acquired assets to its Grand Rapids, Michigan, plant.
On July 7, 2009, the Company acquired substantially all of the assets of E.N. Murray Co. (“ENM”), a Denver, Colorado-based foam fabricator. ENM specialized in the fabrication of technical urethane foams, primarily for the medical industry. This acquisition brought to the Company further access and expertise in fabricating technical urethane foams and a seasoned management team.
On August 24, 2009, the Company acquired selected assets of Advanced Materials, Inc. (“AMI”), a wholly-owned subsidiary of Advanced Materials Group, Inc. Located in Rancho Dominguez, California, AMI specialized in the fabrication of technical urethane foams, primarily for the medical industry.
In 2010, the Company experienced revenue growth from its 2009 acquired businesses (which are primarily focused on the medical market) as well as increased demand for automotive interior trim parts, overlaid on a streamlined organization. As a result, the Company achieved 2010 sales and operating income growth of 22% and 76%, respectively.
The Company’s strategy includes further organic growth and growth through strategic acquisitions.
results of operatIons
The following table sets forth, for the years indicated, the percentage of revenues represented by the items as shown in the Company’s consolidated statements
of operations:
2010 coMpared to 2009
Net sales increased 21.7% to $120.8 million for the year ended December 31, 2010, from net sales of $99.2 million in the same period of 2009, driven primarily by the 2009 acquisitions of Foamade, ENM, and AMI (all within the Component Products segment). Without sales from these acquisitions for the portion of 2010 in which they were not owned in 2009, sales would have increased 10.0% to $109.1 million. The increase in sales excluding these acquisitions was largely due to increased demand for interior trim parts from the automotive industry of approximately $6.6 million (Component Products segment), as well as an increase in sales in the Packaging segment of approximately $2.3 million, due largely to the impact of the improved economy on demand for our customers’ parts.
Gross profit as a percentage of sales (“Gross Margin”) increased to 28.7% for the year ended December 31, 2010, from 26.9% in 2009. The increase in gross margin is primarily attributable to the Company’s ability to leverage sales growth against the fixed component of cost of sales (overhead), partially offset by lower-than-average margins from the increased sales of automotive trim parts (Component Products segment). Overhead as a percentage of sales decreased by 2.2% while material and direct labor collectively increased by 0.4%.
2010 2009 2008
Net sales 100.0% 100.0% 100.0% Cost of sales 71.3 73.1 74.0
Gross profit 28.7 26.9 26.0
Selling, general, and administrative expenses 16.8 18.7 17.1
Restructuring charge 0.0 0.0 1.2
operating income 11.9 8.2 7.7
Total other expenses (income), net 0.0 -0.7 0.3
Income before taxes 11.9 8.9 7.4
Income tax expense 4.1 2.9 2.7
net income attributable to consolidated operations 7.8% 6.0% 4.7%
net income attributable to non-controlling interests 0.1% 0.0% 0.0%
net income attributable to ufp technologies, Inc. 7.7% 6.0% 4.7%
Selling, General, and Administrative Expenses (“SG&A”) increased 9.2% to $20.2 million for the year ended December 31, 2010, from $18.5 million in 2009. As a percentage of sales, SG&A was 16.8% and 18.7%, respectively, for the years ended December 31, 2010, and 2009. The increase in SG&A for the year ended December 31, 2010, is primarily due to increased SG&A associated with newly acquired companies of approximately $1.2 million (Component Products segment) and increased variable-based compensation of approximately $500,000 (primarily Component Products segment). The decrease in SG&A as a percentage of sales is primarily a result of the fixed-cost components of SG&A being measured against higher sales.
Interest expense net of interest income decreased to approximately $116,000 for the year ended December 31, 2010, from interest expense of approximately $233,000 in 2009. The decrease in interest expense is primarily attributable to higher interest earned on excess cash balances, as well as lower interest paid on declining term debt balances.
The Company recorded income tax expense as a percentage of pre-tax income of 34.8% and 32.0% for the year ended December 31, 2010 and 2009, respectively. The increase in effective tax rate for 2010 is primarily due to the non-taxable gains recorded on the acquisitions of Foamade, ENM, and AMI in 2009. The Company has deferred tax assets on its books associated with net operating losses generated in previous years. The Company has considered both positive and negative available evidence in its determination that the deferred tax assets will be realized, and has not recorded a tax valuation allowance at December 31, 2010. The Company will continue to assess the realizability of deferred tax assets and, when appropriate, will record a valuation allowance against these assets. The amount of the net deferred tax asset considered realizable, however, could be reduced in the near term, if estimates of future taxable income during the carryforward period are reduced.
2009 coMpared to 2008
Net sales decreased 9.8% to $99.2 million in the year ended December 31, 2009, from $110.0 million in the same period of 2008. Without sales from its newly acquired Foamade, ENM, and AMI operations (all within the Component Products segment), sales would have declined 19.5% for the year ended December 31, 2009. Sales in the Component Products segment (including those from the newly acquired operations) increased slightly to $61.0 million in 2009, from $60.8 million in 2008. Without sales from the newly acquired operations, Component Products sales would have declined 17.3% to $50.4 million for the year ended December 31, 2009. This decrease in sales is primarily due to a decrease in sales to the automotive industry of approximately $9.6 million. Sales in the Packaging segment decreased 22.2% to $38.2 million for the year ended December 31, 2009, from $49.2 million in the same period of 2008. The decrease in sales is largely due to a decrease in sales of $3.9 million to a key electronics customer and overall reduced demand for packaging because of the impact of the poor economy on demand for our customers’ products, partially offset by an increase in demand for environmentally-friendly molded fiber packaging of approximately $700,000.
Gross profit as a percentage of sales (“Gross Margin”) increased to 26.9% in 2009 from 26.0% in 2008. The improvement in gross margin is primarily attributable to Company-wide manufacturing efficiency and cost-cutting initiatives, as well as a favorable shift in product mix (lower auto sales); material cost as a percentage of sales is down 1.2%, partially offset by higher overhead as a percentage of sales due to the fixed-cost components of overhead measured against lower sales.
Selling, General, and Administrative Expenses (“SG&A”) decreased 1.5% to $18.5 million for the year ended December 31, 2009, from $18.8 million in 2008. As a percentage of sales, SG&A was 18.7% and 17.1% in the years ended December 31, 2009, and 2008, respectively. The decline in SG&A for the year ended December 31, 2009, is primarily due to reduced administrative variable compensation of approximately $900,000 (both business segments) and reduced SG&A associated with the consolidation of the Company’s two Michigan facilities of approximately $550,000 (Component Products segment), partially offset by SG&A associated with newly acquired companies of approximately $1.3 million (Component Products segment). The increase in SG&A as a percentage of sales is primarily a result of the fixed-cost components of SG&A being measured against lower sales.
The Company recorded a restructuring charge of approximately $1.3 million during the year ended December 31, 2008, associated with the consolidation of its Macomb Township, Michigan, automotive operations into its newly acquired plant in Grand Rapids, Michigan. The $1.3 million charge was for the costs associated with vacating the Macomb Township premises, severance, relocation, and stay-bonuses for its employees, equipment moving and hook-up costs, and training and other start-up costs. As of December 31, 2008, the move was completed and all significant costs had been incurred. The Company believes cost savings exceeded $1.4 million as a result of the consolidation for the fiscal year ended December 31, 2009.
The Company recorded acquisition-related gains of approximately $840,000 for the year ended December 31, 2009. The acquisitions of Foamade, ENM, and AMI all resulted in bargain purchase gains, as the consideration paid was less than the fair market value of the net assets acquired. The Company believes the net assets were acquired at a bargain purchase due to the overall weak economy.
Interest expense decreased to approximately $233,000 for the year ended December 31, 2009, from $334,000 in 2008. The decrease in interest expense is primarily attributable to lower average interest rates.
The Company recorded income tax expense as a percentage of pre-tax income of 32.0% and 36.9% for the years ended December 31, 2009, and 2008, respectively. The primary reason for the decrease in income tax expense as a percentage of pre-tax income is due to the non-taxable gains recorded on the acquisitions of Foamade, ENM, and AMI. The Company has deferred tax assets on its books associated with net operating losses generated in previous years. The Company has considered both positive and negative available evidence in its determination that the deferred tax assets will be realized, and has not recorded a tax valuation allowance at December 31, 2009. The Company will continue to assess the realizability of deferred tax assets created by recording tax benefits on operating losses and, when appropriate, will record a valuation allowance against these assets. The amount of the net deferred tax asset considered realizable, however, could be reduced in the near term, if estimates of future taxable income during the carryforward period are reduced.
1312
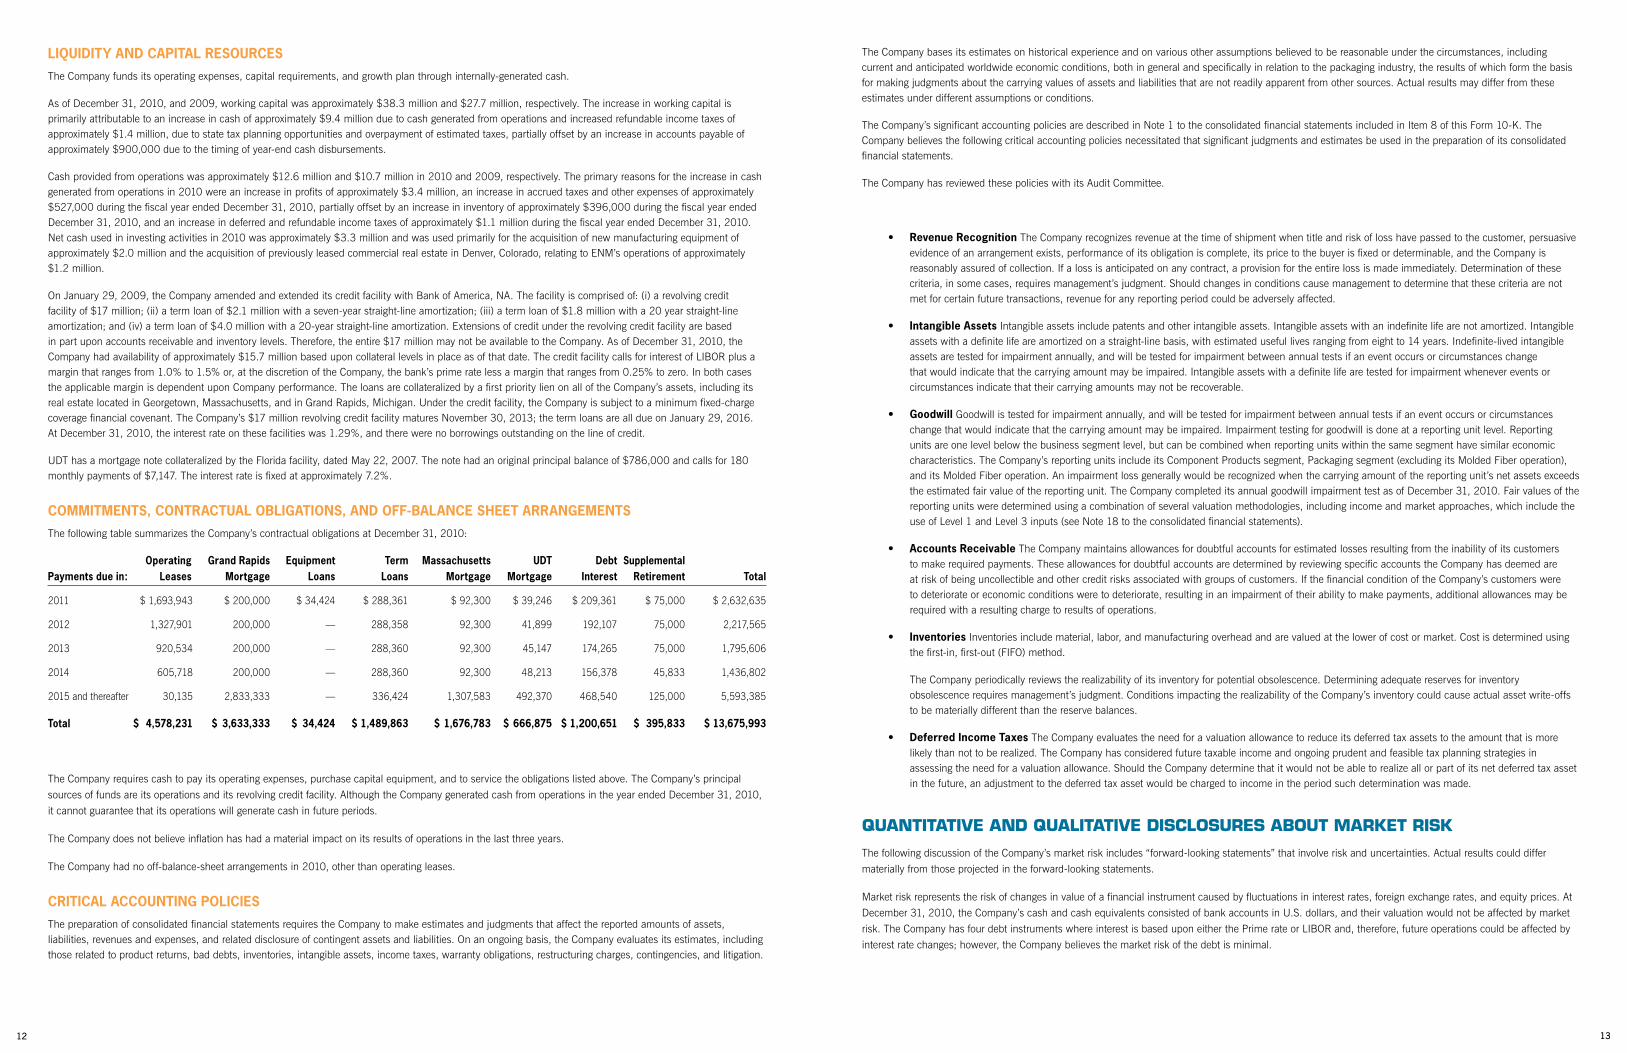
lIquIdItY and capItal resources
The Company funds its operating expenses, capital requirements, and growth plan through internally-generated cash.
As of December 31, 2010, and 2009, working capital was approximately $38.3 million and $27.7 million, respectively. The increase in working capital is primarily attributable to an increase in cash of approximately $9.4 million due to cash generated from operations and increased refundable income taxes of approximately $1.4 million, due to state tax planning opportunities and overpayment of estimated taxes, partially offset by an increase in accounts payable of approximately $900,000 due to the timing of year-end cash disbursements.
Cash provided from operations was approximately $12.6 million and $10.7 million in 2010 and 2009, respectively. The primary reasons for the increase in cash generated from operations in 2010 were an increase in profits of approximately $3.4 million, an increase in accrued taxes and other expenses of approximately $527,000 during the fiscal year ended December 31, 2010, partially offset by an increase in inventory of approximately $396,000 during the fiscal year ended December 31, 2010, and an increase in deferred and refundable income taxes of approximately $1.1 million during the fiscal year ended December 31, 2010. Net cash used in investing activities in 2010 was approximately $3.3 million and was used primarily for the acquisition of new manufacturing equipment of approximately $2.0 million and the acquisition of previously leased commercial real estate in Denver, Colorado, relating to ENM’s operations of approximately $1.2 million.
On January 29, 2009, the Company amended and extended its credit facility with Bank of America, NA. The facility is comprised of: (i) a revolving credit facility of $17 million; (ii) a term loan of $2.1 million with a seven-year straight-line amortization; (iii) a term loan of $1.8 million with a 20 year straight-line amortization; and (iv) a term loan of $4.0 million with a 20-year straight-line amortization. Extensions of credit under the revolving credit facility are based in part upon accounts receivable and inventory levels. Therefore, the entire $17 million may not be available to the Company. As of December 31, 2010, the Company had availability of approximately $15.7 million based upon collateral levels in place as of that date. The credit facility calls for interest of LIBOR plus a margin that ranges from 1.0% to 1.5% or, at the discretion of the Company, the bank’s prime rate less a margin that ranges from 0.25% to zero. In both cases the applicable margin is dependent upon Company performance. The loans are collateralized by a first priority lien on all of the Company’s assets, including its real estate located in Georgetown, Massachusetts, and in Grand Rapids, Michigan. Under the credit facility, the Company is subject to a minimum fixed-charge coverage financial covenant. The Company’s $17 million revolving credit facility matures November 30, 2013; the term loans are all due on January 29, 2016. At December 31, 2010, the interest rate on these facilities was 1.29%, and there were no borrowings outstanding on the line of credit.
UDT has a mortgage note collateralized by the Florida facility, dated May 22, 2007. The note had an original principal balance of $786,000 and calls for 180 monthly payments of $7,147. The interest rate is fixed at approximately 7.2%.
coMMItMents, contractual oblIGatIons, and off-balance sHeet arranGeMents
The following table summarizes the Company’s contractual obligations at December 31, 2010:
operating Grand rapids equipment term Massachusetts udt debt supplementalpayments due in: leases Mortgage loans loans Mortgage Mortgage Interest retirement total
2011 $ 1,693,943 $ 200,000 $ 34,424 $ 288,361 $ 92,300 $ 39,246 $ 209,361 $ 75,000 $ 2,632,635
2012 1,327,901 200,000 — 288,358 92,300 41,899 192,107 75,000 2,217,565
2013 920,534 200,000 — 288,360 92,300 45,147 174,265 75,000 1,795,606
2014 605,718 200,000 — 288,360 92,300 48,213 156,378 45,833 1,436,802
2015 and thereafter 30,135 2,833,333 — 336,424 1,307,583 492,370 468,540 125,000 5,593,385
total $ 4,578,231 $ 3,633,333 $ 34,424 $ 1,489,863 $ 1,676,783 $ 666,875 $ 1,200,651 $ 395,833 $ 13,675,993
The Company requires cash to pay its operating expenses, purchase capital equipment, and to service the obligations listed above. The Company’s principal
sources of funds are its operations and its revolving credit facility. Although the Company generated cash from operations in the year ended December 31, 2010,
it cannot guarantee that its operations will generate cash in future periods.
The Company does not believe inflation has had a material impact on its results of operations in the last three years.
The Company had no off-balance-sheet arrangements in 2010, other than operating leases.
crItIcal accountInG polIcIes
The preparation of consolidated financial statements requires the Company to make estimates and judgments that affect the reported amounts of assets, liabilities, revenues and expenses, and related disclosure of contingent assets and liabilities. On an ongoing basis, the Company evaluates its estimates, including those related to product returns, bad debts, inventories, intangible assets, income taxes, warranty obligations, restructuring charges, contingencies, and litigation.
The Company bases its estimates on historical experience and on various other assumptions believed to be reasonable under the circumstances, including current and anticipated worldwide economic conditions, both in general and specifically in relation to the packaging industry, the results of which form the basis for making judgments about the carrying values of assets and liabilities that are not readily apparent from other sources. Actual results may differ from these estimates under different assumptions or conditions.
The Company’s significant accounting policies are described in Note 1 to the consolidated financial statements included in Item 8 of this Form 10-K. The Company believes the following critical accounting policies necessitated that significant judgments and estimates be used in the preparation of its consolidated financial statements.
The Company has reviewed these policies with its Audit Committee.
• RevenueRecognitionThe Company recognizes revenue at the time of shipment when title and risk of loss have passed to the customer, persuasive evidence of an arrangement exists, performance of its obligation is complete, its price to the buyer is fixed or determinable, and the Company is reasonably assured of collection. If a loss is anticipated on any contract, a provision for the entire loss is made immediately. Determination of these criteria, in some cases, requires management’s judgment. Should changes in conditions cause management to determine that these criteria are not met for certain future transactions, revenue for any reporting period could be adversely affected.
• IntangibleAssets Intangible assets include patents and other intangible assets. Intangible assets with an indefinite life are not amortized. Intangible assets with a definite life are amortized on a straight-line basis, with estimated useful lives ranging from eight to 14 years. Indefinite-lived intangible assets are tested for impairment annually, and will be tested for impairment between annual tests if an event occurs or circumstances change that would indicate that the carrying amount may be impaired. Intangible assets with a definite life are tested for impairment whenever events or circumstances indicate that their carrying amounts may not be recoverable.
• GoodwillGoodwill is tested for impairment annually, and will be tested for impairment between annual tests if an event occurs or circumstances change that would indicate that the carrying amount may be impaired. Impairment testing for goodwill is done at a reporting unit level. Reporting units are one level below the business segment level, but can be combined when reporting units within the same segment have similar economic characteristics. The Company’s reporting units include its Component Products segment, Packaging segment (excluding its Molded Fiber operation), and its Molded Fiber operation. An impairment loss generally would be recognized when the carrying amount of the reporting unit’s net assets exceeds the estimated fair value of the reporting unit. The Company completed its annual goodwill impairment test as of December 31, 2010. Fair values of the reporting units were determined using a combination of several valuation methodologies, including income and market approaches, which include the use of Level 1 and Level 3 inputs (see Note 18 to the consolidated financial statements).
• AccountsReceivable The Company maintains allowances for doubtful accounts for estimated losses resulting from the inability of its customers to make required payments. These allowances for doubtful accounts are determined by reviewing specific accounts the Company has deemed are at risk of being uncollectible and other credit risks associated with groups of customers. If the financial condition of the Company’s customers were to deteriorate or economic conditions were to deteriorate, resulting in an impairment of their ability to make payments, additional allowances may be required with a resulting charge to results of operations.
• Inventories Inventories include material, labor, and manufacturing overhead and are valued at the lower of cost or market. Cost is determined using the first-in, first-out (FIFO) method.
The Company periodically reviews the realizability of its inventory for potential obsolescence. Determining adequate reserves for inventory obsolescence requires management’s judgment. Conditions impacting the realizability of the Company’s inventory could cause actual asset write-offs to be materially different than the reserve balances.
• DeferredIncomeTaxesThe Company evaluates the need for a valuation allowance to reduce its deferred tax assets to the amount that is more likely than not to be realized. The Company has considered future taxable income and ongoing prudent and feasible tax planning strategies in assessing the need for a valuation allowance. Should the Company determine that it would not be able to realize all or part of its net deferred tax asset in the future, an adjustment to the deferred tax asset would be charged to income in the period such determination was made.
quantitative anD qualitative DiSCloSureS about market riSk
The following discussion of the Company’s market risk includes “forward-looking statements” that involve risk and uncertainties. Actual results could differ
materially from those projected in the forward-looking statements.
Market risk represents the risk of changes in value of a financial instrument caused by fluctuations in interest rates, foreign exchange rates, and equity prices. At
December 31, 2010, the Company’s cash and cash equivalents consisted of bank accounts in U.S. dollars, and their valuation would not be affected by market
risk. The Company has four debt instruments where interest is based upon either the Prime rate or LIBOR and, therefore, future operations could be affected by
interest rate changes; however, the Company believes the market risk of the debt is minimal.

1514
report oF inDepenDent regiStereD publiC aCCounting Firm
the board of directors and stockholders
ufp technologies, Inc.
Georgetown, Ma
We have audited the accompanying consolidated balance sheets of UFP Technologies, Inc. and subsidiaries as of December 31, 2010 and 2009, and the related consolidated statements of operations, stockholders’ equity and cash flows for each of the years in the three year period ended December 31, 2010. Our audits also included the financial statement schedule for each of the years in the three year period ended December 31, 2010 as listed in the index at Item 15(a)(2). UFP Technologies, Inc.’s management is responsible for these consolidated financial statements and schedule. Our responsibility is to express an opinion on these consolidated financial statements and schedule based on our audits.
We conducted our audits in accordance with the standards of the Public Company Accounting Oversight Board (United States). Those standards require that we plan and perform the audits to obtain reasonable assurance about whether the consolidated financial statements are free of material misstatement. The Company is not required to have, nor were we engaged to perform, an audit of its internal control over financial reporting. Our audits included consideration of internal control over financial reporting as a basis for designing audit procedures that are appropriate in the circumstances, but not for the purpose of expressing an opinion on the effectiveness of the Company’s internal control over financial reporting. Accordingly, we express no such opinion. An audit also includes examining, on a test basis, evidence supporting the amounts and disclosures in the consolidated financial statements, assessing the accounting principles used and significant estimates made by management, as well as evaluating the overall financial statement presentation. We believe that our audits provide a reasonable basis for our opinion.
In our opinion, the consolidated financial statements referred to above present fairly, in all material respects, the consolidated financial position of UFP Technologies, Inc. and subsidiaries as of December 31, 2010 and 2009, and the results of their operations and their cash flows for each of the years in the three year period ended December 31, 2010 in conformity with accounting principles generally accepted in the United States of America. Also, in our opinion, the related financial statement schedule when considered in relation to the basic consolidated financial statements taken as a whole, presents fairly in all material respects the information set forth therein.
Westborough, Massachusetts
March 16, 2011
ConSoliDateD balanCe SheetS december 31
assets 2010 2009
Current assets:
Cash and cash equivalents (UDT: $277,698 and $166,940, respectively) $ 24,433,761 $ 14,998,514
Receivables, net 14,633,375 14,218,005
Inventories, net 8,044,336 7,647,517
Prepaid expenses 1,035,301 476,381
Refundable income taxes 1,414,026 —
Deferred income taxes 1,208,848 1,410,780
total current assets 50,769,647 38,751,197
Property, plant, and equipment (UDT: $2,756,792 and $2,731,792, respectively) 45,457,275 43,582,578
Less accumulated depreciation and amortization (UDT: $1,640,818 and $1,543,826, respectively) (32,882,135) (31,364,683)
Net property, plant, and equipment 12,575,140 12,217,895
Goodwill 6,481,037 6,481,037
Intangible Assets 593,829 817,737
Other assets 1,389,375 1,183,930
total assets $ 71,809,028 $ 59,451,796
lIabIlItIes and stockHolders’ equItY Current liabilities:
Accounts payable $ 5,168,589 $ 4,273,625
Accrued taxes and other expenses (UDT: $12,900 and $12,900, respectively) 6,679,381 6,152,826
Current installments of long-term debt (UDT: $39,246 and $36,591, respectively) 654,331 623,007
total current liabilities 12,502,301 11,049,458
Long-term debt, excluding current installments (UDT: $627,629 and $666,750, respectively) 6,846,947 7,501,823
Deferred income taxes 880,775 776,877
Retirement and other liabilities 1,352,529 1,118,197
total liabilities 21,582,552 20,446,355
Commitments and contingencies (Note 16)
Stockholders’ equity:
Preferred stock, $.01 par value. Authorized 1,000,000 shares; no shares issued or outstanding — —
Common stock, $0.1 par value. Authorized 20,000,000 shares; issued and outstanding 6,338,829 shares in 2010 and 5,945,357 shares in 2009 63,388 59,454
Additional paid-in capital 16,924,197 15,009,613
Retained earnings 32,712,904 23,465,812
total ufp technologies, Inc. stockholders’ equity 49,700,489 38,534,879
Non-controlling interests 525,987 470,562
total stockholders’ equity 50,226,476 39,005,441
total liabilities and stockholders’ equity $ 71,809,028 $ 59,451,796
The accompanying notes are an integral part of these consolidated financial statements.

1716
ConSoliDateD StatementS oF operationS
Years ended december 31
2010 2009 2008
Net sales $ 120,766,450 $ 99,231,334 $ 110,031,601
Cost of sales 86,150,720 72,511,919 81,468,539
Gross profit 34,615,730 26,719,415 28,563,062
Selling, general, and administrative expenses 20,235,540 18,539,005 18,822,965
Restructuring charge — — 1,315,366
operating Income 14,380,190 8,180,410 8,424,731
Other income (expense): Interest expense, net (115,537) (232,747) (334,293)
Equity in net income of unconsolidated partnership — — 7,218
Other, net 162,000 11,206 57,457
Gains on acquisitions — 839,690 —
Total other (expense) income 46,463 618,149 (269,618)
Income before income tax provision 14,426,653 8,798,559 8,155,113
Income tax expense 5,019,136 2,816,575 2,994,648
Net income from consolidated operations 9,407,517 5,981,984 5,160,465
Net income attributable to non-controlling interests (160,425) (52,559) (44,465)
net income attributable
to ufp technologies, Inc. $ 9,247,092 $ 5,929,425 $ 5,116,000
Net income per share:
Basic $ 1.50 $ 1.02 $ 0.92
Diluted $ 1.37 $ 0.94 $ 0.82
Weighted average common shares:
Basic 6,157,310 5,829,580 5,549,830
Diluted 6,749,062 6,293,964 6,262,666
The accompanying notes are an integral part of these consolidated financial statements.
ConSoliDateD StatementS oF StoCkholDerS’ equity
Years ended December 31, 2010, 2009, and 2008
additional non- total common stock paid-in retained controlling stockholders’ shares amount capital earnings Interests equity
balance at december 31, 2007 5,375,381 $ 53,754 $ 11,768,799 $ 12,420,387 $ 583,533 $ 24,826,473
Stock issued under Employee Stock Purchase Plan 2,817 28 20,535 — — 20,563
Stock issued in lieu of compensation 55,644 556 343,324 — — 343,880
Share-based compensation 93,680 937 1,304,852 — — 1,305,789
Exercise of stock options 139,181 1,392 331,634 — — 333,026
Net share settlement of restricted stock units — — (206,044) — — (206,044)
Excess tax benefits on share-based compensation — — 211,234 — — 211,234
Net income — — — 5,116,000 44,465 5,160,465
Distribution to non-contolling interests — — — — (104,995) (104,995)
balance at december 31, 2008 5,666,703 $ 56,667 $ 13,774,334 $ 17,536,387 $ 523,003 $ 31,890,391
Stock issued in lieu of compensation 43,279 433 183,067 — — 183,500
Share-based compensation 196,000 1,960 898,853 — — 900,813
Exercise of stock options 39,375 394 129,938 — — 130,332
Excess tax benefits on share-based compensation — — 23,421 — — 23,421
Net income — — — 5,929,425 52,559 5,981,984
Distribution to non-contolling interests — — — — (105,000) (105,000)
balance at december 31, 2009 5,945,357 $ 59,454 $ 15,009,613 $ 23,465,812 $ 470,562 $ 39,005,441
Stock issued in lieu of compensation 10,291 103 79,145 — — 79,248
Share-based compensation 108,421 1,084 962,626 — — 963,710
Exercise of stock options, net of shares presented for exercise 274,760 2,747 504,309 — — 507,056
Net share settlement of restricted stock unit and stock option tax withholding — — (485,511) — — (485,511)
Excess tax benefits on share-based compensation — — 854,015 — — 854,015
Net income — — — 9,247,092 160,425 9,407,517
Distribution to non-contolling interests — — — — (105,000) (105,000)
balance at december 31, 2010 6,338,829 $ 63,388 $ 16,924,197 $ 32,712,904 $ 525,987 $ 50,226,476
The accompanying notes are an integral part of these consolidated financial statements.

1918
ConSoliDateD StatementS oF CaSh FlowS
Years ended december 31
2010 2009 2008
Cash flows from operating activities:
Net income $ 9,407,517 $ 5,981,984 $ 5,160,465
Adjustments to reconcile net income to net cash
provided by operating activities:
Depreciation and amortization 3,152,193 2,895,062 2,976,550
Restructuring charge—leasehold improvement write-off — — 170,000
Equity in net income of unconsolidated affiliate and partnership — — (7,218)
Gain on disposal of property, plant, and equipment (12,000) (11,206) (57,457)
Gain on acquisitions — (839,690) —
Share-based compensation 963,710 900,813 1,305,789
Stock issued in lieu of compensation 79,248 183,500 343,880
Deferred income taxes 305,830 226,950 16,469
Changes in operating assets and liabilities, net of effects
from acquisition:
Receivables, net (415,370) (341,536) 777,392
Inventories, net (396,819) 1,863,118 (434,506)
Prepaid expenses (558,920) 72,715 350,013
Refundable income taxes (1,414,026) — —
Accounts payable 894,964 392,641 (2,776,715)
Accrued taxes and other expenses 526,555 (330,726) (937,577)
Retirement and other liabilities 234,332 204,553 (119,173)
Other assets (205,445) (509,425) (98,161)
net cash provided by operating activities 12,561,769 10,688,753 6,669,751
Cash flows from investing activities:
Additions to property, plant, and equipment (3,285,530) (1,856,837) (2,763,250)
Acquisition of Stephenson & Lawyer net of cash acquired — — (5,181,066)
Acquisition of Foamade Industries, Inc.’s assets — (375,000) —
Acquisition of E.N. Murray Co. net of cash acquired — (1,440,534) —
Acquisition of Advanced Materials Group assets — (620,000) —
Payments received on affiliated partnership — — 7,218
Proceeds from sale of property, plant, and equipment 12,000 13,364 101,020
net cash used in investing activities (3,273,530) (4,279,007) (7,836,078)
Cash flows from financing activities:
Distribution to United Development Company Partners
(non-controlling interest) (105,000) (105,000) (104,995)
Excess tax benefits on share-based compensation 854,015 23,421 211,234
Proceeds from sale of common stock — — 20,563
Proceeds from exercise of stock options 507,056 130,332 333,026
Principal repayment of long-term debt (623,552) (576,690) (714,027)
Principal repayment of obligations under capital leases — (1,612,665) (704,407)
Payment of statutory withholdings for stock options exercised and restricted stock units vested (485,511) — (206,044)
Proceeds from long-term borrowings — 4,000,000 —
net cash provided by (used in) financing activities 147,008 1,859,398 (1,164,650)
Net change in cash 9,435,247 8,269,144 (2,330,977)
Cash and cash equivalents at beginning of year 14,998,514 6,729,370 9,060,347
cash and cash equivalents at end of year $ 24,433,761 $ 14,998,514 $ 6,729,370
The accompanying notes are an integral part of these consolidated financial statements.
noteS to ConSoliDateD FinanCial StatementS
December 31, 2010, and 2009
(1) summary of significant accounting policies
UFP Technologies, Inc. (“the Company”) is an innovative designer and custom converter of foams, plastics, and natural fiber products principally serving the
medical, automotive, aerospace and defense, computer and electronics, consumer, and industrial markets. The Company was incorporated in the State of
Delaware in 1993.
(a) Principles of ConsolidationThe consolidated financial statements include the accounts and results of operations of UFP Technologies, Inc., its wholly-owned subsidiaries,
Moulded Fibre Technology, Inc., Simco Industries, Inc. and its wholly-owned subsidiary Simco Automotive Trim, Inc., and Stephenson & Lawyer, Inc.
and its wholly-owned subsidiary, Patterson Properties Corporation. The Company also consolidates United Development Company Limited, of which
the Company owns 26.32% (see Note 8). All significant inter-company balances and transactions have been eliminated in consolidation.
(b) Accounts ReceivableThe Company periodically reviews the collectability of its accounts receivable. Provisions are recorded for accounts that are potentially uncollectible.
Determining adequate reserves for accounts receivable requires management’s judgment. Conditions impacting the realizability of the Company’s
receivables could cause actual asset write-offs to be materially different than the reserved balances as of December 31, 2010.
(c) InventoriesInventories include material, labor, and manufacturing overhead and are valued at the lower of cost or market. Cost is determined using the first-in,
first-out (FIFO) method.
The Company periodically reviews the realizability of its inventory for potential obsolescence. Determining adequate reserves for inventory
obsolescence requires management’s judgment. Conditions impacting the realizability of the Company’s inventory could cause actual asset write-offs
to be materially different than the reserve balances as of December 31, 2010.
(d) Property, Plant, and EquipmentProperty, plant, and equipment are stated at cost and are depreciated or amortized using the straight-line method over the estimated useful lives of the assets or the related lease term, if shorter (for financial statement purposes) and accelerated methods (for income tax purposes). Certain manufacturing machines that are dedicated to a specific program – where total units to be produced over the life of the program are estimable – are depreciated using the modified units of production method for financial statement purposes.
Estimated useful lives of property, plant, and equipment are as follows:
Leasehold improvements Shorter of estimated useful life or remaining lease term Buildings and improvements 31.5 years Equipment 8–10 years Furniture and fixtures 5–7 years
Property, plant, and equipment amounts are reviewed for impairment whenever events or changes in circumstances indicate that the carrying
amount of an asset may not be recoverable. An impairment loss would be recognized when the carrying amount of an asset exceeds the estimated
undiscounted future cash flows expected to result from the use of the asset and its eventual disposition. The amount of the impairment loss to be
recorded is calculated by the excess of the asset’s carrying value over its fair value.
(e) Income TaxesThe Company’s income taxes are accounted for under the asset and liability method. Under the asset and liability method, deferred tax assets and
liabilities are recognized for the estimated future tax consequences attributable to differences between the financial statement carrying amounts of
existing assets and liabilities and their respective tax basis and operating loss and tax credit carryforwards. Deferred tax expense (benefit) results
from the net change during the year in deferred tax assets and liabilities. The effect on deferred tax assets and liabilities of a change in tax rates is
recognized in income in the period that includes the enactment date.
The Company evaluates the need for a valuation allowance to reduce its deferred tax assets to the amount that is more likely than not to be realized.
The Company has considered future taxable income and ongoing prudent and feasible tax planning strategies in assessing the need for a valuation
allowance. Should the Company determine that it would not be able to realize all or part of its deferred tax assets in the future, an adjustment to the
deferred tax assets would be charged to income in the period such determination was made.

2120
The Company recognizes the tax benefit from an uncertain tax position only if it is more likely than not that the tax position will be sustained
on examination by the taxing authorities, based on the technical merits of the position. The tax benefits recognized in the consolidated financial
statements from such positions are then measured based on the largest benefit that has a greater than 50% likelihood of being realized upon
settlement. The Company recognizes interest and penalties accrued related to unrecognized tax benefits in tax expense.
(f) Revenue RecognitionThe Company recognizes revenue at the time of shipment when title and risk of loss have passed to the customer, persuasive evidence of an
arrangement exists, performance of its obligation is complete, its price to the buyer is fixed or determinable, and the Company is reasonably assured
of collection. If a loss is anticipated on any contract, a provision for the entire loss is made immediately. Determination of these criteria, in some cases,
requires management’s judgment.
(g) Investments in Realty PartnershipThe Company has invested in Lakeshore Estates Associates, a realty limited partnership. The Lakeshore Estates investment is stated at cost, plus or
minus the Company’s proportionate share of the limited partnership’s income or losses, less any distributions received from the limited partnership.
The Company has recognized its share of Lakeshore Estates Associates’ losses only to the extent of its original investment in, and advances to, this
partnership. The Company’s carrying amount for this investment is zero at December 31, 2010, and 2009, respectively.
(h) GoodwillGoodwill is tested for impairment annually, and will be tested for impairment between annual tests if an event occurs or circumstances change that
would indicate that the carrying amount may be impaired. Impairment testing for goodwill is done at a reporting unit level. Reporting units are one
level below the business segment level, but can be combined when reporting units within the same segment have similar economic characteristics.
The Company’s reporting units include its Component Products segment, Packaging segment (excluding its Molded Fiber operation), and its Molded
Fiber operation. An impairment loss generally would be recognized when the carrying amount of the reporting unit’s net assets exceeds the estimated
fair value of the reporting unit. The Company completed its most recent annual goodwill impairment test as of December 31, 2010. Fair values of the
reporting units were determined using several valuation methodologies, including a combination of income and market approaches, which include the
use of Level 1 and Level 3 inputs (see Note 18). There was no goodwill impairment in 2010, 2009, or 2008.
(i) Intangible AssetsIntangible assets include patents and other intangible assets. Intangible assets with an indefinite life are not amortized. Intangible assets with a
definite life are amortized on a straight-line basis, with estimated useful lives ranging from 5 to 14 years. Indefinite-lived intangible assets are tested for
impairment annually, and will be tested for impairment between annual tests if an event occurs or circumstances change that would indicate that the
carrying amount may be impaired. Intangible assets with a definite life are tested for impairment whenever events or circumstances indicate that their
carrying values may not be recoverable.
(j) Cash and Cash EquivalentsThe Company considers all highly liquid investments with original maturities of three months or less to be cash equivalents. At December 31, 2010,
and 2009, cash equivalents primarily consisted of money market accounts and certificates of deposit that are readily convertible into cash. The
Company utilizes zero-balance disbursement accounts to manage its funds. As such, outstanding checks at the end of a year are reclassified to
accounts payable. At December 31, 2010, and 2009, the amount reclassified was approximately $2.3 million and $1.6 million, respectively.
The Company maintains its cash in bank deposit accounts, money market funds, and certificates of deposit that at times exceed federally insured
limits. The Company periodically reviews the financial stability of institutions holding its accounts, and does not believe it is exposed to any significant
custodial credit risk on cash.
(k) Use of EstimatesThe preparation of consolidated financial statements in conformity with accounting principles generally accepted in the United States of America
requires management to make estimates and assumptions that affect the reported amounts of assets and liabilities, and disclosure of contingent assets
and liabilities at the date of the consolidated financial statements, and the reported amounts of revenues and expenses during the reporting period.
Actual results could differ from those estimates.
(l) Segments and Related InformationThe Company follows the provisions of ASC 280, Segment Reporting, which establish standards for the way public business enterprises report
information and operating segments in annual financial statements, and requires reporting of selected information in interim financial reports
(see Note 20).
(m) Share-Based CompensationWhen accounting for equity instruments exchanged for employee services, share-based compensation cost is measured at the grant date, based on
the calculated fair value of the award, and is recognized as an expense over the employee’s requisite service period (generally the vesting period of the
equity grant).
Share-based compensation cost that has been charged against income for stock compensation plans is as follows:
Year ended december 31 2010 2009 2008
Selling, general, and administrative expense $ 963,710 $ 900,813 $ 1,305,789
The compensation expense for stock options granted during the three-year period ended December 31, 2010, was determined as the intrinsic fair
market value of the options, using a lattice-based option valuation model with the assumptions noted as follows:
Year ended december 31 2010 2009 2008
Expected volatility 65.8% to 83.4% 68.8% to 84.6% 88.0%
Expected dividends None None None
Risk-free interest rate 2.0% to 3.2% 3.6% 4.0%
Exercise price Closing price on Closing price on Closing price on
date of grant date of grant date of grant
Imputed life 4.1 to 7.9 years (output in 4.1 to 7.9 years (output in 7.9 years (output in
lattice-based model) lattice-based model) lattice-based model)
The stock volatility for each grant is determined based on a review of the experience of the weighted average of historical daily price changes of the
Company’s common stock over the expected option term, and the risk-free rate is based on the U.S. Treasury yield curve in effect at the time of grant
for periods corresponding with the expected life of the option.
The weighted average grant date fair value of options granted during 2010, 2009, and 2008 was $3.89, $1.83, and $2.87, respectively. Tax benefits
totaling $854,015, $23,421, and $211,234 were recognized as additional paid-in capital during the years ended December 31, 2010, 2009, and
2008, respectively, since the Company’s tax deductions exceeded the share-based compensation change recognized for stock options exercised.
The total income tax benefit recognized in the statement of operations for share-based compensation arrangements was approximately $316,600,
$291,000, and $458,000 for the years ended December 31, 2010, 2009, and 2008, respectively.
(n) Deferred RentThe Company accounts for escalating rental payments on a straight-line basis over the term of the lease.
(o) Shipping and Handling CostsCosts incurred related to shipping and handling are included in cost of sales. Amounts charged to customers pertaining to these costs are included
as revenue.
(p) Research and DevelopmentOn a routine basis, the Company incurs costs related to research and development activity. These costs are expensed as incurred. Approximately $0.9
million, $0.8 million, and $1.4 million were expensed in the years ended December 31, 2010, 2009, and 2008, respectively.
(q) Fair Value of Financial InstrumentsCash and cash equivalents, accounts receivable, accounts payable, and accrued taxes and other expenses are stated at carrying amounts that
approximate fair value because of the short maturity of those instruments. The carrying amount of the Company’s long-term debt approximates fair
value as the interest rate on the debt approximates the Company’s current incremental borrowing rate.
(r) Fair Value MeasurementThe Company defines fair value as the price that would be received from selling an asset or paid to transfer a liability in an orderly transaction between
market participants at the measurement date. When determining the fair value measurements for assets and liabilities, which are required to be
recorded at fair value, the Company considers the principal or most advantageous market in which the Company would transact and the market-based
risk measurement or assumptions that market participants would use in pricing the asset or liability, such as inherent risk, transfer restrictions, and
credit risk.
The Company has not elected fair value accounting for any financial instruments for which fair value accounting is optional.

2322
(2) new accounting pronouncements
In June 2009, the Financial Accounting Standards Board (“FASB”) issued guidance to change financial reporting of enterprises with variable interest entities
(“VIEs”) to require an enterprise to qualitatively assess the determination of the primary beneficiary of a VIE, based on whether the enterprise (1) has the
power to direct the activities of a VIE that most significantly impact the VIE’s economic performance and (2) has the obligation to absorb losses of the VIE
or the right to receive benefits from the VIE that could potentially be significant to the VIE. Also, the guidance requires an ongoing reconsideration of the
primary beneficiary and amends the events that trigger a reassessment of whether an entity is a VIE. Enhanced disclosures are also required to provide
information about an enterprise’s involvement in a VIE. This guidance was effective for the Company as of January 1, 2010, and did not have a significant
impact on the Company’s financial position or results of operations.
In January 2010, the FASB amended previously released guidance on fair value measurements and disclosures. The amendment requires disclosure of
transfers into and out of Level 1 and Level 2 fair value measurements, and also requires more detailed disclosure about the activity within Level 3 fair value
measurements. The required disclosures regarding transfers into and out of Level 1 and Level 2 fair value measurements were effective for the Company
as of January 1, 2010, and did not have a significant impact on the Company’s disclosures. The amendment’s requirements related to Level 3 disclosures
are effective for the Company as of January 1, 2011. This guidance affects new disclosures only and will have no impact on the Company’s consolidated
financial statements.
In December 2010, the FASB released ASU 2010-29, Business Combinations (Topic 805): Disclosure of Supplementary Pro Forma Information for
Business Combinations. ASU 2010-29 specifies that when a public company completes a business combination, the company should disclose revenue
and earnings of the combined entity as though the business combination occurred as of the beginning of the comparable prior annual reporting period. The
update also expands the supplemental pro forma disclosures under Topic 805 to include a description of the nature and amount of material, non-recurring
pro forma adjustments directly attributable to the business combination included in the pro forma revenue and earnings. The requirements in ASU 2010-29
are effective for business combinations that occur on or after the beginning of the first annual reporting period beginning on or after December 15, 2010.
We will apply the provisions of ASU 2010-29 on a prospective basis.
(3) supplemental cash flow Information
Cash paid for interest and income taxes is as follows:
Year ended december 31 2010 2009 2008
Interest $ 127,378 $ 205,828 $ 355,221
Income taxes, net of refunds $ 5,522,702 $ 1,648,764 $ 3,817,383
During the year ended December 31, 2010, the Company permitted the exercise of stock options with exercise proceeds paid with the Company’s stock
(“cashless” exercises) totaling $343,750.
(4) receivables and net sales
Receivables consist of the following:
december 31 2010 2009
Accounts receivable-trade $ 14,976,057 $ 14,691,917
Less allowance for doubtful receivables (342,682) (473,912)
$ 14,633,375 $ 14,218,005
The Company’s accounts receivable balance is comprised of many accounts. The highest receivable account balance as of December 31, 2010,
represented 8% of the total accounts receivable balance as of that date. The Company performs credit evaluations on its customers and obtains credit
insurance on a large percentage of its accounts, but does not generally require collateral.
Sales to the top customer in the Company’s Component Products segment comprises 13.9% of that segment’s total sales and 9.3% of the Company’s total
sales for the year ended December 31, 2010. Sales to the top customer in the Company’s Packaging segment comprises 5.7% of that segment’s total sales
and 1.9% of the Company’s total sales for the year ended December 31, 2010.
(5) Inventories
Inventories consist of the following:
december 31 2010 2009
Raw materials $ 5,214,268 $ 4,924,228
Work in process 695,421 699,102
Finished goods 2,570,135 2,574,813
Less reserve for obsolescence (435,488) (550,626)
$ 8,044,336 $ 7,647,517
(6) other Intangible assets
The carrying values of the Company’s definite-lived intangible assets as of December 31, 2010, and 2009, are as follows:
patents non-compete customer list total
Gross amount December 31, 2010 $ 428,806 $ 200,000 $ 769,436 $ 1,398,242
Accumulated amortization at December 31, 2010 (400,885) (93,168) (310,360) (804,413)
net balance at december 31, 2010 $ 27,921 $ 106,832 $ 459,076 $ 593,829
Gross amount December 31, 2009 448,306 200,000 769,436 $ 1,417,742
Accumulated amortization at December 31, 2009 (385,933) (53,240) (160,832) (600,005)
net balance at december 31, 2009 $ 62,373 $ 146,760 $ 608,604 $ 817,737
Amortization expense related to intangible assets was $223,908, $157,104, and $69,072 for the years ended December 31, 2010, 2009, and 2008, respectively. Future amortization for the years ending December 31 will be approximately:
2011 199,081
2012 159,800
2013 159,800
2014 75,148
2015 and thereafter —
total $ 593,829
(7) property, plant, and equipment
Property, plant, and equipment consist of the following:
december 31 2010 2009
Land and improvements $ 944,906 $ 589,906
Buildings and improvements 7,499,855 6,579,670
Leasehold improvements 2,884,463 2,778,894
Equipment 31,695,304 31,133,446
Furniture and fixtures 2,153,943 2,480,510
Construction in progress—equipment/buildings 278,804 20,152
$ 45,457,275 $ 43,582,578
Depreciation and amortization expense for the years ended December 31, 2010, 2009, and 2008, was $2,928,285, $2,737,958,
and $2,907,478, respectively.

2524
(8) Investment in and advances to affiliated partnership
The Company has a 26.32% ownership interest in a realty limited partnership, United Development Company Limited (“UDT”). The Company has
consolidated the financial statements of UDT for all periods presented because it has determined that UDT is a VIE, and the Company is the primary
beneficiary. UDT owns two buildings, which are leased to the Company. The lease payments from the Company account for 100% of UDT’s revenue.
Therefore, the Company believes it has the power to direct the activities of UDT that most significantly impact the entity’s economic performance, and
the obligation to absorb losses of UDT or the right to receive benefits from UDT that could potentially be significant to UDT. In addition to the lease
arrangement, the Company’s management provides management services to UDT in certain situations. The creditors of UDT have no recourse to the
general credit of the Company.
Included in the December 31 consolidated balance sheets are the following amounts related to UDT:
december 31 2010 2009Cash $ 277,698 $ 166,940
Net property, plant, and equipment 1,115,974 1,187,966
Accrued expenses 12,900 12,900
Current and long-term debt 666,875 703,341
(9) Indebtedness
On January 29, 2009, the Company amended and extended its credit facility with Bank of America, NA. The facility is comprised of: (i) a revolving credit
facility of $17 million; (ii) a term loan of $2.1 million with a seven-year straight-line amortization; (iii) a term loan of $1.8 million with a 20 year straight-line
amortization; and (iv) a term loan of $4.0 million with a 20-year straight-line amortization. Extensions of credit under the revolving credit facility are based
in part upon accounts receivable and inventory levels. Therefore, the entire $17 million may not be available to the Company. As of December 31, 2010,
the Company had availability of approximately $15.7 million based upon collateral levels in place as of that date. The credit facility calls for interest of
LIBOR plus a margin that ranges from 1.0% to 1.5% or, at the discretion of the Company, the bank’s prime rate less a margin that ranges from 0.25%
to zero. In both cases the applicable margin is dependent upon Company performance. The loans are collateralized by a first priority lien on all of the
Company’s assets, including its real estate located in Georgetown, Massachusetts, and in Grand Rapids, Michigan. Under the credit facility, the Company
is subject to a minimum fixed-charge coverage financial covenant. The Company’s $17 million revolving credit facility matures November 30, 2013;
the term loans are all due on January 29, 2016. At December 31, 2010, the interest rate on these facilities was 1.29%, and there were no borrowings
outstanding on the line of credit.
UDT has a mortgage note collateralized by the Florida facility, dated May 22, 2007. The note had an original principal balance of $786,000 and calls for
180 monthly payments of $7,147. The interest rate is fixed at approximately 7.2%.
Long-term debt consists of the following:
december 31 2010 2009 Mortgage notes $ 5,310,116 $ 5,602,415
Note payable 1,489,863 1,778,224
UDT mortgage 666,875 703,341
Equipment loan 34,424 40,850
total long-term debt 7,501,278 8,124,830
Current Installments (654,331) (623,007)
long-term debt, excluding current installments $ 6,846,947 $ 7,501,823
Aggregate maturities of long-term debt are as follows:
Year ending December 31:
2011 $ 654,331
2012 622,557
2013 625,807
2014 628,873
2015 and thereafter 4,969,710
$ 7,501,278
(10) accrued taxes and other expenses
Accrued taxes and other expenses consist of the following:
december 31 2010 2009
Compensation $ 2,855,331 $ 2,116,597
Benefits/self-insurance reserve 762,515 648,791
Paid time off 780,109 764,576
Commissions payable 416,326 334,356
Income taxes payable — 389,384
Unrecognized tax benefits 685,000 545,000
Other 1,180,100 1,354,122
$ 6,679,381 $ 6,152,826
(11) Income taxes
The Company’s income tax provision (benefit) for the years ended December 31, 2010, 2009, and 2008, consists of the following:
Years ended december 31 2010 2009 2008
Current:
Federal $ 4,259,000 $ 2,100,000 $ 2,270,000
State 454,000 490,000 709,000
4,713,000 2,590,000 2,979,000
Deferred:
Federal 191,000 263,000 41,000
State 115,000 (36,000) (25,000)
306,000 227,000 16,000
total income tax provision $ 5,019,000 $ 2,817,000 $ 2,995,000
At December 31, 2010, the Company has net operating loss carryforwards for federal income tax purposes of approximately $1,896,000, which are
available to offset future taxable income and expire during the federal tax years ending December 31, 2019, through 2024. The future benefit of the
federal net operating loss carryforwards will be limited to approximately $300,000 per year in accordance with Section 382 of the Internal Revenue Code.
The tax effects of temporary differences that give rise to significant portions of the deferred tax assets and (liabilities) are approximately as follows:
december 31 2010 2009
Equity-based compensation $ 314,000 401,000
Compensation programs 556,000 474,000
Retirement liability 88,000 95,000
Net operating loss carryforwards 644,000 806,000
Inventory capitalization 196,000 230,000
Reserves 359,000 489,000
Other 70,000 49,000
Excess of book over tax basis of fixed assets (1,065,000) (930,000)
Goodwill (627,000) (563,000)
Intangible assets (207,000) (270,000)
Inventory method change — (147,000)
net deferred tax assets $ 328,000 $ 634,000

2726
The amount recorded as net deferred tax assets as of December 31, 2010, and 2009 represents the amount of tax benefits of existing deductible temporary
differences or carryforwards that are more likely than not to be realized through the generation of sufficient future taxable income within the carryforward
period. The Company believes the net deferred tax asset of $328,000 at December 31, 2010, is more likely than not to be realized in the carryforward
period. Management reviews the recoverability of deferred tax assets during each reporting period.
The actual tax provision for the years presented differs from the “expected” tax provision for those years, computed by applying the U.S. federal corporate
rate of 34% to income before income tax expense as follows:
Years ended december 31 2010 2009 2008
Computed “expected” tax rate 34.0% 34.0% 34.0%
Increase (decrease) in income taxes resulting from:
State taxes, net of federal tax benefit 2.0 3.4 5.6
Meals and entertainment 0.1 0.2 0.2
R&D credits (0.3) (0.9) (1.2)
Domestic production deduction (1.8) (1.7) (2.1)
Non-deductible ISO stock option expense 0.1 0.2 0.4
Acquisition gains — (3.3) —
Tax benefits not recorded 1.0 — —
Other (0.3) 0.1 (0.2)
effective tax rate 34.8% 32.0% 36.7%
The Company files income tax returns in the U.S. federal jurisdiction and various state jurisdictions. The Company is in the process of being audited by the
Internal Revenue Service for 2008 in connection with income taxes. The Company has not been audited by any state for income taxes with the exception
of returns filed in Michigan (which have been audited through 2004), and income tax returns filed in Massachusetts for 2005 and 2006, and Florida for
2007, 2008, and 2009 (which are currently being audited). The tax returns for the years 2007 through 2009, and certain items carried forward from
earlier years and utilized in those returns, remain open to examination by the IRS and various state jurisdictions.
A reconciliation of the beginning and ending amount of gross unrecognized tax benefits (“UTB”) resulting from uncertain tax positions is as follows:
federal and state tax 2010 2009
Gross UTB balance at beginning of fiscal year $ 545,000 $ 560,000
Increases for tax position for prior years 140,000 —
Reductions for tax position for prior years — (15,000)
Gross utb balance at december 31 $ 685,000 $ 545,000
The total amount of unrecognized tax benefits that, if recognized, would affect the effective tax rate as of December 31, 2010, and 2009, are $685,000
and $545,000, respectively, for each year.
At December 31, 2010, and 2009, accrued interest and penalties on a gross basis, which are included above in the gross UTB balance, were $145,000
and $115,000, respectively, for each year.
Approximately $255,000 of the unrecognized tax benefits relate to tax returns of a specific state jurisdiction that are currently under examination.
Accordingly, the Company expects a reduction of this amount during 2011.
(12) net Income per share
Basic income per share is based upon the weighted average common shares outstanding during each year. Diluted income per share is based upon the
weighted average of common shares and dilutive common stock equivalent shares outstanding during each year. The weighted average number of shares
used to compute both basic and diluted income per share consisted of the following:
Years ended december 31 2010 2009 2008
Basic weighted average common shares
outstanding during the year 6,157,310 5,829,580 5,549,830
Weighted average common equivalent
shares due to stock options and
restricted stock units 591,752 464,384 712,836
diluted weighted average common shares outstanding during the year 6,749,062 6,293,964 6,262,666
The computation of diluted earnings per share excludes the effect of the potential exercise of stock awards, including stock options, when the average
market price of the common stock is lower than the exercise price of the related options during the period. These outstanding stock awards are not included
in the computation of diluted earnings per share because the effect would have been antidilutive. For the years ended December 31, 2010, 2009, and
2008, the number of stock awards excluded from the computation was 101,769, 190,484, and 41,769, respectively.
(13) stock option and equity Incentive plans
employee stock option plan The Company’s 1993 Employee Stock Option Plan (“Employee Stock Option Plan”), which is stockholder approved, provides long-term rewards and incentives in the form of stock options to the Company’s key employees, officers, employee directors, consultants, and advisors. The plan provides for either non-qualified stock options or incentive stock options for the issuance of up to 1,550,000 shares of common stock. The exercise price of the incentive stock options may not be less than the fair market value of the common stock on the date of grant, and the exercise price for non-qualified stock options shall be determined by the Compensation Committee. These options expire over 5- to 10-year periods.
Options granted under the plan generally become exercisable with respect to 25% of the total number of shares subject to such options at the end of each 12-month period following the grant of the options, except for options granted to officers, which may vest on a different schedule. At December 31, 2010, there were 443,750 options outstanding under the Employee Stock Option Plan, and there were 302,293 shares available to be issued. The plan expired on April 12, 2010.
Incentive plan
In June 2003, the Company formally adopted the 2003 Incentive Plan (the “Plan”). The Plan was originally intended to benefit the Company by offering
equity-based incentives to certain of the Company’s executives and employees, thereby giving them a permanent stake in the growth and long-term success
of the Company and encouraging the continuance of their involvement with the Company’s businesses. The Plan was amended effective June 4, 2008,
to permit certain performance-based cash awards to be made under the Plan. The amendment also added appropriate language so as to enable grants of
stock-based awards under the Plan to continue to be eligible for exclusion from the $1,000,000 limitation on deductibility under Section 162(m) of the
Internal Revenue Code (the “Code”).
Two types of equity awards may be granted to participants under the Plan: restricted shares or other stock awards. Restricted shares are shares of common
stock awarded subject to restrictions and to possible forfeiture upon the occurrence of specified events. Other stock awards are awards that are denominated
or payable in, valued in whole or in part by reference to, or otherwise based on or related to, shares of common stock. Such awards may include Restricted
Stock Unit Awards (“RSUs”), unrestricted or restricted stock, non-qualified stock options, performance shares, or stock appreciation rights. The Company
determines the form, terms, and conditions, if any, of any awards made under the Plan. The maximum number of shares of common stock, in the
aggregate, that may be delivered in payment or in respect of stock issued under the Plan is 1,250,000 shares.
Through December 31, 2010, 814,249 shares of common stock have been issued under the 2003 Incentive Plan, none of which have been restricted. An
additional 251,694 shares are being reserved for outstanding grants of RSUs and other share-based compensation that are subject to various performance
and time-vesting contingencies. The Company has also granted awards in the form of stock options under this Plan. Through December 31, 2010, 50,000
options have been granted and are all outstanding.
director plan
Effective July 15, 1998, the Company adopted the 1998 Director Plan for the benefit of non-employee directors of the Company. The 1998 Director Plan
provides for options for the issuance of up to 975,000 shares of common stock. These options become exercisable in full at the date of grant and expire 10
years from the date of grant. At December 31, 2010, there were 270,746 options outstanding under the 1998 Director Plan and 237,240 available to be
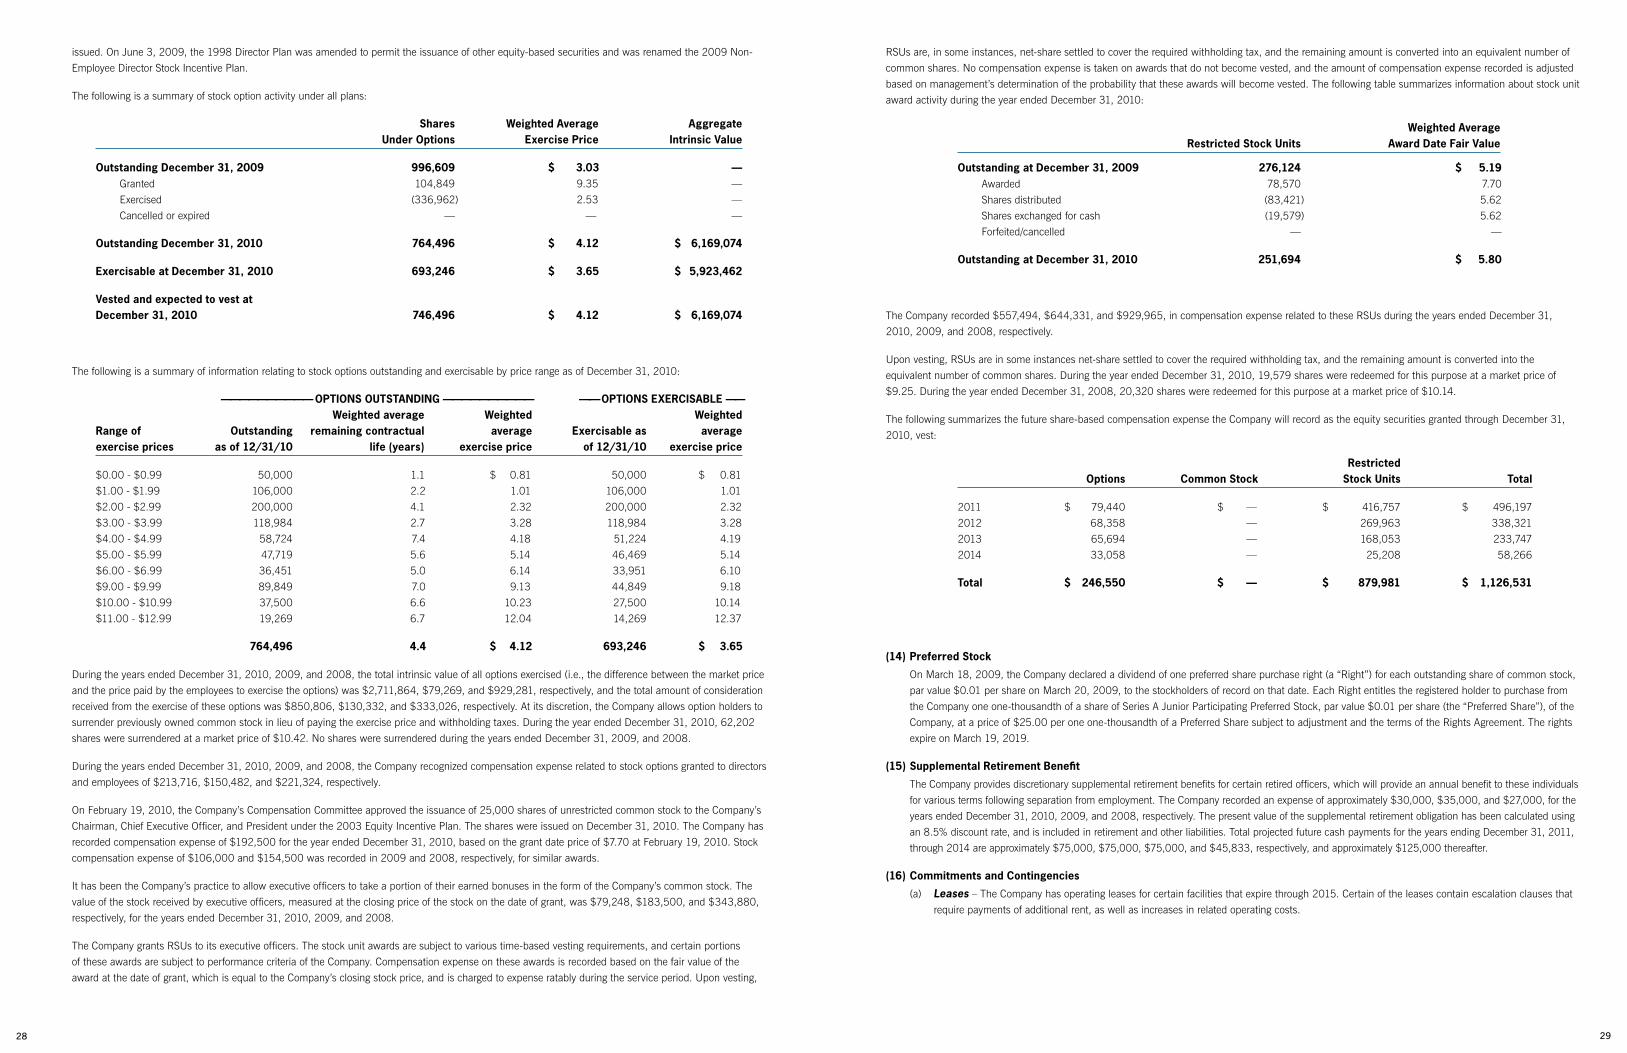
2928
issued. On June 3, 2009, the 1998 Director Plan was amended to permit the issuance of other equity-based securities and was renamed the 2009 Non-
Employee Director Stock Incentive Plan.
The following is a summary of stock option activity under all plans:
shares weighted average aggregate under options exercise price Intrinsic value
outstanding december 31, 2009 996,609 $ 3.03 —
Granted 104,849 9.35 —
Exercised (336,962) 2.53 —
Cancelled or expired — — —
outstanding december 31, 2010 764,496 $ 4.12 $ 6,169,074
exercisable at december 31, 2010 693,246 $ 3.65 $ 5,923,462
vested and expected to vest at december 31, 2010 746,496 $ 4.12 $ 6,169,074
The following is a summary of information relating to stock options outstanding and exercisable by price range as of December 31, 2010:
—————————— optIons outstandInG —————————— —-— optIons exercIsable —— weighted average weighted weighted range of outstanding remaining contractual average exercisable as average exercise prices as of 12/31/10 life (years) exercise price of 12/31/10 exercise price
$0.00 - $0.99 50,000 1.1 $ 0.81 50,000 $ 0.81
$1.00 - $1.99 106,000 2.2 1.01 106,000 1.01
$2.00 - $2.99 200,000 4.1 2.32 200,000 2.32
$3.00 - $3.99 118,984 2.7 3.28 118,984 3.28
$4.00 - $4.99 58,724 7.4 4.18 51,224 4.19
$5.00 - $5.99 47,719 5.6 5.14 46,469 5.14
$6.00 - $6.99 36,451 5.0 6.14 33,951 6.10
$9.00 - $9.99 89,849 7.0 9.13 44,849 9.18
$10.00 - $10.99 37,500 6.6 10.23 27,500 10.14
$11.00 - $12.99 19,269 6.7 12.04 14,269 12.37
764,496 4.4 $ 4.12 693,246 $ 3.65
During the years ended December 31, 2010, 2009, and 2008, the total intrinsic value of all options exercised (i.e., the difference between the market price
and the price paid by the employees to exercise the options) was $2,711,864, $79,269, and $929,281, respectively, and the total amount of consideration
received from the exercise of these options was $850,806, $130,332, and $333,026, respectively. At its discretion, the Company allows option holders to
surrender previously owned common stock in lieu of paying the exercise price and withholding taxes. During the year ended December 31, 2010, 62,202
shares were surrendered at a market price of $10.42. No shares were surrendered during the years ended December 31, 2009, and 2008.
During the years ended December 31, 2010, 2009, and 2008, the Company recognized compensation expense related to stock options granted to directors
and employees of $213,716, $150,482, and $221,324, respectively.
On February 19, 2010, the Company’s Compensation Committee approved the issuance of 25,000 shares of unrestricted common stock to the Company’s
Chairman, Chief Executive Officer, and President under the 2003 Equity Incentive Plan. The shares were issued on December 31, 2010. The Company has
recorded compensation expense of $192,500 for the year ended December 31, 2010, based on the grant date price of $7.70 at February 19, 2010. Stock
compensation expense of $106,000 and $154,500 was recorded in 2009 and 2008, respectively, for similar awards.
It has been the Company’s practice to allow executive officers to take a portion of their earned bonuses in the form of the Company’s common stock. The
value of the stock received by executive officers, measured at the closing price of the stock on the date of grant, was $79,248, $183,500, and $343,880,
respectively, for the years ended December 31, 2010, 2009, and 2008.
The Company grants RSUs to its executive officers. The stock unit awards are subject to various time-based vesting requirements, and certain portions
of these awards are subject to performance criteria of the Company. Compensation expense on these awards is recorded based on the fair value of the
award at the date of grant, which is equal to the Company’s closing stock price, and is charged to expense ratably during the service period. Upon vesting,
RSUs are, in some instances, net-share settled to cover the required withholding tax, and the remaining amount is converted into an equivalent number of
common shares. No compensation expense is taken on awards that do not become vested, and the amount of compensation expense recorded is adjusted
based on management’s determination of the probability that these awards will become vested. The following table summarizes information about stock unit
award activity during the year ended December 31, 2010:
weighted average restricted stock units award date fair value
outstanding at december 31, 2009 276,124 $ 5.19
Awarded 78,570 7.70
Shares distributed (83,421) 5.62
Shares exchanged for cash (19,579) 5.62
Forfeited/cancelled — —
outstanding at december 31, 2010 251,694 $ 5.80
The Company recorded $557,494, $644,331, and $929,965, in compensation expense related to these RSUs during the years ended December 31,
2010, 2009, and 2008, respectively.
Upon vesting, RSUs are in some instances net-share settled to cover the required withholding tax, and the remaining amount is converted into the
equivalent number of common shares. During the year ended December 31, 2010, 19,579 shares were redeemed for this purpose at a market price of
$9.25. During the year ended December 31, 2008, 20,320 shares were redeemed for this purpose at a market price of $10.14.
The following summarizes the future share-based compensation expense the Company will record as the equity securities granted through December 31,
2010, vest:
restricted options common stock stock units total
2011 $ 79,440 $ — $ 416,757 $ 496,197
2012 68,358 — 269,963 338,321
2013 65,694 — 168,053 233,747
2014 33,058 — 25,208 58,266
total $ 246,550 $ — $ 879,981 $ 1,126,531
(14) preferred stock
On March 18, 2009, the Company declared a dividend of one preferred share purchase right (a “Right”) for each outstanding share of common stock,
par value $0.01 per share on March 20, 2009, to the stockholders of record on that date. Each Right entitles the registered holder to purchase from
the Company one one-thousandth of a share of Series A Junior Participating Preferred Stock, par value $0.01 per share (the “Preferred Share”), of the
Company, at a price of $25.00 per one one-thousandth of a Preferred Share subject to adjustment and the terms of the Rights Agreement. The rights
expire on March 19, 2019.
(15) supplemental retirement benefit
The Company provides discretionary supplemental retirement benefits for certain retired officers, which will provide an annual benefit to these individuals
for various terms following separation from employment. The Company recorded an expense of approximately $30,000, $35,000, and $27,000, for the
years ended December 31, 2010, 2009, and 2008, respectively. The present value of the supplemental retirement obligation has been calculated using
an 8.5% discount rate, and is included in retirement and other liabilities. Total projected future cash payments for the years ending December 31, 2011,
through 2014 are approximately $75,000, $75,000, $75,000, and $45,833, respectively, and approximately $125,000 thereafter.
(16) commitments and contingencies
(a) Leases – The Company has operating leases for certain facilities that expire through 2015. Certain of the leases contain escalation clauses that
require payments of additional rent, as well as increases in related operating costs.

3130
Future minimum lease payments under non-cancelable operating leases as of December 31, 2010, are as follows:
Years ending december 31 operating leases
2011 $ 1,693,943
2012 1,327,901
2013 920,534
2014 605,718
Thereafter 30,135
total minimum lease payments $ 4,578,231
Rent expense amounted to approximately $2,616,000, $2,442,000, and $2,214,000, in 2010, 2009, and 2008, respectively.
(b) Legal – The Company is not a party to any material pending legal proceedings.
(17) employee benefits plans
The Company maintains a profit sharing plan for eligible employees. Contributions to the Plan are made in the form of matching contributions
to employee 401k deferrals, as well as discretionary amounts determined by the Board of Directors, and amounted to approximately $785,000,
$709,000, and $703,000, in 2010, 2009, and 2008, respectively.
The Company has a partially self-insured health insurance program that covers all eligible participating employees. The maximum liability is limited by
a stop loss of $100,000 per insured person, along with an aggregate stop loss determined by the number of participants.
During 2006, the Company established an Executive, Non-qualified “Excess” Plan (“the Plan”), which is a deferred compensation plan available to
certain executives. The Plan permits participants to defer receipt of part of their current compensation to a later date as part of their personal retirement
or financial planning. Participants have an unsecured contractual commitment by the Company to pay amounts due under the Plan. There is currently
no security mechanism to ensure that the Company will pay these obligations in the future.
The compensation withheld from Plan participants, together with investment income on the Plan, is reflected as a deferred compensation obligation
to participants, and is classified within retirement and other liabilities in the accompanying balance sheets. At December 31, 2010, the balance of the
deferred compensation liability totaled approximately $1,054,000. The related assets, which are held in the form of a Company-owned, variable life
insurance policy that names the Company as the beneficiary, are reported within other assets in the accompanying balance sheets, and are accounted
for based on the underlying cash surrender values of the policies, and totaled approximately $1,060,000 as of December 31, 2010.
(18) fair value of financial Instruments
Financial instruments recorded at fair value in the balance sheets, or disclosed at fair value in the footnotes, are categorized below based upon the
level of judgment associated with the inputs used to measure their fair value. Hierarchical levels defined by ASC 820, Fair Value Measurements and Disclosures, and directly related to the amount of subjectivity associated with inputs to fair valuation of these assets and liabilities, are as follows:
level 1 – Valued based on unadjusted, quoted prices in active markets for identical assets or liabilities at the measurement date. An active market for
the asset or liability is a market in which transactions for the asset or liability occur with sufficient frequency and volume to provide pricing information
on an ongoing basis.
level 2 – Valued based on either directly or indirectly observable prices for the asset or liability through correlation with market data at the
measurement date and for the duration of the instrument’s anticipated life.
level 3 – Valued based on management’s best estimate of what market participants would use in pricing the asset or liability at the measurement
date. Consideration is given to the risk inherent in the valuation technique and the risk inherent in the inputs to the model.
The Company’s assets and liabilities that are measured at fair value consist of money market funds and certificates of deposit, both considered cash
equivalents, which are categorized by the levels discussed above and in the table below:
cash equivalents 12/31/10 level 1 level 2 level 3 total
Money market funds $ 9,500,000 $ — $ — $ 9,500,000
Certificates of deposits — 4,500,000 — 4,500,000
total $ 9,500,000 $ 4,500,000 $ — $ 14,000,000
cash equivalents 12/31/09 level 1 level 2 level 3 total
Money market funds $ 100,000 $ — $ — $ 100,000
Certificates of deposits — 3,000,000 — 3,000,000
total $ 100,000 $ 3,000,000 $ — $ 3,100,000
As of December 31, 2010, the Company does not have any significant non-recurring measurements of non-financial assets and non-financial
liabilities. The Company may have additional disclosure requirements in the event an impairment of the Company’s non-financial assets occurs in a
future period.
(19) acquisition
On March 9, 2009, the Company acquired selected assets of the Hillsdale, Michigan, operations of Foamade Industries, Inc. (“Foamade”). The
Hillsdale operations of Foamade specialized in the fabrication of technical urethane foams for a myriad of industries and bring to the Company further
penetration into applications using this family of foams, as well as incremental sales to fold into its operations. The Company has transitioned the
acquired assets to its Grand Rapids, Michigan, plant.
On July 7, 2009, the Company acquired substantially all of the assets of E.N. Murray Co. (“ENM”), a Denver, Colorado-based foam fabricator, for
$2,750,000. ENM specialized in the fabrication of technical urethane foams primarily for the medical industry. This acquisition brings to the Company
further access and expertise in fabricating technical urethane foams and a seasoned management team. The Company had leased the former ENM
Denver facilities for a period of two years. The Company purchased these properties on December 22, 2010, for $1,200,000.
On August 24, 2009, the Company acquired selected assets of Advanced Materials, Inc. (“AMI”) for $620,000. Located in Rancho Dominguez,
California, AMI specialized in the fabrication of technical urethane foams primarily for the medical industry and brings to the Company further
penetration into this market. The Company assumed the lease of the 56,000-square-foot Rancho Dominguez location, which expires in
November 2011.
The Company recorded gains of approximately $81,000, $558,000, and $201,000 on the acquisitions of selected assets of Foamade, ENM, and
AMI, respectively, as it acquired the assets in bargain purchases. The Company believes the bargain purchase gains resulted from opportunities
created by the overall weak economy.
The following table summarizes the consideration paid and the acquisition date fair value of the assets acquired and liabilities assumed relating to
each transaction:

3332
foamade enM aMI March 9, 2009 July 7, 2009 august 24, 2009
Consideration
Cash $ 375,000 $ 2,750,000 $ 620,000
fair value of total consideration transferred 375,000 2,750,000 620,000
acquisition costs (legal fees) included in sG&a 25,000 30,000 35,000
Recognized amounts of identifiable assets acquired:
Cash — 1,309,466 —
Accounts receivable — 832,054 289,540
Inventory 182,864 922,497 252,528
Other assets — 37,708 —
Fixed assets 189,100 812,000 345,750
Non-compete 30,000 120,000 —
Customer list 103,000 490,000 56,000
total identifiable net assets 504,964 4,523,725 943,818 Payables and accrued expenses — (830,341) —
Equipment loan — (42,827) —
Deferred tax liabilities (49,386) (342,212) (123,051)
net assets acquired $ 455,578 $ 3,308,345 $ 820,767
With respect to the acquisition of selected assets of ENM, the Company acquired gross accounts receivable of $873,919, of which it deemed $41,865
to be uncollectible. It therefore recorded the accounts receivable at its fair market value of $832,054. With respect to the acquisition of selected assets
of AMI, the Company acquired gross accounts receivable of $324,540, of which it deemed $35,000 to be uncollectible. It therefore recorded the
accounts receivable at its fair market value of $289,540. With respect to the non-compete and customer list intangible assets acquired from Foamade,
ENM, and AMI, the weighted average amortization period is five years. No residual balance is anticipated for any of the intangible assets.
The following table contains an unaudited pro forma condensed consolidated statement of operations for the years ended December 31, 2009, and
2008, as if the ENM acquisition had occurred at the beginning of the respective periods:
Years ended december 31 2009 2008
sales $ 105,228,869 $ 123,049,859
Net Income 6,070,518 5,615,326
Earnings per share
Basic $ 1.04 $ 1.01
Diluted $ 0.96 $ 0.90
The above unaudited pro forma information is presented for illustrative purposes only, and may not be indicative of the results of operations that would
have actually occurred had the ENM acquisition occurred as presented. In addition, future results may vary significantly from the results reflected in
such pro forma information.
(20) segment data
The Company is organized based on the nature of the products and services that it offers. Under this structure, the Company produces products
within two distinct segments: Packaging and Component Products. Within the Packaging segment, the Company primarily uses polyethylene and
polyurethane foams, sheet plastics, and pulp fiber to provide customers with cushion packaging for their products. Within the Component Products
segment, the Company primarily uses cross-linked polyethylene foam to provide customers in the automotive, athletic, leisure, and health and beauty
industries with engineered products for numerous purposes.
The accounting policies of the segments are the same as those described in Note 1. Income taxes and interest expense have been allocated based on
operating results and total assets employed in each segment.
Inter-segment transactions are uncommon and not material. Therefore, they have not been separately reflected in the financial table below. The totals
of the reportable segments’ revenues, net profits, and assets agree with the Company’s consolidated amounts contained in the audited financial
statements. Revenues from customers outside of the United States are not material.
Sales to the top customer in the Company’s Component Products segment comprises 13.9% of that segment’s total sales and 9.3% of the Company’s
total sales for the year ended December 31, 2010. Sales to the top customer in the Company’s Packaging segment comprises 5.7% of that segment’s
total sales and 1.9% of the Company’s total sales for the year ended December 31, 2010.
The results for the Packaging segment include the operations of United Development Company Limited.
The Company has revised its allocation of corporate assets to the two segments to present cash and cash equivalents as unallocated assets. Prior year
numbers have been adjusted to conform to the same allocation method.
Financial statement information by reportable segment is as follows:
2010 component products packaging unallocated assets total
Sales $ 80,373,062 $ 40,393,388 $ — $ 120,766,450
Operating Income 11,104,306 3,275,884 — 14,380,190
Total assets 26,579,654 20,795,613 24,433,761 71,809,028
Depreciation/Amortization 1,802,085 1,350,108 — 3,152,193
Capital expenditures 1,814,874 1,470,656 — 3,285,530
Interest expense, net 61,668 53,869 — 115,537
Goodwill 4,463,246 2,017,791 — 6,481,037
2009 component products packaging unallocated assets total
Sales $ 60,973,325 $ 38,258,009 $ — $ 99,231,334
Operating Income 5,806,122 2,374,288 — 8,180,410
Total assets 25,409,608 19,043,674 14,998,514 59,451,796
Depreciation/Amortization 1,658,290 1,236,772 — 2,895,062
Capital expenditures 989,027 867,810 — 1,856,837
Interest expense, net 126,363 106,384 — 232,747
Goodwill 4,463,246 2,017,791 — 6,481,037
Bargain purchase gains 839,690 — — 839,690
2008 component products packaging unallocated assets total
Sales $ 60,847,533 $ 49,184,068 $ — $ 110,031,601
Operating Income 3,076,360 5,348,371 — 8,424,731
Total assets 22,098,941 19,894,350 6,729,370 48,722,661
Depreciation/Amortization 1,820,239 1,156,311 — 2,976,550
Capital expenditures 1,053,622 1,709,628 — 2,763,250
Interest expense, net 166,013 168,280 — 334,293
Goodwill 4,463,246 2,017,791 — 6,481,037
(21) assets Held for sale
On January 13, 2011, United Development Company Limited (“UDT”) sold its Alabama facility (Packaging segment) for $1,250,000. The net book
value of the asset at December 31, 2010, is approximately $384,000. In addition, the buyer of the building has agreed to allow the Company to
occupy the building rent-free for a period not to exceed nine months.

3534
(22) quarterly financial Information (unaudited)
Year ended december 31, 2010 q1 q2 q3 q4
Net sales $ 28,700,466 $ 29,957,495 $ 30,467,998 $ 31,640,491 Gross profit 7,457,254 9,046,836 8,905,976 9,205,664 Net income attributable to UFP Technologies, Inc. 1,511,382 2,281,616 2,364,840 3,089,254 Basic net income per share 0.25 0.37 0.38 0.49 Diluted net income per share 0.23 0.34 0.35 0.45
Year ended december 31, 2009 q1 q2 q3 q4
Net sales $ 21,607,763 $ 20,959,033 $ 27,620,250 $ 29,044,288 Gross profit 4,942,788 5,370,964 7,454,276 8,951,387 Net income attributable to UFP Technologies, Inc. 344,961 566,198 2,112,742 2,905,524 Basic net income per share 0.06 0.10 0.36 0.49 Diluted net income per share 0.06 0.09 0.34 0.45
special note regarding forward-looking statements
Some of the statements contained in this report are forward-looking statements within the meaning of Section 27A of the Securities Act of 1933 and Section 21E of the Securities Exchange Act of 1934. Forward-looking statements include, but are not limited to, statements about the Company’s prospects, anticipated advantages the Company expects to realize from its acquisition strategies, the Company’s participation and growth in multiple markets, the Company’s business opportunities, the Company’s growth potential and strategies for growth, and any indication that the Company may be able to sustain its sales and earnings, or its sales and earnings growth rates. Investors are cautioned that such forward-looking statements involve risks and uncertainties, including economic conditions that affect sales of the products of the Company’s customers, the ability of the Company to identify suitable acquisition candidates and successfully, efficiently execute acquisition transactions and integrate such acquisition candidates, actions by the Company’s competitors and the ability of the Company to respond to such actions, the ability of the Company to obtain new customers, the ability of the Company to fulfill its obligations on long-term contracts and to retain current customers, the public’s perception of environmental issues related to the Company’s business, the Company’s ability to adapt to changing market needs and other factors. Accordingly, actual results may differ materially from those projected in the forward-looking statements as a result of changes in general economic conditions, interest rates and the assumptions used in making such forward-looking statements. Readers are referred to the documents filed by the Company with the SEC, specifically the last reports on Forms 10-K and 10-Q. The forward-looking statements contained herein speak only of the Company’s expectations as of the date of this report. The Company expressly disclaims any obligation or undertaking to release publicly any updates or revisions to any such statement to reflect any change in the Company’s expectations or any change in events, conditions or circumstances on which any such statement is based.
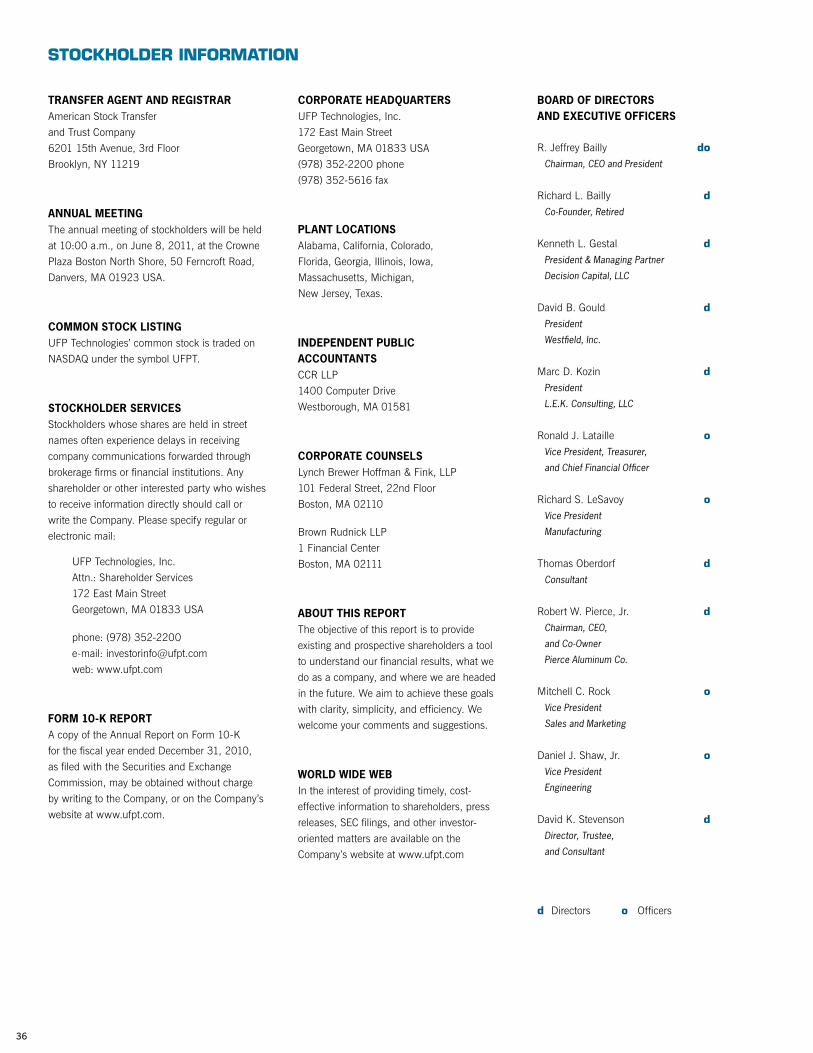
36
transfer aGent and reGIstrarAmerican Stock Transfer
and Trust Company
6201 15th Avenue, 3rd Floor
Brooklyn, NY 11219
annual MeetInGThe annual meeting of stockholders will be held
at 10:00 a.m., on June 8, 2011, at the Crowne
Plaza Boston North Shore, 50 Ferncroft Road,
Danvers, MA 01923 USA.
coMMon stock lIstInGUFP Technologies’ common stock is traded on
NASDAQ under the symbol UFPT.
stockHolder servIcesStockholders whose shares are held in street
names often experience delays in receiving
company communications forwarded through
brokerage firms or financial institutions. Any
shareholder or other interested party who wishes
to receive information directly should call or
write the Company. Please specify regular or
electronic mail:
UFP Technologies, Inc.
Attn.: Shareholder Services
172 East Main Street
Georgetown, MA 01833 USA
phone: (978) 352-2200
e-mail: [email protected]
web: www.ufpt.com
forM 10-k reportA copy of the Annual Report on Form 10-K
for the fiscal year ended December 31, 2010,
as filed with the Securities and Exchange
Commission, may be obtained without charge
by writing to the Company, or on the Company’s
website at www.ufpt.com.
corporate HeadquartersUFP Technologies, Inc.
172 East Main Street
Georgetown, MA 01833 USA
(978) 352-2200 phone
(978) 352-5616 fax
plant locatIonsAlabama, California, Colorado,
Florida, Georgia, Illinois, Iowa,
Massachusetts, Michigan,
New Jersey, Texas.
Independent publIc accountantsCCR LLP
1400 Computer Drive
Westborough, MA 01581
corporate counselsLynch Brewer Hoffman & Fink, LLP
101 Federal Street, 22nd Floor
Boston, MA 02110
Brown Rudnick LLP
1 Financial Center
Boston, MA 02111
about tHIs reportThe objective of this report is to provide
existing and prospective shareholders a tool
to understand our financial results, what we
do as a company, and where we are headed
in the future. We aim to achieve these goals
with clarity, simplicity, and efficiency. We
welcome your comments and suggestions.
world wIde webIn the interest of providing timely, cost-
effective information to shareholders, press
releases, SEC filings, and other investor-
oriented matters are available on the
Company’s website at www.ufpt.com
StoCkholDer inFormation
board of dIrectors and executIve offIcers
R. Jeffrey Bailly doChairman, CEO and President
Richard L. Bailly dCo-Founder, Retired
Kenneth L. Gestal dPresident & Managing Partner
Decision Capital, LLC
David B. Gould dPresident
Westfield, Inc.
Marc D. Kozin dPresident
L.E.K. Consulting, LLC
Ronald J. Lataille oVice President, Treasurer,
and Chief Financial Officer
Richard S. LeSavoy oVice President
Manufacturing
Thomas Oberdorf dConsultant
Robert W. Pierce, Jr. dChairman, CEO,
and Co-Owner
Pierce Aluminum Co.
Mitchell C. Rock oVice President
Sales and Marketing
Daniel J. Shaw, Jr. oVice President
Engineering
David K. Stevenson dDirector, Trustee,
and Consultant
d Directors o Officers

UFP Technologies, inc. 172 East Main Street, Georgetown, MA 01833 USA
tel: 978.352.2200 • fax: 978.352.5616 • web: www.ufpt.com
Alabama California Colorado Florida Georgia Illinois Iowa Massachusetts Michigan New Jersey Texas
operating principlescustomers
We believe the primary purpose of our company is to serve our customers.
We seek to “wow” our customers with responsiveness and great products.
ethics
We will conduct our business at all times and in all places with absolute integrity
with regard to employees, customers, suppliers, community, and the environment.
employees
We are dedicated to providing a positive, challenging,
rewarding work environment for all of our employees.
Quality
We are dedicated to continuously improving our quality of service,
quality of communications, quality of relationships,
and quality of commitments.
simplification
We seek to simplify our business process through the constant re-examination
of our methods and elimination of all non-value-added activities.
entrepreneurship
We strive to create an environment that encourages autonomous
decision-making and a sense of ownership at all levels of the company.
profit
Although profit is not the sole reason for our existence,
it is the lifeblood that allows us to exist.