Embed Size (px)
Citation preview

OTP Bank Rt.
2001 preliminary Stock Exchange Report
(English translation of the original report submitted to the Budapest Stock Exchange)
Budapest, February 14, 2002

OTP Bank’s 2001 Preliminary Stock Exchange Report
2
OTP Bank’s 2001 Preliminary Stock Exchange Report Contains the HAR non-consolidated and consolidated non-audited 2001 balance sheet of 31 December 2001 and profit and loss account for the year ending 31 December 2001. For the sake of easier understanding by international investors, we also present and analyse both the non-consolidated and the consolidated figures in a format that is closer to the international format.
In the interest of the EU law harmonisation, the structure of financial statements (balance sheet, profit and loss statement) and in case of some items their contents also have significantly changed from the business year beginning at 1 January 2001. The changes are comprised in the Act C of 2000 about accounting and in the No. 250/2000 (XII. 24.) Government Order about the accounting and preparation of financial statements for financial institutions.
We present the 2001 stock exchange report in the structure of the new balance sheet and profit and loss statement, and the figures are in HUF millions. In the interest of comparability to the figures of the same period of previous year, we amended the base data accordingly. In our opinion as the result of corrections, the presented figures form appropriate base of comparative analysis.
OTP Bank’s preliminary after-tax profits for 2001 were HUF 38,416 million, HUF 5,933 million, or 18.3% higher than in 2000. OTP Group’s consolidated after-tax profit was HUF 46,928 million, 21.6% higher than in 2000.
Total Bank assets grew to HUF 2,126,437 million or by 10.1% over the year ending 31 December 2001. Total assets for the group were HUF 2,319,052 million, 11.7% higher than on 31 December 2000.
FINANCIAL HIGHLIGHTS
Non-consolidated (except where noted) Three months ended 31 December 2000 2001 Change %
Net income (HUF million) 8,598 9,971 16.0% Net income per common share (EPS)1
Consolidated undiluted (HUF) HUF 397.31 HUF 500.27 25,9% diluted (HUF) HUF 363.32 HUF 456.29 25,6%
Non-consolidated undiluted (HUF) HUF 327.77 HUF 380.09 16.0% diluted (HUF) HUF 307.07 HUF 356.11 16.0% Return on common equity (ROE)2 27.8% 25.8% -1.9%points Return on assets (ROA)2 1.81% 1.92% +0.11%points
Twelve months ended 31 December Net income (HUF million) 32,483 38,416 18.3% Net income per common share (EPS)1
Consolidated undiluted (HUF) HUF 1,491.13 HUF 1,823.62 22,9% diluted (HUF) HUF 1,378.57 HUF 1,676.00 21,6%
Non-consolidated undiluted (HUF) HUF 1,234.21 HUF 1,458.36 18.2% diluted (HUF) HUF 1,160.11 HUF 1,372.00 18.3% Return on common equity (ROE)2 28.5% 26.9% -1.6%points Return on assets (ROA)2 1.76% 1.89% +0.13%points As at 31 December Total assets (HUF billion) 1,931.3 2,126.4 10.1% Common equity (HUF billion) 127.5 158.5 24.3%
1 Not considering the effects of extraordinary items of the HAR P&L
2 Annualised
OTP Bank’s 2001 Preliminary Stock Exchange Report
3
MAJOR TENDENCIES FOR THE FOURTH QUARTER OF 2001
Total assets of the Bank increased by HUF 102.5 billion (5.1%) during fourth quarter 2001 and exceeded HUF 2,126.4 billion on 31 December 2001.
Among the assets the HUF 8.2% decrease in volume of cash, the HUF 20.3 billion or 4.5% increase in volume of government securities and within this volume the restructuring in favour of investment securities are the reasons mentionable. Receivables from banks increased by 25.4%. Customer receivables rose by HUF 48.1 billion or 6.7% owing to the new retail and corporate loans.
Short-term liabilities increased by HUF 113.2 billion or 6.4% due to the increase in the volume of deposits, among which the growth of retail current accounts was remarkable. Liabilities with maturity over 1 year decreased, by 1.0% or HUF 0.6 billion during the fourth quarter, mainly due to the reclassification as the short-term liabilities. The growth of the customer liabilities was HUF 118.3 billion or 7.1%.
Accrued expenses declined because of interest payment settlements, and liability side provisions were 6.1% higher than on 30 September 2001 because of the general risk and other provisions generated.
The Bank’s shareholders’ equity, after accounting the net results, increased by 5.3% or HUF 8.0 billion since 30 September 2001.
Off-balance sheet liabilities grew by 11.8% during the fourth quarter. The increase in contingent liabilities was 13.7% and in the future liabilities was 8.7%.
Fourth quarter pre-tax profits for the Bank reached HUF 12,556 million and after tax profits was HUF 9,971 billion. During the fourth quarter of 2001 net interest income reached HUF 25.9 billion. This is 5.2% higher than during the same period in 2000 and 5.4% above the figures for 3Q 2001. Compared to the Q4 2000 interest income grew by 2.9% and interes expense increased by 0.5%. Compared to the previous quarter interest income increased 2.5% and interest expenses decreased by 0.4%. During 4th quarter interest income from all types of accounts increased and interest income from retail, corporate accounts and from bonds and also increased compared to the same period of 2000 due to the increase in volume of retail and corporate receivables.
In the fourth quarter the average total assets of the Bank were 8.4%, the net interest income 5.2% higher than in the same period in 2000. The average yield for the assets was 10.79%, the average interest paid for liabilities was 5.33%. Compared to the fourth quarter of 2000 the interest rate spread declined by 12 basis points to 5.46%, net interest margin decreased by 15 basis point to 5.14%. Both spread and net interest margin were lower than in the third quarter of 2001.
Non-interest income during the last quarter of 2001 reached HUF 12.4 billion representing 32.4% of total income. Net fee and commission income was 24.3% higher than a year earlier and exceeded the third quarter figure by 13.6%.
Total income of the Bank increased by 9.5% compared to the fourth quarter of 2000. Non-interest expenses grew again in the fourth quarter due to seasonal reasons and they were 9.9% higher than a year earlier. The cost income ratio in Q4 2001 was 64.4%, 0.2% higher than in Q4 2000.
Operating income for the fourth quarter was HUF 13,636 million, 8.8% higher than in the same period 2000.
Fourth quarter pre-tax profits for the Bank reached HUF 12,556 million, 14.7% higher than in fourth quarter 2000. This was the result of the HUF 13,636 million operating profit and the HUF 1,080 million provisioning. Compared to the fourth quarter of 2000 the provisioning decreased by 32.3%. After-tax profits were HUF 9,971 million, 16.0% increase compared to the same period of 2000.
Undiluted earnings per share 1 for the period was HUF 380.09, diluted 2 EPS was HUF 356.11 which are 16.0% higher than in 2000. US dollar equivalents are USD 1.36 and USD 1.27 respectively, increase of 25.2%, based on the central bank’s average middle exchange rate between 1 October and 31 December 2001 (280.45 HUF/USD).
Annualised return on average equity was 25.8%, on average assets 1.92% in the fourth quarter of 2001, 196 basis point lower and 11 basis point higher resp. than in Q4 2000.
1 Calculation method of undiluted earnings per share: post-tax profit/(ordinary shares -shareholders` equity) 2 Calculation method of diluted earnings per share: (post-tax profit+preference dividend)/(ordinary shares+preference shares).

OTP Bank’s 2001 Preliminary Stock Exchange Report
4
MAJOR NON-CONSOLIDATED FIGURES FOR THE YEAR 2001
OTP Bank’s preliminary pre -tax profit for the year 2001 was HUF 47,411 million a 17.9% increase from a year earlier. This profit was obtained as a result of the HUF 8,510 million of provisions and HUF 55,921 million of operating income. Compared to 2000, this means a 16.1% increase of operating income and a 7.3% increase in provisioning requirement.
Compared to 2000 slightly lower effective tax rates (from 19.2% to 19.0%) allowed for a post -tax profit of HUF 38,416 million, which is HUF 5,933 million, or 18.3% higher than in 2000.
After having generated the HUF 3,841 million of general reserves and the dividend fund for the period based on the Bank's dividend policy, the Bank’s retained earnings for the year were HUF 27,299 million, an increase of 13.8% over 2000.
Undiluted earnings per share (EPS) for the year was HUF 1,458.36, diluted was HUF 1,372.00 which is 18.2% and 18.3% higher than for the year 2000. US dollar equivalents are USD 5.08 and USD 4.78 respectively, above the figures for 2000 by 16.1% and 16.2% respectively, based on the central bank’s average middle exchange rate between 1 January and 31 December 2000 (286.80 HUF/USD).
Preliminary return on average equity for the year was 26.9%, on average assets 1.89% (28.5% and 1.76% in 2000). Non-consolidated preliminary real ROE (ROE less inflation) was 17.7%, lower than in 2000 due to the fast growth (25.4%) of average shareholders' equity and the higher than expected inflation rate (9.2%), but remained within the band (16-20%) of the Bank's plans.
NET INTEREST INCOME
The bank’s net interest income for the year 2001 was HUF 98.4 billion, 13.2% higher than in 2000. The net interest income was a result of HUF 193.8 billion of interest income (3.6% increase) and HUF 95.5 billion of interest expenses (4.8% decrease).
Interest income from interbank accounts decreased by 14.8% due to the 13.3% decrease in average volume and the decline in interbank interest level. Compared to 2000 the interest income on securities increased by 20.2% reflecting the 30.5% growth in average volume and the fall of the yields of government papers. In spite of this, reflecting the asset structure of the Bank, the net interest income from securities represented 25.9% of total. Within interest income in line with the 27.4% higher average volume, interest income from retail accounts grew by 15.0%. Despite of the lower volume and of the declining interest rates interest income from corporate and municipal accounts showed 14.4% and 2.2% increase. 22.4% of interest income was generated on retail accounts.
Changes in average volume of customer receivables, customer liabilities, of interest income and expense and yield compared to 2000:
Average volume Interest income/expense Yield (bp) Customer receivables 21.1% 13.8% -88 Total assets 6.6% 3.6% -29 Customer liabilities 8.1% -3.9% -68 Total liabilities 6.6% -4.8% -59
In spite of the growing volume of customer liabilities, interest expenses decreased on all types of accounts except municipal accounts. In the case of interbank liabilities (mainly on the refinanced receivables) interest expenses were higher because volume declined due to the growing of the HUF liabilities. Interest expenses on securities fell by 48.8%. Interest paid on retail accounts decreased by 3.1% and their share in total interest expenses was 78.3% in line with the liability structure.
Preliminary interest spread of average interest bearing assets (yielding 10.93%) and liabilities (yielding 5.53%) reached 5.40% in 2001, an increase of 38 basis points compared to 2000. In 2000 the average total assets were 6.6% higher than in 2000, and the calculated average yield declined by 29 basis points from 10.29% to 10.01%, while rate of interest paid decreased by 59 basis points from 5.52% to 4.93%. Preliminary net interest margin calculated over average total assets of the Bank reached 5.08% in 2001, 30 basis points higher than in 2000. Both indicators showed continuous improvement during the year.
OTP Bank’s 2001 Preliminary Stock Exchange Report
5
QUALITY OF LOAN PORTFOLIO, PROVISIONS
The overall quality of the loan portfolio improved in the 4th quarter. On 31 December 2001 qualified portion of total outstanding represented only 4.0% compared to 4.3% at the end of September 2001. This is due to the fact that while total loans exceeded the figure of 30 September by 11% the volume of no problem loans grew by 12.7% and the volume of qualified loans decreased by 18.2%.
Within qualified loans those to be monitored decreased by HUF 2.6 billion (12.8%), doubtful loans by HUF 4.6 billion (37.6%) and bad loans’ volume was HUF 3.3 billion (16.4%) lower compared to the end of September 2001. Volume of below average loans increased by HUF 0.5 billion (25.3%). During the fourth quarter volume of qualified loans declined in the corporate business by 25.2% and by 2.2% in retail business compared to 30 September 2001.
In the fourth quarter of 2001 the volume of bad loans declined significantly due to the decrease in the volume of bad loans of the corporate business. Large portion of the decrease in the volume of bad loans was caused by the sale of approx. HUF 4.4 billion bad loans as part of the restructuring of Hajdú-Bét exposure. The main reason of the decrease in the volume of to be monitored was that Hajdú-Bét has repaid its short-term loans in a value of around HUF 3.4 billion
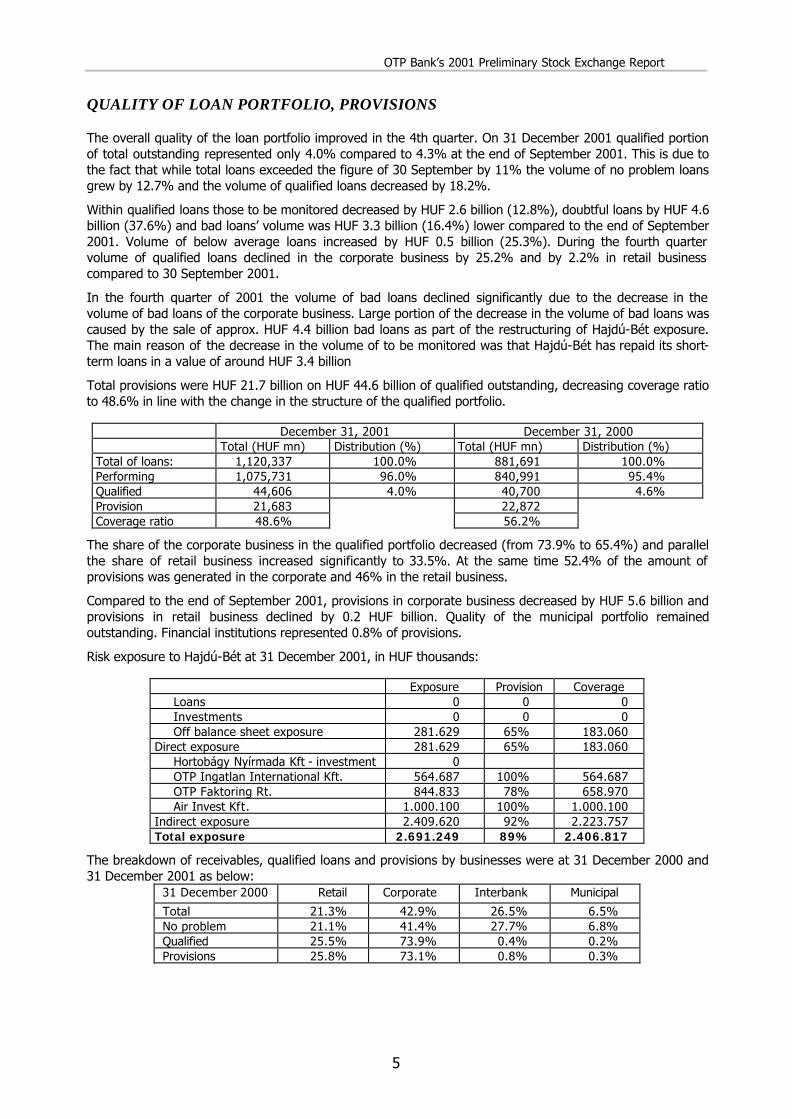
Total provisions were HUF 21.7 billion on HUF 44.6 billion of qualified outstanding, decreasing coverage ratio to 48.6% in line with the change in the structure of the qualified portfolio.
December 31, 2001 December 31, 2000
Total (HUF mn) Distribution (%) Total (HUF mn) Distribution (%) Total of loans: 1,120,337 100.0% 881,691 100.0% Performing 1,075,731 96.0% 840,991 95.4% Qualified 44,606 4.0% 40,700 4.6% Provision 21,683 22,872 Coverage ratio 48.6% 56.2%
The share of the corporate business in the qualified portfolio decreased (from 73.9% to 65.4%) and parallel the share of retail business increased significantly to 33.5%. At the same time 52.4% of the amount of provisions was generated in the corporate and 46% in the retail business.
Compared to the end of September 2001, provisions in corporate business decreased by HUF 5.6 billion and provisions in retail business declined by 0.2 HUF billion. Quality of the municipal portfolio remained outstanding. Financial institutions represented 0.8% of provisions.
Risk exposure to Hajdú-Bét at 31 December 2001, in HUF thousands:
Exposure Provision Coverage Loans 0 0 0 Investments 0 0 0 Off balance sheet exposure 281.629 65% 183.060
Direct exposure 281.629 65% 183.060 Hortobágy Nyírmada Kft - investment 0 OTP Ingatlan International Kft. 564.687 100% 564.687 OTP Faktoring Rt. 844.833 78% 658.970 Air Invest Kft. 1.000.100 100% 1.000.100
Indirect exposure 2.409.620 92% 2.223.757 Total exposure 2.691.249 89% 2.406.817
The breakdown of receivables, qualified loans and provisions by businesses were at 31 December 2000 and 31 December 2001 as below:
31 December 2000 Retail Corporate Interbank Municipal
Total 21.3% 42.9% 26.5% 6.5% No problem 21.1% 41.4% 27.7% 6.8% Qualified 25.5% 73.9% 0.4% 0.2% Provisions 25.8% 73.1% 0.8% 0.3%

OTP Bank’s 2001 Preliminary Stock Exchange Report
6
31 December 2001 Retail Corporate Interbank Municipal
Total 23.5% 41.1% 29.3% 6.2% No problem 23.1% 40.1% 30.5% 6.4% Qualified 33.5% 65.4% 0.4% 0.7% Provisions 46.0% 52.3% 0.8% 0.9%
The cost of risk provisioning for the year 2001 was HUF 5,655 million (21.4% lower than in 2000) and the Bank provided for the general risk (HUF 2.380 billion) as prescribed in the law on credit institutions. The Bank released exchange rate risk loss provisions and country risk provisions generated at the end of 2000 in accordance with law changes. Also based on new regulations (first appeared in the 1H 2001 report), a total of HUF 450 million provision for the uncovered open derivative position was generated, HUF 489 million less than 3 months earlier. The Bank generated HUF 675 million other provisions. Preliminary ratio of loan loss provisioning was 1.12% over the average volume of customer loans in 2001 compared to 1.29% in 2000.
NON-INTEREST INCOME
In 2001 non-interest income reached HUF 42,856 million, which was 10.0% higher than in 2000. Within this net fees and commissions increased by 24.9% to HUF 40,026 million (fees and commissions received increased by 21.5%, while fees and commissions paid were 4.0% higher).
Noteworthy, that fee income of card business was 40.1% higher than in 2000 and exceeded HUF 14 billion. Fee income connected to HUF retail current account keeping and loans increased at above than average rate due to increase in the number of clients, transactions and volume.
The securities trading showed a loss of HUF 1,641 million while the revenue was HUF 2,081 million in 2000. The Bank realised HUF 294 million lower profits on Discounted T-bills and HUF 3.844 million less on Hungarian Government bonds than in 2000. The generation of loss slowed down in the fourth quarter, as forecasted, and the profit for the quarter on securities trading reached HUF 219 million. At the same time the Bank could increase its interest income from the bond portfolio partially due to the changes in mandatory reserve regulations (resulting in approx HUF 60 billion average new bonds in the portfolio).
As we reported earlier this year, after splitting the Bank’s bond portfolio to trading and investment portfolio, the loss was generated partly by the government bonds in the trading portfolio (for which the bank has realised gains during the fourth quarter due to the decline in bond yields). Losses also resulted from the one-time accounting of the accumulated losses (amounting to more than HUF 2 billion) on the fixed rate government bonds portfolio kept on the books above face value, as of 1 January 2001 and partly on those maturing in 2001 and later according to the new depreciation rules valid from the beginning of the year.
The accumulated profit of FX trading was HUF 3.0 billion for 2001, just 4.0% less than in 2000. As the Bank kept an average neutral open FX position in the balance sheet contrarily to 2000 (average net FX position of the balance sheet for the year 2000 was around HUF 9.5 billion) therefore the revaluation of the asset-liability items - as a result of the appreciation of the Hungarian currency - caused HUF 2.3 billion losses. At the same time because of the growing FX trading the exchange rate spread was HUF 6.1 billion higher than in 2000. The average total net FX open position of the Bank was short as in 2000, but the size was 60% lower than in the previous year due to the conservative approach of the Bank.
Losses on real estate transactions were HUF 223 million lower than in 2000, the other non-interest incomes were with HUF 464 million lower because almost all of the items decreased.
Ratio of non-interest income in total income reached 30.3%, which is 0.6% lower than in 2000 mainly because of the losses on securities trading.
Total income for the Bank reached HUF 141,206 million, a 12.2% increase, which was above the inflation rate.
NON-INTEREST EXPENSES
During 2001 non-interest expenses reached HUF 85,285 million, representing an increase of 9.8%, slightly above the inflation. Personnel expenses increased by 20.3%. These expenses were influences by an average 10% salary increase for non-management employees at the beginning of the year, and salary increase for management in July 2001 and by the changes in the accounting regulations for the cost of the option and bonus program. In 2001 and subsequently, (as opposed to the previous practice, when

OTP Bank’s 2001 Preliminary Stock Exchange Report
7
accounting was on a non-accrual basis) the bank is accruing in the current year the expected expenses due in the future related to the bonus and option program. There was only bonus program in the personnel expenses for 2000, while in 2001 the bank accounted for the bonus and option programs for 2001 and 2002 due based on the performance in 2000 and 2001. Deducting the accruals for the 2001 program due in 2002, the increase of personal expenses would have reached 14.1% only. The ratio of personnel expenses in the total income was 23.1% compared to 21.5% in 2000. Depreciation grew by 7.3% to HUF 11,128 million. Other non-interest expenses were only 3.4% higher than a year earlier. Among them, the most important items were non-refundable VAT and local taxes for HUF 6.8 billion (14.5% increase) and material and service expenses related to banking operations (3.3% decrease). The rental costs of the Bank decreased by 15.6% in connection with the rationalisation of its real estate holdings, while the paid fees for specialists increased in connection with ongoing IT projects.
The Bank’s cost -to - income ratio was 60.3%, which was 140 basis points lower than in 2000 and was also favourable than in the plans of the management.
NON-CONSOLIDATED HAR BALANCE SHEET AS AT 31 DECEMBER 2001
OTP Bank’s total assets as at 31 December 2001 were HUF 2,126,437 million, 10.1% higher than a year earlier. Growth was significantly above the December on December inflation, the total assets of the Bank increased in real terms, due to strong inflow of deposits during the last months of the year. The preliminary market share of the Bank based on total assets was 22.4% (At the end of 2000 it was 22.9%).
Within banking assets cash declined by 22.8% due to 29.4% lower volume of term deposits with the NBH in line with changes in mandatory reserve regulations. Term deposit with the NBH decreased mainly owing to the termination of FX deposits with maturity less than 1 year.
Volume of government securities increased by 8.4%. Trading securities were HUF 129.3 billion or 70.6% lower, while investment securities were HUF 166.4 billion or 65% higher in line with the splitting of the portfolio into trading and investment parts.
The volume of the interbank placements increased by 41.1% since the end of 2000 and represented 15.5% of total assets. Within interbank placements the 75.6% higher FX deposits with foreign banks and FX deposits with domestic banks represented the most significant volumes.
Within banking assets, receivables from customers represented 36.2% (31.8% on December 31, 2000), and were HUF 769.8 billion, which was 25.4% higher than a year earlier. Within the commercial loan portfolio retail lending grew by 43.3%, corporate lending, despite of the repayment of many high volume loans, grew by 18.2%. Loans to municipalities grew by 14.9%.
Within corporate lending reaching HUF 464.8 billion at the end of period, loans extended to economic entities increased by 28.9% to HUF 420.0 billion. Within this loans for investment purposes grew by 69.0%, while working capital loans increased by 6.9%. The share of the working capital loans in the amount of loans to economic entities was 28.3%. Foreign currency loans, decreased by 8.7%, and represented 25.7% of total, compared to 36.3% in the previous year. Within corporate loans, those granted to small businesses increased by 18.2% or by HUF 2.4 billion. The share of loans to small businesses within the corporate loan portfolio decreased from 4.1% to 3.8%.
The volume of retail loans increased by 43.3% to HUF 258.3 billion. Within retail loans the growth of housing loans was 44.9% compared to 2000. The volume of the new housing loan introduced in August 2001 almost reached HUF 13 billion during 5 months. The volume of loans granted under conditions valid in 2000 increased by 156.8%. The volume of loans granted under conditions that were valid before 1989, during 1989-1994, and in 1994 decreased significantly. The volume of home equity loans grew by HUF 19.5 billion or 72.4% in 2001.
The volume of consumer loans increased by 24.2%, and was HUF 61.1 billion at the end of 2001. Within this the volume of loans connected to retail current accounts increased by 35.2% and reached HUF 56.6 billion. The volume growth of C-loans, introduced in summer 2000, was 242.4% since December 2000 and the volume increased to HUF 13.2 billion. Volume of loans financing consumer purchases and personal loans decreased by 58.9% and 47.6%. (The volume of Student-loan introduced in 2001 reached HUF 70 million at the end of 2001.)
The market share of the Bank in retail housing loans was 46.3% (55.3% in 2000) and was 21.5% (20.7%) in consumer and Lombard loans.

OTP Bank’s 2001 Preliminary Stock Exchange Report
8
The volume of municipal loans increased further and reached HUF 46.7 billion form HUF 40.7 billion. The Bank retained its leading position in municipal lending. Loans to budgetary organisations were lower than on 31 December 2000 and reached HUF 8.6 billion.
At the end of 2001 the market share of the Bank in lending showed a varied picture. Based on preliminary data, on 31 December 2001 the market share of the Bank was 16.4% in overall lending (14.5% at the end of 2000), and granted 30.7% (31.7% in 2000) of retail, 11.8% (10.5% in 2000) of corporate and 69.1% (71.9% in 2000) of municipal loans.
On 31 December 2001, customer deposits represented 85.2% of the Bank’s liabilities. Their volume was HUF 178.2 billion or 10.9% higher than a year earlier and reached HUF 1,811.2 billion. The increase in retail business was HUF 97.5 billion, in corporate business was HUF 42.7 billion, while deposits of municipalities grew by HUF 38.0 billion. HUF deposits increased by HUF 169.0 billion, while FX deposits expressed in HUF grew by HUF 9.4 billion. On 31 December 2001 the preliminary market share of the Bank was 30.9% in deposits with banks (32.1% at the end of 2000).
Volume of retail deposits increased by 7.5% to HUF 1,405.6 billion during 2001, their share within customer deposits represented 77.6%. Within HUF deposits, passbook deposits slightly decreased. Current account deposits, the leading retail product of the Bank increased significantly - in line with the business policy announced by the management - from HUF 520.8 billion to HUF 630.2 billion or by 21.0% and their share in retail deposits grew from 53.6% to 58.5%. The increase of sight deposits exceeded the increase of term deposits reflecting the growing number of clients and increases in salaries deposited on the accounts. Within retail deposits, during the 12 months preceding 31 December 2001, foreign currency deposits expressed in HUF decreased by 2.1%, while HUF deposits were up by 10.8%. At the end of 2001 the Bank managed 39.2% (41.8% in 2000) of retail HUF, 36.2% (38.6%) of retail foreign currency deposits.
On 31 December 2001 the volume of savings in the Bank’s securities, partly as a result of the decrease in interest rates during the year, decreased by 24.2% was HUF 14.9 billion. By the end of the year the Bank’s market share of securities issued by banks reached 1.1% (1.6% in 2000).
Volume of corporate deposits increased by 20.2% in the period of analysis. Deposits of legal entities decreased by 3.6% in HUF and by 3.2% in foreign currencies. HUF deposits of small enterprises grew by 51.7%, and by 138.0% in foreign currency. The Bank’s market share of corporate deposits was 11.8, with 0.5% above the market share at the end of 2000.
Municipal deposits increased by 33.4% and were HUF 152.1 billion on 31 December 2001. Local governments placed 79.7% of their deposits at the Bank (80.8% in 2000).
Within the Bank's liabilities the volume of provisions grew from HUF 11.3 billion at the end of previous year to HUF 14.6 billion on 31 December 2001.
SHAREHOLDERS’ EQUITY
Preliminary shareholders’ equity of OTP Bank on 31 December 2001 was HUF 158.5 billion, an increase of 25.4%, from a year earlier. The increase of HUF 31.0 billion was a result of an additional HUF 3.8 billion in general reserves, as well as a HUF 15.2 billion increase in retained earnings, a HUF 8.7 billion increase in legal reserves and a HUF 3.3 billion growth in net profits. Preliminary book value of 1 share on 31 December 2001 was HUF 5,662.
On 31 December 2001, the guarantee capital of the Bank without net income for 2001 stood at HUF 95.6 billion, while including the preliminary net income it reached HUF 122.9 billion.
With the risk weighed total assets of HUF 870.7 billion, the capital adequacy ratio - calculated according to Hungarian regulations - as at 31 December 2001 was 10.98%, well in excess of the 8 % required by the Banking Act. The capital adequacy ratio including provisional net earning was 14.12% and it was in compliance of the targets of the Bank's management.
OTHER OPERATIONAL DATA
During the year, the number of retail current accounts, the lead product of the Bank , expanded by 96 thousand to 2,620.4 thousand, based on the present product range. Number of term deposits on the current accounts reached 628.2 thousand at the end of December. In December 2001 1,683 thousand salary and

OTP Bank’s 2001 Preliminary Stock Exchange Report
9
pension transfers were sent to the accounts. The number of transfers from the accounts exceeded 3.5 million.
The number of cards issued connected to the retail current accounts exceeded 2.75 million on 31 December 2001, compared to 2.64 million at the end of 2000. Within this the number, the identification cards issued for current account owners was 158.8 thousand. The number of B-loan cards related to retail current accounts was 174 thousand and the number of the C-loan cards was 72.1 thousand at the end of 2001. Including corporate and FX based cards, the total number of cards issued approached 3,1 million, an increase of 7.4% over 2000. The Bank’s estimated market share of cards issued was over 60%.
The number of the Bank’s ATMs expanded from 1,065 to 1,091; so the Bank owns almost half of the ATMs in the country and more than 50% of the ATMs run by banks. The number of transactions performed on the Bank’s ATMs in 2001 reached 57.5 million, while the turnover of transactions was HUF 1,110.4 billion, 9.7% and 23.1% higher than in 2000. The number of POS terminals on 31 December 2001 stood at 16,330, an increase of 1,133 over a year earlier. Out of the POS terminals 2,467 were operating in the Bank’s branches and 9,356 at commercial establishments, which include gas stations. The number of cash withdrawal transactions on the Bank’s own POS network grew by 12.5% and reached 6.2 million, the turnover increased by 23.7% and was HUF 714.7 billion, while number of merchant transactions was 22.2 million (43.2% increase) with a value of HUF 182.5 billion (43.0% increase). At the end of December 2001 the number of contracted customers for the telephone banking service surpassed 344,000, for mobile banking service 97,000 and for Internet banking service 133,000. During the year the retail electronic distribution network of the Bank carried out 90.8 million transaction of HUF 2.1 billion total value. More than 70% of the turnover in withdrawal transactions and almost half of the purchases in the country were arranged through the network of OTP Bank.
The number of OTP Bank staff grew slightly in 2001. The closing staff number increased by 92 during the first 9 months of 2001 and a further 64 rise was experienced in Q4. This includes 24 persons transferred from OTP Securities as a result of integration of the investment banking into the bank. Thus on 31 December 2001 the closing stuff number was 156 higher than a year earlier. At the same time average employment continued to decrease thus productivity increased.
The Company's staff level (person) 31 December
2000 30 September
2001 31 December
2001 Change during the
last 12 months (%) Average number of employees 8,435 8,169 8,188 -2.9 Employees at the end of period 8,137 8,229 8,293 1.9
CONSOLIDATED FIGURES AS AT 31 DECEMBER 2001
The guiding principle in consolidating the balance sheets and profit and loss accounts prepared by OTP Bank’s fully integrated subsidiaries, in line with the Bank’s consolidation accounting policy, was to restructure the subsidiaries’ asset, liability, income and expenses items under non-banking and investment activities.
Preliminary 2001 consolidated data of the OTP Group in HUF million:
Equity Total assets Pre-tax profits
31-Dec-2000
Audited 31-Dec-2001.
Preliminary 31-Dec-2000
audited 31-Dec-2001.
Preliminary 31-Dec-2000
audited 31-Dec-2001.
Preliminary
OTP Bank Ltd. 127,502 158,533 1,931,272 2,126,437 40,216 47,411 Subsidiaries total 44,939 56,904 223,617 278,568 7,775 9,884 Total (non consolidated) 172,441 215,437 2,154,889 2,405,005 47,991 57,295 Consolidated 143,106 182,626 2,076,902 2,319,052 47,577 57,829
The group of fully consolidated subsidiaries changed compared to the corresponding period of last year because OTP Fund Servicing and Consulting Ltd. and OTP Mortgage Bank have been a fully consolidated subsidiary since the preparation of the consolidated Stock Exchange Report of 31 December 2001.
In preparing the Stock Exchange Report of 31 December 2001, the bank applied the following methodology: Fully consolidated subsidiaries 17 Equity consolidated companies 13 of which

OTP Bank’s 2001 Preliminary Stock Exchange Report
10
- daughter companies 9 - joint managed company - - joint companies 4
CONSOLIDATED BALANCE SHEET
Total assets of the group were HUF 2,319 billion, 9.1% higher than total assets of the Bank. The consolidated balance sheet total of the Group increased by HUF 242 billion or 11.7% from a year earlier. Among daughter companies total assets of OTP Building Society increased the most (by HUF 16.8 billion) followed by OTP-Garancia by HUF 14.5 billion, while growth of total assets at Merkantil Bank neared HUF 6.2 billion not taking into account of consolidation. Merkantil Car reached a HUF 10.9 billion growth in total assets due to its increasing financial leasing business line.
The HUF 242 billion increase in the consolidated balance sheet was the result of HUF 105 billion decrease in current assets while fixed assets grew by HUF 344 billion and accrued assets increased by HUF 3 billion.
In the consolidated balance sheet of 31 December 2001, the shares of current assets and investments were 50.7% and 47.8%, respectively while a year ago these shares were 61.6% and 36.8%, respectively.
In the consolidated balance sheet, the increase of current assets stemmed from the increase of receivables (HUF 114 billion), inventories (HUF 1 billion), and the decrease of securities (HUF 111 billion), and cash and balances (HUF 109 billion).
The 22.3% decline in the consolidated cash and balances figure is mainly due to the decrease in deposits of OTP Bank at the National Bank of Hungary (HUF 123 billion), the decline is moderated by the increase in the volume of cash and foreign currencies (HUF 11 billion).
The 44.7% decrease in the stock of trading securities was mostly caused by the change in the volume of government securities (HUF 120 billion) and the increase in the volume of own shares (HUF 7.5 billion). The volume of government securities owned by OTP Bank decreased by HUF 129 billion. Among daughter companies the growth by HUF 12.6 billion in investments of the OTP Building Society were outstanding. Out of the HUF 26.4 billion own shares, OTP Bank holds 67.3% according to the book value, while the rest is owned by two subsidiaries.
Short-term receivables were 21.3% higher than a year earlier. Gross volume of receivables from banks grew by HUF 110.9 billion (54.2%), customer receivables increased by HUF 5.2 billion (1.7%). Other receivables declined by HUF 2 billion (10.0%).
The increase in consolidated receivables from financial institutions is mostly caused by the change of receivables from foreign banks at OTP Bank.
The change in receivables from customers is affected mostly by Merkantil-Group and HIF, apart from OTP Bank.
The HUF 1 billion change in volume of consolidated inventories can be explained by the ongoing projects at OTP Real Estate.
Compared to the same period of 2000 the consolidated volume of fixed assets was 44.9% higher. Within this investment securities increased the largest extent (HUF 183.8 billion), which was caused mainly by the Bank. In addition the investment of OTP Garancia Insurance Company on behalf of its customers increased by HUF 16 billion compared to the previous year due to the boom of the life insurance business.
Consolidated value of tangible assets increased by HUF 2 billion. The change is in relation with the accession of Merkant-Ház Ltd. to the fully consolidated group.
The liabilities side of the balance sheet increased due to HUF 178 billion growth in liabilities, HUF 16 billion jump in liability side provisions and an increase of HUF 8 billion in accrued liabilities.
Volume of short-term and long-term liabilities in the consolidated balance sheet increased by 10.5% (HUF 182.6 billion) and 3.5% (HUF 4.1 billion), respectively. The change in long term liabilities is almost the same on consolidated basis than in the Bank, while in short term liabilities OTP Building Society and Merkantil Bank accelerated the short-term customer liabilities growth of the OTP Bank (HUF 158 billion). Within liabilities, short term liabilities to customers increased by HUF 204.5 billion caused primarily by the change in the volume of deposits at OTP Bank.

OTP Bank’s 2001 Preliminary Stock Exchange Report
11
The share of customer liabilities in total liabilities reached 91.7% on the 31st of December 2001 and 89.6% on the 31st of December 2000. The shares were 92.2% and 90.1% in the case of OTP Bank.
Provisions on the liability side in the consolidated balance rose by HUF 16 billion. The provision for pending and future obligations increased by HUF 1 billion. General risk provisions and other provisions increased by HUF 2 and 13 billion, respectively. Within it, reserves of OTP Garancia were higher by HUF 12.5 billion compared to 31 December 2000.
Consolidated shareholders’ equity was HUF 183 billion (27.6% growth) at the end of December 2001 representing 7.9% in balance sheet total compared to 6.9% last year.
CONSOLIDATED RESULTS
Consolidated pre-tax profit for 2001 was HUF 57,829 million, 22.0% higher than pre-tax profit of the parent company, and 21.5% higher than consolidated pre-tax profit for 2000.
Consolidated after tax profits for 2001 were 46,928 million, 21.6% higher than in 2000 and 22.2% higher than at the Bank.
Undiluted consolidated earnings per share2 (EPS) for 2001 was HUF 1,832.62, while diluted3 EPS HUF 1,676.00. US dollar equivalents were USD 6.39 and USD 5.84 respectively, based on the National Bank’s average middle exchange rate between 1 January and 31 December 2001 (286.80 HUF/USD).
Consolidated net interest income for the year 2001 reached HUF 110,873 million, 14.8% higher than in 2000 and 12.7% more than that of the Bank. It can be explained by the successful operation of Merkantil Group and the return of investments at OTP Building Society. Consolidated interest incomes were 5.2% higher and expenses were 3.8% lower than in 2000, respectively. Preliminary interest margin over the calculated average total assets grew from 4.92% in 2000 to 4.99% for 2001.
Within the HUF 211.4 billion consolidated interest income the interest from securities represented the highest growth (HUF 9.4 billion) and the interbank interest income decreased by the largest amount (HUF 7.3 billion). An increase in interest income could be detected on retail and corporate accounts both on consolidated (17.6% and 12.6%%) and non-consolidated (15.0% and 14.4%) level.
Among interest expenses, the largest share is paid on retail deposits (HUF 76.1 billion). Interest expenses on corporate accounts declined by HUF 0.7 billion and paid interests on retail deposits and securities was considerably lower (HUF 2.1 billion and HUF 0.6 billion) compared to the previous year.
Consolidated non-interest income increased by 12.5%. Group net fees and commissions were 20.9% higher than a year earlier but lower than at the Bank. Majority of non-interest income at the Group especially at the insurance subsidiary shows up at other non-interest income, which was HUF 48.6 billion higher than at the Bank and 13.0% above the consolidated figure of 2000. In 2001, the share of non-interest income in total income on a consolidated basis was 46.1%, down from 46.7% in 2000.
Cost to income ratio at consolidated basis decreased significantly from 68.3% to 66.8% in 2001 but exceeds the Bank’s figure, due to consolidation process and the characteristics of profit generation of the subsidiaries especially OTP-Garancia.
Consolidated operating income was HUF 10.8 billion higher (18.8%), while provisioning 5.3% higher than a year ago.
Provisioning and loan losses came to 15.3% in 2001 of operating income (17.2% in 2000). At the bank this ratio decreased from 16.5% to 15.2%.
OTP Bank’s 2001 Preliminary Stock Exchange Report
12
SUBSIDIARIES
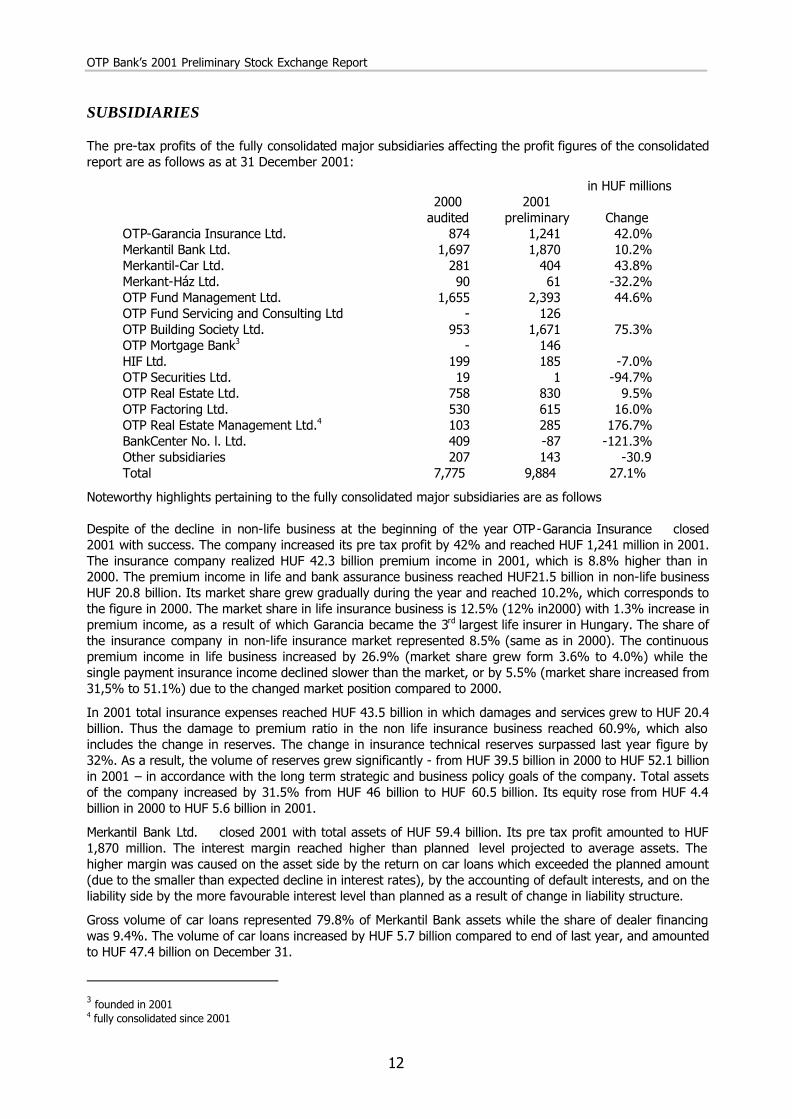
The pre-tax profits of the fully consolidated major subsidiaries affecting the profit figures of the consolidated report are as follows as at 31 December 2001:
in HUF millions
2000
audited 2001
preliminary Change OTP-Garancia Insurance Ltd. 874 1,241 42.0% Merkantil Bank Ltd. 1,697 1,870 10.2% Merkantil-Car Ltd. 281 404 43.8% Merkant-Ház Ltd. 90 61 -32.2% OTP Fund Management Ltd. 1,655 2,393 44.6% OTP Fund Servicing and Consulting Ltd - 126 OTP Building Society Ltd. 953 1,671 75.3% OTP Mortgage Bank3 - 146 HIF Ltd. 199 185 -7.0% OTP Securities Ltd. 19 1 -94.7% OTP Real Estate Ltd. 758 830 9.5% OTP Factoring Ltd. 530 615 16.0% OTP Real Estate Management Ltd.4 103 285 176.7% BankCenter No. l. Ltd. 409 -87 -121.3% Other subsidiaries 207 143 -30.9 Total 7,775 9,884 27.1%
Noteworthy highlights pertaining to the fully consolidated major subsidiaries are as follows
Despite of the decline in non-life business at the beginning of the year OTP-Garancia Insurance closed 2001 with success. The company increased its pre tax profit by 42% and reached HUF 1,241 million in 2001. The insurance company realized HUF 42.3 billion premium income in 2001, which is 8.8% higher than in 2000. The premium income in life and bank assurance business reached HUF21.5 billion in non-life business HUF 20.8 billion. Its market share grew gradually during the year and reached 10.2%, which corresponds to the figure in 2000. The market share in life insurance business is 12.5% (12% in2000) with 1.3% increase in premium income, as a result of which Garancia became the 3rd largest life insurer in Hungary. The share of the insurance company in non-life insurance market represented 8.5% (same as in 2000). The continuous premium income in life business increased by 26.9% (market share grew form 3.6% to 4.0%) while the single payment insurance income declined slower than the market, or by 5.5% (market share increased from 31,5% to 51.1%) due to the changed market position compared to 2000.
In 2001 total insurance expenses reached HUF 43.5 billion in which damages and services grew to HUF 20.4 billion. Thus the damage to premium ratio in the non life insurance business reached 60.9%, which also includes the change in reserves. The change in insurance technical reserves surpassed last year figure by 32%. As a result, the volume of reserves grew significantly - from HUF 39.5 billion in 2000 to HUF 52.1 billion in 2001 – in accordance with the long term strategic and business policy goals of the company. Total assets of the company increased by 31.5% from HUF 46 billion to HUF 60.5 billion. Its equity rose from HUF 4.4 billion in 2000 to HUF 5.6 billion in 2001.
Merkantil Bank Ltd. closed 2001 with total assets of HUF 59.4 billion. Its pre tax profit amounted to HUF 1,870 million. The interest margin reached higher than planned level projected to average assets. The higher margin was caused on the asset side by the return on car loans which exceeded the planned amount (due to the smaller than expected decline in interest rates), by the accounting of default interests, and on the liability side by the more favourable interest level than planned as a result of change in liability structure.
Gross volume of car loans represented 79.8% of Merkantil Bank assets while the share of dealer financing was 9.4%. The volume of car loans increased by HUF 5.7 billion compared to end of last year, and amounted to HUF 47.4 billion on December 31.
3 founded in 2001 4 fully consolidated since 2001
OTP Bank’s 2001 Preliminary Stock Exchange Report
13
Noticeable, that the demand on HUF loans and on financial leasing based on foreign exchange (which appears in the books of Merkantil Car Ltd) approached. , and that the share of used cars in the portfolio increased. The number of car financing transactions in Merkantil Group reached 39,540 of which the number of new car financing was 22,503, and the share of foreign exchange leasing was 39.2%.
Total assets of Merkantil Car reached HUF 33.9 billion at the end of 2001 increased by HUF 10 billion compared to 2000. The volume of foreign currency denominated car leasing was HUF 29.2 billion 66% or HUF 11.6 billion higher than in the previous year. The volume of capital goods leasing business rose by 169% to HUF 4.1 billion from 2000. In 2001 income exceeded the planned figures and operating costs were lower than expected. The company closed 2001 with pre tax profit of HUF 404 million.
The rationalization of capital market service activity in OTP Group at OTP Securities continued over the fourth quarter correspondently to the OTP Group’s strategy. Within the framework of the rationalization program the investment banking services will be taken over by the Bank.
In 2001 the integration dominated the activity and the management of OTP Securities Ltd. The company realized HUF 1,000 million coverage (income HUF 2,685 million, expense HUF 1,685 million) on the core investment service activities during 2001, majority of that was generated in the first half of the year.
Trading in government papers was moved to the Bank at the end of 1H 2001. After the second quarter of 2001 in equity trading only commission deals were satisfied.
Despite of the negative effect of the integration process the company realized HUF 1 million pre tax profit compared to the planned HUF 278 million loss. The outstanding efficiency was due to the derivate trading, the government papers business, the portfolio management and the cost rationalization.
The London-based Hungarian International Finance Ltd.’ s activity mostly corresponded to its targets. The volume of shareholder’s equity exceeded Huf 1,837 million (GBP 4,54 million). The company managed successfully to replace maturing assets, grow the value of its portfolio and enhance its market position. The pre tax profit amounted to HUF 185 million (GBP 452 thousand). The Bank offers HIF’s export finance services to its domestic customers and HIF intermediated high yielding assets to the Bank.
The Central and Eastern European market remained the main region of the company's business strategy, constituting 66.1% of total assets, commitments and guarantees. Contracts from the markets of Central and South America represented 10.2% of receivables, while Middle East and North Africa represented 15.5%.
The results of OTP Fund Management are continuously increasing year-by-year. The pre-tax profits of the company for the year 2001 reached HUF 2,393 million which was 44.6% higher than a year earlier. The assets of the funds managed by the company grew by 34.3% from HUF 273.4 billion to HUF 367.3 billion during the year, which was well above the 23.6% growth of the market. Thus the market share of the company increased from 48.5% to above 52%. The assets of the managed pension funds grew from HUF 70.3 billion to HUF 101.7 billion.
OTP Building Society concluded 80,249 contracts in 2001 in cooperation with agent companies and the branches of OTP Bank. In the fourth quarter the withdrawal of the customer deposits and the disbursement of loans has started. Half of those entitled withdrew their deposits and quarter of them took a loan. The volume of customer deposits was HUF 48.1 billion on 31 December 2001. The company closed the year with HUF 1,671 million pre-tax profit, a 75.3% increase compared to last year and considerably exceeding the planned figure.
OTP Bank realising the new opportunities created by the government subsidies to housing established OTP Mortgage Bank in May 2001, which starts its operation in 2002 as a specialised lending institution. Its business target is to increase competitiveness and market share of the group on the housing lending market and to realise the higher margin offered by the multiple government subsidies. It intends to purchase high quality housing loans from the Bank and finance it with the issuance of mortgage bonds to be subscribed by the bank. The new Mortgage Bank is going to distribute its product through the bank and the group companies taking advantage of the accumulated know how and the high capital and trustworthiness of the banking group. The bank considers it target to reach and maintain a market share of 45-50% on the housing lending market as realistic.
At OTP Real Estate the volume of sales reached HUF 10.5 billion and pre tax profits reached HUF 830 million, which exceeded the planned figure. From the more than HUF 11.4 billion total assets the volume of
OTP Bank’s 2001 Preliminary Stock Exchange Report
14
working capital reached HUF 9.9 billion, within that the inventories represented HUF 7.7 billion. Inventories were financed partly from own sources, partly from customer payments in advance and from project financing loans.
The gross volume of new receivables taken over by OTP Factoring in 2001 was around HUF 10,444 million. Within this HUF 7,534 million was taken over from OTP Bank. The activity remains to be very profitable. The incomes of the company are much higher than planned, due to the increase of the redemptions and to outstanding incomes from businesses launched in last months in 2000 closed in the beginning of 2001. As a result of activity the company realised a pre-tax profit of HUF 615 million above the planned figure.
PERSONAL CHANGES
During the fourth quarter of 2001 the auditor of the Bank, the Board of Directors and the Supervisory Board remained unchanged.
Budapest, 14 February 2002
For further information please contact:
George Fenyo managing director Investor Relations OTP Bank Ltd. Phone: +36 1 269 1693 Fax: + 36 1 331 6312 email: [email protected] www.otpbank.hu

OTP Bank’s 2001 Preliminary Stock Exchange Report
15
FINANCIAL DATA

OTP Bank’s 2001 Preliminary Stock Exchange Report
16
OTP BANK LTD. SELECTED NON-CONSOLIDATED FINANCIAL DATA (HUF)
HUF MILLIONS
For the 12 months ended 31 December
Change
2000 2001 01/00 Interest from interbank accounts 55,017 46,885 -14.8% Interest from customer accounts 37,830 43,488 15.0% Interest from corporate accounts 37,673 43,097 14.4% Interest from municipal accounts 5,572 5,694 2.2% Interest from bonds 41,736 50,188 20.3% Interest from mandatory reserves 9,271 4,449 -52.0% Total interest income 187,099 193,801 3.6% Interest to interbank accounts 3,037 3,449 13.6% Interest on customer accounts 77,209 74,780 -3.1% Interest on corporate accounts 9,733 8,397 -13.7% Interest on municipal accounts 5,795 5,959 2.8% Interest on bonds 2,881 1,474 -48.8% Interest on subordinated loan 1,591 1,392 -12.5% Total interest expense 100,246 95,451 -4.8% Net interest income 86,853 98,350 13.2% Fees & commissions income 38,220 46,444 21.5% Fees & commissions paid 6,172 6,418 4.0% Net fees & commissions 32,048 40,026 24.9% Securities trading 2,081 -1,641 -178.9% FOREX trading 3,123 2,999 -4.0% Losses on property transactions -391 -168 -57.0% Other 2,104 1,640 -22.1% Non interest income 38,965 42,856 10.0% Ratio of non interest income in total income 31.0% 30.3% -2.0% Total income 125,818 141,206 12.2% Staff costs 27,066 32,551 20.3% Depreciation 10,371 11,128 7.3% Other costs 40,232 41,606 3.4% Operating costs 77,669 85,285 9.8% Cost/income ratio 61.7% 60.4% -2.1% Operating income/Profit 48,149 55,921 16.1% Provisions 7,933 8,510 7.3% Pre-tax profit 40,216 47,411 17.9% Taxes 7,733 8,995 16.3% Tax rate % 19.2% 19.0% -1.4% Net income 32,483 38,416 18.3% 1 The Bank’s audited 1999 and non-audited 2000 financial statements were prepared on the basis of Hungarian Accounting Rules and are here presented in a structure closer to international practice

OTP Bank’s 2001 Preliminary Stock Exchange Report
17
OTP BANK LTD. SELECTED NON-CONSOLIDATED FINANCIAL DATA (USD)5
USD ‘000s
For the 12 months ended 31 December
Change
2000 2001 01/00 Interest from interbank accounts 195,242 163,478 -16.3 Interest from customer accounts 134,248 151,630 12.9 Interest from corporate accounts 133,692 150,268 12.4 Interest from municipal accounts 19,773 19,851 0.4 Interest from bonds 148,111 174,995 18.2 Interest from mandatory reserves 32,901 15,514 -52.8 Total interest income 663,967 675,736 1.8 Interest to interbank accounts 10,776 12,027 11.6 Interest on customer accounts 273,996 260,739 -4.8 Interest on corporate accounts 34,544 29,279 -15.2 Interest on municipal accounts 20,564 20,777 1.0 Interest on bonds 10,223 5,141 -49.7 Interest on subordinated loan 5,645 4,852 -14.0 Total interest expense 355,748 332,815 -6.4 Net interest income 308,219 342,921 11.3 Fees & commissions income 135,629 161,939 19.4 Fees & commissions paid 21,905 22,379 2.2 Net fees & commissions 113,724 139,560 22.7 Securities trading 7,384 -5,722 -177.5 FOREX trading 11,082 10,458 -5.6 Losses on property transactions -1,391 -588 -57.7 Other 7,473 5,716 -23.5 Non interest income 138,272 149,424 8.1 Interest vs. non interest income 31.0% 30.3% -2.0 Total income 446,491 492,345 10.3 Staff costs 96,051 113,498 18.2 Depreciation 36,801 38,800 5.4 Other costs 142,775 145,064 1.6 Operating costs 275,627 297,362 7.9 Cost/income ratio 61.7% 60.4% -2.1 Operating income/Profit 170,864 194,983 14.1 Provisions 28,147 29,672 5.4 Pre-tax profit 142,717 165,311 15.8 Taxes 27,443 31,363 14.3 Taxes due to consolidation --- --- Tax rate % 19.2% 19.0% -1.4 Net income 115,274 133,948 16.2
5 The US Dollar amounts are solely for convenience of readers outside Hungary. The rate used for USD amounts is 281.79 HUF/USD for 2000, and 286.80 HUF/USD for 2001.

OTP Bank’s 2001 Preliminary Stock Exchange Report
18
OTP BANK LTD. SELECTED CONSOLIDATED FINANCIAL DATA (HUF)
HUF MILLIONS
For the 12 months ended 31 December
Change %
2000 2001 01/00 Interest from interbank accounts 54,258 46,934 -13.5% Interest from customer accounts 43,997 51,754 17.6% Interest from corporate accounts 42,298 47,635 12.6% Interest from municipal accounts 5,572 5,693 2.2% Interest from bonds 45,461 54,839 20.6% Interest from mandatory reserves 9,494 4,584 -51.7% Total interest income 201,080 211,439 5.2% Interest to interbank accounts 4,441 3,909 -12.0% Interest on customer accounts 78,223 76,125 -2.7% Interest on corporate accounts 9,234 8,562 -7.3% Interest on municipal accounts 5,795 5,959 2.8% Interest on bonds 5,232 4,619 -11.7% Interest on subordinated loan 1,591 1,392 -12.5% Total interest expense 104,516 100,566 -3.8% Net interest income 96,564 110,873 14.8% Fees & commissions income 41,298 49,442 19.7% Fees & commissions paid 8,114 9,323 14.9% Net fees & commissions 33,184 40,119 20.9% Securities trading 3,022 -1,074 -135.5% FOREX trading 2,130 3,625 70.2% Losses on property transactions 1,602 2,056 28.3% Other 44,518 50,285 13.0% Non interest income 84,456 95,011 12.5% Ratio of non interest income in total income 46.7% 46.1% -1.3% Total income 181,020 205,884 13.7% Staff costs 34,645 41,337 19.3% Depreciation 12,807 14,529 13.4% Other costs 76,097 81,767 7.5% Operating costs 123,549 137,633 11.4% Cost/income ratio 68.3% 66.8% -2.2% Operating income/Profit 57,471 68,251 18.8% Provisions 9,894 10,422 5.3% Pre-tax profit 47,577 57,829 21.5% Taxes 9,138 10,848 18.7% Taxes due to consolidation -161 53 -132.6% Tax rate % 18.9% 18.8% -0.5% Net income 38,600 46,928 21.6% 1 The Bank’s 2000 and 2001 financial statements were prepared on the basis of Hungarian Accounting Rules and are here presented in a structure closer to international practice
OTP Bank’s 2001 Preliminary Stock Exchange Report
19
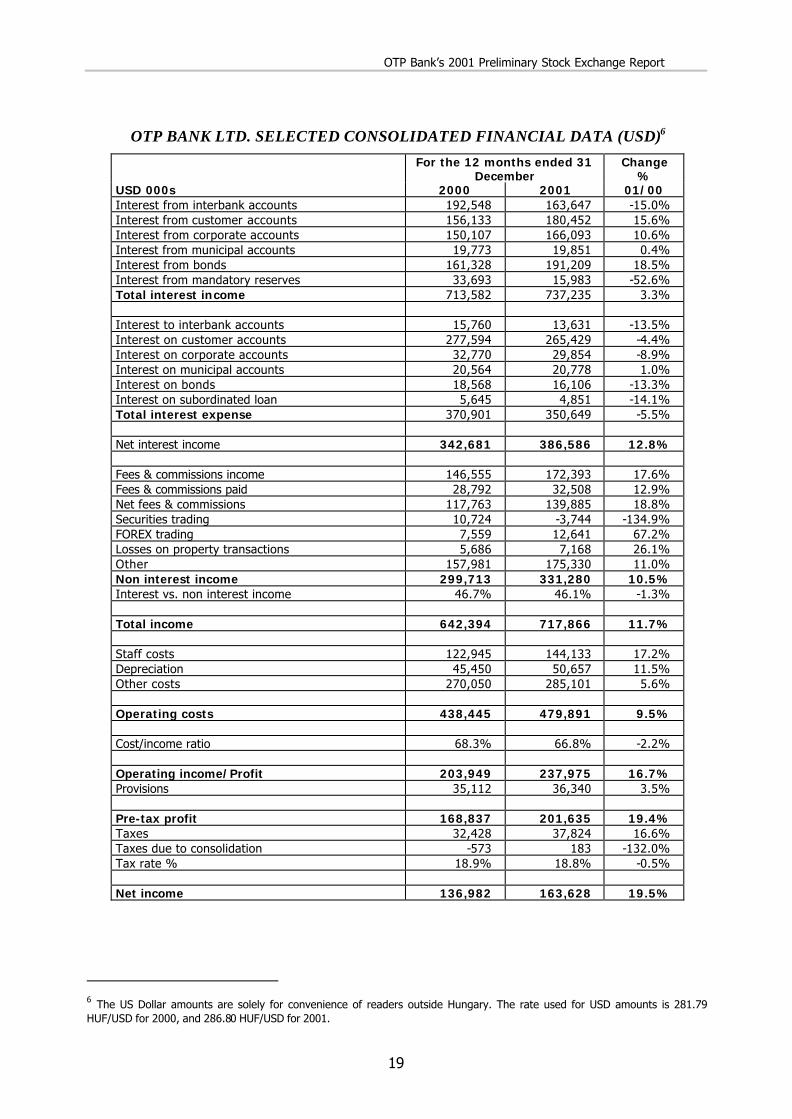
OTP BANK LTD. SELECTED CONSOLIDATED FINANCIAL DATA (USD)6
For the 12 months ended 31 December
Change %
USD 000s 2000 2001 01/00 Interest from interbank accounts 192,548 163,647 -15.0% Interest from customer accounts 156,133 180,452 15.6% Interest from corporate accounts 150,107 166,093 10.6% Interest from municipal accounts 19,773 19,851 0.4% Interest from bonds 161,328 191,209 18.5% Interest from mandatory reserves 33,693 15,983 -52.6% Total interest income 713,582 737,235 3.3% Interest to interbank accounts 15,760 13,631 -13.5% Interest on customer accounts 277,594 265,429 -4.4% Interest on corporate accounts 32,770 29,854 -8.9% Interest on municipal accounts 20,564 20,778 1.0% Interest on bonds 18,568 16,106 -13.3% Interest on subordinated loan 5,645 4,851 -14.1% Total interest expense 370,901 350,649 -5.5% Net interest income 342,681 386,586 12.8% Fees & commissions income 146,555 172,393 17.6% Fees & commissions paid 28,792 32,508 12.9% Net fees & commissions 117,763 139,885 18.8% Securities trading 10,724 -3,744 -134.9% FOREX trading 7,559 12,641 67.2% Losses on property transactions 5,686 7,168 26.1% Other 157,981 175,330 11.0% Non interest income 299,713 331,280 10.5% Interest vs. non interest income 46.7% 46.1% -1.3% Total income 642,394 717,866 11.7% Staff costs 122,945 144,133 17.2% Depreciation 45,450 50,657 11.5% Other costs 270,050 285,101 5.6% Operating costs 438,445 479,891 9.5% Cost/income ratio 68.3% 66.8% -2.2% Operating income/Profit 203,949 237,975 16.7% Provisions 35,112 36,340 3.5% Pre-tax profit 168,837 201,635 19.4% Taxes 32,428 37,824 16.6% Taxes due to consolidation -573 183 -132.0% Tax rate % 18.9% 18.8% -0.5% Net income 136,982 163,628 19.5%
6 The US Dollar amounts are solely for convenience of readers outside Hungary. The rate used for USD amounts is 281.79 HUF/USD for 2000, and 286.80 HUF/USD for 2001.

OTP Bank’s 2001 Preliminary Stock Exchange Report
20
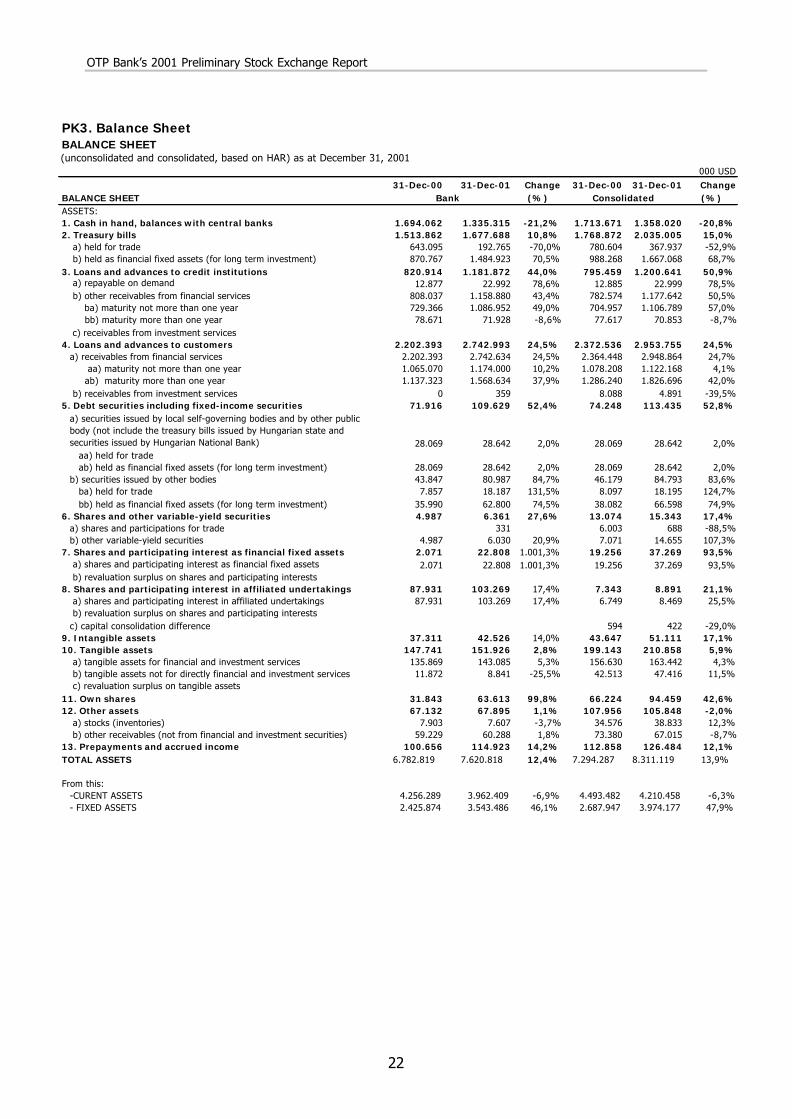
PK3. Balance SheetBALANCE SHEET(unconsolidated and consolidated, based on HAR) as at December 31, 2001
HUF million
31-Dec-00 31-Dec-01 Change 31-Dec-00 31-Dec-01 ChangeBALANCE SHEET (%) (%)ASSETS:1. Cash in hand, balances with central banks 482.350 372.593 -22,8% 487.934 378.928 -22,3%2. Treasury bills 431.042 468.125 8,6% 503.651 567.828 12,7%
a) held for trade 183.108 53.787 -70,6% 222.261 102.666 -53,8% b) held as financial fixed assets (for long term investment) 247.934 414.338 67,1% 281.390 465.162 65,3%
3. Loans and advances to credit institutions 233.739 329.778 41,1% 226.491 335.015 47,9% a) repayable on demand 3.667 6.415 74,9% 3.669 6.418 74,9% b) other receivables from financial services 230.072 323.363 40,5% 222.822 328.597 47,5%
ba) maturity not more than one year 207.672 303.293 46,0% 200.722 308.827 53,9% bb) maturity more than one year 22.400 20.070 -10,4% 22.100 19.770 -10,5%
c) receivables from investment services4. Loans and advances to customers 627.087 765.377 22,1% 675.532 824.186 22,0%
a) receivables from financial services 627.087 765.277 22,0% 673.229 822.822 22,2% aa) maturity not more than one year 303.257 327.581 8,0% 306.998 313.119 2,0%
ab) maturity more than one year 323.830 437.696 35,2% 366.231 509.703 39,2% b) receivables from investment services 0 100 2.303 1.364 -40,8%
5. Debt securities including fixed-income securities 20.476 30.590 49,4% 21.141 31.652 49,7%
a) securities issued by local self-governing bodies and by other public body (not include the treasury bills issued by Hungarian state and securities issued by Hungarian National Bank) 7.992 7.992 0,0% 7.992 7.992 0,0%
aa) held for tradeab) held as financial fixed assets (for long term investment) 7.992 7.992 0,0% 7.992 7.992 0,0%
b) securities issued by other bodies 12.484 22.598 81,0% 13.149 23.660 79,9%ba) held for trade 2.237 5.075 126,9% 2.306 5.077 120,2%bb) held as financial fixed assets (for long term investment) 10.247 17.523 71,0% 10.843 18.583 71,4%
6. Shares and other variable-yield securities 1.420 1.775 25,0% 3.722 4.281 15,0%a) shares and participations for trade 92 1.709 192 -88,8%b) other variable-yield securities 1.420 1.683 18,5% 2.013 4.089 103,1%
ba) held for trade 1.420 -100,0% 1.933 2.362 22,2% bb) held as financial fixed assets (for long term investment) 1.683 80 1.727 2.058,8%
7. Shares and participating interest as financial fixed assets 590 6.364 978,6% 5.483 10.399 89,7% a) shares and participating interest as financial fixed assets 590 6.364 978,6% 5.483 10.399 89,7% b) revaluation surplus on shares and participating interests
8. Shares and participating interest in affiliated undertakings 25.036 28.815 15,1% 2.091 2.481 18,7% a) shares and participating interest in affiliated undertakings 25.036 28.815 15,1% 1.922 2.363 22,9% b) revaluation surplus on shares and participating interestsc) capital consolidation difference 169 118 -30,2%
9. Intangible assets 10.624 11.866 11,7% 12.427 14.261 14,8%10. Tangible assets 42.066 42.392 0,8% 56.702 58.836 3,8%
a) tangible assets for financial and investment services 38.686 39.925 3,2% 44.597 45.605 2,3% b) tangible assets not for directly financial and investment services 3.380 2.467 -27,0% 12.105 13.231 9,3% c) revaluation surplus on tangible assets
11. Own shares 9.067 17.750 95,8% 18.856 26.357 39,8%12. Other assets 19.115 18.945 -0,9% 30.738 29.535 -3,9%
a) stocks (inventories) 2.251 2.123 -5,7% 9.845 10.836 10,1% b) other receivables (not from financial and investment securities) 16.864 16.822 -0,2% 20.893 18.699 -10,5%
13. Prepayments and accrued income 28.660 32.067 11,9% 32.134 35.293 9,8%TOTAL ASSETS 1.931.272 2.126.437 10,1% 2.076.902 2.319.052 11,7%
From this: -CURENT ASSETS 1.211.893 1.105.631 -8,8% 1.279.429 1.174.845 -8,2%- FIXED ASSETS 690.719 988.739 43,1% 765.339 1.108.914 44,9%
ConsolidatedBank

OTP Bank’s 2001 Preliminary Stock Exchange Report
21
HUF million31-Dec-00 31-Dec-01 Change 31-Dec-00 31-Dec-01 Change
LIABILITIES (%) (%)1. Liabilities to credit institutions 44.415 25.133 -43,4% 51.895 33.506 -35,4%
a) repayable on demand 591 2.595 339,1% 596 2.547 327,3% b) liabilities from financial services with maturity dates or periods of notice 43.824 22.538 -48,6% 51.299 30.959 -39,6%
ba) not more than one year 26.338 5.596 -78,8% 31.068 10.866 -65,0% bb) more than one year 17.486 16.942 -3,1% 20.231 20.093 -0,7%
2. Liabilities to customers 1.600.265 1.779.885 11,2% 1.667.293 1.868.592 12,1% a) saving deposits 366.672 363.961 -0,7% 366.672 363.961 -0,7%
aa) repayable on demand 41.753 42.831 2,6% 41.753 42.831 2,6% ab) maturity not more than one year 314.672 311.396 -1,0% 314.672 311.396 -1,0% ac) maturity more than one year 10.247 9.734 -5,0% 10.247 9.734 -5,0%
b) other liabilities from financial services 1.226.492 1.414.214 15,3% 1.292.146 1.502.184 16,3% ba) repayable on demand 455.678 558.470 22,6% 457.929 558.804 22,0%
bb) maturity not more than one year 760.979 847.441 11,4% 768.620 880.511 14,6% bc) maturity more than one year 9.835 8.303 -15,6% 65.597 62.869 -4,2%
c) liabilities from investment services 7.101 1.710 -75,9% 8.475 2.447 -71,1%3. Liabilities from issued debt securities 77.022 73.735 -4,3% 77.022 73.735 -4,3%
a) issued bond 1 1 0,0% 1 1 0,0% aa) maturity not more than one year ab) maturity more than one year 1 1 0,0% 1 1 0,0%
b) issued other debt securities 1.032 555 -46,2% 1.032 555 -46,2% ba) maturity not more than one year 883 538 -39,1% 883 538 -39,1% bb) maturity more than one year 149 17 -88,6% 149 17 -88,6%
c) issued debt securities according to act on accounting, but the act on securities not qualifies that certificates as securities 75.989 73.179 -3,7% 75.989 73.179 -3,7%
ca) maturity not more than one year 71.170 68.492 -3,8% 71.170 68.492 -3,8% cb) maturity more than one year 4.819 4.687 -2,7% 4.819 4.687 -2,7%
4. Other liabilities 36.861 34.998 -5,1% 45.455 44.810 -1,4% a) maturity not more than one year 36.861 34.998 -5,1% 44.522 43.848 -1,5% b) maturity more than one year 72 48 -33,3% c) (Calculated ) Corporate tax difference due to consolidation 861 914 6,2%
5. Accruals and deferred income 16.130 22.286 38,2% 20.597 28.449 38,1%6. Provisions 11.317 14.574 28,8% 53.340 69.598 30,5%
a) provisions for pensions and similar obligations b) risk provision for off-balance sheet items (for pending and future liabilities) 1.192 2.032 70,5% 1.469 2.552 73,7% c) general risk provision 8.550 10.930 27,8% 9.162 11.566 26,2% d) other provision 1.575 1.612 2,3% 42.709 55.480 29,9%
7. Subordinated liabilities 17.760 17.293 -2,6% 18.194 17.736 -2,5% a) subordinated loan capital 17.760 17.293 -2,6% 17.760 17.293 -2,6%
aa) equity consolidation difference 434 443 2,1% b) pecuniary contribution of members at credit institutions operating as credit cooperatives c) other subordinated liabilities
8. Subscribed capital 28.000 28.000 0,0% 28.000 28.000 0,0% From this: repurchased own shares at face value 813 1.542 89,7% 1.568 2.217 41,4%
9. Subscribed but unpaid capital (-)10. Capital reserves 52 52 0,0% 52 52 0,0%
a) premium (from share issue) b) other 52 52 0,0% 52 52 0,0%
11. General reserves 25.610 29.451 15,0% 25.610 29.451 15,0%12. Retained earnings (accumulated profit reserve) (+) 40.790 55.981 37,2% 42.076 57.421 36,5%13. Legal reserves 9.067 17.750 95,8% 9.067 17.750 95,8%14. Revaluation reserve15. Profit or loss for the financial year according to the balance sheet (+) 23.983 27.299 13,8% 29.888 35.696 19,4%16. Subsidiaries' equity increases/decreases (+-) 5.309 * 11.189 ** 110,8%17. Increases/decreases due to consolidation (+-) 3.104 3.067 -1,2%
- from debt consolidation difference 5.653 4.754 -15,9% - from intermediate result difference -2.549 -1.687 -33,8%
18. Participation of outside members (other owners)19 .Difference from exchange rateTOTAL LIABILITIES 1.931.272 2.126.437 10,1% 2.076.902 2.319.052 11,7%From this:
- SHORT-TERM LIABILITIES 1.716.026 1.874.067 9,2% 1.740.549 1.923.194 10,5%- LONG-TERM LIABILITIES 60.297 56.977 -5,5% 119.310 115.185 -3,5%- EQUITY (CAPITAL AND RESERVES) 127.502 158.533 24,3% 143.106 182.626 27,6%
* Book value of shares owned by subsidiaries 9.789 8.607
Bank Consolidated
OTP Bank’s 2001 Preliminary Stock Exchange Report
22
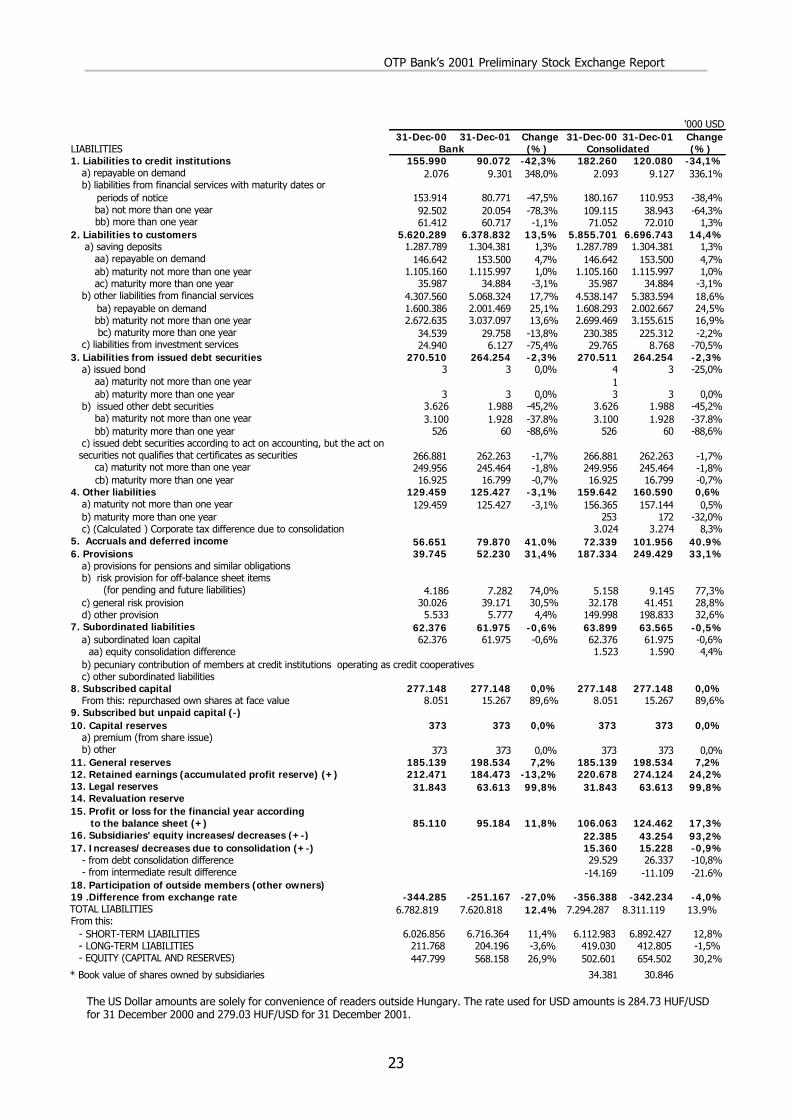
PK3. Balance SheetBALANCE SHEET(unconsolidated and consolidated, based on HAR) as at December 31, 2001
000 USD
31-Dec-00 31-Dec-01 Change 31-Dec-00 31-Dec-01 ChangeBALANCE SHEET (%) (%)ASSETS:1. Cash in hand, balances with central banks 1.694.062 1.335.315 -21,2% 1.713.671 1.358.020 -20,8%2. Treasury bills 1.513.862 1.677.688 10,8% 1.768.872 2.035.005 15,0%
a) held for trade 643.095 192.765 -70,0% 780.604 367.937 -52,9% b) held as financial fixed assets (for long term investment) 870.767 1.484.923 70,5% 988.268 1.667.068 68,7%
3. Loans and advances to credit institutions 820.914 1.181.872 44,0% 795.459 1.200.641 50,9% a) repayable on demand 12.877 22.992 78,6% 12.885 22.999 78,5% b) other receivables from financial services 808.037 1.158.880 43,4% 782.574 1.177.642 50,5%
ba) maturity not more than one year 729.366 1.086.952 49,0% 704.957 1.106.789 57,0% bb) maturity more than one year 78.671 71.928 -8,6% 77.617 70.853 -8,7%
c) receivables from investment services4. Loans and advances to customers 2.202.393 2.742.993 24,5% 2.372.536 2.953.755 24,5%
a) receivables from financial services 2.202.393 2.742.634 24,5% 2.364.448 2.948.864 24,7% aa) maturity not more than one year 1.065.070 1.174.000 10,2% 1.078.208 1.122.168 4,1%
ab) maturity more than one year 1.137.323 1.568.634 37,9% 1.286.240 1.826.696 42,0% b) receivables from investment services 0 359 8.088 4.891 -39,5%
5. Debt securities including fixed-income securities 71.916 109.629 52,4% 74.248 113.435 52,8%a) securities issued by local self-governing bodies and by other public body (not include the treasury bills issued by Hungarian state and securities issued by Hungarian National Bank) 28.069 28.642 2,0% 28.069 28.642 2,0%
aa) held for tradeab) held as financial fixed assets (for long term investment) 28.069 28.642 2,0% 28.069 28.642 2,0%
b) securities issued by other bodies 43.847 80.987 84,7% 46.179 84.793 83,6%ba) held for trade 7.857 18.187 131,5% 8.097 18.195 124,7%bb) held as financial fixed assets (for long term investment) 35.990 62.800 74,5% 38.082 66.598 74,9%
6. Shares and other variable-yield securities 4.987 6.361 27,6% 13.074 15.343 17,4%a) shares and participations for trade 331 6.003 688 -88,5%b) other variable-yield securities 4.987 6.030 20,9% 7.071 14.655 107,3%
7. Shares and participating interest as financial fixed assets 2.071 22.808 1.001,3% 19.256 37.269 93,5% a) shares and participating interest as financial fixed assets 2.071 22.808 1.001,3% 19.256 37.269 93,5% b) revaluation surplus on shares and participating interests
8. Shares and participating interest in affiliated undertakings 87.931 103.269 17,4% 7.343 8.891 21,1% a) shares and participating interest in affiliated undertakings 87.931 103.269 17,4% 6.749 8.469 25,5% b) revaluation surplus on shares and participating interestsc) capital consolidation difference 594 422 -29,0%
9. Intangible assets 37.311 42.526 14,0% 43.647 51.111 17,1%10. Tangible assets 147.741 151.926 2,8% 199.143 210.858 5,9%
a) tangible assets for financial and investment services 135.869 143.085 5,3% 156.630 163.442 4,3% b) tangible assets not for directly financial and investment services 11.872 8.841 -25,5% 42.513 47.416 11,5% c) revaluation surplus on tangible assets
11. Own shares 31.843 63.613 99,8% 66.224 94.459 42,6%12. Other assets 67.132 67.895 1,1% 107.956 105.848 -2,0%
a) stocks (inventories) 7.903 7.607 -3,7% 34.576 38.833 12,3% b) other receivables (not from financial and investment securities) 59.229 60.288 1,8% 73.380 67.015 -8,7%
13. Prepayments and accrued income 100.656 114.923 14,2% 112.858 126.484 12,1%TOTAL ASSETS 6.782.819 7.620.818 12,4% 7.294.287 8.311.119 13,9%
From this: -CURENT ASSETS 4.256.289 3.962.409 -6,9% 4.493.482 4.210.458 -6,3%- FIXED ASSETS 2.425.874 3.543.486 46,1% 2.687.947 3.974.177 47,9%
ConsolidatedBank
OTP Bank’s 2001 Preliminary Stock Exchange Report
23
'000 USD31-Dec-00 31-Dec-01 Change 31-Dec-00 31-Dec-01 Change
LIABILITIES (%) (%)1. Liabilities to credit institutions 155.990 90.072 -42,3% 182.260 120.080 -34,1%
a) repayable on demand 2.076 9.301 348,0% 2.093 9.127 336,1% b) liabilities from financial services with maturity dates or periods of notice 153.914 80.771 -47,5% 180.167 110.953 -38,4%
ba) not more than one year 92.502 20.054 -78,3% 109.115 38.943 -64,3% bb) more than one year 61.412 60.717 -1,1% 71.052 72.010 1,3%
2. Liabilities to customers 5.620.289 6.378.832 13,5% 5.855.701 6.696.743 14,4% a) saving deposits 1.287.789 1.304.381 1,3% 1.287.789 1.304.381 1,3%
aa) repayable on demand 146.642 153.500 4,7% 146.642 153.500 4,7% ab) maturity not more than one year 1.105.160 1.115.997 1,0% 1.105.160 1.115.997 1,0% ac) maturity more than one year 35.987 34.884 -3,1% 35.987 34.884 -3,1%
b) other liabilities from financial services 4.307.560 5.068.324 17,7% 4.538.147 5.383.594 18,6% ba) repayable on demand 1.600.386 2.001.469 25,1% 1.608.293 2.002.667 24,5%
bb) maturity not more than one year 2.672.635 3.037.097 13,6% 2.699.469 3.155.615 16,9% bc) maturity more than one year 34.539 29.758 -13,8% 230.385 225.312 -2,2%
c) liabilities from investment services 24.940 6.127 -75,4% 29.765 8.768 -70,5%3. Liabilities from issued debt securities 270.510 264.254 -2,3% 270.511 264.254 -2,3%
a) issued bond 3 3 0,0% 4 3 -25,0% aa) maturity not more than one year 1 ab) maturity more than one year 3 3 0,0% 3 3 0,0%
b) issued other debt securities 3.626 1.988 -45,2% 3.626 1.988 -45,2% ba) maturity not more than one year 3.100 1.928 -37,8% 3.100 1.928 -37,8% bb) maturity more than one year 526 60 -88,6% 526 60 -88,6%
c) issued debt securities according to act on accounting, but the act on securities not qualifies that certificates as securities 266.881 262.263 -1,7% 266.881 262.263 -1,7%
ca) maturity not more than one year 249.956 245.464 -1,8% 249.956 245.464 -1,8% cb) maturity more than one year 16.925 16.799 -0,7% 16.925 16.799 -0,7%
4. Other liabilities 129.459 125.427 -3,1% 159.642 160.590 0,6% a) maturity not more than one year 129.459 125.427 -3,1% 156.365 157.144 0,5% b) maturity more than one year 253 172 -32,0% c) (Calculated ) Corporate tax difference due to consolidation 3.024 3.274 8,3%
5. Accruals and deferred income 56.651 79.870 41,0% 72.339 101.956 40,9%6. Provisions 39.745 52.230 31,4% 187.334 249.429 33,1%
a) provisions for pensions and similar obligations b) risk provision for off-balance sheet items (for pending and future liabilities) 4.186 7.282 74,0% 5.158 9.145 77,3% c) general risk provision 30.026 39.171 30,5% 32.178 41.451 28,8% d) other provision 5.533 5.777 4,4% 149.998 198.833 32,6%
7. Subordinated liabilities 62.376 61.975 -0,6% 63.899 63.565 -0,5% a) subordinated loan capital 62.376 61.975 -0,6% 62.376 61.975 -0,6%
aa) equity consolidation difference 1.523 1.590 4,4%
c) other subordinated liabilities8. Subscribed capital 277.148 277.148 0,0% 277.148 277.148 0,0%
From this: repurchased own shares at face value 8.051 15.267 89,6% 8.051 15.267 89,6%9. Subscribed but unpaid capital (-)10. Capital reserves 373 373 0,0% 373 373 0,0%
a) premium (from share issue) b) other 373 373 0,0% 373 373 0,0%
11. General reserves 185.139 198.534 7,2% 185.139 198.534 7,2%12. Retained earnings (accumulated profit reserve) (+) 212.471 184.473 -13,2% 220.678 274.124 24,2%13. Legal reserves 31.843 63.613 99,8% 31.843 63.613 99,8%14. Revaluation reserve15. Profit or loss for the financial year according to the balance sheet (+) 85.110 95.184 11,8% 106.063 124.462 17,3%16. Subsidiaries' equity increases/decreases (+-) 22.385 43.254 93,2%17. Increases/decreases due to consolidation (+-) 15.360 15.228 -0,9%
- from debt consolidation difference 29.529 26.337 -10,8% - from intermediate result difference -14.169 -11.109 -21,6%
18. Participation of outside members (other owners)19 .Difference from exchange rate -344.285 -251.167 -27,0% -356.388 -342.234 -4,0%TOTAL LIABILITIES 6.782.819 7.620.818 12,4% 7.294.287 8.311.119 13,9%From this:
- SHORT-TERM LIABILITIES 6.026.856 6.716.364 11,4% 6.112.983 6.892.427 12,8%- LONG-TERM LIABILITIES 211.768 204.196 -3,6% 419.030 412.805 -1,5%- EQUITY (CAPITAL AND RESERVES) 447.799 568.158 26,9% 502.601 654.502 30,2%
* Book value of shares owned by subsidiaries 34.381 30.846
Bank Consolidated
b) pecuniary contribution of members at credit institutions operating as credit cooperatives
The US Dollar amounts are solely for convenience of readers outside Hungary. The rate used for USD amounts is 284.73 HUF/USD for 31 December 2000 and 279.03 HUF/USD for 31 December 2001.

OTP Bank’s 2001 Preliminary Stock Exchange Report
24
HUF million31-Dec-00 31-Dec-01 Change 31-Dec-00 31-Dec-01 Change
(%) (%)1. Interest received and interest-type income 187.099 193.801 3,6% 201.080 211.439 5,2%
a) interest received on securities with fixed-interest signifying a creditor relationship 41.736 50.188 20,3% 45.461 54.839 20,6%b) other interest received and interest-type income 145.363 143.613 -1,2% 155.619 156.600 0,6%
2. Interest paid and interest-type expenses 100.246 95.451 -4,8% 104.516 100.566 -3,8%Interest difference (1-2) 86.853 98.350 13,2% 96.564 110.873 14,8%
3. Incomes from securities 160 127 -20,6% 427 504 18,0%4. Fees and Commission received 37.722 45.692 21,1% 37.742 44.357 17,5%
a) revenues from other financial services 33.826 41.441 22,5% 33.866 41.153 21,5%b) revenues from investment services (except incomes from trading activities) 3.896 4.251 9,1% 3.876 3.204 -17,3%
5. Fees and Commission paid 6.172 6.418 4,0% 6.554 7.654 16,8%a) expenses on other financial services 6.164 6.189 0,4% 6.070 7.236 19,2%b) expenses on investment services (except expenses from trading activities) 8 229 2.762,5% 484 418 -13,6%
6. Profit or loss from financial transactions (6/a-6/b+6/c-6/d) 2.167 -5.554 -356,3% 2.538 -1.956 -177,1%a) revenues from other financial services 8.252 26.897 225,9% 8.791 28.373 222,8%b) expenses on other financial services 8.522 29.778 249,4% 9.296 28.138 202,7%c) revenues from investment services (revenues from trading activities) 7.273 3.733 -48,7% 10.497 4.779 -54,5%b) expenses on investment services (expenses from trading activities) 4.836 6.406 32,5% 7.454 6.970 -6,5%
7. Other incomes from business 16.027 15.762 -1,7% 93.270 110.420 18,4%a) incomes from non financial and investment services 4.407 4.919 11,6% 81.716 99.036 21,2%
a1) income of consolidated investment service providers 29.376 36.705 24,9%a2) income of consolidated insurance companies 39.701 43.772 10,3%a3) income of other consolidated companies 12.639 18.559 46,8%
b) other revenues 11.620 10.843 -6,7% 11.359 10.775 -5,1%Including: -reversal of write-off of inventory 52 16 -69,2% 52 16 -69,2%
b1) income of consolidated investment service providers 9.622 9.523 -1,0%b2) income of consolidated insurance companies 399 149 -62,7%b3) income of other consolidated companies 1.338 1.103 -17,6%
ba) consolidation difference income due to debtor consolidation bb) other income due to consolidation 195 609 212,3%
8. General administration expenses 50.611 60.057 18,7% 54.307 63.788 17,5%a) personnel expenses 27.066 32.551 20,3% 29.699 35.177 18,4%b) other administration expenses 23.545 27.506 16,8% 24.608 28.611 16,3%
9. Depreciation and amortization 10.371 11.128 7,3% 10.891 11.576 6,3%10. Other expenses from business 37.048 33.681 -9,1% 103.571 121.927 17,7%
a) expenses from non-financial and investment services 6.603 3.951 -40,2% 62.133 68.903 10,9%a1) expense of consolidated investment service providers 31.642 36.162 14,3%a2) expense of consolidated insurance companies 30.362 32.407 6,7%a3) expense of other consolidated companies 129 334 158,9%
b) other expenses 30.445 29.730 -2,3% 23.642 29.612 25,3%Including: -write-off of inventory 7 65 15 -76,9%
b1) expense of consolidated investment service providers 21.748 27.910 28,3%b2) expense of consolidated insurance companies 322 280 -13,0%b3) expense of other consolidated companies 1.572 1.422 -9,5%
ba) consolidation difference expense due to debtor consolidation 2 9 350,0%bb) other expense due to consolidation 252 86 -65,9%
c) expense of consolidated investment service providers 17.542 23.317 32,9%c1) expense of consolidated insurance companies 8.402 9.478 12,8%c2) expense of other consolidated companies 9.140 13.839 51,4%
11. Write-off of loans and provision for contingent and future liabilities 7.807 13.752 76,1% 10.509 17.159 63,3%a) write-off of loans 8.854 12.455 40,7% 11.142 15.514 39,2%b) provision for contingent and future liabilities -1.047 1.297 -223,9% -633 1.645 -359,9%
12. Reversal of write-off of loans and credit for contingent and future liabilities 10.159 14.468 42,4% 4.370 15.107 245,7%a) reversal of write-off of loans 10.159 14.016 38,0% 4.366 14.550 233,3%b) credit for contingent and future liabilities 452 4 557 13.825,0%
13.Write-off of securities for investing purposes, signifying a creditor relationship, equity investments in associated or other company 1.475 273 -81,5% 1.842 231 -87,5%
14.Reversal of write-off of securities for investing purposes, signifying a creditor relationship, and equity investments in associated or other company 681 4.097 501,6% 681 1.580 132,0%
15. Result of ordinary business activities 40.285 47.633 18,2% 47.918 58.550 22,2%Including: -RESULT OF FINANCIAL AND INVESTMENT SERVICES 42.481 46.665 9,8% 46.034 52.184 13,4% - RESULT OF NON-FINANCIAL AND INVESTMENT SERVICES -2.196 968 -144,1% 1.884 6.366 237,9%
16. Extraordinary revenues 6 212 3.433,3% 20 213 965,0%17. Extraordinary expenses 75 434 478,7% 361 934 158,7%18. Extraordinary profit or loss (16-17) -69 -222 221,7% -341 -721 111,4%19. Profit or loss before tax (±15±18) 40.216 47.411 17,9% 47.577 57.829 21,5%20. Tax liabilities 7.733 8.995 16,3% 9.138 10.848 18,7%
Tax difference due to consolidation -161 53 -132,9%21. After-tax profit or loss (±19-20) 32.483 38.416 18,3% 38.600 46.928 21,6%22. Formation and utilization of general reserves (±) -3.248 -3.841 18,3% -3.461 -4.142 19,7%23. Use of accumulated profit reserve for dividends and profit-sharings24. Dividends and profit-sharings paid (approved) 5.252 7.276 38,5% 5.252 7.090 35,0%25. Balance-sheet profit or loss figure (±21±22+23-24) 23.983 27.299 13,8% 29.887 35.696 19,4%
PK4. Profit and Loss StatementPROFIT AND LOSS ACCOUNT(unconsolidated and consolidated, based on HAR) for the year ended 31 December 2001
Bank Consolidated

OTP Bank’s 2001 Preliminary Stock Exchange Report
25
'000 USD31-Dec-00 31-Dec-01 Change 31-Dec-00 31-Dec-01 Change
(%) (%)1. Interest received and interest-type income 663.967 675.736 1,8% 713.582 737.235 3,3%
a) interest received on securities with fixed-interest signifying a creditor relationship 148.111 174.995 18,2% 161.329 191.209 18,5%b) other interest received and interest-type income 515.856 500.741 -2,9% 552.253 546.026 -1,1%
2. Interest paid and interest-type expenses 355.748 332.815 -6,4% 370.901 350.649 -5,5%Interest difference (1-2) 308.219 342.921 11,3% 342.681 386.586 12,8%
3. Incomes from securities 569 443 -22,1% 1.516 1.756 15,8%4. Fees and Commission received 133.864 159.316 19,0% 133.935 154.663 15,5%
a) revenues from other financial services 120.040 144.494 20,4% 120.182 143.489 19,4%b) revenues from investment services (except incomes from trading activities) 13.824 14.822 7,2% 13.753 11.174 -18,8%
5. Fees and Commission paid 21.905 22.379 2,2% 23.259 26.686 14,7%a) expenses on other financial services 21.877 21.580 -1,4% 21.541 25.229 17,1%b) expenses on investment services (except expenses from trading activities) 28 799 2753,6% 1.718 1.457 -15,2%
6. Profit or loss from financial transactions (6/a-6/b+6/c-6/d) 7.693 -19.365 -351,7% 9.006 -6.819 -175,7%a) revenues from other financial services 29.285 93.783 220,2% 31.196 98.930 217,1%b) expenses on other financial services 30.241 103.826 243,3% 32.991 98.109 197,4%c) revenues from investment services (revenues from trading activities) 25.810 13.015 -49,6% 37.252 16.662 -55,3%b) expenses on investment services (expenses from trading activities) 17.161 22.337 30,2% 26.451 24.302 -8,1%
7. Other incomes from business 56.878 54.958 -3,4% 330.998 385.007 16,3%a) incomes from non financial and investment services 15.641 17.152 9,7% 289.993 345.312 19,1%
a1) income of consolidated investment service providers 104.250 127.981 22,8%a2) income of consolidated insurance companies 140.889 152.623 8,3%a3) income of other consolidated companies 44.854 64.708 44,3%
b) other revenues 41.237 37.806 -8,3% 40.311 37.571 -6,8%Including: -reversal of write-off of inventory 185 56 -69,7% 185 56 -69,7%
b1) income of consolidated investment service providers 34.147 33.205 -2,8%b2) income of consolidated insurance companies 1.415 519 -63,3%b3) income of other consolidated companies 4.749 3.847 -19,0%
ba) consolidation difference income due to debtor consolidation 1bb) other income due to consolidation 693 2.124 206,5%
8. General administration expenses 179.604 209.406 16,6% 192.721 222.413 15,4%a) personnel expenses 96.051 113.498 18,2% 105.394 122.655 16,4%b) other administration expenses 83.553 95.908 14,8% 87.327 99.758 14,2%
9. Depreciation and amortization 36.802 38.800 5,4% 38.649 40.363 4,4%10. Other expenses from business 131.476 117.439 -10,7% 367.552 425.128 15,7%
a) expenses from non-financial and investment services 23.433 13.777 -41,2% 220.497 240.249 9,0%a1) expense of consolidated investment service providers 112.290 126.090 12,3%a2) expense of consolidated insurance companies 107.747 112.994 4,9%a3) expense of other consolidated companies 460 1.165 153,3%
b) other expenses 108.043 103.662 -4,1% 83.900 103.249 23,1%Including: -write-off of inventory 25 229 52 -77,3%
b1) expense of consolidated investment service providers 77.178 97.316 26,1%b2) expense of consolidated insurance companies 1.142 976 -14,5%b3) expense of other consolidated companies 5.580 4.957 -11,2%
ba) consolidation difference expense due to debtor consolidation 8 32 300,0%bb) other expense due to consolidation 893 298 -66,6%
c) expense of consolidated investment service providers 62.254 81.300 30,6%c1) expense of consolidated insurance companies 29.818 33.048 10,8%c2) expense of other consolidated companies 32.436 48.252 48,8%
11. Write-off of loans and provision for contingent and future liabilities 27.707 47.951 73,1% 37.293 59.831 60,4%a) write-off of loans 31.422 43.429 38,2% 39.540 54.096 36,8%b) provision for contingent and future liabilities -3.715 4.522 -221,7% -2.247 5.735 -355,2%
12. Reversal of write-off of loans and credit for contingent and future liabilities 36.052 50.447 39,9% 15.507 52.674 239,7%a) reversal of write-off of loans 36.052 48.871 35,6% 15.493 50.732 227,5%b) credit for contingent and future liabilities 1.576 14 1.942 13771,4%
13. Write-off of securities for investing purposes, signifying a creditor relationship, equity investments in associated or other company 5.233 949 -81,9% 6.535 806 -87,7%
14. Reversal of write-off of securities for investing purposes, signifying a creditor relationship, and equity investments in associated or other company 2.414 14.287 491,8% 2.415 5.507 128,0%
15. Result of ordinary business activities 142.962 166.083 16,2% 170.049 204.147 20,1%Including: -RESULT OF FINANCIAL AND INVESTMENT SERVICES 150.754 162.708 7,9% 163.365 181.951 11,4% - RESULT OF NON-FINANCIAL AND INVESTMENT SERVICES -7.792 3.375 -143,3% 6.684 22.196 232,1%
16. Extraordinary revenues 21 740 3423,8% 70 743 961,4%17. Extraordinary expenses 266 1.512 468,4% 1.282 3.255 153,9%18. Extraordinary profit or loss (16-17) -245 -772 215,1% -1.212 -2.512 107,3%19. Profit or loss before tax (±15±18) 142.717 165.311 15,8% 168.837 201.635 19,4%20. Tax liabilities 27.443 31.363 14,3% 32.428 37.824 16,6%
Tax difference due to consolidation -573 183 -131,9%21. After-tax profit or loss (±19-20) 115.274 133.948 16,2% 136.982 163.628 19,5%22. Formation and utilization of general reserves (±) -11.527 -13.413 16,4% -12.282 -14.444 17,6%23. Use of accumulated profit reserve for dividends and profit-sharings24. Dividends and profit-sharings paid (approved) 18.637 25.369 36,1% 18.637 24.722 32,7%25. Balance-sheet profit or loss figure (±21±22+23-24) 85.110 95.166 11,8% 106.063 124.462 17,3%
Bank Consolidated
(unconsolidated and consolidated, based on HAR) for the year ended 31 December 2001
PK4. Profit and Loss StatementPROFIT AND LOSS ACCOUNT
The US Dollar amounts are solely for convenience of readers outside Hungary. The rate used for USD amounts is 281.79 HUF/USD for 2000, and 286.80 HUF/USD for 2001.

OTP Bank’s 2001 Preliminary Stock Exchange Report
26
RS1. Ownership structure
% shares % shares % shares % sharesDomestic institution/corporation 26.2 7,335,985 25.2 7,058,800 26.2 7,335,985 25.2 7,058,800
Foreign institution/corporation 46.1 12,910,000 45.1 12,633,600 46.1 12,910,000 45.1 12,633,600Domestic retail 14.4 4,056,124 19.3 5,406,000 14.4 4,056,124 19.3 5,406,000Foreign retail 0.1 28,000 0.1 28,000 0.1 28,000 0.1 28,000Employees, management 3.8 1,064,000 2.1 600,332 3.8 1,064,000 2.1 600,332Treasury shares 6.5 1,806,737 5.5 1,542,468 6.5 1,806,737 5.5 1,542,468State budgetary organization 0.9 239,155 0.1 39,201 0.9 239,154 0.1 39,200Suporanational development organization 2.0 560,000 2.0 560,000 2.0 560,000 2.0 560,000Other 0.5 131,600 0.5 131,600TOTAL 100.0 28,000,001 100.0 28,000,001 100.0 28,000,000 100.0 28,000,000
Full share capital Listed seriesBeginning of period End of period Beginning of period End of period
RS2. Volume (qty) of treasury shares held in the year under review
1 January 31 March 30 June 30 September 31 December Bank 813,428 1,741,393 1,806,737 1,806,737 1,542,468
Subsidiaries 754,856 754,856 754,856 714,856 674,856 In addition to providing the figures, please indicate in this section if a 100% subsidiary holds any of the Issuer’s shares.
RS3. List and description of shareholders with more than 5% (at the end of the period)
Name Nationality 4 Activity 5 Quantity Interest (%) 6 Remarks 7 --
4 Domestic (B), Foreign (K) 5 Custodian (L), Government (Á), International Development Institute (F), Institutional (I), Individual (M), Employee, senior officer (D) 6 Figure should be rounded to two decimal points 7 E.g. strategic investor, financial investor, etc.
TSZ2. Changes in headcount (persons) End of reference period Current year opening Current period closing Bank 8,229 8,137 8,293 Consolidated 10,823 11,335 11,059 TSZ3. Senior officers, strategic employees Type Name Position Beginning of
assignment End of assignment
IT dr. Csányi Sándor Chairman-CEO 1992.05.15. 2006. IT dr. Spéder Zoltán Vice Chairman, Deputy CEO 1991.08.30. 2006. IT Baumstark Mihály Board Member 2000.04.29. 2006. IT dr. Bíró Tibor Board Member 1992.05.15. 2006. IT Braun Péter Board Member, Deputy CEO 1997.04.29. 2006. IT dr. Horváth Judit Board Member tag 1991.04.05. 2006. IT dr. Kocsis István Board Member tag 1997.04.29. 2006. IT dr. Vörös József Board Member tag 1992.05.15. 2006. FB Tolnay Tibor Supervisory Board Chairman 1992.05.15. 2002. FB Gyulainé Zsakó Zsófia Supervisory Board Member 1993.05.26. 2002. FB dr. Horváth Gábor Supervisory Board Member 1995.05.19. 2002. FB dr. Nagy Gábor Supervisory Board Member 1992.05.15. 2002. FB Vécsei Klára Supervisory Board Member 1991.01.25. 2002. FB dr. Zimányi Tibor Supervisory Board Member 1992.05.15. 2002. ST Wolf László Deputy CEO - - ST Lantos Csaba Deputy CEO - - ST Pongrácz Antal Deputy CEO