Embed Size (px)
Citation preview

OSU/IPPC/NPDN/NRI - Pest Epidemiology Models,
Maps and ReportsNPDN Epidemiology Committee
Leonard Coop & Paul JepsonOregon State & Purdue University
June 07-08, 2007

Host
PathogenEnvironment
- Local- Local and regional and regional
field monitoringfield monitoring- First - First
responders responders - Plant - Plant
quarantinequarantine- Watch lists- Watch lists
- Spore trapping- PCR rapid diagnosis
- Remote sensing
NPDN database
- Modes of - Modes of transporttransport
- Aerobiology- Aerobiology- Storm reconstruction- Storm reconstruction
- Pest and disease models- Pest and disease models
The Epidemiologist's Diagnostic Toolbox
Host

Types of pest epidemiological modelsInsects/plants: - phenological/degree-day - population and dispersal - crop loss simulationPathogens: - infection risk - epidemiological and dispersal - crop loss simulationAll airborn pests - aerobiology
* most amenable to use of generic modeling approaches

Currently 52+ IPM and crop models, generic calculator linked to weather data; online since 1996 (52 wea stations)
10,500+ weather station (most hourly or better) data accessed at 15 minute intervals from NOAA + grower networks
Free access; no user fees
Open source computing technologies (LAMP (Linux/Apache/MySQL/Perl-PHP), GRASS GIS/spatial modeling, UMN MapServer/GRASSLinks web user interface
Missing max min temperature data estimated using PRISM near real-time weather interpolation
Online IPM Models - IPPC

Plant disease risk models:
Risk models generally signal periods when infection can occur, assuming inoculum is present. Like insects, plant pathogens respond to temperature in a more-or less linear fashion. Unlike insects, we can measure infection events using degree-hours rather than degree-days. In addition, many plant pathogens also require moisture at least to begin an infection cycle.

Online Models - IPPCNPDN plant disease risk models online: multiple generic risk models + 7,500+ weather stations
Model outputs shown w/input weather data for veracity
GIS user interface

Online IPM Models - IPPCDisease models online – e. g. grass seed stem rust simulator (w/Bill Pfender, USDA)
Fungicideefficacy submodel
Automatic help window
Graphs of disease and crop development
Single screen user interface
Field sample inputs

Weather and Degree-day Concepts
1)Degree-day models: accumulate a daily "heat unit index" (DD total) until some event is expected (e. g. egg hatch)
38
20
18
32
14
22
20
26
daily:
cumulative: 20
70
84
106
126
152
Eggs hatch: 152 cumulative DDs
Eggs start developing: 0 DDs
70o(avg)-50o(threshold)=20DD

DD Models map – select weather station from map (example for South Central Region – codling moth model)
Weather station selected
48-state US Degree-day mapping calculator


US Degree-day mapping calculator (cont.)
Steps used to create degree-day maps

Online IPM Models - IPPC- PRISM climate maps used for real-time degree-day modeling since 1999.- A process known as “delta correction” is used to spatialize temperature and degree-day accumulations

Example 700 degree-day event for 2006

Online IPM Models - IPPCNew - date of event phenology maps – we will test if “date” prediction maps are easier to use than “degree-day” prediction maps

Integrated GIS Platforms
Distributed Integrated Interfaced National Database, Managed locally, distributed nationally
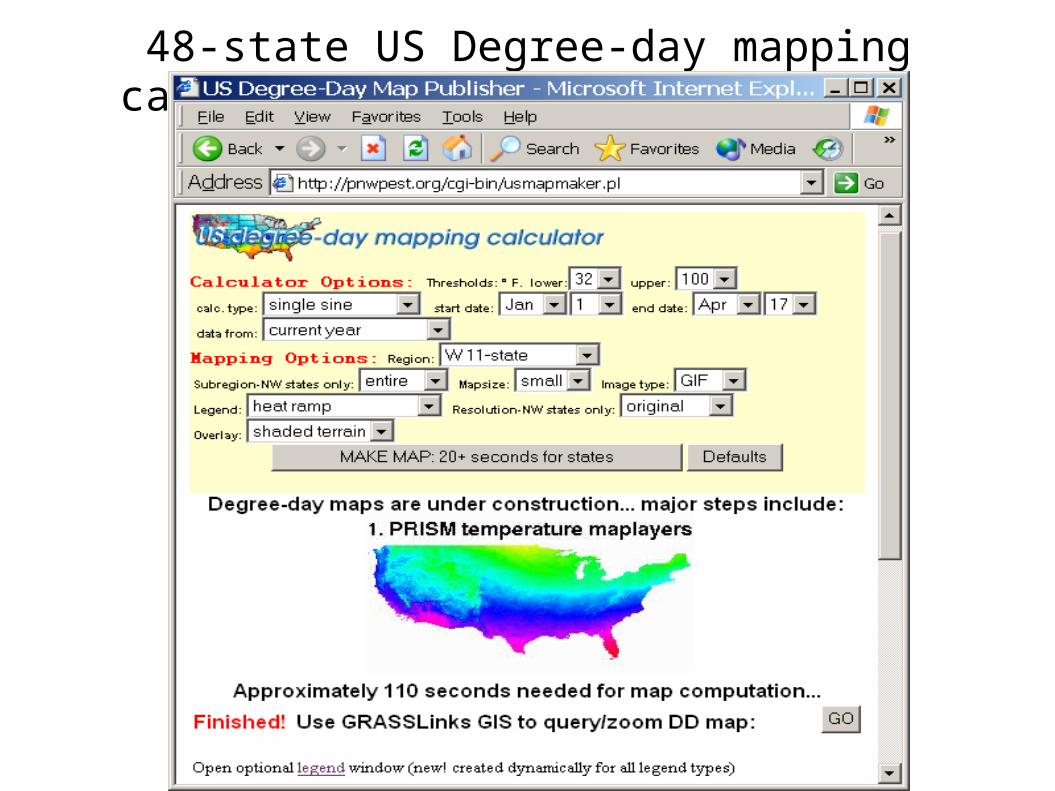
- Purdue/CERIS: national NPDN database/repository
- Multi-level authorization and security protocols
- Dynamic maps linked to reports; custom queries for any keywords
- Contact Mike Hill at Purdue Univ. if you don't yet have access

Online IPM Models - IPPCAbility to use GWR (geographically weighted regression) to downscale e. g. from medium (4km) to high (100m) resolution
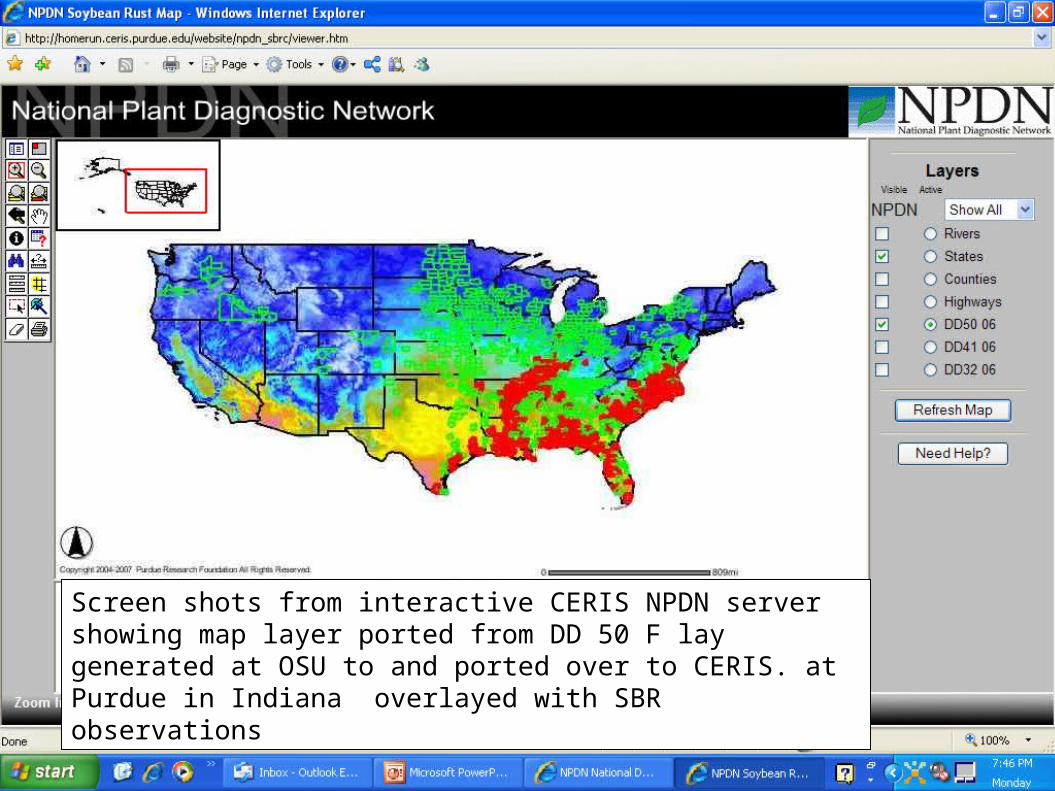
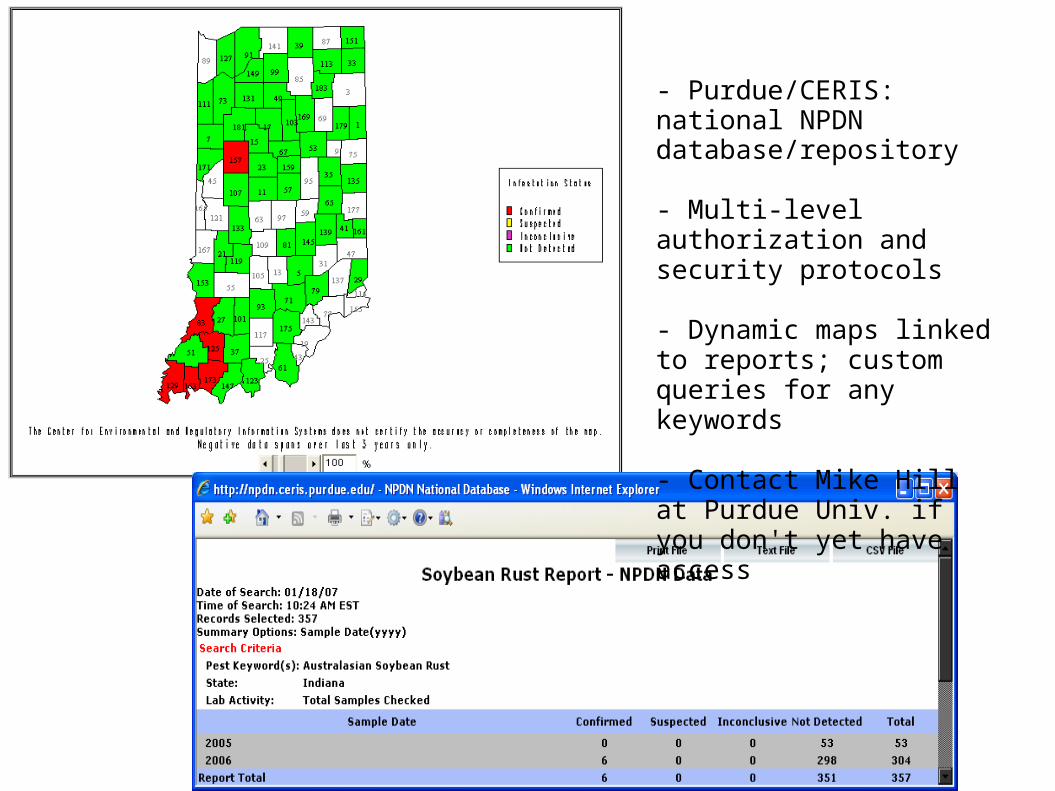
Screen shots from interactive CERIS NPDN server showing map layer ported from DD 50 F lay generated at OSU to and ported over to CERIS. at Purdue in Indiana overlayed with SBR observations

And the 41 degree day layer

And for 32 degree day layer

Online IPM Models - IPPC
Daily and custom degree-day maps and calculator access available for coterminous USA by state and region

Online Pest Models - NPDN/IPPC
Thumbnail index pages to base 32, 41, 50 maps of all regions within 48-state US
Current year-to-date
Deviations from normals year-to-date
30 year historical (normals) year-to-date

Online Pest Models - NPDN/IPPC
GIF version of daily degree-day maps

Online Pest Models - NPDN/IPPC
Updated online GIS interface –

Online Pest Models - NPDN/IPPC
Online GIS interface – new features for 2007:zoom box, layers depend on zoom level
Zoom box

Online Pest Models - NPDN/IPPC
Additional zoom layers: National highways, railroads, higher resolution topography

Online Pest Models - NPDN/IPPC
Zoom box

Online Pest Models - NPDN/IPPC
Added zoom layers: major roads, rivers, enclosed water, urban areas, 90 m topography, weather station and place name labels

Online Pest Models - NPDN/IPPC
Select site
DD calculator form
Site specific degree-days

Online Pest Models - NPDN/IPPC
Degree-day and disease risk models available from online GIS interface
Forecast weather data

IPPC phenology models used increasingly in IPM decision making since the first degree-day calculator went online in 1996. Example - tree fruit models usage in 2005 > 3,000 runs (table) Total usage for all cropping systems now over 14,000 model runs/yr
Species – tree fruit pests 1999 2000 2002 2003 2004 2005 (Oct 10)=====================================================================================codling moth [apple & pear] 83 1123 2019 2053 2428 1811western cherry fruit fly 5 120 186 187 230 213fire blight [apple & pear] 17 300 699 1115 778 560obliquebanded leafroller 15 108 557 320 271 110apple scab infection season 11 101 139 130 78 81pear scab infection season 0 0 368 343 330 268Apple maggot 1st emerge 0 0 0 0 40 72Apple maggot percent emerge 0 0 0 0 20 40
Model Runs0
2000
4000
6000
8000
10000
12000
14000
16000
Calculator/model usage per year
1999
2000
2002
2003
2004
2005 (est)

Future Online Models
Full proposed system for a multi-crop National biosecurity and IPM weather-driven pest and disease risk alert system, Western Region Weather Systems Workgroup, NRI Plant Biosecurity funding
3 & 6 hourly, 0 to 4 day NOAA weather forecast models (B1)
Real-time public and private weather networks (a)
Quality Assurance and missing data estimation using climatologically aided interpolation (CAI) and other techniques (h)
Database of modular plant disease model parameters
Real-time ground-based orographicand meteorological adjustment using spatial models, including rain and wind field (d)
Leaf wetness models (e)
Disease infection/pest models
GIS and spatial modeling to various scales (f)
Short-term (0 to 4 day) disease risk forecasts
5 to15 day 12 hourly NOAA forecasts (B2)
Targeted climatology models (g)
Spatialized 5-15 day forecasts (c)
Field validation studies for pilot pests and diseases
Long-term (5 to 30 day) disease risk forecasts
Web GIS and delivery of modeling outputs and uncertainty/errors
Plant biosecuritypest/disease risk alerts
Pest management pest/disease risk alerts

LW Comparisons 06/20/01 0000 - 06/29/01 2300 pst Blue=Estd, Red=RainDry, YLW=NRND
0
1
2
3
4
5
6
7
8
9
1 10 19 28 37 46 55 64 73 82 91 100 109 118 127 136 145 154 163 172 181 190 199 208 217 226 235
hours past 06/20/01 0000
LW
Series1
Series2
Series3
Online Models - IPPCNew modified fuzzy logic leaf wetness estimation for disease risk models – contract with Fox Weather LLC
Blue-sensor Yellow-FLLW Red-FLLW+down-slope drying+rain effects

MtnRTemps (wea. forecast model)
Mean dewpoint, temp.
+
+ =>Gridded maplayers (to 5-7 days)
of:1. Hourly leaf wetness (LW)2. Tmean for each hour of LW
period needed for input into Spatialized disease risk forecasts(w/ Fox Weather LLC)
Spatialized Disease Model Forecasts
CALMET (wind model)
PRISM (climate maps)
+
Fuzzy Logic Leaf Wetness
model(Kim et al,
Fox weather
LLC)

IPPC Weather Modeling system description
Open source computing technologies (LAMP (Linux/Apache/MySQL/Perl-PHP) web serving, GRASS GIS/spatial modeling, UMN MapServer/GRASSLinks web user interface) State-of-the-art models: climate data sets (PRISM, modified PRISM), several global dynamic forecast models (GFS, NAM, AVN), orographic/terrain modification models (CALMET, MtnRTemps, mesoscale weather models), modified Fuzzy Logic Leaf Wetness estimation model Algorithms include PRISM-based delta correction and geographically weighted regression interpolation and downscaling, hi-resolution elevation data (30 & 100 m) Developed and maintained by OSU IPPC (Integrated Plant Protection Center), which has a long history of providing free online agricultural decision support tools

The epidemiologist's investigative toolbox has potential to help detect anomalies/solve problems (when, where & how) of pest invasions. Adding environmental factors from disease triangle (for our needs) requires effort.
CERIS NPDN data and numerous pest and disease models are now available separately and together for custom queries and to explore the influence of environmental (weather related) factors on pest outbreaks.
Some pest model categories (especially degree-day and plant disease infection risk) are amenable to generic, widely applicable uses.
Expertise from different groups can be complementary and combined for most efficient use of resources.
Recent improvements to our Grasslinks web GIS interface bring more power to associate NPDN records with geophysical attributes such as land use, topography, and transportation routes.
Summary: Epidemiology maps and reports: