Embed Size (px)
Citation preview

Cruise Report cruise 64PE400
OSNAP East leg 2
July 8-29 2015
Reykjavik-Reykjavik, Iceland
R/V Pelagia
Chief Scientist: Laura de Steur (NIOZ)
1

Contents
1. Background and objectives
2. Cruise summary
3. Cruise participants
4. Mooring operations
4.1 Notes on mooring recovery/deployment method
4.2 Moorings recovered
4.3 Instrument functioning
4.4 Moorings deployed
4.5 CIS mooring survey
5. CTD stations
5.1 CTD station list
5.2 Calibration S data
5.3 Calibration O2 data
5.4 Tracer samples
5.5 Section plots
5.6 Data management
6. RAFOS floats
7. LADCP data
8. VMADP data
9. Appendix A: List of CTD stations
10. Appendix B: List of RAFOS deployments
11. Appendix C: LADCP master / slave settings
12. Appendix D: NOC CTD processing in relation to calibration dip
13. Appendix E: Designs of the NOC deployed moorings (M1, M2, M3, M4, M5)
14. Appendix F: Designs of NIOZ deployed moorings (IC0, IC1, IC2, IC3, IC4, and
LOCO2)
2

1. Background and objectives
Background
This oceanographic cruise was carried out to support oceanographic mooring operations,
hydrographic stations and float deployments within the programs North Atlantic Climate
(NACLIM) funded by the EU-FP7, and the international Overturning of the Subpolar North
Atlantic Program (OSNAP) East. The cruise was financed by the Netherlands Institute for Sea
Research (NIOZ). NACLIM aims at investigating and quantifying the predictability on interannual
to decadal time scales of the climate in the North Atlantic/European sector related to north
Atlantic/Arctic Ocean surface state (SST and sea ice) variability and change. The program finances
the continuation of many long-term mooring sites delivering time series in key areas of the north
Atlantic, amongst which the profiling mooring LOCO2 and 4 new moorings on the Reykjanes
Ridge. OSNAP is designed to provide a continuous record of the full-water column, trans-basin
fluxes of heat, mass and freshwater in the subpolar North Atlantic and is a large international effort
which started off in 2014. The OSNAP observing system consists of two main arrays: one
extending from southern Labrador to the southwestern tip of Greenland across the mouth of the
Labrador Sea (OSNAP West), and the second from the southeastern tip of Greenland to Scotland
(OSNAP East) (Figure 1). During summer 2015 two cruises were carried out with RV Pelagia in the
OSNAP East sector: leg 1 covered the Rockall Trough and the Iceland Basin, while leg 2 covered
the Irminger Sea between the Reykjanes Ridge and the SE Greenland coast. This cruise report
covers leg 2 (cruise ID 64PE400) which was carried out from July 8 to July 29 (red box in Fig. 1).
3
Figure 1: OSNAP East elements to be serviced with RV Pelagia during Cruise 64PE400 in July 2015: (G) Netherlands Western Mid-Atlantic Ridge array; (F) LOCO2 and CIS moorings; (D) UK DWBC array; (E1) US float launch sites.

Cruise objectives
During cruise 64PE400 the OSNAP East moorings, which were deployed in the Irminger
Basin in summer 2014 have been recovered, serviced and redeployed (red box in Figure 1). There
are 5 moorings in the eastern Irminger Sea in the Irminger Current (IC) maintained by NIOZ, 5
moorings in the Western Irminger Sea in the Deep Western Boundary Current (DWBC) maintained
by NOC, and one mooring (LOCO2) in the centre of the Irminger gyre (section 4) maintained by
NIOZ. The telemetry buoy from the second mooring in the central gyre (CIS, from GEOMAR) was
scheduled to be serviced, but since the telemetry buoy could not be found and was likely broken off
or submerged, this activity could not be carried out.
A total of 34 RAFOS floats were released at target depths between 1800 and 2200 m in the
eastern and western Irminger Sea as part of the US OSNAP program (section 5). The mooring work
was complemented with repeat CTD stations on the former WOCE (or current CLIVAR?) AR7E
repeat section (between roughly 59°N, 31°W and 60°N, 42.5°W) including sampling for salinity
and dissolved oxygen (O2) calibration (section 6). On the westernmost CTD stations in the East
Greenland Current samples for ∂18O and nutrients were also taken. LADCP and VMADCP data
were collected on CTD casts and on the cruise track respectively (sections 7 and 8). Because of
good weather and excellent progress an second short CTD section was carried out on the Greenland
shelf slope at approximately 64.5°N. On the Reykjanes Ridge between the IC moorings multi-beam
data was collected as well on the Greenland shelf slope.
A close collaboration between marine technicians of NIOZ, SAMS and NOC and the ship's
crew during the recoveries and redeployments of all moorings allowed for an optimized time
schedule and successful mooring operations. All mooring operations were carried out during day
time. Three CTD watches consisting of three people each were in charge of the CTD/LADCP
stations and the water sampling. They followed a schedule of 12:00-20:00, 20:00-04:00 and 04:00-
12:00. All salinity and oxygen samples for calibration of the CTD sensors were measured on board
in the salinity/oxygen container by a NIOZ analyst.
4

2. Cruise participants
# Name: Institution,
country:
Primary duties: Email address:
1 Laura de Steur NIOZ, NL Chief scientist [email protected]
2 Femke de Jong NIOZ/Duke,
NL/USA
CTD/LADCP watch
lead
3 Ryan Peabody Duke, USA RAFOS floats [email protected]
4 Marcel Bakker NIOZ, NL NIOZ moorings [email protected]
5 Jan Dirk de Visser NIOZ, NL NIOZ moorings [email protected]
6 Colin Griffiths SAMS, UK NOC moorings [email protected]
7 Neill Mackay NOC, UK NOC moorings and
CTD
8 Loic Houpert SAMS, UK NOC moorings and
CTD
9 Dave Childs NMF, UK NOC moored
instruments & CTD
10 Till Bauman GEOMAR, DE CIS mooring &
CTD/LADCP watch
11 Ruud Groenewegen NIOZ, NL CTD/LADCP watch,
CTD technician
12 Karel Bakker NIOZ, NL O2 calibration,
nutrient sampling
13 Huang Lei OUC, China CTD/LADCP watch [email protected]
14 Ellen Jochems UU, NL CTD/LADCP watch [email protected]
15 Stellios Kritsotalakis UU, NL CTD/LADCP watch [email protected]
16 Maarten Roos CurveLight-
Films, NL
Film, outreach [email protected]
5

3. Cruise summary
Thanks to an early arrival of the OSNAP East leg 1 (cruise 64PE399) in Reykjavik prior to our leg
2 (cruise 64PE400), and the fact that we were able to shift around all our gear between the two
cruises in nearly 1.5 days, made it possible for an early departure on Wednesday July 8th. The daily
activities of the cruise are summarized below. The cruise speed of RV Pelagia was generally ~9 kn.
Date Activity
Tues 7/7/2015 Full day of loading and putting gear in place.
08/07/15 Everyone embarks RV Pelagia at 9 am. Departure at 1 pm from Reykjavik. Transit to
mooring site IC4 for roughly 40 hours. Science briefing for everyone on board at 7 pm.
Good weather but quite windy, which is slightly tough for some participants.
Thur 9/7/2015 Transit to mooring site IC4. Setting up equipment and labs. Demonstration of
CTD/LADCP and water sampling procedures to CTD watches. Still windy and wavy.
Fri 10/07/2015 Recovery of NIOZ moorings IC4 (morning), IC3 (afternoon), and IC2 (evening). All
moorings on deck within 1.5 to 2 hours. All look good. One recurring problem was that
the SBE37 Microcats on the top 400 m dynema wire had slid down (from ~45 m to 180
m) after a couple of weeks because the tape did not hold properly. Disappointing to not
obtain proper temperature measurements high in the water column this year. This is
solved by adding 1 m of cable there during the redeployment to attach the SBE37s to.
Sat 11/07/2015 Recovery of NIOZ moorings IC1(morning) and IC0 (afternoon).
Start of the CTD/LADCP section on the Reykjanes Ridge at 8 pm. First CTD taken at
IC0. Second CTD is also the SBE37 Microcat calibration CTD dip and is done on the
deepest CTD cast (7 nm NW of IC0) which is the westernmost station on the high-
resolution Reykjanes Ridge section. After that we work our way eastward. Some RAFOS
float deployments overnight on locations over 1800 and 2200 m depths. Some wind and
waves.
Sun 12/07/2015 Continue the CTD/LADCP section Reykjanes Ridge (stations ~7 nm apart). Salt samples
are taken on every cast, while O2 samples are taken on every other cast. Weather is
improving.
Mon 13/7/2015 Continue CTD/LADCP section Reykjanes Ridge. Some problems encountered with
LACDP (particularly the slave which is from NIOZ, the master head from NOC is
working well). Battery died, was replaced, but the battery case was not tightened properly
(a loose end of a zip tie came in between the case and the lid) so that it flooded. Roald and
Ruud fixed it very fast. These 'lost' LADCP stations will be repeated during the night
between the mooring deployments to obtain good LADCP data there.
6

Tues 14/7/2015 IC4 got deployed at 10.22 am. A repeat station for LADCP data on the IC3 site was
carried out after lunch after which IC3 was deployed. All went well. On both sites the
approach to the target site was from the SSE and time for set up was taken to be 2 hours.
This was plenty of time since the mooring was ready in ~ 1.25 to 1.5 hours. On IC4 we
continued 250 m past the target site, and on IC3 we continued 300 m past the target site
before anchor drop.
Wed 15/7/2015 Another successful day with two tall moorings deployments in the Irminger current on the
Reykjanes Ridge (IC1 & IC2). Stable (gray) weather gives us very workable conditions.
For IC2 and IC1 an approach of 2.5 nm was used and we dropped the anchor at 400 and
500 m past the target position respectively. IC0 was deployed after dinner such that by
21.30 all moorings in the eastern Irminger Basin were done! Time for a little celebration...
Thur 16/7/2015 Just 3 CTDs today, but all deep, wider station spacing and all with a lot of bottles as we
take our time to sail across the central basin towards M5 (NOC) which is planned to be
recovered the next day.
Fri 17/7/2015 Recovery of M5 and M4 of NOC. Calm weather still though slightly more winds, and
colder. Successful recoveries but with slight tangles. All on board by 4.30 pm followed by
a calibration CTD cast near M4. 5 RAFOS float deployments during afternoon and
evening.
Sat 18/7/2015 We search for the top telemetry buoy from the CIS mooring between 6 am and 1 pm. No
sign of the telemetry buoy. Visibility was excellent and wave height was small. It is likely
lost. The mooring is still there as we ranged on the releases and triangulation led to the
same (± 30m) position as the given anchor site. The CIS mooring site is abandoned after 1
pm and we head to LOCO2 for recovery. LOCO2 recovered at 5.30 pm. MMP has worked
very well, as have the Microcats and ADCPs. Directly after recovery of LOCO2 a CTD
cast is taken with the two Microcats put on it for calibration. Overnight we go back to the
CIS site (5 km distance) and do a CTD there.
Sun 19/7/2015 Start the day with another CTD cast at LOCO2 site (now with the optode on it too for
calibration). Work on deck continues to prep for the deployment of LOCO2. After lunch
all instruments are serviced and ready to be deployed again. LOCO2 is deployed by 5 pm
and the mooring releases are ranged at 3 positions. Final anchor is approx. 470 m from
anchor drop which is what was aimed for.
One CTD is done at night between M4 and M5.
Mon 20/7/2015 Deployments of NOC moorings M5 (morning) and M4 (afternoon). Done by 6 pm (both
positions are ranged). After an initial sunny day the fog picks up and visibility is poor.
However, Maarten still gets to go out in the MOB with Len and Fred to film the last bit of
the deployment of M4. After that we steam to CTD station 31 which is midway between
M4 and M3. CTD done after midnight. Steaming to M3.
Tues 21/7/2015 Today we start with recovering M3 from NOC. Perfect weather, excellent visibility,
7

slightly more wind. Released at 08:05, on deck by 10:10 am. After lunch time we continue
with M2 for recovery. Released at 12:30, on deck by 14:30. Instrumentation is being read
out and Microcats are prepared to go on the CTD for a calibration dip on the M2 site.
Overnight: steam eastward again for 5 RAFOS float deployments.
Wed 22/7/2015 Another nice sunny day and calm seas. The day starts with a CTD cast near M3 after
which we deploy M3 again. In the afternoon we deploy M2. All NOC moorings are
ranged. After that several RAFOS float deployments. No CTDs overnight since the deck
team had been up all day and longer. After 8 pm Greenland is in sight, even though still
60 nm away. Very good visibility, and sharp mountain coastline. Hope for continued good
visibility tomorrow.
Thur 23/7/2015 Still good weather though slightly more wind, and more clouds. Greenland is not visible
anymore. M1 is released ~07:55 and is on deck by 10:15am. Mooring and instruments are
all in good shape. Smooth work and smooth sailing. CTD section with ~ 4 nm distance
between stations is continued around noon including one calibration CTD dip for the NOC
instruments. We plan to CTD throughout the night and continue west into Friday morning
onto the shelf. Keeping our distance from the WHOI moorings with ~ 4.5 km. A chart of
SE Greenland is found on the bridge. We'll see how far we can get....
Fri 24/7/2015 At 7 am we reached the marginal ice zone... at a bathymetric contour of 1600 m ..
Steaming slowly westward, take one more CTD at ~ 1000 m, after which we reach a band
of ice with too tightly packed for RV Pelagia to go through ~ at 59°56'N, 42°10'W.
Steaming somewhat north and south to see if we can find a way through. Perhaps we need
to stop though. Very calm weather and good visibility though cloudy with several layers
of very low clouds on the coast. No visibility of Greenland at 30 nm from coast. Too
much ice to continue, last CTD station at ~ 480 m on the shelf, just a bit south off the line.
We stop the CTD attempts at noon and return to M1 to deploy it late afternoon. Start
deployment at roughly 16:20, anchor drop is at 18:50 targeting a water depth of 2085 and
taking a fall back of 200 m in account. The anchor position is ranged. As of 7 pm: end of
cruise BBQ!
Sat 25/7/2015 Since we have done all the mandatory work on the mooring and CTD line (and more) and
still have time left we head north to do another short CTD section across the Irminger
Current and East Greenland Current across the Greenland shelf break at roughly 64°N
where Dense Shelf water has been found to cascade down the slope. Arrival should be
between 6 to 8 am on Sunday.
Sun 26/5/2015 We arrive at the extra CTD section planned across the IC/EGC at ~ 64°N 35°W at 6.30
am. We take 8 to 10 stations across the shelf break between 400 m and 2450 m depth. The
shelf is very wide here and warm and salty water is found on the eastern part of the shelf;
the EGC appears very far west away from the IC. As there is no time to sample the whole
shelf up to the coast, we return SE to at 14:15 pm to pick up at CTD section at 1800 m and
8

continue eastward with a last CTD at 2440 m depth until ~ 4 am Monday.
Mon 27/7/2015 CTD line was finished early am. The last CTD/LADCP data is being processed, last
salinity and O2 samples analysed and people start cleaning and packing. The day will
consist of taking a group photo, sharing and organizing data and text files and compiling
the cruise report. Short end-of-cruise seminar at 7 pm about "What have we learned?"
Tues 28/7/2015 Iceland in sight already at breakfast. Steaming into port in the afternoon. Arrival in REY
around 17:00.
Wed 29/7/2015 Packing, cleaning and some (WHOI, RSMAS) gear that needs to be shipped is delivered
to agent. Some people depart today and most on Thursday.
9
Figure 2: Cruise stations carried out during cruise 64PE400: NIOZ IC moorings IC0-IC4 (black diamonds),NOC DBWC moorings M1-M5 (green diamonds), the NIOZ LOCO2 profiling mooring and the GEOMAR CIS (telemetry) mooring (magenta diamonds), and CTD stations (red dots). The RAFOS float sites were mainly located between M1 - M4, and IC2 - IC0 (see table 2, and Fig. 6.1).
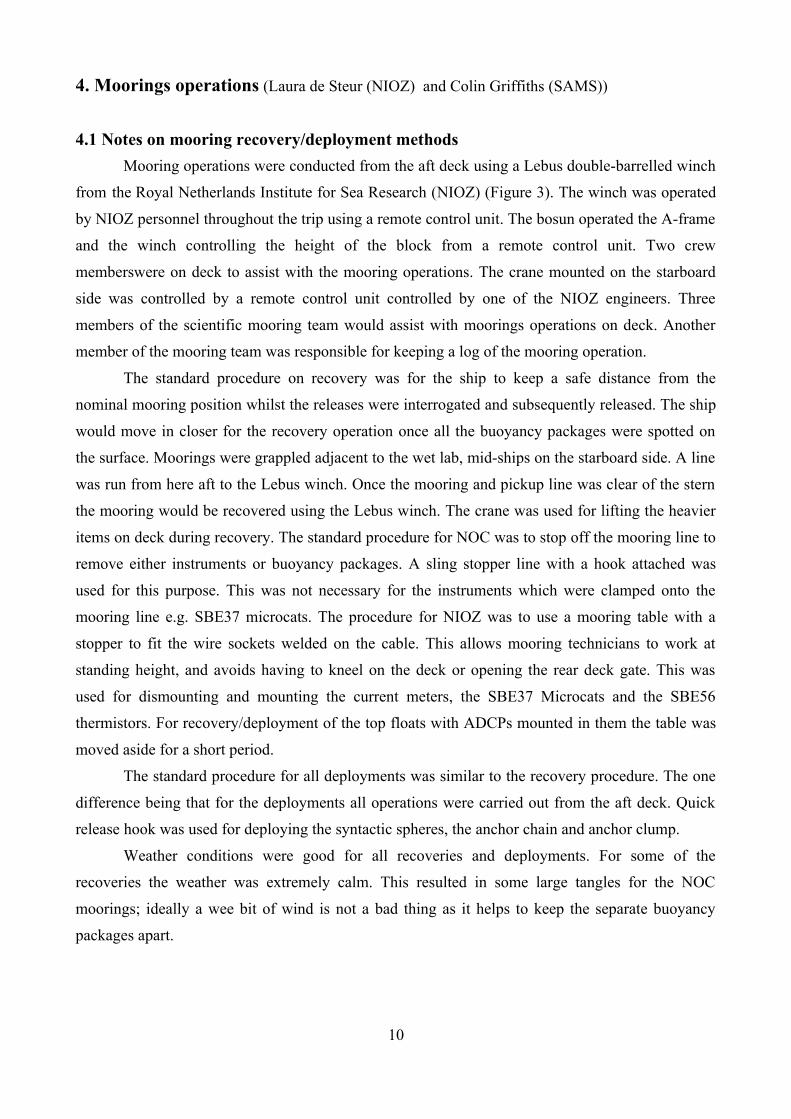
4. Moorings operations (Laura de Steur (NIOZ) and Colin Griffiths (SAMS))
4.1 Notes on mooring recovery/deployment methods
Mooring operations were conducted from the aft deck using a Lebus double-barrelled winch
from the Royal Netherlands Institute for Sea Research (NIOZ) (Figure 3). The winch was operated
by NIOZ personnel throughout the trip using a remote control unit. The bosun operated the A-frame
and the winch controlling the height of the block from a remote control unit. Two crew
memberswere on deck to assist with the mooring operations. The crane mounted on the starboard
side was controlled by a remote control unit controlled by one of the NIOZ engineers. Three
members of the scientific mooring team would assist with moorings operations on deck. Another
member of the mooring team was responsible for keeping a log of the mooring operation.
The standard procedure on recovery was for the ship to keep a safe distance from the
nominal mooring position whilst the releases were interrogated and subsequently released. The ship
would move in closer for the recovery operation once all the buoyancy packages were spotted on
the surface. Moorings were grappled adjacent to the wet lab, mid-ships on the starboard side. A line
was run from here aft to the Lebus winch. Once the mooring and pickup line was clear of the stern
the mooring would be recovered using the Lebus winch. The crane was used for lifting the heavier
items on deck during recovery. The standard procedure for NOC was to stop off the mooring line to
remove either instruments or buoyancy packages. A sling stopper line with a hook attached was
used for this purpose. This was not necessary for the instruments which were clamped onto the
mooring line e.g. SBE37 microcats. The procedure for NIOZ was to use a mooring table with a
stopper to fit the wire sockets welded on the cable. This allows mooring technicians to work at
standing height, and avoids having to kneel on the deck or opening the rear deck gate. This was
used for dismounting and mounting the current meters, the SBE37 Microcats and the SBE56
thermistors. For recovery/deployment of the top floats with ADCPs mounted in them the table was
moved aside for a short period.
The standard procedure for all deployments was similar to the recovery procedure. The one
difference being that for the deployments all operations were carried out from the aft deck. Quick
release hook was used for deploying the syntactic spheres, the anchor chain and anchor clump.
Weather conditions were good for all recoveries and deployments. For some of the
recoveries the weather was extremely calm. This resulted in some large tangles for the NOC
moorings; ideally a wee bit of wind is not a bad thing as it helps to keep the separate buoyancy
packages apart.
10

Figure 3: a) The NIOZ LEBUS Double Barrel Winch, b) the spooling winch used with the DB winch.Photo's: Colin Griffiths.
4.2 Moorings recovered
The four Dutch moorings IC4-IC4 in the Irminger Current (IC) on the Reykjanes Ridge, and IC0 a
short - jointly Dutch/US funded - mooring at the bottom of the Reykjanes Ridge were recovered in
good order. The locations were chosen such to capture the main branch(es) of the IC (IC1-IC4) as
well as the deep boundary current potentially carrying ISOW (IC0). The moorings were initially
scheduled to be 5 km NE of the AR7E line, however due to the difficulties of finding a 'good flat
spot' for them on the highly variable ridge bathymetry (using multi-beam) IC0 and IC1 almost
ended up almost back onto AR7E. The deployment date and time and the final positions/depths of
the moorings are given in Table 1.
Name Recovery date
and time
Latitude
(degree minutes)
Longitude
(degree minutes)
Target depth
IC0-1 11/07/2015 59° 12.88'N 35° 07.55'W 2938 m
IC1-1 11/07/2015 59° 05.93'N 33° 40.93'W 2509 m
IC2-1 10/07/2015 59° 01.23'N 32° 46.05'W 1978 m
IC3-1 10/07/2015 58° 57.33'N 31° 57.54'W 1635 m
11
IC4-1 10/07/2015 58° 53.12'N 31° 18.18'W 1477 m
LOCO2-11 18/7/2015
±17:30 GMT
59° 12.048'N 39° 20.241'W 3006 m
M5 -NOC 17/07/2015
±09:25 GMT
59° 34.8463'N 37° 47.8957'W 3124 m
M4 -NOC 17/07/2015
±14:37 GMT
59° 38.8709’ 38° 34.0344'W 2985 m
M3-NOC 21/07/2015
±08:00 GMT
59° 48.86’N 40° 16.53'W 2560 m
M2-NOC 21/07/2015
±12:28 GMT
59° 51.56'N 40° 41.33'W 2429 m
M1-NOC 23/07/2015
±07:57 GMT
59° 54.175'N 41° 08.457'W 2059 m
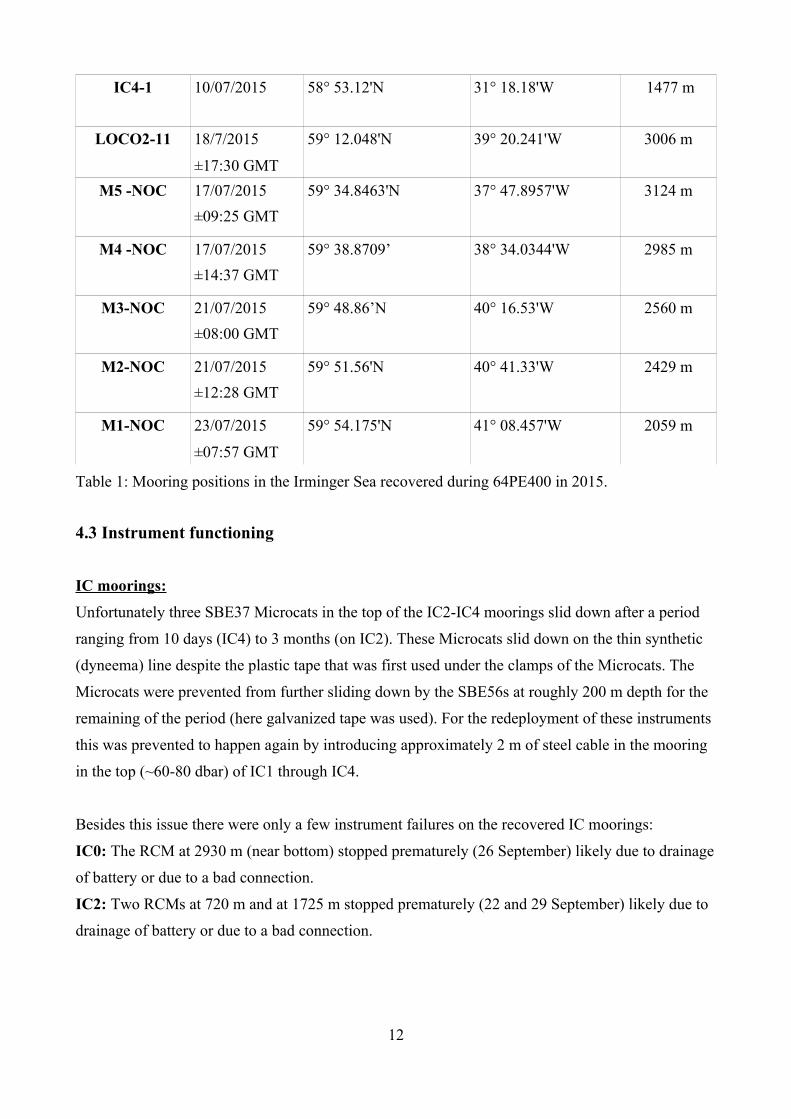
Table 1: Mooring positions in the Irminger Sea recovered during 64PE400 in 2015.
4.3 Instrument functioning
IC moorings:
Unfortunately three SBE37 Microcats in the top of the IC2-IC4 moorings slid down after a period
ranging from 10 days (IC4) to 3 months (on IC2). These Microcats slid down on the thin synthetic
(dyneema) line despite the plastic tape that was first used under the clamps of the Microcats. The
Microcats were prevented from further sliding down by the SBE56s at roughly 200 m depth for the
remaining of the period (here galvanized tape was used). For the redeployment of these instruments
this was prevented to happen again by introducing approximately 2 m of steel cable in the mooring
in the top (~60-80 dbar) of IC1 through IC4.
Besides this issue there were only a few instrument failures on the recovered IC moorings:
IC0: The RCM at 2930 m (near bottom) stopped prematurely (26 September) likely due to drainage
of battery or due to a bad connection.
IC2: Two RCMs at 720 m and at 1725 m stopped prematurely (22 and 29 September) likely due to
drainage of battery or due to a bad connection.
12

Four SBE37 Microcats from NIOZ/WHOI showed a slight drift during the deployment which was
corrected for by comparing with the CTD calibration cast data.
Mooring SBE37 SN# Target depth S correctionIC1 12048 975 -0.00879IC2 12060 70 0.005771IC3 12052 70 0.001911IC4 8511 1300 -0.01446
LOCO2 mooring:
The newly upgraded MMP profiler (new firmware, new CTD) on LOCO2 had functioned
exceptionally well during the whole deployment period. Excellent daily profiles were obtained for
one whole year. The ADCPs and SBE37 Microcats on LOCO2 had also delivered full records. The
additional RINKO optode that was added to the bottom of the mooring to measure dissolved O2 in
relation to DWOW showed a large drift during the record and the data is likely not useful. The
optode was however recalibrated on board and redeployed. The calibration on board was done with
an anoxic solution of demi water with nitrogen. The solution turned out to be not 100% anoxic (10
uM O2 per liter) and therefore sodium sulfite (Na2SO3) should be brought along for that purpose
next year (Karel Bakker).
DWBC moorings:
All moorings were successfully recovered. Only two instruments failed to record full data sets. The
middle SBE37 on M5-NOC only recorded data up to March 2015 due to battery issues. The 300kHz
ADCP on M4-NOC failed to record any meaningful data due to unresolved issues. The ranges of
the ADCPs on the other 4 moorings is less than expected especially on M5-NOC (~25m). The
ranges on the other three ADCPs is greater during the first half of the deployment (~65m) but then
falls off to half of this value for the second half of the records.
13

4.4 Moorings deployed in 2015
The moorings below are listed in order of deployment (going from east to west). In black the target
position is given (for IC moorings) or the position from trilateration (for M1-M5 and LOCO2
moorings). In blue the anchor drop positions and depths are added. The fallback of the mooring
after the deployment is also listed whenever available. Detailed mooring drawings are given in
Appendices E and F.
Name Deployed on Latitude (degree
minutes)
[anchor drop]
Longitude (degree
minutes)
[anchor drop]
Fall back
(when
available)
Depth from
multi-beam
[at anchor drop]
IC4-2 14/07/2015
10:22 UTC
58° 53.37'N
[58° 53.432'W]
31° 17.84'W
[31° 18.131'W]
1478 m
[1500 m]
IC3-2 14/07/2015
17:19
58° 57.35'N
[58° 57.381'N]
31° 57.35'W
[31° 57.463'W]
1632 m
[1623 m]
IC2-2 15/07/2015
10:19
59° 01.4'N
[59° 01.556']
32° 46.63'W
[32° 45.999']
1978 m
[1988 m]
IC1-2 15/07/2015
15:46
59° 06.26'N
[59° 6.507'N]
33° 41.125'W
[33° 41.402'W]
2509 m
[2485 m]
IC0-2 15/07/2015
21:26
59° 12.99'N
[59° 13.024'N]
35° 07.41'W
[35° 07.421'W]
2938 m
LOCO2-12 19/07/2015
17:03
59° 12.06'N
[59°12.225'N]
39° 30.18'W
[39° 29.808'W]
477 m 3008 m
[3020 m]
M5 - NOC 20/07/2015
11:16
59°N 34.626'N
[59° 34.866'N]
37° 47.952'W
[37° 47.857'W]
446 m 3214 m
M4 - NOC 20/07/2015
17:10
59° 38.796'N
[59° 38.980’N]
38° 33.941'W
[38° 34.145’W]
321 m 2989 m
M3 - NOC 22/07/2015
12:11
59° 48.888'N
[59° 51.562’N]
40° 16.59'W
[40° 16.214’W]
199 m 2564 m
M2 - NOC 22/07/2015
17:10
59° 51.546'N
[59° 51.562’N]
40° 41.334'W
[40° 41.551’W]
200 m 2434 m
M1 - NOC 24/07/2015
18:80
59° 54.18'N
59° 54.334’N
41° 6.708'W
41° 06.639’W
296 m 2086 m
Table 2: Moorings in the Irminger Basin deployed during cruise 64PE400 in 2015: the Dutch moorings IC1-
IC4, the Dutch/US mooring IC0, the Dutch LOCO2 mooring, and the UK moorings M1-M5 (Note: the latter
are given the extension NOC here since the RSMAS moorings in the Iceland Basin are also named M1-M5).
14

4.5 CIS mooring survey (Till Bauman, GEOMAR)
The CIS-mooring in the Irminger Sea is part of GEOMAR’s (Kiel, Germany) contribution to
OSNAP. The current version was deployed in late summer 2014 in the southwestern Irminger Sea
for a two-year period and is designed to monitor possible deep convection events and their
influence on nutrient concentrations. The data of the instruments located in the upper thousand
meters of the mooring are inductively send through the mooring wire to a little surface buoy that
transmits them via satellite to the headquarters in Kiel. Because this telemetry buoy stopped
working in early 2015, it was planned to be replace during this cruise. When the buoy was still
working properly, it regularly transmitted its GPS-based position and thus the expected location
was well known: A circle with a radius of maximum 400 m centered around the known mooring
position 59° 31.05'N,39°W 47.25'W (see Fig.4). On July 17th the search for the buoy began at
6:30am but despite the well-known position, the calm sea and good visibility the search remained
unsuccessful. After seven hours spent on a dense search-grid within this confined area, the mission
had to be abandoned. A subsequently performed triangulation based on the distances obtained by
contacting the mooring releases from different positions confirmed the location of the actual
mooring. This means that the mooring is most likely intact; only the surface buoy is missing. It
remains uncertain whether the buoy was ripped off the mooring or just went subsurface.
Figure 4: a) The last CIS position in Feb. 2015, b) cruise track when searching for the CIS telemetry buoy.
5. CTD stations (Femke de Jong, NIOZ/Duke University)
A recently (April 2015) calibrated SBE 9/11+ CTD, SN-0942, was used to measure temperature,
salinity, and turbidity profiles. The sensors mounted on the CTD were an SBE3 temperature sensor
SN-001219, SBE4 conductivity sensor SN-003262, a Digiquatz pressure sensor SN-127486, an
SBE43 oxygen sensor SN-0431932, a Wetlab CStar beam transmission meter SN-CST-1406DR
with a path length of 25 cm, a Chelsea PAR/irradiance sensor SN-118, and a Chelsea Aqua 3
fluorometer SN-088008.
15

The CTD was mounted in a special rack, which contained 22 Niskin water samplers. Two Niskin
water samplers were taken off the rosette to make space for the dual-head LADCP set up (Lowered
Acoustic Doppler Current profiler). To control the temperature measurements an SBE35 Deep
Ocean Standards thermometer was mounted next to the temperature sensor of the CTD. Reference
temperature samples were taken with this when water samples were taken with the Niskin samplers.
At every bottle stop the CTD operator waited one minute to allow the bottle to be flushed properly.
After the bottle was closed another minute was waited to allow the SBE35 to register temperature.
The water from these samplers was sub-sampled for the determination of dissolved oxygen and
salinity on most stations (Figure 3) and for nutrients and δO18 on the stations near Greenland.
Figure 5. Bottle depths for salinity (blue) and oxygen samples (red) for the 42 CTD stations along
AR7E. Nutrient samples were taken from bottles 300 m and up on the western 8 stations. δO18
samples were taken from bottles closed in the upper 100m on the same stations. Bottom topography
is from ETOPO data set. Bottle samples were taken at every station and indicate actual
encountered depth.
For the data collection the new Seasave software for Windows (version V7.21d), produced by SBE,
was used. The CTD data were recorded with a frequency of 24 data cycles per second. After each
CTD cast the data were copied to a hard disk of the ship's computer network. The CTD data were
processed with the recently obtained calibration data, using the Seasoft software, also produced by
SBE, and reduced to 1 dbar average ASCII files for regular use and to 1Hz average ASCII files for
the LADCP processing. These were used for the preliminary analysis of the data. The final data
processing was completed at Royal NIOZ, Texel. In Appendix A a list is given with all 51 CTD
stations carried out during the cruise. Stations 1 through 42 are on the main section across the
Irminger Basin (~AR7E). Stations 43 to 51 are taken on a 2nd section at roughly 64.5°N across the
Greenland shelf slope to capture the spill jet.
16
5.1 Reference temperature measurements
Mounted on the CTD-rack was a high precision SBE35 reference temperature sensor, which
recorded the temperature on commands given by the CTD operator. These SBE35 temperature data
will be used to control the calibration of the CTD temperature sensor. The difference TCTD-TSBE35
amounts to -0.000953°C (±0.0016°C standard deviation). There was no significant drift.
5.2 Salinity calibration
Measurements from the salinity samples were used to calibrate the CTD salinity. The Seabird
conductivity sensor is known to show an amplification bias, a pressure or density dependent bias
and occasionally a drift in time. The set of sample/CTD salinity values were checked for these types
of biases. No significant drift was seen although several stations, CTD# 11 to 16, had somewhat
higher biases due to unknown reasons. Both the CTD conductivity and salinity (calculated using the
corrected temperature) showed an offset with a slight pressure dependence. Using an adjusted
CPcor of 9.35e-08 in the Seabird processing software improved the CTD salinity, but a better match
was made with the samples using a direct adjustment of the salinity. The found salinity bias was
SCTD-Ssamples = - 2.0722e-7 *P + 0.002245.
5.3 Oxygen calibration
Measurements from the oxygen bottle samples were used to calibrate the CTD oxygen. The CTD
oxygen is known to have amplification issues, but for the 64PE400 cruise we found pressure effects
to be dominant. The found oxygen bias was O2CTD-O2samples = - 0.00034423 *P – 6.0812.
5.4 Tracer samples
Nutrient samples (PO4, NO3, NO2) and oxygen isotope samples (∂18O) were taken in the EGC/IC
on CTD stations 34 and 36 through 42 on section 1, and on stations 43 through 50 on section 2. The
nutrient samples were filtered and frozen on board, and are analyzed later at NIOZ. The ∂18O
samples will be send to the Vrije Universiteit (VU) in Amsterdam to be measured by a stable
isotope mass spectrometer, Finnigan Delta+, equipped with a Gas Bench. These joint tracer data
will be used in a three end-member equation to identify the contribution of Pacific Water, sea ice
melt and meteoric mater to the freshwater content in the EGC.
5.5 Section plots
Preliminary section plots of temperature and salinity and dissolved ogygen are shown below. Due to
a strong winter in 2014-2015 deep convection occurred in the Irminger Sea replacing all the LSW,
and newly ventilating the basin. This can be seen clearly as a cold, fresh and high oxygen water
mass on the section shown in Figures 6 and 7.
17

18
Figure 6. Potential temperature in the Irminger Sea as observed during cruise 64PE400 July 2015. Black contours mark the isopycnals 27.72, 27.7, 27.8 and 27.9 kg/m3 (from top to bottom).
Figure 7. Dissolved oxygen in the Irminger Sea as observed during cruise 64PE400.

5.5 Data Management
All raw data were copied to a cruise directory on the network computer in different groups of sub-
directories. Subsequent processed data, final products, documents and figures were copied to
separate sub-directories within the cruise directory. Backups of the network disks were made on a
daily basis. At the end of the cruise copies of the whole cruise directory have been made on portable
hard-disk. By help of paper measurement forms and computerized data inventory files all data are
tracked. A final inventory of the mooring activities, hydrographic stations, and the available raw
data files was made in a cruise summary file.
6. RAFOS floats (Ryan Peabody, Duke University)
Principal Investigators: A. Bower (WHOI), S. Lozier (Duke), H. Furey (WHOI). The RAFOS
deployments on board were carried out by PhD student Ryan Peabody (Duke).
Approximately 120 subsurface, acoustically tracked RAFOS floats are being released during the
2014, 2015, and 2016 OSNAP cruises to directly observe pathways of overflow waters through the
subpolar North Atlantic. An array of 10 260-Hz sound sources moored during the 2014 OSNAP
cruises is being used to track the floats until all the moored arrays are recovered in 2018. The
positions of RAFOS floats that were deployed in the Irminger Sea on this cruise are shown in
Figure 8.1.
19

Figure 8.1: Locations of RAFOS floats deployed during 64PE400 are indicated by black stars.
6.1 The 2015 RAFOS deployments
This year’s seeding was similar to last year’s deployment, with one major difference: the float
deployment positions in the deep Charlie-Gibbs Fracture Zone used in 2014 were moved to the
OSNAP line west of the Reykjanes Ridge crest. In 2014, the ship travelled over the Charlie-Gibbs
when deploying the sound source array and a one-time seeding of 10 floats was made at this
location, targeting the Iceland–Scotland Overflow Water as it travels east to west through the
fracture zone. The 2015 OSNAP cruises do not travel in this region, so this deployment position
was re-located downstream to seed the deep mean northward flow that blankets the west Reykjanes
Ridge. Also, it was unclear of any of the floats releases in the Iceland Basin or CGFZ would turn
north to travel along the Irminger Sea boundary. During Year 2, a total of 47 OSNAP RAFOS
deployments were planned. This increase from 40 to 47 is due to manufacturer decreasing cost of
the RAFOS unit, and providing difference in the form of five additional RAFOS, and two 2014
RAFOS that were held back because they were thought to have imperfections in glass housing, but
were later deemed sound.
Planned deployments for 2015 were as follows:
Cruise 64PE399 (leg 1): 15 RAFOS on the eastern flank of the Reykjanes Ridge
programmed for 730-day missions; three monitoring RAFOS floats in the Iceland Basin to
20

give sound source information at 10, 100, and 317 days. The monitor day counts equate to:
information returned in enough time to hold back deploying 2015 Leg 2 floats, in enough
time to procure, ship and moor a replacement sound source, and in enough time to halt
shipment on 2016 RAFOS floats.
Cruise 64PE400 (leg 2): 12 RAFOS over the western flank of the Reykjanes Ridge
programmed for 730-day missions; 20 RAFOS floats over the East Greenland Slope, 17 of
which were programmed for 730-day missions and 3 of which were programmed for 20 day
missions;1 and 3 monitoring RAFOS in the Irminger Basin to give sound source information
at 10, 80, and 300 days, which mimics the above staggered surfacing plans.
Appendix B lists detailed deployment information for the floats on 64PE400, OSNAP East Year 2
Leg 2. Floats released on the western flank of the Reykjanes Ridge (12 total) were ballasted for
1800, 2000, 2200, and 2500 decibars. Floats released on the eastern flank of the East Greenland
Slope (19 total) were ballasted for 1800, 2000, 2200, 2500, and 2800 decibars. Deployments on the
Reykjanes Ridge were designed to target Iceland-Scotland Overflow Water flowing northward,
while deployments on the East Greenland Slope were designed to target Denmark Strait Overflow
Water flowing southward. Deployments on the Reykjanes Ridge were given a vertical structure,
with 2 or 3 floats deployed at each site, ballasted for different depths. Deployments on the East
Greenland Slope were clustered, with 2 or 3 floats deployed at each site, but ballasted for the same
depths. Figure 8.1 shows the deployment sites superimposed on (uncalibrated) CTD salinity and
Figure 8.2 shows the deployment locations over bathymetry.
1� One float was not deployed, as the wire connecting the weight to the float body was severed at some point
before arrival in Iceland. This could be due to damage from transport, or a malfunction that caused an early release trigger.
21
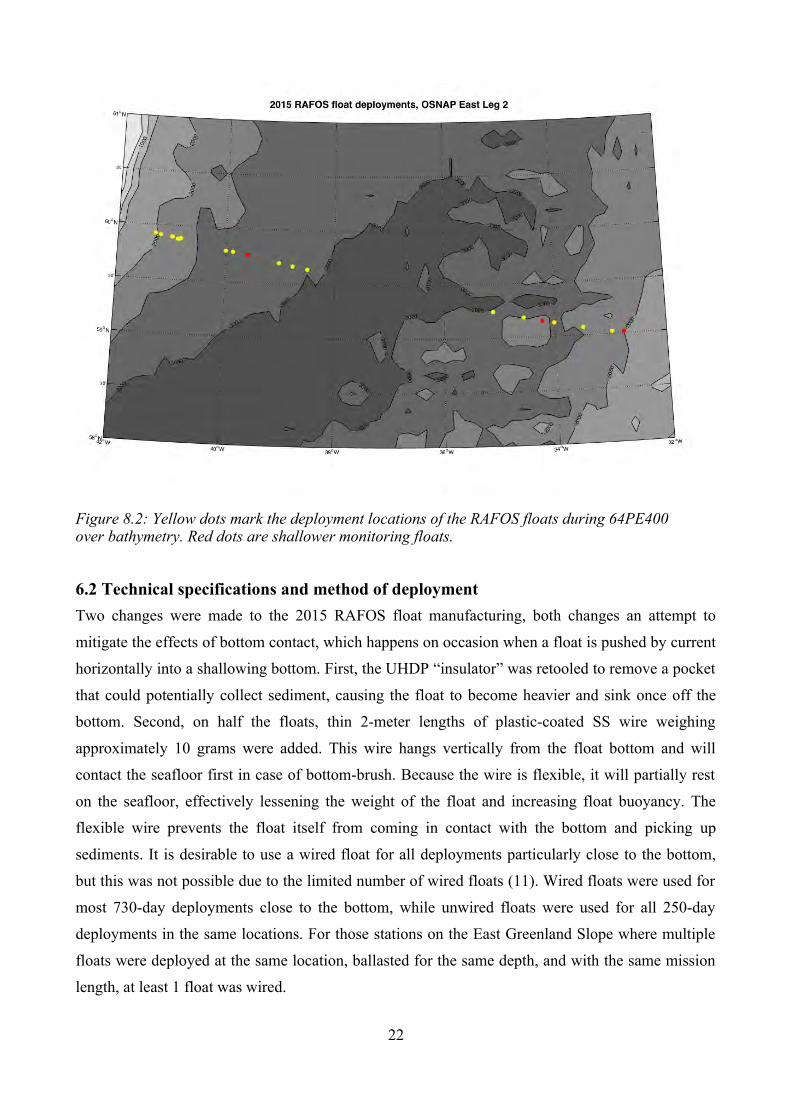
Figure 8.2: Yellow dots mark the deployment locations of the RAFOS floats during 64PE400 over bathymetry. Red dots are shallower monitoring floats.
6.2 Technical specifications and method of deployment
Two changes were made to the 2015 RAFOS float manufacturing, both changes an attempt to
mitigate the effects of bottom contact, which happens on occasion when a float is pushed by current
horizontally into a shallowing bottom. First, the UHDP “insulator” was retooled to remove a pocket
that could potentially collect sediment, causing the float to become heavier and sink once off the
bottom. Second, on half the floats, thin 2-meter lengths of plastic-coated SS wire weighing
approximately 10 grams were added. This wire hangs vertically from the float bottom and will
contact the seafloor first in case of bottom-brush. Because the wire is flexible, it will partially rest
on the seafloor, effectively lessening the weight of the float and increasing float buoyancy. The
flexible wire prevents the float itself from coming in contact with the bottom and picking up
sediments. It is desirable to use a wired float for all deployments particularly close to the bottom,
but this was not possible due to the limited number of wired floats (11). Wired floats were used for
most 730-day deployments close to the bottom, while unwired floats were used for all 250-day
deployments in the same locations. For those stations on the East Greenland Slope where multiple
floats were deployed at the same location, ballasted for the same depth, and with the same mission
length, at least 1 float was wired.
22
Most of the RAFOS floats were released using the “holey tube”, ~0.25-m diameter, 2.5-m long
PVC pipe. Normally this tube is used with a starch-ring piston that releases a bottom gate once the
starch ring dissolves in water, an event that takes approximately 15 seconds. However, the floats
were not able to be launched using this method for fear that wire would be damaged (therefore
changing ballasting weight) or hang up on the PVC launcher bottom gate. Leg 1 (PE399) developed
a method that was used for all deployments on Leg 2, whereby the tube is used as a simple
deployment chute. The float was loaded into the tube horizontally on deck, the wire (if present)
carefully unwound and fed over the ship’s fantail. One person would hold the top of the glass float,
while another person would edge the tube over the side, tilting both in concert at 45-60 degree angle
to the water. The float and tube were then lowered as much as possible to minimize distance to
water surface. Waiting for swell to come up, the float was then let go and dropped through the tube
into the water. In this manner, the tail wire was not damaged, and the glass housing had no contact
with the deck.
7. LADCP data collection (Laura de Steur, NIOZ)
LADCP dual head with the downward looking head provided by NOC, and the upward looking
head from NIOZ. The script file with settings that was used to start the LADCP is given in
Appendix C. On some stations (CTD stations 11 to 14) on the Reykjanes Ridge the LADCP did not
work (the battery case flooded due to a bad fix of the lid after replacing the battery. All electronics
were cleaned and fixed after which good data was collected again). Those stations were repeated
when steaming back on to the section prior to mooring redeployments (CTD stations 19 to 21). The
LADCP profiles were processed on board with LDEO software Version IX_10 (see
http://www.ldeo.columbia.edu/~ant/LADCP) using 1 Hz bin-averaged CTD data (no VMADCP).
The barotropic tides were removed from the profiles by using the Global 1/4°x1/4° degree tidal
model TMD2.03/Model_tpox6.2:
http://www.coas.oregonstate.edu/research/po/research/tide/index.html.
8. Vessel Mounted ADCP (VMADCP) data collection (Till Bauman, GEOMAR)
A 75 kHz VMADCP (Vessel Mounted Acoustic Doppler Current Profiler), mounted downward
looking in the ship’s hull, is used to continuously monitor the ocean’s velocity in the upper ~600m.
The specifications and settings are presented in the documentation script that is attached. Although
the vertical resolution of the VMADCP is substantially lower than the one from the LADCP that is
attached to the CTD-rosette, its higher horizontal resolution (ø 0.5 km compared to the ø 15 km of
23
the CTD casts) provides critical information to complement the velocity data set. While the
VMADCP measured continuously during the whole cruise, we are mostly interested in the current
velocities along the section between the Reykjanes ridge and Greenland. Therefore only
measurements that took place along this section were considered and redundant multiple coverages
of certain segments were discarded. Furthermore, to maintain a coherent spatial resolution, only
data recorded during steaming (threshold = 2 m/s ~ 4 kn) is used to calculate the velocity field. In
order to account for biases of the velocity readings introduced by tides, the records were detided
using the Tide Model Driver (TMD) and the associated global 1/4° tide model6.2. The removed
tidal biases have peak amplitudes of 0.05 m/s and are assumed to act barotropically on the water
masses within depth range covered by the VMADCP. In the next step the velocity field is rotated by
10° clockwise so that the U and V components refer to along-section and cross-section instead of
the original east and north component, respectively. The rotated data is then interpolated on an
equidistant grid (0.1° by 10 m) using elliptic gaussian weights with influence and cut-off radii of
0.2° by 20 m and 0.5° by 70 m, respectively.
The results are depicted in Figure 9.1. The high barotropicity of the velocity signals over the
top 600 m allows for a vertically averaged display of the currents in the context of topography: In
Figure 9.2, the cruise track (green), the position of the data actually used (red) and the vertically
averaged VMADCP velocities (arrows) are shown. The dominant feature of this section is the
northward flow along the Reykjanes ridge in the East and the Southward flow of the Irminger
Current along the Greenland shelf in the West. Interestingly there are quite pronounced velocity
signals in the central Irminger Sea as well. Since they are located above the deepest part of the
basin, the full-depth LADCP casts might help to explain these currents.
24

25
Figure 9.2: Vector plot of the (600 m) depth-averaged velocity obtained from the VMADCP on the main section.
Figure 9.1: Along and across-section velocity as obtained by the VMADCP.

9. Outreach
During the cruise (bi-) weekly updates with 1.5 min short film clips were send to the OSNAP cruise
blog: http://www.o-snap.org/category/cruises/
In addition, a 10-minute long short film "Go With the flow of the North Atlantic Ocean" was made
to illustrate the background and relevance of the two large projects that this cruise supports and to
show how the oceanographic fieldwork is carried out. The filming and first cut of the film was done
by Maarten Roos on board (CurveLight-Films, NL). The animations and post production of the film
were done by Dick Peterse and Dan Brinkhuis (Science Media). The film was shown at the AGU
General Assembly in San Francisco in December 2015, and the EGU General Assembly in Vienna
in April 2016. The film is posted on the following NIOZ Youtube Channel:
https://www.youtube.com/watch?v=a-lhCIQjE4c
Acknowledgments
The Dutch contribution to OSNAP has received funding from the European Union 7th Framework
Programme (FP7 2007-2013), under grant agreement n.308299 (NACLIM www.naclim.eu). The
Royal Netherlands Institute for Sea Research NIOZ (NWO) subsidized 20 days of ship time to the
OSNAP program. In addition, a large part of the moored instrumentation (ADCPs, RCMs,
Aquadopps, releases, and beacons, as well as some SBE37 Microcats) were provided by the Marine
Research Facilities (MRF) pool from NIOZ as an in-kind contribution to the project.
26

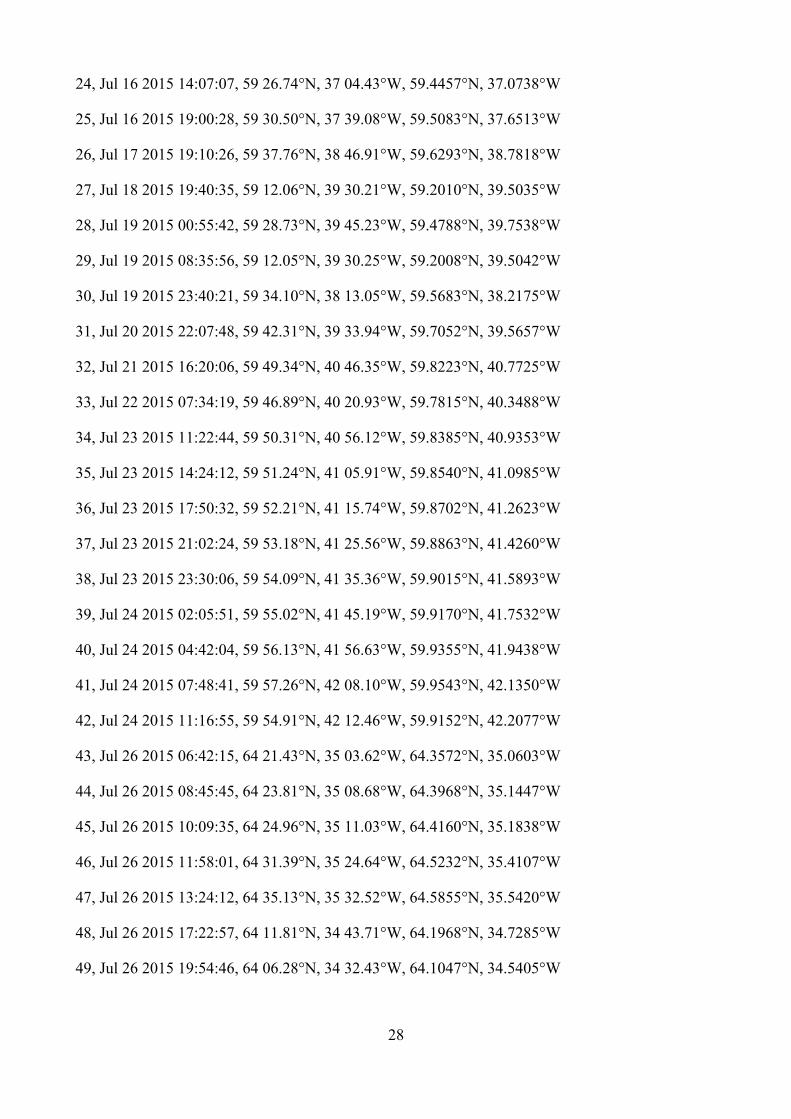
Appendix A: List of CTD stations
Nr, Date Time, Deg/Min North, Deg/Min West, Decimal Deg. North, Decimal Deg. West
01, Jul 11 2015 16:48:08, 59 14.60°N, 35 06.76°W, 59.2433°N, 35.1127°W
02, Jul 11 2015 21:03:30, 59 16.08°N, 35 21.88°W, 59.2680°N, 35.3647°W
03, Jul 12 2015 02:05:51, 59 12.61°N, 34 49.96°W, 59.2102°N, 34.8327°W
04, Jul 12 2015 05:44:23, 59 10.98°N, 34 33.87°W, 59.1830°N, 34.5645°W
05, Jul 12 2015 09:16:51, 59 09.34°N, 34 17.75°W, 59.1557°N, 34.2958°W
06, Jul 12 2015 12:45:55, 59 07.64°N, 34 01.21°W, 59.1273°N, 34.0202°W
07, Jul 12 2015 16:21:40, 59 06.04°N, 33 45.33°W, 59.1007°N, 33.7555°W
08, Jul 12 2015 19:29:52, 59 04.46°N, 33 29.52°W, 59.0743°N, 33.4920°W
09, Jul 12 2015 22:37:02, 59 02.85°N, 33 14.02°W, 59.0475°N, 33.2337°W
10, Jul 13 2015 01:58:45, 59 01.38°N, 32 58.64°W, 59.0230°N, 32.9773°W
11, Jul 13 2015 05:11:46, 58 59.66°N, 32 42.15°W, 58.9943°N, 32.7025°W
12, Jul 13 2015 07:47:18, 58 58.22°N, 32 27.95°W, 58.9703°N, 32.4658°W
13, Jul 13 2015 10:40:40, 58 56.67°N, 32 12.60°W, 58.9445°N, 32.2100°W
14, Jul 13 2015 13:00:07, 58 55.00°N, 31 57.03°W, 58.9167°N, 31.9505°W
15, Jul 13 2015 15:48:43, 58 53.67°N, 31 43.31°W, 58.8945°N, 31.7218°W
16, Jul 13 2015 18:26:58, 58 52.32°N, 31 29.66°W, 58.8720°N, 31.4943°W
17, Jul 13 2015 20:42:42, 58 50.93°N, 31 15.94°W, 58.8488°N, 31.2657°W
18, Jul 13 2015 22:57:36, 58 50.52°N, 31 02.07°W, 58.8420°N, 31.0345°W
19, Jul 14 2015 13:34:53, 58 55.00°N, 31 57.03°W, 58.9167°N, 31.9505°W
20, Jul 14 2015 18:49:04, 58 56.70°N, 32 12.54°W, 58.9450°N, 32.2090°W
21, Jul 14 2015 21:05:47, 58 58.21°N, 32 27.93°W, 58.9702°N, 32.4655°W
22, Jul 14 2015 23:28:40, 58 59.69°N, 32 42.13°W, 58.9948°N, 32.7022°W
23, Jul 16 2015 08:08:57, 59 20.54°N, 36 06.21°W, 59.3423°N, 36.1035°W
27
24, Jul 16 2015 14:07:07, 59 26.74°N, 37 04.43°W, 59.4457°N, 37.0738°W
25, Jul 16 2015 19:00:28, 59 30.50°N, 37 39.08°W, 59.5083°N, 37.6513°W
26, Jul 17 2015 19:10:26, 59 37.76°N, 38 46.91°W, 59.6293°N, 38.7818°W
27, Jul 18 2015 19:40:35, 59 12.06°N, 39 30.21°W, 59.2010°N, 39.5035°W
28, Jul 19 2015 00:55:42, 59 28.73°N, 39 45.23°W, 59.4788°N, 39.7538°W
29, Jul 19 2015 08:35:56, 59 12.05°N, 39 30.25°W, 59.2008°N, 39.5042°W
30, Jul 19 2015 23:40:21, 59 34.10°N, 38 13.05°W, 59.5683°N, 38.2175°W
31, Jul 20 2015 22:07:48, 59 42.31°N, 39 33.94°W, 59.7052°N, 39.5657°W
32, Jul 21 2015 16:20:06, 59 49.34°N, 40 46.35°W, 59.8223°N, 40.7725°W
33, Jul 22 2015 07:34:19, 59 46.89°N, 40 20.93°W, 59.7815°N, 40.3488°W
34, Jul 23 2015 11:22:44, 59 50.31°N, 40 56.12°W, 59.8385°N, 40.9353°W
35, Jul 23 2015 14:24:12, 59 51.24°N, 41 05.91°W, 59.8540°N, 41.0985°W
36, Jul 23 2015 17:50:32, 59 52.21°N, 41 15.74°W, 59.8702°N, 41.2623°W
37, Jul 23 2015 21:02:24, 59 53.18°N, 41 25.56°W, 59.8863°N, 41.4260°W
38, Jul 23 2015 23:30:06, 59 54.09°N, 41 35.36°W, 59.9015°N, 41.5893°W
39, Jul 24 2015 02:05:51, 59 55.02°N, 41 45.19°W, 59.9170°N, 41.7532°W
40, Jul 24 2015 04:42:04, 59 56.13°N, 41 56.63°W, 59.9355°N, 41.9438°W
41, Jul 24 2015 07:48:41, 59 57.26°N, 42 08.10°W, 59.9543°N, 42.1350°W
42, Jul 24 2015 11:16:55, 59 54.91°N, 42 12.46°W, 59.9152°N, 42.2077°W
43, Jul 26 2015 06:42:15, 64 21.43°N, 35 03.62°W, 64.3572°N, 35.0603°W
44, Jul 26 2015 08:45:45, 64 23.81°N, 35 08.68°W, 64.3968°N, 35.1447°W
45, Jul 26 2015 10:09:35, 64 24.96°N, 35 11.03°W, 64.4160°N, 35.1838°W
46, Jul 26 2015 11:58:01, 64 31.39°N, 35 24.64°W, 64.5232°N, 35.4107°W
47, Jul 26 2015 13:24:12, 64 35.13°N, 35 32.52°W, 64.5855°N, 35.5420°W
48, Jul 26 2015 17:22:57, 64 11.81°N, 34 43.71°W, 64.1968°N, 34.7285°W
49, Jul 26 2015 19:54:46, 64 06.28°N, 34 32.43°W, 64.1047°N, 34.5405°W
28

50, Jul 26 2015 22:47:21, 63 59.79°N, 34 19.79°W, 63.9965°N, 34.3298°W
51, Jul 27 2015 02:00:45, 63 51.05°N, 34 00.85°W, 63.8508°N, 34.0142°W
29

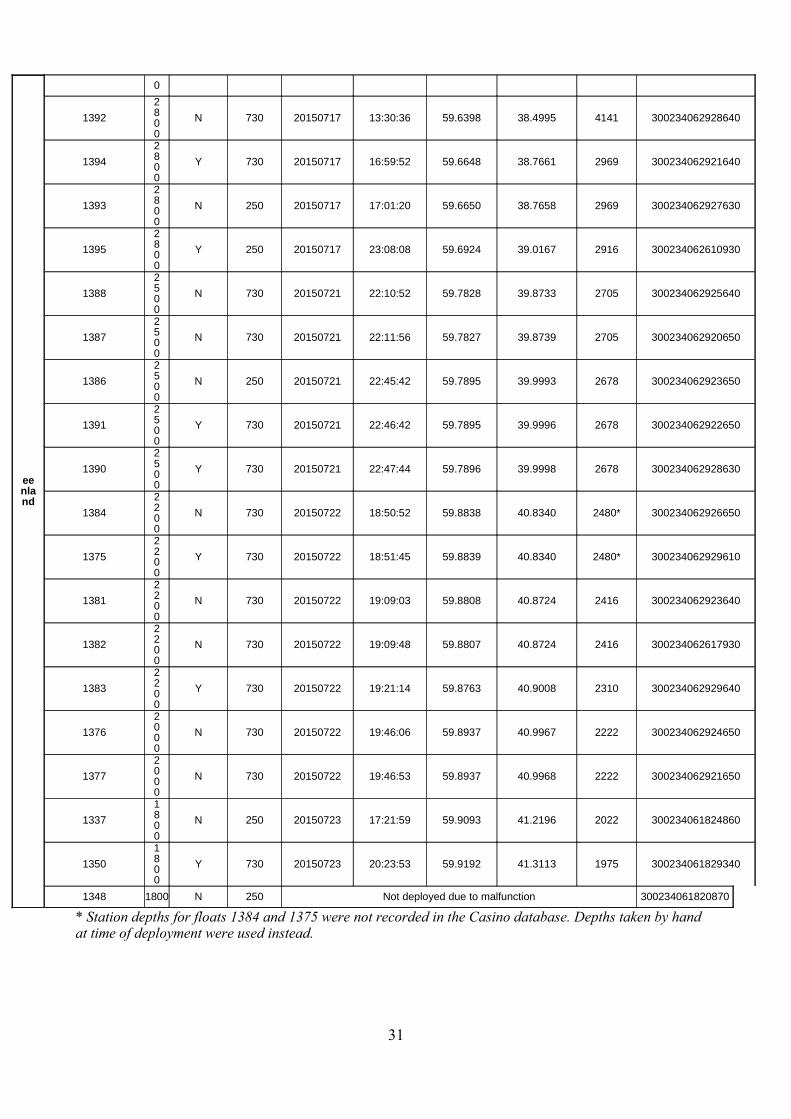
Appendix B: List of RAFOS float deployments 2015 (leg 2)
Serial Number
Ballast/TargetDepth(m)
Wiredfloat
Mission
(days)
Deployment Date
Deployment Time(GMT)
DecimalLatitude
(°N)
DecimalLongitude
(°W)
Waterdepth(m)
Iridium IMEI Number
Monitor
1045
1000
N 8 20150710 17:50:53 59.0150 32.7705 1999 300234010115360
1131
1000
N 80 20150715 17:33:07 59.1469 34.2360 2417 300234010139170
1117
1000
N 300 20150722 14:12:27 59.7567 39.6063 2668 300234011477240
ReykjanesRidge
1385
2500
N 730 20150711 19:25:30 59.2433 35.1133 3019 300234062920640
1380
2200
N 730 20150711 19:26:46 59.2434 35.1132 3018 300234062922640
1372
2200
Y 730 20150712 8:05:28 59.1827 34.5634 2851 300234062618940
1368
2000
N 730 20150712 8:06:34 59.1828 34.5631 2852 300234062613940
1363
1800
N 730 20150712 8:07:21 59.1830 34.5629 2895 300234062614940
1371
2200
Y 730 20150712 15:10:52 59.1276 34.0196 2847 300234062619930
1367
2200
N 730 20150712 15:11:27 59.1276 34.0196 2843 300234062610950
1362
1800
N 730 20150712 15:12:26 59.1277 34.0196 2845 300234062618930
1361
2000
Y 730 20150712 21:27:55 59.0746 33.4936 2309 300234062613950
1353
1800
N 730 20150712 21:28:40 59.0747 33.4939 2309 300234061822340
1364
2000
Y 730 20150713 3:55:21 59.0232 32.9776 2252 300234062614910
1352
1800
N 730 20150713 3:56:22 59.0230 32.9775 2251 300234061823360
EastGr
1389 280
N 730 20150717 13:28:42 59.6398 38.4988 4867 300234062924640
30
eenland
0
1392
2800
N 730 20150717 13:30:36 59.6398 38.4995 4141 300234062928640
1394
2800
Y 730 20150717 16:59:52 59.6648 38.7661 2969 300234062921640
1393
2800
N 250 20150717 17:01:20 59.6650 38.7658 2969 300234062927630
1395
2800
Y 250 20150717 23:08:08 59.6924 39.0167 2916 300234062610930
1388
2500
N 730 20150721 22:10:52 59.7828 39.8733 2705 300234062925640
1387
2500
N 730 20150721 22:11:56 59.7827 39.8739 2705 300234062920650
1386
2500
N 250 20150721 22:45:42 59.7895 39.9993 2678 300234062923650
1391
2500
Y 730 20150721 22:46:42 59.7895 39.9996 2678 300234062922650
1390
2500
Y 730 20150721 22:47:44 59.7896 39.9998 2678 300234062928630
1384
2200
N 730 20150722 18:50:52 59.8838 40.8340 2480* 300234062926650
1375
2200
Y 730 20150722 18:51:45 59.8839 40.8340 2480* 300234062929610
1381
2200
N 730 20150722 19:09:03 59.8808 40.8724 2416 300234062923640
1382
2200
N 730 20150722 19:09:48 59.8807 40.8724 2416 300234062617930
1383
2200
Y 730 20150722 19:21:14 59.8763 40.9008 2310 300234062929640
1376
2000
N 730 20150722 19:46:06 59.8937 40.9967 2222 300234062924650
1377
2000
N 730 20150722 19:46:53 59.8937 40.9968 2222 300234062921650
1337
1800
N 250 20150723 17:21:59 59.9093 41.2196 2022 300234061824860
1350
1800
Y 730 20150723 20:23:53 59.9192 41.3113 1975 300234061829340
1348 1800 N 250 Not deployed due to malfunction 300234061820870
* Station depths for floats 1384 and 1375 were not recorded in the Casino database. Depths taken by hand at time of deployment were used instead.
31
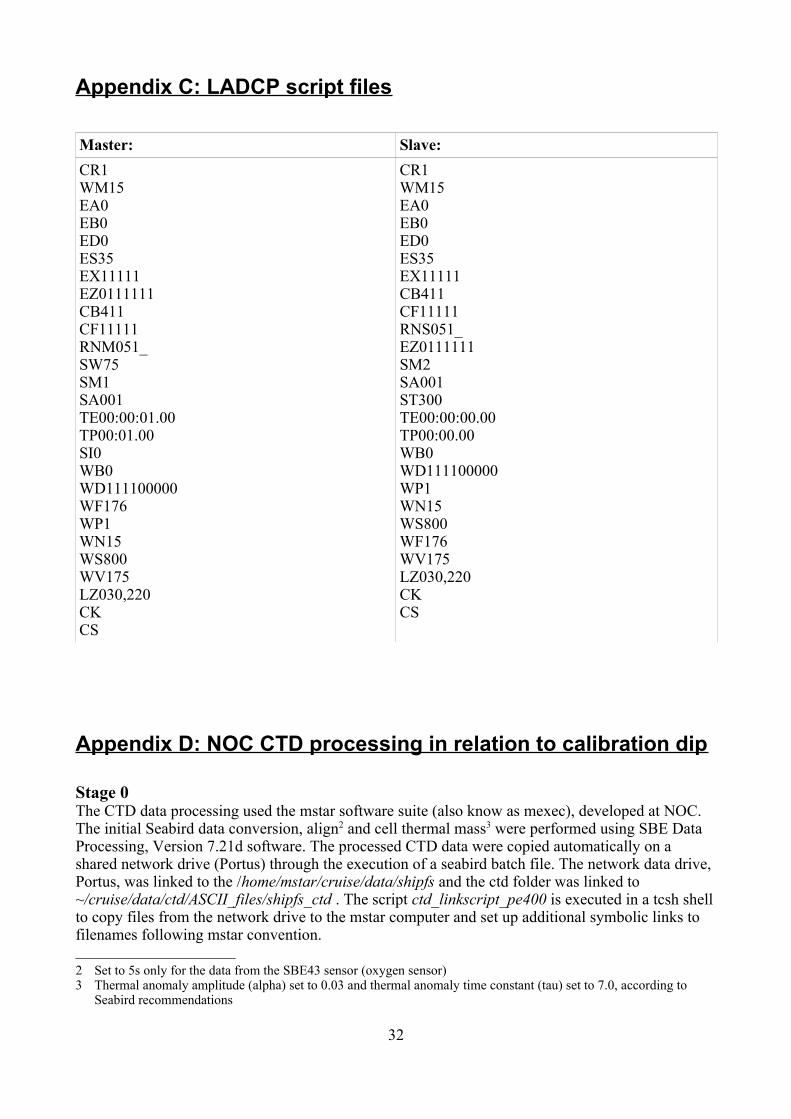
Appendix C: LADCP script files
Master: Slave:
CR1WM15EA0EB0ED0ES35EX11111EZ0111111CB411CF11111RNM051_SW75SM1SA001TE00:00:01.00TP00:01.00SI0WB0WD111100000WF176WP1WN15WS800WV175LZ030,220CKCS
CR1WM15EA0EB0ED0ES35EX11111CB411CF11111RNS051_EZ0111111SM2SA001ST300TE00:00:00.00TP00:00.00WB0WD111100000WP1WN15WS800WF176WV175LZ030,220CKCS
Appendix D: NOC CTD processing in relation to calibration dip
Stage 0The CTD data processing used the mstar software suite (also know as mexec), developed at NOC. The initial Seabird data conversion, align2 and cell thermal mass3 were performed using SBE Data Processing, Version 7.21d software. The processed CTD data were copied automatically on a shared network drive (Portus) through the execution of a seabird batch file. The network data drive, Portus, was linked to the /home/mstar/cruise/data/shipfs and the ctd folder was linked to ~/cruise/data/ctd/ASCII_files/shipfs_ctd . The script ctd_linkscript_pe400 is executed in a tcsh shellto copy files from the network drive to the mstar computer and set up additional symbolic links to filenames following mstar convention.
2 Set to 5s only for the data from the SBE43 sensor (oxygen sensor)3 Thermal anomaly amplitude (alpha) set to 0.03 and thermal anomaly time constant (tau) set to 7.0, according to
Seabird recommendations
32

Stage 1The first step of the processing is the creation of empty sample files sam_pe400_nnn.nc for all castsnnn. These files were generated from the list of variables indicated in the file ~/cruise/data/templates/sam_pe400_varlist.csv through the execution of the scripts msam_01, msam_01b (as described in the comments at the beginning of msam_01b).For each cast the following matlab files were run, using a wrapper script ctd_all_part1: mctd_01, mctd_02a, mctd_02b, mctd_03, msam_putpos, mdcs_01, mdcs_02.The processes completed by these scripts include: - read ASCII cnv data from data/ctd/ASCII_FILES/ctd_pe400_nnn_ctm.cnv;- convert variable names from SBE names to mstar names using data/templates/ctd_pe400_renamelist.csv- convert raw file to 24hz file- make oxygen hysteresis ajustement on 24hz file- average to 1hz- calculate derived variables psal et potemp- extract information from the ship navigation data for the bottom of cast identified by maximum pressure
Stage 2Then the script mdcs_03g_pe400 was run to inspect profiles and hand-select cast start and end times. The start, bottom and end data cycles are stored for each cast nnn in files dcs_pe400_nnn.nc. After selecting the limits for start and end, ctd_all_part2_pe400 was then run, executing mctd_04_pe400, mfir_01, mfir_02, mfir_03, mfir_04, mbot_00, mbot_01, mbot_02. The processes completed by these scripts include: - extract down and upcasts using scan numbers stored in dcs_pe400_nnn.nc, and average into 2dbar files (2db down and 2db up)- read the data/ctd/ASCII_FILES/ctd_pe400_001.bl file and extract scan numbers corresponding to bottle firing events.- add time from CTD file, merging on scan number- add CTD upcast data corresponding to bottle firing events- paste these data into master sample file data/ctd/sam_pe400_nnn.nc- paste the bottle firing codes and quality flag into the master sample file
When a conductivity calibration is available, it is applied to the 24hz files using mctd_condcal. Then a subset of scripts can be rerun, specifically mctd_02b, mctd_condcal, mctd_03, mctd_04_pe400, mfir_03, mfir_04. This collection of calls can be run through the script smallscript_pe399.
33

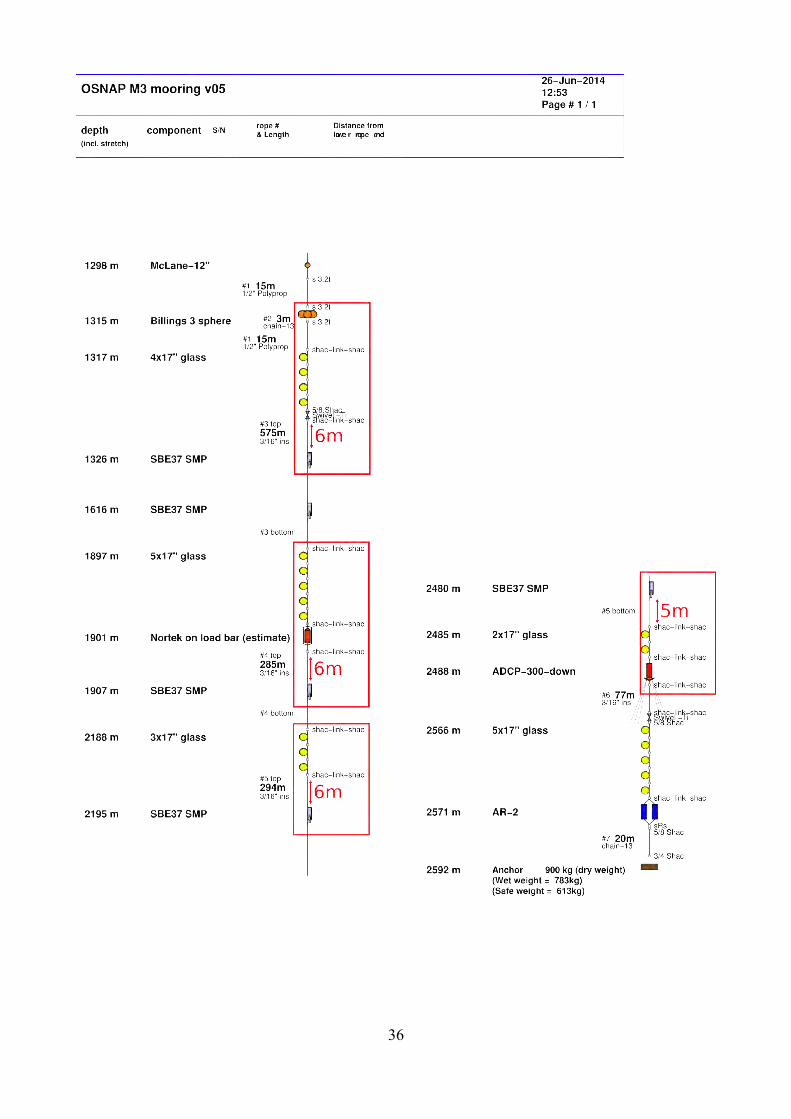
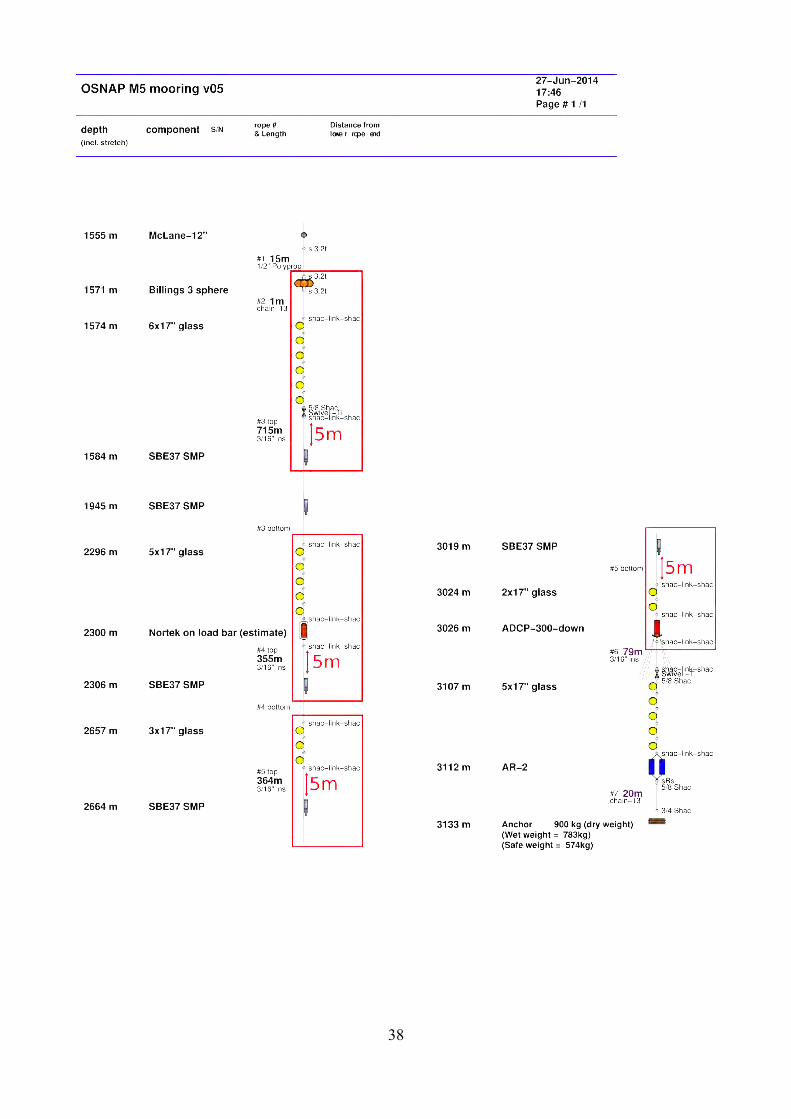
Appendix E: NOC Mooring designs M1-M5 deployed
34

35
36

37
38
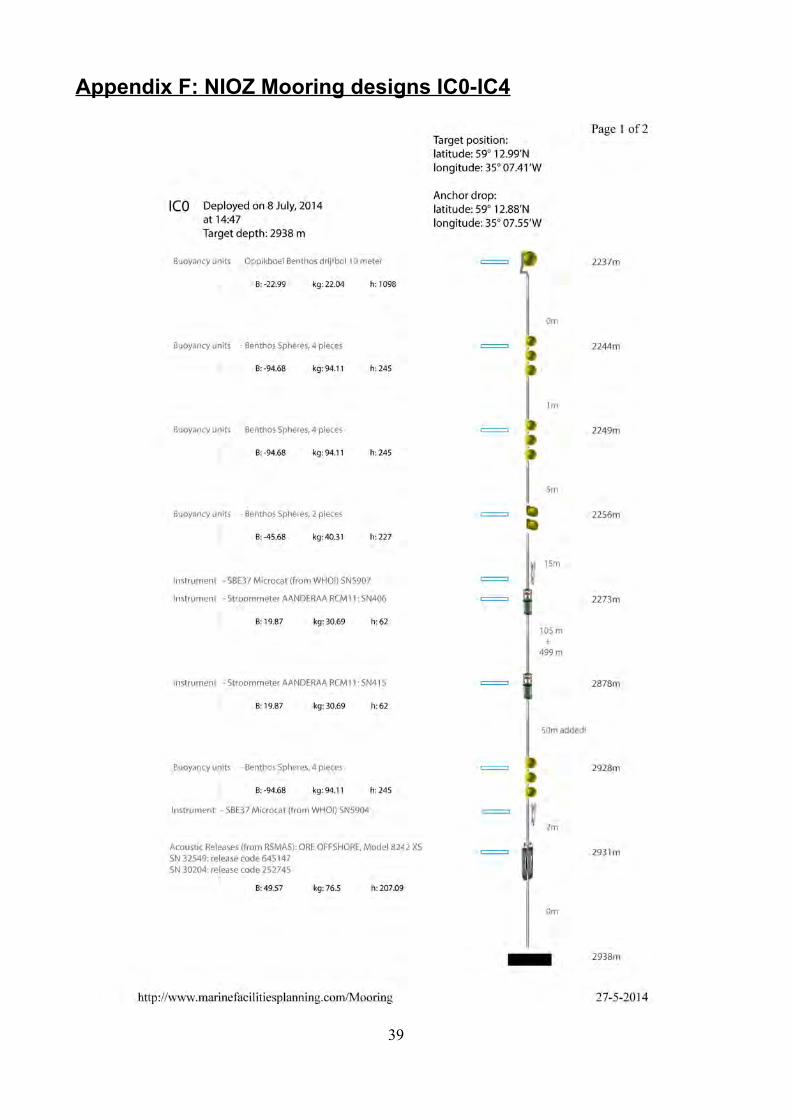
Appendix F: NIOZ Mooring designs IC0-IC4
39
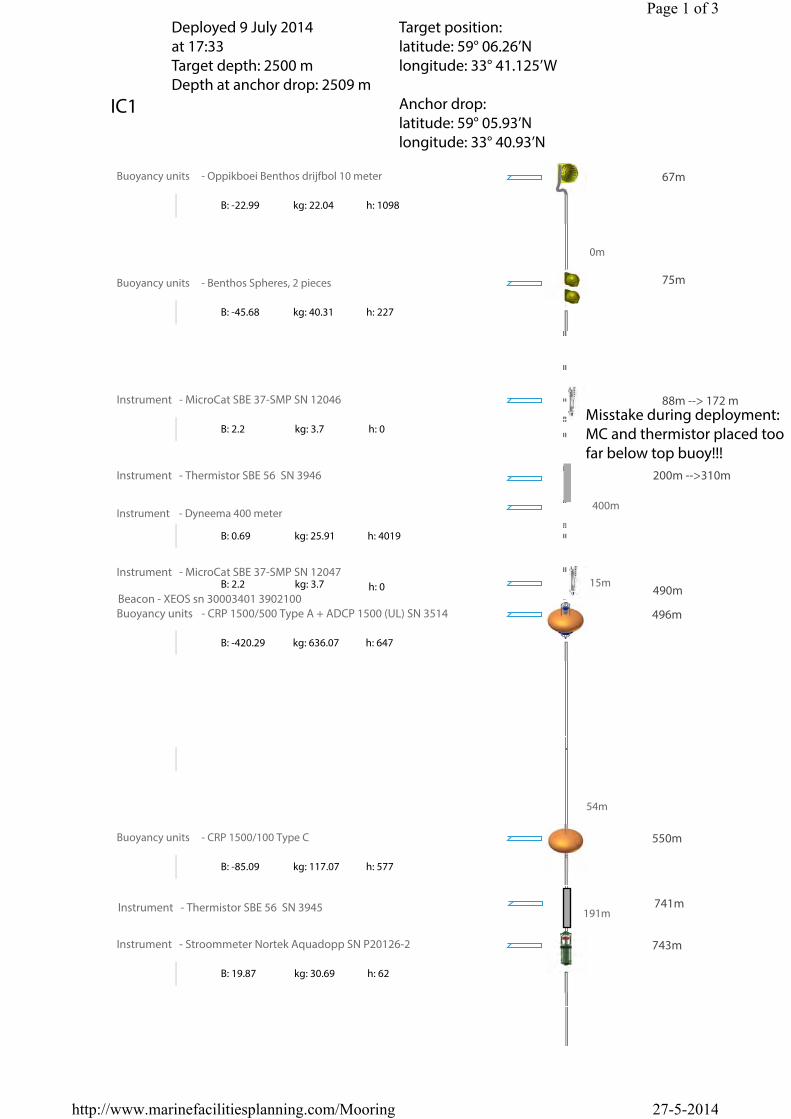
IC1
Buoyancy units - Oppikboei Benthos drijfbol 10 meter
B: -22.99 kg: 22.04 h: 1098
0m
Buoyancy units - Benthos Spheres, 2 pieces
B: -45.68 kg: 40.31 h: 227
Instrument - MicroCat SBE 37-SMP SN 12046
B: 2.2 kg: 3.7 h: 0
Instrument - Dyneema 400 meter
B: 0.69 kg: 25.91 h: 4019
Buoyancy units - CRP 1500/500 Type A + ADCP 1500 (UL) SN 3514
B: -420.29 kg: 636.07 h: 647
Instrument - MicroCat SBE 37-SMP SN 12047B: 2.2 kg: 3.7 h: 0
54m
Buoyancy units - CRP 1500/100 Type C
B: -85.09 kg: 117.07 h: 577
191m
Instrument - Stroommeter Nortek Aquadopp SN P20126-2
B: 19.87 kg: 30.69 h: 62
67m
88m --> 172 m
496m
490m
550m
743m
Page 1 of 3
27-5-2014http://www.marinefacilitiesplanning.com/Mooring
Deployed 9 July 2014at 17:33Target depth: 2500 mDepth at anchor drop: 2509 m
Target position:latitude: 59° 06.26’Nlongitude: 33° 41.125’W
Anchor drop:latitude: 59° 05.93’Nlongitude: 33° 40.93’N
Instrument - Thermistor SBE 56 SN 3946 200m -->310m
15m
Instrument - Thermistor SBE 56 SN 3945 741m
Beacon - XEOS sn 30003401 3902100
Misstake during deployment:MC and thermistor placed too far below top buoy!!!
75m
400m

Instrument - MicroCat SBE 37-SMP SN 12048
B: 2.2 kg: 3.7 h: 0
251m
Instrument - Stroommeter Nortek Aquadopp SN P286-6/02
B: 19.87 kg: 30.69 h: 62
Instrument - MicroCat SBE 37-SMP SN 12049
501m
Instrument - Stroommeter Nortek Aquadopp SN P20126-4
B: 19.87 kg: 30.69 h: 62
752m
Instrument - Sluiting GPH 1.5ton+ Splitpen
Instrument - MicroCat SBE 37-SMP SN 12050
B: 2.2 kg: 3.7 h: 0
231m
Instrument - Stroommeter Nortek Aquadopp SN P286-8/02
B: 19.87 kg: 30.69 h: 62
Releases - Acoustic Release, IXSEA AR861 B2S
SN 170 ARM 04DA Release code: ARM+0455SN 147 ARM 04C2 Release code: ARM+55
B: 49.57 kg: 76.5 h: 207.09
0m
Anker - Ankergewicht (700 kg)
Remains on the seabed
B: 710.22 kg: 814.56 h: 558
994m
996m
1499m
2482m
2509 m
Page 2 of 3
27-5-2014http://www.marinefacilitiesplanning.com/Mooring
Added 20 m extra!
Instrument - Stroommeter Nortek Aquadopp SN P286-7/02
B: 2.2 kg: 3.7 h: 0
2502 m
2500m
2251m
1497m

IC2
Buoyancy units - Oppikboei Benthos drijfbol 10 meter
B: -22.99 kg: 22.04 h: 1098
Buoyancy units - Benthos Spheres, 2 pieces
B: -45.68 kg: 40.31 h: 227
Instrument - MicroCat SBE 37-SMP SN 12060
B: 2.2 kg: 3.7 h: 0
Instrument - Dyneema 400 meter +
B: 0.69 kg: 25.91 h: 40019
Buoyancy units - CRP 1500/500 Type A + ADCP 1500 (UL) SN 3439
B: -420.29 kg: 636.07 h: 647
250m
Instrument - Stroommeter AANDERAA RCM11 SN 408
B: 19.87 kg: 30.69 h: 62
Instrument - MicroCat SBE 37-SMP SN12058B: 2.2 kg: 3.7 h: 0
251m
48 m
55 m
60 m
455 m
Page 1 of 2
27-5-2014http://www.marinefacilitiesplanning.com/Mooring
Beacon - XEOS sn 30003401 3708960
Target position:latitude: 59° 01.40’Nlongitude: 32° 45.63’W
Anchor drop:latitude: 59° 01.23’Nlongitude: 32° 46.05’W
Deployed 10 July 2014at 10:17 UTCTarget depth: 1978 m
Instrument - Thermistor SBE56 SN 3949 200 m
15m
Instrument Thermistor SBE56 SN 3950
Instrument - Stroommeter AANDERAA RCM11 SN 48
B: 19.87 kg: 30.69 h: 62
972 m
721 m
723 m
470 m
400m
501m
252m
241m
5m
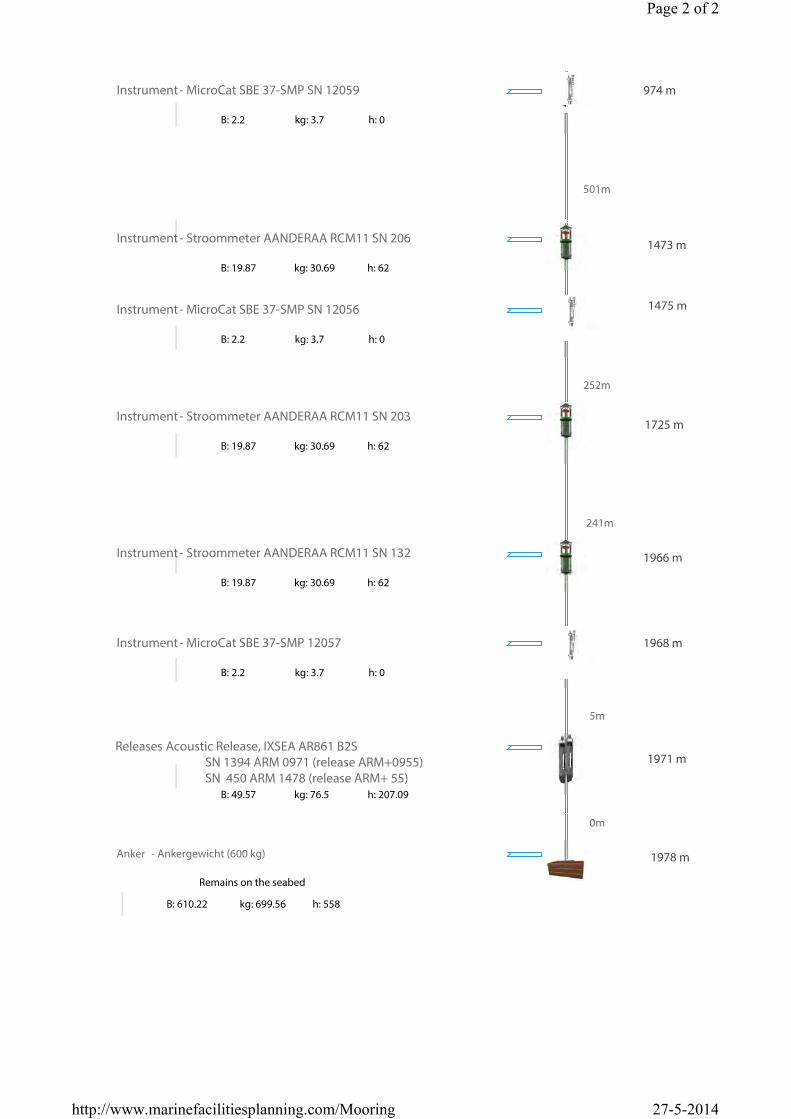
Releases Acoustic Release, IXSEA AR861 B2S SN 1394 ARM 0971 (release ARM+0955) SN 450 ARM 1478 (release ARM+ 55)
B: 49.57 kg: 76.5 h: 207.09
0m
Anker - Ankergewicht (600 kg)
Remains on the seabed
B: 610.22 kg: 699.56 h: 558
Instrument - Stroommeter AANDERAA RCM11 SN 132
B: 19.87 kg: 30.69 h: 62
974 m
1978 m
Instrument - MicroCat SBE 37-SMP SN 12056
B: 2.2 kg: 3.7 h: 0
Instrument - MicroCat SBE 37-SMP 12057
B: 2.2 kg: 3.7 h: 0
Page 2 of 2
27-5-2014http://www.marinefacilitiesplanning.com/Mooring
Instrument - MicroCat SBE 37-SMP SN 12059
B: 2.2 kg: 3.7 h: 0
Instrument - Stroommeter AANDERAA RCM11 SN 206
B: 19.87 kg: 30.69 h: 62
Instrument - Stroommeter AANDERAA RCM11 SN 203
B: 19.87 kg: 30.69 h: 62
1971 m
1968 m
1966 m
1725 m
1473 m
1475 m

IC3
Buoyancy units - Oppikboei Benthos drijfbol 10 meter
B: -22.99 kg: 22.04 h: 1098
0m
Buoyancy units - Benthos Spheres, 3 pieces
B: -70.98 kg: 57.61 h: 227
Instrument - MicroCat SBE 37-SMP SN 12052
B: 2.2 kg: 3.7 h: 0
Instrument - Dyneema 400 meter +
B: 0.69 kg: 25.91 h: 40019
Buoyancy units - CRP 1500/400 Type A +ADCP 1500 (UL) SN 7082
B: -312.15 kg: 522 h: 667
250m
Instrument - Stroommeter AANDERAA RCM11 SN 405
B: 19.87 kg: 30.69 h: 62
Instrument
251m
48m
58m
63m
480m
730m
981m
Instrument - MicroCat SBE 37-SMP SN 12053B: 2.2 kg: 3.7 h: 0
478m
Page 1 of 2
27-5-2014http://www.marinefacilitiesplanning.com/Mooring
Deployed on July 10, 2014at 14:58 UTCTarget depth: 1635 m
Target position:latitude: 58° 57.35’Nlongitude: 31° 57.17’W
Anchor drop:latitude: 58° 57.33’Nlongitude: 31° 57.54’W
15m
Instrument - Thermistor SBE56 SN 3951
Instrument - Thermistor SBE56 SN 3947 190m
Beacon - XEOS SN 30003401 2196220
- Stroommeter AANDERAA RCM11 SN 193
B: 19.87 kg: 30.69 h: 62
732m

Instrument
495m
100m
Instrument - StroommeterAANDERAA RCM11 SN 417
B: 19.87 kg: 30.69 h: 62
50 m added!!
Release - Acoustic Release, IXSEA AR861 B2S SN 160 ARM 04CF (release code: ARM + 55) SN 146 ARM 04C1 (release code ARM + 0455)
B: 49.57 kg: 76.5 h: 207.09
0m
Anker - Ankergewicht (600 kg)
Remains on the seabed
B: 610.22 kg: 699.56 h: 558
983m
1635 m
Instrument - MicroCat SBE 37-SMP SN 12055
B: 2.2 kg: 3.7 h: 0
Page 2 of 2
27-5-2014http://www.marinefacilitiesplanning.com/Mooring
- MicroCat SBE 37-SMP SN 12054
B: 2.2 kg: 3.7 h: 0
1627 m
1477 m
1478 m

IC4
Buoyancy units - Oppikboei Benthos drijfbol 10 meter
B: -22.99 kg: 22.04 h: 1098
0m
Buoyancy units - Benthos Spheres, 3 pieces
B: -70.98 kg: 57.61 h: 227
Instrument - MicroCat SBE 37-SMP SN 12051
B: 2.2 kg: 3.7 h: 0
Instrument - Dyneema 400 meter +
B: 0.69 kg: 25.91 h: 40019
Buoyancy units - CRP 1500/400 Type A +ADCP 1500 (UL) SN 3641
B: -312.15 kg: 522 h: 667
250m
Instrument - Stroommeter AANDERAA RCM11 SN 44B: 19.87 kg: 30.69 h: 62
Instrument
251m
55m
65m
70m
475m
724m
975m
Instrument - MicroCat SBE 37-SMP SN 2672B: 2.2 kg: 3.7 h: 0
472m
Page 1 of 2
27-5-2014http://www.marinefacilitiesplanning.com/Mooring
Deployed on 11 July 2014at 09:45 UTCTarget depth: 1477 m
Target position:latitude: 58° 53.37’Nlongitude: 31° 17.84’W
Anchor drop:latitude: 58° 53.12’Nlongitude: 31° 1.8.18’W
Instrument - Thermistor SBE56 SN 3948
Instrument - Thermistor SBE56 SN 3952 200m
722m
15m
Beacon - XEOS SN 30003401 2279280
- Stroommeter AANDERAA RCM11 SN 245
B: 19.87 kg: 30.69 h: 62

Instrument
335m
Instrument - MicroCat SBE 37-SMP SN 8511
B: 2.2 kg: 3.7 h: 0
100m
50 m added!
Release - Acoustic Release, IXSEA AR861 B2S SN 1556 ARM 0A11 (release code: ARM + 0155) SN 1392 ARM 096F (relaease code: ARM + 0955)
B: 49.57 kg: 76.5 h: 207.09
0m
Anker - Ankergewicht (600 kg)
Remains on the seabed
B: 610.22 kg: 699.56 h: 558
977m
1.312m
1.412m
1.463m
1470 m
Page 2 of 2
27-5-2014http://www.marinefacilitiesplanning.com/Mooring
- MicroCat SBE 37-SMP SN 2675
B: 2.2 kg: 3.7 h: 0
Instrument - Stroommeter AANDERAA RCM11 SN 189
B: 19.87 kg: 30.69 h: 62
- Sluiting GPH 1.5ton+ Splitpen
1.315m

Newly “upgraded”McLane profiler: S/N=11564-03D
Buoy BC=1373
SBE 37-SM MicroCAT: BC=12799 SN = 4354
Clamp on
DOWN W A R D LOOKINGLR ADCP : BC=3810, SN = 3702
Acoustic release: BC=35316, S/N=1557Acoustic release: BC=30052, S/N=166
WUW ... kg (steel, in air 1200kg)
LOCO 2-11Version: 29 September 2014
Final depth: 3006 m, post depl:3020Deployed: 16 Sept 2014,19:10 UTC
Final location (anchor drop):Latitude: 59° 12.048’NLongitude: 39° 30.241’W
10m �oating line
20 m cable
2283 m cable
568 m cable
7 m chain
113m
139m
137m
2423m
2998m
3006m
CRP
DOWN W A R D LOOKINGLR ADCP : BC=6453, S/N=1431Buoy BC = 1380
Argos beacon BC=2097S/N = 60677Argos code = 23005
SBE37 directly above bumper
141m
2420m Bumper
CRP
2 m chain
2 m chain
2 m chain
2 m chain
Bumper
! ! KEEP max pressure of MMP to ~2420 m
SBE 37-SM MicroCAT: BC= 3797 SN = 2656
Clamp on2993m Remained in mooring, serviced onboard:
Remained in mooring, serviced onboard:
Remained in mooring, serviced onboard:
Clamp on2992m New: O2 optode: S/N 48
NEW ADCP in mooring:
2 m chain
! ! NOTE: keep bumber close (0.7 m) to socket -> for recovery!!
ARM CODE: 0A12ARM CODE: 04D6