Embed Size (px)
Citation preview
Journal of Membrane Science, 69 (1992) 213-222 Elsevier Science Publishers B.V., Amsterdam
213
Osmotic pressure measurements of dissociating bovine hemoglobin
Edward M. Trujillo Department of Chemical Engineering, University of Utah, Salt Lake City, UT 84112 (USA)
(Received July 23,199O; accepted in revised form December 20,199l)
Abstract
While the dissociation of hemoglobin, in general, has been studied extensively using various techniques under both alkaline and acidic conditions, the dissociation under alkaline conditions using membrane osmometry has not been previously reported. An equilibrium mathematical model describing the two- stage dissociation is presented in this paper and agrees with the experimental osmotic pressure measure- ments of bovine hemoglobin at pH’s above 7.4. Results of this study show that the pH dependency under alkaline conditions at 37 ’ C can be regressed to give approximate values of the dissociation constants for both the dissociation of the tetramer to the dimer and the dimer to the monomer as a function of pH. The data also indicate that, in the presence of the borate buffer used in these experiments, the liberation of approximately one proton occurs for the dissociation of the tetramer into the dimers; approximately two protons are liberated for the dissociation of the dimer into the monomer. The dissociation constants reported here for bovine hemoglobin are in reasonable agreement with those obtained under similar conditions using other techniques.
Keywords: osmosis; theory; hemoglobin; dissociation
Introduction
Excellent reviews of osmotic pressure and its applications are provided by Kelley and Kupke [ 1 ] and Tombs and Peacocke [ 21. Guntelberg and Linderstrom-Land [ 31 were one of the first to develop the relations for the osmotic pres- sure of associating solutes in ideal, isoelectric systems. Steiner [4] discussed a similar rela- tion and developed a graphical procedure for the evaluation of the dissociation constants from osmotic pressure data. The procedure was
Correspondence to: E.M. Trujillo, Dep. Chem. Eng., 3290 Merrill Engineering Building, University of Utah, Salt Lake City, UT 84112 (USA).
0376-7388/92/$05.00 0 1992 Elsevier Science Publishers B.V. All rights reserved.
later applied to the self-association of a soy- bean inhibitor of trypsin and chymotrypsin [ 51.
Adams [6] extended the theory to nonideal so- lutions. Neet [ 71 presented an analysis show- ing that the apparent dissociation constants can indicate conformational changes as well.
The most extensive and authoritative work on the osmotic pressure of hemoglobin was per- formed by G.S. Adair [8,9] and, even today, continues to be the major reference on the sub- ject, particularly at high concentrations. Sev- eral investigators [lo-121 have fit the Adair data to polynomials to understand the osmotic properties of red blood cells. It is well recog- nized that hemoglobin can reversibly dissociate into subunits according to the equations [ 13,141
214 E.M. Trujillo/J. Membrane Sci. 69 (1992) 213-222
2(ap)*2a+2p (1)
%A =2 cap) (2)
where the dissociation constants, K1 and K,, in terms of gmole/l, can be defined as
(3) K _GWa+M/A
2 - (Ma + MJ2C,
and Cm,, Cma, C, and C, are the concentrations of the a-monomer, /?-monomer, dimer, and te- tramer, respectively, in mass units (g/l).
The dissociation constants K2 and Ki de- pend on temperature, pH, ionic strength, die- lectric constant of the solvent, and salt com- position [ 14-191. Antonini and Brunori [ 201 summarized the values of the dissociation con- stant K2 but little information was available on Ki. At low ionic strengths (0.02-0.40 M) an av- erage value of about 2.5 x 10m6 M was reported for K,, whereas for higher ionic strengths (l.OO- 2.00 M) about 5.0~ 10m5 M was reported. All these values were taken from measurements made at a pH of about 7.0 and at temperatures from 20 to 25 o C. In 0.25 M acetate under acidic conditions (pH 5.4) the dissociation constant rose to about 3.0~ 10m4 M. No substantial dif- ferences were noted among oxyhemoglobin, deoxyhemoglobin, and carbonmonoxyhemo- globin. Most of the K2 values were obtained from sedimentation experiments. Few authors used osmotic pressure data, Guidotti [ 14,16,17] being a notable exception.
Guidotti [ 14,16,17] measured the osmotic pressures of oxyhemoglobin, deoxyhemoglo- bin, and carbonmonoxyhemoglobin in various solutions at pH 7.0 and 20’ C and obtained the dissociation constant Kz by curve fitting to an appropriate equation, assuming no dissocia- tion to the monomeric form and using data at hemoglobin concentrations of 1 to 14 g/l. Gui- dotti’s dissociation constants and the values of
an empirical constant said to account for non- idealities, B*, are given in Table 1.
Surprisingly, few values of the dissociation constant Kl have been reported although sev- eral references refer to the fact that monomers are present at low concentrations. One study attempting to obtain both dissociation con- stants was by Hanlon et al. [ 211 in their treat- ment of bovine hemoglobin. Using sedimenta- tion data to calculate weight average molecular weights and assuming only tetramers and di- mers to be present, they obtained K2 dissocia- tion constants from 2.5 X 10e7 M at pH 7.1 to 1.00 x 10m3 M at pH 4.4 (They defined the dis- sociation differently so their actual values are the reciprocal of those given here). The disso- ciation constant Kl was then calculated, using trial and error techniques, at pH 4.4 and pH 4.6 using the value of K2 calculated previously. The constant Kl was estimated as 2.0 x 10m6 M for both pH values. The authors noted that the value of Kz was an order of magnitude lower than that obtained with human hemoglobin at similar conditions. They concluded that this, in part, could account for the failure of bovine hemoglobin to hybridize with other species. Two types of buffers were used in their studies, a phosphate buffer, 0.1 M (pH 7.1-6.0) and an acetate buffer, 0.25 M (pH 5.5-4.4). Measure- ments were made from 5°C to 8°C.
Dissociation data for both Kl and K2 under alkaline conditions are scarce. Three articles dealt with dissociation at high pH, those of Hasserodt and Vinograd [ 221, Rossi-Fellani et
TABLE 1
Dissociation constants for oxyhemoglobin in various so- lutions at pH 7.0,2O”C (Guidotti [ 171)
Solvent
(M)
0.4 MgC& 1.0 NaCl 2.0 NaCl
K, (MI
60.0x 1O-5 2.0x10⁻⁵
12.0x10⁻⁵
B* (mole-ml-g-2)
12.5x 1OV 16.8x1O-5 17.4x 1o-5
E.M. Trujillo/J. Membrane Sci. 69 (1992) 213-222 215
al. [ 151 and Kurihara and Shibata [ 231. All of these studies showed a decrease in the sedi- mentation constant from pH 9.5 to 10.5. At- tempts to elicit dissociation constants from the data were not made.
Mrabet et al. [ 241 studied the dissociation of dimers of human hemoglobins A and F into monomer subunits by a-chain exchange. Al- though the focus of their work was to determine kinetic dissociation rate constants, they re- ported an equilibrium dissociation constant of 4.7~10~~~ M at 25°C and pH 7.5 based on a literature value for the corresponding associa- tion constant.
Van den Berg et al. [25] studied the mono- mer-dimer equilibrium of /?-lactoglobulin and found good agreement between the measured osmotic pressures and theoretical models in- corporating association. Measurements were made at several concentrations and pH values. Equilibrium constants were calculated and compared with those obtained in the literature from sedimentation and light scattering experiments.
Several authors [ 26-281 have studied the as- sociation and dissociation of extracellular hemoglobins using techniques such as gel fil- tration, ultracentrifugation, gel electrophore- sis and fluorescence spectroscopy. Generally it was found that the dissociation increased as pH increased or decreased from neutrality and that the dissociation was greater at alkaline condi- tions than at acidic conditions, indicating a dif- ferent subunit dissociation for the two pH regimes.
The association or dissociation of proteins into subunits can be observed fairly easily and inexpensively in osmometry measurements, particularly if measurements are taken at sev- eral different concentrations and at several pH values. While the measurements are some- times tedious, the environment is relatively mild and information on very sensitive pro- teins can be obtained provided the shear-sen-
sitive nature of these proteins is taken into consideration. One of the objectives of this study was to investigate the ability of osmotic pressure measurements to indicate the amount of dissociation of a complex molecule such as hemoglobin which dissociates from a tetramer molecule into both dimer and monomer sub- units. Other objectives were to develop a math- ematical model describing total osmotic pres- sure as a function of the two dissociation constants and the total concentration and to obtain these dissociation constants as a func- tion of pH from experimental data using non- linear regression techniques.
Theory
Experimental osmotic pressure data are strongly affected by concentration. As stated earlier osmotic pressure versus concentration data can provide knowledge of the dissociation constants of hemoglobin under certain condi- tions. If one uses mass concentrations instead of molar concentrations, the total hemoglobin concentration, C,, is given by [ 211
c,=c,+c,+c,,+c, (4)
or in terms of the dissociation constants K1 and
KZ
+Gn&nl, mfcx+M~) +c
K1 MaMa ma +c
m/3 (5)
If we assume that the alpha and beta chains are approximately equivalent in molecular weight (M,=15,742 and MB=16,483, each with a heme group) and concentration and thus con- sider both monomer fractions the same, C,,= Cd, we have
co= 4ck 2c2 K:K2M;+KlMa
-J=+2c,, (6)
216 E.M. TrujillolJ. Membrane Sci. 69 (1992) 213-222
The concentration of the alpha chain monomer should be half the total monomer concentra- tion. Thus we can rewrite eqn. (6) in terms of a total monomer concentration, C,, as
co= ck -!z_ +c 4K;K,M;+2K,Ma m
(7)
or in terms of the monomer mass fraction,
fm=Crn/C0
for all roots of the above equation for fm and thus obtain a reasonable root for the monomer mass fraction. Once the monomer, dimer and tetramer mass fractions are found at any given total concentration for fixed values of K1 and K,, the total osmotic pressure, or reduced total osmotic pressure, can be calculated using
This fourth order equation, (eqn. 8), can be solved in a number of ways for the monomer mass fraction, fm, once the total concentration, C,, the molecular weight of the monomer, Mm, and the dissociation constants, Kl and K2, are fixed. The mass fractions fd and ft can then be calculated from fm using the definition of the dissociation constants. The problem with eqn. (8) is that four roots are possible; some of which can be imaginary but at least one of which should be real, depending on the values for C,, Mm, Kl and K2. Only casual reference to this problem has been found in the literature and when solutions were reported they were ob- tained from trial and error techniques. Avail- able mathematical programs are able to solve
TABLE 2
pH Dependent values used for nonlinear regression anaiy- sis of the dissociation of bovine hemoglobin in borate buffer at37”CasafunctionofpH
Monomer molecular weight (Da) = 16,125 RT at 37°C (l-cm H,O/gmole) = 2.628 X lo4
PH Ionic strength
(M)
Charge per tetramer molecule
7.4 0.743 - 10.6 7.9 0.728 - 14.8 8.3 0.698 - 17.3 8.7 0.643 - 19.4 9.1 0.500 -21.5
(10)
(11)
(12)
In the above equations, only the second viral coefficients for the monomer, dimer and tetra- mer, B,, Bd and &, respectively, have been used, higher order terms have been ignored. An ad- ditional contribution to the total osmotic pres- sure, eqn. (12), is the ideal Donnan contribu- tion as given by Van den Berg et al. [25] and Vilker et al. [ 291.
A nonlinear regression analysis was used to fit experimental data [reduced osmotic pres- sure vs. total concentration] to eqns. (8)- (13) at several different pH values. The best fit pa- rameters K1, K,, B,, Bd and B, were then ob- tained for given values (see Table 2 ) of RT, Mm, 2, and ionic strength, I.
Experimental
Osmotic pressures were measured with a Melabs Recording Osmometer (Model CSM-1 distributed by Wescan Instruments) equipped
E.M. TrujillolJ. Membrane Sci. 69 (1992) 213-222 211
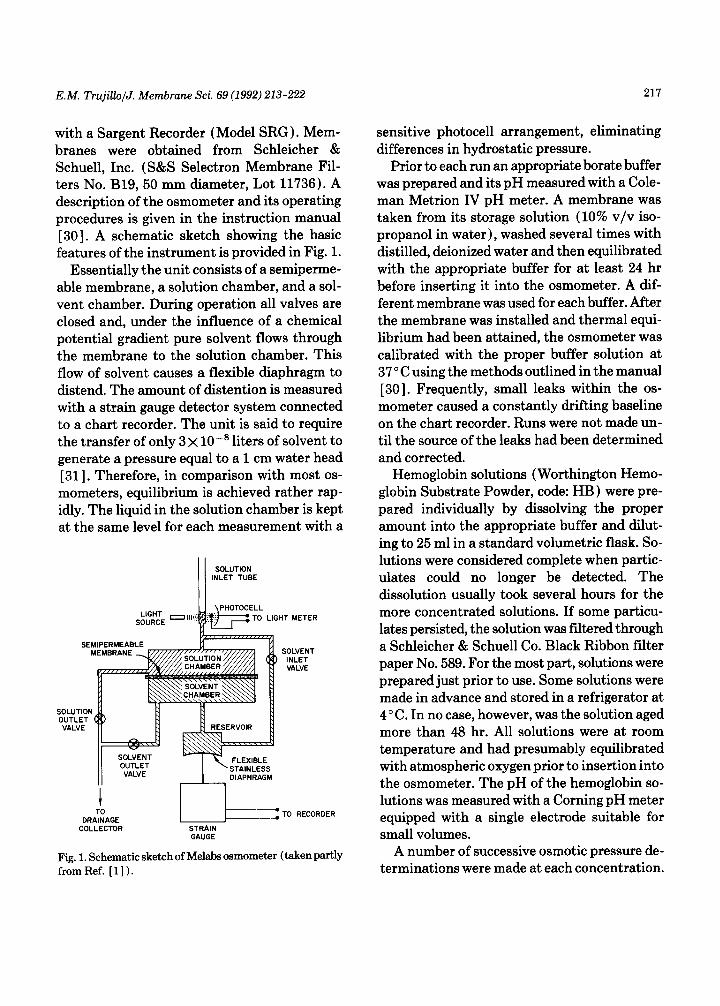
with a Sargent Recorder (Model SRG). Mem- branes were obtained from Schleicher & Schuell, Inc. (S&S Selectron Membrane Fil- ters No. B19, 50 mm diameter, Lot 11736). A description of the osmometer and its operating procedures is given in the instruction manual [30]. A schematic sketch showing the basic features of the instrument is provided in Fig. 1.
Essentially the unit consists of a semiperme- able membrane, a solution chamber, and a sol- vent chamber. During operation all valves are closed and, under the influence of a chemical potential gradient pure solvent flows through the membrane to the solution chamber. This flow of solvent causes a flexible diaphragm to distend. The amount of distention is measured with a strain gauge detector system connected to a chart recorder. The unit is said to require the transfer of only 3 x lo-* liters of solvent to generate a pressure equal to a 1 cm water head [ 311. Therefore, in comparison with most os- mometers, equilibrium is achieved rather rap- idly. The liquid in the solution chamber is kept at the same level for each measurement with a
(I SOLUTION INLET TUBE
LIGHT SOURCE
oli:ii
SEMIPERMEAB SOLVENT
INLET VALVE
TO DRAINAGE
1 ];TO RECORDER
COLLECTOR STRAIN GAUGE
Fig. 1. Schematic sketch of Melabs osmometer (taken partly fromRef. [l]).
sensitive photocell arrangement, eliminating differences in hydrostatic pressure.
Prior to each run an appropriate borate buffer was prepared and its pH measured with a Cole- man Metrion IV pH meter. A membrane was taken from its storage solution (10% v/v iso- propanol in water), washed several times with distilled, deionized water and then equilibrated with the appropriate buffer for at least 24 hr before inserting it into the osmometer. A dif- ferent membrane was used for each buffer. After the membrane was installed and thermal equi- librium had been attained, the osmometer was calibrated with the proper buffer solution at 37’ C using the methods outlined in the manual [30]. Frequently, small leaks within the os- mometer caused a constantly drifting baseline on the chart recorder. Runs were not made un- til the source of the leaks had been determined and corrected.
Hemoglobin solutions (Worthington Hemo- globin Substrate Powder, code: HB ) were pre- pared individually by dissolving the proper amount into the appropriate buffer and dilut- ing to 25 ml in a standard volumetric flask. So- lutions were considered complete when partic- ulates could no longer be detected. The dissolution usually took several hours for the more concentrated solutions. If some particu- lates persisted, the solution was filtered through a Schleicher & Schuell Co. Black Ribbon filter paper No. 589. For the most part, solutions were prepared just prior to use. Some solutions were made in advance and stored in a refrigerator at 4’ C. In no case, however, was the solution aged more than 48 hr. All solutions were at room temperature and had presumably equilibrated with atmospheric oxygen prior to insertion into the osmometer. The pH of the hemoglobin so- lutions was measured with a Corning pH meter equipped with a single electrode suitable for small volumes.
A number of successive osmotic pressure de- terminations were made at each concentration.
218
The true osmotic pressure was recorded when successive determinations differed by no more than 4-5%. Osmotic pressures could be read to within 0.04 cm for pressures from 5-10 cm; 0.20 cm for pressures from lo-50 cm; and to 0.40 cm for pressures 50-100 cm. Generally three or more determinations were made for each concentration.
Results and discussion
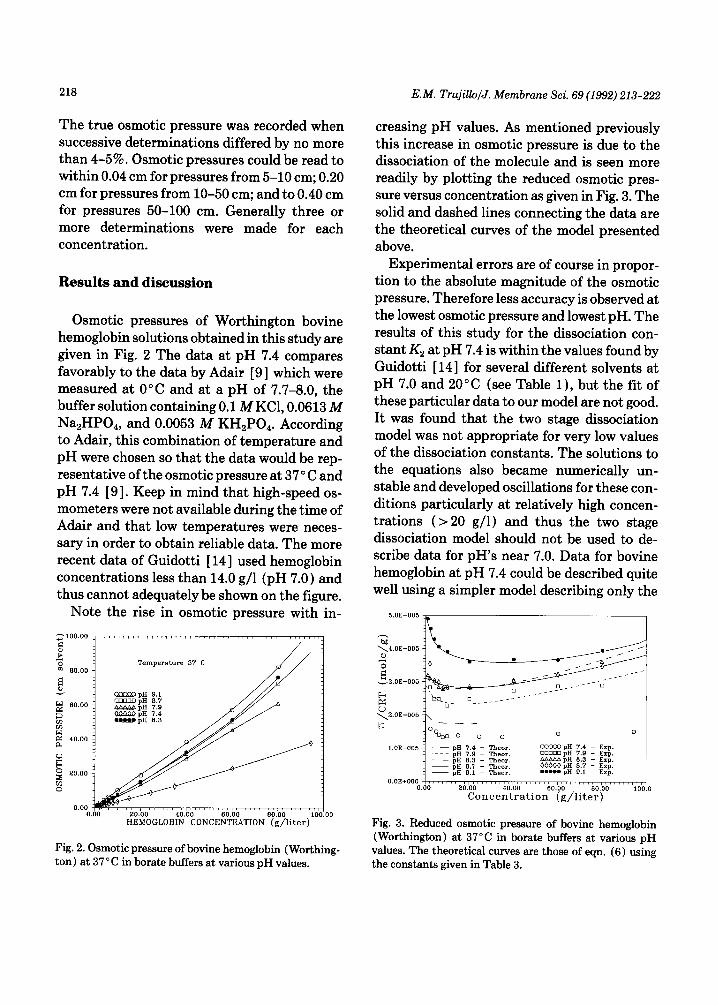
Osmotic pressures of Worthington bovine hemoglobin solutions obtained in this study are given in Fig. 2 The data at pH 7.4 compares favorably to the data by Adair [9] which were measured at 0” C and at a pH of 7.7-8.0, the buffer solution containing 0.1 MKCl, 0.0613 M Na,HPO,, and 0.0053 M KH,PO,. According to Adair, this combination of temperature and pH were chosen so that the data would be rep- resentative of the osmotic pressure at 37’ C and pH 7.4 [9]. Keep in mind that high-speed os- mometers were not available during the time of Adair and that low temperatures were neces- sary in order to obtain reliable data. The more recent data of Guidotti [ 141 used hemoglobin concentrations less than 14.0 g/l (pH 7.0) and thus cannot adequately be shown on the figure.
Note the rise in osmotic pressure with in-
0.00 0.00 20.00 40.00 60.00 00.00 100.00
HEMOGLOBIN CONCENTRATION (g/liter)
Fig. 2. Osmotic pressure of bovine hemoglobin (Worthing- ton) at 37 o C in borate buffers at various pH values.
E.M. Trujillo/J. Membrane Sci. 69 (1992) 213-222
creasing pH values. As mentioned previously this increase in osmotic pressure is due to the dissociation of the molecule and is seen more readily by plotting the reduced osmotic pres- sure versus concentration as given in Fig. 3. The solid and dashed lines connecting the data are the theoretical curves of the model presented above.
Experimental errors are of course in propor- tion to the absolute magnitude of the osmotic pressure. Therefore less accuracy is observed at the lowest osmotic pressure and lowest pH. The results of this study for the dissociation con- stant K2 at pH 7.4 is within the values found by Guidotti [ 141 for several different solvents at pH 7.0 and 20” C (see Table 1 ), but the fit of these particular data to our model are not good. It was found that the two stage dissociation model was not appropriate for very low values of the dissociation constants. The solutions to the equations also became numerically un- stable and developed oscillations for these con- ditions particularly at relatively high concen- trations ( > 20 g/l) and thus the two stage dissociation model should not be used to de- scribe data for pH’s near 7.0. Data for bovine hemoglobin at pH 7.4 could be described quite well using a simpler model describing only the
5.OE-005
xi \4.OE-005 m z E
v%OE-005
Fz +.OE-005
! -I
~:::~:li~~~~~~ ,,,,,, gkis&,;, 40.00 60.00 80.00 10
Concentration (g/liter)
Fig. 3. Reduced osmotic pressure of bovine hemoglobin (Worthington) at 37°C in borate buffers at various pH values. The theoretical curves are those of eqn. (6) using the constant-s given in Table 3.
E.M. Trujillo/J. Membrane Sci. 69 (1992) 213-222
dissociation of the tetramer to the dimer and assuming no dissociation of the dimer to the monomer. With this simpler model a value of 5.4 x 10m6 M was obtained for KZ.
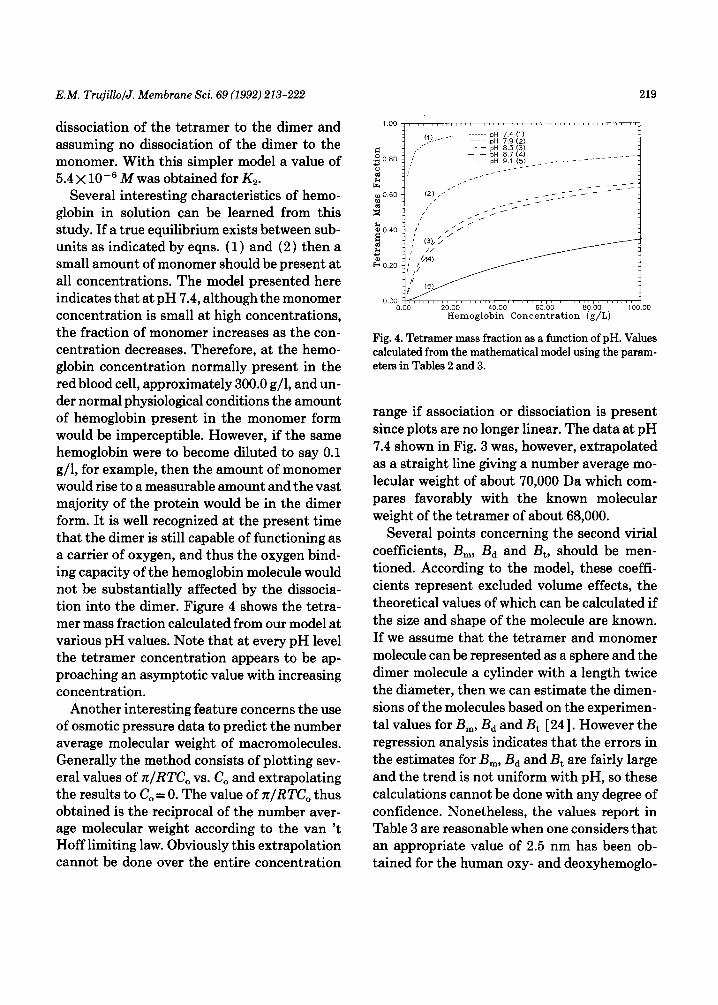
Several interesting characteristics of hemo- globin in solution can be learned from this study. If a true equilibrium exists between sub- units as indicated by eqns. (1) and (2) then a small amount of monomer should be present at all concentrations. The model presented here indicates that at pH 7.4, although the monomer concentration is small at high concentrations, the fraction of monomer increases as the con- centration decreases. Therefore, at the hemo- globin concentration normally present in the red blood cell, approximately 300.0 g/l, and un- der normal physiological conditions the amount of hemoglobin present in the monomer form would be imperceptible. However, if the same hemoglobin were to become diluted to say 0.1 g/l, for example, then the amount of monomer would rise to a measurable amount and the vast majority of the protein would be in the dimer form. It is well recognized at the present time that the dimer is still capable of functioning as a carrier of oxygen, and thus the oxygen bind- ing capacity of the hemoglobin molecule would not be substantially affected by the dissocia- tion into the dimer. Figure 4 shows the tetra- mer mass fraction calculated from our model at various pH values. Note that at every pH level the tetramer concentration appears to be ap- proaching an asymptotic value with increasing concentration.
Another interesting feature concerns the use of osmotic pressure data to predict the number average molecular weight of macromolecules. Generally the method consists of plotting sev- eral values of z/RTC, vs. Co and extrapolating the results to C, = 0. The value of n/RTC,, thus obtained is the reciprocal of the number aver- age molecular weight according to the van ‘t Hoff limiting law. Obviously this extrapolation cannot be done over the entire concentration
Fig. 4. Tetramer mass fraction as a function of pH. Values calculated from the mathematical model using the param- eters in Tables 2 and 3.
range if association or dissociation is present since plots are no longer linear. The data at pH 7.4 shown in Fig. 3 was, however, extrapolated as a straight line giving a number average mo- lecular weight of about 70,000 Da which com- pares favorably with the known molecular weight of the tetramer of about 68,000.
Several points concerning the second virial coefficients, B,, Bd and B,, should be men- tioned. According to the model, these coeffi- cients represent excluded volume effects, the theoretical values of which can be calculated if the size and shape of the molecule are known. If we assume that the tetramer and monomer molecule can be represented as a sphere and the dimer molecule a cylinder with a length twice the diameter, then we can estimate the dimen- sions of the molecules based on the experimen- tal values for B,, Bd and B, [ 241. However the regression analysis indicates that the errors in the estimates for B,, Bd and B, are fairly large and the trend is not uniform with pH, so these calculations cannot be done with any degree of confidence. Nonetheless, the values report in Table 3 are reasonable when one considers that an appropriate value of 2.5 nm has been ob- tained for the human oxy- and deoxyhemoglo-
220 E.M. TrujiUojJ. Membrane Sci. 69 (1992) 213-222
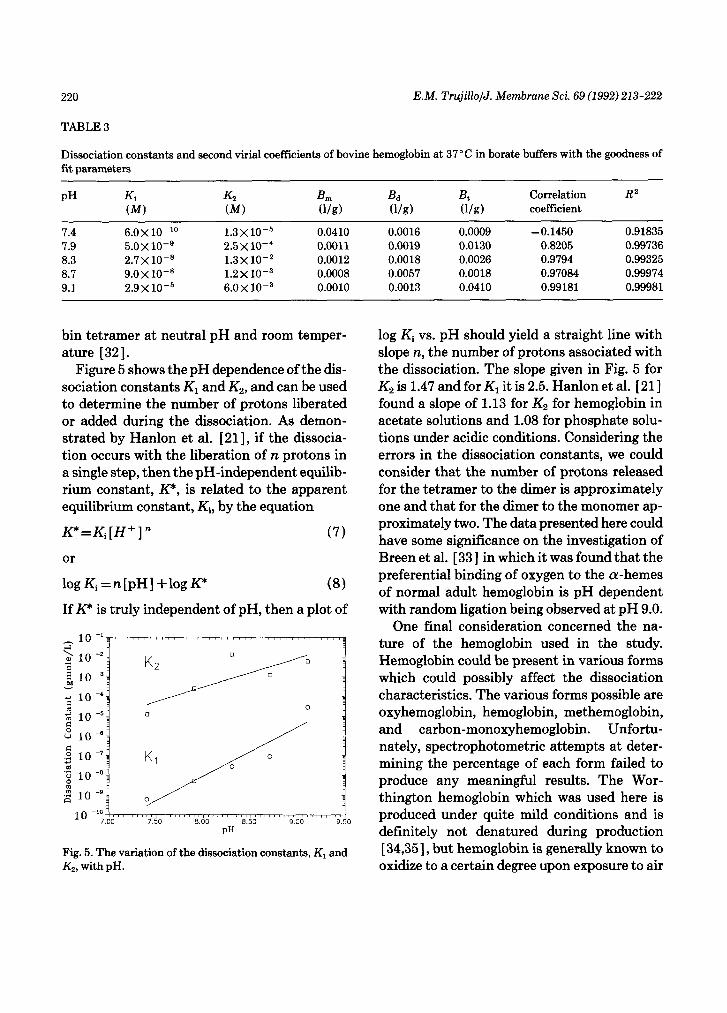
TABLE 3
Dissociation constants and second virial coefficients of bovine hemoglobin at 37°C in borate buffers with the goodness of fit parameters
PH
7.4 7.9 8.3 8.7 9.1
K K? & & & Correlation
(M) (Ml (l/g) (l/g) (l/g) coefficient
6.0x lo-” 1.3x10⁻⁵ 0.0410 0.0016 0.0009 -0.1450 5.0x 10⁻⁹ 2.5x 1O-4 0.0011 0.0019 0.0130 0.8205 2.7X 10-s 1.3 x 10⁻² 0.0012 0.0018 0.0026 0.9794 9.0x 10-s 1.2 x 10⁻³ 0.0008 0.0057 0.0018 0.97084 2.9x1o-5 6.0x 1O-3 0.0010 0.0013 0.0410 0.99181
R2
0.91835 0.99736 0.99325 0.99974 0.99981
bin tetramer at neutral pH and room temper- ature [ 321.
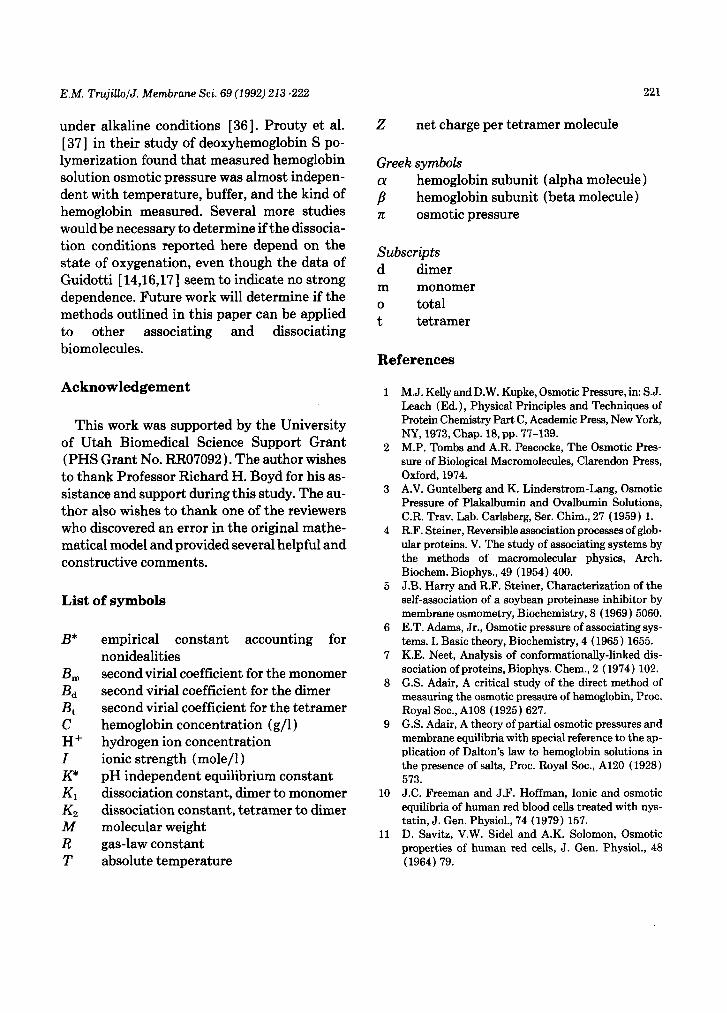
Figure 5 shows the pH dependence of the dis- sociation constants K1 and K,, and can be used to determine the number of protons liberated or added during the dissociation. As demon- strated by Hanlon et al. [ 211, if the dissocia- tion occurs with the liberation of n protons in a single step, then the pH-independent equilib- rium constant, KY, is related to the apparent equilibrium constant, Ki, by the equation
F=Ki[H+] n (7)
or
logKi=n[pH]+logK* (3)
If K* is truly independent of pH, then a plot of
~ 10 -1~“““““““““““““““““““‘~
10 -ial,““,,,‘l”“““‘,‘,““,“,‘,,“‘,.’,”,””,,l 7.00 7.50 8.00 8.50 9.00 9.50
PH
Fig. 5. The variation of the dissociation constants, K, and Kz, with pH.
log Ki vs. pH should yield a straight line with slope n, the number of protons associated with the dissociation. The slope given in Fig. 5 for K2 is 1.47 and for Kl it is 2.5. Hanlon et al. [ 211 found a slope of 1.13 for K2 for hemoglobin in acetate solutions and 1.08 for phosphate solu- tions under acidic conditions. Considering the errors in the dissociation constants, we could consider that the number of protons released for the tetramer to the dimer is approximately one and that for the dimer to the monomer ap- proximately two. The data presented here could have some significance on the investigation of Breen et al. [ 331 in which it was found that the preferential binding of oxygen to the cu-hemes of normal adult hemoglobin is pH dependent with random ligation being observed at pH 9.0.
One final consideration concerned the na- ture of the hemoglobin used in the study. Hemoglobin could be present in various forms which could possibly affect the dissociation characteristics. The various forms possible are oxyhemoglobin, hemoglobin, methemoglobin, and carbon-monoxyhemoglobin. Unfortu- nately, spectrophotometric attempts at deter- mining the percentage of each form failed to produce any meaningful results. The Wor- thington hemoglobin which was used here is produced under quite mild conditions and is definitely not denatured during production [ 34,351, but hemoglobin is generally known to oxidize to a certain degree upon exposure to air
EM. TrujillojJ. Membrane Sci. 69 (1992) 213-222
under alkaline conditions [36]. Prouty et al. [37] in their study of deoxyhemoglobin S po- lymerization found that measured hemoglobin solution osmotic pressure was almost indepen- dent with temperature, buffer, and the kind of hemoglobin measured. Several more studies would be necessary to determine if the dissocia- tion conditions reported here depend on the state of oxygenation, even though the data of Guidotti [ 14,16,17] seem to indicate no strong dependence. Future work will determine if the methods outlined in this paper can be applied to other associating and dissociating biomolecules.
Acknowledgement
This work was supported by the University of Utah Biomedical Science Support Grant (PHS Grant No. RR07092 ) . The author wishes to thank Professor Richard H. Boyd for his as- sistance and support during this study. The au- thor also wishes to thank one of the reviewers who discovered an error in the original mathe- matical model and provided several helpful and constructive comments.
List of symbols
B*
&Xl &I Bt C
H+ I K*
Kl & M R T
empirical constant accounting for nonidealities second virial coefficient for the monomer second virial coefficient for the dimer second virial coefficient for the tetramer hemoglobin concentration (g/l) hydrogen ion concentration ionic strength (mole/l) pH independent equilibrium constant dissociation constant, dimer to monomer dissociation constant, tetramer to dimer molecular weight gas-law constant absolute temperature
221
z net charge per tetramer molecule
Greek symbols
p*
hemoglobin subunit hemoglobin subunit
7r osmotic pressure
Subscripts d dimer m monomer 0 total t tetramer
References
(alpha molecule) (beta molecule)
1
2
3
4
5
9
10
11
M.J. Kelly and D.W. Kupke, Osmotic Pressure, in: S.J. Leach (Ed. ) , Physical Principles and Techniques of Protein Chemistry Part C, Academic Press, New York, NY, 1973, Chap. 18, pp. 77-139. M.P. Tombs and A.R. Peacocke, The Osmotic Pres- sure of Biological Macromolecules, Clarendon Press, Oxford, 1974. A.V. Guntelberg and K. Linderstrom-Lang, Osmotic Pressure of Plakalbumin and Ovalbumin Solutions, C.R. Trav. Lab. Carlsberg, Ser. Chim., 27 (1959) 1. R.F. Steiner, Reversible association processes of glob- ular proteins. V. The study of associating systems by the methods of macromolecular physics, Arch. Biochem. Biophys., 49 (1954) 400. J.B. Harry and R.F. Steiner, Characterization of the self-association of a soybean proteinase inhibitor by membrane osmometry, Biochemistry, 8 (1969) 5060. E.T. Adams, Jr., Osmotic pressure of associating sys- tems. I. Basic theory, Biochemistry, 4 (1965) 1655. K.E. Neet, Analysis of conformationally-linked dis- sociation of proteins, Biophys. Chem., 2 (1974) 102. G.S. Adair, A critical study of the direct method of measuring the osmotic pressure of hemoglobin, Proc. Royal Sot., A108 (1925) 627. G.S. Adair, A theory of partial osmotic pressures and membrane equilibria with special reference to the ap- plication of Dalton’s law to hemoglobin solutions in the presence of salts, Proc. Royal Sot., Al20 (1928) 573. J.C. Freeman and J.F. Hoffman, Ionic and osmotic equilibria of human red blood cells treated with nys- tatin, J. Gen. Physiol., 74 (1979) 157. D. Savitz, V.W. Side1 and A.K. Solomon, Osmotic properties of human red cells, J. Gen. Physiol., 48 (1964) 79.
222 E.M. Trujillo/J. Membrane Sci. 69 (1992) 213-222
12 A.K. Solomon, M.R. Toon and J.A. Dix, Osmotic properties of human red cells, J. Membrane Biol., 91 (1986) 259.
13 J. Vinograd and W.D. Hutchinson, Carbon-14 la- belled hybrids of hemoglobin, Nature, 187 (1960) 216.
14 G. Guidotti, Studies on the chemistry of hemoglobin. II. The effect of salts on the dissociation of hemoglo- bin into subunits, J. Biol. Chem., 242 (1967) 3685.
15 A. Rossi-Fanelli, E. Antonini and A. Caputo, Hemo- globin and myoglobin, in: C.B. Anfinsen, Jr. (Ed.), Advances in Protein Chemistry, Vol. 19, Academic Press, New York, NY, 1964, pp. 73-222.
16 G. Guidotti, Studies on the chemistry of hemoglobin. I. The reactive sulfhydryl groups, J. Biol. Chem., 242 (1967) 3673.
17 G. Guidotti, Studies on the chemistry of hemoglobin. III. The interactions of the a/l subunits of hemoglo- bin, J. Biol. Chem., 242 (1967) 3694.
18 H.R. Mahler and E.H. Cordos, Biological Chemistry, 2nd edn., Harper and Row, New York, NY, 1971, pp. 240.
19 K. Kawahara, A.G. Kirshner and C. Tanford, Disso- ciation of human CO-hemoglobin by urea, guanidine hydrochloride, and other reagents, Biochemistry, 4 (1965) 1203.
20 E. Antonini and M. Brunori, Hemoglobin, Ann. Rev. Biochem., 39 (1970) 977.
21 S. Hanlon et al., The dissociation of bovine hemoglo- bin at acid pH, Biochem. Biophys. Acta, 229 (1971) 359.
22 U. Hasserodt and J. Vinograd, Dissociation of human carbon monoxyhemoglobin at high pH, Proc. Natl. Acad. Sci. U.S., 45 (1959) 12.
23 K. Kurihara and K. Shibata, Dissociation of horse hemoglobin at high pH, Arch. Biochem. Biophys., 88 (1960) 298.
24 N.T. Mrabet et al., Dissociation of dimers of human hemoglobins A and F into monomers, J. Biol. Chem., 261 (1986) 1111.
25 G.B. Van den Berg, J.H. Hanemaaijer and C.A. Smol- ders, Ultrafiltration of protein solutions: the role of protein association in rejection and osmotic pressure, J. Membrane Sci., 31 (1987) 307.
26
27
28
29
30
31
32
33
34
35
36
37
G. Polidori et al., The dissociation of the extracellular hemoglobin of Tubifeex tubifex at extremes of pH and its reassociation upon return to neutrality, Arch. Biochem. Biophys., 233 (1984) 800. J.P. Harrington and R.E. Hirsch, Analysis of the acid and alkaline dissociation of earthworm hemoglobin, Lumbricus terrestris, by front-face fluorescence spec- troscopy, Biochim. Biophys. Acta, 1076 (1991) 351. M.G. Mainwaring et al., The dissociation of the extra- cellular hemoglobin of Lumbricus terrestris at acid pH and its reassociation at neutral pH, J. Biol. Chem., 261(1986)10899. V.L. Vilker, C.K. Colton and K.A. Smith, The os- motic pressure of concentrated protein solutions: Ef- fect of concentration and pH in saline solutions of bo- vine serum albumin, J. Colloid Interface Sci., 79 (1981) 548. Melabs Scientific Instruments, Recording Osmome- ter Operating and Maintenance Instruction, 1969. Burge, D., Personal communication, Wescan Instru- ments, 1974. E. Antonini and M. Brunori, Hemoglobin and myog- lobin in their reactions with ligands, in: A. Neuberger and E.L. Tatum (Eds.), Frontiers of Biology, North Holland Publishing Company, Amsterdam, 1971, Chap. 5, p. 101. J.J. Breen, D.A. Bertoli, J. Dadok and C. Ho, Proton magnetic resonance studies of human adult hemoglo- bin in water, Biophys. Chem., 2 (1974) 49. J. Soderman, Personal communication, Worthington Biochemical Corp., 1975. M.L. Anson, The estimation of pepsin, trypsin, pa- pain andcathepsin with hemoglobin, J. Gen. Physiol., 22 (1938) 79. R. Lemberg and J.W. Legge, Hematin Compounds and Bile Pigments, Interscience Publishers, New York, NY, 1949, p. 100-110. M.S. Prouty, A.N. Schechter and V.A. Parsegian, Chemical potential measurements of deoxyhemoglo- bin S polymerization. Determination of the phase dia- gram of an assembling protein, J. Mol. Biol., 184 (1985) 517.