Embed Size (px)
Citation preview

ISSN 1831-9343
Osh in figures: Annex to Report: Occupational Safety and Health
in the road transport sector: An overview
National Report: Belgium
TE
-RO
-10-001-EN
-N

Authors: Marthe Verjans, Veronique De Broeck, Nele Roskams, Karen Muylaert, Rik Op De Beeck, Prevent, Belgium
Edited and updated by Xabier Irastorza and Elke Schneider - European Agency for Safety and Health at Work (EU-OSHA)
This document is an annex to the Agency’s Report “OSH in figures - Occupational safety and health in the transport sector – an overview”
You can find the full report –in English only- on the Agency’s website: http://osha.europa.eu/en/publications/reports/transport-sector_TERO10001ENC/view
More information on the European Union is available on the Internet (http://europa.eu).
Cataloguing data can be found on the cover of this publication.
Luxembourg: Publications Office of the European Communities, 2011
ISBN -13: 978-92-9191-303-9
DOI: 10.2802/2218
© European Agency for Safety and Health at Work, 2011
Reproduction is authorised provided the source is acknowledged.

Work-related musculoskeletal disorders in the transport sector - Belgium
Table of contents
List of figures and tables....................................................................................................................... 1
1 Source description.......................................................................................................................... 3
1.1 Statistical sources ................................................................................................................. 3
1.2 Analytical sources ................................................................................................................. 5
2 Summary ........................................................................................................................................ 6
2.1 Contextual features ............................................................................................................... 6
2.2 Exposure to risks................................................................................................................... 6
2.3 Health outcomes ................................................................................................................... 7
3 Statistical and analytical data collection on Transport ................................................................... 8
3.1 Contextual features ............................................................................................................... 8
3.2 Exposure to risks................................................................................................................. 20
3.3 Health outcomes ................................................................................................................. 32
3.4 Legislation and policies ....................................................................................................... 38
List of figures and tables
Figure 1: Employment in transport in number (1000) and percentage share in total, 15-64 years, 1995-2006 ............................................................................................................................ 9
Figure 2: Percentage distribution of employment transport, by sub sectors, 15-64 years, 1995-2006 ............................................................................................................................ 9
Figure 3: Percentage distribution of enterprises by number of employees. Transport and overall economy, 2007................................................................................................................... 11
Figure 4: Percentage distribution of employment in transport, by gender, 15-64 years, 1995-2006 . 12
Figure 5: Percentage distribution of employment by gender and transport sub sector, 15-64 years, 2004-2006 .......................................................................................................................... 13
Figure 6: Percentage distribution of employment by age, transport and total, 1995 and 2006.......... 15
Figure 7: Percentage distribution of employment in transport, by age and gender, LFS 1995-2006 16
Figure 8: Percentage share of self-employed workers in transport in total self-employed, 1999-2005 .......................................................................................................................... 17
Figure 9: Percentage share of part-time employement in transport and the total, 1995-2006........... 18
Figure 10: Overview of physical work factors. Percentage share of workers reporting always being exposed to risk factors, transport and Flemish average, 2004 ................................ 23
Figure 11: Working with computers - Repetitive hand and arm movements, 2004 ........................... 28
Figure 12: Overview – Work organisation: percentage share of workers reporting these factors as ‘problematic’, 2004 ........................................................................................................ 28
EU-OSHA – European Agency for Safety and Health at Work 1
Work-related musculoskeletal disorders in the transport sector - Belgium
Table 1: Number of employers by size of the enterprises, 2001-2007, RSZ ..................................... 11
Table 2: Employment by gender (1000) and transport sub sector, 15-64 years, LFS 1995-2006..... 12
Table 3: Employment by age (1000), LFS 1995-2006 ....................................................................... 14
Table 4: Employment in transport by age and gender (1000), 1995-2006......................................... 15
Table 5: Number of self-employed workers in transport and in total economy, 1999-2005............... 16
Table 6: Number of part-time workers in transport (1,000), 1995-2006 ............................................. 18
Table 7: Transport in goods, 1999-2005, FOD Economie - Algemene Directie Statistiek & NMBS .. 19
Table 8: How often do you face vibrating tools and machines at work? WBM, 2004 ........................ 20
Table 9: How often do you face uncomfortable/ tense working positions at work? WBM, 2004 ....... 20
Table 10: How often do you face physically arduous tasks while you are working? WBM, 2004...... 21
Table 11: How often do you face noise nuisance while you are working? WBM, 2004..................... 21
Table 12: How often do you face extreme temperatures while you are working? WBM, 2004.......... 22
Table 13: How often are you exposed to dangerous substances at work? WBM, 2004.................... 23
Table 14: How often do you face working with computer while you are working? WBM, 2004......... 24
Table 15: How often do you face repetitive hand/arm movements at work? WBM, 2004 ................. 25
Table 16: Work pressure, WBM, 2004 ............................................................................................... 25
Table 17: Autonomy, WBM, 2004....................................................................................................... 26
Table 18: Routine job, WBM, 2004..................................................................................................... 26
Table 19: Learning opportunities by age, WBM, 2004 ....................................................................... 26
Table 20: Work-life balance, WBM, 2004........................................................................................... 27
Table 21: Support from the immediate management, WBM, 2004 .................................................... 27
Table 22: Night work, WBM 2004....................................................................................................... 29
Table 23: Working overtime, WBM 2004............................................................................................ 29
Table 24: How often have you faced physical violence at work in the last 12 months?, WBM, 2004.................................................................................................................................... 30
Table 25: How often have you faced sexual harassment at work in the last 12 months? WBM, 2004.................................................................................................................................... 31
Table 26: How often have you faced mobbing at work in the last 12 months? WBM, 2004 .............. 31
Table 27: Reported occupational accidents, 2000-2004.................................................................... 32
Table 28: Number of severe accidents and severity rate by sector, 2000-2004................................ 33
Table 29: Number of recognised occupational diseases in the transport sector, pathology and cause, 2001-2005, FBZ...................................................................................................... 34
Table 30: Number of occupational diseases by pathology in transport, 2001-2005, FBZ ................. 35
Table 31: Number of recognised occupational diseases by gender and age, 2001-2005, FBZ ........ 36
Table 32: Musculoskeletal disorders, in %, 2004 ............................................................................... 36
Table 33: Have you experienced emotional problems such as anxiety, depression, irritability or feeling down in the last two weeks? WBM 2004................................................................ 37
EU-OSHA – European Agency for Safety and Health at Work 2

Work-related musculoskeletal disorders in the transport sector - Belgium
1 Source description
1.1 Statistical sources
Title European Union Labour Force Survey
Acronym LFS
Institution Eurostat, Statistical Office of the European Communities
Country EU
Periodicity 1983-…
Type Household Survey
URL Figures available on: www.epp.eurostat.ec.europa.eu
The European Union labour force survey Methods and definitions – 2001
http://www.mmo.gr/pdf/library/Data issues/KS_BF_03_002____N_EN.pdf
Coverage GEOGRAPHICAL COVERAGE
The EU-LFS covers all the territories of the Member States of the European Union, the EFTA countries, as well as Bulgaria and Romania. In case of Cyprus, however, the data only refer to the territory under the control of the Government of the Republic of Cyprus.
INDUSTRIAL AND OCCUPATIONAL COVERAGE
The EU-LFS covers all industries and occupations.
POPULATION COVERAGE
The EU-LFS covers the total population usually residing in Member States, except persons living in collective or institutional households. While demographic data are gathered for all age groups, questions relating to labour market status are restricted to persons in the age group 15 years or older except for Spain, the United Kingdom and Iceland where this age limit is 16 years. In Denmark, Estonia, Latvia, Hungary, Finland, Sweden, Iceland and Norway questions on the labour market characteristics are also restricted to those younger than 75 years of age. In the EFTA countries, Iceland, Norway and Switzerland, population data are not provided for the age-groups outside the scope of labour market questions.
TOPICAL COVERAGE
The EU-LFS is organised in thirteen modules, covering demographic background, labour status, employment characteristics of the main job, hours worked, employment characteristics of the second job, time-related underemployment, search for employment, education and training, previous work experience of persons not in employment, situation one year before the survey, main labour status, income and technical items relating to the interview.
Content The European Union Labour Force Survey (EU-LFS) provides population estimates for the main labour market characteristics, such as employment, unemployment, inactivity, hours of work, occupation, economic activity and much else as well as important socio-demographic characteristics, such as sex, age, education, households and regions of residence.
The division of the population into employed persons, unemployed persons and inactive persons follows the ILO definition. Other concepts also follow broadly the recommendations of ILO.
EU-OSHA – European Agency for Safety and Health at Work 3

Work-related musculoskeletal disorders in the transport sector - Belgium
Title Vlaamse werkbaarheidsmonitor (Flemish Workability Monitor)
Acronym WBM Institution SERV, STV- Innovatie & Arbeid Country Belgium (Flanders) Periodicity 2004-2007-2010 Type Employee Survey URL http://www.serv.be/uitgaven/603.pdf Demographic group
Salaried employees residing in the Flemish Region
Objectives A representative and accurate look at the quality of work on the Flemish labour market. The Survey provides an opportunity to monitor working conditions in Flanders and to analyse specific themes in depth, such as: sector differences, working conditions and gender, age, employment contracts, etc.
Description Written survey of 20,000 Flemish employees Content This survey describes a broad range of questions in the field of working
conditions.
Title Statistieken Beroepsziekten (Occupational diseases statistics)
Institution Occupational Diseases Fund Country Belgium Periodicity Every year Type Statistics (absolute figures) URL http://fmp-fbz.fgov.be/ Demographic group
All workers except self-employees
Objectives Refund damage caused by occupational diseases and prevention of these diseases
Description Reporting occupational diseases by the physician Content Statistics of prevalence of occupational diseases
Title Annual Report of Fund for Occupational Accidents
Institution Fund for Occupational Accidents (FAO) Country Belgium Periodicity Annual report URL http://fat.fgov.be/site_fr/stats_etudes/stats_etudes.html
Description The database of the Fund for Occupational Accidents, which was established by the
royal decree of 16 December 1987, publishes statistics on occupational accidents in the
private sector every year. The royal decree of 19 April 1999 gave the Fund the additional
task of setting up a database for occupational accidents in the public sector, starting in
2000. Previously, statistics about occupational accidents in the private sector had been
published by the National Institute for Statistics (NIS).
Demographic group
The data for these statistics come from the insurance companies. However, it should be
pointed out that information about the administrative follow-up of accidents
(compensation for temporary incapacity for work, determination of permanent incapacity)
has not always been obtained at the same time.
Thus the NIS used the accident information that was known on 31 December of the year
following the year in which the accident had occurred. Since 1996, the Fund for
Occupational Accidents has published statistics on the basis of information about the
follow-up of accidents by the insurer, as known on 31 December of the year of the
accident.
EU-OSHA – European Agency for Safety and Health at Work 4

Work-related musculoskeletal disorders in the transport sector - Belgium
1.2 Analytical sources
Title Workable Work sector profile – Transport
Editor SERV
Country Belgium
Time 2005
URL http://www.serv.be/dispatcher.aspx?page_ID=50-00-00-00-004
Summary In the Vilvoorde Pact, the Flemish government and the social partners agreed that they want to work to ensure not just that more people of working age have a proper job, but also that the quality of jobs (the workability level) improves. In order to identify this quality or workability level statistically, STV-Innovatie & Arbeid developed the ‘workability monitor’. In 2004, a first measurement (involving a written questionnaire) was conducted among a representative sample of Flemish wage-earners. Subsequent measurements are scheduled for 2007 and 2010. In this note, we compile the key data for transport under seven headings.
TOC 1. Workability level
2. Workability problem areas
3. Workability risks in the working situation
4. Risk profile for work-related stress
5. Risk profile for motivation problems
6. Risk profile for insufficient learning opportunities
7. Risk profile for problematic work-life balance
8. Conclusion
Title The working and employment conditions of the sector road transport of
goods in Belgium
Editor Prevent (prepared for European Foundation for the Improvement of Living and Working Conditions)
Country Belgium
Time 2003
URL /
Summary In this report, the working and employment conditions of road transport of goods (60.24) in Belgium are described.
Title Implementation and effect of an intervention study in truckers with an important health risk.
Editor Katholieke Hogeschool Kempen, Departement Gezondheidszorg en Chemie
Country Belgium
Time 2007
Summary This study project fits in a four-year research, of which this research is the third.
In the research, the factors were examined to the prevention of O.S.A.S. of
truckers.
EU-OSHA – European Agency for Safety and Health at Work 5

Work-related musculoskeletal disorders in the transport sector - Belgium
2 Summary
2.1 Contextual features
In 2006, about 163,000 Belgian workers were employed in the transport sector, representing 3.9% of employment in the whole economy. This proportion has remained stable in the last 10 years. Land transport is by far the largest transport sub sector in Belgium. The globalisation of this market results in an increase in the distance between production and consumer, the main consequence being a larger geographic spread, a bigger logistic circle and, consequently, an increase in international transport. Being a small country, international transport is very important in Belgium. In this sense, in terms of forwarded ton-kilometers, international transport clearly outnumbers national transport.1 Transport is made up mainly of male workers (85% in 2006), but the number and proportion of female workers is increasing since 1995. The gender difference is not as big in all sub sectors. For instance, the share of female workers is highest in air transport (33% in 2006), followed by transport over water (20% in 2006) and land transport (13% in 2006). Therefore attention should be focused on those factors hindering female work as drivers: difficulties in combining work and family, the high physical load and the lack of female friendly facilities.2 The highest number and proportion of workers in transport can be found in the age category 25-49 years, followed by the age category 50-64 and young workers. The number/proportion of workers in the age category 25-49 years has decreased since 1995, while those in the age category 50-64 years increased. In 2006, about one out of ten transport workers were working part-time in comparison with about one out of five within the total working population. In any case, part-time work in transport has increased remarkably during the last decade.
2.2 Exposure to risks
Road safety is the most often mentioned physical environment risk but there are several other safety risks in the transport sector. In terms of physical strain, exposure to vibrating tools/machines and noise nuisance at work form the highest risk for transport workers. According to WBM 2004, one out of four transport workers reports always being exposed to vibrating tools/machines at work, while almost one out of five reports always being exposed to noise nuisance at work. These exposure rates are significantly higher than the average Flemish working population. Transport workers also report higher than average exposure to other physical risk factors such as uncomfortable or tense working positions, physically arduous tasks, extreme temperatures and dangerous substances.
1 SERV, Onderzoek naar de kwalificatiebehoeften voor vrachtwagenchauffeur, Brussel: Sociaal-Economische Raad van
Vlaanderen, 1998. 2 European Foundation for the Improvement of Living and Working Conditions, EU road freight transport sector: Work and
employment conditions – Belgian Survey, 2003
EU-OSHA – European Agency for Safety and Health at Work 6

Work-related musculoskeletal disorders in the transport sector - Belgium
According to WBM 2004 too, transport workers report less computer work and more repetitive hand/arm movements than the average Flemish working population. However, both the content and workload of employees in transport is changing following the introduction of a number of computer applications such as planning systems and mobile means of communication. In terms of work organisation, pace of work represents the highest risk for transport workers followed by learning opportunities, autonomy and routine job content. Work-life balance and support from the immediate management are reported next. Due to the increase in international transport, the job content of truck drivers has changed considerably and knowledge of road codes and planning has become more important. Due to technological improvements, trucks are better equipped and more comfortable but drivers need to know how to use automated systems like on-board computers, digital tachographs or other telematic equipment. These systems may become increasingly complicated, leading to the need of extra education and training.3
Irregular working time patterns i.e. night work and working overtime are common in the transport sector and they represent a risk factor. In this sense, statistics reveal that 45% of deadly accidents happen at night, when there is less traffic. Regarding the total number of injured people, only 18% take place at night by which it can be concluded that if an accident occurs at night, the risk for a serious accident is much higher4. According to WBM 2004, about 29.7% of transport workers report work stress, slightly higher than the average: 28.9%. According to a study conducted by the Belgian Workers Transport Union (BTB-ABVV) the following were considered the most stressful factors in freight transport by road: responsibility for material, lack of involvement, traffic legislation, other drivers and aggressions, quality requirements and unsafe working conditions.5 About 71% of truck drivers consider aggression of other drivers or passengers as an extra burden for their job and 69% are annoyed by the behaviour of other drivers. A specific issue on violence is the increasing number of truck thefts.
2.3 Health outcomes
According to the Fund for Occupational Accidents, in 2004 about 8,665 accidents occurred within the land transport sector, 927 of them severe accidents. These figures represented approximately 9.1% and 7.8% of the total number of occupational accidents and severe accidents, respectively. In recent years, a downward trend has been observed in the number of (severe) occupational accidents. The occurrence of occupational accidents in land transport is higher than the average and so is the number of lost working days due to occupational accidents. A sectoral overview shows that the number and severity of occupational accidents is highest in construction and manufacturing of wood and metal, followed by transport. Bone, discus and joint pathologies represent the largest part of the recognised occupational diseases in transport: 74.62%. The causes of this type of pathology are mechanical vibrations and the body part most affected is the back. Most of the recognised occupational diseases correspond to workers aged 45-54 years old, followed by those in the 55-64 and 35-44 age groups.
3 SERV, Flexibilisering van werk- en levertijden in het goederenvervoer: een aanbeveling van de Sectoriële Commissie
Goederenvervoer, Brussel: Sociaal-economische Raad van Vlaanderen, 1999. 4 BIVV, Jaarverslag 2000: Verkeersveiligheid, 2000. 5 ABVV-BTB, Wegwijs april/mei/juni 2002, 2002.
EU-OSHA – European Agency for Safety and Health at Work 7

Work-related musculoskeletal disorders in the transport sector - Belgium
3 Statistical and analytical data collection on Transport
3.1 Contextual features
The transport sector covered in this report refers to the following NACE codes. NACE 60: Land transport; transport via pipelines
601 Rail transport 602 Road transport
6021 + 6022 + 6023 = Transport of persons 6024 = Freight transport by road
603 Transport through pipes NACE 61: Transport over water
611 Transport overseas 612 Inland navigation
NACE 62: Air transport
3.1.1 General prevalence – Employment
In 2006, about 163,000 Belgian workers were employed in the transport sector. This number has increased since 1995.
The share of transport in the whole economy accounts for about 3.9%, this proportion having remained stable the last 10 years.
Land transport is the sub sector with the highest number of workers. In 2006, about 88% of workers in transport were employed in land transport; about 15% were employed in air transport and only 5% in the transport over water.
The number of employees in the different sub sectors fluctuated little over the last 10 years. The number of employees in land transport and air transport has increased since 1995 while in transport over water it has decreased.
In 2006, about 163,000 Belgian workers were employed in the transport sector, representing 3.9% of employment in the whole economy. The number of workers employed in this sector has increased over the past 10 years by over 14,000. Also within the total working population, the number of employed workers has increased the last years: 463,500 between 1995 and 2006. The share of transport within the whole economy has remained stable in the last 10 years.
EU-OSHA – European Agency for Safety and Health at Work 8

Work-related musculoskeletal disorders in the transport sector - Belgium
Figure 1: Employment in transport in number (1000) and percentage share in total, 15-64 years, 1995-2006
149 152 151
143
177
165 164 164 164158
163167
4.0 4.0
3.7
4.1 4.1 4.14.0
3.83.9
4.0
4.1
4.5
100
110
120
130
140
150
160
170
180
190
200
1995 1996 1997 1998 1999 2000 2001 2002 2003 2004 2005 2006
3.5
3.7
3.9
4.1
4.3
4.5
4.7
4.9
Number (1,000) % Share in total
Source: LFS547 – Web Annex - Belgium
LFS data allow distinguishing the three sub sectors within transport: land transport (NACE 60), which that includes rail and road transport (of both people and goods), transport over water (NACE 61), including inland navigation and overseas transportation, and air transport (NACE 62). Land transport is the sub sector with the highest number of workers. In 2006, 143,000 of the total 163,000 workers in transport worked in land transport. About 15,000 were employed in air transport while about 5,000 worked in transport over water. This means that about 88% of workers in transport were employed in the land transport, 15% in air transport and only 5% in transport over water. The number of employees in the different sub sectors has fluctuated little over the last 10 years. Table 2 shows that the number of employees in land transport and air transport has increased since 1995 -13,000 and 3,000, respectively-, while transport over water has seen a drop of 2,000 workers.
Figure 2: Percentage distribution of employment transport, by sub sectors, 15-64 years, 1995-2006
87.2 83.6 84.8 82.5 79.187.4
81.286
90.285.4 89.2 87.7
4.7 5.9 4 4.9 5.6 2.4 4.8 3.7 4.9 3.7 2.5 3.18.1 11.2 10.6 12.6 15.3
10.2 13.99.8
4.911 8.9 9.2
0
10
20
30
40
50
60
70
80
90
100
1995 1996 1997 1998 1999 2000 2001 2002 2003 2004 2005 2006
60 Land transport, transport via pipelines61 Transport over w ater62 Air transport
Source: LFS
EU-OSHA – European Agency for Safety and Health at Work 9

Work-related musculoskeletal disorders in the transport sector - Belgium
3.1.2 Analytical information – TRANSAM study: changes between occupations in transport of goods
The Social Fund for Transport of Goods carried out a study on the transport sector, ‘TRANSAM’ 6, which includes both quantitative as qualitative data. Some findings on reasons why people change jobs were the following:
According to the employers:
Increase in inspections, penalties;
Too low wages;
Strict rules of driving and resting times;
According to the drivers:
Better wages or conditions in new job (often within the sector);
Better or new truck;
Shorter working hours in new job.
It was found that for non-driving occupations, people move to another sector -only 23% stay in transport-, whereas for drivers, people change jobs within the sector (70%). Those who change sector give the following reasons:
Work pressure;
Long working days;
Social circumstances (work/family balance);
Lack of respect;
Low wages.
3.1.3 Size of the enterprises
As within the total workforce, most enterprises in transport and supportive activities -about 95% of them in 2007-, are small (less than 50 employees).
Most enterprises in transport and supportive activities are small. In 2007, about 52% of them employed less than 5 people, about 18% employed between 5 and 9 workers, 13% employed between 10 and 19 employees and about 12% employed between 20 and 49 people. Therefore, about 95% of transport enterprises in Belgium are small, employing less than 50 workers. Also in the overall economy most enterprises are small. In 2007, about 68% of employers employed less than 5 people, about 15% employed between 5 and 9 workers, about 8% employed between 10 and 19 people and about 6% employed between 20 and 49 workers. So, about 97% of Belgian enterprises are small, employing less than 50 people.
6 ECWS, TRANSAM: arbeidsmarktstudie m.b.t. de sector goederenvervoer en –behandeling voor rekening van derden, in
opdracht van het Sociaal Fonds voor het goederenvervoer: Brussel, 2001.
EU-OSHA – European Agency for Safety and Health at Work 10

Work-related musculoskeletal disorders in the transport sector - Belgium
Table 1: Number of employers by size of the enterprises, 2001-2007, RSZ
Transport and supportive activities
< 5 5-9 10-19 20-49 50-99 100-199 200-499 500-999 > 1000 Total
2002 4.101 1.483 1.111 972 236 88 39 13 10 8.053
2003 4.224 1.495 1.132 980 260 92 39 13 10 8.245
2004 4.290 1.500 1.146 993 269 103 34 12 11 8.358
2005 4.243 1.507 1.171 986 281 109 38 14 10 8.359
2006 4.287 1.510 1.124 996 288 100 44 15 10 8.374
2007 4.263 1.540 1.126 1.033 269 112 46 17 10 8.416
Total
< 5 5-9 10-19 20-49 50-99 100-199 200-499 500-999 > 1000 Total
2002 146.084 31.041 17.406 11.722 3.226 1.549 937 298 235 212.498
2003 148.243 31.059 17.254 11.703 3.275 1.525 953 297 238 214.547
2004 149.056 31.412 17.534 11.850 3.267 1.537 950 300 238 216.144
2005 149.108 32.193 17.851 12.000 3.345 1.581 983 300 248 217.609
2006 149.153 32.465 17.820 12.201 3.443 1.618 974 312 255 218.241
2007 150.240 33.041 18.128 12.451 3.574 1.659 1.012 310 262 220.677
Source: http://www.onssrszlss.fgov.be/Onssrsz/NL/Statistics/Brochures/Beige/beige_home.htm
Figure 3: Percentage distribution of enterprises by number of employees. Transport and overall economy, 2007
50.7
18.313.4 12.3
3.2 2.2
68.1
15.08.2 5.6
1.6 1.50
10
20
30
40
50
60
70
80
< 5 5-9 10-49 20-49 50-99 >100
Transport Total
Source: RSZ, http://www.onssrszlss.fgov.be/Onssrsz/NL/Statistics/Brochures/Beige/beige_home.htm
EU-OSHA – European Agency for Safety and Health at Work 11
Work-related musculoskeletal disorders in the transport sector - Belgium
3.1.4 Distribution by gender
Transport is mostly made up of male workers: in 2006, about 85% of workers were male. However, the proportion/number of female workers is increasing since 1995.
There are more male workers across all sub sectors, but the gender difference is not as big in all of them. The proportion of female workers is highest in air transport (33% in 2006), followed by transport over water (20% in 2006) and land transport (13% in 2006).
The proportion of female workers has increased in all sub sectors since 1995.
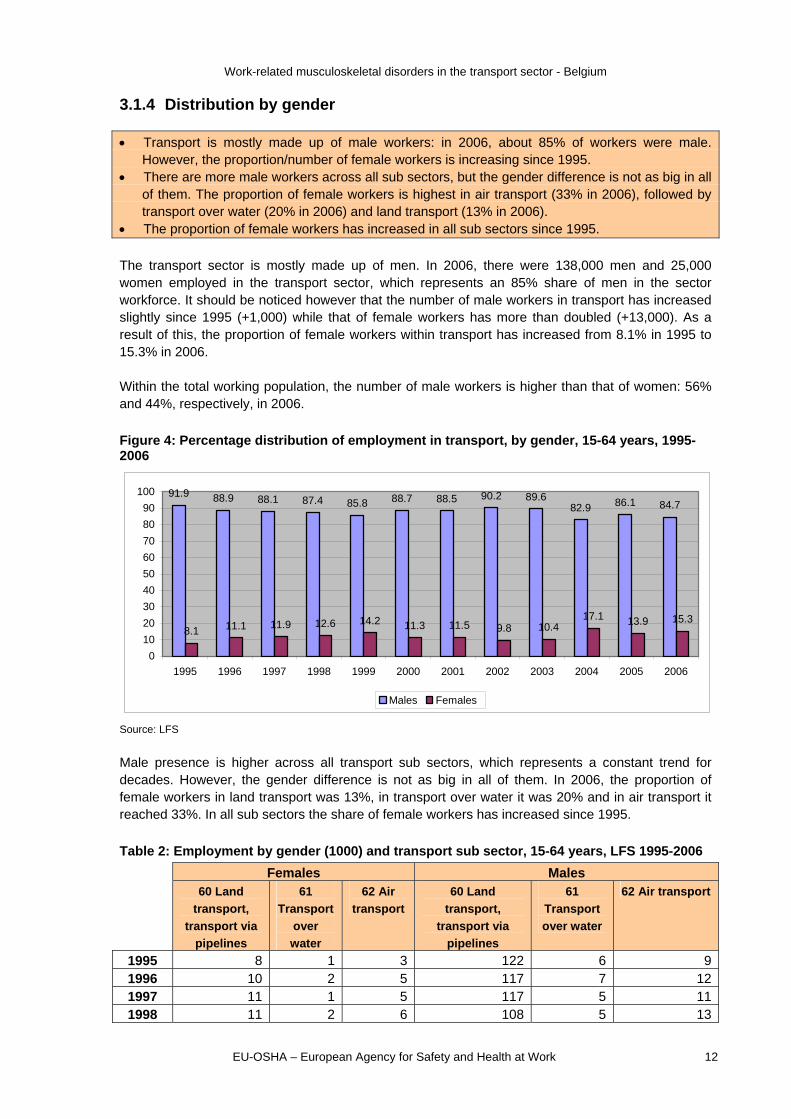
The transport sector is mostly made up of men. In 2006, there were 138,000 men and 25,000 women employed in the transport sector, which represents an 85% share of men in the sector workforce. It should be noticed however that the number of male workers in transport has increased slightly since 1995 (+1,000) while that of female workers has more than doubled (+13,000). As a result of this, the proportion of female workers within transport has increased from 8.1% in 1995 to 15.3% in 2006. Within the total working population, the number of male workers is higher than that of women: 56% and 44%, respectively, in 2006.
Figure 4: Percentage distribution of employment in transport, by gender, 15-64 years, 1995-2006
91.9 88.9 88.1 87.4 85.8 88.7 88.5 90.2 89.682.9 86.1 84.7
8.1 11.1 11.9 12.6 14.2 11.3 11.5 9.8 10.417.1 13.9 15.3
0
10
20
30
40
50
60
70
80
90
100
1995 1996 1997 1998 1999 2000 2001 2002 2003 2004 2005 2006
Males Females
Source: LFS
Male presence is higher across all transport sub sectors, which represents a constant trend for decades. However, the gender difference is not as big in all of them. In 2006, the proportion of female workers in land transport was 13%, in transport over water it was 20% and in air transport it reached 33%. In all sub sectors the share of female workers has increased since 1995.
Table 2: Employment by gender (1000) and transport sub sector, 15-64 years, LFS 1995-2006
Females Males 60 Land
transport,
transport via
pipelines
61
Transport
over
water
62 Air
transport
60 Land
transport,
transport via
pipelines
61
Transport
over water
62 Air transport
1995 8 1 3 122 6 91996 10 2 5 117 7 121997 11 1 5 117 5 111998 11 2 6 108 5 13
EU-OSHA – European Agency for Safety and Health at Work 12

Work-related musculoskeletal disorders in the transport sector - Belgium
Females Males 60 Land 61 62 Air 60 Land 61 62 Air transport
transport, Transport transport transport, Transport
transport via over transport via over water
pipelines water pipelines
1999 12 4 10 128 6 172000 14 - 5 132 4 122001 10 2 6 123 6 162002 12 - 4 129 6 122003 15 - 3 133 8 62004 19 1 8 121 4 102005 17 1 5 124 3 92006 19 1 5 124 4 10
Source: LFS
Figure 5: Percentage distribution of employment by gender and transport sub sector, 15-64 years, 2004-2006
13.6
86.4
20.0
80.0
44.4
55.6
12.1
87.9
25.0
75.0
35.7
64.3
13.3
86.7
20.0
80.0
33.3
66.7
0
10
20
30
40
50
60
70
80
90
100
Females Male Females Male Females Male
60 Land transport, transport viapipelines
61 Transport over water 62 Air transport
2004 2005 2006
Source: LFS
3.1.4.1 Analytical information – TRANSAM study: Gender difference in transport of goods
The ‘TRANSAM’7 study also covers gender differences. According to the employers, the main reasons why there are not many female drivers in transport of goods are the following:
Difficulty in combining work and family: 73.4%.
Too high physical burden: 26.4%.
Long time away from home: 23.2%.
Female workers mention another important aspect: the lack of female friendly facilities, such as toilet infrastructures at rest areas.
7 ECWS, TRANSAM: arbeidsmarktstudie m.b.t. de sector goederenvervoer en –behandeling voor rekening van derden, in
opdracht van het Sociaal Fonds voor het goederenvervoer: Brussel, 2001.
EU-OSHA – European Agency for Safety and Health at Work 13

Work-related musculoskeletal disorders in the transport sector - Belgium
Furthermore:
14.2% of employers agree with the statement “When a woman seeks a non-driving profession in my company, she has a lower chance of being hired than a man”.
34.5% agree with “When a woman seeks a driving profession, she has a lower chance of being hired than a man”.
57.8% agree with “Women are equally suited to have a driving function”.
But 58.7% mention that it is easier for a woman to find a job in transport of persons.
34% reveal that the sector does not do enough at the moment to hire women.8
Therefore attention has to be placed on addressing the main issues why there are not many female drivers: the difficulty in combining work and family, the too high physical load and the lack of female friendly facilities.9
3.1.5 Distribution by age
The highest number/proportion of workers in transport is found in the age category 25-49 years, followed by the age category 50-64 and the young workers. The distribution of male and female workers by age shows the same pattern. The number/proportion of workers in the age category 25-49 years have decreased since 1995, while those in the age category 50-64 years have increased. These trends are observed for both genders. The number of female workers has increased in all age categories since 1995. As in the total working population, the highest number/proportion of workers in transport is found in the age category 25-49 years. The age category 50-64 years is next, followed by young workers (15-24 years). The distribution of male and female workers by age shows the same pattern. The number/proportion of workers in the age category 25-49 years has decreased since 1995, while those of workers in the age category 50-64 years have increased remarkably. Young workers have witnessed a slight reduction. The same trends can be observed in the distribution of the male workers by age, whereas for women the number of female workers has increased in all age categories since 1995. The proportion of female workers by age shows the same pattern as the male workers.
Table 3: Employment by age (1000), LFS 1995-2006
Transport (60 + 61 + 62) Total Year
15-24 25-49 50-64 15-24 25-49 50-64
1995 7 121 21 345,4 2857,7 566,3
1996 9 121 22 334,1 2881,9 551,3
1997 9 120 22 320,1 2914,7 584
1998 9 115 18 326,3 2903,5 611,5
8 ECWS, TRANSAM: arbeidsmarktstudie m.b.t. de sector goederenvervoer en –behandeling voor rekening van derden, in
opdracht van het Sociaal Fonds voor het goederenvervoer: Brussel, 2001. 9 European Foundation for the Improvement of Living and Working Conditions, EU road freight transport sector: Work and
employment conditions – Belgian Survey, 2003
EU-OSHA – European Agency for Safety and Health at Work 14

Work-related musculoskeletal disorders in the transport sector - Belgium
Transport (60 + 61 + 62) Total Year
15-24 25-49 50-64 15-24 25-49 50-64
1999 11 136 30 317,6 2986,2 651,4
2000 10 134 23 376,7 3045 671,3
2001 8 128 28 353,7 2950,9 711,3
2002 11 119 34 355,6 2951,4 724,3
2003 11 121 32 339,5 2924,6 762,6
2004 9 118 36 352,6 2975,4 793,5
2005 9 107 43 347,8 2994,3 857,1
2006 7 113 43 351,4 3000,4 881,1
Source: LFS
Figure 6: Percentage distribution of employment by age, transport and total, 1995 and 2006
4.7
81.2
14.19.2
75.8
15.0
4.3
69.3
26.4
8.3
70.9
20.8
0102030405060708090
100
15-24 25-49 50-64 15-24 25-49 50-64
Transport Total
1995 2006
Source: LFS
Table 4: Employment in transport by age and gender (1000), 1995-2006
Males Females Year
15-24 25-49 50-64 15-24 25-49 50-64
1995 6 112 20 1 9 1
1996 7 108 20 2 13 2
1997 7 106 20 2 14 1
1998 7 101 17 3 15 1
1999 9 116 26 2 20 3
2000 7 120 22 3 15 2
2001 7 113 26 1 15 2
2002 10 106 32 1 13 2
EU-OSHA – European Agency for Safety and Health at Work 15

Work-related musculoskeletal disorders in the transport sector - Belgium
Males Females Year
15-24 25-49 50-64 15-24 25-49 50-64
2003 8 107 31 2 14 1
2004 6 96 34 3 22 2
2005 6 92 38 2 16 4
2006 5 94 39 2 19 4
Source: LFS
Figure 7: Percentage distribution of employment in transport, by age and gender, LFS 1995-2006
4.3
81.2
14.59.1
81.8
9.13.6
68.1
28.3
8.0
76.0
16.0
0102030405060708090
100
15-24 25-49 50-64 15-24 25-49 50-64
Males Females
1995 2006
Source: LFS
3.1.6 Distribution by employment status
3.1.6.1 Self-employment In 2005 the transport sector (of both people and goods) had about 9,584 self-employed workers. The numbers have slightly decreased since 1999. In the total working population there were 867,268 self-employed workers in 2005 workers and, as opposed to the trend in transport, numbers have increased since 1999.
Table 5: Number of self-employed workers in transport and in total economy, 1999-2005
1999 2000 2001 2002 2003 2004 2005
Transport 9.761 9.680 9.525 9.215 9.885 9.665 9.584
Total 793.854 794.923 793.481 795.257 856.655 859.717 867.268
% of transport in total 1,23 1,22 1,20 1,16 1,15 1,12 1,11
Source: RSVZ, http://www.rsvz-inasti.fgov.be/nl/tools/statistics/department_05_I.htm
EU-OSHA – European Agency for Safety and Health at Work 16

Work-related musculoskeletal disorders in the transport sector - Belgium
Figure 8: Percentage share of self-employed workers in transport in total self-employed, 1999-2005
1.231.22
1.20
1.16 1.15
1.121.11
1.00
1.05
1.10
1.15
1.20
1.25
1.30
1999 2000 2001 2002 2003 2004 2005
Source: RSVZ, http://www.rsvz-inasti.fgov.be/nl/tools/statistics/department_05_I.htm
3.1.6.1.1 Analytical information – TRANSAM study
In the ‘TRANSAM’ 10 study self-employed drivers mention the following as the most attractive aspects of their contract status:
high degree of independence (47.4% );
having one’s own truck (16.4%);
financial aspects (12.7%).
The least attractive aspects:
driving – resting rules (32.3%);
financial aspects (19.1%);
social conditions (combination work/family life) (17%).11
3.1.6.2 Part-time work In 2006, about one out of ten transport workers were working part-time in comparison with about one out of five in the total working population. Part-time work in transport strongly increased during the last decade. Part-time employment is still less common among transport workers than in the total working population. However, the percentage of part-time work has also risen in transport in recent years, from 3.4% of total employment in the sector in 1995 to 11% in 2006. The overall data for Belgium also show an increase, from 13.7% of the total working population in 1995 to 22.3% in 2006.
10 ECWS, TRANSAM: arbeidsmarktstudie m.b.t. de sector goederenvervoer en –behandeling voor rekening van derden, in
opdracht van het Sociaal Fonds voor het goederenvervoer: Brussel, 2001. 11 ECWS, TRANSAM: arbeidsmarktstudie m.b.t. de sector goederenvervoer en –behandeling voor rekening van derden, in
opdracht van het Sociaal Fonds voor het goederenvervoer: Brussel, 2001.
EU-OSHA – European Agency for Safety and Health at Work 17

Work-related musculoskeletal disorders in the transport sector - Belgium
Figure 9: Percentage share of part-time employement in transport and the total, 1995-2006
3,4 3,96 6,3
7,3 7,2 7,96,1
7,99,1
10,8 11
13,7 14,1 14,815,8 16,5
17,518,6 19,5
20,821,8 22,2 22,3
0
5
10
15
20
25
1995 1996 1997 1998 1999 2000 2001 2002 2003 2004 2005 2006
Transport (60 + 61 + 62) Total
Source: LFS
Table 6: Number of part-time workers in transport (1,000), 1995-2006
Year
60 Land transport,
transport via pipelines
61 Tranport
over water
62 Air transport
1995 4 0 1 1996 4 0 2 1997 6 0 2 1998 6 0 3 1999 8 1 4 2000 7 - 4 2001 9 - 4 2002 8 - 2 2003 13 - 0 2004 12 - 3 2005 14 - 3 2006 15 0 3
Source: LFS
3.1.7 Long and short distance transport
In 2005 Belgian transport companies transported about 696 million tons of goods. Figures have increased steadily since 1999, transport over land being by far the most important, transporting about 467 million tons of goods on Belgian roads. In any case, the figures for land transport have gone down since 2000, which reveals an increasing outsourcing to foreign transport companies.
EU-OSHA – European Agency for Safety and Health at Work 18

Work-related musculoskeletal disorders in the transport sector - Belgium
Table 7: Transport in goods, 1999-2005, FOD Economie - Algemene Directie Statistiek & NMBS
Tons 1999 2000 2001 2002 2003 2004 2005 2005/2004
Total 591.486 684.235 668.561 676.655 680.077 691.840 696.077 +0,6%
Transport over water
110.309 120.944 128.561 135.115 137.755 147.765 168.093 +13,8%
Rail transport 59.149 61.279 57.050 57.198 55.732 58.454 60.976 +4,3%
Land transport 422.028 502.012 482.950 484.342 486.590 485.621 467.008 -3,8%
Source: http://www.statbel.fgov.be/figures/d74_nl.asp#1
The market globalisation results in an increase in the distance between product and consumer. The consequence of this is a larger geographic spread, a bigger logistic circle and, consequently, an increase in international transport. Being a small country, international transport is very important in Belgium. In this sense, in terms of forwarded ton-kilometers, international transport clearly outnumbers national transport.12
3.1.8 Migrant workers
3.1.8.1 Analytical information – TRANSAM study: Migrant workers in transport of goods sector
The TRANSAM study concluded that 14% of employees in transport of goods in Belgium are foreign workers: 9.4% are non-Belgian citizens coming from an EU Member State, 3.3% are Belgian citizens coming from an EU Member State and 1.4% are non-Belgian citizens from outside the EU. Compared to the migrant population in the overall economy, transport reports a higher share of employees from other EU member states and a smaller one of non-EU workers. In general, the following are mentioned as the main problems for the employment of foreign workers:
Lack of language skills;
General shortage of qualifications;
Cost of education is too high;
Not familiar with the profession.
In the TRANSAM questionnaire to the employers (ECWS, 2002) the following results were found:
37.6% agrees with the statement that foreign drivers have the same chance as Belgians to find a job in the sector;
It is difficult to hire foreign employees because few of them have followed driver education (44.9%);
Most difficulties of clients with foreign employees are due to language problems (50.5%);
Only 17.3% agree with the statement that the sector does enough efforts to hire foreign workers, whereas 42.5% agree with the statement that this could partly solve the shortage of personnel in the sector.13
12 SERV, Onderzoek naar de kwalificatiebehoeften voor vrachtwagenchauffeur, Brussel: Sociaal-Economische Raad van
Vlaanderen, 1998. 13 ECWS, TRANSAM: arbeidsmarktstudie m.b.t. de sector goederenvervoer en –behandeling voor rekening van derden, in
opdracht van het Sociaal Fonds voor het goederenvervoer: Brussel, 2001.
EU-OSHA – European Agency for Safety and Health at Work 19

Work-related musculoskeletal disorders in the transport sector - Belgium
3.2 Exposure to risks
3.2.1 Physical work factors
3.2.1.1 Exposure to vibrations
According to WBM 2004, almost one out of four transport workers report always being exposed to vibrating tools and machines at work.
0Transport workers report this exposure at work more frequently than the average Flemish working population.
The results of WBM 2004 show that almost one out of four transport workers (23.3%) always face vibrating tools and machines at work, as opposed to 7.3% for the average in Flanders. Approximately 48.2% of the transport workers never face vibrating tools and machines at work, while the share rises to 66.3% for the Flemish average. Hence, according to WBM, transport workers report more frequent exposure to vibrating tools and machines at work than the average Flemish working population. Several studies show the dangerous consequences of sustained sitting and exposure to body vibration: exposure to vibrations leads to back disorders. In this sense, specific seats for truck drivers have been designed in recent years in order to prevent vibration-induced back problems.14
Table 8: How often do you face vibrating tools and machines at work? WBM, 2004
Never (%) From time to time (%) Often (%) Always (%)
Transport 48.2 17.7 10.8 23.3
Total 66.3 17.4 9 7.3
3.2.1.2 Painful positions
According to WBM 2004, almost one out of ten transport workers reports always being exposed to uncomfortable or tense working positions.
Transport workers report this exposure at work more frequently than the average Flemish working population.
The results of the WBM 2004 show that 40.8% of transport workers never face uncomfortable or tense working positions, slightly below the 44.9% share for the average Flemish working population. As opposed to this, approximately 8.5% of workers always face uncomfortable or tense working positions, a share that doubles that found in the average Flemish working population (4.3%).
Table 9: How often do you face uncomfortable/ tense working positions at work? WBM, 2004
Never (%) From time to time (%) Often (%) Always (%)
Transport 40.8 35.4 15.2 8.5
Total 44.9 36.1 14.6 4.3
14 European Foundation for the Improvement of Living and Working Conditions, EU road freight transport sector: Work and
employment conditions – Belgian Survey, 2003
EU-OSHA – European Agency for Safety and Health at Work 20

Work-related musculoskeletal disorders in the transport sector - Belgium
3.2.1.3 Heavy loads
According to WBM 2004, almost one out of ten transport workers report always being exposed to physically arduous tasks at work.
Transport workers report this exposure at work more frequently than the average Flemish working population.
WBM 2004 shows that 42.2% of transport workers never face physically arduous tasks at work as opposed to 53.2% of the average Flemish working population. Meanwhile, approximately 8.5% of workers always face physically arduous tasks at work, well above the 5.5% share for the average Flemish working population.
Table 10: How often do you face physically arduous tasks while you are working? WBM, 2004
Never (%) From time to time (%) Often (%) Always (%)
Transport 42.2 34.2 15.2 8.5
Total 53.2 28.5 12.8 5.5
Specifically during loading and unloading, which takes in general about 1.5h per day, drivers can be exposed to heavy lifting tasks. Whether or not help is provided for these activities depends largely on the arrangements made with clients. Therefore it is necessary that truck drivers know correct lifting and carrying techniques to prevent low back disorders when climbing in and out the truck.15
3.2.1.4 Exposure to noise
According to WBM 2004, almost one out of five transport workers report always being exposed to noise nuisance at work.
Transport workers report this exposure at work more frequently than the average Flemish working population.
The WBM 2004 results show that 35.1% of transport workers never face noise nuisance at work, the share being 44.9% among the average Flemish working population. Meanwhile, approximately 20.3% of transport workers always face noise nuisance at work, again almost doubling the share reported for the average Flemish working population (10.7%).
Table 11: How often do you face noise nuisance while you are working? WBM, 2004
Never (%) From time to time (%) Often (%) Always (%)
Transport 35.1 29.5 15.1 20.3
Total 44.9 30.8 13.7 10.7
Different noise sources are present in vehicles and specifically in trucks: the exhaust, the air inlet, the ventilator, the motor, the transfer, the tires and the aerodynamic effects. The first four produce the most noise but with increasing speed, noise from tire contact with the road rises and thus, becomes an increasing problem when driving on highways. The older the vehicle, the louder noise production due to wastage will be. Also diesel trucks create more (10 dB (a)) noise then gasoline
15 European Foundation for the Improvement of Living and Working Conditions, EU road freight transport sector: Work and
employment conditions – Belgian Survey, 2003
EU-OSHA – European Agency for Safety and Health at Work 21

Work-related musculoskeletal disorders in the transport sector - Belgium
ones. Truck drivers spend a lot of time in their vehicle so it is very important to reduce fatigue or negative cognitive effects induced by noise. Furthermore, since it is necessary to communicate by radio, the use of noise reduction measures (e.g. the use of noise absorbing materials) or development of other techniques is important16.
3.2.1.5 Exposure to heat and cold
According to WBM 2004, about 7% transport workers report always being exposed to extreme temperatures at work.
Transport workers report this exposure at work more frequently than the average Flemish working population.
During loading and unloading activities, drivers may be exposed to extreme climate conditions. In wintertime, attention should be placed on people that have to perform sustained loading and unloading tasks.17 Findings from WBM 2004 show that 46.3% of transport workers never face extreme temperatures at work, below the 54.6% share of the average Flemish working population. On the other hand, approximately 7% of transport workers always face extreme temperatures at work, twice as much as the average for Flanders (3.3%).
Table 12: How often do you face extreme temperatures while you are working? WBM, 2004
Never (%) From time to time (%) Often (%) Always (%)
Transport 35.1 29.5 15.1 20.3
Total 44.9 30.8 13.7 10.7
3.2.1.6 Handling dangerous substances
According to WBM 2004, about 6% of transport workers report always being exposed to dangerous substances at work.
Transport workers report this exposure at work more frequently than the average Flemish working population.
Handling dangerous substances is common in the transport sector. Attention must also be given to the exhaust fumes of trucks during loading and unloading activities, as respiratory problems may occur when exhaust fumes are attracted by the ventilation system. The combination with smoking increases the risk for respiratory problems.18 The results of WBM 2004 show that 60.9% of transport workers never face dangerous substances at work (70% for the average Flemish working population). Approximately 5.5% of transport workers always face dangerous substances at work, above the 3.2% share of the average Flemish working population.
16 De Vriendt, J., Studie van de geluidsbelasting in een vrachtwagencabine (afstudeerwerk Gespecialiseerde Studies
Veiligheidstechnieken, K.U.Leuven): K.U.Leuven: Leuven, 1994. 17 European Foundation for the Improvement of Living and Working Conditions, EU road freight transport sector: Work and
employment conditions – Belgian Survey, 2003 18 European Foundation for the Improvement of Living and Working Conditions, EU road freight transport sector: Work and
employment conditions – Belgian Survey, 2003
EU-OSHA – European Agency for Safety and Health at Work 22

Work-related musculoskeletal disorders in the transport sector - Belgium
Table 13: How often are you exposed to dangerous substances at work? WBM, 2004
Never (%) From time to time (%) Often (%) Always (%)
Transport 60.9 25.2 8.4 5.5
Total 70 21 5.8 3.2
3.2.1.7 Sitting Since truck drivers spend several hours in a row in a sitting position, the risk for back muscle fatigue (which can develop in more serious low back problems), is present. The risk increases when the sitting position is combined with the truck vibrations.
3.2.1.8 Overview – Physical work factors In terms of physical strain, exposure to vibrating tools - machines and noise nuisance at work form the highest risk for transport workers. According to WBM 2004, one out of four transport workers report always being exposed to vibrating tools - machines at work; almost one out of five transport workers report always being exposed to noise nuisance at work. These risks are reported more frequently among transport workers than the average Flemish working population. In addition, transport workers report higher than average exposure to other physical risk factors, such as uncomfortable or tense working positions, physically arduous tasks, extreme temperatures and dangerous substances. However, the difference for these factors is less significant.
Figure 10: Overview of physical work factors. Percentage share of workers reporting always being exposed to risk factors, transport and Flemish average, 2004
23.3
7.38.54.3
8.55.5
20.3
10.77.0
3.35.5
3.2
0
5
10
15
20
25
30
35
40
Transport Total
Vibrations Painful positions
Physical demanding tasks Noise nuisance
Extreme temperatures Handling dangerous substances
Source: WBM
EU-OSHA – European Agency for Safety and Health at Work 23

Work-related musculoskeletal disorders in the transport sector - Belgium
3.2.2 Work organisation
3.2.2.1 Working with computers The results of WBM 2004 show that 50.6% of transport workers never work with computers, as opposed to 35.8% for the average Flemish working population. Approximately one out of four transport workers always face working with computers at work, slightly below the 26.7% share of the Flemish average.
Table 14: How often do you face working with computer while you are working? WBM, 2004
Never (%) From time to time (%) Often (%) Always (%)
Transport 50.6 10.5 12.9 26.0
Total 35.8 16.5 21 26.7
Analytical information: New technology
Another element that is changing the content and workload of drivers is the introduction of a number of computer applications, such as planning systems and mobile means of communication. These systems are used to work more efficiently and to increase quality and additional services: cost calculations will be more accurate and detailed, planning will be more efficient (less empty trucks) and there will be fewer errors and faster interventions when problems occur. The following types of telematic applications are already partly present in the sector and will develop further in the future: On-board computer: computer installed in the vehicle and used for digital registration of data
regarding the journey, the vehicle and the driver. The computer can be linked to a communication system (mobile phone, satellite). Advantages of this system that are mentioned are: less administration, precise management information, more efficient control of the driver, decrease in fuel, better client report. This gives the possibility to spend more attention to the driving task. However, also disadvantages exist: technical problems such as no linking of on-board computer software with the home software, too little information regarding ‘interesting’ and ‘necessary’ information, input mistakes by the driver (manual input during driving can cause disturbance to the driver and can therefore be a risk with regard to accidents), savings are not immediately present;
Navigation systems: information presented during the journey regarding the route. Information is given visually on a computer screen and/or spoken. As advantages are mentioned: time saving, decreased kilometers and less fuel. However the investments of such a system are very large and therefore not often used in the Belgian transport sector;
Digital tachograph: an instrument the Government has made compulsory which controls rules regarding driving and resting times using a smart card that registers the individual driver’s behavior during 30 days;
Planning systems used by a dispatcher to plan duration and costs of journeys. In Belgium the driver still often performs the planning of the route itself and computerised systems are not yet frequently used. Disadvantages are unforeseen disturbances that are not calculated in the planning, e.g. traffic accidents. Today, simulation programmes are possible;
Tracking, tracing and fleet-management systems to follow or search vehicles or loads, often using barcodes for registration of loads. Using these systems would increase efficiency, provide better service to clients and decreases communication;
Other planning systems: exchange freight systems, document change systems;
EU-OSHA – European Agency for Safety and Health at Work 24
Work-related musculoskeletal disorders in the transport sector - Belgium
A mobile phone is the telematics application most often used because the main advantage is the possibility to communicate interactively at each time. As disadvantages are mentioned: the possibility of telephoning everybody from everywhere (costs), more assimilation of all calls by dispatching and transmission problems.
In general, the following advantages of new technologies are mentioned: increased safety, attainable for family, correct and equal treatment of all drivers, less administration, less time-consuming. These applications and systems are now used by dynamic companies but are creating a certain degree of uneasiness, confusion and irritation amongst the drivers who raise a number of questions. How do they find out about what exactly is logged by the computer? Are these data also used to calculate wages? Can the mobile phone be turned off during rest breaks? Can it also be used for personal use? In addition, lorry drivers have to learn how to operate these on-board computers - not a simple task, which leads to extra stress. This increases the need for adopted and sufficient training. 19
3.2.2.2 Repetitive work
According to WBM 2004, about one out of five transport workers report always being exposed to repetitive hand/ arm movements at work.
Transport workers report this exposure at work more frequently than the average Flemish working population.
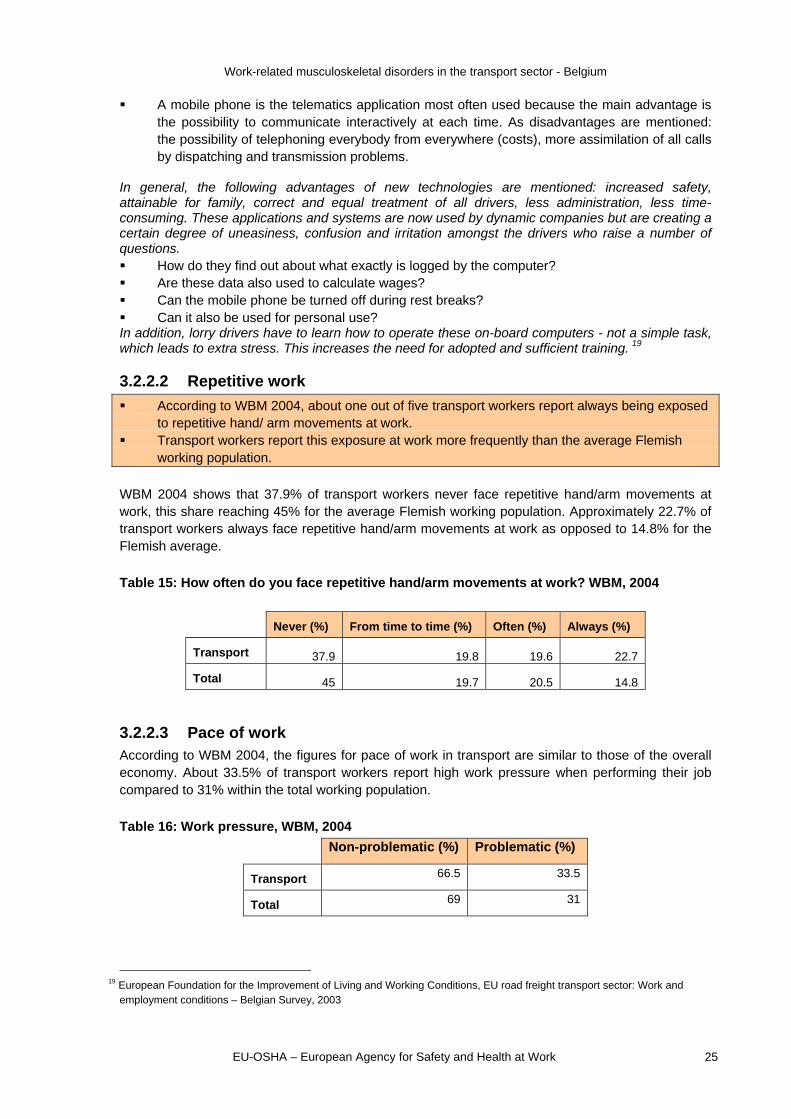
WBM 2004 shows that 37.9% of transport workers never face repetitive hand/arm movements at work, this share reaching 45% for the average Flemish working population. Approximately 22.7% of transport workers always face repetitive hand/arm movements at work as opposed to 14.8% for the Flemish average.
Table 15: How often do you face repetitive hand/arm movements at work? WBM, 2004
Never (%) From time to time (%) Often (%) Always (%)
Transport 37.9 19.8 19.6 22.7
Total 45 19.7 20.5 14.8
3.2.2.3 Pace of work According to WBM 2004, the figures for pace of work in transport are similar to those of the overall economy. About 33.5% of transport workers report high work pressure when performing their job compared to 31% within the total working population.
Table 16: Work pressure, WBM, 2004
Non-problematic (%) Problematic (%)
Transport 66.5 33.5
Total 69 31
19 European Foundation for the Improvement of Living and Working Conditions, EU road freight transport sector: Work and
employment conditions – Belgian Survey, 2003
EU-OSHA – European Agency for Safety and Health at Work 25

Work-related musculoskeletal disorders in the transport sector - Belgium
3.2.2.4 Job control According to WBM 2004, the figures for job control are lower in transport than in the total working population. About 29.1% of the transport workers report insufficient autonomy when performing their job compared to 20.8% within the total working population.
Table 17: Autonomy, WBM, 2004
Non-problematic (%) Problematic (%)
Transport (n=390) 72.4 29.1
Total (n = 10.204) 79.2 20.8
3.2.2.5 Job content The WBM 2004 findings show that the job content is more routine for workers in transport than the overall average: 29.3% and 23.8%, respectively.
Table 18: Routine job, WBM, 2004
Non-problematic (%) Problematic (%)
Transport 70.7 29.3
Total 76.2 23.8
3.2.2.5.1 Analytical information – Emerging risk: Change in job content in transport sector
Due to the open market and the increase in international transport, the job content of truck drivers has changed considerably. Knowledge of the road codes and planning has become more important, e.g. knowing the European traffic laws and road signals (which may be different in several countries) or knowing the important European traffic routes, where to find customhouses, knowing the tunnels and bridges, and knowing different European languages etc. Due to technology improvements, trucks are better equipped and are more comfortable. Furthermore, technology results in decreased expenditure, less noise etc. but it also creates a need for more knowledge on the part of the drivers to handle special circumstances. Drivers have to know how to work with automated systems, such as on-board computers, digital tachographs or other telematic equipments. The risk of these systems is that they become more and more complicated, increasing the need for extra education and training.20
3.2.2.6 Skills, training, information According to WBM 2004, transport workers have fewer opportunities to learn: about 29.4% of these workers report insufficient of no learning opportunities compared to 22.6% within the total working population.
Table 19: Learning opportunities by age, WBM, 2004
Non-problematic (%) Problematic (%)
Transport 70.6 29.4
Total 77.4 22.6
20 SERV, Flexibilisering van werk- en levertijden in het goederenvervoer: een aanbeveling van de Sectoriële Commissie
Goederenvervoer, Brussel: Sociaal-economische Raad van Vlaanderen, 1999.
EU-OSHA – European Agency for Safety and Health at Work 26

Work-related musculoskeletal disorders in the transport sector - Belgium
3.2.2.7 Work-life balance Transport workers report slightly higher problems when it comes to work-life balance. About 17.1% of them report having difficulties combining their work and personal life compared to 11.8% in the total working population.
Table 20: Work-life balance, WBM, 2004
Non-problematic (%) Problematic (%)
Transport 82.9 17.1
Total 88.2 11.8
3.2.2.8 Job support According to WBM 2004, transport workers are more likely to report problems related with support from the immediate management compared to the total working population. About 22% of transport workers report problems on this issue as opposed to 16.1% for the average working population.
Table 21: Support from the immediate management, WBM, 2004
Non-problematic (%) Problematic (%)
Transport 78 22
Total 83.9 16.1
Work in isolation may regarded positively by some workers, who prefer not being controlled by a supervisor on a regular basis. On the other hand, the Ministry of Employment and Workers mentions the absence of a member of the hierarchy as a negative issue since there is no direct support or reprimand when something goes wrong.21
3.2.2.8.1 Analytical information – SERV: Consequences of economic and logistic trends
The introduction of chain logistics is an important trend: as different transport systems work together there is an increasing need for the management of transport streams and a flexible organisation. Companies across all sectors are nowadays more concentrated on their core business, which leads to an increase in supply industries and, consequently, more transport streams as the increase in outsourcing increases the geographic spread of economic activities. Furthermore, the life cycle of products is shorter: they are replaced faster, which results in an increase in both consumption and transport. The just-in-time approach means that goods are delivered at the moment the company needs them in the production process. Since stocks are decreased to a minimum, a higher delivery frequency of small amounts is needed.22
21 European Foundation for the Improvement of Living and Working Conditions, EU road freight transport sector: Work and
employment conditions – Belgian Survey, 2003 22 SERV, Onderzoek naar de kwalificatiebehoeften voor vrachtwagenchauffeur, Brussel: Sociaal-Economische Raad van
Vlaanderen, 1998.
EU-OSHA – European Agency for Safety and Health at Work 27
Work-related musculoskeletal disorders in the transport sector - Belgium
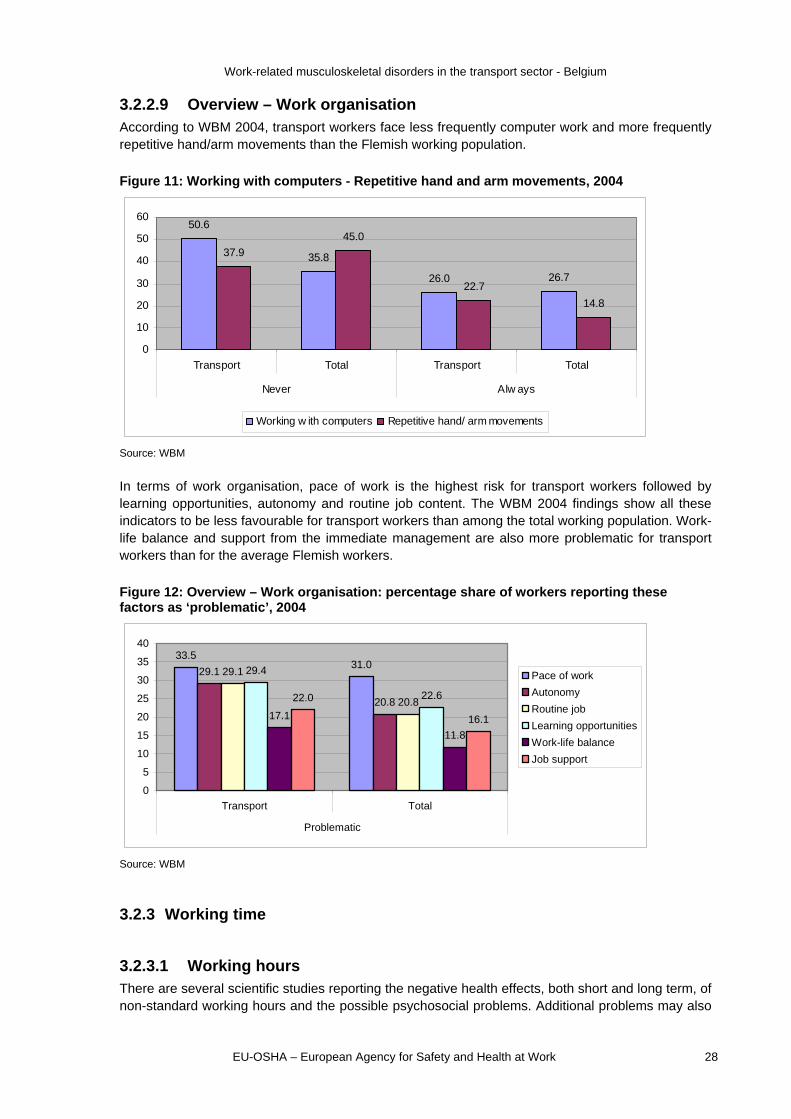
3.2.2.9 Overview – Work organisation According to WBM 2004, transport workers face less frequently computer work and more frequently repetitive hand/arm movements than the Flemish working population.
Figure 11: Working with computers - Repetitive hand and arm movements, 2004
50.6
35.8
26.0 26.7
37.9
45.0
22.7
14.8
0
10
20
30
40
50
60
Transport Total Transport Total
Never Alw ays
Working w ith computers Repetitive hand/ arm movements
Source: WBM
In terms of work organisation, pace of work is the highest risk for transport workers followed by learning opportunities, autonomy and routine job content. The WBM 2004 findings show all these indicators to be less favourable for transport workers than among the total working population. Work-life balance and support from the immediate management are also more problematic for transport workers than for the average Flemish workers.
Figure 12: Overview – Work organisation: percentage share of workers reporting these factors as ‘problematic’, 2004
33.531.0
29.1
20.8
29.1
20.8
29.4
22.6
17.1
11.8
22.0
16.1
0
5
10
15
20
25
30
35
40
Transport Total
Problematic
Pace of work
Autonomy
Routine job
Learning opportunities
Work-life balance
Job support
Source: WBM
3.2.3 Working time
3.2.3.1 Working hours There are several scientific studies reporting the negative health effects, both short and long term, of non-standard working hours and the possible psychosocial problems. Additional problems may also
EU-OSHA – European Agency for Safety and Health at Work 28
Work-related musculoskeletal disorders in the transport sector - Belgium
occur in specific risk groups, such as female workers, who may suffer reproductive problems. Since the attraction of female workers to the profession is mentioned as one of the solutions for the employment problem in the sector, attention must be paid to this specific issue. Regarding elderly workers, increased fatigue problems may occur. Since the number of elderly workers is increasing - and it is expected that keep growing in the future, more attention should be placed on this issue too.23
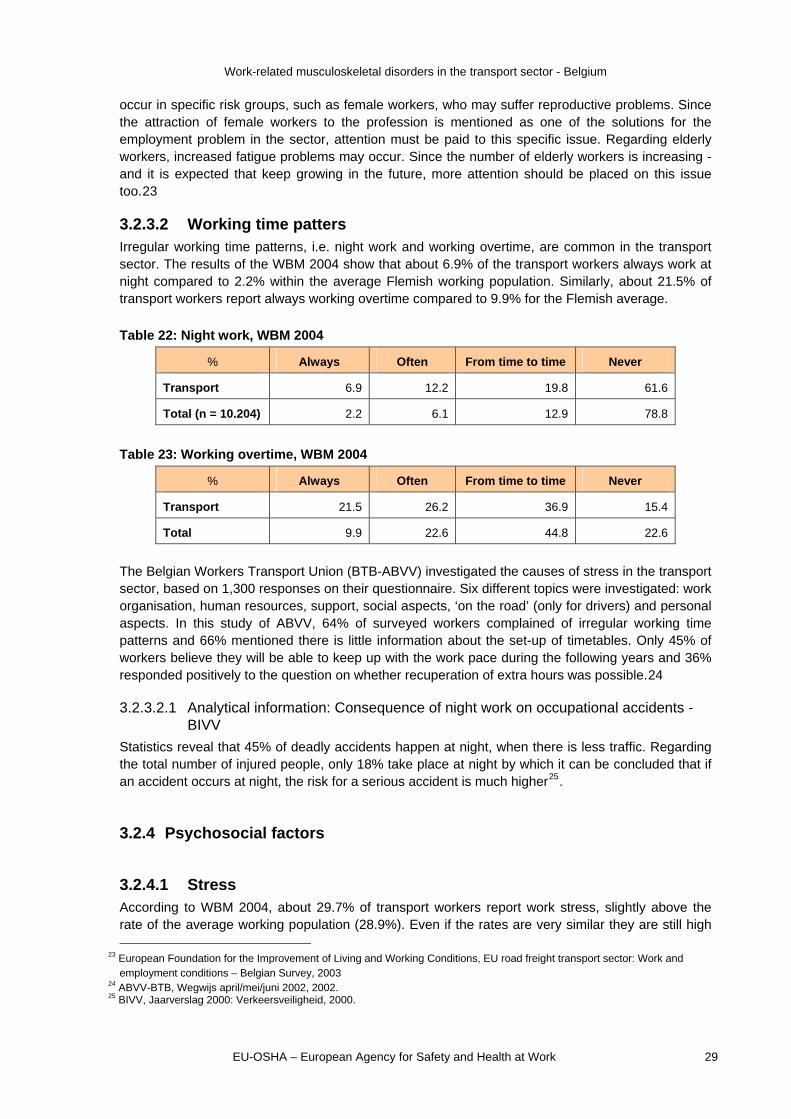
3.2.3.2 Working time patters Irregular working time patterns, i.e. night work and working overtime, are common in the transport sector. The results of the WBM 2004 show that about 6.9% of the transport workers always work at night compared to 2.2% within the average Flemish working population. Similarly, about 21.5% of transport workers report always working overtime compared to 9.9% for the Flemish average.
Table 22: Night work, WBM 2004
% Always Often From time to time Never
Transport 6.9 12.2 19.8 61.6
Total (n = 10.204) 2.2 6.1 12.9 78.8
Table 23: Working overtime, WBM 2004
% Always Often From time to time Never
Transport 21.5 26.2 36.9 15.4
Total 9.9 22.6 44.8 22.6
The Belgian Workers Transport Union (BTB-ABVV) investigated the causes of stress in the transport sector, based on 1,300 responses on their questionnaire. Six different topics were investigated: work organisation, human resources, support, social aspects, ‘on the road’ (only for drivers) and personal aspects. In this study of ABVV, 64% of surveyed workers complained of irregular working time patterns and 66% mentioned there is little information about the set-up of timetables. Only 45% of workers believe they will be able to keep up with the work pace during the following years and 36% responded positively to the question on whether recuperation of extra hours was possible.24
3.2.3.2.1 Analytical information: Consequence of night work on occupational accidents - BIVV
Statistics reveal that 45% of deadly accidents happen at night, when there is less traffic. Regarding the total number of injured people, only 18% take place at night by which it can be concluded that if an accident occurs at night, the risk for a serious accident is much higher25.
3.2.4 Psychosocial factors
3.2.4.1 Stress According to WBM 2004, about 29.7% of transport workers report work stress, slightly above the rate of the average working population (28.9%). Even if the rates are very similar they are still high
23 European Foundation for the Improvement of Living and Working Conditions, EU road freight transport sector: Work and employment conditions – Belgian Survey, 2003
24 ABVV-BTB, Wegwijs april/mei/juni 2002, 2002. 25 BIVV, Jaarverslag 2000: Verkeersveiligheid, 2000.
EU-OSHA – European Agency for Safety and Health at Work 29

Work-related musculoskeletal disorders in the transport sector - Belgium
and represent an important problem. Furthermore, 88.2% of transport workers report that work is manageable in terms of emotional stress, compared to 79.5% of the total working population.
3.2.4.1.1 Analytical information: Causes of stress in transport sector by BTB - ABVV
According to the Belgian Workers Transport Union (BTB-ABVV) 26 the following items were considered the most stressful in freight transport by road:
Responsibility for material;
Lack of involvement;
Traffic legislation;
Other drivers and aggression;
Quality requirements;
Unsafe working conditions.
From the results of their questionnaire, ABVV mentioned several specific actions to be taken in the future to reduce stress factors.
1. Just-in-Time: mandatory black box that registers the planning in order to avoid ‘impossible’ client demands, training for dispatching, punishment of violations.
2. Dispatching of waste collection: more personnel, introduce prevention officers, ADR (Agreement on Dangerous Goods by Road) training, training in social skills.
3. Flexitime: clear collective agreements on flexibility.
4. Recognition of the profession of “truck driver”, both at national and European level and based on a specific diploma.
3.2.4.2 Violence WBM 2004 shows that transport workers face physical violence at work slightly less frequently than the average working population. Approximately 96.2% of transport workers report that they never face this problem, compared with the Flemish average of 94.5%.
Table 24: How often have you faced physical violence at work in the last 12 months?, WBM, 2004
Never (%) From time to time (%) Often (%) Always (%)
Transport 96.2 3.6 0.3 0
Total 94.5 4.5 0.9 0.1
According to the Belgian Workers Transport Union (BTB-ABVV) 27 about 71% of truck drivers consider aggression of other drivers or passengers as an extra burden for their job and 69% are annoyed by the behaviour of other drivers. Another important issue is the discrepancy in instructions received from the clients compared with their own company’s instructions.
26 ABVV-BTB, Wegwijs april/mei/juni 2002, 2002. 27 ABVV-BTB, Wegwijs april/mei/juni 2002, 2002.
EU-OSHA – European Agency for Safety and Health at Work 30
Work-related musculoskeletal disorders in the transport sector - Belgium
A specific violence issue is the increasing number of truck thefts. Several prevention strategies are necessary to overcome this increasing problem, e.g.:
Manual for drivers that mentions what to do to prevent thefts and how to react in case of thefts;
Clear instructions on how to handle the load, how to use safety systems, where to park trucks etc.
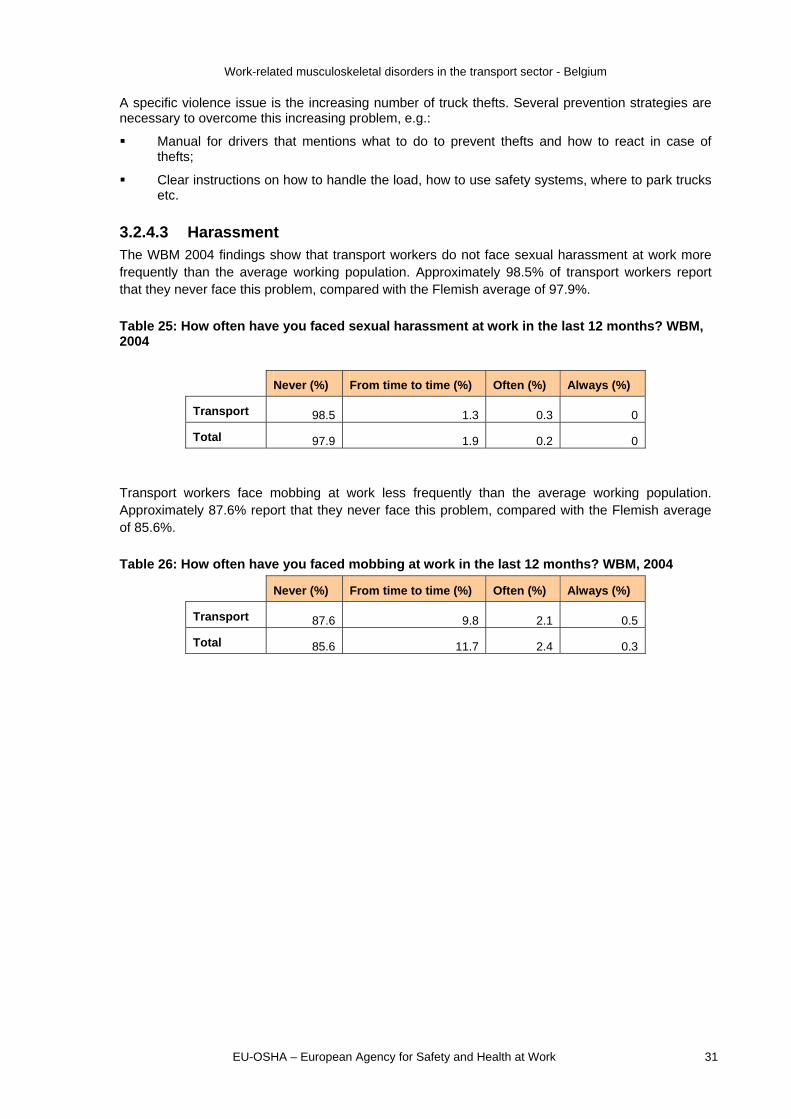
3.2.4.3 Harassment The WBM 2004 findings show that transport workers do not face sexual harassment at work more frequently than the average working population. Approximately 98.5% of transport workers report that they never face this problem, compared with the Flemish average of 97.9%.
Table 25: How often have you faced sexual harassment at work in the last 12 months? WBM, 2004
Never (%) From time to time (%) Often (%) Always (%)
Transport 98.5 1.3 0.3 0
Total 97.9 1.9 0.2 0
Transport workers face mobbing at work less frequently than the average working population. Approximately 87.6% report that they never face this problem, compared with the Flemish average of 85.6%.
Table 26: How often have you faced mobbing at work in the last 12 months? WBM, 2004
Never (%) From time to time (%) Often (%) Always (%)
Transport 87.6 9.8 2.1 0.5
Total 85.6 11.7 2.4 0.3
EU-OSHA – European Agency for Safety and Health at Work 31

Work-related musculoskeletal disorders in the transport sector - Belgium
3.3 Health outcomes
3.3.1 Occupational accidents
In 2004 8,665 accidents occurred in land transport, 927 of them severe accidents. Land transport represented approximately 9.1% and 7.8%, respectively, of the total number of occupational accidents and severe accidents. In recent years, a downward trend has been observed in the number of (severe) occupational accidents. The occurrence of occupational accidents is higher in land transport than in the total working population. Also the number of lost working days due to occupational accidents is higher in land transport sector than in the total working population. A sectoral overview shows that the number and severity of occupational accidents is highest in construction and manufacturing of wood and metal, followed by transport. According to the Fund for Occupational Accidents, 8,665 accidents occurred in the land transport sector in 2004, and 94,432 in the total working population. Therefore, land transport represented approximately 9.1% of the total number of occupational accidents. In recent years, a downward trend has been observed in the number of occupational accidents. The frequency rate shows that the occurrence of occupational accidents is higher in land transport than in the total working population. A sectoral overview shows that the number of occupational accidents is highest in construction and manufacturing of wood and metal, followed by transport.
Table 27: Reported occupational accidents28, 2000-2004
Number Frequency rate29
Transport Total Transport Total
2000 15,537 209,508 49.5 35.5
2001 17,163 203,171 56.0 35.0
2002 9,743 108,216 54.2 31.2
2003 9,012 98,552 49.6 28.4
2004 8,665 94,432 46.6 27.0
Source: FAO, Fund for Occupational Accidents.
In 2004, about 927 severe occupational accidents -permanent work incapacity or fatal occupational accident- occurred in land transport and about 11, 873 in total. Land transport represented therefore approximately 7.8% of the total number of severe occupational accidents in Belgium. Similarly to occupational accidents in general, in recent years a downward trend has been observed in the number of severe occupational accidents. The severity rate shows that the number of lost working days due to occupational accidents is higher in land transport than in the total. A sectoral overview shows that the severity of occupational accidents is highest in construction and manufacturing of wood and metal, followed by transport.
28 Occupational accident with and without working days lost
29 Frequency rate is the number of occupational deaths and injuries per one million work hours. This is calculated using the following formula: (Number of occupational deaths and injuries x 1,000,000 / Total work hours)
EU-OSHA – European Agency for Safety and Health at Work 32

Work-related musculoskeletal disorders in the transport sector - Belgium
Table 28: Number of severe accidents and severity rate by sector, 2000-2004
Transport Total
Number30 Severity rate31 Number Severity
rate
2000 1,166 1.41 13,277 0.82
2001 1,419 1.46 13,869 0.75
2002 828 1.37 11,831 0.70
2003 933 1.40 12,729 0.67
2004 927 1.34 11,873 0.65
Source: FAO, Fund for Occupational Accidents.
3.3.1.1 Analytical information – Causes of occupational accidents To analyse the most important types of occupational accidents in the road transport of goods sector, a study by Ceunen32 reveals that out of 977 accidents, 43% occurred during loading activities, 13% were road accidents, 13% were accidents in the cabin and 11% were loading/lifting accidents.
3.3.2 Occupational diseases
Bone, discus and joint pathologies represent the largest part of the recognised occupational diseases in transport: 74.62%. The causes of this type of pathology are mechanical vibrations and the body part most affected is the back. Most of the recognised occupational diseases correspond to workers in the age group 45-54 years old, followed by 55-64 and 35-44.
In Belgium, in order to obtain benefit payments as a result of an occupational disease an application has to be submitted to the Occupational Diseases Fund who will then examine whether or not the condition can be recognised as an occupational disease. This can only happen if the disease appears on a list of occupational diseases (closed system) or if the person concerned can demonstrate a causal link between the condition and the occupational activity (open system). The person concerned then has to provide proof of exposure to the risk cited, proof of the disease and proof of the casual link between the exposure and the condition. Together they are referred to as the “mixed system”. From 2001 until 2005, 500 requests for occupational diseases were recognised in the transport sector in Belgium. These 500 diseases are spread among 12 different pathologies. Bone, discus and joint pathologies represent the largest part (74.62%), the causes being mechanical vibrations. The part of the body that is mostly injured is the back. Lumbar disorders, leg and joint disorders and upper extremities are also caused by mechanical vibrations. This means that mechanical vibrations are the prior cause of occupational diseases in the transport sector. The C, L, M, S, T and U pathologies are all musculoskeletal disorders. Together, they represent 85.95% of all recognised diseases between 2001 and 2005.
30 Severe accident = Permanent work incapacity or fatal occupational accident 31 Severity rate is lost workdays per 1, 000 work hours. This is calculated using the following formula: (Total lost workdays /
Total work hours) x 1,000 32 Ceunen, A., Naar een veiliger wegtransport. In: Promosafe 93/2: 6-9, 19
EU-OSHA – European Agency for Safety and Health at Work 33
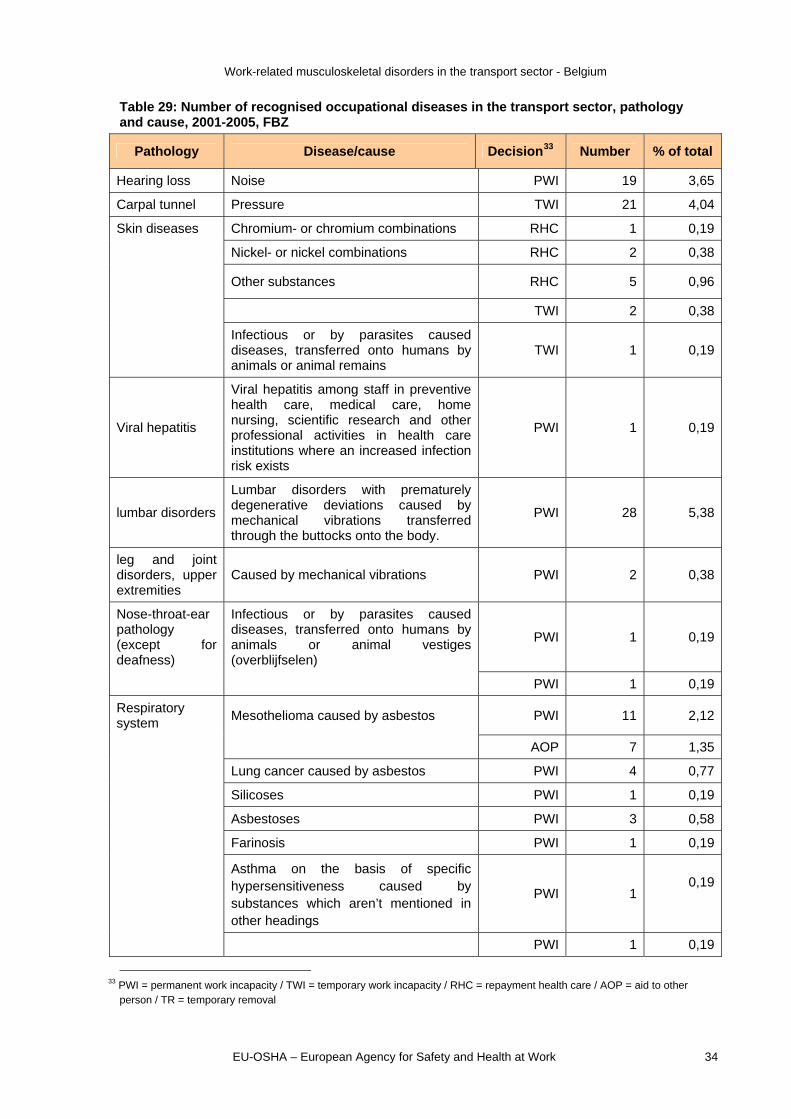
Work-related musculoskeletal disorders in the transport sector - Belgium
Table 29: Number of recognised occupational diseases in the transport sector, pathology and cause, 2001-2005, FBZ
Pathology Disease/cause Decision33 Number % of total
Hearing loss Noise PWI 19 3,65
Carpal tunnel Pressure TWI 21 4,04
Skin diseases Chromium- or chromium combinations RHC 1 0,19
Nickel- or nickel combinations RHC 2 0,38
Other substances RHC 5 0,96
TWI 2 0,38
Infectious or by parasites caused diseases, transferred onto humans by animals or animal remains
TWI 1 0,19
Viral hepatitis
Viral hepatitis among staff in preventive health care, medical care, home nursing, scientific research and other professional activities in health care institutions where an increased infection risk exists
PWI 1 0,19
lumbar disorders
Lumbar disorders with prematurely degenerative deviations caused by mechanical vibrations transferred through the buttocks onto the body.
PWI 28 5,38
leg and joint disorders, upper extremities
Caused by mechanical vibrations PWI 2 0,38
Nose-throat-ear pathology (except for deafness)
Infectious or by parasites caused diseases, transferred onto humans by animals or animal vestiges (overblijfselen)
PWI 1 0,19
PWI 1 0,19
Respiratory system
Mesothelioma caused by asbestos PWI 11 2,12
AOP 7 1,35
Lung cancer caused by asbestos PWI 4 0,77
Silicoses PWI 1 0,19
Asbestoses PWI 3 0,58
Farinosis PWI 1 0,19
Asthma on the basis of specific hypersensitiveness caused by substances which aren’t mentioned in other headings
PWI 1 0,19
PWI 1 0,19
33 PWI = permanent work incapacity / TWI = temporary work incapacity / RHC = repayment health care / AOP = aid to other
person / TR = temporary removal
EU-OSHA – European Agency for Safety and Health at Work 34

Work-related musculoskeletal disorders in the transport sector - Belgium
Bone, joint and discuss pathology
PWI 2 0,38
Bone, joint and discuss disorders of the upper extremities caused by mechanical vibrations PWI 8 1,54
TR 1 0,19
Bone, joint and discuss diseases of the upper extremities caused by mechanical vibrations PWI 4 0,77
Bone, joint and discuss diseases of the back caused by mechanical vibrations PWI 357 68,65
Bone, joint and discuss diseases of the upper extremities and back caused by mechanical vibrations PWI 17 3,27
Tendinitis TR 3 0,58 PWI 2 0,38
Disorders of the bursae
Caused by pressure, subcutaneous cellulitis TR 1 0,19
PWI 1 0,19 RHC 1 0,19 General infestation (infectious kidney and nerve pathologies which don't occur among other headings)
Lead of -combinations
TR 1 0,19 Benzene TR 1 0,19 Malaria TR 6 1,15 Malaria RHC 2 0,38 Total 520 100,00
Table 30: Number of occupational diseases by pathology in transport, 2001-2005, FBZ
Pathology Decision Number % of total
A Hearing loss PWI 19 3,65
C Carpal tunnel TWI 21 4,04
D Skin diseases RHC 8 1,54
TWI 3 0,58
H Viral hepatitis PWI 1 0,19
L Lumbar disorders PWI 28 5,38
M leg and joint disorders, upper extremities PWI 2 0,38
N Nose-throat-ear pathology (except for deafness) PWI 2 0,38
R Respiratory system PWI 22 4,23
AOP 7 1,35
S Bone, joint and discuss pathology PWI 388 74,62
EU-OSHA – European Agency for Safety and Health at Work 35

Work-related musculoskeletal disorders in the transport sector - Belgium
Decision Pathology Number % of total
TR 1 0,19
T Tendinitis TWI 3 0,58
PWI 2 0,38
U Disorders of the bursae TWI 1 0,19
PWI 1 0,19
RHC 1 0,19
X General infestation (aantasting) (infectious kidney and nerve pathologies which don't occur among other headings) TWI 1 0,19
TR 7 1,35
RHC 2 0,38
Total 500 100,00
Most of the recognized occupational diseases correspond to workers in the age group 45-54 years old, followed by 55-64 and 35-44. Most victims are men.
Table 31: Number of recognised occupational diseases by gender and age, 2001-2005, FBZ
<25 25-34 35-44 45-54 55-64 65+ total
m f m f m f m f m f m f m + f
2001 0 0 1 0 25 1 67 0 57 0 7 0 158
2002 1 1 3 1 26 2 54 0 63 1 10 0 162
2003 0 0 3 3 15 2 59 0 44 1 15 0 142
2004 0 0 3 3 15 0 14 0 8 0 5 0 48
2005 0 0 1 1 6 1 11 0 3 0 4 0 27
total 1 1 11 8 87 6 205 0 175 2 41 0 537
3.3.3 Self-reported health problems
3.3.3.1 Musculoskeletal disorders The WBM 2004 shows that transport workers report more frequently muscular pain in arms or legs than the average working population. Almost one out of two transport workers reported neck-shoulder pain, about 45% of workers reported back pain and almost two out of three reported muscular pain in arms and legs in the last two weeks before the survey.
Table 32: Musculoskeletal disorders, in %, 2004
Transport Total Back pain 40.6 45.0
Pain in neck and shoulder 41.8 48.0
Pain in muscles in arms or legs 34.2 31.4
Question: Have you experienced … in the last two weeks?
Source: WBM
EU-OSHA – European Agency for Safety and Health at Work 36
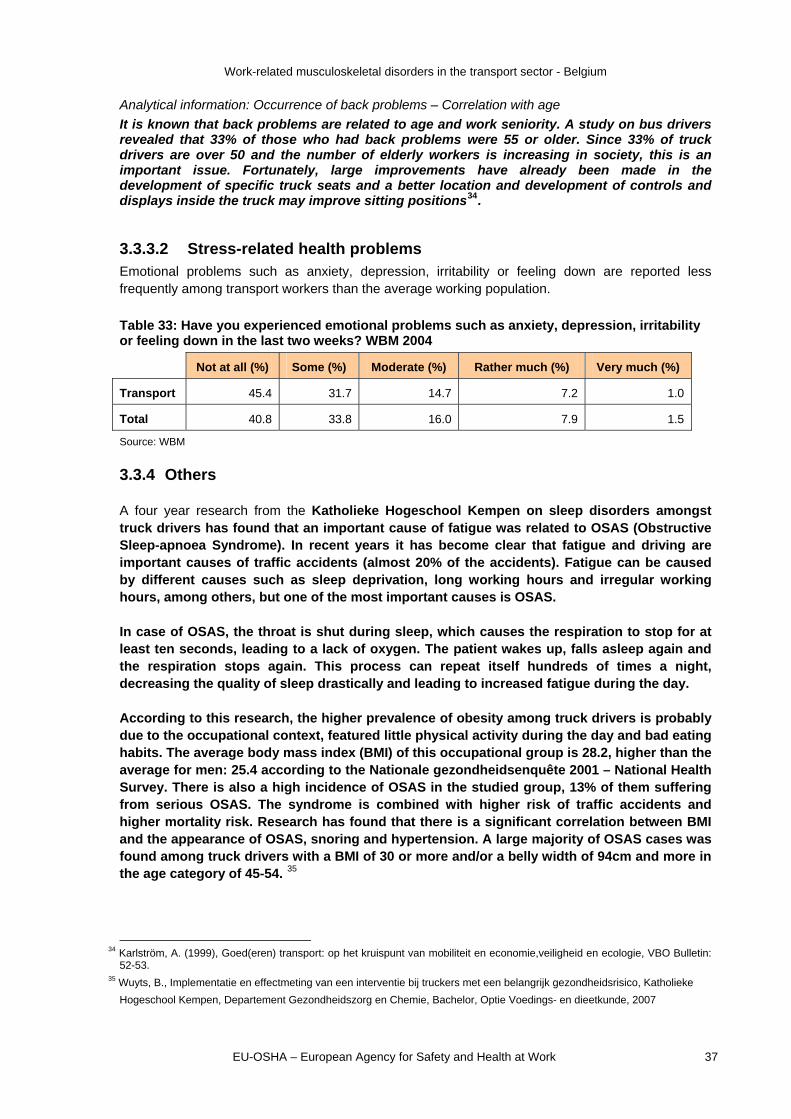
Work-related musculoskeletal disorders in the transport sector - Belgium
Analytical information: Occurrence of back problems – Correlation with age
It is known that back problems are related to age and work seniority. A study on bus drivers revealed that 33% of those who had back problems were 55 or older. Since 33% of truck drivers are over 50 and the number of elderly workers is increasing in society, this is an important issue. Fortunately, large improvements have already been made in the development of specific truck seats and a better location and development of controls and displays inside the truck may improve sitting positions34.
3.3.3.2 Stress-related health problems Emotional problems such as anxiety, depression, irritability or feeling down are reported less frequently among transport workers than the average working population.
Table 33: Have you experienced emotional problems such as anxiety, depression, irritability or feeling down in the last two weeks? WBM 2004
Not at all (%) Some (%) Moderate (%) Rather much (%) Very much (%)
Transport 45.4 31.7 14.7 7.2 1.0
Total 40.8 33.8 16.0 7.9 1.5
Source: WBM
3.3.4 Others
A four year research from the Katholieke Hogeschool Kempen on sleep disorders amongst truck drivers has found that an important cause of fatigue was related to OSAS (Obstructive Sleep-apnoea Syndrome). In recent years it has become clear that fatigue and driving are important causes of traffic accidents (almost 20% of the accidents). Fatigue can be caused by different causes such as sleep deprivation, long working hours and irregular working hours, among others, but one of the most important causes is OSAS. In case of OSAS, the throat is shut during sleep, which causes the respiration to stop for at least ten seconds, leading to a lack of oxygen. The patient wakes up, falls asleep again and the respiration stops again. This process can repeat itself hundreds of times a night, decreasing the quality of sleep drastically and leading to increased fatigue during the day. According to this research, the higher prevalence of obesity among truck drivers is probably due to the occupational context, featured little physical activity during the day and bad eating habits. The average body mass index (BMI) of this occupational group is 28.2, higher than the average for men: 25.4 according to the Nationale gezondheidsenquête 2001 – National Health Survey. There is also a high incidence of OSAS in the studied group, 13% of them suffering from serious OSAS. The syndrome is combined with higher risk of traffic accidents and higher mortality risk. Research has found that there is a significant correlation between BMI and the appearance of OSAS, snoring and hypertension. A large majority of OSAS cases was found among truck drivers with a BMI of 30 or more and/or a belly width of 94cm and more in the age category of 45-54. 35
34 Karlström, A. (1999), Goed(eren) transport: op het kruispunt van mobiliteit en economie,veiligheid en ecologie, VBO Bulletin:
52-53. 35 Wuyts, B., Implementatie en effectmeting van een interventie bij truckers met een belangrijk gezondheidsrisico, Katholieke
Hogeschool Kempen, Departement Gezondheidszorg en Chemie, Bachelor, Optie Voedings- en dieetkunde, 2007
EU-OSHA – European Agency for Safety and Health at Work 37

Work-related musculoskeletal disorders in the transport sector - Belgium
3.4 Legislation and policies
3.4.1 Legislation
A selection of the most relevant regulations is presented in the tables below. It covers directives or regulations regarding specific transport items, social security and labour protection as well as occupational safety and health topics.
3.4.1.1 Transport These legal documents refer specifically to the transport of dangerous substances. The scope is safety in the broad sense: protection of the safety of the population, the environment and goods as well as workers. Most provisions do not focus on the workers specifically but have an indirect impact on the working conditions of the drivers and other workers involved in the transport of dangerous goods. The most relevant provisions concern the appointment of a safety advisor and the strict requirements concerning vocational training: for the safety advisor, as well as for the drivers and other workers concerned.36 Royal Decree of 12.11.1998 concerning the transport of dangerous substances by road, with the exception of explosive and radioactive substances – ADR (OJ, 24.12.1998)
Transposes the ADR convention into the Belgian law: the latest version is applicable in Belgium from 1.1.2003
Royal Decree of 19.10.1998 implementing the Council Directive 95/50/EC of the Council of 06.10.1995 on uniform procedures for checks on the transport of dangerous goods by road (OJ 26.11.1998)
Implementation of Council Directive 95/50/EC on checks of transport
Royal Decree of 26.03.1993 concerning the (ADR) vocational training certificate for drivers of transport units transporting dangerous substances, other than radioactive substances, by road (OJ, 15.4.1993)
Implementation of Council Directive 89/684/EEC on vocational training: for a better risk prevention, drivers of dangerous goods by road are required to hold a vocational training certificate issued by the competent national authority, confirming that they have successfully completed appropriate training in the carriage of dangerous goods by road
Royal Decree of 1.7.1999 concerning the appointment and vocational qualification of safety advisors for the transport of dangerous substances by road, rail and inland waterway (OJ, 13.7.1999)
The main task of the adviser is to seek, under the responsibility of the employer, by all appropriate means and by all appropriate actions, within the limits of the relevant activities of the operator, to facilitate the conduct of those activities in accordance with the rules applicable and in the safest possible way.
Ministerial Decree of 1.7.1999 concerning the vocational qualification of safety advisors for the transport of dangerous substances other than classes 1 to 7 (OJ, 13.7.1999)
36 European Foundation for the Improvement of Living and Working Conditions, EU road freight transport sector: Work and
employment conditions – Belgian Survey, 2003
EU-OSHA – European Agency for Safety and Health at Work 38

Work-related musculoskeletal disorders in the transport sector - Belgium
Ministerial Decree of 11.10.1999 concerning the vocational qualification of safety advisors for the transport of dangerous substances of class 1 (OJ, 18.11.1999)
Other specific regulations exist for explosive substances, radioactive substances, waste. Other specific regulations concern content of the training courses of the safety advisors, traffic regulations , technical requirements such as speed limitation devices.
3.4.1.2 Social security and labour protection The general legal framework on social security, social protection and labour protection also apply to drivers and other transport workers. The social security regime includes provisions on heath insurance, disability and incapacity insurance, old age pension, annual leave, family benefits, and unemployment benefits. These regulations mainly apply to employees, the benefits from this regime for self-employed is limited. As a complement to the basic social security regime, a lot of provisions have been introduced into Belgian law due to European Community regulations, concerning the free movement of workers, the mutual recognition of diplomas etc. The most important derogating regulations refer to working time, flexible working hours, the definition of driving periods, breaks and rest periods, temporary working, etc. The legislation is completed by a series of Collective Work Agreements (CWA). Concluded trough negotiations by the social partners, these agreements become mandatory once adopted by Royal Decree. For the transport sector, more than 300 CWAs have been concluded. They include provisions that are more advantageous than the existing legal framework and that apply to the whole sector, or one or more branches, on social aspects such as working hours, reimbursement of costs (e.g. for training), special and circumstantial leave etc. All these legal instruments result in a very detailed regulatory framework which might be one of the reasons why no “soft law” instruments on working conditions have been uncovered. In particular, the strict requirements on vocational training and the detailed provisions on working time probably explain why no need is felt for further complementary (self)regulation.37
Access to the profession Transportation of goods Act of 3.5.1999 (OJ 30.06.1999) and the Royal Decree of 7.5.2002 on the transportation of goods by road (OJ 30.5.2002)
Deals with: the conditions for access to the profession and vocational certificate.
Social provisions
Royal Decree of 25.4.1986 on the working time for some workers of transport sector (OJ 27.5.1986)
Gives precisions on the notion ‘working time’, excluding certain periods (waiting time, time to sleep or rest, time to eat, …) : the specific regulations on the limitation of working time do not apply to these periods
37 European Foundation for the Improvement of Living and Working Conditions, EU road freight transport sector: Work and
employment conditions – Belgian Survey, 2003
EU-OSHA – European Agency for Safety and Health at Work 39

Work-related musculoskeletal disorders in the transport sector - Belgium
Royal Decree of 13.5.1987 implementing EC Regulation 3820/85 of 20.12.1985 on the harmonization of certain social legislation relating to road transport (OJ 4.6.1987)
Implemented Regulation 3820 by listing the types of valid certificates for vocational qualification, appointing the competent authorities for control and determining the sanctions in case of violation A series of vehicles or transport is exempted.
Royal Decree of 13.7.1984 (modified by the Royal Decree of 10.11.1987) implementing EEC Council Regulation 3281/85 of 20.12.1985 on recording equipment in road transport (OJ 4.10.1984)
Implemented Regulation 3821/85 by determining the modalities of the recording equipment for periodic control, the modalities of controlling, the sanctions and the list of vehicles that are exempted
Regulations concerning the Belgian social security regime
Regulations applied to all employees (workers under employment contract) in Belgium and concerning: health insurance and disability or incapacity insurance, old age pension, yearly vacation, family benefits, unemployment benefit.
Employment contracts Act of 3.7.1987
General rights and obligations, applicable to all workers with an employment contract, as well as limitation of civil liability for workers to fraud, serious offence, repetitive minor fault
Collective work agreements, some examples:
More than 300 collective work agreements have been concluded for the transport sector. These agreements include derogations, often more advantageous provisions than the general framework and apply to the whole sector or one or more branches.
CWA of 15.5.1997 for the promotion of the employability for driving and non-driving workers
Employability measures précising conditions and possibilities for part time jobs, early retirement, vocational training, flexible working hours, …
CWA of 15.12.1999 on payment for interim time
CWA of 8.7.1993 on the working conditions and salary for transport of goods and CWA of 28.05.2002 for buses
CWA’s on holidays Guarantees the payment of 10 official holidays per year
CWA’s on the reimbursement of costs Reimbursement of costs of driving license
CWA’s on special leave
Special leave for family events and special occasions (marriage etc.) of civil duties : payment of salary is guaranteed for a certain period.
CWA’s on circumstantial leave For family reasons, workers can be absent during max. 10 days a year without salary.
Act of 05.03.2002 regarding the principle of non-discrimination for part time workers (13/03/2002) and Royal Decree of 28.01.2002 implementing the Council Directive 97/81/EC
Act of 26.06.02 regarding the principle of nondiscrimination for fixed-term work.
EU-OSHA – European Agency for Safety and Health at Work 40

Work-related musculoskeletal disorders in the transport sector - Belgium
3.4.1.3 Occupational safety and health Aside from the obligation to appoint a safety advisor, no specific legal provisions on occupational safety and health have been found for the transport sector. Hence, the general framework applies. Since 1996, occupational safety and health is covered by the Well-being regulations, including the traditional field of technical safety and health, as well as three new fields focusing on the quality of working conditions: ergonomics, psychosocial factors, and violence, mobbing, and sexual harassment. Every employer has the obligation of carrying out a prevention policy, to implement a dynamic risk management system based on a risk assessment where a series of mandatory prevention principles need to be applied. Every company has to appoint a prevention officer assisting the management in the implementation of the prevention policy. Specific regulations apply for specific risks. According to the ABVV-BTB union, several shortcomings exist, e.g.: Regarding medical survey for workers at safety jobs: a transport driver is not necessary a risk
for his colleagues, but can be a risk for other road users; Working at heights does not foresee issues for drivers when they put a tarpaulin across the
loading38
Wellbeing Act of 4.08.1996 on the wellbeing of workers during the execution of their work
Wellbeing Code regrouping all the Royal
Decrees that implement the Well being Act (RD
Prevention Policy, RD Internal Prevention
Service, RD External Prevention Service, RD
Young workers, etc.)
General Regulations on Occupational Safety and Health (the remaining part of the former executive decrees based on the former Health and Safety Act 1952)
The Wellbeing Act transposes the European
Framework Directive and is applicable to all employers of the private as well as the public sector. These regulations oblige the employer to implement a dynamic risk management system, based on a risk assessment, where a series of prevention principles are applied. Every company must have a prevention officer, who will assist the management in implementing the mandatory prevention policy. Besides this general framework with target-setting obligations, a series of specific obligations for specific risks remain (e.g. violence, mobbing and sexual harassment at the workplace).
Accidents at Work Act of 10.4.1971
Occupational diseases Act of 3.6.1970
Guarantees, under certain conditions, immediate compensation for the victims and obliges the employer to take insurance.
3.4.2 Policies
3.4.2.1 Sectoral level
3.4.2.1.1 FEBETRA FEBETRA has composed, together with the International Road Transport Union (IRU), a practical traffic safety manual that tries to motivate and concern people on issues such as the prevention of accidents, maintenance of materials, training and learning. Another IRU initiative regarding traffic
38 European Foundation for the Improvement of Living and Working Conditions, EU road freight transport sector: Work and
employment conditions – Belgian Survey, 2003
EU-OSHA – European Agency for Safety and Health at Work 41
Work-related musculoskeletal disorders in the transport sector - Belgium
safety is the international award for the best truck driver. On a national level a safety charter was developed in 2002 that includes 5 elementary rules:
Extra attention to the weaker road-users;
Be courteous and calm;
Always be fit;
Keep sufficient distance;
Follow the speed limits.
3.4.2.1.2 SAV
SAV (Koninklijke beroepsorganisatie van de Vlaamse wegvervoerders en logistieke dienstverleners – Royal federation of Flemish carriers and logistics service providers) has developed the project ‘Safety Culture’. The goal is to provide different types of tools for professional carriers and logistics service providers in order to achieve a safe working environment throughout the entire enterprise. A self-assessment test enables the company to assess the safety level in the company; this test gives a score and feedback on the negative and positive aspects of the company’s safety policy. A second tool comprises a screening of the truck drivers. This allows the employer to screen the drivers’ ergonomic, ecological and safety behaviour. Based on the results the employer can decide which drivers need further training.
Source: http://www.sav.be/main.asp?info=veiligheidenimago/veiligheidscultuur
3.4.2.2 Company level - Transport Van Dievel: safe driving linked to fuel consumption
Van Dievel Transport is a ‘full-load” transport company, with about 90 truck drivers, active in the Benelux, France and Germany. The transport of goods includes also loading and unloading trucks.
The company has been working on a safety culture for several years. Van Dievel gives a lot of attention to safety and ergonomics in the selection of trucks, speed limit on trucks, specific safety requirements for trailers, use of special mirrors and cameras, new communication techniques and computer, hands-free mobile telephone -only to own company-, severe maintenance programme, study of the lifting equipment and the unloading bay’s in the companies where they have to deliver goods.
Furthermore, they have a dynamic training programme to develop and promote safe driving behaviour. Young and new drivers have to follow an intensive practical training. First, all the rules and principles are explained for safe driving. Then a safety coach (team of 10 safety coaches is available) accompanies the new driver and gives feedback about their driving behaviour. In this first period some candidate drivers are refused. Afterwards all the principles of safe driving are repeated and promoted in different ways: toolbox meetings, information sheets, safety messages and results in internal communication, individual feedback.
One of the most important actions is the ‘Eco-proactive training programme’. The principle behind this programme is the relationship between safe driving and economical driving (fuel consumption). The initiators of the programme were also convinced of a positive influence on the mental and psychosocial workload of the drivers. It was also shown that this safe and ecologic driving style was not slower.
The advantages of this Eco-proactive training programme are:
more driving comfort and less stress.
more possibilities for anticipation and safe driving.
less fuel consumption.
EU-OSHA – European Agency for Safety and Health at Work 42

Work-related musculoskeletal disorders in the transport sector - Belgium
EU-OSHA – European Agency for Safety and Health at Work 43
When it comes to measuring the results of the programme, between 2001 and 2006 there was a strong decrease (70%) in the number of accidents, placing the company well under the sector average.
3.4.3 Initiatives
A collaboration protocol was established between the social partners and the Flemish Minister of Employment for the period December 2000–October 2003. The most important issues are:
Improvements for employment (specific actions to attract female and foreign workers). Education and recognition of the profession. Improvement of starting jobs for youngsters. Specific measures for elderly workers. To establish this protocol, two sector advisers were hired and were working at the Social
Fund. Several initiatives regarding training and education have already been developed and are presented below:
The Institute for Road Transport (IWT-ITR): the board of the institute is represented by governmental services (mobility and traffic) and employers’ organisations from the road transport of goods sector. The aims are to stimulate and coordinate studies and research, to coordinate road transport of goods and to help the government in further organisation and development.
The Belgian Institute for Transport Organisations (BITO): its aims are to provide qualitative support to the sector, to stimulate the recognition of diplomas and to organise examinations. BITO is also a center for the transfer of knowledge by cooperating with several knowledge centers in the country.
The Belgian Institute for Traffic Safety (BIVV) organises awareness campaigns on general traffic issues or oriented towards specific risk groups. Between 2000-2001 they organised campaigns on drinking and driving, use of the safety belt, pedestrians, going back to school at the start of a new school year etc. In 2003 they organised a campaign on driving fatigue specifically for truck drivers, including a publication and brochures.