Embed Size (px)
Citation preview

p. 1 of 18 5/7/2010
Oscillation in a Network Model of Neocortex
Jennifer Dwyer1, Hyong Lee
1, Amber Martell
1,
Rick Stevens2,3
, Mark Hereld2,3
, and Wim van Drongelen1,2
1 The University of Chicago, Department of Pediatrics, 5841 South Maryland Avenue,
Chicago, IL, 60637, USA
2 The University of Chicago, Computation Institute, 5640 South Ellis Avenue,
Chicago, IL, 60637, USA
3 Argonne National Laboratory, Mathematics and Computer Science Division, 9700
Cass Avenue, Argonne, IL, 60439, USA

p. 2 of 18 5/7/2010
1 Introduction
Brain activity can be studied at multiple levels, ranging from synapses to
single neurons to networks of millions of nerve cells. Gaining understanding of the
complex, opaque relationships between activities across the microscopic and
macroscopic levels is a major goal in neuroscience, because it would be a tremendous
help to unravel the underpinning of both normal and pathological function. For
example, one would be able to describe how individual neural components interact to
generate the γ-rhythm of the electroencephalogram (EEG), how neurons go awry
during an epileptic seizure, or how they generate a steering signal for a muscle group.
Current experimental techniques cannot capture the behavior of all the
individual neural components of a large network in sufficient detail:
electrophysiology lacks the spatial resolution for measuring individual cells in a
network, while imaging techniques lack temporal resolution. Data collected from
computational models of neural networks are not thus limited and therefore can reveal
individual and aggregate neuronal activity at the same time [12, 17, 18, 19, 20].
Traditional network models usually contain neurons with integrate-and-fire
properties. Recently it was recognized that neurons can also have inductor-like
resonant characteristics (reviewed in [8]). Depending on the voltage-dependence of
stabilizing ion channels, these characteristics can be simulated with models that
include biophysically realistic channels (e.g., [9]). Since brain rhythms are believed to
play a critical role in neural processing (e.g., [3]), it is important to establish how such
resonant properties affect network dynamics.
The purpose of this study is to model and examine the relationship between
cellular and network oscillations. We examine network activity in a previously
developed neuronal model of neocortex with biophysically realistic ion channels
following the Hodgkin and Huxley formalism [7, 11, 19, 20]. We determine the
resonant properties of single neocortical cells and study how these properties relate to
onset and offset of network oscillations.

p. 3 of 18 5/7/2010
2 Methods
Modeling.
Because the histo-physiology of neocortex is not described at the same level of
detail as other areas in the brain, such as hippocampus, we focus on replicating the
general network characteristics of neocortical circuitry. Therefore we include
excitatory and inhibitory neuronal populations, recurrent excitation, inhibition,
disinhibition, direct electrical contact between the inhibitory cell types, and feedback
and feedforward loops. Because thalamic input is not of primary interest for intrinsic
cortical oscillations, we focus on the pyramidal neurons and neglect stellate cells.
Inhibitory neurons, although a minority in the cortex, are more variable than the
excitatory neuronal population. In the current model we focus on the inhibitory
neurons that predominantly connect to soma and initial segment and that have
significant horizontal spread (relevant for propagation of cortical activity).
Details of the model are described in [18, 19, 20]. Briefly, the neural network
representing neocortex includes excitatory and inhibitory neuronal populations with a
multicompartmental representation for each cell type. Sodium and potassium channels
following the Hodgkin and Huxley formalism are included in the soma and initial
segment compartments of the cell models. Excitatory synaptic function was simulated
with an alpha function (time constant 1-3 ms), while inhibitory synaptic activity was
modeled by a dual exponential function with time constants of 1 and 7 ms.
The excitatory component of the network (Fig. 1) consists of superficial
pyramidal cells from cortical layers 2/3 (S, Fig. 1) and deep pyramidal cells from
layers 5/6 (D, Fig. 1). The network inhibition is provided by three types of basket
cells and the chandelier cell (I, Fig. 1), all of which receive input from both types of
pyramidal neurons. The basket cells inhibit the pyramidal cell soma, whereas the
chandelier cells directly inhibit the initial segment. The model captures essential
features of neocortical microcircuitry: we use a ratio of 4:1 for excitatory to inhibitory
neurons; excitatory synapses end on the dendritic portion and the inhibitory ones on
the soma, initial segment, and dendrites [4]; connections include recurrent excitation,
reciprocal inhibitory contacts, axo-axonic interneurons, and nearest-neighbor gap
junctions (R, Fig. 1) between inhibitory cells [1]. The neurons are placed in a three-
dimensional grid with realistic cell density and network connectivity based on
histological and physiological studies [4, 5, 6, 10, 13, 14].

p. 4 of 18 5/7/2010
The computational model is implemented in the parallel GENESIS neural
simulator [2]. Extracellular activity was obtained as the weighted sum of currents
generated by the model cells’ somas [15]. Depending on the overall levels of synaptic
excitation E and inhibition I, the model displays a variety of EEG rhythms; for
example, with I=2.0, the model produces desynchronized activity (E>~3.0), network
bursts (E<0.5), or oscillations around 28 Hz (0.5<E<3.0) [18].
Two sets of simulations were preformed. In the first, one of each cell type in a
656-cell network was primed with a 300 pA current injection for 200 ms; thereafter,
the simulation was allowed to progress without further stimulation. The network
coupling (E & I) were set so that the network would oscillate. In the second set of
simulations, the response of the model neurons and network to the frequency of
external stimulation was evaluated by injecting sinusoidal currents. A 1 nA current (1-
100 Hz) applied to the soma of a single model cell elicited a response just below its
spiking threshold. Network stimulation during bursting activity was modeled by
injecting a 30 pA sinusoidal current into 25% of the superficial pyramidal cells in
their distal apical dendrite compartments. We varied the frequency of this current
between 1 and 300 Hz.
Experimental Procedures. Coronal slices (500 µm) were prepared from CD-1 mice
ages P8-12 and transferred into artificial cerebral spinal fluid (ACSF) consisting of (in
mM) 118 NaCl, 25 NaHCO2, 30 glucose, 3 KCl, 1 NaH2PO4, 1 CaCl2, and 1 MgCl2
(pH 7.4). Patch pipettes and electrodes for extracellular recordings were manufactured
from glass capillaries and filled with intracellular solution containing (in mM) 140 D-
gluconic acid, 10 EGTA, 10 HEPES, 2 MgCl2, 1 CaCl2, 4 Na2ATP (pH 7.2). Layer 5
pyramidal neurons in the frontal cortex were patched using the blind-patching
technique. The resonant properties of each neuron were measured by recording the
cellular voltage response to intracellularly-injected sinusoidal current stimuli that
ramped linearly in frequency from 0 to 15 Hz over 30 seconds (ZAP input).
Extracellular recordings were performed in layer 5/6 frontal cortex using pipettes
filled with bath ACSF solution. Network resonance was evaluated by delivering the
ZAP current through a second stimulation electrode placed in layer 5/6. The
measurement was repeated after blocking action potential generation (and synaptic
transmission) by bath application of 1 mM tetrodotoxin (TTX) in order to verify the
biological origin of the signal.

p. 5 of 18 5/7/2010
3 Results
Role of Neuronal Resonant Properties in Network Oscillation. A sample of the EEG
generated by the simulated neocortical patch is shown in Fig. 2A and the
corresponding amplitude spectrum in Fig. 2B. These oscillations are also observed in
the membrane potentials of individual neurons in the simulation (Fig. 2C, D).
Although different cells show very different suprathreshold (spiking) behavior during
the network oscillation, their subthreshold oscillations are remarkably similar and
synchronized (Fig. 2C). Frequency analysis of each neuron’s activity shows a strong
component around 28 Hz, the same frequency as the EEG oscillation. The dominant
peak in the amplitude spectrum reflects the predominant frequency of the
subthreshold oscillations; while, the harmonics correspond to the varying degrees of
spiking behavior among individual neurons. When isolated model neurons are
stimulated with sinusoidal signals of varying frequencies, their responses display a
resonant peak around 30 Hz (Fig. 2E, F): not identical, but very close, to the dominant
frequency of the network oscillations.
Offset of Network Bursting in the Model. In a second set of simulations we evaluated
how effectively one might stop network bursting patterns with electrical stimulation.
The upper trace in Fig. 5A depicts the EEG of a bursting network , and the six bottom
traces show examples of how the EEG is altered by electrical stimulation with a
sinusoidal current of different frequencies (ranging between 2 and 127 Hz). The graph
in Fig. 5B shows how well different frequencies attenuate the network bursts. The
stimulus is most effective in the range of the cellular resonance (~30 Hz).
The Membrane Equivalent Circuit and Resonance. The close relationship observed
between the resonant behavior of individual neurons and the dominant oscillatory
frequency of the network has important implications for elucidating mechanisms
underlying oscillatory behavior across macroscopic and microscopic levels. To
analyze how intra-cellular components might contribute to resonance, we follow [8]
and represent the electrical properties of a neuronal membrane as a parallel RLC
circuit (see Fig. 3A,B). The fundamental concept is that passive properties of the cell
membrane (i.e., membrane resistance R and membrane capacitance C) interact with

p. 6 of 18 5/7/2010
an active current or currents (represented by the inductor in series with a resistor). As
a whole, the circuit acts as a band-pass filter: in other words, it exhibits resonance.
From a dynamical systems point of view, the RC portion of the circuit can be
described by a one-dimensional system whose equilibrium at rest is a node and is
therefore incapable of producing oscillatory behavior. A simple parallel RC circuit
can be used to model the linear subthreshold behavior of an integrator-type neuronal
membrane. In order to model the properties of resonator neurons, a second dimension
must be incorporated so that oscillations are possible near rest. A so-called resonate-
and-fire (RF) neuron is the simplest example of a linear, two-dimensional model
system that exhibits resonator-like properties [9, 16]. Furthermore, the RF neuron’s
subthreshold behavior can be modeled by the equivalent circuit shown in Fig. 3B, a
simplified version of the Hodgkin and Huxley neuronal membrane model [7] depicted
in Fig. 3A. The inductor-resistor series component of the circuit in Fig. 3B is a good
model for an ion channel capable of producing resonance. An inductor, which
generates an electromotive force that opposes the injected current to the circuit, is
analogous to a resonant channel, such as the delayed rectifier potassium channel, that
can oppose changes in membrane voltage by, for example, activating outward current
upon depolarization.
To gain a more intuitive understanding of how resonance arises in the cell, we
approximate the RLC impedance curve as follows. First, we consider the effective
impedance (ZRC) for the resistor (Rm) and capacitor (Cm) in parallel separately from
the impedance for the inductor (LK) and resistor (RK) in series (ZLR). From the usual
rule for adding impedances in parallel,mmCRRC fC
i
RZZZmm
2
1111 . As a result,
|ZRC| must be smaller than either mRZ or
mCZ (these limits, with the exact solution
for |ZRC|, are shown and labeled accordingly in Fig. 3C). We also note that
KKRLLR RfLiZZZKK
2 , so that |ZLR| must be greater than either KLZ or
KRZ (dotted line, indicated LKRK, in Fig. 3C). Finally, the effective impedance for the
entire circuit, Z, is given by RCLR ZZZ
111 ; neglecting for the moment the relative
phase angle of the components, |Z| can be approximated as being less than either |ZRC|
or |ZLR|. As the exact solution to |Z| (dotted curve indicated “whole cell impedance” in

p. 7 of 18 5/7/2010
Fig. 3C) illustrates, combining these constraints can help estimate whether, and at
what frequency, a resonant peak exists in the cell’s impedance curve. Conversely, it
is possible to estimate the values of the circuit elements from the impedance curve.
Properties of Ion Channels and Resonance. Simplifying further, if the circuit in Fig.
3B is under voltage clamp, we can disregard the contribution of the Cm branch
(because the membrane is charged directly by the voltage clamp electrode, not
through the membrane resistance, the voltage across the capacitor tracks the set point
voltage rapidly compared to any timescales relevant to the channels in the
membrane). If, in addition, we consider just the conductance due to potassium (e.g.,
if all other channel types are blocked pharmacologically), the circuit reduces to only
the RK and LK components in series with the voltage clamp command potential V (Fig.
3D). This simplified circuit allows us to describe the current response (the output
measured in a voltage clamp experiment) to a voltage step as follows:
tL
R
K
K
K
eR
VtI 1)( .
The channel time constant K is equal toK
K
R
L, so finding the values of KL and
KR provides the time constant of the ion channel (or channels) primarily responsible
for the resonance peak (see the impedance plots in Fig. 3C: KL is estimated from the
value of the total impedance at the resonance peak, while KR is roughly the low-
frequency baseline value of the total impedance).
We now show an example of how to calculate K . Fig. 2F shows the
impedance curve from a model pyramidal cell; point 3 indicates the impedance Zres at
the resonant frequency fres, point 1 shows the low frequency limit of the impedance Z1
at f1 << fres and point 2 indicates the impedance Z2 at a high frequency f2>>fres. To
estimate the channel time constant:
(1) Find mC from f2, Z2: At f2 the capacitor contributes most of the impedance
Z2 (see Fig. 3C), so mC can be estimated by substituting 2f = 61.35 Hz and
2Z = 50 MΩ into )2(
1
22 ZfCm
= 5.2 × 10
-5 µF.
(2) Estimate KL from fres, mC : At fres, the total impedance consists of roughly
equal contributions from the capacitor and inductor:
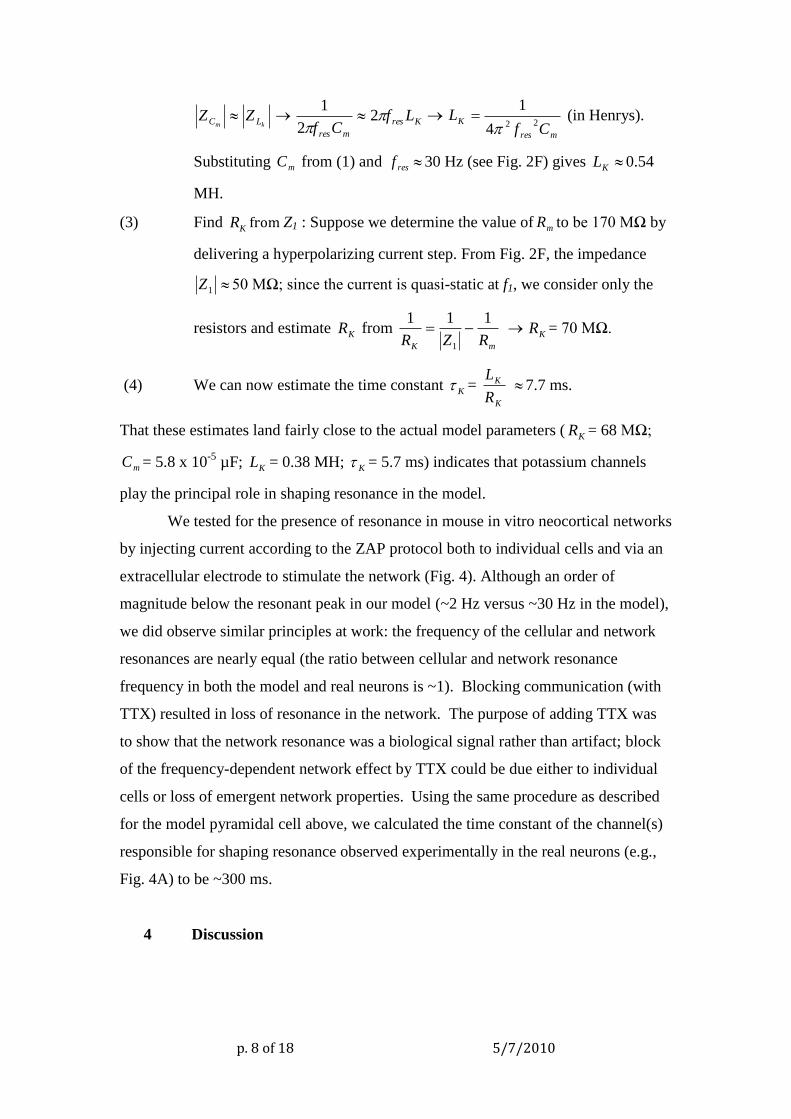
p. 8 of 18 5/7/2010
km LC ZZ Kres
mres
LfCf
22
1
mres
KCf
L224
1
(in Henrys).
Substituting mC from (1) and resf 30 Hz (see Fig. 2F) gives KL 0.54
MH.
(3) Find KR from Z1 : Suppose we determine the value of mR to be 170 MΩ by
delivering a hyperpolarizing current step. From Fig. 2F, the impedance
1Z 50 MΩ; since the current is quasi-static at f1, we consider only the
resistors and estimate KR from mK RZR
111
1
KR = 70 MΩ.
(4) We can now estimate the time constant K = K
K
R
L 7.7 ms.
That these estimates land fairly close to the actual model parameters ( KR = 68 MΩ;
mC = 5.8 x 10⁻⁵
µF; KL = 0.38 MH; K = 5.7 ms) indicates that potassium channels
play the principal role in shaping resonance in the model.
We tested for the presence of resonance in mouse in vitro neocortical networks
by injecting current according to the ZAP protocol both to individual cells and via an
extracellular electrode to stimulate the network (Fig. 4). Although an order of
magnitude below the resonant peak in our model (~2 Hz versus ~30 Hz in the model),
we did observe similar principles at work: the frequency of the cellular and network
resonances are nearly equal (the ratio between cellular and network resonance
frequency in both the model and real neurons is ~1). Blocking communication (with
TTX) resulted in loss of resonance in the network. The purpose of adding TTX was
to show that the network resonance was a biological signal rather than artifact; block
of the frequency-dependent network effect by TTX could be due either to individual
cells or loss of emergent network properties. Using the same procedure as described
for the model pyramidal cell above, we calculated the time constant of the channel(s)
responsible for shaping resonance observed experimentally in the real neurons (e.g.,
Fig. 4A) to be ~300 ms.
4 Discussion

p. 9 of 18 5/7/2010
Although one would expect the suprathreshold behavior of neurons to be most
important for the network’s activity, and therefore the generated local field potentials
and EEG, we show that subthreshold resonant behavior may determine spike timing
and that synchronized subthreshold oscillation significantly contributes to the
compound electrical activity generated by the population of neurons in the network.
We acknowledge that it is difficult to unravel cause and effect, and that mechanisms
promoting oscillations as an emergent property of the network’s spiking activity offer
possible explanations; however,the population of cells in the network creates
sufficient activity to sustain oscillations in the neuron’s membrane potential and the
likelihood of sustained oscillations is highest near the peak of the single-cell
resonance curve. These subthreshold oscillations affect the probability of action
potential generation (Fig. 2C), thereby influencing overall spike timing in the
network. At reasonable levels of spiking activity, the subthreshold oscillations in
individual neurons become synchronized and together generate an oscillating
extracellular current observable in the EEG signal. From the perspective of the
network function, the oscillatory activity propagates back and forth between the
superficial and deep layers [20].
From the analysis of the cell model’s membrane equivalent circuit (Fig. 3), we
confirm that the resonate-and-fire behavior seen in Fig. 2C can be explained with the
inductive properties of the membrane [8]. To the best of our knowledge this is the first
procedure that directly relates induction to the time constant of the membrane’s
resonant ion currents. We validate this procedure in our model by correctly estimating
the known time constant of the K+ channel from the impedance measurement of the
pyramidal cell in Fig. 2F. Applying this relationship between the cell’s impedance and
the resonant current to data recorded from slices of mouse neocortex, we show that
inductive properties in real neurons are associated with a time constant of several
hundred milliseconds. This estimate indicates that the ion current responsible is
significantly slower than the delayed rectifier potassium current. Thus if, as in our
model neurons, potassium channels play a major role in the resonance we observed in
mouse neocortical pyramidal neurons, we can exclude channels with relatively rapid
activation (such as KDR or KA) from consideration; more probable contenders such as
KM must be further investigated experimentally.
The ultimate goal of our computational modeling effort is to create a virtual
nervous system. In such a virtual environment one can study spontaneous and

p. 10 of 18 5/7/2010
perturbed activity patterns, thereby generating insight into neural function across
scales. In our example, presented in Fig. 5, we show a relationship between the
effectiveness of electrical stimulation of the network and the resonant frequency of
the neurons. Insight into relationships across scales not only sheds light on brain
function and malfunction, but it can also be used for computer-aided design of brain-
computer interfaces. This approach may help to determine what signals are most
effective as steering input to an interface (e.g., for a robotic arm), or it may provide a
strategy for developing algorithms to decompose compound signals into more
effective individual steering components.

p. 11 of 18 5/7/2010
Acknowledgements
This work was supported by the Falk Foundation; the National Science
Foundation (CNS-0509332); the Office of Advanced Scientific Computing Research,
Office of Science, U.S. Dept. of Energy under Contract DE-AC02-06CH11357; the
American Epilepsy Society; the ARCS Foundation; and the University of Chicago
MSTP and GDTP training programs.
References
[1] Y. Amitai, J.R. Gibson, M. Beierlein, S.L. Patrick, A.M. Ho, B.W. Connors, and
D. Golomb, The spatial dimensions of electrically coupled networks of interneurons
in the neocortex, J Neurosci. 22 (2002) 4142-4152.
[2] J.M. Bower and D. Beeman, The Book of Genesis (Springer Verlag, New York,
1998).
[3] G. Buzsáki, Rhythms of the brain (Oxford University Press, New York, 2006).
[4] J. DeFelipe, L. Alonso-Nanclares, and J.I. Arellano, Microstructure of the
neocortex: comparative aspects, J. Neurocytol. 31 (2002) 299-316.
[5] D. Feldmeyer and B. Sakmann, Synaptic efficacy and reliability of excitatory
connections between principle neurones of the input (layer 4) and output (layer 5) of
the neocortex, J. Physiol. 525 (2000) 31-39.
[6] B.A. Hellwig, A quantitative analysis of the local connectivity between pyramidal
neurons in layer 2/3 of the rat visual cortex, Biol Cybern. 82 (2000) 111-121.
[7] A.L. Hodgkin and A.F. Huxley, A quantitative description of membrane current
and its application to conduction and excitation in nerve, J. Physiol. 117 (1952) 500-
544.
[8] B. Hutcheon and Y. Yarom, Resonance, oscillation and the intrinsic frequency
preferences of neurons, Trends Neurosci. 23 (2000) 216-22.
[9] E.M. Izhikevich, Dynamical Systems in Neuroscience: The Geometry of
Excitability and Bursting (MIT Press, Cambridge, MA, 2007).
[10] L.S. Krimer and P.S. Goldman-Racik, Prefrontal microcircuits: Membrane
properties and excitatory input of local, medium and wide arbor interneurons, J.
Neurosci. 21 (2001) 3788-3796.

p. 12 of 18 5/7/2010
[11] H.C. Lee, M. Hereld, R. Stevens, and W. Van Drongelen, Epileptiform activity
patterns in coupled neural networks, 5th International Conference BEM & NFSI,
Minneapolis, MN, 2005.
[12] W.W. Lytton, Computer modelling of epilepsy, Nat. Rev. Neurosci. 9 (2008)
626-637.
[13] V.B. Mountcastle, The columnar organization of the neocortex, Brain 120 (1997)
701-722.
[14] R. Nieuwenhuys, The neocortex: An overview of its evolutionary development,
structural organization and synaptology, Anat. Embryol. 190 (1994) 307-337.
[15] P.L. Nunez, Electric fields of the brain: the neurophysics of EEG (Oxford
University Press, Oxford, 1981).
[16] S.H. Strogatz, Nonlinear Dynamics and Chaos: With Applications to Physics,
Biology, Chemistry, and Engineering (Da Capo Press, Cambridge, MA, 2001).
[17] R.D. Traub, D. Contreras, M.O. Cunningham, H. Murray, F.E. LeBeau, A.
Roopun, A. Bibbig, W.B. Wilent, M.J. Higley, and M.A. Whittington, Single-column
thalamocortical network model exhibiting gamma oscillations, sleep spindles, and
epileptogenic bursts, J. Neurophysiol. 93 (2005) 2194-2232.
[18] W. van Drongelen, H.C. Lee, H. Koch, M. Hereld, F. Elsen, Z. Chen, and R.L.
Stevens, Emergent epileptiform activity in neural networks with weak excitatory
synapses, IEEE Trans. Neur. Sys. & Rehab. 13 (2005) 236-241.
[19] W. van Drongelen, H. Koch, F.P. Elsen, H.C. Lee, A. Mrejeru, E. Doren, C.J.
Marcuccilli, M. Hereld, R.L. Stevens, and J.M. Ramirez, The role of persistent
sodium current in bursting activity of mouse neocortical networks in vitro. J.
Neurophysiol. 96 (2006) 2564-2577.
[20] W. van Drongelen, H.C. Lee, R.L. Stevens and M. Hereld, Propagation of
seizure-like activity in a model of neocortex, J. Clin. Neurophysiol. 24 (2007) 182-
188.

p. 13 of 18 5/7/2010
Figures
Fig. 1: Diagram of the neocortical model and the associated EEG electrodes. Included
are superficial pyramidal neurons (S), deep pyramidal cells (D), and inhibitors (I).
The pyramidal cells are the excitatory component with short-range and long-range
connections (in steps of ~1 mm), the inhibitors inhibit the pyramidal cells and each
other and have only short-range connections (not shown in the diagram). Each type of
inhibitory neuron has interconnections via gap junctions, indicated by the resistor
symbol (R). During oscillatory activity, symbolized with the stippled arrows, there is
activity propagating between the superficial and deep layers. These oscillations are
reflected in the compound signals recorded from the EEG electrodes.

p. 14 of 18 5/7/2010
Fig. 2: Resonance and oscillatory activity across different levels in the model. Panels
(A) and (B) show the time and frequency domain representations of the compound
activity from the EEG electrode. The dominant oscillation of ~28 Hz is indicated by
the arrow in panel (B). Panels (C) and (D) show oscillations in individual superficial
pyramidal cells during the same EEG epoch (spikes in (C) are truncated). These cells
have different levels of activity varying from non-spiking (cell 3), to occasional firing
(cell 2), to continuous spiking (cell 1). The subthreshold signal component shows
somewhat synchronized oscillations in all neurons, and the associated amplitude
spectrum (D) shows that these oscillatory components are located at ~28 Hz (arrow),
the same frequency as the EEG in panel (B). The harmonics in the amplitude

p. 15 of 18 5/7/2010
spectrum are associated with the action potentials. Single-cell resonance can be
recorded by injecting currents at a range of frequencies and recording the response in
the membrane potential (E). The neuronal resonance can be expressed as the ratio of
membrane potential amplitude and injected current amplitude, that is, the impedance
(F). The peak of the cellular resonance is in the same area (~30 Hz) as the
subthreshold oscillations of the neurons and the network oscillations.
Fig. 3: (A) Hodgkin and Huxley neuronal membrane equivalent circuit including
sodium, potassium, and leak channels (represented by RNa, RK, and RL, respectively).

p. 16 of 18 5/7/2010
Batteries shown represent the equilibrium potentials (ENa, EK, and EL) for the
respective channels. (B) Equivalent circuit model for a resonate-and-fire (RF) neuron
simplified from panel (A). Batteries are omitted from the figure. (C) RF circuit
elements interact to produce a peak in the impedance curve for the whole cell
indicating resonance. Impedance traces are from the inductor (LK), resistor in series
with inductor (RK), membrane resistance (Rm), and membrane capacitance (Cm). The
dotted curves show the combined impedances for the RmCm, RKLK, and the whole cell
model. (D) A simplified circuit of the membrane under voltage-clamp conditions that
represents the potassium channel behavior.
Fig. 4: Cellular (A) and network resonance (B) in mouse neocortical tissue in vitro.
The resonance properties of real neural structures were examined by injection of a
ZAP current, a signal for which the frequency increases from 0 to 15 Hz over time,
top traces in panels (A) and (B). In both the cell and network we see resonance
occurring at 1.6 Hz and 1.9 Hz respectively (arrows, panel (A) and (B)).

p. 17 of 18 5/7/2010
Fig. 5: Effect of electrical stimulation in a bursting model network. The top trace in
panel (A) shows the EEG of a bursting network. When stimulating the network with
sinusoidal currents at different frequencies, both the amplitude and frequency of the
network bursting is affected (panel (A), six bottom traces with stimulus frequencies
ranging from 2 to 127 Hz). The ratio between the amplitude of the network bursts
with and without electrical stimulation is plotted versus the stimulus frequency in
panel (B).