Embed Size (px)
Citation preview

Orthopedic Contract Manufacturing
Industry Overview
November 30, 2012
Investment banking services are provided by Harris Williams LLC, a registered broker-dealer and member of FINRA and SIPC, and Harris Williams
& Co. Ltd, which is authorised and regulated by the Financial Services Authority. Harris Williams & Co. is a trade name under which Harris Williams
LLC and Harris Williams & Co. Ltd conduct business.

1 - 0
Contract Manufacturing Market Update 1
Appendix: Healthcare & Life Sciences Group 2
Table of Contents

1 - 1
Current View of the
US Healthcare Environment
The U.S. healthcare industry is in the midst of historically significant change
characterized by coverage expansion and reimbursement pressure.
• The U.S. will spend $4.6 trillion on healthcare by 2020, representing a CAGR of 6.1% from 2010.
– The Patient Protection and Affordable Care Act (“PPACA”) adds 32 million covered lives to the healthcare system by 2020 Growth
Reimbursement
Pressures
Equity Markets
M&A Markets
• The reelection of President Obama provides better policy visibility and clarity to market participants, especially with regards to the PPACA.
– However, specific implementation and timing remain uncertain
• Fiscal pressures have triggered reimbursement cuts by government payors.
– Fraud and abuse prevention is also a key government initiative
• Healthcare equity markets have performed well but continue to be supported by historic levels of monetary intervention.
• The U.S. healthcare M&A market has remained active due to:
– Opportunities created by shifts in policy to expand coverage
– Robust credit markets
– Strong corporate balance sheets coupled with challenging organic growth opportunities
– Availability of financial sponsor capital

1 - 2
$220
$247 $235$258
$273$284
$299$314
$331$348
$0
$50
$100
$150
$200
$250
$300
$350
$400
2007 2008 2009 2010 2011E 2012P 2013P 2014P 2015P 2016PAmericas Western Europe Asia/Pacific Central & Eastern Europe Middle East/Africa
2011-2016P CAGR: 5.0%
523
714
969
1,252
1,4877.6%
9.3%
11.7%
14.2%
16.2%
0%
2%
4%
6%
8%
10%
12%
14%
16%
18%
0
200
400
600
800
1,000
1,200
1,400
1,600
2010 2020 2030 2040 2050
Global Population 65 & Older % of Global Population 65 & Older
Global Medical Device Market Overview
Medical devices continue to be a key point of innovation in healthcare, both
supporting and driving additional demand.
Global Medical Device Market
For the Years Ended and Ending December 31, 2007 – 2016P
($ in billions)
Global Demographic Trends
Source: Epsicom Business Intelligence Source: United Nations Population Division
• The medical device industry benefits from multiple attractive long-term trends, including:
– Aging population and longer life expectations
– Greater demand for healthcare services
• OEMs are increasingly seeking to outsource manufacturing for a number of reasons:
– OEM focus on core competencies
– OEM margin pressure
– Technological advancements
– New product development
– Market growth outpacing capacity expansion
– Shorter product lifecycles / faster time to market
Millions of People from 2010 -2050
1 - 3
Global Orthopedic Growth by Region
Source: www.IBISWorld.com
4.9%
3.8%
9.8%
6.9%
5.2%
0%
2%
4%
6%
8%
10%
12%
North America EMEA Asia/Pacific Rest of Americas World
2010-2015P CAGR
2010-2015P CAGR
2015P Market Size
$28.4 $11.7 $5.9 $0.8 $46.816% 16% 16%
13%
11%
12%
10%
6%
5% 5%
3%
10%
0%
2%
4%
6%
8%
10%
12%
14%
16%
18%
2002 2003 2004 2005 2006 2007 2008 2009 2010 2011 2012E
YOY Orthopedic Market Growth 10-Year Average
Global Orthopedic Market Growth
Source: 2012 Orthopedic Industry Annual Report
For the Years Ending Dec. 31, 2000-2012E
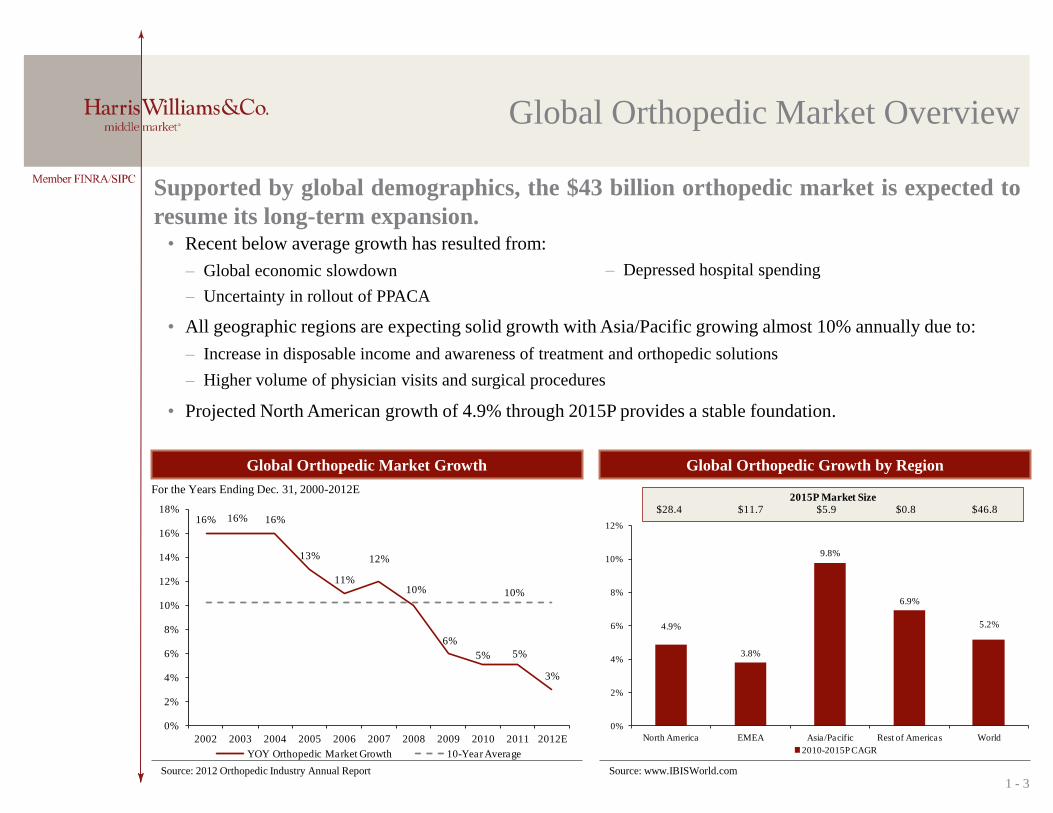
Global Orthopedic Market Overview
Supported by global demographics, the $43 billion orthopedic market is expected to
resume its long-term expansion. • Recent below average growth has resulted from:
– Global economic slowdown
– Uncertainty in rollout of PPACA
• All geographic regions are expecting solid growth with Asia/Pacific growing almost 10% annually due to:
– Increase in disposable income and awareness of treatment and orthopedic solutions
– Higher volume of physician visits and surgical procedures
• Projected North American growth of 4.9% through 2015P provides a stable foundation.
– Depressed hospital spending

1 - 4
2.5%
8.6%
2.8%
4.9%
7.3%
8.4%
5.2%
0%
1%
2%
3%
4%
5%
6%
7%
8%
9%
10%
Spine Trauma Knees Hips Orthobiologics Extremities Other
Gro
wth
Rate
2012-2015P CAGR
Spine Trauma Knees Hips Orthobiologics Extremities Other
2015P Market Size
$8.7 $8.3 $7.7 $7.5 $4.7 $1.8 $8.0
Global Orthopedic Market Trends
The orthopedic market is expected to reach $46.8 billion in 2015P as global
consumers demand more advanced products.
Source: Epsicom Business Intelligence
Spine, 20%
Trauma, 17%
Knees, 17%
Hips, 16%
Orthobiologics, 10%
Extremities, 4%
Other, 17%
Global Orthopedic Market By Segment
For the Year Ending Dec. 31, 2012
Global Orthopedic Market Growth By Segment
Source: Epsicom Business Intelligence
• Trauma is forecasted to be the fastest growing segment at 8.6% annually through 2015P.
• Orthobiologics and extremities are expected to grow 7.3% and 8.4% annually through 2015P.
– Technological innovations in orthobiologics resulting in faster recovery times continue to drive expansion in this segment while increases in ankle and surgery procedures are expected to spur extremities growth
• Growth in spine and knees is expected to be slower compared to the overall market due to sluggish procedure volume in these segments.

1 - 5
13.3x
17.1x
15.1x
12.0x
14.2x
13.1x
6.9x
9.2x
8.2x
7.3x 7.3x
11.2x
0x
2x
4x
6x
8x
10x
12x
14x
16x
18xPublic Trading Multiples 10 Year Average
11.5x
13.2x
8.4x
10.0x
12.0x
11.1x
13.6x
5.4x
6.7x
10.3x
11.2x
10.3x
0x
2x
4x
6x
8x
10x
12x
14x
16xMedian M&A Multiple 10 Year Average
Medical Device and Orthopedic Valuation Trends
A valuation gap between the public and private markets has emerged in the last
several years as M&A valuations have rebounded strongly.
Public Trading Multiples – TEV/LTM EBITDA M&A Multiples – TEV/LTM EBITDA
For the Years Ended and Ending December 31, 2002 – 2012 YTD For the Years Ended and Ending December 31, 2002 – 2012 YTD
Source: CapitalIQ.
Note: Public trading multiples include the constituents of the Dow Jones Med Devices Index.
Source: Pitchbook.
• Public trading multiples have remained at depressed levels since 2008 and are trading well below the ten year average.
• Overall medical device M&A multiples rebounded in 2011 and are trading above the 10-year average through 2012 YTD.
– The median 2012 YTD M&A transaction traded at 11.2x LTM EBITDA versus a ten year average of 10.3x

1 - 6
• Healthcare cost containment effort and
increased regulation drive margin pressure
• Rapid innovation and reduced product
lifecycle make time to market critical
• New products rely on highly specialized
manufacturing capabilities and equipment
• Strong growth in devices requires significant
capital investment to match growth
• Focus on R&D and outsource non-core
manufacturing operations
• Leverage outsourcing for design and
manufacturing expertise and rapid turnaround
• Outsource manufacturing to CMOs with
unique capabilities and scale
• Leverage capital investment by CMOs
Contract Manufacturing –
Trends Towards Outsourcing
OEM cost pressure and medical device innovation will continue to support strong
growth in contract manufacturing.
• OEM medical device competitors focused on new devices primarily create value in ways unrelated to
manufacturing.
– Introducing new technology to improve outcomes
– Branding strategies
– Building sales forces and channels
Trend OEM Response
1 - 7
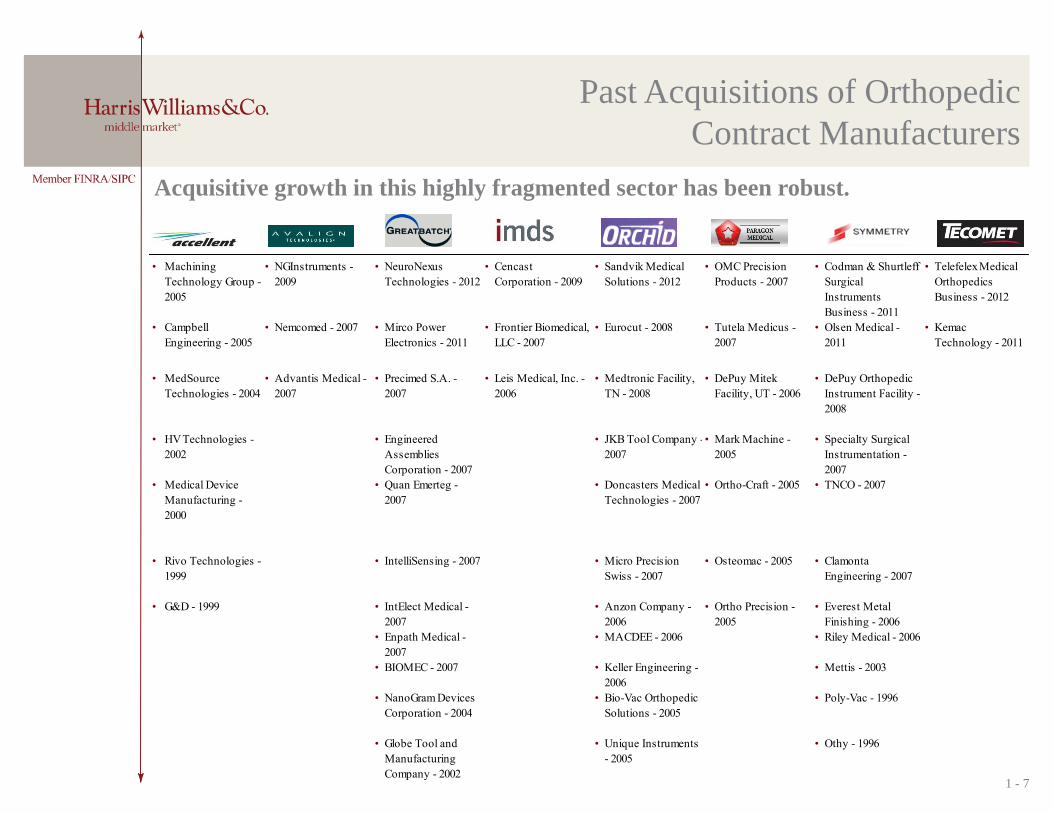
Acquisitive growth in this highly fragmented sector has been robust.
Past Acquisitions of Orthopedic
Contract Manufacturers
• Machining
Technology Group -
2005
• NGInstruments -
2009
• NeuroNexus
Technologies - 2012
• Cencast
Corporation - 2009
• Sandvik Medical
Solutions - 2012
• OMC Precision
Products - 2007
• Codman & Shurtleff
Surgical
Instruments
Business - 2011
• Telefelex Medical
Orthopedics
Business - 2012
• Campbell
Engineering - 2005
• Nemcomed - 2007 • Mirco Power
Electronics - 2011
• Frontier Biomedical,
LLC - 2007
• Eurocut - 2008 • Tutela Medicus -
2007
• Olsen Medical -
2011
• Kemac
Technology - 2011
• MedSource
Technologies - 2004
• Advantis Medical -
2007
• Precimed S.A. -
2007
• Leis Medical, Inc. -
2006
• Medtronic Facility,
TN - 2008
• DePuy Mitek
Facility, UT - 2006
• DePuy Orthopedic
Instrument Facility -
2008
• HV Technologies -
2002
• Engineered
Assemblies
Corporation - 2007
• JKB Tool Company -
2007
• Mark Machine -
2005
• Specialty Surgical
Instrumentation -
2007
• Medical Device
Manufacturing -
2000
• Quan Emerteg -
2007
• Doncasters Medical
Technologies - 2007
• Ortho-Craft - 2005 • TNCO - 2007
• Rivo Technologies -
1999
• IntelliSensing - 2007 • Micro Precision
Swiss - 2007
• Osteomac - 2005 • Clamonta
Engineering - 2007
• G&D - 1999 • IntElect Medical -
2007
• Anzon Company -
2006
• Ortho Precision -
2005
• Everest Metal
Finishing - 2006
• Enpath Medical -
2007
• MACDEE - 2006 • Riley Medical - 2006
• BIOMEC - 2007 • Keller Engineering -
2006
• Mettis - 2003
• NanoGram Devices
Corporation - 2004
• Bio-Vac Orthopedic
Solutions - 2005
• Poly-Vac - 1996
• Globe Tool and
Manufacturing
Company - 2002
• Unique Instruments
- 2005
• Othy - 1996

1 - 8
Orthopedic Contract Manufacturers
Teleflex Medical OEM, Orthopedics Business Tecomet, Inc. Aug-12 $45,200 1.3 x NA
Sandvik Medical Solutions Ltd. Orchid MPS Holdings, LLC Mar-12 NA NA NA
Remmele Engineering, Inc. RTI International Metals, Inc. Feb-12 182,000 0.3 x 8.3 x
Codman & Shurtleff, Inc., Surgical Instruments Business Specialty Surgical Instrumentation, Inc. Dec-11 165,687 2.4 x 8.0 x
Medisize Corporation Phillips Plastics Corporation Aug-11 142,094 0.8 x NA
Kemac Technology, Inc. Tecomet, Inc. Jul-11 NA NA 7.8 x
Orchid Orthopedic Solutions, LLC Altor Equity Partners; Altor Fund III Jun-11 NA NA NA
Katena Products, Inc. Cortec Group; Cortec Group Fund IV, L.P. Sep-09 NA NA 7.0 x
Memry Corporation SAES Getters SpA Sep-08 73,930 1.4 x 15.1 x
Tecomet, Inc. Charlesbank Capital Partners, LLC Sep-08 NA NA 7.9 x
Hi-Tech Rubber, Inc. Parker-Hannifin Corporation Apr-08 NA NA NA
Avail Medical Products, Inc. Flextronics International Ltd. Jan-08 282,000 1.1 x NA
Arrow International, Inc. TFX Medical OEM Oct-07 2,010,176 4.0 x 16.2 x
Seabrook International, LLC FdG Associates LP Jul-05 NA NA 9.9 x
Median of Orthopedic Contract Manufacturers: $165,687 1.3x 8.2x
Orthopedic Contract Manufacturers
M&A Valuations
Representative Medical Device Sector M&A Activity
Proprietary
Enterprise Enterprise Value/LTM Target LTM (for reference)
Target Company Acquirer Date Value Sales EBITDA
Proprietary
Proprietary
Proprietary
Proprietary
Proprietary

1 - 9
Considerations For Exit
HW&Co. believes that successful and well-positioned contract manufacturers will
have a number of attractive exit opportunities in 2013.
• Contract manufacturing will benefit from ongoing economic recovery.
• 2013 is expected to be a favorable M&A environment, and interest in both healthcare platforms and contract
manufacturing will be high.
• Corporate buyers are selective but willing to deploy capital for strategic assets.
– Companies comprising the S&P 500 alone held an aggregate of $1.74 trillion in cash at the end of Q3 2012
• There is a large amount of private equity capital ready to be deployed, and the lending environment is very
attractive and liquid for sponsored deals.
– As of September 2012, there was an estimated $359 million in private equity “dry powder”
– HW&Co. is routinely seeing total leverage of >5.0x for quality businesses
• There is expected to be a dearth of quality deals early in 2013, so high-quality companies will receive lots of
attention.

A - 0
Table of Contents
Contract Manufacturing Market Update 1
Appendix: Healthcare & Life Sciences Group 2

A - 1
Healthcare & Life Sciences Team
For further questions about HW&Co. or the contract manufacturing sector, please
contact James Clark or Geoff Smith. Name Title Phone Email
Turner Bredrup Managing Director (804) 915-0110 [email protected]
Todd Morris Managing Director (415) 217-3412 [email protected]
James Clark Managing Director (804) 915-0119 [email protected]
Cheairs Porter Managing Director (804) 915-0130 [email protected]
Geoff Smith Director (804) 915-0195 [email protected]
Andy Dixon Vice President (415) 217-3419 [email protected]
Paul Hepper Vice President (804) 932-1326 [email protected]
Andy Hewlett Vice President (415) 217-3427 [email protected]
Whit Knier Vice President (804) 932-1321 [email protected]

A - 2
Harris Williams & Co. (www.harriswilliams.com) is a preeminent middle market investment bank focused on the advisory needs of clients worldwide. The firm has
deep industry knowledge, global transaction expertise, and an unwavering commitment to excellence. Harris Williams & Co. provides sell-side and acquisition advisory,
restructuring advisory, board advisory, private placements, and capital markets advisory services.
THIS REPORT MAY CONTAIN REFERENCES TO REGISTERED TRADEMARKS, SERVICE MARKS AND COPYRIGHTS OWNED BY THIRD-
PARTY INFORMATION PROVIDERS. NONE OF THE THIRD-PARTY INFORMATION PROVIDERS IS ENDORSING THE OFFERING OF, AND
SHALL NOT IN ANY WAY BE DEEMED AN ISSUER OR UNDERWRITER OF, THE SECURITIES, FINANCIAL INSTRUMENTS OR OTHER
INVESTMENTS DISCUSSED IN THIS REPORT, AND SHALL NOT HAVE ANY LIABILITY OR RESPONSIBILITY FOR ANY STATEMENTS MADE
IN THE REPORT OR FOR ANY FINANCIAL STATEMENTS, FINANCIAL PROJECTIONS OR OTHER FINANCIAL INFORMATION CONTAINED
OR ATTACHED AS AN EXHIBIT TO THE REPORT. FOR MORE INFORMATION ABOUT THE MATERIALS PROVIDED BY SUCH THIRD
PARTIES, PLEASE CONTACT US AT +1 (804) 648-0072.
The information and views contained in this report were prepared by Harris Williams & Co. (“Harris Williams”). It is not a research report, as such term is defined by
applicable law and regulations, and is provided for informational purposes only. It is not to be construed as an offer to buy or sell or a solicitation of an offer to buy or
sell any financial instruments or to participate in any particular trading strategy. The information contained herein is believed by Harris Williams to be reliable but
Harris Williams makes no representation as to the accuracy or completeness of such information. Harris Williams and/or its affiliates may be market makers or
specialists in, act as advisers or lenders to, have positions in and effect transactions in securities of companies mentioned herein and also may provide, may have
provided, or may seek to provide investment banking services for those companies. In addition, Harris Williams and/or its affiliates or their respective officers, directors
and employees may hold long or short positions in the securities, options thereon or other related financial products of companies discussed herein. Opinions, estimates
and projections in this report constitute Harris Williams’ judgment and are subject to change without notice. The financial instruments discussed in this report may not
be suitable for all investors, and investors must make their own investment decisions using their own independent advisors as they believe necessary and based upon
their specific financial situations and investment objectives. Also, past performance is not necessarily indicative of future results. No part of this material may be copied
or duplicated in any form or by any means, or redistributed, without Harris Williams’ prior written consent.
Copyright © 2012 Harris Williams & Co., all rights reserved.