Embed Size (px)
DESCRIPTION
http://www.energyfromthorium.com/pdf/ORNL-TM-1060.pdf
Citation preview


Contract No. W-7405-eng-26
REACTOR DrJISION
MOLTEN SALT CONVERTER REACTOR
Design Study and Power Cost Estimates for a 1000 Mwe Stat ion
ORNL TM-1060
L. G. Alexander, W. L. Carter, C. W. Craven, D. B. Janney, T. W. Kerlin, and R. Van Winkle
W
SEPTEMBER 1965
OAK RIDGE NATIONAL LABORATORY O a k Ridge, Tennessee
mer ated by UNION CARBIDE CORPORATION
for the U. S. ATOMIC ENERGY COMMISSION


‘b
i
I _
P a
4
5 f
iii
FOREWORD i i
A molten-salt-breeder reactor was evaluated at the Oak Ridge National Because a number of the features postulated Laboratory beginning in 1959.
had not been demonstrated at that time, the realization of a breeder ap- peared to lie rather far in the future. near-term, one-region, one-fluid molten-salt convert.er described in this report was begun in July 1961 and completed in December 1962. several advances have been made in molten-salt technology which make the breeder reactor mwh less remote and modify some of the conclusions in this report.
Accordingly, the study of the
Since then,
Briefly, these advances include: 1. Progress in core graphite design which greatly simplifies previ-
ous problems of separating the core into two regions - one for the uranium- bearing fuel salt and one for the thorium-bearing blanket salt. design utilizes a liquid-lead seal around the tops of graphite tubes con- taining fuel salt that allows the tubes to expand or contract freely while maintaining an absolute seal between fuel and blanket fluids.* tion of a blanket results in a much better conversion than obtained in this report and leads directly to an attractive breeder.
The new
The addi-
2. Thermal engineering studies which show that the Loeffler boiler system can advantageously be replaced by a supercritical boiler. stress problems are reduced, overall thermodynamic efficiency is increased, and capital costs are considerably reduced. dium metal and of mixtures f alkali carbonates show that if either of these inexpensive materials can be safely used for the intermediate cool- ant in place of the costly li ium-beryllium fluoride mixtures postulated in this study, then f’urther 1
Thermal
In addition, studies of so-
e cost reductions can be realized?
*E. S . Bettis, Oak Ridge National Laboratory, personal communication
t ~ . W. Collins, oak Ri with L. G. Alexander, Oak Ridge National Laboratory, January 1965.
with L. G. Alexander, Oak Ridge National Laboratory, January 1965. tional Laboratory, personal communication

5 ’ J,
iv 74
3. A fue l purif icat ion process based on simple d i s t i l l a t i on? which
‘ not only reduces processing costs§ but permits reuse of the car r ie r
salts - an advantage not assumed i n t h i s study. - As a r e s u l t of these developments, we believe tha t fue l cycle costs
fo r a two-region breeder based on 1965 technology w i l l be only 0.3 t o 0.4 m i l l = compared t o the 0.68 mill/kwhr sham i n Table 6.10 for the IGCR.
?M. J. Kelley, Oak Ridge National Laboratory, personal communication
SW- L. Carter, Oak Ridge National Laboratory, personal comunication
*H. F. Bauman, Oak Ridge National Laboratory, personal communication
with L. G. Alexander, Oak Ridge National Laboratory, January 1965.
with L. G. Alexander, Oak Ridge National Laboratory, January 1965.
with L. G. Alexander, Oak Ridge National Laboratory, January 1965.

'hi V
CONTEXTS
Page
c ..*
hd
ABSTRACT ........................................................... 1. SUMMARY ........................................................
1.1 Description ................................................ 1.2 Fuel Reprocessing .......................................... 1.3 Nucleas and Thermal Performance ............................ 1.4 Fuel Cycle Cos$ ............................................ 1.5 Power Costs ................................................ 1.6 Advanced IGCR .............................................. 1.7 Post Scr ipt - January 1965 .................................
2. INTRODUCTION ................................................... 2 .1 Purpose, Scope, and Method of Approach .....................
2.1.1 Figure of Merit ...................................... 2.1.2 Reactor Concept ...................................... 2.1.3 Procedure ............................................
Status of Molten Sa l t Reactor Development .................. 2.2.1 Early Work ........................................... 2.2.2 The Molten S a l t Reactor Program ...................... 2.2.3 Fuel Development ..................................... 2.2.4 Container Development ................................
2.2
1
1 3 3 3 4
5 6 7 8 8
8
8 8 9
9 10 10
12 -.. 2.2.5 Moderator Development ................................ 15
2.2.6 Component ................................ 14
2.2.7 Reactor V . . . . . . . . . . . . . . . . . . . . . . . . . . . . . . . . 14
2.2.8 Molten S ................................. 14
2.2.9 Molten S 2.2.10 Freeze Valve Freeze Flanges ..................... 15 2.2.11 Molten t a t ion and Special .................................. 16 2.2.12 Remote Maint ................................... 16
2.2.13 Chemical of Molten Sa l t Fuels ............. 18
18 2.2.15 Thorex Process ....................................... 19
2.2.14 Fluoride Vola t i l i ty and HF' Solution Processes ........

vi
e
t.
(i .. :: 6)
CONTENTS (continued)
2.2.16 Fractional Crystallization Process .................. 20 2.2.17 Other Processes ..................................... 20
2.2.18 Molten Salt Reactor Studies ......................... 21 2.3 Molten Salt Reactor Experiment ............................ 22
3 . BASES AND ASSuMpTIONs .......................................... 23 3.1 Design Bases .............................................. 23
3.1.1 Reactor Concept ..................................... 23
i
3.1.2 Design Calculations ................................. 23 3.1.3 Station Power ....................................... 23 3.1.4 Plant Utilization Factor ............................ 24 3.1.5 Therm1 Efficiency .................................. 24 . 3.1.6 Fueling Cycle ....................................... 24 3.1.7 Processing .......................................... 24 3.1.8 Feed and Recycle .................................... 25 3.1.9 Isotopic Composition of Lithium ..................... 25 3.1.10 Energy Conversion System ............................ 25 3.1.11 Primary Heat Exchanger Requirements .................. 26 3.1.12 Minimum Salt Temperatures ........................... 26
3.2 Cost Bases ................................................ 26 3.2.1 Value of Fissile Isotopes ........................... 26 3.2.2 Value of Thorium .................................... 27
3.2.3 Value of LiF(99.995$ ‘Li) ........................... 27
3.2.4 Value of BeF2 ....................................... 27 3.2.5 Value of Base Salt .................................. 27 3.2.6 Cost of Compounding and F’urifying Fuel Salt ......... 27 3.2.7 ..INOR -8 Cost ......................................... 27 3.2.8 Moderator Graphite Cost ............................. 28 3.2.9 Annual Fixed Charges ................................ 28 3.2.10 Central Fluoride Volatility Plant Processing
Charges ............................................. 29
Q
t. . V
3 .3 Special Assumptions ....................................... 29 3.3.1 Permeation of.Graphite by Salt ...................... 29

vi i
CONTENTS (continued)
Page
3 . 3 - 2 Permeation of Graphite by 135Xenon .................. 30
3.3.3 Corrosion Products .................................. 30
3.3.4 Approach t o Equilibrium ............................. 3 1
4 . DESCRIPTION OF MSCR CONCEPT ................................... 32
4.1 General Description ....................................... 32
4.2 S i t e Plan ................................................. 32
m
CI
4.3 Structures ................................................ 40
4.4 Primary System Components ................................. 44
4.4.1 Reactor Vessel ...................................... 44
4.4.2 Moderator Structure ................................. 45
4.4.3 Fuel-Salt Circulating Pumps ......................... 45
4.4.4 Primary Heat Exchanger .............................. 48
4.5 Intermediate Cooling System ............................... 5 1
4.5.1 Introduction ........................................ 5 1
4.5.2 Coolant S a l t Pumps .................................. 5 1
4.5.3 Steam Superheaters .................................. 51
4.5.4 Steam Reheaters ..................................... 53
4.6 Power Generation System ................................... 53
4.6.1 Introduction ........................................ 53
4.6.2 Loeffler Boiler System .............................. 54 4.6.3 Steam Circulators ................................... 55
4.6.4 !Turbogenerator ...................................... 4.7 Reactor Control System ...................................
4.7.1 Introduction ........................................ 4.7.2 Shim Control ........................................ 4.7.3 Emergency Control ...................................
4.8 S a l t Handling Systems ..................................... 4.8.1 Introduction ... ............................... 4.8.2 m e 1 S a l t Prepax ............................... 4.8.3 Coolant S a l t Preparation ............................ 4.8.4 Reactor S a l t Purif icat ion ........................... 4.8.5 Coolant-Salt Purification
6.) ........................... a 4
3 - e w
57
57
57
58
58
59
59
59
61
61 . 62

viii
CONTENTS (continued)
Page
4.8.6 Reactor Salt Charging System ....................... 63 4.8.7 .Intermediate Coolant Charging System ............... 63 4.8:8 UF'4 Addition Facility .............................. 63 4.8.9 Fuel Salt Drain and Storage System ................. 64 4.8.10 Coolant Salt Drain System .......................... 66 4.8.11 Spent F'uel Withdrawal System ...................... 66 4.8.12 High Level Radioactive Salt Sampler ................ 67 4.8.13 Coolant Salt Sampl5ng .............................. 69 4.8.14 Freeze Valves ...................................... 69
4-9 Auxiliasy Services and Equipment ........................ 70 4.9.1 Introduction ....................................... 70 4-9.2 Helium Cover Gas Supply and Distribution System .... 70 4-9.3 Reagent Gas Supply and Disposal System ............. 72 4.9.4 Waste Gas System ................................... 72 4.9.5 Liquid Waste Disposal System ....................... 73 4.9.6 Coolant Pump Lubricating O i l Systems ............... 74 4.9.7 Beheating System .................................. 74 4.9.8 Auxiliary Power .................................... 74 4.9.9 Service Water System ............................... 75 4.9.10 Control and Station Air Systems .................... 75 4.9.11 Cranes and Hoists .................................. 75 4.9.12 Instrumentation and Control ........................ 76 4.9.13 Plant Utilities .................................... 76
4.10 MSCR Design Specifications .............................. 5 . PROCESSING ..............................................
5.1 Reprocessing System ..................................... 5.2 Fluoride Volatility Central Plant .......................
5.2.1 Process Design ..................................... 5.2.2 Shipping ........................................... 5.2.3 Prefluorination Storage Tanks ...................... 5.2.4 Fluorinator ........................................ 5.2.5 CRP Trap and NaF Absorbers .........................
77 91 91 91 92 94 94 96 98
c '
G2
B

c . d e
c
-1 . ' -?
ix
CONTENTS (continued)
Page
5.2.6 Cold Traps .......................................... 100 5.2.7 Reduction Reactor ................................... 100 5.2.8 Transfer Tanks ...................................... 100 5.2.9 Waste Storage Tanks ................................. 100 5.2.10 Freeze Valves ....................................... 102 5.2.11 Samplers ............................................ 102 5.2.12 Biological Shield ................................... 102 5.2.13 Process Equipment Layout ............................ 102 5.2.14 Plant Layout ........................................ 105 5.2.15 Capital Cost Estimate ............................... 105 5.2.16 Operating and Maintenance Cost Estimates ............ 113 5.2.17 MSCR Irradiated Fuel Shipping Cost .................. 113 5.2.18 MSCR Unit Processing Cost ........................... 117
5.3 Thorex Central Plant ...................................... 118 5.3.1 Head-End Treatment .................................. 119 5.3.2 Solvent Extraction .................................. 121 5.3.3 Tail-End Treatment .................................. 121 5.3.4 Processing Costs .................................... 123
5.4 Cornpaxison of Processing Cost Estimates ................... 125 6 . FUEL CYCLE ANALYSIS ........................................... 127
6.1 Analysis of Nuclear System ................................ 127 6.1.1 Computer Programs ................................... 127 6.1.2 Reactor Physics Model ............................... 129 6.1.3 Cross Section Data .................................. 129
. 2 Analysis of Therma chanical System ................. 130 6.2.1 Maximum Fuel ture ............................ 131 6.2.2 Minimum Fuel atme ............................ 131 . 2.3 Velocity ....... ................................. 131 6.2.4 Fuel Volume ......................................... 133
6.3 Analysis of Chemical System ............................... 134 6.3.1 Thorium-232 ......................................... 134 6.3.2 Protactinium-233 .................................... 135 .
.

X
CONTENTS (continued)
P
W'
6.3.3 6.304 6-395 6.3-6 6.3.7 6.3.8 6.3-9 6-3-10 6-3-11 6.3-12 6-3-13
Uranium-233 ......................................... 135 Uranim-234 ......................................... 135 Uranium-235 ......................................... 136 Uranium-236 ......................................... 136 Nept-iiium-237 ....................................... 136 Uranium-238 ......................................... 136 Neptunium-239 and Plutonium Isotopes ................ 136 Salt ................................................ 136 Xenon-135 and Related Isotopes ...................... 137 Noble Metal Fission Products ........................ 137
Other Fission Products .............................. 137 . 6.3.14 Corrosion Products .................................. 137
6.4 Fuel Cycle Optimization ................................... 138 6.5 Reference Design Reactor .................................. 141
6.5.1 Specifications ...................................... 142 6.5.2 Neutron Economy ..................................... 143 6.5.3 Inventories and Processing Rates .................... 147 6.5.4 Fuel Cycle Cost ..................................... 148
6.6 Parameter Studies ......................................... 150 6.6.1 Processing Cost as Parameter ........................ 150 6.6.2 Effect of Xenon Removal ............................. 152 6.6.3 Effect of Product Sale Without Recycle .............. 153
6.7 Alternative Design and Cost Bases ......................... 154 6.7.1 Thorex Processing Cost Estimates .................... 154 6.7.2 Reactor-Integrated Fluoride Volatility Processing ... 155 6.7.3 Reactor-Integrated Precipitation Process ............ 156
6.8 Ebolution of a Self-sustaining MSCR ....................... 156 6.8.1 Reduction of Leakage ................................ 157
6.8.2 Reduction of Xenon Captures ......................... 157
6.8.3 Reduction of Fission Product Poisoning .............. 158 6.8.4 Improvement of Mean Eta and Reduction of 236U
Captures ............................................ 158
B 4
a

1 ! c *
''kit
t .c
' ..
xi
CONTENTS (continued)
Page
6.8.5 Ultimate Breeding Potential of MSCR ................. 158
EXPENSE ....................................................... 160
7.1 Introduction .............................................. 160
7.2 Summary of N C R Capital Investment ........................ 160
7.3 MSCR Fixed Charges ........................................ 162
7.4 MSCR Operating and Maintenance Cost Estimate .............. 164
7.4.1 Labor aEd Materials ................................. 164
7.4.2 Operation aEd Maintenance Cost ...................... 165
8 . RESULTS AND CONCLUSIOXS ....................................... 168
8.1 Fuel Cost ................................................. 168
8.2 Fixed Charges ............................................. 169
8.3 Operation and Maintenance Expense ......................... 170
8.4 Cost of Power ............................................. 170
8.5 Breeding Potential of the MSCR ............................ 171 8.6 Conclusions ............................................... 173
8.7 Recommendations ........................................... 173
8.7.1 Title 1 Design Study of MSCR ........................ 173
8.7.2 Conceptual Design Studies of Advanced Breeder Reactors ............................................ 174
8.7.3 Fundamental Studies of Alternative Chemical
8.7.4 Engineering Laboratory Study of Precipitation Processing .......................................... 174
8.7.5 Pilot Plant Study of HF Dissolution Process ......... 175 APPENDICES ............... ................................. 177
Appendix A - MULTIGROUP CR CTIONS FOR MSCR CALCULATIONS ...... 179
7 MSCR CAPIWL INVESTMENT. FIXED CHARGES. AND OPERATING
Processes ........................................... 174
Appendix B - EFFECTIVE THOR ONANCE INTEGRAIS ................ 196
Introduction ................................................... 196 Analysis ....................................................... 197
Sample Calculation ............................................. 200
Results ........................................................ 201 Symbols ........................................................ 201 References ..................................................... 204
. .

CON"?TS (continued)
Appendix C . ENERGY DEPENDENCE OF ETA OF 233U ..................... 205 Summary ........................................................ 205 References ..................................................... 208
209 Introduction ................................................... 209
Appendix D . THE MERC-1 EQUILIBRIUM REACTOR CODE ..................
Theory ......................................................... 209 References ..................................................... 220
Appendix E . FISSION PRODUCT NUCLEAR DATA ......................... 221 References ..................................................... 224
Appendix F -TREATMENT OF DEIAYED NEUTRONS ........................ summary ........................................................ References .....................................................
Appendix G - TRFATMENT OF XENON ABSORPTION IN GRAPHITE ............ Introduction ................................................... Analysis ....................................................... Reference ......................................................
Appendix H -THE EQUILIaRIUM STATE AS A BASIS FOR ECONOMIC EVALUATION OF' THORIUM REACTORS ....................................
Introduction ................................................... Methods ........................................................ 1 . Fission Products ........................................ 2 . . Uranium-233 ............................................. 3 . Uranium-234 ............................................. 4 . Uranium-235 ............................................. 5 . Uranium-236 ............................................. 6 . Uranium-238 .............................................
225 225 229 230 230 231 234
235 235 236 236 237 239 239 240 241
Results and Conclusions ........................................ 242 1 . Fission Products ........................................ 242 2 . Uranium-233 ............................................. 249 3 . Uranium-234 ............................................. 249 4 . Uranium-235 ............................................. 249 5 . Uranium-236 ............................................. 249 6 . Uranium-238 ............................................. 249

i 'b xiii
CONTENTS (continued)
Page
bsli .
Appendix I -ESTIMATES OF PHYSICAL PROPERTIES OF LITHIUM- BERYLLIUM MSCR FUEL AND COOLANT SALTS .............................
Introduction ................................................... Viscosity ...................................................... Heat Capacity .................................................. Thermal Conductivity ........................................... Density ........................................................ Liquidus Temperature ........................................... References .....................................................
Appendix J . FUEL AND CARRIER SALT CaT BASES .....................
252
252
253
256
256
258
258
260
261 Introduction ................................................... 261
Bases for Establishing Prices .................................. 269
General Comments on Price Quotations ........................... 269
Thorium Fluoride ............................................. 269
Zirconium Fluoride ........................................... 269
Beryllium Fluoride .......................................... 270
Sodium Fluoride ............................................. 270
Thorium Oxide ............................................... 270
Lithium Fluoride ............................................ 270
271 Recommended Values for Molten Salt Fuel ........................ References .....................................................
Appendix K . BCR POWER LIMITATION RESULTING FROM MODERATOrR THERMAL STRESS ....................................................
Summary ........................................................ References ............... ...................................
Appendix L - VOLUMES OF FUEL SALT AND INTERMEDIATE COOIANT SALT FOR 1000 Mwe MOLTEN SALT CONVERTER REACTOR ........................
Introduction ................................................... Fuel Salt Volume ............................................... Coolant Salt Volume ..... ...................................
Appendix M - EVALUATION OF A SALT CONVERTER REACTOR ............................................
Introduction ................................................... I
272
273
273
279
280
280
280
282
285
285
A

I
xiv
CONTENTS (continued)
J
Results ........................................................ 286 Conclusions .................................................... 288
Appendix N -DETAILED ESTIMAT'E OF 1000 Mwe MSCR CAPITAL INVES- ........................................................ 289
Sumnary ........................................................ Investment Requirements ........................................
Appendix 0 -DESIGN REQ- FOR THE M3CR MODERATOR ........... Introduction ................................................... Moderator ...................................................... Void Fraction .................................................. Permeation of Graphite by Salt ................................. Graphite Shrinkage ............................................. Graphite Replacement ........................................... Differential EsLpansion ......................................... References .....................................................
BIBLIOGRAPHY ......................................................
289 290 328 328 330 330 331 332
333 335 336 337
\

xv
ACKNOWLEDGMENTS
The comments, suggestions, and c r i t i c a l reviews of R. B. Briggs,
P. R. Kasten, J. A. Lane, H. G. MacPherson, E. S. Bet t is , A. M. Perry,
and S. E. Beall are grateful ly acknowledged. The computer programming
was performed by J. Lucius, ORGDP Computing Center, and many of the
drawings were prepared by H. MacColl. by C. A. Hatstat of Sargent and Lundy, Engineers.
W. G. Stockdale, ORNL Chemical Technology Division, ass is ted the chemi- c a l processing cost studies. Roy Robertson and I. Spiewak, ORNL Reactor Division, ass i s ted the design and analysis of the energy conversion systems. Special studies reported i n the Appendix were performed by
R. H. Chapman, J. W. Miller, and C. W. Nestor of the ORNL Reactor D i -
vision, and D. B. Janney of ORGDP.
The capi ta l costs were estimated
R. P. Milford and

s
I
A
*

MOLTEN SALT CONVERTER REACTOR Design Study and Power Cost Estimates
for a 1000 Mwe Station
L. G. Alexander, W. L. Carter, C. W. Craven, D. B. Janney, T. W. Kerlin, and R. Van Winkle
ABSTRACT
The MSCR is a one-region, one-fluid, graphite-moderated converter reactor fueled with a mixture of the fluorides of thorium uranium, lithium-7, and beryllium which is circulated through the 20-ft-dim core to an external heat exchanger. Heat is transferred through an intermediate salt-coolant to steam at 2400 psi, 1000°F in a Loeffler boiler system having a net thermal efficiency of 41.5$. Spent fuel is processed by fluorination (at 0.08 mill/kwhe) for recycle of isotopes of uranium. The stripped salt is discarded.
A capital investment of $143/kwe (3.0 millslkwhe), an operation and maintenance annual expense of $2.1 million (0.3 mill/kwhe), and a minimum fuel cycle cost of 0.7 mill/ kwhe (optimum conversion ratio is -0.9) were estimated, giv- ing a net power cost of 4.0 mills/kwhe. on 1962 bases ground rules.
All costs were based
Second generation plants may have capital costs as low as $125/kwe. can be obtained in advanced designs.
Conversion ratios slightly greater than one
This study was completed in December 1962 and does not reflect increased feasibility and superior performance of two-region, two-fluid molten salt breeder reactors made pos- sible by recent (January 1965) advances in core design, heat transfer, and fuel-salt processing.
1. S m Y
The Molten Salt Converter Reacior (MSICR) is a one-region, one-fluid, near-term reactor that does not require any technology beyond the scale-up of that already developed at ORNL or to be demonstrated in the MSRE.-,Sa- lient characteristics are given in Table 1.1.

2
Table 1.1, Characteristics of the Molten Salt Converter Reactor
Thermal capability Net thermal efficiency Diameter and height of core Moderator Volume fraction of fuel in core Composition of fuel carrier salt (mole-percentages )
Density of fuel salt Heat capacity of fuel salt Velocity of fuel salt Inlet temperature Outlet temperatwe Flow rate Volume of circulating stream Parer density in core (av) Pawer density in fuel salt (av) Thorium specific power Fissile material specific parer Fertile material exposure Intermediate coolant (mole-per-
Stem conditions C: Th atom ratio Th: U atom ratio Mean neutron productions (92) Optimum conversion ratio
centages )
2500 Mw
41-54 20 x 20 ft Graphite 0.10 68-LiFy 22-BeF2, 9-ThF4, LUF4
190 lb/ft' 0.35 Btu/lb - "F 6 fps 1100°F 1300°F 160 ft3/sec 2500 ft3 14 w/cm3 35 w/cm3 30 Mwtltonne 0.9 Mwt/kg ,47 Mw days/& 63-ZiFy 37-BeF2
2400 psi, 1000°F -300 -30 2.21 099

3
1.1 Description
The reactor vessel i s fabricated of INOR-8 al loy and i s f i l l e d w i t h
cyl indrical graphite logs 8 inches i n diameter and 24 inches long.
fuel , a mixture of the fluorides of 7Li , Be, Th, and U flows upward through The
the passages around the logs and i s discharged through eight pumps t o an
equal number of heat exchangers where the heat is transferred t o an in te r - mediate-salt coolant.
exchanger; par t of the steam i s routed t o the turbines; the r e s t i s re-
circulated t o Loeffler boilers where saturated steam i s generated by in-
ject ing the superheated steam in to water.
coolant s a l t with subcooled, boil ing water i s avoided, and thermal s t r e s s i n the tube walls i s tolerable. The thermal efficiency i s i n excess of
4%. average power densi t ies i n the fue l s a l t of not more than 35 w/cm3.
Saturated steam i s superheated i n a shell-and-tube
Thus, thermal contact of the
Twenty-five hundred Mw of heat are extracted from a single core a t
1 .2 Fuel Reprocessinq
Irradiated f u e l i s removed from the reactor daily, collected i n t o
processing batches, and t reated with fluorine fo r recovery of isotopes of
uranium ( f u l l y decontaminated) as the hexafluoride. The stripped s a l t i s discarded. Recovered UF6 i s reduced t o UF4, blended with f resh salt, and recycled t o the reactor. Net burnup and loss of f i s s i l e material a re com- pensated by addition of 95% enriched 235U.
1.3 Nuclear and Thermal Performance
The l imit ing c r i t e r i a ( e . g . , m a x i m u m allowable fuel temperature, maxi-
mum allowable thermal stress i n graphite, e tc . ) were chosen conservatively
throughout, and provide consid l e margin for improvement i n l a t e r de- The key variables (core diameter, volume fract ion of f u e l i n core,
thorium ra t io , and processing ra te) were optimized with respect t o
the f u e l cycle cost .
i n Table 1.1 where it i s seen t h a t the optimum conversion r a t i o i s 0.9,
w i t h s l i gh t ly permeable graphite t ha t absorbs 135Xe only slowly.
Characterist ics of the optimized system are l i s t e d

4
1.4 Fuel Cycle Cost
The estimation of inventory and replacement charges for the MSCR is straightforward. Processing costs are less well defined; however, the processing contributes only e, small part of the total fuel cost, and the aggregate is not sensitive to large errors in the processing cost esti- mates.
A central Fluoride Volatility facility capable of processing 30 ft3/ day of salt was designed and costed. covered; carrier salt and thorium are discarded along with fission pro- ducts. Unit costs and the components of the fuel cycle cost are listed in Table 1.2.
Only isotopes of uranium are re-
Table 1.2. Fuel Cycle Cost in 1000 Mwe Molten Salt Converter Reactor Plant
Cost Bases Capital investment in processing plant: Annual operating expense: $2 million "urn-around-time: 2 days Batch size: 6000 kg Unit processing cost: $27/kg Th Shipping costs: $lO/kg Th Purchase price ThF4: $19/kg Th Carrier salt purchase price: $1130/ft3 Fissile isotopes: $l2/gram
$26 million
Charges, mills/kwhre
Inventory Replacement Processing Material Total
0.033 0.043 m232
pa2 3 0.001f $33 u235
0.181 0.037 - - 0- 156 -
0.082 - -
Total 0.262 0.199 0.082 0.54 0.14 - Salt 0.062 0.079
Totai charges, mills/kwhre 0.7

5
1.5 Power Costs
r
The cost of power was obtained by combining fuel-cycle costs with estimates of capital charges prepared by Sargent and Lundy, Engineers (95,96), from a design study conducted at ORNL.
specified in sufficient detail that costs might be estimated by usual procedures. buildings, piping, services, etc. were estimated. Operation and mainte- nance costs were estimated according to standard procedures (52 ) .
mwy of the principal items is given in Table 1.3.
Equipment was sized and
Plant arrangement drawings were prepared from which costs of
A sum-
Table 1.3. 1000-Mwe Molten Salt Converter Reactor Construction Costs
Direct construction costs Structures and improvements Reactor plant equipment Turbine-generator units Accessory electric equipment Miscellaneous power plant equipment
Total direct construction costs Indirect costs Engineering design and inspection costs Miscellaneous charges
GRAND TOTAL
Net station power Unit capital cost
$ 5,997,950 51,324,350 26,843,700 4,375,300
89,341,200
9,083,300
15,080,300
35,370,800
$148,875,600
1038 Mwe $l43/Kwe
799,900
The fixed charges (14.46%) on the capital investment contribute 3.0
mills/kwhre to the power cost.
fixed charges might range up to 3.5 mills/kwhre. The uncertainty in this cost might run as high as 15-204, and the
Operation and maintenance contribute 0.3 mills/kwhre to the total power cost (Table 1.4). may be low, and the cost might run as high as 0.5 mills/kwhre.
Because of the many uncertainties, this estimate

6
Table 1.4. 1000-Mwe Molten Salt Convert= Reactor Operating
and Maintenance Cost
Wages and salaries $ 872,000 Routine materials 220,000 Maintenance 800,000 Management 262,000
Total $2,154,000
The various contributions to the cost of power have been swmned in Table 1.5.
Table 1.5. Cost of Parer in a 1000-Mwe Molten Salt Converter Reactor
Item
.Fuel cycle cost 0-7
Fixed charges 3.0 0.3 Operation and maintenance -
Cost of power, mills/hke 4=0
Taking the upper bound on these three items estimated above (fuel cast -1.0, fixed charges -3.5, operation and maintenance -0.5) gives an upper limit on the cost of power of 5.0 mills/kwhre.
1.6 Advanced WCR
The system evaluated above was based on the scale-up of current tech- nology, and was conservatively designed in every respect. There are sev- eral obvious impruvements that could be incorporated into a "second gen-. eration" design. could be substituted for the intermediate salt coolant (saving about $10 million in capital costs.
If the design criteria were relaxed, metallic sodium
This would also permit the use of "conventional"
7 i ‘u
. C I
T
once-through sodium-heated boi lers and reduce the cost of the energy con-
version system by about another $10 million.
-$l25/kwe.
duced from 2500 f t3 t o 1800 ft3. graphite and so reduce absorption of xenon therein and a l so as a struc-
t u r a l material by means of which a blanket of ThF4 bearing salt could be
added at the periphery of the core t o reduce neutron leakage. Fluoride Vola t i l i ty coupled with the Hl? Solution Process t o remove ra re
earths could reduce the f i ss ion product poisoning t o very low levels while
permitting recycle of car r ie r s a l t (but not thorium). Preliminary calcu- la t ions show tha t these improvements ( a l l within reach of modest develop-
ment programs) might increase the conversion r a t i o above 1.0, and, w i t h
The t o t a l cost would then be
By careful design and development the fue l volume might be re-
Separated 92M0 could be used t o clad the
The use of
the reduction i n capi ta l costs noted, r e su l t i n a power cost of 3.4
kwhre. m i l l s /
1.7 Post Scr ipt - January 1965
This study was completed i n December 1962, and does not re f lec , fn- creased f e a s i b i l i t y and superior performance of two-region, two-fluid
molten s a l t breeders made possible by the recent advances (January 1965)
i n core design, heat transfer, and fue l -sa l t processing alluded t o i n the Foreword.

8
2. INTRODUCTION
Purpose, Scope, and Methoc, of Approach
The purpose of t h i s study was t o evaluate the economic potent ia l of a
near-term molten salt power reactor. "Near-term" characterizes a system which u t i l i z e s only techniques or equipment currently under development.
2.1.1 Figure of Merit
The economic potent ia l of power reactors i s measured by the net cost of e l e c t r i c power.
Fuel cycle cost, although not def ini t ive, is a l so an important index
Moreover, the optimization of the f u e l cycle is a of economic potent ia l .
required f i rs t s tep i n the detai led design of both reactor and e l ec t r i c plants.
tem, the energy conversion system, and the f u e l reprocessing plant were
designed i n d e t a i l suf f ic ien t t o permit the optimization of the f u e l cycle.
In t h i s study, the reactor and i t s associated heat t ransfer sys-
2.1.2 Reactor Concept
A concept w a s selected for evaluation, which, judging from previous
experience, would sa t i s fy the "near-term" requirement and ye t would ex-
h i b i t a t t r ac t ive fue l costs: A single-fluid, single-region, graphite-
moderated molten-salt reactor generically re la ted t o the Molten Sa l t Re-
actor Experiment. Since the breeding r a t i o was expected t o be l e s s than
unity, the system was designated the "Molten Sa l t Converter Reactor" -'*%-
(mcR)*
2.1.3 Procedure
In a ser ies of preliminary calculations, the l imitat ions on reactor
design imposed by consideration of allowable temperature, pressures, ve-
l oc i t i e s , thermal s t ress , etc. , were determined. Design and cost bases
were established, and the f u e l cycle cost w a s minimized by optimization
of the key variables, which i n the M3CX are the core diameter, carbon/
thorium ra t io , volume f rac t ion of f u e l i n the core, and spent f u e l

processing r a t e .
ing from al ternate bases and assumptions (e.g., removal of xenon) were
For the optimum conditions, the f i e 1 cycle costs resu l t -
determined.
tior- of a l l favorable assumptions and potentially l o w processing costs
w a s estimated.
Finally, the ultimate performance resul t ing from a concatena-
2.2 Status of Molten Sa l t Reactor Development
2.2.1 Early Work
Molten s a l t fue ls were conceived originally as a means of sat isfying
the requirements for very high temperature and extremely high power density
necessary f o r a i r c r a f t propulsion.
physical, chemical, and engineering character is t ics of uranium and thorium
bearing molten fluorides was carried out as par t of the ANP program a t
Oak Ridge National Laboratory.
A very large amount of work on the
The technology of molten s a l t reactors w a s first introduced in to the open l i t e r a t u r e i n 1957 by Briant and Weinberg (14).
e t a l . (6,7) and Ergen e t al. (31) reported the Aircraft Reactor Experi- ment, a beryllium-moderated reactor fueled with UF4 dissolved i n a mix-
ture of the fluorides of sodium and zirconium, and contained i n Inconel. The reactor was successfully operated i n 1954 for about 90,000 kwhr w i t h -
out incident a t powers up t o 2.5 Mwt and temperatures as high as 1650°F-
Papers by B e t t i s
The potent ia l usefulness of molten sal t fue ls far c iv i l ian power w a s
recognized from the start. the high temperature of the f u e l (permitting use of modern steam technology
and attainment of high thermal efficiency) combined with a l o w vapor pres-
sure, the high s t a b i l i t y of halide salts under radiation, and the advan-
tages t h a t a f luid f u e l provides. These include a negative temperature coefficient of react ivi ty , absence of the need for i n i t i a l excess reac-
t i v i t y and of neutron wastage i n control elements, no l imitat ion t o fuel exposure due t o radiat ion damage or f i e 1 burnup, the absence of a compli-
cated s t ructure i n the reactor core, removal of the heat t ransfer opera-
t ion from the core t o an external heat exchanger, and the potent ia l fo r a low-cost f u e l cycle.
The features that a t t rac ted at tent ion were
In addition, sui table molten s a l t mixtures exhibit a

10
solubility for thorium fluoride sufficient for all reactor applications; morewer, these mixtures may be economically and rapidly processed for the recovery of 233U by means of the well-developed Fluoride Volatility Process.
Studies of power reactors utilizing molten salts have been reported by Wehmeyer (log), Jarvis (49), Davies (27), and Bulmer (15). Davidson and Robb (26) conceived many of the features of one-region thorium con- verter reactors and anticipated some of the development problems.
2.2.2 The Molten Salt Reactor Program
The molten salt reactor program was inaugurated at ORNL in 1956 (57 ,
58) to exploit the technology of molten salt fuels for purposes of economic civilian power. Several parts of the program were: (a) a reactor evalua- tion study to select the most promising concepts for civilian power and to pinpoint specific development problems: (b ) an extensive materials de- velopment program for fuels, containers, and moderators; ( c ) an equally extensive program for the development of components, especially pumps, valves, and flanges suitable for extended use with mblten salts at 1300"E; (d) a modest program for the discwery of supplementary chemical processes for recovering valuable components (other than uranium) from spent fuel;
(e) a program for the development and definitive demonstration of the feasibility of completely remote maintenance of molten salt reactor sys- tems; and presently (f) the Molten Salt Reactor Experiment (MSRE).
2.2.3 Fuel Development
The program for the development of molten salt fuels in the Reactor Chemistry Division at ORNL has been highly successful (56). ponent mixtures (fluorides of Li, Be, Th, U, and Zr) developed for the M3RE (12) have many exceptional features. below 1000°F, with ample solubility for UF4, ThF'4, and fission product fluorides.
The five-com-
They have melting points well
.-. They are thermodynamically stable with vapor pressures less
than 0.1 atm at temperatures well above 2000"F, and, being ionic liquids, are not subject to permanent radiation damage ( e . g . , radiolytic dissocia- tion) when in the liquid state. the base elements (7Li,r 'Be, qnd 19F) are satisfactorily low, arid 7Li
The pasasitic capture cross sections of

11
is available a t a t t rac t ive pr ices i n grades containing as l i t t l e as 0.005$
Li-6.
bet ter heat transfer media than most l iquid metals i n sp i t e of the higher fi lm conductances obtainable with the l a t t e r .
The high volumetric heat capacit ies of salt mixtures make them
These mixtures do not appreciably attack the container material
(INOR-8), corrosion rates being l e s s than 1 mil/yeax (possibly as low as 1/2 mil/year) a t temperatures below 1300°F (28). Although it i s not now
anticipated tha t it w i l l be necessary t o use INOR i n the neutron active
zone, since the moderator material (graphite 1 i s suitably self -supporting, experiments have shown that the corrosion i s not appreciably accelerated
by radiation. A long l i f e (10-30 years) is predicted f o r a l l components
constructed of INOR (reactor vessel, pumps, heat exchangers, e tc . ) be-
cause resistance t o corrosion does not depend on maintenance of a protec-
t i ve f i lm but stems from the inertness of the base metal toward the s a l t .
Molten s a l t f u e l mixtures are compatible with graphite. Tests of a
typical grade show tha t the s a l t does not wet the graphite and penetra-
t i on i s mostly confined t o the surface layers ( 8 4 , p. 93).
been observed i n post-irradiation examination of in-pi le experiments.
Since CF4 i s thermodynamically unstable with respect t o the salt, it i s
thought t ha t i t s formation resul ted from at tack on graphite by f r ee fluo-
r ine produced by radiolysis of so l id salt. maintained i n the l iquid s t a t e for other reasons, f r ee fluorine would not
Some CF4 has
Since the fue l - sa l t must be
normally be present i n the circulat ing stream. Xenon i s not adsorbed appreciably on graphite (17) a t reactor tempera-
tures, though it w i l l sa turate the voids present because of i t s extremely
low so lubi l i ty i n s a l t (107). However, it may be possible t o exclude Xe
,from the graphite by t reat ing the surface t o close the pores there and
render in te r ior pores inaccessible (5). of helium i n the pump bowl or i n a special contactor would then maintain
the Xe concentration a t a very low l eve l (.Section 6 . 8 ) . i n the ionic s t a t e and i s not absorbed. expected t o be reduced by INOR outside the core.
-
Purging the salt with a stream
Iodine remains
Noble metal f i s s ion products are
The phase behavior of' a great many mixtures has been investigated
(108). Proposed mixtures containing up t o 40 mole $ BeF2 have v iscos i t ies

c
3.2
\ w- adequately l o w and dissolve heavy metal fluorides (W4, ThF4, or ZrF4) in concentrations up to I5 mole $ with liquidus temperatures less than 1000°F ( 5 6 ) . duces the sensitivity of the fuel mixture toward precipitation of U02 by oxygenated contaminants (e.g., air, water, lubricating oils) which will be difficult to exclude entirely *om a large reactor system. readily de-oxygenated by in situ decomposition of mF-HF vapor, which shows negligible attack on the INOR.
Additions of 5 1 mole $ of ZrF4 to the base salt satisfactorily re-
Graphite is
Thermophysical properties of the important salt mixtures have been measured (8,24) in detail sufficient to permit reliable calculation of pumping and heat transfer characteristics, which are good. No evidence - of the deposition of scale or dendrites in the heat exchangers has been f O m d
2.2.4 Container Development
The development of nickel-molybdenum base alloys (INOR series) for containment of molten fluorides was conducted jointly by OFWL and Inter- national Nickel Company. tioned abwe, the alloys have good-to-excellent mechanical and thermal characteristics, (superior to those of many austenitic stainless steels) and are virtually unaffected by long-term exposye to salts or to air at 1300°F (12). panies, and it is presently available on a limited commercial basis in the
In addition to the resistance to corrosion men-
The alloy has been made by several major manufacturing com-
form of tubing, plates, bars, forgings, and castings. Exhaustive tests - at ORNL have sham that its tensile properties, ductility, creep strength, cyclic fatigue strength (both thermal and mechanical) are adequate for molten salt reactor applications when ,-judged in accordance with criteria used in the ASME Boiler Code (75-87). techniques using welding rods of the same composition as the base metal. A gold-nickel alloy has been developed at ORNL suitable for remote brazing of react02 components. 2500°F.
-
INOR is weldable by conventional
INOR begins to soften abwe 2000°F and melts at The thermal conductivity is about 3.2 Btu/hr.ft*"F at 1200PF. NO
major difficulties have been encountered in the design and fabrication of reactor components, including pumps and heat exchangers (12)
?
w 5
P

13
2,2.5 Moderator Development
Graphite, because of its good moderating properties, low neutron cap- ture cross section, compatibility with fluoride salts and INOR, and excel- lent high-temperature physical properties is a superior moderator for molten salt reactors. density of 1.'8 g/cc and a kerosene-accessible porosity of 6%. the pore volume is accessible from the surface. above, molten fluorides do not wet graphite and permeation of MSRE grade graphite by the salt is less than 0.5% by volume at 150 psi (84 , p. 93) .
The coefficient of permeability by helium at 30°C is loc5 cm2/sec, and Xe will be adsorbed rapidly. are being developed. ties at least two orders of magnitude lower have been made (107).
"he graphite proposed for use in the MSRE has a About half
However, as mentioned
However, techniques for reducing permeability Samples of high-density graphite having permeabilik
Developent of graphites and graphite bodies is being carried out cooperatively with National Carbon Company. ently available in sections up to 20 in. square and 20 ft long. having outstanding mechanical properties is available in the form of readily machinable rods, tubes, slabs, and spheres. clear radiations on this material are not fully known. ductivity declines, but probably not below 15 Btu/hr*ft* OF. stress considerations thus affect the design of moderator elements; the allowable stress is thought to be at least 2000 psi and the allowable strain at least O.l$. thermal and nuclear requirements of optimum core design. mental verification of these values is needed.
Pieces of graphite are pres- Graphite
The effects of nu- The thermal con-
Thermal
These limits appear to be compatible with the However, experi-
At the temperatures encountered in molten salt reactors, graphite will shrink during exposure to fast neutrons. the fast neutron flux exist, the resulting differential shrinkage will result in deformations, or, if these are restrained, in stresses. "he problem of designing a long-lived core structure of large pieces of graph- ite is presently unresolved. restrained by use of molybdenum hoops, but this solution may not be suit- able for large power reactors.
Where large gradients in
The bowing of graphite stringers might be
L,

14
2.2.6 Component Development
Development of components for molten salt reactors has been in pro- gress for over ten years. The most notable achievements to date are:ih demonstration of the long-term reliability of pumps operating at 1300°F, including pumps having molten-salt-lubricated bearings, and the demonstra- tion of the reliability and maintainability of remotely operated freeze flanges and freeze valves.
2.2.7 Reactor Vessel
No difficulties were encountered in the design or fabrication of the reactor vessel for the MSRE.
thermal stress by means of thermal ~ shields may be necessary, but mechanical stresses are not important because pressures greater than 200 psi are not encountered anywhere in the systems.
problem.
In large power reactors provision to limit
Corrosion does not appear to be a
2.2.8 Molten Salt Pumps
Molten salt pumps have been operated continuously for 33.months at A sump-type pump having one salt-lubricated temperatures above 1200'F.
journal bearing has logged more than 12,000 hours of operation at I225'F, I200 rpm, and 75 gpm.
nation of the bearings disclosed no discernible attack. lubricated bearings will enable the shaft to be lengthened so that shield- ing may be interposed between the pump bowl and the motor with its oil- lubricated bearings. indefinitely under operating conditions. It is believed that pumps of the types developed can be made in large sizes for use in large molten salt reactor plants and that these can operate at the temperatures re- quir ed.
After it was stopped and restarted 82 times, exami;. The use of salt-
The impellers of these pumps also withstand attack
2.2.9 Molten Salt Heat &changers and Steam Boilers i
The design and fabrication of exchangers for transferring heat from fuel salt to an intermediate coolant salt are straightforward. Heat
15
t ransfer experiments conducted a t ORNL w i t h unirradiated salt ver i fy the
correlations used t o predict the performance. Scale did not form on the heat t ransfer surfaces.
The Loeffler boiler seems especially suited for use with molten salts.
Here dry saturated steam i s superheated i n a salt-to-steam exchanger; par t
of the superheated steam i s routed t o the turbines, and par t i s recircu-
la ted through an evaporator producing saturated steam for recycle t o the
exchanger. Problems i n boiling burnout, thermal s t ress i n the exchanger
tubes, and freezing of the salt are thas avoided. However, a fue l - sa l t boiler presently i n the conceptual stage has
many potent ia l advantages.
inside the reactor vessel i s widened tc accommodate several hurrdred 33oR thimbles. Bayonet tubes, i n to which water i s introduced, are inserted
in to the thimbles, but are separated from the thimble walls by a narrow
annulus f i l l e d with an ine r t s a l t . Calculations show tha t the heat trans-
f e r i s adequate t o produce steam at 1000°F and 2000 psi . Yet the s a l t and steam systems are isolated from di rec t contact alnd the salt- system i s
In t h i s concept, the f u e l downcomer annulus
under negligible pressure.
tected immediately by monitors i n the ine r t salt system. Should e i ther system leak, th i s would be de-
Such a boi ler has many advantages, including the complete elimination
of one cooling loop and i t s associated pumps, heat exchanger, e tc . In addition, the f u e l c i r cu i t i s appreciably shortened i n comparrison t o a "spread-out'' system. The steam produced w i l l be considerably l e s s radio- active than that produced i n a d i rec t cycle boiling-water reactor.
2.2.10 Freeze Valves and Freeze Flanges
Although the high melting point of a molten salt reactor fue l (800- 1000°F) i s a disadvantag f i l l i n g and provision must be made t o avoid freezing, there are a lso bene-
f i t s tha t accr-ue. Among these i s the f a c t t h a t if a leak does occur there
i s l i t t l e tendency f o r the material t o disperse rapidly. sion products do not accumulate i n the l iquid, and the fluorides of the
remaining f i s s ion products have negligible vapor pressure and are retained.
n tha t the system m u s t be preheated before
Noble gas fis-

The ready solidification of salts has also been put to use in the development of flanges and valves. freeze flanges has been successfully demonstrated in many tests and in a remote maintenance development facility. Freeze valves have no moving parts, no seals, and have been demonshated to be satisfactory infsalt transfer and drain pipes.
The remote manipulation of reliable
2.2.11 Molten Salt Instrumentation and Special Equipment
Conventional equipment is adequate for measuring the nucleax behavior of molten salt reactors; hawever, special equipment for handling molten salts was developed at ORNL for the MSRE. the pump bawls, for example, a ball-float suspending an iron bob whose position is sensed by an external induction coil was developed. point electrical probe device has a l s o been developed for use in the fill- and-drain tanks to calibrate the weighing system.
For measuring liquid level in
A single
A sampler-enricher device is being tested whreby fresh fuel may be added to the fuel stream during operation, and a sample of spent fuel may be removed without contamination of the fuel stream by air or water vapor and without the uncontrolled escape of any radioactive material fYom the reactor.
Clam-shell electrical pipe heaters for lines carrying molten salt have been developed.
2-2-12 Remote Maintenance
Because of fission-product contamination and induced activity in components and piping, the fuel-containing portions of molten salt re- actors cannot be approached for direct maintenance even after draining and flushing. handled tools is possible for some items, but it is necessary to develop completely remote tools and methods for many of the larger components. These include tools, techniques, and procedures for removing and replacing all major reactor components, including the heat exchanger, primary fuel- pump and motor, reactor vessel, and fill-and-drain tank. Such equipment and techniques successfully demonstrated in the Molten Salt Remote Main- tenance Development Facility at OFiNL (65 ) .
Semi-direct maintenance through a shield plug with long-
This facility simulated a

17
20-Mwt molten salt reactor system and comprised a mockup of the reactor vessel, a mockup of the heat exchanger, together with full-scale pumps, flanges, valves, electrical heaters, thermocouples, etc. A l l maintenance operations were performed by a single operator from a remotely located control center, using closed-circuit stereo-television for viewing. The manipulator was a general purpose, medium duty, electro-mechanical "arm" which performed a variety of functions easily and efficiently. It was used to connect and disconnect tube and electrical connections, to carry loads weighing up to 750 lbs and to manipulate tools. Eight basic mo- .
tions, five for the arm and three for the crane bridge, were controlled independently by two pistol-grip handles on the control coosole. Two
types of remotely interchangeable grasping devices permitted a variety of objects to be handled.
Tools developed for remote manipulation included impact wrenches, a torque tool and bolt runner, screw jacks on the heat exchanger for working the freeze flanges, and miscellaneous devices such as lifting slings, socket extensions, hooks, fingers, etc. manipulator. socket extensions for the torque tool and bolt runner were positioned by the manipulator, but operated by the crane or by their own power-
A l l these were operated by the In addition, a reactor-lifting jig, a pump-lifting eye, and
The installation of microphones at strategic locations inside the reactor cell to enable the operator to listen to pneumatic and electric motor sounds was found to be helpful.
Reliable, quickly acting disconnects f o r electric, pneumatic, oil, and other services were adapted or developed.
The components of the Remote Maintenance Facility were removed and replaced several times before develop procedures and test the tools. with salt, brought to temperature with salt circulating freely, then shut down and drained. and tested.
he system was filled with salt in order to Finally, the system was filled
All equipment was then removed and replaced remotely, The salt was replaced and brought to temperature again. Items
maintained" in this way included the pump motor, the fuel pump, the re- actor vessel, the heat exchanger, the fill-and-drain tank, electrical pipe heaters, and thermocouples. The demonstration was entirely successful.
11

-. 18
W A Maintenance of the MSRE will be accomplished by means of the tech-
niques and tools developed and supplemented with same semi-direct main- tenance operations through a portable shield having a rotatable plug. Long-handled tools may be inserted through this plug and manipulated by hand. scale mockup of the MSRE now being constructed at ORNL.
These means of maintenance w i l l be thoroughly tested in a full-
2.2.13 Chemical Processing of Molten Salt Fuels
The use of fluid fuels in nuclear reactors provides an opportunity for continuously removing fission products and replacing fissile isotopes at power. Thus, it is possible to hold fission-product neutron losses to low levels and to eliminate capture of neutrons in control rods.
The "Fluoride Volatility Process" is in an advanced stage of develop- ment; a pilot plant for general application is now in operation at ORNL.
Other processes are being sought, and prospects are good that simple and economic means can be found to separate fission products continuously from spent fuel salt.
2.2.14 Fluoride Volatility and HF Solution Processes
While the fluoride volatility process was not developed specifically for use with molten salt fuels, it has been verified in laboratory experi- ments conducted at ORNL that it is applicable for removal of uranium from fluoride mixtures containing W 4 (16). In this process, elemental fluo- rine, diluted with an inert gas, is bubbled through the salt. UF4 is -a
converted to UF6 which is volatile at the temperature of operation (500- 700°C) and passes out of the contactor to be absorbed reversibly in a bed of sodium fluoride. The off-gas is cooled, stripped of F2 in a scrubber, and passed through charcoal beds where fission product gases are absorbed.
P
The fluorides of a few of the fission products are also volatile but these are irreversibly absorbed in the sodium fluoride beds. Thus, by heating the beds, uF6 is brought Over in a very pure state, completely decontaminated and with losses less than 0.1%.
The UF6 is reduced to UF4 in a hydrogen-fluorine flame, and is col- ci
lected as a powder in a cyclone separator backed up by gas filters. Losses =sb

19
routinely are smaller than random errors in the assays, and the process has been used successfully for many years in the manufacture of enriched 235U from natural uranium in the production plants at Oak Ridge.
The Fluoride Volatility FYocess alone is seficient for the economi- cal operation of a malten salt converter reactor. UF4, ThF4, 233Pa, as well as fission products is removed from the reactor periodically and fluorinated for recovery of uranium isotopes. stripped salt is discarded (stored in INOR cylinders indefinitely) to purge the system of fission products. tains valuable components (7Li, Be, 232Th, 233Pa), the cost of discarding these is'offset by the'.imprwement in conversion satid
Spent fuel containing
The
Although the discwded salt con-
The steps described above appear to be especially attractive for integration with the reactor plant. ture, non-aqueous processes, and could conveniently be carried out in the reactor cell, utilizing the same shielding and sharing in the use of re- mote maintenance equipment. itotopes of uranium) is in a form conveniently stored for decay of radio- activity. After a period measured in years, the waste codd conveniently be removed to another location for recovery of thorium, lithium, beryl- lium, and other valuable components in a relatively low-level-radiation facility .
That is, they are all high-tempera-
The waste product (fuel salt stripped of
The HF Solution Process (16) under study at ORNL provides one means of separating rare earths (which constitute the bulk of important non- volatile fission products, including isotopes of samarium) from the base salt, after uranium has been removed. solving solidified salt in liquid HF containing up to 1% water. rare earths, thorium, and related materials precipitate and may be sepa- rated by filtration or decantation,.permitting reuse of the salt. HF Solution Process is presently in the laboratory stage of development.
2.2.15 Thorex Process
The separation is effected by dis- The
The
While the Fluoride Volatility process appears attractive if inte- grated with the reactor plant, it i s not obvious that it is superior in a central facility to alternative modes of processing, such as Thorex.

20
This uncertainty is due in part to paucity of reliable information on costs of on-site and central Fluoride Volatility process plants, and in part to the limitations of the method in respect to recovery of lithium and thorium. better known, and, with suitable modifications, Thorex appears to permit economic recovery of all valuable components of the fuel salt only mod- erately contaminated with certain fission products (e.g., cesium). "he costs associated with a modified Thorex process as described in Section 5.3 were used in an alternate evaluation of the MSCR.
On the other hand, the costs of Thorex pknts are rather
2-2-16 Fractional Crystallization Process
Studies by Ward et al. (108, lw, 80,,p. 80).pravide a basis for evaluating the feasibility of removing rare earth fluorides from the fuel salt by partial freezing. A brief description is given in Section 6.7030 The process is not suitable for a breeder reactor inasmuch as the fission product concentration cannot be lowered much below 0.2 mole $; however, much higher concentrations can be tolerated in a converter. erence design studied here, the concentration is approximately 0.5 mole $-
In the ref-
2.2.17 Other Processes
Solvents which will selectively dissolve either 'I"4 or rare earth fluorides are being sought at CIRNL.
promise. Solutions of SbF5 in HE' show some
The capture of a neutron by an atom of 233Pa results in a double loss - that of the neutron and of the fissile atom of 233U that would have been formed by decay of the Pa. and economically remove 233Pa from the circulating salt stream SO that it may be held outside the reactor until it decays to 233U. There i s a POS- sibility that exposing the fertile stream to beds of Tho2 pellets might accomplish this. exchange with Pa in the solution, and the latter will be immobilized until it decays, after which it might, as 233U, exchange with thorium in the salt, and so become available for recovery by fluorination. e-g., BeO, are also under study.
A process is needed that can quickly
There is some evidence that thorium from the beds will
Other oxides,

c
21
T
2.2.18 Molten Sa l t Reactor Studies
The s ta tus of the Molten Sa l t Reactor Program was reviewed i n 1958
for the second Geneva Conference by MacPherson e t a l . (56). time a homogeneous molten s a l t reactor having only a limited capabili ty
for f u e l regeneration was under consideration. Further studies of t h i s
system were reported by Alexander e t a l . (l), and a 30-Mwt experimental
reactor was described (2).
A t t ha t
Also, i n 1958, good indications were obtained t h a t the system INOR-
graphite-salt i s chemically s table i n radiation f i e l d s and at tent ion was
accordingly shif ted t o graphite-moderated systems.
(60) described a one-region single-fluid reactor u t i l i z ing s l igh t ly en-
riched uranium and a highly enriched feed.
were incorporated i n the present study.
MacPherson e t a l .
Many features of h i s concept
The potent ia l of graphite-moderated molten-salt reactors for breeding
i n the Th-233U cycle was investigated and the associated development
problems were ident i f ied by MacPherson i n a se r ies of papers (61-63)-
Several conceptual designsfor one- andtwo-region breeders were proposed.
One of these ( the I’GBR) was evaluated i n comparison w i t h four other ther-
mal breeders by the Thorium Breeder Reactor Evaluation Group a t ORNL (3);
t h i s system employed a fue l s a l t (contained i n graphite bayonet tubes and
circulated through external heat exchangers) together with a f e r t i l e s a l t
stream (containing a l l the thorium) surrounding the moderated core region. The major problems associated w i t h th i s concept were the development of a
r e l i ab le graphite-metal j o in t fo r connecting the bayonet tubes t o an INCJR
header and the uncertain behavior of the core structure fo r long periods
under i r rad ia t ion a t high power densit ies.
It was estimated tha t the MSBR could achieve f u e l yields up t o about
7$/year (doubling time about 14 years) a t f u e l cycle costs not greater
than 1.5 mills/kwhr; and tha t f u e l costs as l o w as 0.7 mills/kwhr could
be achieved by sacr i f ic ing the f u e l yield i n favor of lower processing
costs (3).
bd .

22
2.3 Molten S a l t Reactor Experiment
The favlorable r e su l t s obtained i n the various evaluation and develop-
ment programs led t o the i n i t i a t i o n i n May 1960 of preliminary design of
t h e Molten S a l t Reactor Experiment (12,5). of the en t i re system are scheduled for campletion i n mid-1964 and c r i t i -
c a l i t y late i n 1964, or ear ly 1965.
Construction and ins ta l la t ion
The MSRE is expected t o demonstrate the long-term r e l i a b i l i t y of
components and the compatibility of materiais under ac tua l operating con-
dit ions, including the dimensional s t a b i l i t y of the graphite and i t s re -
sistance t o permeation by f u e l salt i n the presence of radiations and the
maintainability of the system after operatiozl a t power.
The reactor w i l l produce up t o 10 megawatts of heat i n a f u e l con- sisting of a solution of highly enriched 235U'F4 dissolved i n a m i x t u r e
of the f luorides of lithium (99.990$ 7 L i ) , bery$lium, ,and zbconium
having a l iquidus temperature of 842°F. The salt enters a volute around
the upper par t of the cyl indrical vessel a t 1175°F and flows a t the r a t e
of 1200 gpm down through an annular plenum between the wall of the vessel
and up the graphite core-matrix.
square bars loosely t o INOR beams lying across the bottom of the vessel.
The s a l t flows up among the bars a t a veloci ty of 0.7 f t /sec. (Reynolds number 1000) and e x i t s a t 1225°F.
This is constructed by pinning E-5n;
The f u e l pump, a sumptype having a bowl 36 in . i n diameter and l2 in . high, is driven by a 75 hp motor and develops a head of 48.5 f t a t 1200 gpn.
The heat exchanger, a l so constructed of INOR, has 165 tubes 14 f t long by 1/2 in . OD with w a l l s 0.042 in. thick, and provides 259 f k 2 of
heat t ransfer surface (heat flux 130,000 Btu/hr*ft2 at a IMTD of 133°F). The reactor heat i s transferred t o a secondary salt coolant from whence it is discharged t o the atmosphere i n an air-cooled radiator .
i s too l o w f o r s ignif icant amounts of 233U t o be produced i n a reasonable
time.
la t ions of c r i t i c a l mass, etc. , and t o discover i f there are any unfore-
seen compatibility or s t a b i l i t y problems.
A l l par t s are constructed of INaR.
I n i t i a l l y , the E R E w i l l contain no thorium, since the power l eve l
Thorium may be added later t o permit ver i f ica t ion of nuclear calcu-

23
3 , BASES AND ASSUl@TIONS
3.1 Design Bases
3.1.1 Reactor Concept
The concept selected for study was mQdeled closely after that pro- posed by MacPherson et al. 9 (60 ) , and is essentially a scale'up) of the Molten Salt Reactor Experiment (12,5) plug necessary auxiliary equipment for generation of electricity, etc. tical bundle of unclad graphite logs contained in an INOR vessel. salt containing thorium and uranium flows up through the bundle into a plenum, thence through several pumps in parallel to the shell side of multiple shell-and-tube heat exchangers, and then back t o the reactor.
Briefly, the core consists of a ver- Fuel
3.1.2 Design Calculations
These were performed only in sufficient detail to permit the estima- Problems of control, shielding, hazards analy- tion of the capital cost.
sis, etc., were ignored. ance and processing costs. provide a basis for estimating the volume of the fuel salt circulating in the primary heat system, the net thermal efficiency, and the capital investment.
Attention was centered on the nuclear perform- The energy conversion system was designed to
3.1.3 Station Power
An electrical capability of 1000 Mw was selected to permit direct comparison with systems previously evaluated at the same plant capacity. Preliminary calculations indicated that the core should be -20 ft in diam- eter for satisfactory nuclear performance. At a power of 1000 &e, power densities are only 14 kw/liter of core and 35 kw/liter of salt (average). A lower plant output would result in inefficient utilization of the fuel inventory.

24
3-1.4 Plant Utilization Factor
The standard factor of 0.8 was used as recammended in the "Guide" (52).
3.1.5 Thermal Efficiency
c' Several different energy conversion schemes were considered in suf- ficient detail (see Section 4.3) to show that even the least efficient system (Loeffler boiler) would have, when fu l ly optimized, a thermal ef- ficiency not less than 40$. use in the fuel cost optimization calculations.
This efficiency was therefore adopted for
3.1.6 Fueling Cycle
For the purposes of optimization calculations, it was assumed that make-up fuel was added and spent fuel was removed quasi-continuously, and that, with three exceptions, the concentrations of the various nu- clides in the circulating salt system were in equilibrium with respect to feed rates, nuclear reactions, and processing rates. were 234U and 238U (which are initially present in amounts substantially lower than the equilibrium value, and whose concentrations increase with time) and 236U (the concentration of which starts at zero and reaches only about 3/4 of its equilibrium values in 30 years). isotopes, concentrations that approximated the average Over a life of 30 years starting with the reactor charged with 235U (95% enrichment) were used. concentrations in times short compared to the reactor life. equilibrium concentrations for these, especially for slowly equilibrating fission products, is discussed in Appendix H.
The exceptions
For these three
Other important isotopes appear to approach their equilibrium "he use of
3.1.7 Processing
The processing rate was optimized with respect to the fuel cycle cost. In the selected process, spent fuel is accumulated, shipped to a central Fluoride Volatility Plant, cooled for a minimum of 90 days, and treated for recovery of uranium. and 'Be are lost in the waste.
Undecayed 233Pa, along with 232!L'h, 7Li,

25
3-1.8 Feed and Recycle
In the optimization calculations, it was assumed that isotopes of uranium recovered from irradiated fuel are recycled, and that deficiencies in the breeding ratio are compensated by additions of 95$-enriched 23 5u.
The effects of a few feed and recycle schemes on the optimum reactor were studied (Section 6.9), such as the use of feeds containing a mixture of uranium isotopes (e.g., spent Pael from the Consolidated Edison Reactor at Indian Point, New York). The sale of irradiated fuel to the AEC as an alternate to recycle was also investigated.
3.1.9 Isotopic Composition of Lithium
It was assumed that lithium (as the hydroxide) would be available in grades containing up to 99.995% 7Li at a price no greater than that quoted in reference 67 ($120/kg of lithium). (rather than one having a lower cost) resulted from a compromise between cost of neutron losses to 6Li and the cost of discarding the salt enriched in 7Li with a processing rate of about 2 ft3/day.
The choice of this composition
3.1.10 Energy Conversion System
Although it would be difficult to establish a complete set of require- ments for coupling of the reactor system with the energy conversion system prior to the preparation of a detailed design, nevertheless, it is neces- saxy t o f ix some of these in order that the f u e l cycle cost may be esti-
mated. late the fuel salt from the thermodynamic fluid, at least when that fluid is water. The hazards associated with the possibility that high pressure steam might leak into the fuel system cannot be tolerated, since such leakage would result in the rapid formation of U02 (81, p. 63). only slightly soluble in the base salt, although its solubility can be increased somewhat by additions of ZrF4 and of ThF4 (84 , p. 96). tion of the steam and fuel systems is achieved by interposing a compatible third fluid, either as a stagnant layer or as a separate stream circulated between primary and secondary heat exchangers.
The most important requirement appears to be a necessity to iso-
I’
This is
Isola-

26
The intermediate coolant ( t h i rd f l u i d ) must be chemically compatible
with fue l salt, and i n addition, it is desirable that it be ine r t with respect t o steam.
e l se it should be readi ly removable from f u e l salt. design, a s a l t 66 mole $ LiF (99.9959 7 L i ) and 34 mole $ BeF2 was selected
(Table 3.4) as the intermediate f lu id .
Also, it should ei ther not be a nuclear poison, or For the reference
3.1-11 Primary Heat Exchanger Requirements
It i s important t ha t the external portion of the f u e l salt c i rculat-
ing system s h a l l have as small a volume as possible i n order t o reduce
the inventory of valuable materials. However, the r e l i a b i l i t y and main-
t a inab i l i t y of the system cannot be compromised i n favor of s m a l l volume.
A requirement for maintainability, which includes replaceabili ty, implies
tha t the primasy heat exchanger s h a l l be drainable of f u e l salt. quirement i s most easily and cer ta inly met by putting the f u e l salt i n
the shell-sides of the heat exchangers and grouping these about the reac-
t o r i n a v e r t i c a l posit ion so tha t the heads may be removed and the tube bundles l i f t e d out easilS;.
This re-
3.1.12 Minimum Sa l t Temperatures
To provide a margin of safety i n regard t o possible freezing of both
f u e l salt and intermediate coolant salt, it w a s decided tha t the operating
temperature of any salt stream should not be at a temperature l e s s than
t h e l iquidus temperature of the f u e l salt.
3.2 Cost Bases
3.2.1 Value of F i s s i l e Isotopes
Unirradiated, highly enriched 235U w a s valued a t $ U . O l / g r a m of con-
tained 235U (52).
formula V = f (E) $=/gram of contained f i s s i l e isotope (233U, 235U), where
f ( E ) i s an enrichment factor found by dividing the value of enriched
having the same composition as the mixture i n question by $12.0l/gram.
The enrichment, E, of the mixture is found by dividing the sum of the
Mixtures of isotopes were valued according t o the
235u

1
27
atomic concentrations of 235U and 233U (and 233Pa, if any) by the Sum Of atomic concentrations of all isotopes of uranium in the mixture (thus lumping 234U and 236U with 238U as diluents).
3.2.2 Value of Thorium
Inquiries directed to several vendors elicited only one reply (Appen- dix J); however, the quotation given ($6/lb of ThF4) agreed well with a 1959 estimate by Orrosion (89) and led to the adoption of a price of $19.00/kg of thorium as ThFc, ($6.5O/lb ThFt,) .
3.2.3 Value of LiF(99.9955 7Li)'-
This was taken to be $l20/kg of contained lithium (Appendix J) or $32.30/kg of LiF.
3.2.4 Value of BeF2
Inquiries cited in Appendix J led to adoption of a price of $15.40/kg of BeF2.
3.2.5 Value of Base Salt
This varied with the composition, but the base salt in the optimum reactor contained 68 moles of LiF per 23 moles of BeF2 giving a value of $25.97/kg.
3.2.6 Cost of Compounding and Purifying Fuel Salt
The operation of blending recycle uranium with make-up uraniurp and fresh lithium, beryllium, and thorium fluoride and purifying is to be per- formed on-site. The cost was therefore excluded from the operating and capital chazges of the processing plant and included in the capital and operating charges of the reactor plant.
3.2.7 INOR-8 Cost
The following cost information supplied by A. Taboada of CJRNL is based on quantity production. Manufacturing experience to date with fab- rication of the listed forms has not indicated the existence of any 4 i J

n 28
W L serious problems and therefore pricing safety factors i n the costs shown
may be pessimistic.
Plate $3 per l b
Round Rod $4.25 per l b
Welding Rod $8 per l b
Pipe (Seamless) $10 per l b
Pipe (Welded) $5 per l b
Tubing (Seamless) $12 per l b
Tubing (Welded) $6 Per l b Simple Forgings
Fabricated Plate
Dished Heads $5.50 per l b
Forged Pipe F i t t ings
Castings $2 per l b
$4.50 per lb (e.g., tube sheets)
$10 per l b (e.g., pressure vessel shells3
$50 per l b
3.2.8 Moderator Graphite Cost
The cost of graphite such as would be used i n the MSCR core bas been
established at $6.00 per lb .
dor s . This i s from informal discussion w i t h ven-
3.2.9 Annual Fixed Charges
For f issi le isotopes, the use charge was taken a t 4.75$/yr i n ac-
cordance with the "Guide" (52).
carried as depreciating asse ts (since only the isotopes of uranium and
thorium are recoverable).
annual r a t e of 14.464 fo r an investor-owned public u t i l i t y (IOPU). ra te , however, includes 0.354 f o r interim replacement when the r a t e of re-
placement i s not known. In the present instance, the replacement r a t e s
f o r base salt were calculated and the corresponding costs l i s t e d sepa-
ra te ly; therefore, the annual charge for the above items w a s s e t a t ~ . 14.-U$/yr. This included a l so l.ll$/yr for amortization by means of a 30-yr sinking fund with cost of money a t 6.75$~/yr; hence, a charge fo r
replacement of salt a t the end of 30 years was not made e i ther separately
or as par t of the f i n a l processing t o recover the uranium inventory.
Other components of the f u e l mixture were 4
For such the "Guide" recornends (Table 3.1) an This
i - - < u L

29 .-
3-2-10 Central Fluoride Volatility Plant Processing Charges
The schedule given below was extracted from the estimates presented in Table 5.9 and apply to a plant capable of processing 30 ft3 of salt per day (about lOOO/kg day of thorium for the reference design salt) for recovery of isotopes of uranium. Capital The barren salt is discarded. investment ($25.5 million) was estimated by scaling from a study by Carter, Milford, and Stockdale ( 2 1 ) of two smaller on-site plants (1.2
and 12 ft3/day), and adding costs of other facilities required in a cen- tral plant (receiving, outside utilities, land improvements, etc. ). The plant is large enough to service about fifteen 1000 Mwe molten salt con- verter reactor plants. ping charges ($10.30/kg thorium) were estimated separately (Table 5 . 8 ) -
A turn-around-time of two days was allowed. Ship-
Table 3.1. MSCR Reference Design One Ton/Day Central Fluoride Volatility
Plant Cost Schedule
Production Rate Processing Cost* $/kg Thorium kg/day of Thorium
from Reactor
320 160 80 40 53.3 40 26.7
23.0 24.0 25.3 26.1 26.6 27.6 30.0
*hcluding shipping.
3.3 Special Assumptions
3.3.1 Permeation of Graphite by Salt
Tests with MSRE fie1 salt at 1300°F and 150 psi in MSRE graphite showed penetrations of the order of 0.02% in 100 hours (86, p. 93) . Most of the absorbed salt was contained in pockets lying at the surface of the graphite, and presumably in cammunication with bulk liquid. From a metal- lographic examination of thin sections, it was concluded that penetrations
c 1

t 30
considerably less than 0.12s would be encountered i n the MSRE a t the
maximum pressure of 65 psia.
it was assumed the penetration would be O.l$, and tha t only pores lying
a t the surface would contain salt. the volume of salt absorbed i n the graphite would be s l i gh t ly less than
l$ of the volume of salt i n the core.
t o have the same composition as the circulat ing stream.
For the purposes of evaluating the "R,
Thus, i n a core 90 volume $ graphite
This absorbed salt was assumed
3.3.2 Permeation of Graphite by 135Xe.nont
The so lubi l i ty of xenon and other noble f i ss ion product gases i n fue l
salt i s very low (107); also, the i r adsorption on graphite a t 1200°F ap- f
pears t o be negligible (17). However, there remains the poss ib i l i ty t h a t
gaseous xenon may diffuse in to the pores i n graphite a t a rate large corn- pared t o that at which it can be removed from the salt by sparging or
spraying. sented by Watson, e t . al. (107), who a lso established probable ranges
fo r the diffusion coefficient.
t i on having a reasonable degree of p laus ib i l i ty , a value of
see) was selected f o r the diffusion coeff ic ient and a value of 0.01 for
the porosity of graphite t o noble gases. Further, it w a s assuuied t o be
feasible t o by-pass 1% of the f u e l s a l t (16 f t3/sec) through the pump
bowls or through a sparge chamber, and tha t t h i s by-pass steam would give
up substant ia l ly a l l of i t s xenon t o the sweep gas.
3.3.3 Corrosion Products
*
The mathematical treatment of the case a t hand has been pre-
For the purposes of a reference calcula-
(cm2/
i
Tests i n a forced corxection INCX loop using a s a l t (62-LiF, 36.5-
BeF2, 0.5-UF4, 1.0-ThF4) very s i m i l a r (except f o r thorium content) t o
tha t proposed f o r the MSCR, show t h a t after a period of i n i t i a l a t tack
(occurring generally i n the equipment i n which the batch of salt i s pre-
pared) the concentration of structural-element cations reaches equilibrium
values (84, p. 79).
leg, llOO°F i n the cold leg, and w a s circulated fo r a t o t a l of almost
The temperature of the salt was 3300°F i n the hot
15,000 hours. The concentration of nickel, a f t e r r i s i n g t o a maximum of
80 p p i n about a thousand hours, reached an equilibrium value of about r? u

5
'c)
*
31
50 ppm at 2000 hours. 600 ppm, averaging about 500 ppm, while iron averaged about 250 ppm. Molybdenum was said to be negligible and was not reported.
Chromium concentration fluctuated between 400 and
Apparently the concentration of chromium is in equilibrium with respect to the rate with which chromium is oxidized by UF4 to CrF2 at the hot metal surfaces and the rate with which it is reduced to O C r at the cold surfaces (75, p. 39).
to the salt at all temperatures between 1100°F and 1300°F. rate of diffusion of chromium in INOR has been determined at various teniperatures, it is not possible to calculate the chromium concentration in the salt until the temperature profile is known.
In the MSCR, large areas of INOR are exposed Although the
In the calculations performed here, a neutron-poison allowance was made for corrosion products, amovnting to 0.008 neutrons per atom of fuel destroyed. "his loss is comparable to the loss that would result if the concentrations of Ni, C r , and Fe were 50, 500, and 250 ppm, as in the loop-corrosion test cited above (Section 6.3).
3.3.4 Approach to Equilibrium
The nuclear performance was calculated by means of MERC-1, an equi- librium reactor code. approach to equilibrium, when concentrations of isotopes of uranium and of fission products are changing, was not considered, except in regard to 234U, 236U, and 238U.
years; 233U, 235U, and fission products were taken at their equilibrium values.
Thus the performance of the reactor during the
These were averaged over a fuel lifetime of 30
In cases where adequa supplies of 233U are unavailable the reactor would be fueled initially with enriched 235U.
in respect to eta and also forms a non-fertile daughter, 236U. disadvantages are offset by initially-low concentrations of fission products and 236U. desirable in such cases, it does not appear that the error introduced by assuming equilibrium conditions is important. further in Appendix H.
This is inferior to 233U
These
While a calculation of the time-dependent behavior is J
The matter is explored

32
4. DESCRIPTION OF MSCR CONCEPT
4.1 General Description
The MSCR i s a single-region, unreflected, graphite-moderated f luid- fue l reactor u t i l i z ing a mixture of molten fluorides of lithium, beryl-
l i u m , thorium, and uranium as the f i e 1 and primary coolant. A sketch of
the reference design reactor i s shown i n Fig. 4.1. As seen i n t h i s f i g -
ure, the reactor consists of a 20-ft-diam by 20-ft-high cyl indrical core made up of 8-in.-diam graphite cylinders.
a bottom grid, flows upward through the spaces between the cylinders and i s discharged in to one of eight primary heat removal c i r cu i t s located
around the reactor. 4.2. coolant salt consisting of a mixture of barren lithium and beryllium
fluoride containing no uranium or thorium. The coolant salt i s used t o
superheat saturated steam produced i n a Loeffler boi ler and also t o re-
heat steam f r a m the turbogenerators. "he reactor vessel , in ternals and
a l l primary and secondary system components i n contact with fue l s a l t and
coolant salt a re constructed of INOR-8. The specifications a re tabulated
i n section 4.10. turbine and the rest i s injected in to the Loeffler boi lers t o generate
saturated steam. This saturated steam i s recirculated t o the superheater
by steam-driven axial compressors using steam drawn f r o m the high-pressure
turbine discharge. A flowsheet of t h i s heat removal-power generation sys-
tem i s shuwn i n Fig. 4.3.
The fue l s a l t enters through
The arrangement of these c i r cu i t s i s shown i n Fig. The heat generated i n fuel salt i s transferred t o an intermediate
Part of the superheated steam i s sent t o a high-pressure
Design data and operating character is t ics fo r the reference design are given i n Table 4.1.
4.2 S i t e Plan,.
The s i t e plan of the MSCR plant i s shown i n Fig. 4.4 based on con-
The 1200-acre di t ions specified i n the AEC Cost Evaluation Guide (52). grass-covered s i t e has l eve l t e r r a in and is located on the bank of a r iver . Grade l eve l of the s i t e is 40 f t above the r ive r low water l eve l

33
ORNLDWG. 63-2801Rl

ORNLDWG. 65-7906
/ 1
(' I
I I I I I I I I I
',
REACTOR VESSEL '\
PRIMARY HEAT EXCHANGER
COOLANT PUMP
c COOLANT SALT LINE
SHIELD
Fig. 4.2. MSCR Heat Transfer Flow Diagram.

_I-
Ik I \
?I -

A 3 > 0
7 I w
a\
W
c

37
, ,
! ! . ? -
2 -
I
j
Table 4.1. Design Characteristics of the 1000 Mwe Molten Salt Converter Reference Reactor
General Thermal power Net thermal efficiency Net electrical power Core geometry Moderator
Form Dimensions Weight Volume fraction in core Porosity accessible to salt (assumed) Porosity accessible to gas (assumed) Gas diffusion coefficient (assumed) Graphite density Radiation heating (ma. ) Maximum temperature rise
Reactor vessel Inside diameter Thickness Maximum temperature Weight, including internals Radiation heating in support plates Radiation heating in vessel wall Maximum temperature rise in wall
Fuel stream Composition
Base salt ( LiF-BeF2 -ThF4 ) U F ~ (fissile) Fission products Corrosion products
Liquidus temperature of base salt Density.of base salt at 1200°F Mean heat capacity of base salt at 1200°F Fraction of core occupied by fuel salt Fuel stream inlet temperature Fuel stre& outlet temperature Flaw rate Velocity in channels in core (avg. ) Velocity in piping Velocity in heat exchanger
Shell side Tube side
2500 Mw 41.5% 1038 Mw Cylindrical, 20 ft x 20 ft Unclad graphite CylindEr s 8 in. diam, 24 in. long 335 tons 0.9 0.1%
1.9 g/cm 5.2 watts/cm3 520°F
1.0% 10-6 cm2isec
INOR-8 20 ft-2 in. 1.7 in. 1400°F 125 tons 2 watt s/cm3 0.6 watt s/cm3 40°F
68-22-9 mole $ 0.3 mole % 0.5 mole '$ 750 ppm 887 OF 3.045 g/cc 0.383 Btu/lb OF 0.1 ll0O"F 1300°F 160 ft3/sec 6 ft/sec 35 ft/sec
20 ft/sec 31 ft/sec

38
Table 4.1 (continued]
Fuel Stream, (continued)
Pressure, psia Pump discharge Heat exchanger i n l e t Heat exchanger out le t Reactor i n l e t Reactor ou t le t Pump suction
Parer density i n f u e l salt I n core ( m a x . ) Average Over en t i re f u e l volume
Volume of fue l salt In act ive core In top and bottom plena I n f u e l annulus adjacent t o vessel wall In surge tank I n pumps In heat exchangers I n connective piping In dump tanks and r eac t iv i ty control tanks
TOTAL
Volume of fue l i n active core
Primary heat t ransfer loop
Primary pumps; number and type Pressure a t pump discharge Primary heat exchangers Total heat transfer area Average heat f lux Material Weight
Secondary heat t ransfer loop
Coolant salt composition (mole $) Coolant salt i n l e t temperature Coolant salt outer temperature Coolant salt flow rate Coolant salt pump discharge pressure Coolant s a l t volume
190 185 95 80 35 22.. 5
510 w/cc 35 w/cc
630 f t3 540 ft’ 105 f t3
130 ft’
320 ft’
85 f t 3
575 ft’
115 ft’
2500 f t3
650 ft3
8 - Sa l t Lubricated 200 ’psi 8 - Shel l and Tube 53,000 f t 2 160,000 Btu/hr*ft2
36,000 l b each INOR-8
66-LiF; 34-BeF2 950°F U.00 OF 203 ft3/sec 350 p s i 5600 f t3
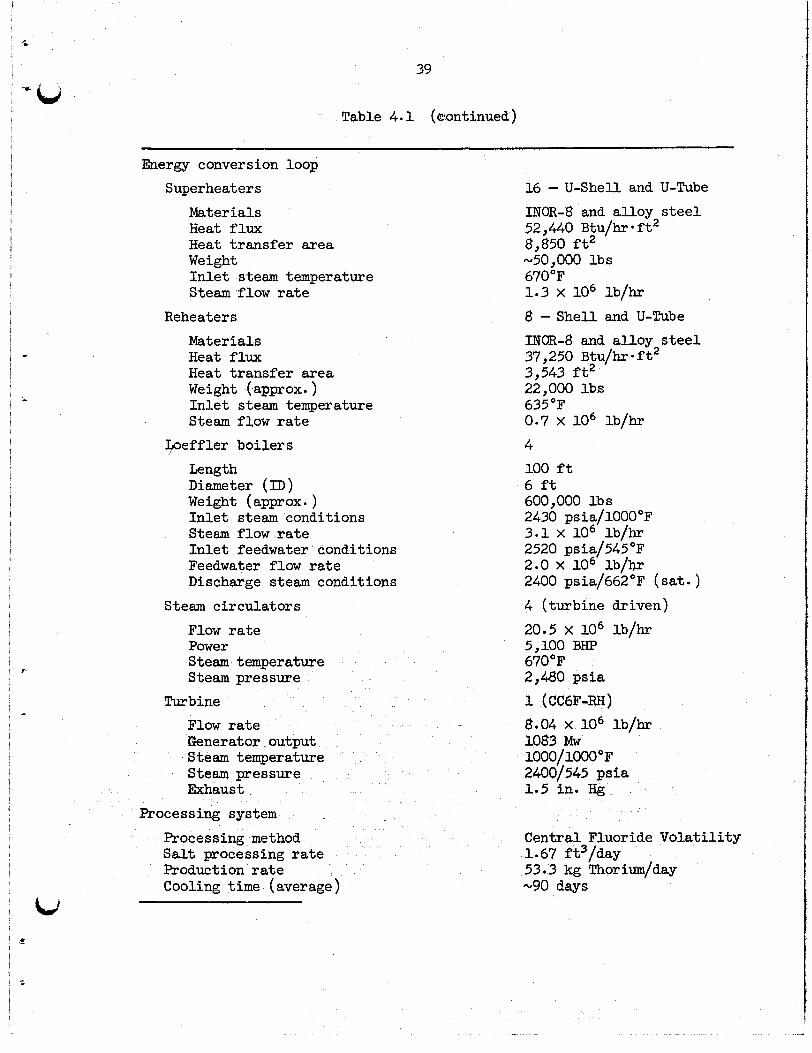
W t
39
Table 4.1 (continued)
Energy conversion loop Superheaters
Materials Heat flux Heat transfer area Weight Inlet steam temperature Steam flow rate
Reheaters Materials Heat flux Heat transfer area Weight (approx. ) Inlet steam temperature Steam flow rate
$oef f ler boilers Length Diameter (ID) Weight (approx . ) Inlet steam conditions Steam flow rate Inlet feedwater conditions Feedwater flat rate Discharge steam conditions
Steam circulators Flow rate Power Steam temperature Steam pressure
Turbine Flat rate Generator output -Steam temperature Steam pressure Exhaust
Processing system Processing method Salt processing rate Production rate Cooling time ( aver age )
16 - U-Shell and U-Tube INOR-8 and alloy steel 52,440 Btu/hr ft2 8,850 ft2 -50,000 lbs 670°F 1.3 X lo6 lb/hr 8 - Shell and U-Tube INOR-8 and alloy steel 37,250 Btu/hr f t2 3,543 ft2 22,000 lbs 635 OF 0.7 X lo6 lb/hr 4 100 ft 6 ft 600,000 l b s 2430 psia/100O0F 3.1 x lo6 lb/hr 2520 psia/545OF 2.0 X lo6 lb/W 2400 psia/662"F (sat 4 4 (turbine driven) 20.5 X lo6 lb/hr 5,100 BHP 670'F 2,480 psia 1 (CCGF-RH) 8.04 x lo6 lb/hr 1083 Mw l O O O / l O O O ~ F 2400/545 psia 1.5 in. Hg
Central Fluoride Volatility 1.67 ft3/day 53.3 kg Thor ium/day -90 days

40
Table 4.1 (continued)
Processing sys tem (continued) Hold-up time ( t o t a l ) 126 days Processing batch s ize Processing plant capacity 1,000 kg/day Turn-around time 2 days
-6,000 kg Thorium
and 20 f t above the high water level .
for the ultimate s ta t ion capacity i s assumed t o be provided by the r iver
w i t h an average maximum temperature of 75°F and an average minimum tem- perature of LOOF.'
An adequate source of r a w water
4.3 Structures
Plan views of the reactor and turbine building are shown i n Figs. 4 - 5
and 4.6 and v e r t i c a l sections i n Fig. 4.7. reactor building and turbine building are addscent, the secondary shield
w a l l forming a separation from grade t o the main f loor .
are two-level s t ructures w i t h the grade f loors of the turbine and reactor
buildings a t an elevation of one foot above grade, and the main f loor a t 36 f e e t above grade. The secondary shield wall extends t o the main f loor
and forms the w a l l s of the lower part of the reactor and auxi l iary build-
ing -
As seen i n these figures, the
"he buildings
"he turbine building and the upper l eve l of the reactor and auxiliary
buildings are s t e e l frame structures, w i t h insulated metal panel siding.
The arrangement of the equipment within the buildings i s indicated on the
general arrangement drawings, Figs. 4.5 and 4.7. '
A three-level s t e e l frame and insulated metal-pBnel structure ad- joining the turbine building houses the administrative offices, control
room, switchgear, ba t te r ies , plant heating boi ler and makeup water de-
mineralization plant.
are also located i n this building.
Lockers, showers, and t o i l e t s fo r plant personnel
A 200-ft waste gas stack i s provided for dispersal of plant venti-
l a t i ng air and waste gases from the various reactor and reactor equipment rooms.

!-
rl %
f
i \I
-
1: i
J
I, .
i
J
. r

I I
i
u

(J
.b 4
i

44
4.4 Primary System Components
The primary system components consist of the reactor vessel, modera-
tor, fuel salt pumps and fuel salt-to-intermediate coolant salt heat ex- changer. The arrangement of these components is shown in Figs. 4.1 and 4.2. Design and performance characteristics are summarized in the follow- ing paragraphs.
4.4.1 Reactor Vessel
The reactor vessel is 20 ft in diameter and 37 ft high (including expansion dome) as shown in Fig. 4.1.
2-in.-thick INOR-8. ing of the vessel wall does not exceed 0.6 w/cc. external vessel insulation and salt flow through the core-vessel annulus can be adjusted as necessary to avoid excessive thermal stresses in the vessel wall and at the same time minimize heat loss to the external con- tainment space.
The vessel wall is fabricated of No thermal shield is required since the gamma heat-
The thickness of the
A 6-ft diam expansion dome at the top of the reactor vessel not only provides surge volume but serves as the fuel salt volatiles purge loca- tion, the UF4 pellet injection point and salt sampler location. Circula- tion of fuel salt in the dome is accomplished by recirculation of salt from each pump discharge through an orificed 2-in. line to a point below the normal liquid level in the dome. ing the pressure of the helium cover gas. 5% of the volume of the dome is occupied by 2-in. dim sealed INOR-8 tubes.
This level is maintained by adjust- To minimize holdup of salt,
The reactor vessel is provided with eight inlet nozzles which dis- charge fuel salt radially into the bottom plenum, eight outlet nozzles leading to the pumps, together with bottom and top INOR-8 grids for sup- port and restraint of the graphite core. These grids in turn are sup- ported by columns or stanchions attached to the reactor vessel.
The reactor vessel specifications are given in Section 4.10.

i 'U i
r
45
4-4.2 Moderator Skructure
The graphite matrix is composed of cylindrical logs 8.in. in diameter and 24 in. long, as shown in Fig. 4.8. These are stacked in a vertical position and alligned by means of axial pins and sockets. up through the cusp-shaped passages between logs.
Fuel-salt flows
The "pile" is centered in the vessel by metal pins protruding from the support plates at the bottom and top of the vessel. near the axis of the vessel and mate with a corresponding moderator log. Initially the pile rests on the lower support grid; as the reactor is filled with salt, the pile floats up against the upper grid. while allowing this vertical motion, keep the central logs centered in the vessel. passing around the peripheral logs. These hoops are fabricated from mo- lybdenum, which has about the same coefficient of expansium as graphite. This arrangement allows the support grids to expand independently of the moderator as the reactor is broughk to operating temperature. Also, the increase in height of the vegsel on expansion is accommodated.
These are located
The pins,
The remaining logs axe bound to these by means of metal hoops
"he radial profile of temperature in the fuel-salt is flattened by proper distribution of the flow, which is accomplished by orificing the flow channels. The bottom row of moderator logs is machined from hexa- gonal pieces. grid is not machined. would block completely the f l o w path of the fie1 salt. Therefore, the
corners of the hexagons axe cut away to provide orifices of appropriate diameter for each channel.
A &in. section of the end in contact with the support If close-packed in a triangular lattice, these ends
4.4.3 Fuel-Salt Circulating Pumps
Circulation of the fuel salt flowing at 9075 gpm is maintained by a centrifugal pump as sham in Fig. 4.9 in each of the eight independent heat exchange circuits. Because the system has no valves or other means of equipment isolation, the pumps are installed at the highest elevation (and the highest temperature region) of the circuit between the reactor and the primary heat exchanger. the hazard of seal flooding and reverse rotation at standstill and to
By this means it is possible to avoid

46
ORNL-LR-DWG 63-2803
Bhck Annulus
Fig. 4 .8 . MSCR Core Configuration.

47
ORNL-LR-DWG 417651
i 1 : 1 7
VEL
Fig. 4.9. Molten Sa l t Journal Bearing Pump.

48
minimize some design problems re la ted t o thermal expansion, shaft sea l
and guide bearings, and maintenance accessibi l i ty .
close t o the reactor, however, introduces the problem that the organic
Locating the pumps SO
materials used i n the motor winding insulatiaq and bearing lubricant must be shielded from radiation. Also the pump motor and oil-lubricated bear-
ings must be located a t some distance from the s a l t region.
shown, the motor and oil-bearings are positioned above the pumps fo r easy
maintenance and a lower salt lubricated bearing providbd t o take the
r ad ia l thrust .
by allowing salt t o leak upwards around the shaft and out a smaU vent
l ine .
and a vo la t i l e f i ss ion product purging wrface. th i s casing is maintained a t the Same leveJ as tha t i n the expansion dome
under a helium cover gas a t 22 psi.
prevent impeller cavitation.
In the design
Circulation of salt through th i s bearing i s accamplished
A cyl indrical casing above the impeller provides expqnsion volume The surface of s a l t i n
This gas overpressure a l so helps
Detailed specifications of the MSCR pumps axe given i n Section 4.10-
4.4 .4 Primary Heat kchanger
The design of the heat exchanger f o r transferring heat f r o m the f u e l
s a l t t o the intermediate coolant salt i s shown i n Fig. 4-10. and tube heat exchanger i s of a U tube configuration designed par t icular ly
fo r access ib i l i ty t o the tube sheet from above without disturbing con-
This s h e l l
necting piping.
possible w i t h the given design.
more valuable f u e l salt, which normally would be circulated through the
tubes, is put on the she l l side t o permit ready drainage. The tube bundle - and associated baffles, which can s l ide in to the s h e l l from above, hang
from the tube-sheet which r e s t s on a shelf machined in to the she l l . A
circumferential s e a l weld joins the tube sheet t o the she l l and separates the coolant from the f’uel salt. A Wid-down r ing keeps the tube sheet i n
place i n case pressure on the s h e l l side should exceed pressure on the tube side.
Removal of the tube hundle through the top head i s a l so
With-this configuration, however, the
Normal design conditions require that the coolant salt (tube
s ide) be kept a t a pressure higher than tha t of the f’uel salt. ,-\
bid i

49
ORNL-LR-DWG 63-2802
, ciis
Fuel Salt
Y i
I I
Fig. 4.10. MSCR Primary Heat Exchanger.

50
- i
"he end-closure may be sealed against leakage of coolant salt t o the
outside bp several ways.
valve sea t ) i s provided at point "A" shown on Fig. 4.10.
sea l is maintained i n the annulus above "A".
a t the top between the flange on the s h e l l side and the inverted head.
O r l a s t ly , double-gaskets on c i r c l e s inside and outside of the sea l weld l i p could confine leakage i f the sea l weld, or other seals ahead of the
sea l weld, should fa i l .
flange provides the strength necessary t o hold the inverted head against
the several hundred pound pressure of the coolant salt.
A bearing and sealing surface (much l i k e a A frozen s a l t
A sea l weld could be made
A massive hold-down flange bolted t o the top
A par t i t ion attached t o the inverted heat f i t s closely in to a dia-
metrical s l o t i n the tube sheet t o separgte the i n l e t coolant salt plenum
from the out le t plenum. A s m a l l amount of by-pass flaw may occur thraugh
the very small gap between the s l o t and the par t i t ion . The inverted head is shaped so as t o minimize the volume of coolant s a l t i n the tube-sheet
dis t r ibut ion plenums.
l a r i n cross section (f la t tened and broadened so as t o minimize head-space
without sacr i f ic ing flow area).
The i n l e t and out le t coolant nozzles are noncircu-
Not shown are cooling and heating prwis ions fo r $he top head, heat-
ing provisions for the shell ar the insulation which must be provided. In order t o avoid excsssive thermal s t resses i n the tube sheet it may
be necessasy t o reduce the thermal gradient wross the tube sheet by pro-
viding insulation between it and the f u e l salt.
An appreciable heel of coolant salt w i l l remain i n the tubes a f te r
draining.
changer be exposed only t o i n e r t atmospheres when the top closure i s re-
moved, the upper portion of the heat exchanger (above the coolant nozzle)
is prorrided w i t h a gas-tight caisson tha t extends from the heat exchanger
t o the loca l i t y of the maintenance equipment.
changers per reactor, each w i t h a heat load of 1.006 X lo9 Btu/hr per uni t .
In order that the salt-containing intesnals of the heat ex-
The specifications given i n Section 4.10 are based on eight heat ex-
..
6 a
*

i -
?
51
4.5 Intermediate Coaling System
4.5.1 Introduction
Leakage of steam in to the f u e l s a l t would res-alt i n precipitation of
uranium; therefore, a material which has good heat transfer properties and
i s compatible with both f u e l s a l t and steam must be interposed between
these two materials. LiF-BeF2 appears t o be the most promising and i s used as a basis f o r the
present MSCR design involving a Loeffler steam generation system. design the intermediate cooling system consists of the heat exchanger a l -
ready described, coolant s a l t pumps, steam superheaters and steam reheat-
ers .
Of the various possible choices, a barren salt of
In t h i s
4.5.2 Coolant Sa l t Pumps
The coolant s a l t pumps are s i m i l a r i n design t o the fue l s a l t pumps
but have a higher capacity and head.
heaters and four reheaters and each pump circulates 13,900 gpm of coolant
s a l t a t a temperature of 950°F and the primary heat exchanger i n l e t pres-
sure of 300 psia. The developed head of the pump i s approximately 270 f t .
Additional specifications f o r the coolant pumps are given i n Section 4.10.
Eight pumps serve the sixteen super-
4.5.3 S t e m Superheaters
Steam from the superheaters is divided among several streams. About
2% i s used t o drive the turbogenerators f o r the production of e l ec t r i c i ty ;
a much smaller f rac t ion i s used t o drive other turbines which power feed-
water pumps and the steam circulators.
i n the Loeffler boi ler t o produce saturated s t e m required i n the super-
heater.
The balance i s mixed w i t h feedwater
A U-tube i n U-shell arrangement w i t h f ixed tube sheets and counter-
current flow of coolant s a l t and steam i s shown in Fig. 4.ll. s a l t is on the shell-side, and steam flows through the tubes.
mounted on i t s side t o minimize f loor space. The shell-side i s unbaffled
t o minimize pressure drop. The heat t ransfer coefficient with near-laminar flow of coolant s a l t is about 15% l e s s than for baffled flow, and requires
Coolant
The unit i s

52
COOLANT SALT IN
A ORNL-LR-DWG 39169A
TUBE SHEET
SANRATED STEW IN
U t
COOLANT SALT OUT
Fig. 4.11. MSCR Steam Superheater.

53
more tubing. To prevent freezing of the s a l t , the superheater i s brought
up t o operating temperature by steam generated i n an auxiliary, o i l - f i red boiler.
Coolant s a l t operating between 950 and 1100°F circulates through the
Steam enters a t 670°F and 2490 psi , and leaves a t 1000°F and shell-side.
2465 ps i .
4.5.4 Steam Reheaters
In order t o provide greater energy ava i lab i l i ty for the turbine work
cycle and t o provide lower pressure steam t o drive auxiliary turbines, the
high pressure turbine exhaust steam i s directed t o the reheaters, the
auxiliary turbines, and the second feedwater heaters. The same general
design c r i t e r i a apply t o the reheaters as t o the superheaters, although
the steam i s a t a lower pressure. As with the superheaters, the reheaters are constructed of INOR-8
and alloy s tee l . Eight uni ts provide the desired heat transfer surface.
Again, the coolant s a l t flows i n the s h e l l countercurrently t o the steam passing through the tubes.
conditions ex i s t i n the reheater as i n the superheaters, aJthough baff l ing
( t o improve heat t ransfer ) on the she l l introduces a pressure drop of about 40 ps i .
Comparable pressure drop and heat transfer
4.6 Power Generation System
4.6.1 Introduction
Before selecting the power generation system fo r the MSCR a number of a l ternat ive approaches were considered i n some de ta i l . These included the
use of (a ) a mercury boiler, (b ) a "Kinyon" boiler, ( c ) a "Bettis" boiler,
and (d) a "Loeffler" boiler.
steam generation systems are summarized as follows. The character is t ics of these al ternat ive
The use of binary mercury-steam power cycles f o r power generation
from sol id f u e l reactors has been studied by Bradfute et-Lal, (13) and
Randall e t al. (92). binary cycle t o molten s a l t reactors.
- Kinyon and Romie (55) considered application of the
The binary system, i n addition t o

54
mitigating the thermal s t r e s s problem, has the f'urther advantage of a
higher thermal efficiency (95). changers are required a t the high tempersture end, and it i s not obvious that the f u e l salt volume w i l l be small compared t o that involved i n the
Loeffler system.
On the other hand, bimetallic heat ex-
"he "Kinyon" boi ler (53) employs bayonet elements composed of three
concentric tubes.
the innermost tube and i s botled by heat transferred f r o m superheated
steam f l w i n g downward i n the outer annulus.
l iquid a t the top of the inner annulus; the l iqu id i s routed down the
central tube t o a plenum from which it i s recycled t o the boiling annulus. Vapor passes down the outer annulus; it i s superheated by salt surrounding
the bayonet element and i n turn boi l s the water r i s ing i n the inner an-
nulus. tubing. . The system avoids the use of steam recirculators .
the bayonet tube boi ler may be more compact and l e s s eppensive than the
equivalent superheaters and boi lers i n the Loeffler system.
c l e w , however, t ha t the required rate of vapor-liquid separation can be
achieved with present technology.
The "Bettis" boi ler is a modification of the "Lewis" boi ler (59,55)
Water is introduced i n the annular passage surrounding
Vapor i s separated from the
This arrangement results i n tolerable thermal s t resses i n the Furthermore,
It is not
wherein a bayonet tube containing water and steam i s inser ted in to a
thimble extending down in to the fue l salt. the annular space between the pressure tube and the thimble, providing
thermal contact along w i t h physical isolation.
steam circulators and a l so eliminates the necessity for pumping the in-
termediate s a l t .
An i n e r t buffer s a l t occupies
This system avoids use of
4.6.2 Loeffler Boiler System
In the system selected for the reference design, four boilers gen-.
e ra te steam by d i rec t contact between the steam from the superheaters and
the feed water from the turbine cycle.
the saturated steam from the boi lers through the superheaters of the ine r t
salt system, providing steam a t 2400 psia, 1000°F a t the turbine t h r o t t l e
and a t the superheated steam i n l e t of the Loeffler boi lers .
Four steam compressws c i rcu la te

55
These boilers, sham in Fig. 4.12, consist of cylindrical drums with ', an inside diameter of about 72 in., with distribution pipes for super-
heated steam and feed water located on the vertical centerline and below the horizontal centerline of each drum. Conventional cyclone steam sepa- rators, located above the horizontal centerline and arranged in four paral- lel rows along the inside of the drum, separate the steam from the boiling water. A system of scrubber-type steam driers occupies the upper part of the drum. they leave the two distribution pipes and boiling occurs. water is guided by internal baffles through the cyclone separators where the water is removed by centrifugal force. moisture flow through the scrubbers, where the steam is dried to approxi- mately 99.7 quality. designed for a pressure of 2625 psia. quired for an inside diameter of 72 in. and a temperature of 650°F. drum is about 100 ft in length and has hemiellipsoidal heads.
In operation, superheated steam and feed water are mixed as The boiling
Steam and a small amount of
The drums are fabricated of carbon steel and are A wall thickness of 7 in. is re-
Each
4.6.3 Steam Circulators \
The steam circulators are single-stage axial compressors suitable for a steam flow of approximately five million lb/hr at a discharge pres- sure of 2480 psia. The circulators are driven by steam turbines, using steam frm the cold reheat lines of the main turbine-generator. conditions, each circulator requires a power input of 4750 BHP. from the turbines is returned to the cycle through the feed-water heaters. One circulator has a motor drive suitable for full flow at design pressure to be used during stat-up shutdown. An oil-fired package boiler, de- signed for a saturated steam flow of 50,000 lb/hr at 300 psia, is provided for stetrtup purposes.
At design Steam
The system is designed t operate as four 1/4 capacity units; each unit consists Qf one Loeffler boiler, one steam circulator and four sbper- heaters. Valves are located according to this philosophy. Interconnec- tions between various units are not provided except at the inlet to the boilers and the discharge from the superheaters.

. _ .
ORNL DWG., 65-7908 l4 in. Sch. 160 Steam Header
Cyclone Separat
uperheated Steam Headers
Operating Conditions (one unit): In le t Water In le t Steam Outlet Steam
2 X lo6 lb/hr @ 545OF, 2500 psi 3.1 x lo6 lb/hr @ 100°F, 2450 psi 5.1 X lo6 lb/hr , sat. @ 2400 psi
Fig. 4.12. MSCR Loeffler Boiler.

57
4.6.4 Turbogenerator
The turbogenerator is a standard CC6F-RH unit operating at 2400 psia 1000°F and producing a gross electrical output of 1083 Mw.
Fig. 4.3 the units consist of three turbines: sure units and one double-flow intermediate pressure unit on one shaft with a 667 Mw net output plus three double-flow low pressure units on another shaft with a 416 Mw net output.
As shown in two double-flow high pres-
The plant auxiliaries have a maximum coincidental loading of 45,000 kw; this power results in a net station output of 1038 Mwe to the station main power transformers.
,,
Other characteristics of the power generation system are given in Fig. 4.3 and summarized in Section 4.10.
4.7 Reactor Control System
4.7.1 Introduction
The specifications for the MSCR control system depend on the unique properties of its fluid-fuel.
UF4 to increase reactivity and by replacement of fuel salt with a salt containing no fissile isotopes to decrease reactivity.
The main mode of shim control is by adding
This control is supplemented by operational control with BF3 gas, which is sufficiently soluble that adequate concentrations may be obtained in the salt by regu- lating the partial pressure of BF3 over the salt surface in the dome.
Fuel is added to compensate burnup and fission product accumulation. Greater reactivity control is required during startup and shutdown. The startup procedure involves a gradual increase in power, during which the rising xenon poisoning (controlled by the flux level) is compensated by the addition of new fuel. for forty hours while 135X
After shutdown, the reactor is sub-critical If longer shutdm is required, grows in.
then fifty cubic feet of f’uel salt must be removed and replaced by non- fissile salt.
Emergency shutdown, such as that required in a loss-of-flow accident, is provided by injecting BF3 gas through tubes opening into the core just above the bottom support grid. The BF3 will displace fuel, will rapidly

58
* .
-4
w : dissolve in the salt, and will diffuse into the graphite. processes will result in a rapid and large decrease in reactivity.
A l l of these
J
4.7.2 Shim Control
For shim control by fuel addition or removal, two reactivity-control drain tanks of 50 cubic ft capacity each and a shim-control salt-addition tank of 50 cubic ft capacity are located in the reactor containment cell. All tanks are provided with vents to the reactor dome, gas connections to the helium pressurizing system, and several100 kw electric heaters for initial vessel heating and maintaining stored salt tempersture. addition tank is essentially in parallel with the 2 cubic ft salt-addition metering tank.
The
The drain tank is connected to the reactor vessel upper plenum and is installed with respect to the reactor dome liquid level so
that overfilling will not be possible. the tanks from the reactor. The reactivity control drain tanks must have, in addition to heating coils, decay heat removal facilities similar to the fuel salt drain tanks.
removal system which will be 1/20 the size of the fuel drain tank heat removal system. .
Freeze valves are used to isolate
They have an independent steam condenser and heat
4.7.3 Ehnergency Control
The BF3 addition system comprises pressure cylinders manifolded to a BF3 flow control and quick-acting injection valves are incorpo-- heater.
rated in the supply line connected to the bottom plenum of the reactor vessel. The flow control facility is operated from the shim control in- strumentation and the quick-acting injection system is operated from the scram" circuits. I1
The BF3 gas is stored in six 330 cubic ft, 2000 psi cylinders located The speci- outside and adjacent to the east wall of the reactor building.
fications for the reactivity-control drain tanks and the reactivity-control salt-addition tank are given in Section 4.10.

z
* c
c
59
4.8 Salt Handling Systems
4.8.1 Introduction
Facilities for handling both fresh and spent fuel salt and inter- mediate coolant salt constitute the heart of the MSCR complex. tions which must be performed include melting, purifying, charging, re- moval, storage, and sampling of the salt. These are accomplished by means of the following systems and facilities shown in Fig. 4.13.
The func-
a. b. C.
d. e.
f.
g* h. i.
3.
Fuel salt preparation Coolant salt preparation Reactor salt purification Coolant salt purification Reactor salt charging system UF4 addition facility Fuel salt drain and storage system Coolant salt drain system Spent fuel withdrawal system High level radioactive sampling
k. Coolant salt sampling
4.8.2 Fuel Salt Preparation
Fuel salt is received in solid form and must be liquified prior to processing. Barren salt, having the same composition as the intermediate coolant salt, i.e. , 66% LiF and 34% BeF2, with a liquidus temperature of 851'F is used for preoperational testing and system flushing before and after maintenance activity. A solid mixture having this composition is charged initially. Sufficient LiF and ThF4 are added to form composition 68% LiF, 23% BeF2 and 9% ThF4. All mixtures are processed through the same equipment. After routine operation is established, flush salt is the base material for the lithium/thorium addition process. ner, flush salt contaminated by fission products may be consumed and special treatment for removal of fission products will be unnecessary.
A 12-ft-highJ 150 cubic ft tank enclosed by an 8-ft-highJ 150 kw The furnace, located in the
In this man-
furnace receives solid salt for melting.

cn 0

61
f lush-sal t storage area, i s designed fo r melting approximately 7 f t3/hr .
Molten s a l t i s transferred by pressure siphoning.
Solid s a l t i s added by means of a tube extending from the f loor above
the storage area t o the melt tank.
sealed.
devious route and i s provided w i t h a helium purge t o prevent back-flow of
radioactive material and intolerable radiation levels a t the open feed
point. A check valve ju s t below the flange allows purge gas t o be di.-
rected in to the melt tank.
face t o receive s a l t from the shipping containers. the work area t o prevent the spread of toxic dust resul t ing from the feed operat ion.
The top of the tube is flanged and
A valve i s located j u s t below the flange. The tube takes a
A portable hopper i s connected t o the flange
A portable shed covers
4.8.3 Coolant S a l t Preparation
Equipment and system design are s i m i l a r t o tha t of fuel-sal t melt tank and so l id salt feed.
room near the chemical treatment tank. Solid salt i s fed from the f loor above.
The melt tank i s located i n the heat exchanger
4.8.4 Reactor S a l t Purification
The reactor f u e l and f lush s a l t s are purif ied i n the molten s t a t e
pr ior t o charging or storing.
and subsequently, t o remove oxides and other contaminants. In normal operation, a chemical treatment tank of 100 cubic f t cat
pacity located i n the f lush-sal t storage area receives the molten salt. After a one-day holdup f o r purification, the salt i s transferred t o s tor-
age tanks.
tank, f e r t i l e s a l t i s formed; t h i s is then transferred t o the f e r t i l e s a l t
puri f icat ion tank where gaseous HE’ and H2 are bubbled through the l iqu id
This i s done i n i t i a l l y t o remove oxides,
By the addition of LiF and ThF4 t o f lush s a l t i n the melt
t o remove oxides. Subsequently the t reated s a l t i s transferred t o the
100 cubic f t salt-storage tank ins ta l led a t tde same location. make-up is processed i n the same manner, and through the same equipment.
After treatment, it i s transferred t o a spare f lush-sa l t tank.
Flush-salt
For the i n i t i a l charges of f lush s a l t and f e r t i l e salt for the reac-
t o r system, greater purifying capacity i s required i n order t o avoid delay

62
i n preoperational tes t ing and power production.
t ion, HF' and H2 bubbling f a c i l i t i e s are provid6d i n the f e r t i l e salt s tor -
age tank and temporary flanged l i nes arranged so t ha t the f e r t i l e s a l t
tank may receive molten salt from the melt tank, perform p a r t i a l pur i f i -
To f u l f i l l th is condi-
cation and allow transfer of the salt t o the normal treatment tank. I n this manner the two tanks, f e r t i l e storage and chemical treatment, are
placed i n ser ies t o double both the purif icat ion r a t e and the system s a l t charging ra te . This procedure does not increase the sampling or analysis
requirements over those necessary for normal operation.
4.8.5 Coolant-Salt Purification
"he purpose of the coolant salt purification system i s t o remove
impurities such as corrosion products or oxides which could cause fouling
of surfaces and plugging of l i nes and tubes if allowed t o accumulate.. It is unlikely that a single coolant charge could be used fo r the
whole lifetime of the reactor without exceeding permissible concentrations
of oxides or corrosion products; however, it probably w i l l not be neces-'
sary to employ a continuous treatment of coolant salt. the coolant s a l t by accidental exposure t o air or water vapor, or from oxygen present as an impurity i n the cwer gas used t o pressurize ishe
coolant-salt systems.
by coolant salt i s low, the area of metal surface i n contact w i t h coolant
salt is very large, so that corrosion products are cer ta in t o accumulate.
When it becomes necessary t o repurify the coolant s a l t , it is done batch-
wise, one coolant c i r c u i t per batch, a t infrequent intervals during per i - '
ods of reactor shutdown.
Oxides may get in to
Although the r a t e of corrosion of INOR-8 surfaces
If the coolant salt should become contaminated w i t h f i s s ion products
or uranium as a r e s u l t of a leak i n the primary heat exchanger (an event
not l i k e l y t o occur because the coolant salt system i s kept a t a pressure higher than tha t of the f u e l salt) , the contaminated coolant s a l t is
drained from the affected c i r c u i t t o a drain tank, and then transferred t o the chemical processing plant f o r disposal.
n
5
c
J-. G €9
t

63
4.8.6 Reactor Salt Charging System
Fuel salt without uranium is injected into the primary reactor cir- cuit by manual control from a small salt addition tank to replenish the fuel salt withdrawn for chemical processing (two cubic ft per day). This addition is made remotely and with assurance that fuel salt will not flow back into the addition system. molten condition by gravity flow or under pressure. heating to maintain the salt in a molten condition prior to injection is provided .
The make-up is fed into the reactor in a Sufficient electrical
A two-cubic-ft salt addition tank (metering tank) is located on the wall of the biological shield at a level somewhat above the liquid level in the reactor. The tank is supplied from the fertile-salt storage tank situated in the flush salt storage area. ing the freeze valve and the vent valve between the tank and reactor dome. The freeze-valve in the line leading to the reackor dome must be placed at the bottom of a loop so that when the tank is empty a heel of salt will remain in the valve.
Makeup is accomplished by open-
4.8.7 Intermediate Coolant Charging System
Molten coolant salt is injected into any one of the eight intermedi-; ate coolant loops from the coolant drain tanks at a rate up to 600 ft3/hr. The drain lines from several locations in each of the eight intermediate codan t loops also serve as charging l ines for t h i s operation.
4.8.8 UFr, Addition Facility
During steady-state ope on at equilibrium, about 6 kg/day of vF4
ensate for burnup and a fuel withdrawal of addition of UF4 to the reactor is e requirements. Valves in the vF4
are added to the reactor to c of 2 ft3/day. The amount and governed by reactivity and tempe addition system must be kept gas-tight when closed even though they must pass solids when opened, but since law radiation level, plastic seats (for non-scoring properties) may be used.
hey will be in a region of relatively

. /-
64
W ' I The UF4 charged in to the reactor system i s prepared by mixing re -
cycled uranium w i t h fresh uranium. r ica ted by casting IJkb i n an i ne r t atmosphere, are charged in to a gas-
t i gh t shielded shipping container, containing an atmosphere of dry helium a t approximately 1 atmosphere absolute pressure. A t the reactor, the
shielded shipping container i s mounted on the f u e l charging machine (which i s located above the reactor) , and the mated assembly of the shipping con-
tainer and fue l charging machine i s made gas-tight by bolting a gasketed flange.
Pe l le t s about 0.75-in. i n diam, fab-
Figure 4.14 shows a schematic sketch of the UFI, addition f a c i l i t y .
4.8.9 Fuel S a l t Drain and Storage System
Fac i l i t i e s are provided fo r the drainage and storage of fue l salt during periods of maintenance and emergency shutdown.
on the flow diagram i n Fig. 4.2. tions; this includes the primary heat exchangers as weU as the reactor
vessel. emergency condition without steam flow and auxi l iary power, since without
heat removal the s a l t temperatures r i s e 300400°F i n the first half hour.
Four equally spaced 2-in. drain l i nes connected r ad ia l ly tQ the bottom
plenum of the reactor vessel, w i t h 1-in. interconnections t o the primary
heat exchangers drain connections, will drain the reactor system i n ap-
proximately one-half hour after the freeze valves are opened.
The system i s shown
A l l s a l t c i r cu i t s have drain connec-
The draining of the f i e 1 salt i s accomplished quickly, even under
The tanks are capable of receiving the f u l l inventory of the reactor
within half an hour, maintaining the stored Volume of salt at a tempera-
tu re of less than 1400°F, and recharging it t o the reactor.
and gas pressure are used fo r t ransferr ing salt.
- Gravity drain
- Because forced circulat ion may not be available under emergency con-
dit ions, natural convection cooling i s provided i n small-diam cyl indrical
vessels. Fifty-four ve r t i ca l ly mounted 35-in. ID cylinders 8 f t long are
located i n a loof t trench around the inside periphery of the reactor con-
tainment ce l l .
bonate bath. The carbonate mixture is contained i n a double-walled tank Each cylinder i s immersed i n a molten alkali metal car-
which serves as a boi ler for the removal of decay heat from the f u e l salt.
Fifteen-kilowatt e l ec t r i c heaters are arranged within the carbonate m i x - .- ip,
tu re annulus for fue l - sa l t mel4ing following long( storage periods and,: -f

65
ORNL- LR- DWG 75326
Shielded Shipping Container
UF4 Pellet Container
M Flange with Soft Metal Gasket
I cu.ft. Pellet Bln and Dispancer
Metering Cham bar UF, Pellet
Top of Reactor Shield Ma in tenance Valve
UF, Addition Pipe JV \c- Reactor Dome
- Gas Space Salt Level
Perforated U F4 Dissolver
Vent Opening
I f- &L @9'
Fig. 4.14. MSCR UFQ Addition Facility.
Tube

66
! - 1
i i c
W ' temperature maintenance during shorter periods.
bring the s a l t t o llOO°F i n four days.
4.8.10 Coolant S a l t Drain System
These drain tanks have several purposes:
space fo r the complete volume of coolant contained i n two (out O f e igh t )
coolant c i r cu i t s during periods when it i s necesswy t o drain the coolant from one c i r cu i t fo r maintenance; (b ) t o provide the reservoir and the
application of motive force fo r transferring coolant salt in to the reac-
t o r coolant c i rcui t6 during i n i t i a l salt-charging; and ( c ) t o serve as a t ransfer point from which coolant salt may be removed from the system and
transferred t o shipping containers in 'case it should become necessmy t o
process contaminated coolant salt.
The heaters are sized t o
( a ) t o provide storage
The drain tanks are located a t an elevation which permits the coolant salt t o flow by gravity from the reactor coolant system in to the drain
tanks. t o or *om any one of the 8 coolant c i r cu i t s .
large enough t o f i l l one coolant c i r cu i t i n one hour,:-using a gas pressure
of 50 psig.
4.8.11 Spent Fuel Withdrawal System
"he t ransfer l i nes m e valved with freeze-valves t o permit flow The t ransfer l i nes a re
Fuel s a l t i s drawn from the reactor vessel drain l i n e a t about 30 psia in to the vented metering tank. The metering tank i s a d d n . ( I D ) by 25-ft-long cyl indrical vessel located a t an elevation such tha t when flow
stops it contains two oubic f t of f u e l s a l t .
s a l t i n the tank lead t o the dome on the reactor vessel.
moval i s accomplished by radiation and convection t o the reactor contain-
ment c e l l atmosphere.
the r a t e of remwal i s controlled by means of an insulated jacket 4 in. thick surrounding the tank, and separated from it by a small a i r gap. A
temperature-actuated bellows opens the jacket t o allow excess heat t o be
radiated t o the room.
aids i n maintaining desired salt temperature when the tank is full .
Vent connections above the
Decay-heat r e -
Because the heat generation r a t e diminishes rapidly,
A 12-kw klec t r ic heater provides preheating and
After a 24-hr holdup, the salt i s released by gravity drain t o a
transfer tank. When a 10 f t3 batch of salt i s accumulated, the salt i s

67
transferred t o a shipping f lask, which i s placed i n a shielded cask and
shipped by ra i l t o a central. processing plant.
for about 120 days a t the processing plant, and i s then processed i n about
6 days.
Spent fue l i s accumulated
Should it be necessary or desirable t o hold spent f u e l a t the reactor
s i t e (Section 5.3.4), f ive 35 ft3 intermediate storage tanks are provided. Heat i s removed by boiling water i n steam jackets; the steam generated i s condensed i n water-cooled condensers.
4.8.12 High Level Radioactive Sa l t Sampler
The high l eve l radioactive s a l t sampler shown i n Fig. 4.15 i s used
t o obtain samples of fue l or f lush s a l t from several points such as the
reactor (via the f u e l withdrawal tank), the transfer tank i n the shipping
area, the fue l drain tanks, or the f lush-sal t chemical treatment tank, and
t o deliver these samples t o an adjoining hot c e l l fo r chemical analysis.
Sampling i s accomplished by means of access ducts located a t appro-
These are mounted ver t ica l ly with no pi tch l e s s than 50" They are . large enough t o allow the f ree passage of
pr ia te points.
from the horizontal.
the sample capsule, and axe equipped with a sample capsule cage a t the
sampling point t o l i m i t the depth i n the salt melt reached by the capsule
and prevent the end of the cable from dipping i n the s a l t .
The thief sampler principle i s employed wherein an open sample
capsule made i n the form of a thick-walled, round-bottomed bucket hanging on a f lex ib le cable i s lowered in to the salt-containing vessel. The cap-
sule sinks below the surface and i s f i l l e d with salt which so l id i f i e s when
the sample capsule i s withdrawn t o a cooler region above the sample point.
After sol idif icat ion, the capsule i s pulled up through the sampler access duct i n to the sampler cavity i n which i s located the cable drive mechanism.
Once i n the sampler cavity, the capsule i s positioned over a second duct
leading t o a hot analyt ical ce l l . The sample capsule i s lowered through
the second duct and deposit Using a suitable manipu- la tor , which i s par t of the hot c e l l equipment, the sample capsule i s de-
tached from the end of the cable, and a new sample capsule is attached.
The new sample capsule i s then pulled up in to the sampler cavity i n readi-
ness for another sampling operation.
'n the hot ce l l .

68
ORNL- LR - DWG 75325
Inner Containment
Outer Containment
Sampler Duct Port
Valve Drive Motor
Inner Containmeni
Sampler Duct Valve - Outer Containment
Sampler Duct Valve
Fig. 4.15. Radioactive Salt Sampler.

69
The sampler cavity is connected to the hot cell and to each of the four sample points by five separate sample access ducts. Each duct is made of 1 1/2-in. Sch. 40 pipe and contains two 1 1/2-in. double-disc gate valves. The bottom valve is closed only in the event the upper valve is remaved for repair or replacement
4.8 .13 Coolant Salt Sampling
Coolant salt sampling connections for a portable sampling device are provided on the eight coolant loops and the chemical treatment tank. ples are also drawn from the eight coolant-salt pump bowls and from the make-up salt chemical-treatment tank. A portable, single-sample holding device receives the sample in a manner similar to that of the high level radioactive salt sampler, transports the sample to the hot cell area, de- posits the sample capsule in the hot cell, and receives a fresh capsule from the hot cell. The connection between the portable sampler and cool- ant salt system is of a lock type, has a gas-tight fitting and operates in an inert atmosphere (possibly radioactive) from f u l l vacuum to 200 psia at 100°F.
Sam-
4.8.14 Freeze Valves
Freeze valves are used to close off all lines used for transferring salt f’rom one location to another. These valves are formed in any size of pipe up to 2 in. in dim by pinching the pipe to form a rectangular shaped flow passage. In a 2-in. pipe, the flattened section is about 0.5 in. thick and 2 in. long. Closure of the valve is accomplished by freez- ing salt inside the pipe. agailrst the top and bottom surfaces of the flattened portion. The air, supplied by a Rootes-Connersville blower, i s controlled to regulate the rate of freezing. Subsequent thawing of the salt plug is achieved in a few minutes by means of a Calrod electric heater (3000 watts for a 2-in. line) bent in a saddle-shaped series of turns conformal to the flat sec- tion. This heater is easily remaved for maintenance.
This is done by directing jets of cold air
70
4.9 Auxiliary Services and Equipment
4.9.1 Introduction
Auxiliary services necessary for the MSCR plant are as f;ollows:
a. b.
C*
de e, f.
65. h. i.
j- k. 1.
Helium cover gas supply and distribution Reagent gas supply and disposal Waste gas disposal Liquid waste disposal Coolant pump lubricating oil system Preheating system Auxiliary power supply Service water system Control and station air systems Cranes and hoists Instrumentation and control system Plant utilities
4.9.2 Helium Cover Gas Supply and Distribution System
The helium inert cover gas system serves a number af functions, viz: (a) as a pressurizing gas in various salt containing vessels for the transfer of salt from one place to another; (b) as a carrier gas for the removal of volatile fission products from the recycle gas purge system; ( c ) as an inert atmosphere to protect against contamination of the salt in places such as the UFq system, samplers, melt tank atmospheres, etc., which are occasionally opened to the atmosphere; (d) as a gas seal and bearing lubricant in molten salt pumps; (e) to provide the pressures re- quired in the fuel salt and coolant salt circuits to prwent pump cavita- tion, and to avoid leakage of fuel salt into the coolant salt in case of a leak in the primary heat exchangers; and (f) to pressurize leak-detec- tion devices at various flanged joints and disconnects.
Since the helium comes into contact with fuel salt or with inter- mediate coolant salt it must be free from oxide-containing impurities such as H20, SO2, etc; therefore, a purification system is necessary as shown in Fig. 4.16.
W The raw helium is supplied from a trailer having a capacity -

!4 0
, I
.-
a
'I
..
,
..'
of 39,000 s t d . cubic f t i n 30 cylinders a t 2406 ps i .
of 2400 s td . cubic f t i s supplied from twelve 200 s td . cubic ft cylinders.
A s shown i n the flow diagram duplicate l i nes of' helium purif icat ion un i t s
%re provided. Each has a capacity of 1 . 5 scfm.
An emergency supply
4.9.3 Reagent Gas Supply and Disposal System
A reagent mixture consisting of 8% anhydrous kjrdrogen f luoride and
20% hydrogen i s used t o remove oxide impurit ies from reactor and in t c r -
mediate coolant salts. Unreacted reagent gas Ray contain radioactive
material , and thus must be handled by both the gaseous and l iqu id waste
disposal sys t em.
The reagent gases a re supplied from high pressure cylinders provided
with pressure reducers and flow contr.01 instruments s o tha t the flow may
be adjusted (Fig. 4.16).
salt contained i n the f u e l - s d t and the coolant-salt chemical treatment
tanks. Unreacted reagent gas passes through a potassium hydroxide (KOH) scrubber t o remove HI?, and through a hydrogen burner t o remove hydrogen.
Sperit caust ic and condensate from the hydrogen burner may contain radio-
act ive mater ia l and thus must be sent t o the l i qu id waste disposal syszem
for concentration and ult imate shipment t o a remote disposal area. Non-
condensibles from t'ne hydrogen burner are cooled and vented from the sys-
tem through the gaseous waste disposal system.
The mixed reagent gas i s bubbled through molten
4 - 9.4 Waste Gas System
As mentioned previously, helium i s passed through the dome above the
core t o carry away xenon and other v o l a t i l e f i s s ion products.
t ion , pwge gas i s passed down around the shaf t s of the f u e l pumps t o
sweep away f i s s ion products diffusing toward the upper, oi l - lubricated
bearings. Also, there i s helium cover gas i n the bowls of the pmps, i n
the durlp tanks, i n the f u e l handling system, e tc . , and a11 of these must
be purged t o some extent.
sphere surrounding the reac tor s i t e , the off-gas from these various sys-
tems i s passed through charcoal beds t o t r ap the f i s s i o n products u n t i l
Yney have decayed, as shown i n Fig. 4.16. A few long-lived isotopes,
In addi-
I n order t o limit rad ioac t iv i ty i n the atmo-

73
particularly 85e, decay but little in the charcoal beds, and hence con- siderable dilution with air is required to limit the concentration of these in the stack discharge.
If the BF3 addition system is ever used to effect a "scram" of the reactor, it will be necessary to remove the BF3 from the reactor system before normal reactor operation can be restored. BF3 from the recycle helium stream to avoid saturating the off-gas ad- sorber as shown in the flow diagram (Fig. 4.16).
A stripped unit removes
4.9.5 Liquid Waste Disposal System
Liquid wastes originate in the drains and sumps of the various equip- ment cells. Typical sources are hot sinks in the analytical laboratory, cell drains in the shipping area where the shipping cask will be flushed with decontaminants, the contaminated equipment storage and decontaminak..: tion cell, and spent caustic solutions from the reagent-gas disposal sys- tem. cenkration, and storage of active wastes on-site. concentrated by evaporation and stored in underground tanks. Low-level wastes may be held in underground tanks or in a low-level activity pond until they have decayed sufficiently for discharge into the river. The capacity of this pond is approximately 25,000 cubic ft (nearly twice the volume of the contaminated equipment storage cell)
"he liquid waste system shown in Fig. 4.16 provides for holdup, con- High level wastes are
Intermediate wastes are sent to ten 10,000-gallon stainless steel retention tanks, which are used for>temporary storage until it is possible to send the waste to an evaporator for concentration.
High level wastes from the plant and from the evaporator are sent to a L0,OOO-gallon waste-storage tank which provides semi-permanent storage of these wastes, which will ultimately be transferred to shielded shipping containers for shipment to a permanent disposal area.
Spent caustic wastes from the reagent gas disposal system are sent to the intermediate-level storage tank for further concentration and ultimate disposal off-site.
Pumps (mechanical, air jet, or steam jet) are provided at every sump, at the pond, at the 10,000-gallon tanks, at the evaporator tank, and at the 1000-gallon tanks to transfer the liquids.

74
The waste evaporator is capable of evaporating 200 gallons of water per hour using the plant heating steam, The condenser drairrs eit3er to the retention tank or to the l o w level waste pond, depending on the ac- tivity. the charcoal beds.
A vent on the shell side allows noncondensibles to be vented to
4.9.6 Coolant Pump Lubricating Oil Systems
These systems supply oil to the bearings of eight pumps in the fuel circuits and to eight pumps in the intermediate coolant loops. groups of eight pumps each are supplied by two independent systems. lubricant is circulated under oxygen-free conditions, 120 gpm to each pump group. oil temperature rise of 20°F.
The two The
The systems are designed to 120°F supply with an expected
4.9.7 Preheating System
Prior to the admission of salt, all salt-containing piping and equip- ment must be preheated to 900°F.
several types of resistance heating. is heated by passing an alternating current throygh the piping itself.
This is accomplished by the use of '
In sizes up to about 2 in., piping
All pipes heated this way are electrically insulated. salt-cogtaining pipes are heated by hinged resistance heaters (2000 w/ft ) surrounding the pipe. heater assembly is used. heating units.
Larger diameter
For large pipes (above 10 in.) a three-section Piping fittings are covered by prefabricated
Heaters for pumps are field-fabricated. The reactor vessel and primary heat exchangers are heated by tubular
resistance heaters attached to the outer surfaces by means of clips on .welded studs.
4.9.8 Auxiliary Power
Auxiliary power is supplied at 4160 volts by a pair of auxiliary power transformers, type QA/FA, 24-4.16 kv with a maxim fan-cooled rating of 25 Mva. serves as a standby unit. rated at 150 horsepower or more, and the auxiliary power transformers
A reserve transformer, fed from the switchyard bus, The loads fed at 4160 volts include all motors

75
I I &cI,-.
*
required for station lighting, 480 volt auxiliaries, and the fuel melting and preheating system.
Smaller auxiliaries, of 30 horsepower or less, and those whose con- tinuous operation is not considered vital to station operation, are fed from motor control centers in the vicinity of the load. 120 volt transformers supply a 115 volt a-c control and instrumentation bus for each unit. 15 h a inverter motor-generator set which is driven by the unit 250-volt battery.
Two 15 kva 480-
An emergency supply to this bus is provided from a
4.9.9 Service Water System
The service water system supplies river water for cooling purposes throughout the plant, including the reactor auxiliaries and the turbine plant components.
Water is supplied by three 15,000 gpm, half-capacity, vertical cen- trifugal pumps. located in the circulating water intake structure. During normal opera- tiop two pumps supply the system with water at LOO psig, with the third pump employed as a standby.
Each pump is driven by a 1250-horsepower motor, and is
4.9.10 Control and Station Air Svstems
I
The compressed air system for the plant consists of separate, inter- connected air supplies for the station and for control purposes. station air system supplies hose valves far operating and maintenance re- quirements throughout the station. Control air is used primarily for in- strument transmitOers and air-operated valves. cross connected so that compressed air may be supplied to the control air system in event of a compressor failure.
The
The two air systems are
The control air system of the plant supplies air-operated control devices at a header pressure of 115 psia and is reduced to 55 psia and 45 psia for supply to various drive units and instrument transmitters.
4.9.11 Cranes and Hoists
dr A single traveling bridge crane serves the reactor and steam turbine buildings. Its lifting capacity is based on handling the rotor of the
. . .

76
low pressure steam turbine-generator, which weighs about 150 tons. bridge span is 130 ft, and the crane lift is sufficient to reach the low- est portion of the building. by rail may be handled by the crane. removal of all components within the reactor primary shield except the reactor.
The
All heavy equipment coming into the building Its capacity is sufficient to allow
i
4-.9.12 Instrumentation and Control
The requirements for instrumentation and control of the turbine sys- tems are similar to those of the turbine system in a conventional fossil- fuel power plant.
Instrumentation for the reactor system monitors the reactor neutron flux, primary system pressures, temperatures, levels, and.flow rates, Bnd provides control and alarm signals to actuate the appropriate device or to call for operator action when changes occur in the measured quantities, through either changes in load or malf'unction of system components.
Control and instrumentation panels are located in the control room, for convenience of reading, recording and operating the most important quantities and components. Other auxiliary control panels or isolated instruments may be located at appropriate places in the plant; area radia- tion monitors, alarm or warning signals, hydrogen and seal oil controls for the generators, etc.
4.9.13 Plant Utilities L
The plant utilities include those systems that are provided for-moni- toring plant equipment, disposing of nonradioactive wastes, safety of personnel, protection of equipment and for heating, ventilating and air- conditioning the plant buildings. from those provided for conventional plants.
-
These systems do not differ appreciably
f

77
4.10 MSCR Design Specifications
' The significant specifications for the MSCR equipment and materials
are listed in Tables 4.2 through 4.6. Table 4.2, heat-transfer equipment in Table 4 . 3 , pumps and circulators in Table 4 . 4 , miscellaneous equipment in Table 4.5, and materials in Table 4 . 6 .
The vessels are described in
.-A

mble 4.2. If?oR-8 Salt-Containing Vessels
Weight
l b gross, (each)
Design Design Heater Wall
in. ';? ~~~~~~ Diameter Height Capacity
Psi l b tare Unit s f t 3 in. in. (each uni t ) 'F
kw
1.
2.
3.
4.
5.
6.
7.
8.
9.
10.
ll.
12.
13
14.
15.
Reactor Vessel 1
Fuel Salt Draln 54 Tanks
Tank
Treatment Tank
Tank
Addition Metering Tank
Addition Metering Tank
Withdrawal Metering Tank
Control Drain Tanks
Storage Tanks
Transfer Tank
Tanks
Tank
Treatment Tank
Tanks
Ferti le Sal0 Melt 1
Fert i le Salt Chemical 1
Fert i le Salt Storage 1
Ferti le Sal t Small 1
Ferti le Sal t Iarge 1
fie1 Sal t Small 1
f ie l Sal t Reactivity 2
Fuel Salt Decay 5
f i e l Salt Withdrawal 1
Flush Sal t Storage 5
Coolant Sal t Melt 1
Coolant Salt Chemical 1
Coolant Sal t Drain 2
630 fuel
50
150
100
100
2
50
2
50
35
lo
650
150
50
750
241
35
42
36
36
12
36
4
36
30
30
96
42
42
43 *7
240
96
144
168
168
32
90
300
96
90
27
156
144
60
864
15
150
15
l2
1
lo
10
lo
3
150
150
8
X K )
U O i n l e t 100 in 1,100,OOO 1300 outlet 50 out
1300 100
1200 50
1300 100 25,000 8
1x)o 100 23,000 8
1300 50 5 o o g
lo00 100
1300 150
1300 100
1300 25 2350 g 290 t
1000 80
1200 50
1100 80 100,OOOg 10,000 t

0 4
C
Table 4.3. Heat Transfer Equipment
Fuel Salt Drain Tank Condensers
Primary Heat Steam Steam Loeffler Exchanger s Superheaters Reheaters Boilers
AEC Account Number 221.314 Design data
Number of units 8 Unit heat rate, Btu/hr Geometry Shell & U-Tube Number of tubes 2,025 Active area, ft2 6,643 Active length, ft 25 Length of longest tube, 28.8
Length of shortest tube, 23.7
Tube OD, in. 0.5 Tube-wall thickness, in. 0.035
1,066 x lo6
ft
ft
Lattice pitch, in. 0.625 Tube material fnm-8 Shell material fnm-8 Shell ID, in. 43.75 Shell thickness, in. 1.5
I"D, OF 173.7 Shell weight, lb 16,000 Tubing weight, lb 10,000 Design pressure
Heat transfer coefficient, 924 Btu
hr 6 f tz. OF Shell-side conditions
Fluid Fuel salt no. 2 Inlet temperature, OF 1,100 Outlet temperature, O F 1,300 Flow rate, ft3/sec 20.25 Pressure, psig 200 Pressure drop, psi 80 Volume, ft3 61.6
Tube-side conditions Fluid Int. cool. salt Inlet temperature, OF 950
Flowrate, lb/hr 31 Pressure, psig 350 Pressure drop, psi 84
Outlet temperature, OF 1,100
222 * 32
16
Shell & U-Tube 785 8,905 57.8 61.8
53.8
0.75 0.083
467 x 106
INOR-8 INOR-8 31.5 0.5 174.8 11,m
25,000
300
Int. cool. salt 1,100 950 13.7 300 15 150
Steam 670
1.28 x lo6 2,490 25
222.322 222.31 223.312
8 4 1 132 x lo6 Shell & U-Tube Cyl. Drums Shell & U-Tube 766 None 630 3,543 1,036 23.6 100 10
85 x lo6
0.75 0.065 1.00 INOR-8 INOR-8 31 0.5 187.5 4,500 9,620
119
Int. cool. salt 1,100 950 3.84 300 40 64
Steam 635 1,000 0.7 x lo6 440 20
0.625 0.065 1.5 Admiralty
Carbon steel Carbon steel 72 26 7 0.25
Steam 240 120 80,000 10
3,800
Steam 1.000 636 3.7 x 10⁶ 2,460
Water 'Water 80 545 150 636 1.2 x 10⁶ 110 2,450
5.2 x lo6
50

~ . . , . . . . . . . . . . . . . . . . . . . . . . .~ . _ , - . " .... i-l~. ~~ ~ . . . .
Table 4.4. Aunps and Circulators
bSCR Fuel Pump MSCR Coolant Pump
Steam Circulators
Number of units
Type Fluid pumped Service temperature Fluid density Fluid flow per pump Suction pressure (17 ft "SH) Discharge pressure (150 ft developed
Impeller OD head)
Suction ID Discharge ID
Over-all pump OD (Approx,) -
Over-all pump height-suction opening to
Pump motor rating Pump motor speed ( syncbonous ) Pump motor type
pump housing flange face (Approx.)
8 Centrifugal MSCR-2 fie1 salt 1300°F 190 lb/ft3 9075 gpm 22.5 psia 220 psia
25 in. 14 in. 12 in. 50 in. 50 in.
1600 hp, 4160 volt 900 rpm Totally enclosed,
-n
3 phase water cooled
8 Centrifu@l Constant salt 1100°F 120 n p t 3 13,900 130 psia 350 psia
25 in. 14 in. I2 in. 50 in. 50 ' in.
2000 hp, 4160 volt 900 rpm Totally enclosed, 3 phase water cooled
4
Axi a1 Steam 1000 "F
5.3 x. lo6 lb/hr 2430 psig 03
0 2490 psig
,

81
Table 4.5. Miscellaneous Equipment
Thermal shield Dimensions, ft Material
1.5 x 24 x 24
Shield 2 in. plate carbon steel Headers 20 in. x 4 in. carbon steel
Weight, lb gross (water filled) Inlet/outlet pipe Heat removal rate, lo6 Btu/hr
(1/2 in. wall thickness) 250,000 8 in. Sch. 20 qarbon steel 18
Water flow, gpm Water temperature/pressure, "F/ps ig
Shield cooling system Heat load, Mwt Demineralized water circuit
Maximum temperature, OF Minimum temperature, O F
Flow rate, gpm Service water conditions
Maximum temperature, O F
Minimum temperature, O F
Flow rate, gpm
Cell-air cooling system Heat load, Mwt Demineralized water circuit
Maximum temperature, O F
Minimum temperature, OF Flow rate, gprn
Service water conditions Maximum temperature, OF Minimum temperature, OF Flow rate, gpm
2000
90-110/15
37.5
180 125
4650
125
75
5120
5
110
95
2275
95
75
1700

82
Table 4.5 (continued)
High level radioactive salt sampler Sa'mpler cavity linner containment vessel Dimensions Material and thickness De sign temperature/ pr e s sure
Sampler cavity shielding Material; thickness
Approximate weight Sampler cavity outer containment vessel Dimensions Material and thickness Design temper atur e/pr es sure
Sampler ducts Design pressure De sign temperature Size Mater i a1
Sampler duct valves De sign pres sure/ temperature Number required
m e
Cable drive unit Service environment
-. w
0 1
= I
5 ft 4 in. ID x 6 ft high 3oC, stainless steel, 1/8 in. 125"F/+15 psig
Lead; 1 ft thick all around sides
57 tons an8 top
7 ft 8 in. ID x 8 ft high Carbon steel, X/4 in. thick 125OF/15 psig
100 psig 200°F 11/2 in. Sch. 40 pipe Inconel
100 psig/l25"F 10 1 1/2 in. Vulcan bellows stem double-disc motar-operated gate valve (supplied by Hoke Valve co. )
Drive unit will operate in an inert but radioactive atmosphere at nprmal temperature. Radia- tion level will be high only during sampling operation. The cable must be capable of operation at temperatures in the range 100 to 1300°F.
n.
w
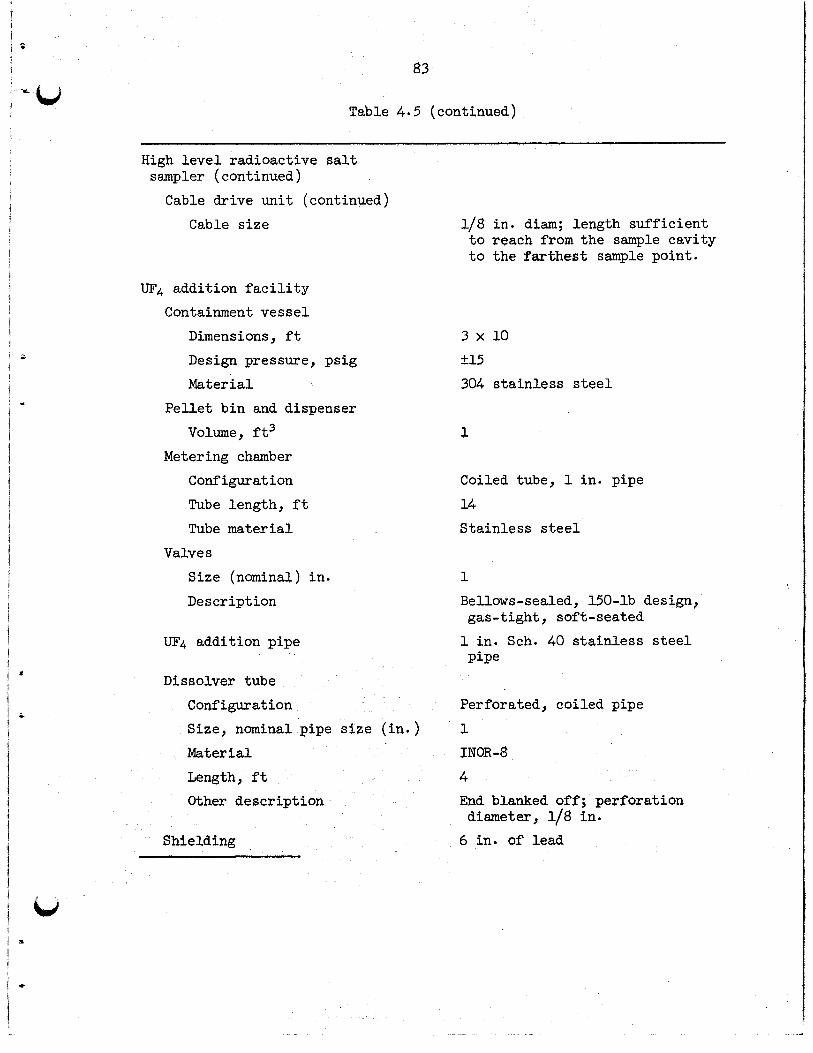
83
Table 4.5 (continued)
High level radioactive salt sampler (continued) Cable drive unit (continued)
Cable size
UF4 addition facility Containment vessel
Dimensions, ft Design pressure, psig Material
Pellet bin and dispenser Volume, ft3
Metering chamber Configuration Tube length, ft Tube material
Valves Size (nominal) in. Description
UF4 addition pipe
1/8 in. dim; length sufficient to reach from the sample cavity to the farthest sample point.
3 x 10 +15
304 stainless steel
1
Coiled tube, 1 in. pipe 14 Stainless steel
1 Bellows-sealed, 150-lb design,
1 in. Sch. 40 stainless steel gas-tight, soft-seated
Pipe Dissolver tube ~
Configuration Perforated, coiled pipe Size, nominal pipe size (in.)
Length, ft 4
1 Material INOR-8
Other description End blanked off; perforation diameter, 1/8 in.
Shielding 6 in. of lead

84
Table 4.5 (continued)
Reagent gas disposal system data
Hydrogen supply Cylinder s ta t ion capacity,
standard cubic f t
Flow ra te , scfm
Hydrogen fluoride supply
standard cubic f t Cylinder s ta t ion capacity,
Flow ra te , scfm
KOH scrubber fo r HI? disposal
WF f l o w r a t e (max), scfm
Cooling requirement, Btu/hr Cooling w a t e r flow rate, gpm
KOH solution feed ra te ,
Flaw r a t e of unreacted
Length and diameter, f t Material of construction
Wall thickness, in.
l i t e r s/min ( m a x )
hydrogen, scfm
KOH supply tank
Dimensions
Material
Chemical feed pump
Mixer
Hydrogen burner
per hour Design f l o w ra te , lb-moles H2
Heat load, B/hr
Cooling water f law, gpm
Design a i r flow ra te , cfm
Dimensions
Material
(max)
3000
2
12,000
8
8 118,000 10
1
2
8 and 2.8
Monel
1/4
4 f t dim, 8 f t high
Carbgn s t e e l
0-1 liter/min
2 hP
1/3
41,000
4
10
1 f t dim x 4t f t high
Carbon s teel

85
Table 4.5 (continued)
Reagent gas disposal system data
Hydrogen burner condenser (continued)
Heat load, B/hr
Cooling water flow, gpm Exit gas flow r a t e (nitrogen plus unburned oxygen), scfm
Design temperature of ex i t gas, O F
Surface area of tubing, f t 2
Shel l material
Tubing material
Configuration
Condensate r a t e , l b H2O per hr
COver gas purif icat ion system
Helium dryer Dessicant used
Amount, l b
Length/diameter , f t / i n .
Pressure rat ing, psig Container material
Helium heater ( e l ec t r i c ) Design temperature gas ex i t ,
Helium flow rate, scfm Desige pressure, psig
Heater ra t ing (e lec t r ic ) , kw
"F
Oxygen removal unit Resign flow ra t e , scfm
Container size, length/diam-
Active ingredient
e t e r , in./in. (overall)
20,000 .
9,
4
100
100
Carbon s t e e l
Admiralty
Shell-and-tube, single pass,
6
s t ra ight tube
Molecular sieve
10
2.5/4
300 Caxbon s t e e l
1200
1.5
300 1
1.5 26/6 Sch. 40
Titanium sponge

. , Table
$6
4.5 (continued)
Cover gas purification system ( continued )
Oxygen removal uni t (coptinued)
Design pressure/ temperature, psig/"F
Helium cooler
4 in. finned tube w i t h flanges
Inlet /out le t temperature, "F Helium f l o w ra te , scfm
Treater helium surge tank
Tank volume, f t3
3(30/1200
4 f t long
l200/2QQ 1.5
Design pressure/temperature psig/"F
Material
Lube o i l system Number of systems
Design lube o i l flow, gpm
Design lube o i l temperature,
Design cooling water tempera-
Design cooling water pressure,
Design cooling water flow, gpm
Number of lube o i l pumps
Type .-. .- -
Lube o i l pumps head, f t
OF (in/out)
ture , O F (in/out>
Psig
Flow, QFan
Motor, hp
Reservoir, number 2
ID, f t (cyl indrical)
Height, f t
Capacity, gal.
Wall thickness, in.
60 3 0 0 / l O O
Carbon s t e e l
2 120 140/120
75/100
25
45 2 Rot 150 300 20 1 5 5
600
0.25
t
L

87
Table 4.5 (continued)
Lube oil system (continued) Reservoir, number 2 (continued)
Mater i a1 Carbon steel Weight (full), lb 3000
Cooler, number 2 TYPe 2 pass shell, 4 pass tube Tube material Inconel Shell material Carbon steel Overall heat transfer 20 coefficient , Btu/hr*ft2 - O F
Tube surface area, ft2 735
Tube size, OD, in. 518 Tube wall thickness, in. 0.125 Tube pitch (triangular) 0.938
Shell diameter, ID, in. 18 Shell length, ft 34 Tube design pressure, pig 25 Tube design temperature, OF 100 Shell design pressure, psig 45

88
Table 4.6. Material Specifications
Properties Assumed for MSCR Graphite
Items and Units
Density, g/cc Thermal conductivity, Btu/hr '
At 68'F and with grain At 68°F and across grain At 1200"F, isotropic, after
ft' "F
irradiation Coefficient of thermal ex- pansion, across grain, per OF At 68°F At 1200°F, after irradia- tion
Maximum allowable strain, in ./in. Porosity
Accessible to salt at 150
Accessible to gas psi
Poisson's ratio Young' s modulus
With grain Across grain
Helium permeability at 3OoC,
Diffusivity of xenon at 1200*F,
Specific heat Btu/lb* "F
cm2 / s ec
cm2/ s ec
80 45
15
1.7 X 10" 3 x 10⁻⁶
0.001
0.001
0.01 0.4
0.005
3 Y lo6 1.25 x lo6 1.5 x 1Q6
10'6
0.33
MSCR %RE*
1.9 1.9
WSRE values are given for comparison and were mostly taken from reference (12).

89
Tsble 4.6 (continued)
Assumed Properties of MSCR Fuel-Salt Mixture at 1200°F
Mixture No. 1 2 3
Composition Mole 4 LiF-BeFz-ThFk 71-16-13 68-23-9 66-29-5 Wt $I LiF-BeF2 -ThF4 29-11-60 32-19-49 38-29-33
Liquidus temperature, OF 941 887 860
Molecular weight 66 03 56.2 46.2
Density, lb/ft3 215 6 190.1 163.0
Viscosity, lb/ft*hr 24.2 21.0 18.9
Thermal conductivity, 2.67 2.91 3.10
Heat capacity, Btu/lb* OF 0.318 0.383 0.449 Btu/hr f t 9 O F
Assumed Properties of MSCR Intermediate Coolant Salt Mixture at 1062'F*
Composition Mole '$ LiF-BeF2 Wt 46 LiF-BeF2
Liquidus temperature, OF Molecular weight Density, lb/ft3 Viscosity, lb/ft*hr Thermal conductivity, Btu/hr.ft* "F Heat capacity, Btu/lb* O F
66-34 52-48 851 33.14
120.5
20.0
3.5
0.526
*Reference ( 12 ) of the Bibliography.
Properties of INOR-8* wt $J
Chemical composition Nickel, min 66-71 (balance ) Molybdenum 15-18
*Reference ( 1 2 ) of the Bibliography.

90
!
' i
Table 4.6 (continued)
Properties of INOR-8 (continuedl
Chemical composition (continued)
Chromium Iron, max
Manganese, max Silicon, max Carbon Miscellaneous, max
Wt '$ (continued)
- i
6-8
5 1
1 0.04-0.08
2
Physical Properties at 1200°F
Density, g/cc Melting point, OF
8.79 247&2 5 5 5
Thermal conductivity, Btu/hr*ft. OF 11.7
Young's modulus, psi at 1300°F Specific heat, Btu/lb. OF at 1200°F
Coefficient of thermal expansion,
Maximum allowable stress, psi at
Maximum allowable stress, psi at
at 1200°F 25 X lo6 0.1385
7.8 X
6000
3500
1/"F at 1200°F
1200°F
I30O0F

91
5. FUEL PROCESSING
5.1 Reprocessing System
Fluorination of spent fue l from t h e MSCR t o recover isotopes of ura-
nium, followed by discard of the ca r r i e r sa l t (cantaining LiF, BeF2, ThF4,
and f i ss ion product f luorides), was selected as the method of processing
for several reasons: future integration with the reactor plant (sharing shielding and mainte-
nance facil i t ies and personnel) with appreciable potent ia l reductions i n
fue l cycle cost (Sec. 6.9); (b) the necessity fo r holding the spent fue l
fo r decay of radioact ivi ty is eliminated; ( c ) no development is required;
the plant may be designed and costed on the basis of current technology.
(a) The fluorination process is w e l l adapted fo r
In order t o use the next most applicable process, Thorex, it would be
necessary t o develop special head-end and tail-end s teps fo r converting
spent f u e l from the fluoride t o the n i t r a t e and back again.
be necessary t o hold the spent fue l pr ior t o processing fo r not less than 120 days (to average the equivalent of 90 days of cooling).
is some uncertainty concerning the effect of f luoride ion on the chemistry of the aqueous separations.
ered, and perhaps also the carrier salt could be recovered free from con- tamination with rare ear th isotopes.
with the isotopes Cd, Sr, Ag, C s , Se, Ba, and Te.
Also it would
Further, there
On the other hand, the thorium could be recov-
1% would, however, be contaminated
The processing costs fo r the MSCR f u e l have been estimated fo r both
processes.
5.2
3 A central plant capable of processing about 30 f t of f u e l sa l t per
day (1 tonne Th/day) was selected €or costing,
servicing about 20 referenc
20,000 Mwe.
This plant is capable of
esign MSCR's having a t o t a l capabili ty of
Component design plant layout, and associated costs for the plant
described herein were adapted from a design and cost study of an on-site
plant prepared by Carter, Milford, and Stockdale in a pr ior study (21).
92
Due allowance fo r fue l transport t o a cent ra l location was made, together with other adjustments for difference i n capacit ies, elimination of prot-
actinium recycle, etc.
5.2.1 Process Design
The s teps of the proposed fluorination process are indicated i n
Fig, 5.1. fluorination storage by applying gas pressure o r by siphoning.
is then introduced batch-wise in to the f luorinators where it is treated
with elemental f luorine, possibly diluted with some i n e r t gas, a t about
1000°F. The eff luent UF6 is absorbed i n beds of NaF a t 2OO0F, is la ter desorbed a t 7OOOF and collected i n cold t raps at -4SoF,
cold t raps are warmed, and the decontaminated UF6 is collected i n cylinders.
thorium or any of the components of the carrier salt .
Spent fue l is transferred from the shipping containers t o pre- The fue l
Periodically the
The fluoride v o l a t i l i t y process does not provide fo r recovering Consequently, after
fluorination the LiF-BeF2-ThF4-FP m e l t is drained in to interim waste s tor-
age, and later transferred t o permanent waste storage such as, f o r example,
i n a sa l t mine. The interim storage period has been taken t o be 1100 days, a value corresponding t o the most favorable economic balance between on-
s i te and permanent storage charges for t h i s par t icular process.
It w i l l be observed t h a t 233Pa is not recovered i n t h i s process. An analysis of Pa recovery versus discard disclosed tha t additional process
equipment and building space requirements made the recovery of Pa
uneconomical.
A major problem i n the design of vessels which contain i r radiated sal t is t h a t of heat removal.
temperature of the heat source is considerably greater than t h a t of con-
ventional heat sinks (such as cooling water from r ive r s or wells). design evolved, heat is transferred across an a i r gap in to water, principal heat t ransfer mechanism is radiation; convection accounts f o r
perhaps 5 t o 10 per cent of the t ransfer . This arrangement, i n addition
t o controll ing the heat t ransfer rate a t tolerable levels , provides iso-
la t ion of the coolant from the molten sa l t so t h a t a leak of e i the r stream
through i ts containment wall does not contaminate the other stream.
Volumetric heat release rates are high, and the
In the
The

i! UF. Recycle to
Reactor d
ORNL-LR NO. 74670
i I I I I I I I I I
I I f
4 I b I I I
Fig. 5.1. MSCR Fluoride Volatility Fuel Processing Plant.
c

94
! i
- 1
fl
W - b The fluorinators are cooled by circulat ing air through the cell,
the case of the prefluorination storage tanks , radiation from storage
vessels t o a concentric tank i n a water bath provides suf f ic ien t cooling
fo r 5-day-old fue l sa l t ,
In
Wherever possible, the equipment was patterned after tha t used i n the
O W L Volat i l i ty P i lo t Plant described by Milford (661, Carr (181, Cathers e t a l , (22, 23).
5.2.2 Shipping
Shipment of i r radiated fue l is made i n a lead shielded carrier shown in Fig, S 0 2 ,
able t o absorb decay heat radiated from the sal t container and t o diss ipate
t h i s heat t o the atmosphere v ia finned tube exchangers fastened t o the out- s ide of the cask.
inside jacket followed by condensation i n the outside exchanger, or by
natural convection.
The cask is equipped with a water-cooling system which is
Heat t ransfer may be e i the r by boiling the water i n the
The shipping container (a lso used for waste disposal) , is designed t o hold %lo f t s a l t which is about s i x days accumulation a t the reactor dis-
charge rate of 1.67 ft /day. For t h i s design it has been assumed t h a t the
processing plant is located 500 miles from the reactor s i t e and t h a t ship-
ment w i l l be made by ra i l . is anticipated t o t a k e 10 days.
is approximately 5 days.
3
3
The round t r i p , including f i l l i n g and emptying,
The average age of spent f u e l a t shipment
5.2.3 Prefluorination Storage Tanks
3 One hundred and s ix ty 30 f t tanks receive up t o 120 days supply of When a 120-day batch spent fue l from each of a number of reactor sites.
is completed, the tanks are removed from t h e i r cooling jackets t o the t ransfer area where the material is transferred t o 6-ft
tanks,
i n e r t gas pressure t o the fluorinators,
3 metering t ransfer
From these tanks the spent f u e l can be transferred by gravity or
The cooling jackets for the prefluorination storage tanks are s ta in-
less steel tanks 2,2 f t i n diameter by 1 2 f t high immersed i n a water bath,
Cooling is achieved principally by radiation from the storage tank t o the
*
a
-
h
w -
c

95
i
ORNL-DWG. 65-7911
X
Lead Shielding (14.5 th ick) J
I
Finned Tube Condenser or Heat Exchanger
S a l t 1 Jacket for H20 Container Circulation
Fig. 5.2. I r radiated Fuel Shipping Cask.
t

96
jacket,
water. should heating be required,
The t ransfer tanks are equipped with jackets cooled by circulat ing
Electric heaters provide preheating pr ior t o t ransfer operations,
5.2.4 Fluorinator
The design shown i n Fig. 5,3 has been successfully operated i n the ORNL Fluoride Vo l i t i l i t y P i lo t Plant (18).
chamber is a de-entrainment section, The lower chamber is surrounded by an electrically-heated furnace while the upper is heated with electrical s t r i p
heaters.
corrosion rate is about 1 m i l per hour of fluorination time; hence the
fluorinator must be inexpensive and accessible f o r frequent replacement, It w a s designed t o diss ipate decay heat and heat of reaction t o the atmos-
phere i n the cell through a w a l l 1/2 in. thick a t a temperature of 9 O O O F .
The preferred materials of construction are e i the r INOR-8 or Alloy 79-4 (70 per cent N i , 4 per cent Mo, 17 per cent Fe), L-Nickel has been used
f o r f luorinator construction but is susceptible t o intergranular attack. Spent fuel is fluorinated batchwise a t about 1000°Fo
6 hours t o vo la t i l i ze the uranium (99.9+%) from a 6 f t3 batch, pract ice the attack of fluorine on the vessel is severe,
corrosion is believed t o r e su l t f r o m the combined action of l iqu id salt
Surmounting the fluorination
Five uni t s are required, each having a capacity of 6 ft3. The
It takes about
In current
The high rate of
and gaseous fluorine phases.
under investigation.
nator (35) wherein a layer of so l id salt is maintained on the vessel wall by proper control of the cooling, and t h i s layer protects the w a l l . Another approach consists of spraying the molten salt i n t o a re la t ive ly
cool atmosphere of fluorine.
removed from the microdroplets which then cool and freeze before they s t r i k e the w a l l .
l iquid phase i n contact with the w a l l .
However, several l i n e s of improvement are
These include the use of the "frozen wall" f luori-
Uranium hexafluoride is formed i n and rapidly
Not only are the w a l l temperatures lower, but there is no
The fluorides of some f i ss ion products, notably Mo, Zr, Nb, Cs, Ru,
These are separated from the
It is not ex- and Te are vola t i le and accompany the UF6.
uranium i n the CRP t r ap and NaF absorber described below.
pected t h a t the fluoride of Pa w i l l be vo la t i l e under conditions specified,

97
ORNL-LR-DWG 39150-R2
FURNACE LINER - TREPANNED SECTION
(4-in. OD)
DRAFT TUBE-
S
THERMOCOUPLE WELL
-FLUORINATION CHAMBER (16-in. OD )
WE INLET
.. . . _ I _ .

98
Protactinium w i l l remain i n the barren salt and be l o s t t o waste. The loss
amounts t o about 10 g/day i n the reference design reactor, and studies have
shown tha t it is not economical t o recycle the barren salt t o the f luori-
nators after holding it t o allow the Pa t o decay, additional f luorinator capacity and interim storage vessels more than off-
sets the value of the 233U recovered,
5.2.5
The cost increase of
CRP Trap and NaF Absorbers
After leaving the fluorinator, UF6 and accompanying f i ss ion product
f luorides pass in to a two-zoned NaF absorption system. the complexible radioactive products (CRP) t r a p is operated at about 400OC
ana removes fluorides of chromium, zirconium, niobium, cesium, stroxtium, and rare earths, as w e l l as entrained sa l t par t ic les . Uranium hexafluoride
is not absorbed here, but is absorbed i n the second zone operated a t 100°C,
along with the fluorides of molybdenum and ruthenium, and traces of others.
Some ruthenium carries through in to the fluorine recirculat ion system.
It is
The first, called I
Uranium is recovered from the beds by desorption a t 4o0°c0
collected i n cold t raps described below,
The stationary bed absorber, shown i n Fig. 5,4, contains j u s t over
Each is mounted i n a one cubic foot of NaF. lightweight, low-heat capacity electric furnace which opens on hinges for removal of the absorber. A cooling-heating tube 2-1/2 inches OD carrying
coolant and containing electric heaters extends through the center of the bed.
U-shaped path through the bed,
Six unites are required.
An i n t e r io r cyl indrical baf f le forces the process stream t o follow a
Design l imitat ions arise i n the rate at which the bed temperature can
be cycled and the bed thickness,
insulator and m u s t be made i n th in sections t o faci l i ta te heating and cool-
ing.
The granular bed is a r a the r effect ive
The absorbers therefore have large length-diameter r a t i o s , When the bed becomes saturated with f i ss ion products, the absorber is
removed from the furnace, emptied, and recharged remotely i n a 4-5 day
cycle .
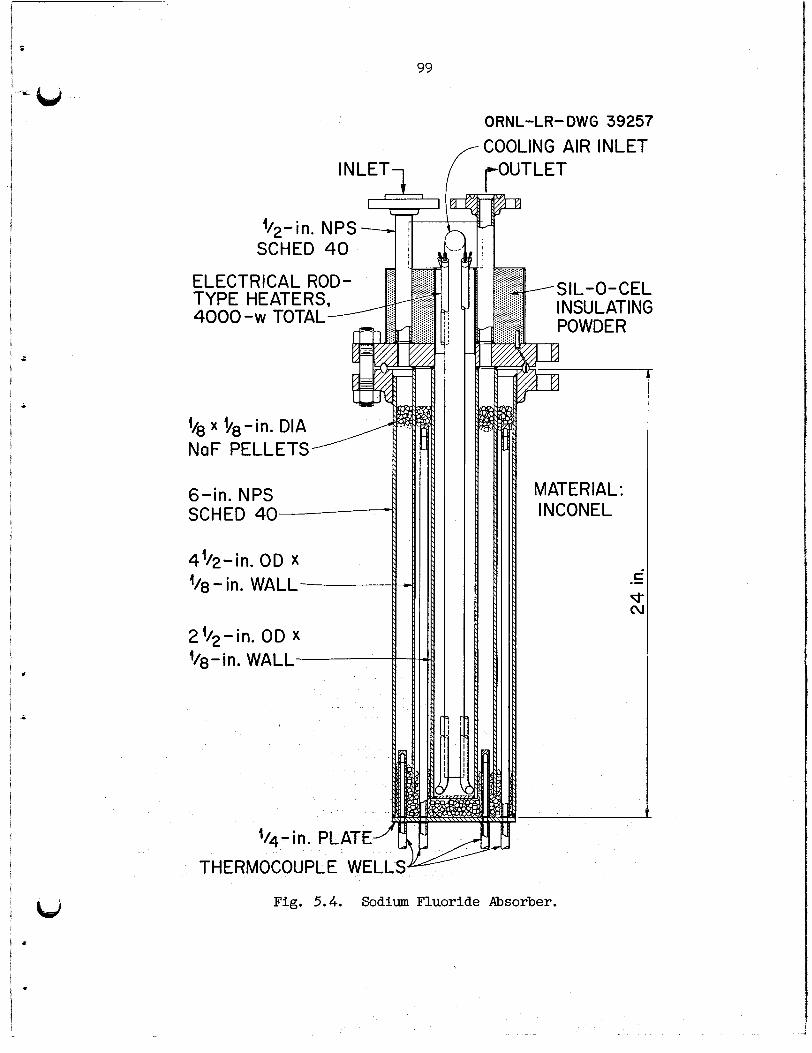
99
I"% L
!/,-in. NPS- SCHED 40
ELECTRICAL ROD- TYPE HEATERS, 4000 -W TOTAL
/ $8 x 98-h. DIA NaF PELLETS
6-in. NPS SCHED 40-
2'/2-in. OD x '4-in. WALL
'1'4 - in. PLATE'
.
THERMOCOUPLE WELLS
ORNL-LR- DWG 39257 COOLING AIR INLET rOUTLET
SIL-0-CEL INSULATING POWDER
MAT E R I A L : INCONEL
Fig. 5.4. Sodium Fluoride Absorber.

100
5,2.6 Cold Traps
These are similar t o those used i n the ORNL Fluoride Volat i l i ty P i lo t
Plant as shown i n Fig, 5 , 5 .
is operated at about -4OOC and the second a t -60°C,
Two t raps are mounted i n series, The first
Adequate surface f o r rapid transfer of heat and collection of so l id
The components must have small thermal i n e r t i a so UF must be provided.
t ha t the temperature may be changed quickly, During . .. defrosting, the t raps are heated t o 90°C at 46 psia t o allow UF t o m e l t and drain t o collection
cylinders.
6
6
5,2.7 Reduction Reactor
The reduction of UF6 t o UF4 is accomplished i n a reactor patterned
Uranium hexafluoride and flourine are mixed w i t h excess H
after tha t described by Murray (70) and consists of a 4-in. d i m by 10-ft high column.
a nozzle a t the top of the reaction chamber.
H -F - 2 2 i n molten sa l t of sui table composition,
through a fi l ter .
Losses are very low and typical ly are less than 0.1 per cent.
i n
The uranium is reduced i n the 2
flame, and falls t o the bottom of the chamber where it is collected
Gaseous materials are discharged
The reactor has a capacity of 10-15 kg of UF6 per hour.
5.2.8 Transfer Tanks
Stripped fuel is drained f r o m the fluorinators i n to t ransfer tanks
(two each) from whence it is dis t r ibuted t o interim waste storage tanks,
The t ransfer tanks have capacit ies of 60 ft3,
the surface of the tank through a 1/2 in. a i r gap t o a water-cooled jacket. While being held i n the t ransfer tanks, the salt is t reated with He or other i n e r t gas t o remove traces of F2 of HF t ha t would increase corrosion
i n the waste storage tanks.
Decay heat is radiated from
502.9 Waste Storage Tanks
Waste sa l t is stored i n s t a in l e s s steel shipping cylinders 2 f t i n
diam by 8 ft long. 2,75 f t i n diam and f i f t een feet long which d ip in to a water-filled
canal.
These are placed a t the bottom of steel thimbles
Heat is dissipated by radiation and convection across the 4-inch
, i
- i
w-t

INLE
101
ORNL-LR-WG 1909t
- FILTER 1.- CARTRIDGES
ERANT TUBES (4)
12 0 12 24 - - - SCAM IN INCHES
PRIMARY COLD TRAP
Fig. 5.5. Primary Cold Traps.

102
a i r gap, through the thimble wall and in to the water. tanks are shipped t o a sal t mine fo r permanent storage,
After cooling, the
5.2.10 Freeze Valves
Conventional valves cannot be used with molten salts. Flow stoppage
is achieved by freezing a plug of sa l t i n a section of a l i n e with a je t of cooling air . desired.
Electric heaters are used t o thaw the plug when flow is A freeze valve for the MSRE is shown i n Fig, 5.6.
5 2 11 Samplers
The apparatus pictured i n Fig. 5,7 is being tes ted for use with the
MSRE (12). Essential features are the hois t and capsule fo r removing the
sample from the vessel; a lead-shielded cubicle with manipulator, heating elements and service piping, and a transport cask for removing the sample
f r o m the process area. g i ca l shield i n an accessible area.
The sampling cubicle is mounted on the cell biolo-
5,2,12 Biological Shield
Calculations were made using the Phoebe program f o r the IBM 704 com- puter, I n the study by Carter, Milford, and Stockdale (211, on which the
present estimate is based, spent f u e l was brought t o the processing plant
immediately after removal f r o m the reactor, and the shield was accordingly made qui te thick. In the present instance, the f u e l is cooled a t the pro-
cessing plant fo r not less than 90 days so t ha t the shielding requirements are not as extreme. general u t i l i t y , no reduction i n shield thickness was made.
However, i n order t ha t the central plant have more
5.2,13 Process Equipment Layout
Process equipment is l a i d out according t o the major process opera-
t ions: prefluorination storage, f luorination, t ransfer , NaF absorption, cold t raps and product collection, UF6 + UF,, reduction, and interim waste
storage, an arrangement tha t minimizes distances between vessels, Three t ransfers
of molten s a l t are required i n the processing sequence,
Equipment is grouped i n cells according t o ac t iv i ty l eve l and in
G - - -

103

f i
- i I i
Fig. 5.7. Radioactive Material Sampler. u- s
-

105
Inter im waste s torage vesse ls are loca ted ad jacent t o t h e processing
area i n a l a r g e canal. To facil i tate remote maintenance, ves se l s are arranged so t h a t a l l
equipment i s access ib l e from above, and a l l process and se rv ice l i n e s can be connected remotely.
maintenance considerat ions r a t h e r than by a c t u a l ves se l s i z e ,
Over-all bu i ld ing space i s d i c t a t e d by remote
5,2,14 P lan t Layout
I n order t o e s t a b l i s h uniformity i n c o s t es t imat ion of nuc lear power
p l a n t s , t h e Atomic Energy Commission has spec i f i ed c e r t a i n ground r u l e s
(52) covering topography, meteorology, climatology, geology, a v a i l a b i l i t y
of labor , accounting procedwes, f i xed charge r a t e s , etc.
r u l e s were used i n t h i s s tudy,
These ground
Advantage was taken of a design study and opera t ing experience with a
remotely maintained r ad ioac t ive chemical p l an t reported by Farrow (32) t o ob ta in over -a l l p l an t arrangements, as shown i n Fig, 5.8,
The hypothe t ica l s i t e loca t ion is 500 miles from t h e r e a c t o r s i te ,
The p l a n t is loca ted on a stream t h a t i s navigable by boa ts having up t o
6-f t d r a f t ,
l oca t ed on l e v e l t e r ra in i n a grass-covered f i e l d . 8 f t deep with bedrock below.
There is convenient highway and r a i l r o a d access. The p l an t is
The e a r t h overburden is
5,2,15 Capital Cost Estimate
The cos t of t h e f u e l processing p l an t was apportioned among t h r e e
p r i n c i p a l ca tegor ies :
i a r y process equipment and se rv ices cos ts .
such items as s i te preparat ion, s t r u c t u r a l materials and labor , permanently
i n s t a l l e d equipment, and mater ia l and l abor f o r s e rv i ce fac i l i t i es ,
ess equipment c o s t s were ca lcu la ted f o r those tanks, ves se l s , furnaces , and
similar items whose primary funct ion is d i r e c t l y concerned with process
operat ions, t i e s , process piping and process instrumentat ion which are in t imate ly asso-
c i a t e d with process operat ions.
bu i ld ing c o s t s , process equipment c o s t s , and auxi l -
The bui ld ing c o s t s included
Proc-
Process se rv i ce f a c i l i t i e s are items such as sampling f a c i l i -

m m
r
*-
I I

107
h) E
Accounting Procedure, -The accounting procedure set for th in the
Guide t o Nuclear Power Cost Evaluation (52) was used as a guide in t h i s
estimate,
plants, and the accounting breakdown is not specif ic for a chemical proc-
essing plant, were augmented.
This handbook was writ ten as a guide fo r cost-estimating reactor
Where necessary the accounting procedures of the handbook
Process Equipment. - A large number of process vessels and auxiliary
equipment i n these plants is similar t o equipment previously purchased by
ORNL fo r the fluoride v o l a t i l i t y p i lo t plant fo r which cost records are available,
fabrication and over-all equipment costs. t o extrapolate the data t o obtain costs f o r larger vesselso
were estimated i n t h i s manner include the fluorinators, furnaces, NaF
absorbers, and CRP traps.
based on a uni t described by Murray (70).
than was needed fo r these plants, but it was assumed tha t t he required unit would have about the same over-all cost ,
cold t raps were estimated from cost data on ORGDP and ORNL equipment,
Extensive use was made of these records i n computing material, In some cases it was necessary
Items tha t
The cost of the UF6-to-UF4 reduction unit was The uni t had a larger capacity
Refrigeration equipment and
For vessels and tanks of conventional design, the cost was computed
from the cost of material (INOR-8 fo r most vessels) plus an estimated fab- r ica t ion charge, both charges being based on the weight of the vessel,
summary of values used i n estimating process vessels by weight is given i n Table 5.1. n i f ican t ly different from
For the she l l s of the pre
cost values shown were obtain
mate fo r a similar vessel,
A
Some items of process equipment were of special design and sig- essels for which cost data were available. nation storage tanks, the high fabrication
by comparison with an available shop esti-
Auxiliary process items such as process piping, process e l ec t r i ca l
service, instrumentation, sampling connections and t h e i r ins ta l la t ion were not considered i n suf f ic ien t design d e t a i l t o permit d i rec t estimation, A
cost was assigned t o these items which was based upon previous experience i n design and cost estimation of radiochemical processing plants,
assigning these costs cognizance was taken of the fact t ha t the plant is remotely maintained,
In

108
Table 5.1, Vessel, Pipe, and Tubing Costs
~~ ~ -- -~ _ _ ~
INOR- 8 Alloy Stainless $ / f t s/lb 79-4 Stee l 304
Metal Cost
Fabrication Cost:
Prefluorination INOR t ransfer tanks 3 and 4
Fluor inators Transfer vessels Waste storage vessel Waste storage thimbles UF dissolvers 1 / Y in. OD x 0,042 wall tube 1 in. IPS, Sch, 40 pipe 1-1/2 in. IPS, Sch. 40 pipe
- 3.50
6.06 26.40 30.05 16.04 41.67 13.71
0.65
Buildings. -The building estimate shown i n T a b l e 5.2 included the
cost of land acquisit ion, s i te preparation, concrete, s t ruc tura l steel,
painting, heating, ventilation, a i r conditioning, elevators, cranes,
service piping, laboratory and hot ce l l equipment, etc. costs were calculated using current data for materials and labor, and were
based on the drawings prepared.
The individual
Process Equipment Capital Cost. -Process equipment cap i t a l costs fo r
the two fluoride v o l a t i l i t y plants are presented i n Table 5.3,
are the totals of material, fabrication and ins ta l la t ion charges.
These costs
Building Capital Cost. -As mentioned above, process equipment and
buildings were the only items considered i n suf f ic ien t design d e t a i l t o permit d i r ec t estimation. The remainder of the cap i t a l costs were esti- mated by extrapolation from previous s tudies of radiochemical processing plants. The fact t h a t the plant is remotely maintained was an important
factor i n estimating process instrumentation and electrical and sampling connections.
spacing, and accessibi l i ty requirements.
These items are expensive because of counterbalancing,
G Construction overhead fees were taken a t 20 per cent of d i rec t
materials and labor for a l l buildings,installed process equipment, piping,
*
4 i

109
Table 5.2. Fluoride Vola t i l i ty Processing Building Costs 30 ft3/day Plant Capacity
Receiving Area
Excavating and backf i l l Concrete, forms, etc. Structural steel , etc. Roofing Services
Processing Cells
Excavating and backf i l l Concrete, forms, etc. S t ruc tura l steel, etc. Crane area roofing,
painting, etc. Crane bay doors Services Bldg. movable equipment Viewing windows
Waste Storage
Excavation and backf i l l Concrete, forms , etc. S t ruc tura l steel, etc. Crane area roofing Painting Services Bldge movable equipment
Operations and Laboratories Excavation and backf i l l Concrete forms, etc. S t ruc tura l steel, etc. Roofing Super s t ructure
Materials Labor Total
$ 38,000 108,000 58,000 13,000 63,000
$184,200 520,000 277,000 64,900
390,000 301,000 865,000 40,000
$ 95,000 332,000 400,000
86,500 44,500
565,000 225,000
$ 72,200 82,600
204,700 8,500
79,100 Misc. s t ruc tura l material 31,900 Services 352,000 Misc. equipment 300,000
$ 18,000 $ 56,000 133,000 241,000 49,000 107,000 16,000 29,000 39,000 102,000
$ 535,000
$ 85,500 $ 269,700 639,000 1,159,000 235,000 512,000 75,600 140,500
160,000 550,000 188,000 489,000 255,000 1,120,000
2,000 42,000
$4,282,200
$ 44,400 $ 139,400 496,000 828,000 404,000 804,000 100,800 187,300
* 44,500 89,000 289,000 854,000 30,000 255,000
$3,156,700
$ 33,400 $ 105,600 115,100 197,700 43,200 247,900
4,300 12,800 27,100 106,200 35,100 67,000
276,000 628,000 43,500 343,500
$1,708,700
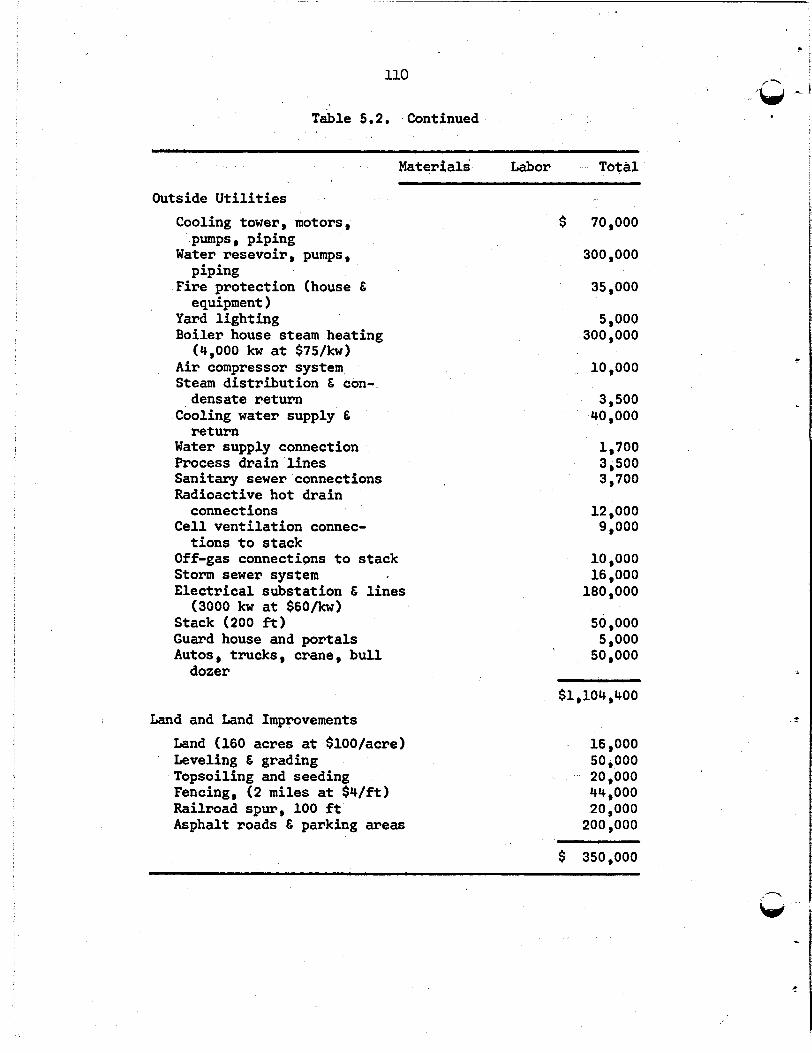
110
Table 5.2. Continued
Materials Labor T b t a l
Outside Util i t ies
Cooling tower, motors,
Water resevoir, pumps, piping
Fire protection (house 4 equipment 1
Yard l ight ing Boiler house steam heating
(4,000 kw a t $75/kw) A i r compressor system Steam dis t r ibut ion 4 con-
Cooling water supply &
Water supply connection Process drain l i nes Sanitary sewer connections Radioactive hot drain
connections C e l l vent i la t ion connec-
t ions t o stack Off-gas connectiws t o stack Storm sewer system Electrical substation 4 l i nes
(3000 kw at $60/kw) Stack (200 f t ) Guard house and portals Autos, trucks, crane, b u l l
Pumps, piping
densate return
return
dozer
$ 70,000
300,000
35,000
5,000 300,000
10,000
3,500 40,000
1,700 3,500 3,700
12,000 9,000
10,000 16,000
180,000
50,000
so ,000 5,000
Land and Land Improvements
Land (160 acres at $lOO/acre) Leveling & grading Topsoiling and seeding Fencing, (2 miles at $4/ft) Railroad spur, 100 f t Asphalt roads 4 parking areas
$1,104,400
16,000 50,000
44,000 20,000
20,000 200,000
$ 350,000

111
Table 5.3. Instal led Cost of Fluoride Vola t i l i ty Process Equipment 30 ft3/day Plant Capacity
Number Description cost
Receiving Cooling jackets f o r shipping tanks
Instrumentation
Prefluorination Storage
Transfer tanks
Furnace
Fluorination
Fluorinators
Furnaces
Movable bed absorber
Absorption Absorbers with furnaces
Cold t raps
NaF chem, t r a p
Vacuum pump
Reduct ion and Compounding
Reactor
Dissolver
Heater Sa l t make-up tank
Heater
160
2
2
5
5
5
30
15 15
5
1
1 1
1 2
2
2,75 I D by 15-ft high, $ carbon s t e e l Thermocouples, radiation monitors, etc.
2-ft x 2 - f t ; INOR-8; 0.375 in. she l l , 0.5 i n . head
2,7 f t x 3 f t ; 50 kw
1.75 f t d. by 9 f t high; 6 f t 3 sal t ; Alloy 79-4; 0,s in. she l l , 0.5 in . head
2.7 f t d. x 4 f t h; 75 kw
6 in. d x 4 f t h
6 in . sch. 40 pipe, 603 f t long -4OOC uni ts , copper -75OC units, copper
6 in. sch, 40 pipe x 6 f t ; heated
50 cfm displacement
10 kg/day capacity; Inconel
2,7 f t d. x 2.7 f t h; 12 f t sal t ; INOR-8; 0.5 in. s h e l l
3.4 f t d. x 3,7 ft h; 71 kw
3
3*4 f t do x 6.7 f t h; INOR-8; 40 f t 3 capacity
4.1 f t d. x 7.7 f t h; 178 kw
120,000
480,000
100,000
7,000
40,000
16,000
25,000
150,000
112,500 37,500
3,000
3,000
66,150
5,500
6,000
26,000
34,000

112
T a b l e 5.3. Continued
.
Number Description cost
Transfer Tanks
Waste Storage Shipping and storage tanks
Thimbles
Miscellaneous Equipment
h f r i g e r a t i o n uni t Refrigeration u n i t HF disy:sal uni t
F su- :.!I system 2
3
of sal t ; INOR-8 with heaters 2 4.5 f t d. x 4,s f t h; 60 f t
As 2 f t I D by 8 f t h; s t a in l e s s
0.25 in , s h e l l and head
3 Needed steel 304 L; 10 f t salt;
1200 2.75 f t d o x 15 f t h; or- dinary steel 304 L; 0.1875 s h e l l
2 50,000 Btu/hr at -4OOC 2 8,000 Btu/hr a t -75OC
1 2.8 f t d. x 5.3 f t h
5 Tank and t ra i ler
$ 100,000
Included with op- erat ing expenses
600,000
10,000
10,000
500
35,000
Total Process Equipment $1,987,150
instrumentation, electrical and other d i rec t charges.
than current charges for t h i s type of construction and estimates,
tect engineering and inspection fees were taken as 15 per cent of a l l charges including construction overhead.
This rate is higher Archi-
A summary of the capi ta l cost estimate is presented i n T a b l e 5.4.
?
i

113 *-
Table 5 0 4 0 Summary of Capital Cost Estimate for Molten-Salt Reactor-Fuel Fluoride Volat i l i ty Processing Plant
Capacity - 30 ft3 of Salt/Day
Receiving Area Processing Cells Waste Storage Operations and Laboratories Outside Uti l i t ies Land and Improvements Process Equipment Process Piping Process Instrumentation Process Electrical Connections Sampling Connections
$ 535,000 4,282,200 3,156,700 1,708,700 1,104,400
350,000 1,987,150
320,000 205,000
39,000 30,000
Total, Instal led Equipment and Buildings
General Construction Overhead a t 20% subtotal Architectural Engineer, etc., a t 15% subtotal Contingency a t 20% subtotal In te res t During Construction, 9.3% of subtotal
~~ ~
$13,718,150
2,743,660 2,469,294 3,786,250 2,112,728
Total $24,830,082
5.2.16 ODeratinrr and Maintenance Cost Estimates
The manpower requirements were estimated consistently with the proce-
dures outlined i n the Guide (52); the resu l t s are l i s t e d i n Table 5.5.
Materials, u t i l i t i e s , maintenance materials, etc. were estimated by consid- erat ion of the process s teps involved; the estimates are l i s t e d i n Table 5,6 together with a summary of the labor cost.
cost was estimated t o be $4,040,850 annually,
5.2.17
The t o t a l operating
MSCR Irradiated Fuel Shipping Cost
The shipping cask must accommodate a molten-salt shipping cylinder 3 having a volume of 10 f t e
was determined by the shielding requirements.
fabricated was allowed, including charges fo r an INOR l i n e r and a condens-
ing-water radiator.
reactor s i t e , a second a t the processing plant, an6 a th i rd i n t r a n s i t .
Results are l i s t e d i n Table 5 ,7 ,
The cost was estimated from the weight which A unit cost of $l.OO/lb
Three casks were allowed so t ha t one might be a t the

- 1
i
-? 114
- W ” ! T a b l e 5.5. Operating Manpower Estimates for
30 ft3/day - Fluoride Vola t i l i ty Plants
cost ($/pear)
Management
Manager Assistant manager Secretary
Production Superintendent Shi f t supervisor Ope rat or Helper Secretary
Maintenance
Superintendent Mechanical engineer Mechanic Machinist Instrument man Clerk * Storeroom keeper
Laboratory Supervisor Chemist Technician Helper
Health Physics Supervisor Monitor Clerk Records keeper
1 1 2
4 - 1 4
12 12
2
31 - 1 2
12 3 8 1 2
29 -
1 6
10 6
23 -
1 4 1 1
7 -
18,000 15,000 10;000
43,000
12,000 30,000 66,000 60,000 9,600
177,600
10,000 16,000 69,600 18,000 46,400 4,350 8,700
173,050
8,000
52,000 28,800
39,000
127,800
8,000 20,800
4,000 3,600
36,400 -
12, --

5
115
Table 5.5. Continued
cost No. ($/year)
Account a b i l i t y Engineer Clerk
1 1
2 -
Engine e r i n g
Mechanical engineer 2 Chemical engineer 4
Secretary 1 Draftsman 3
- 10
General Office
Manager Account ant Payroll c lerk Purchasing agent Secretary
1 1 2 1 2
7 -
Miscellaneous Guard 8 Fireman 4 Receptionist 1 Laundry worker 3 Nurse 1 Jani tor 3
20
Total 133
-
7,000 4,000
11,000
16,000 36,000 15,900 4,500
72,400
5,000 4,800 8,000 4,800 8,000
30,600
32,000 16,000
4,000 10,800
4,800 10,800
78,400
750,250
-

116
Table 5.6. Fluoride Vola t i l i ty Plant Direct Annual Operating Cost
Shipping - Storage Tanks (50 at $2,500)
Chemical Consumption Fluorine ( a t $2 O O / l b KOH ( a t $O.lO/lb) Hydrogen (at $2 . O O / l b ) NaF (at $O.lS/lb) Nitrogen ( a t $O.o5/ft HF (at $Oo20/lb) Graphite ( a t $0 . 15/ lb Miscellaneous
$ ,125,000
120,000 16,600 4,500
300 3,400 6,100
5,300 1,100
Utilities E lec t r i c i ty ( a t $0 . O l / k w h r Water (at $0.015/1000 ga l ) Heating (based on steam at $0.25/1000 lbs)
157,300
362,000 5,700 8,500
Labora Operating Laboratory Maintenance Supervision Overhead ( a t 20% of above)
376,200
406,400 127,800 173,050
150,000 43,000
Maintenance Materials
b S i t e C e l l s tructures and buildings Service'and u t i l i t i e s Process equipment'
900,250
10,000 76,000 78,800
243,300
Total Direct Operating Cost b82,lOO
$2,040,850
Summarized from T a b l e 5 . 5 . a
bBuilding services excluded.
Includes process equipment, process instrumentation C
and sampling. h
bi
c

117
i
T a b l e 5,7. MSCR Irradiated Fuel Shipping Cask Data and Shipping Cost*
Cask weight Cost of cask Number of casks Sa l t volume i n shipment Age of salt a t shipment Days sa l t accumulation En shipment Round t r i p distance Round t r i p time Method of shipment Number of shipments per f u l l power year Freight rate
Unit shipping cost
100,000 lbs $100,000 3 10 f t3 20 days 6 days 1000 miles 10 days R a i l 50 $2.40/100 Ibs- 1000 miles
$330/ft3 salt
*Data and cost adapted from Reference 20.
5.2.18 MSCR Unit Processing Cost
The various bases and contributions t o the uni t processing cost are collected i n Table 5 , 8 for the fluoride v o l a t i l i t y central plant process-
ing of MSCR fuel. thorium per ft3, the uni t cost was $36.90 per kg of thorium.
For the reference design f u e l containing 32 kg of
Although the cost was expressed i n terms of $/kg of Th, it should be remembered tha t only isotopes of uranium are recovered.
containing valuable thorium, lithium-7, and beryllium, as w e l l as f iss ion products, is discarded.
quired t o recover any of these components.
Stripped sal t ,
Additional o r a l te rna te processing would be re-
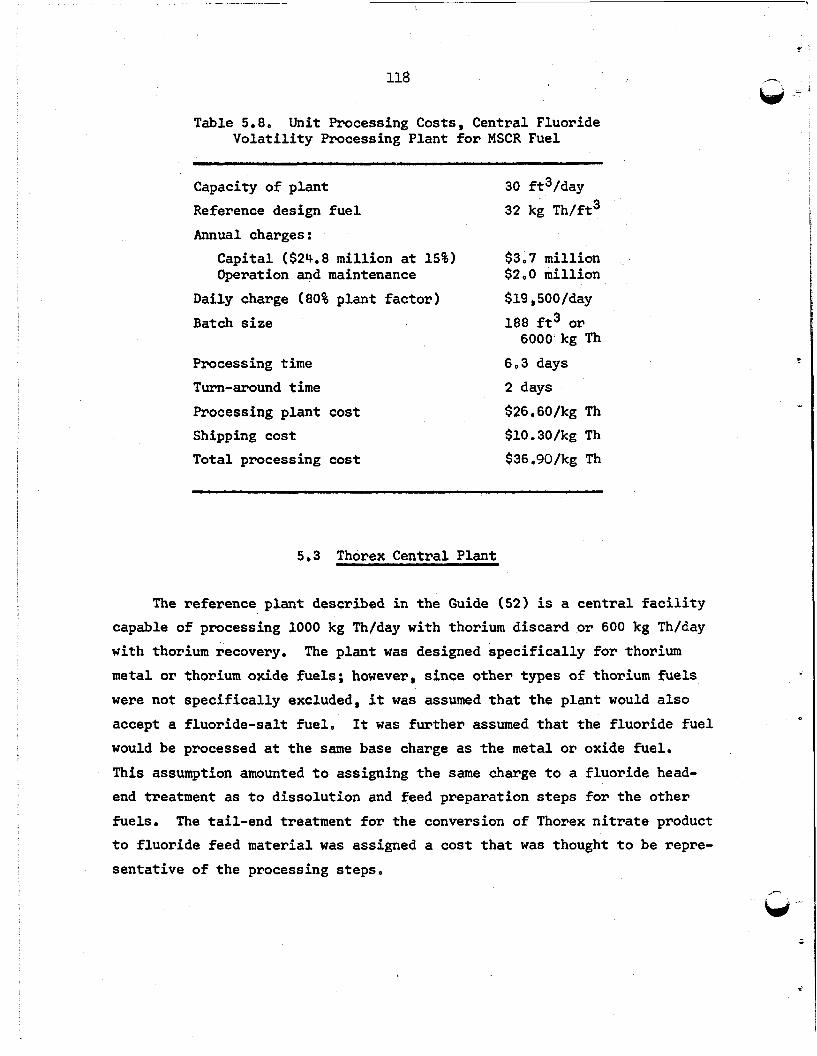
118
Table 5.8. Unit Processing Costs, Central Fluoride Volat i l i ty Processing Plant f o r MSCR Fuel
~~ ~ ~~ ~
Capacity of plant Reference design f u e l
Annual charges :
Capital ($24.8 million at 15%) Operation and maintenance
Daily charge (80% plant factor)
Batch s i ze
Processing time
Tm-around time
Processing plant cost Shipping cost
Total processing cost
30 ft3/day
32 kg Th/ft3
$3,7 million $2,0 million
$19,5OO/day 188 f t3 or
6,3 days 2 days
$26.60/kg Th $10.30/kg Th
$36,90/kg Th
6000 kg Th
5.3 Thorex Central Plant
The reference plant described i n the Guide (52) is a cent ra l f a c i l i t y capable of processing 1000 kg Th/day with thorium discard or 600 kg Th/day
with thorium recovery.
metal or thorium oxide fuels; however, since other types of thorium fuels were not specif ical ly excluded, it was assumed tha t the plant would a l so
accept a fluoride-salt fue l , would be processed a t the same base charge as the metal or oxide fuel.
This assumption amounted t o assigning the same charge t o a fluoride head- end treatment as t o dissolution and feed preparation s teps fo r the other
fuels. The tail-end treatment for the conversion of Thorex n i t r a t e product
t o fluoride feed material was assigned a cost t h a t was thought t o be repre-
sentat ive of the processing steps.
The plant was designed spec i f ica l ly fo r thorium
It was fur ther assumed tha t the fluoride f u e l
c
w -

119
5.3.1 Head-End Treatment
The head-end treatment shown schematically i n Fig, 5.9 has not been
demonstrated,
by laboratory investigations of the s t a b i l i t y of fluoride salt fuels.
However, the chemical principles have been established (40)
It is known (40) t ha t the oxides of uranium, thorium and beryllium are very stable compounds having the indicated order of s t a b i l i t y
U02 Be0 Tho2
and tha t oxygen o r oxygen-bearing compounds must be eliminated from fluo-
r ide sa l t fue ls t o insure t h e i r s t a b i l i t y o ment, the draw-off from the reactor a t 500 - 5SOOC would be contacted i n a
spray with steam or high temperature water (%2OO0C) t o precipi ta te the oxides of uranium, beryllium, thorium, protactinium and some of the f i ss ion
products. t h i s manner.
not enter i n to reaction with water, and be frozen in to small c rys ta l l ine par t ic les .
In the proposed head-end treat-
It is believed tha t rare earth oxides can be precipitated i n Lithium fluoride is a very s tab le compound and would probably
It should remain i n the system as L i F
The hydrolysis would form large quant i t ies of HF which i n aqueous
media is ra ther corrosive, Therefore the selection of materials of con-
s t ruct ion fo r the precipator w i l l be a problem,
accomplished by di lut ion with large volumes of a i r and dispersion from a stack o r by neutralization with an inexpensive base,
HF stream w i l l be required because of vo la t i l e f i ss ion products, Reuse of t h i s HF i n the subsequent hydrofluorination s tep (see Fig. 5 . 8 ) may not be
feasible because of water vapor i n the gas,
Disposal of HF can be
Some cleanup of the
The second s t ep i n the head-end treatment is dissolution of a l l the
hydrolyzed components t h a t are soluble i n n i t r i c acid,
uranium, thorium, protactinium and rare ear th products should dissolve
qui te readily,
soluble i n aqueous media, negligible amounts of these compounds should be dissolved,
w i l l be insoluble and remain with the lithium and beryllium.
should proceed smoothly because it has been shown by P i t t (73) t ha t the
pa r t i c l e s izes produced when a molten sal t is sprayed in to water are i n the micron and submicron range,
The oxides of
Since lithium fluoride and beryllium oxide are qui te in-
Also, it is almost certain t h a t some of the f i ss ion products Dissolution

120 w-
ORNL-LR-OWG 71093
off -gas HNO,
n HF
Solvent Extraction Precipitation Dissolution Filtrotfon Aqueous Molten
111, Product I - 200.c 100.C U 4 ( W *
QP)C@JO,)l Th ( NO,),
Wotte FP's
Reconstitute( Fuel UF
Be Ft ThR U F4
Make -Up Be 0
( FPk)
1 + Woste Discord
Nit rogen
Deni trot ion
. I Product I
Fig. 5.9. Proposed Aqueous Processing for MSCR. .

121
Dissolut ion is followed by so l id - l iqu id separa t ion e i t h e r by f i l t ra- -2- c) -
t i o n or cen t r i fuga t ion ,
adjustment s t e p preceding so lvent ex t r ac t ion by Thorex and t h e inso luble material is routed t o hydrofluorinat ion, A t t h i s po in t a por t ion of t h e
s o l i d s can be discarded as a purge of f i s s i o n products t h a t remain i n t h e
p r e c i p i t a t e ,
Aqueous n i t ra te so lu t ions are fed i n t o a feed
5.3.2 Solvent Ext rac t ion
Decontamination of thorium and uranium can be accomplished by w e l l -
Aqueous n i t r a t e so lu t ions are evaporated e s t ab l i shed Thorex procedureso
u n t i l about 0,15 N ac id d e f i c i e n t and f ed t o an ex t r ac t ion column, In t h e
ex t r ac t ion column both thorium and uranium are ex t r ac t ed i n t o an organic
phase ( t r i b u t y l phosphate) leav ing t h e bulk of t h e f i s s i o n products i n t h e
aqueous phase, with decontamination factors up t o 10
-..)
5
Waste from t h e first ex t r ac t ion cycle conta ins a l l of t h e protact inium
t h a t was i n t h e feed stream.
r a n t recyc l ing t h e waste after an add i t iona l decay period.
between discharge from t h e r e a c t o r and chemical processing, t h e f u e l ages
about 120 days so t h a t only about 15% o f t h e protact inium remains undecayed. The waste is given permanent storage i n l a r g e underground tanks.
However, t he amount is i n s u f f i c i e n t t o war- In t h e in t e r im
I n a f u e l r ecyc le system such as t h e MSCR it is not necessary t o de- contaminate f u r t h e r by t h e use of a d d i t i o n a l ex t r ac t ion cycles .
ence of 232U and 228Th w i l l make r ecyc le f u e l too r ad ioac t ive f o r d i r e c t handling, regard less ,
p a r t i t i o n uranium and thorium i n a s t r i p p i n g column by t h e proper ad jus t - ment of organic and aqueous flow rates.
s t r i p p e d f r o m t h e organic phase i n t o an aqueous phase; uranium remains i n t h e organic phase,
t o t h e aqueous phase.
The pres-
After ex t r ac t ion , t he re fo re , it is s u f f i c i e n t t o
In t h i s operat ion, thorium is
A subsequent s t r i p p i n g operat ion r e t u r n s t h e uranium
The produce streams are re spec t ive ly Th(f103),+ and
5.3,3 Tail-End Treatment
Fuel reconst i tut ion begins with acceptance of the nit rate products
u from t h e so lvent ex t r ac t ion p l an t . I t is necessary t o convert t h e n i t r a t e s
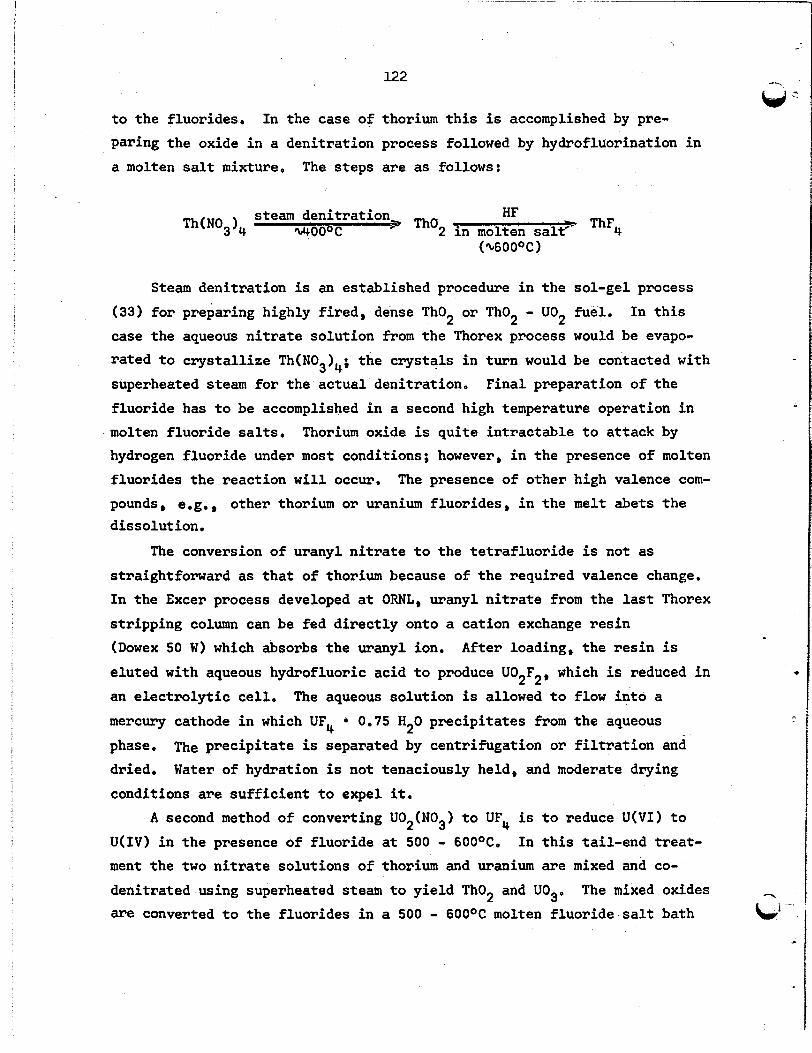
122
t o the fluorides.
paring the oxide i n a deni t ra t ion process followed by hydrofluorination i n a molten salt mixture, The s teps are as follows:
In the case of thorium t h i s is accomplished by pre-
HF ThF4 steam deni t ra t ion
woooc Thu2 i n molten sal? Th ( NO3 l4
Steam deni t ra t ion is an established procedure i n the sol-gel process
(33) for preparing highly f i r ed , dense Tho2 or Tho2 - U02 fuel , case the aqueous ni t ra te solut ion from the Thorex process would be evapo-
ra ted t o c rys t a l l i ze Th(N03)4; the crystals i n turn would be contacted with
superheated steam f o r the ac tua l deni t ra t ion,
f luoride has t o be accomplished i n a second high temperature operation i n
molten f luor ide salts. hydrogen f luoride under most conditions; however, i n the presence of molten
f luorides the react ion w i l l occur, The presence of other high valence com-
pounds, e.g., other thorium or uranium f luorides , i n the melt abets t h e dissolut ion .
In t h i s
Final preparation of the
Thorium oxide is qui te in t rac tab le t o attack by
The conversion of uranyl n i t r a t e t o the t e t r a f luo r ide is not as
straightforward as t h a t of thorium because of t he required valence change. In the Excer process developed a t OWL, uranyl ni t ra te from the last Thorex
s t r ipp ing column can be fed d i r ec t ly onto a cation exchange r e s in (Dowex 50 W ) which absorbs the uranyl ion.
e luted with aqueous hydrofluoric acid t o produce U02F2, which is reduced i n an e l e c t r o l y t i c cell. The aqueous solut ion is allowed t o flow i n t o a mercury cathode i n which UF4 0.75 H 2 0 prec ip i ta tes from the aqueous
phase,
dried,
conditions are su f f i c i en t t o expel it,
,. After loading, t he r e s i n is
The prec ip i ta te is separated by centrifugation or f i l t r a t i o n and
Water of hydration is not tenaciously held, and moderate drying
A second method of converting U02(N03) t o UF4 is t o reduce U(V1) t o
U ( 1 V ) i n t he presence of f luoride at 500 - 600°C0
ment the two n i t r a t e solut ions of thorium and uranium are mixed and co-
In t h i s tail-end treat-
deni t ra ted using superheated steam t o y ie ld Tho2 and U03, The mixed oxides T
c
are converted t o the f luorides i n a 500 - 6OOOC molten f luoride sa l t bath e-

12 3
by contacting with a gaseous mixture of H2 + HF. t he hydrogen and hydrogen f luoride t o the te t rava len t form and dissolves
as UF4; thorium is metathesized t o ThF4 which a l s o dissolves i n the melt.
The processing cycle is completed when the uranium f luoride is mixed
with f luorides of thorium, lithium, and beryllium oxide plus make-up feed
and hydrofluorinated,
hydrofluorinated i n molten f luoride solutions,
Uranium i s reduced by
Beryllium recycled as Be0 dissolves as BeF2 when
5,3.4 Processing Costs
The uni t processing costs were computed according to the prescr ipt ion
The given i n Guide t o Nuclear Power Cost Evaluation, Vol. 4, Section 460,
escalated da i ly charge f o r operation of the Thorex plant w a s taken as
$17,500 i n la te 1962.
600 kg/day.
f u e l withdrawn from the reactor were accumulated f o r 120 days and combined
i n t o a s ingle processing batch.
1.25 f t /day (40 kg Th/day), t he batch s i ze exceeded 4800 kg of Th and re-
quired eight days o r longer t o process.
the "turn-around-time" is specified t o be eight days i n the Guide.
the t o t a l processing time is 120r/600 + 8 days (where r is the withdrawal
rate i n kg Th/day) and the t o t a l amount processed i s 1 2 0 r kg of Th.
cost fo r operating the Thorex plant is thus
Since the thorium was recycled, the capacity was As described i n a previous section, the da i ly increments of
If the withdrawal rate exceeded 3
For t h i s range of process times,
Thus
The
120r +
Separation Cost = 120r
= (29.2 + 1167/r) $/kg Th
The cost of reducing so l id f u e l elements i n t o a form su i tab le f o r pro-
cessing (aqueous solut ion of uranyl and thorium n i t r a t e s ) is included i n the da i ly operating cost (lob),
ing the MSCR f u e l by the method proposed i n Sec. 5.2 would be less cost ly
than the reduction of so l id f u e l elements by Darex o r Zircex, However, an investment of $500,000 for MSCR f u e l head-end treatment was allowed, based
It seems l i k e l y t h a t the cost of convert-

I24
on estimates extracted from reference 20. This resul ted i n a head-end
treatment charge of $0.53/kg Th processed. The cost of converting recovered thorium n i t r a t e t o ThF4 was not given
i n the Guide.
UF6 was only $5.60/kgO
simpler and shor te r than the uranium process, it seemed adequate and con-
servative t o assign a cost of $5.00/kg Th f o r t he conversion of ThF4.
However, the cost of converting low enrichment uranium t o
Since the proposed thorium conversion process is
Summing these charges, one has
Processing Plant Cost,= (34.7 + 1167/r) $/kg
where r = kg Th/day removed from the reactor.
Shipping cos ts are presented i n Section 465 of t he Guide (521, and include freight, handling, cask r en ta l , and property insurance. is $16/kg of uranium (or thorium) for spent fue l elements.
The cost
MSCR f u e l must be packaged before shipment. I n t he scheme proposed, 3 the da i ly productions of 1.67 ft3/day are accumulated i n 35 f t batches i n
the spent fue l f a c i l i t y (Sec, 408elO) which contains 5 tanks each having a
capacity of 35 f t
f r o m freshly i r rad ia ted fuel.
"bottle" (cylinder) one foot i n diameter and 13 feet long.
se r ted i n t o an individual shipping cask and transported t o the Thorex
plant. f o r a t least 10 years, they w i l l add t o the shipping cost only $1.74/kg Th
a t the lowest rate of processing (40 kg/day),
3 and provided with su f f i c i en t cooling t o remove af te rhea t 3 A 10 f t batch is drained i n t o an INOR
This is in-
If the b o t t l e s cost as much as $10,000 apiece, but are re-usable
The charge f o r shipping decontaminated thorium back t o the plant is represented t o be $l.OO/kg i n the Guide.
Since the processing plant operating charge was a l l levied against t he thorium, the only charges on the uranium are shipping a t $17/kg per
round t r i p and reconversion, for which operation the Handbook gives $32/kg for converting the n i t r a t e of highly enriched 235U t o UF6,
t he cost of conversion t o UF should be less, the given cost was assumed.
The to ta l charge f o r t h e uranium was thus $49/kg, and was charged against
a l l isotopes of uranium, including 238U and the precursor, 233Pa.
Although
4

12 5
5.4 Comparison of Processing Cost Estimates
For t he purposes of comparison, the r e s u l t s of three other processing
cost s tud ies are ci ted.
Fluoride Vola t i l i ty plant designed especial ly for processing MSCR fuel a t a rate of 31.5 ft3/day (1000 kg Th/day), The estimates were based on the
same design study (21) used t o prepare the estimates reported i n Sec. 5.2.
The scal ing, however, was performed on the plant as a whole, r a the r than
with individual items, and the scal ing factor was 0.31.
i t a l cost was $31.5 mill ion, and the annual operating expense was $3.0
million. This study is referred t o below as the "CMS" study.
The first, by Carter (20), dea l t with a central
The estimated cap-
~
The second study, a l so by Carter (201, dea l t with a cent ra l Thorex - f a c i l i t y adapted t o process f luoride fue l s (1000 kg Th/day) and was based
on a de ta i led analysis of the head-end and tail-end processes (described
i n the previous sect ion) as w e l l as the Thorex separation process, and
w a s based on an unpublished design and cost study performed by Carter,
Harrington, and Stockdale a t ORNL i n which flow sheets, equipment spec i f i -
cations, plant arrangement drawings, building drawings, etc, were prepared
and the items were costed. as the "CHS" study.
f a c i l i t y assumed i n the Guide t o Nuclear Power Cost Evaluation (521,
adapted f o r f luoride fuels. i t y of 1000 kg Th/day, was $36.5 mi l l ion , and the annual operating expense
was $3.6 million.
For brevity, t h i s study is re fer red t o below
It is, essent ia l ly , an independent estimate of the
The estimated cap i t a l cost , scaled t o a capac-
The t h i r d study, performed by W. H e Farrow, Jr, (321, dea l t with sev-
eral radiochemical separation plants for several d i f fe ren t so l id fue l s and
clads and with both d i r ec t and remote maintenance.
is similar t o Thorex, was employed f o r the separations,
case was t h a t of a remote
per day of na tura l urani
erable d e t a i l , a cost breakdown was not given by Farrow was $43 mill ion, and the annual d i r ec t operating cost was$3.7 million. One
might reasonably assume t h a t a Thorex plant of the same capacity would have
approximately the same costs , and t h a t the head and tail-end treatments f o r
The purex process, which
The most applicable
aintained plant capable of t r ea t ing one tonne
Although the process was described i n consid-
The c a p i t a l cost
b, * f luoride fuels would be no more expensive, and perhaps less, than those of
the s o l i d fue ls ,

- I26
It is seen t h a t the estimates of t he total cost , including shipping,
vary by a fac tor of two, ranging from $37 t o $75/kg of thorium processed.
It seems plausible t h a t processing MSCR fue l ' i n a .central Fluoride Vdlatil- i t y f a c i l i t y w i l l cost less than $50/kg, and possibly less than $QO, and
t h a t processing i n a Thorex plant w i l l cost less than $70, and possibly
less than $50 per kg of thorium.
T a b l e 5.9. Comparison of Estimates of Processing Costs fo r t he MSCR Reference Designa
This Work CMS AEC CHS Farrow
Type of Plant
Location
Capacity, kg Th/day
Batch Size, kg Th
Turn-Around-Time , Days
Capital Cost, $106
Annual Operating E main- tenance Cost, $106
Process Plant Cost, $/kg Th
Shipping Cost, $/kg Th
Processing Cost, $/kg Th
d
F1. Vol. F1. Vol. Thorex Thorex (Purex)
Central Central Central Central Central
1000 1000 600 1000 (1000 )b
2 2 8 2 ( 2 F
25.2 31.2 0 36.5 43
6000 6000 6000 6000 6000
2.0 3.0 r 3.6 3.7
26.6 34.5 56.5 40.5 46.4
10.3f 10.3 18.7 10.3 ( 2 0 P
36.9 44.8 7502e 50.8 (66.4 IC
Spent f u e l is withdrawn from the reac tor (1.67 ft3/day; 53.3 kg Th/day)and shipped t o a cen t r a l processing plant i n 10 f t3 batches. These are accumulated i n 6000 kg Th batches, cooled for an average of 90 days, and processed i n s i x days (10 days i n AEC plant) .
a
c
bPurex plant capacity of one tonne of natural uranium per day
These items w e r e not estimated by Farrow; values chosen were assumed equivalent t o one tonne thorium per day.
thought t o be consistent with h i s general treatment,
a t ing charge (escalated t o 1962) was given i n reference 52.
and shipping costs of $10.30/kg Th, t h e t o t a l cos ts would be only about $50, which is comparable t o the other estimates l i s t e d , except Farmw'S.
C
dFixed charges were 14.46%, except f o r AEC plant where da i ly oper-
e \
Turn-around-time was 8 days. With a more realist ic time of 2 days,
b- fTable 5.7.

127
6. FUEL CYCLE ANALYSIS
6.1 Analvsis of Nuclear Svstem
The nuclear calculations for the MSCR were performed by means of the
MERC-1 program f o r the IBM-7090,
i n Appendix D, uses the multigroup neutron diffusion code Modric and the
isotope code ERC-10 as chain l inks.
This program, described by Kerlin e t al.,
6.1.1 Computer Programs
Modric. -This program was employed i n a 34-group version using the - group energies and cross sections of the various elements given i n refer-
ence 54. The cross sections were adopted f o r the most pa r t from Nestor's tabulation (721, with some minor modifications described below.
Boltzman averaged thermal cross sections and resonance in tegra ls of impor- t a n t materials are l i s t e d i n Table 6.1.
ignored ,
Maxwell-
Thermal spectrum hardening was
Although the treatment of downscattering i n Modric provides f o r the
t r ans fe r of neutrons from any group i q t o any of the ten next lower groups,
the required sca t te r ing matrices were not available when the MSCR calcula-
t ions were begun.
account fast f i ss ions and i n e l a s t i c sca t te r ing i n thorium and the fact t h a t the elastic sca t te r ing lethargy decrements were i n some ranges la rger than
the group widths. tance of t r ea t ing the downscattering i n t h i s more precise mannero
effect was found t o be ins igni f icant ,
Subsequently, t he matrices were computed taking i n t o
A s ing le calculation was made t o determine the impor- The
ERC-10, -The basic isotope equation i n ERC-10 computes t h e concentra- - t i on t h a t is i n equ i l ib r i i t h t he sources (make-up, recycle, transmuta- t i on , decay, f i s s ion ) and s inks (transmutation, decay, waste, sales, recycle), One isotope (u ly 233U o r 235U) may be selected t o satisfy a c r i t i c a l i t y equation; the feed rate or sales rate required to maintain the
cri t ical concentration is t h
Three isotopes, 234U9 236U9 and 238U, approach equilibrium with periods long compared t o the assumed fue l l i f e (30 years), The equi l ibr iun

128
Table 6.1. Cross Sections and Resonance Integrals Used i n MSCR Multigroup Neutron Calculations
(Values i n barns per atom)
Material Thermal cross Sectiona Fission (vu,) Absorption (aa)
232111
2 3 3 ~ a 23313
2 34u
2 3 5 ~
2 3 6 ~
37Np 2 3 8 ~
6 L i
' ~ i 9Be 9F
1%
1 3 5 ~ e
INOR-8
Resonance Integrals b Fission (vuf) Absorption (ua)
8.286 x 10⁻¹ 9.684 x 10
8.67221 x l o 2 2 2.01972 x l o 3 9,60119 x 10
1,0602 x 10 6.89453 x l o2 2 7,54945 x lo2 4.66792 x 10
5.487 2*87528 x l o 2 2 1.0983 X 10 5.70047 x 10
3,225 2.77241 x l o2
1.5774 x loo2 4.748 x 1.975 x
1.897 x 10.' 6.004
4.5756 x lo4
4,58811 X lo2
%axwell-Boltzman averaged a t 1200O F . bCut-off a t 0,437 ev. ; i n f i n i t e d i lu t ion values.
concentrations of these were not computed; instead, first approximations of t h e i r time-mean concentrations ( s t a r t i ng with a reac tor i n i t i a l l y inven-
tor ied with 235U 95% enriched) were computed as described i n Appendix Ha The t rans ien t behavior of all other isotopes, including 233Pa9 233U9
and f i s s ion products, was ignored i n the optimization s tudies . mations involved i n t h i s approach are examined i n Appendix H,
The appSox-
MERC-1. - Input (54) consis ts of specif icat ions of the geometry and - dimensions of the reactor regions, i n i t i a l guesses a t the composition, in-
/-,
formation on power, f u e l volume, processing modes and rates, composition of W make-up materials, un i t values, and processing costs. The output consis ts

129
of nuclear data (breeding r a t i o , mean eta, neutron balance, etc.), process- ing da ta (feed and production rates), and a fue l cycle cost (inventory,
make-up processing, etc.). pr inc ipa l items of cost and suggests changes i n specif icat ions which might reduce these. In some cases, the effect of changing an input parameter is
An examination of these data discloses the
not readi ly predictable; e,g, , increasing the concentration of thorium i n the f u e l stream usually increases the conversion r a t i o and so reduces the
23%J feed requirements but on the other hand increases the fissile inven-
tory. ca l ly i n a "factored" set of calculations yielding the maximum information from a minimum number of cases,
with respect t o several variables simultaneously.
In cases such as t h i s , the input parameters are varied systemati-
The f u e l cycle cost is thus optimized
(See Section 6,4.1.)
6.1.2 Reactor Physics Model
The reactor was computed as a homogeneous mixture i n equivelant spher- ical geometry ( i o e o , the input diameter was 1.09 times the diameter of the
cy l indr ica l core), able, was ignored, nance escape is underestimated, resu l t ing i n a pessimistic estimate of the mean eta of the system,
these can always be matched a t some neighboring concentration, a minor effect on the spectrum of neutrons, the chief e r ro r introduced is
a s l i g h t underestimate of the thorium inventory. f o r the inventory charges contribute only a small portion of t he t o t a l fue l
cos ts (less than 5%).
Thus the heterogeneity of the core, which is appreci- But t h i s treatment is conservative i n t h a t t he reso-
In regard t o the estimated captures i n thorium,
Aside from
But t h i s is not important,
The equivalent spherical core comprised three zones; an inner zone consisting of a homogeneous mixture of fue l s a l t and graphite, a spherical annulus about one inch thick f i l l e d with fue l sa l t , and a spherical reac tor
vessel one inch thick, The
assumed t o be 1200°F, and
ef fec t ive temperature of t he f u e l was
era ture was a l so assigned t o the graph- or three hundred degrees warmer.
6.1.3 Cross Section Data
Thorium-232, - Saturation of resonances (self-shielding) was found t o be important i n f i v e of the neutron energy groups, The e f fec t ive cross
c

130
sections of thorium i n these groups were calculated by means of a correla- t i o n developed by J. H. Miller (Appendix B) and based on the theore t ica l analysis of effect ive resonance in tegra ls made by La Dresner (29).
Protactinium-233. - A 2200 m l s cross sect ion of 39 barns, as recom- ~
mended by Eastwood and Werner (301, was assigned.
900 barns was adopted,
A resonance in t eg ra l of
This was d is t r ibu ted as shown i n Appendix A. I
Uranium-233. - A value of 2.29 was adopted f o r eta a t thermal energies, based on the recent measurements of Gwin and Magnuson (43), For energies
above thermal, Nestor's estimates (72) were used, as tabulated i n Appen-. d ix A. Resonance saturat ion effects were ignored.
Beryllium. -The (n,2n) react ion of energetic neutrons i n 9Be was ig- nored.
is moreover o f f se t by the disadvantageous (n,a) react ion which uses up a neutron and leads t o the formation of 6 L i ,
It is of small importance i n t h i s graphite moderated reactor , and
Fission Products. -These, excepting xenon and samarium, gere handled co l lec t ive ly i n the Modric calculat ion and individually i n the ERC calcu-
l a t ion , as described below. f i ss ion product was computed f r o m ERC r e s u l t s and used i n the multigroup calculation i n conjunction with an a rb i t r a ry set of group cross sect ions
composed of a hypothetical standard absorber having a thermal cross sect ion
An "effective" concentration of an "aggregate"
of one barn and an epithermal cross sect ion corresponding t o a l / v varia-
t i o n above thermal.
were mostly taken from the compilation- of Garrison and Roos (371, supple- mented by estimates from Bloemeke (91, Nephew (711, and Pattenden (90).
The data used, including f i s s ion y ie lds and decay constants, are tabulated
i n Appendix E.
Thermal cross sect ions and resonance in tegra ls f o r f i s s ion products
6.2"Analysis of Thermal and Mechanical System
The analysis included consideration of f l u i d flow i n and mechanical
arrangement of the reac tor and equipment associated with the extract ion of
heat f r o m the f u e l stream, as they affect f u e l cycle costs. ,-\
&J 31 1
131
6.2.1 Maximum Fuel Temperature
It is believed t h a t t he rate of corrosion of INOR w i l l be very small
and t h a t the heat exchangers w i l l have a very long lifetime i f the temper-
a ture of the fue l solut ion does not exceed 130OOF (121, The maximum
allowable temperature may be higher; i f so, future generations of molten- salt reactors w i l l be able t o achieve higher spec i f ic powers and higher
thermal e f f ic ienc ies
6,2.2 Minimum Fuel Temperature
For t h i s , llOO°F was selected. Earlier work ( 3 ) had shown t h i s t o be
a reasonable value, and calculations summarized i n Table 6,2 confirmed i ts
optimal qua l i ty f o r the MSCR, were calculated i n Table 6.2, and it was concluded t h a t the optimum temper-
Perturbations of the affected cap i t a l costs
a ture is very near llOO°F (see a l so Sec. 3.1.12).
6.2 3 Velocity
Erosion does not appear t o be a problem i n s a l t - I N O R systems, nor does
there appear t o be any dependence of the corrosion rate on velocity.
Rather, t he veloci ty appears t o be l imited by considerations of pumping
power and stresses induced by pressure gradients.
heat exchangers is limited by the rapid increase i n cost of INOR s h e l l s
with increasing wall thickness. across the reac tor core is determined by l imi ta t ions on s t rength and th ick-
ness of the reactor vessel and in t e rna l support members. Velocit ies, pres- sures, and wall thicknesses at various points i n the f u e l circuit of the
Pressure drop across the
Likewise, maximum allowable pressure drop
rence design are l i s t e d In Table 6,3.
The pumping power requ e r heat exchanger loop was calculated t o margin of 500 horsepower for pump and be about 1500 horsepower; w i
motor inef f ic ienc ies and un en losses. This pumping power requirement
results i n a pumping cost (with electric power at 4 mills/kwhr) of
0.004 mi l l s /bh re .

Table 6.2. MSCR Minimum Fuel Temperature Optimizationfc
Case 1 Case 3 Case 2
Minimum f u e l temp., OF 10 50 1100 1150
Fuel stream temp. r ise , OF
Fuel salt flow rate, lb /h r x 250
89 200
111
150
148
Heat exchanger log-mean temp,
Heat exchanger area, f t Heat exchanger pressure drop, p s i
d i f f e rence , OF 2
Fuel s i d e Coolant s i d e
3 Heat exchanger volume, f t Fuel s i d e Coolant s i d e
Fuel c i rcui t piping
Pressure drop, gsi Pipe volume, f t Pipe weight, Ibs.
Pumps
Fuel c i rcu i t , hp Coolant c i rcu i t , hp
144 174 200
53,000 46,000 (-$306
62 1 0 1
80 84
123 73
575 488
696 (+$3,025) 584 (+$125)
504 (-$1,775) 424 (-$83) P w
h,
133 255 (-$1,625 15,400 (-$31)
150 320 18,500
19 5
21,300 (+$28) 410 (+$2,250)
9,100 (-$736) 17,300 (+$256)
22,200 (61 ,872) 15,200 (-$l60)
$+1,83
12,800 16,000
Net c a p i t a l cos t increment $million $+1.49 Reference Condition
*Capital cos t increments with respec t t o reference condition (1100OF) associated with each item are given i n parenthes is i n $thousands. configuration, hea t exchanger c ros s sec t ion , f u e l ve loc i ty i n piping were held constant, as was flow rate of coolant sa l t and i ts temperature extremes. The power of t h e r e a c t o r was constant, and t h e thermal e f f i c i ency was not a f f ec t ed ,
In t h i s ca lcu la t ion , r e a c t o r o u t l e t temperature,
gi C )

2
133
T a b l e 6.3. Character is t ics of Fuel Circui t of 1000-Mwe Molten Sa l t Converter Reference Design Reactor
-%” c4
Minimum
(ft/sec 1 (ps ia ) (inches ) Locat ion Velocity Pressure Wall Thickness
Pump discharge 35 190 0 e 406 Top of heat exchanger - 185 - Heat exchanger tubing 8 A - 0.035
Bottom of heat exchanger 35 95 0 250 Bottom of reactor - 80 - Fuel channels i n core 4.3 - 7,4 - - Top of reactor (Pump suction) 20 22.5 0 312
*Shell-side
6.2.4 Fuel Volume
Contributions t o the volume of t he f u e l system are l i s t e d i n Table 4.1
f o r the reference design.
pends on the power l eve l and various l imitat ions such as those on sa l t temperature, pressure, velocity, thermal stress i n and minimum thickness of
heat exchanger tubing, etc. The reference system was designed with consid- erable conservatism. increase i n spec i f i c power; pumping power costs and c a p i t a l investment i n
pumps would increase. design of the system should be optimized with respect t o the sum of a l l the
cos ts affected; but t h i s l ay o
The volume of fue l i n the external system de-
The f u e l volume could be reduced appreciably w i t h an
Cost of heat exchangers might also increase. The
ide the scope of the present study.
ernal portion of the f u e l system of the The power density i n the 3 reference design is approximately 2.8 M w t / f t .
than t h e 7.6 M w t / f t used i n a -pr ior study of a molten salt breeder (3)
which was based on a study by Spiewak and Parsly (991, who estimated a spec i f ic power of 4,9 M w t / f t
This is very much smaller 3
3 3 f o r a first generation plant and 7.6 M w t / f t
for subsequent plants ,
u

134
Since only about one fourth of the t o t a l is contributed by the f u e l
i n the act ive core, the t o t a l f u e l volume is not very sens i t ive t o changes i n f u e l volume f rac t ion i n the core. The t o t a l volume is r a the r more sen- s i t i v e t o changes i n core diameter. The volume of neutron-active f u e l in- creases as the cube of the core diameter (height equal t o diameter), while volume i n the r a d i a l annulus and i n top and bottom plenums increases as the square. About 40% of the t o t a l volume is affected,
I n a f u l l y optimized system, the f u e l volume might plausibly be
2000 ft3, and perhaps be as low as 1800 ft', provided some of the holdup i n end-plenums, etc. can be eliminated.
-
6.3 Analysis of Chemical System
The composition of the f u e l stream as a function of its chemical in- te rac t ion with the reac tor environment and with the processing plant is
considered. Behavior of xenon-135 is ImporYtant and is discussed, in d e t a i l i n Section 6.8. Stagnation of fue l i n crevices between moderator elements
may be important; however, it does not seem possible at t h i s time t o eval- uate the effect except t o say t h a t p a r a s i t i c captures of neutrons i n
f i s s ion products immobilized i n such places w i l l take place.
t a i n t y was lumped with t h a t associated with corrosion products as discussed
This uncer-
below . So far as the composition of the f u e l stream is concerned, t he chem-
ical effects of t h e two proposed processing methods (Thorex vs f luoride
v o l a t i l i t y ) are the same. handled a t least semi-remotely whether the thorium is recycled or not.
Both methods r e s u l t i n recycle feed containing only negl igible amounts of nuclear poisons (other than isotopes of uranium) and both return 233Pa
removed from the reactor as 233U with losses t h a t depend only on the hold- ing time p r io r t o chemical treatment,
The recycled uranium is radioactive and must be
6.3.1 Thorium-232 . h
W - Thorium may be recycled i f Thorex processing is used; however, accord-
ing t o the Guide, the capacity of a multi-purpose processing plant would be c

135 -= (J
reduced by 40% (52).
without loss of capacity, however, and recover the thorium at no extra cost .)
t he value of the thorium saved,
thorium is not recovered except by means of an addi t ional s t ep presently
not avai lable .
(One could design the plant t o handle the thorium
It turns out t h a t t h i s reduction i n capacity almost exactly o f f se t s
With the f luoride v o l a t i l i t y processing,
6.3.2 Protactinium-233
With mean residence times of the order of 1000 days, protactinium f o r
However, the most pa r t decays while still i n the c i rcu la t ing f u e l system.
the process stream carries 60-80 grams per day out of the reac tor system. In the proposed reference design processing scheme (Section 5.21, the pro-
cessing stream i s accumulated f o r 120 days and then held as a batch f o r an
addi t ional 30 days, giving a t o t a l hold-up time of 150 days and an average
decay t i m e of 90 days. A t t he time of processing, 85% of the 233Pa i n the
mixed batch w i l l have decayed t o 233U, so t ha t the maximum loss of 233Pa
w i l l be only 9 t o 1 2 grams per day.
6.3.3 Uranium-233
The loss per pass through the processing plant was assumed t o be 0.3%. In the reference design reactor , t he product stream from the process
plant was recycled t o the reactor ; however, the economics of sale of the product stream w a s also examined.
6.3.4 Uranium-234
Natural uranium is 99.27 ight per cent 238U, Oo72 per cent 235U, and 0.0055 per cent 234U. 235U, a diffusion plant product containing 95 weight per cent 235U would a l so contain 0,726 per cent 234U, with the b a l
allow f o r some enrichment, the composition of the feed was taken t o be 95 per cent 235U, 1 per cent 234U, and 4 per cent 238U, processing losses were 0.3 per cent/passo
If there were no enrichment in-234U r e l a t i v e t o
e being 238U. In o r
A s with 233U, t he
I n i t i a l l y the reac tor contains l i t t l e 234U. The approach t o equilib-
rium is slow, and, as seen i n Appendix H, the average concentration over

136
a period of t h i r t y years is only 65 per cent of the equilibrium concentra- t ion. The average value, r a the r than the equilibrium value, was therefore
used i n the nuclear calculations.
6.3,s Uranium-235
An enrichment of 95% was selected f o r t he make-up, Losses i n process-
ing were assumed t o be 0.3% per pass.
6.3.6 Uranium-236 ~
The concentration of t h i s isotope a l so approaches equilibrium slowly with respect t o a f u e l lifetime of 30 years,
the 30-year l i f e was used.
A concentration averaged over
Losses i n processing were assumed t o be 0.3%.
6.3.7 Neptunium-237
This was assumed t o be removed completely i n the processing plant.
6.3.8- Uranium-238
For reasons given above, t h e fuel make-up stream was assumed t o con- t a i n 4% 238U by weight.
0.38.
t ions instead of the equilibrium concentration,
Losses i n the process plant were assumed t o be The 30-year average concentration was used i n t h e nuclear calcula-
6 . 3.9 Neptunim'-239 and Plutonium Isotopes
Only small amounts of these w i l l be formed, and they are l o s t i n the
waste. breeding c red i t was taken for absorptions i n 238U0
6.3.10 Salt
Accordingly, t h e i r formation i n the f u e l stream was ignored and no
- The fuel carrier i n the reference design consisted of 68 mole per cent -.
LiF, 23 per cent BeF2, -and 9 per cent ThF,,. was 99,995% 7Li.
l e n t isotope "Carrier-1." neutron captures therein were computed separately. Lithium and beryllium
i n the process stream are l o s t t o t he waste, and no value was assigned t o
Lithium i n the make-up sa l t
Captures i n 'Li, Be, and F were lumped under an equiva- _ _ The mean reac tor concentration of 6 L i and

; -
I 1
137
the waste.
Be; the 6 L i feed rate was proportioned t o the 7 L i make-up rate. The make-up rate was made equal t o the discard rate f o r 7 L i and
6,3,11 Xenon-135 and Related Isotopes
In the reference design reactor , it was assumed the graphite has a diffusion coeff ic ient no greater than loF6 cm2/sec ( D = 10" cm 2 /sec f o r
MSRE graphite), a porosity no greater than 0.01, the f u e l stream is recirculated t o the dome of the expansion chamber and
the pump bowls. gas with an eff ic iency of 100 per cent per pass, t he loss i n breeding r a t i o due t o absorptions i n 135Xe is 0.017 as shown
i n Appendix G, where the losses corresponding t o other assumptions are a l so
given e
and t h a t 10 per cent of
Here Xe is desorbed and swept away i n a stream of helium With these assumptions,
6.3.12 Noble Metal'Fission'Products
It was assumed t h a t t h i s group of isotopes, comprising Mo, Rh, Ru, Pd,
and In, "plate out" on INOR surfaces i n the f u e l c i r c u i t with an eff ic iency
of 1.0 per cent per pass,
6.3.13 Other Fission Products
These are removed 100 per cent i n the Fluoride Vo la t i l i t y process, and only negl igible amounts w i l l be present i n the recycle stream from a Thorex plant e
6,3,14 Corrosion Products
Data are meager from which the concentration of corrosion products i n
t h e c i rcu la t ing f u e l stream could be estimated, ated for 15,000 hours, the concentrations of iron, nickel, and chromium
appeared t o f luc tua te about equilibrium values (84, pa 791,
of these data one might expect the f u e l t o contain 50 ppm of nickel,
500 ppm of chromik, and about 250 ppm of iron, reactor , , these concentrations would r e s u l t i n a poison f rac t ion (loss i n
breeding r a t i o ) of 0,006 uni ts .
t r a r i l y assigned t o corrosion products i n the calculations, making some
In an in-pile loop oper-
On the bas i s
In the reference design
A poison fract ion of 0.008 uni t s w a s arbi-
L

138
allowance f o r f i s s ion products immobilized i n Cracks and Crevices i n the moderator, etc.
6,C"Fuel'Cycle Optimization
The designer has l i t t l e control over some of t he independent var iables
t h a t affect the f u e l cycle cost. temperature is f ixed by necessity of l imit ing corrosion rates. For some variables the f u e l cost may decrease monotonically as the var iable tends toward an extreme value, but other cos ts may increase, For example, de-
creasipg the external volume of f u e l sa l t decreases inventory charges but
increases pumping cos tso selected for the reference design optimization; however, effect on fue l cycle cost of decreasing the external volume is e a s i l y estimated.
For instance, the maximum allowable f u e l
_. . . A plausible and conservative external volume was
After the values of such fixed or l imi t ing var iables were established,
there remained several which required optimization simultaneously with re- spect t o the fuel costs.
variables . These variables were designated t h e "key"
The key independent var iables were found t o be the diameter (D) of the
core, the volume f r ac t ion (F) of f u e l i n the core, t h e concentration (t4) of thorium i n the f u e l sa l t , and the processing rate (R). t h i r d combine t o f i x an important subsidiary variable, t he C/Th atom r a t i o (an indicat ion of the degree of moderation of the system). and then sa t i s fy ing the c r i t i c a l i t y equation together with the equilibrium
isotope equation results i n f ix ing the Th/U ratio, breeding r a t i o , f u e l
cost , etc.
The second and
Fixing a l l four
Exploratory calculat ions showed t h a t the fue l cycle cost is a r a the r
sens i t ive function of the C/Th ratio, but is insens i t ive t o the diameter
of the core i n the range from 15 t o 20 feet.
f u e l cycle costs for a series of calculat ions are shown i n Table 6.4.
Relative breeding ratios and
On the bas i s of these results, t he 20-foot core having a f u e l volume f rac t ion of 10 per cent and using a fue l salt containing 9 mole per cent
ThF4 was selected for fur ther study. The optimum processing rate f o r t h i s

i -
139
T a b l e 6.4. Conversion Ratios and Fuel Cycle Costs 1000 Mwe Molten S a l t Reference Design Reactor Processing a t Rate
of Two Cubic Feet per Day
Case Core D i a m Vol. Frac. Mole % C/Th Th/U Conv. FCC f t o Fuel Th F4 Ratio m/kwhr
1 15 0,18 1 3 107 1066 0091 1.09
2 17,7 0.18 13 107 12.4 0.96 1.02
3 20 0.18 1 3 107 13.5 0.99 1.04
4 15 0.10 9 293 21.0 0.84 0.73
5 17.7 0,lO 9 293 23 , l 0,87 0.69
6* 20 0010 9 293 2400 0.90 0.70
7 15 0,107 5 468 20,O 0.68 0.82
8 17.7 0.107 5 468 21.7 0,72 0.78 9 20 0 . 107 5 468 22.9 0.74 0.77
*Reference case, preferred over Case 5 because of lower power dens i ty , lower v e l o c i t i e s , etc,
combination of key va r i ab le s was then determined from r e s u l t s l i s t e d i n
Table 6.5.
The numbers given i n Table 6.5 are p lo t t ed i n Fig, 6.1. The fue l c o s t
has a minimum somewhat below 0.7 mills/kwhre a t conversion r a t i o s ly ing be-
tween 0.85 and 0.9.
t h e loca t ion o f t h i s minimum over a wide range,
S l i g h t changes i n cos t assumptions, etc. could s h i f t
To t h e l e f t of t h e cost minimum, loss of neutrons t o f i s s i o n products
increases burnup c o s t s more r ap id ly than processing c o s t s decline; t o t h e
r i g h t t h e processing lo s ses outweigh t h e gain i n conversion. The extreme
i n t h e conversion r a t i o resu l t s from t h e fact t h a t processing l o s s e s in- crease l i n e a r l y with processing rate whereas loss of neutrons t o f i s s i o n
products decreases only inverse ly ,
The processing c o s t s used i n computing T a b l e 6.5 were those assoc ia ted
with a central Fluoride V o l a t i l i t y Plant (Sec, 5,2) but followed, where
appl icable , t h e p re sc r ip t ion given i n t h e - Guide (52).
time was 2 days f o r a l l of t h e cases l i s t e d ,
The "turn-around"

140
1.1
1.0
0.9
0.6
0- 5
0.4
0 Central Fluoride Volatility Processing
Reference Design Case
I 0 5 10
CONVERSION RATIO
Fig. 6.1. MSCR Fuel Cycle Cost Versus Conversion Ratio.

141
Table 6.5. Processing Variables
Case Cycle Time Volume Rate Weight Rate Conv. Fuel Cycle Cost days f t /day kg Th/day Ratio mills/kwhre
1 3000 0.83 27 0 . 835 0.71
2 2000 1.25 40 0 868 0.68
3* 1500 1.67 53 0.895 0.68
4 1250 2.00 64 0 e 904 0.70
5 1000 2.50 80 0 . 917 0.74
6 500 5.0 160 0.930 1.01
7 250 10.0 320 0.908 1.64
5CReference Design Case
6.5 Reference Design Reactor
The MSCR is capable of producing power a t a f u e l cycle cost , including
sa l t charges, of 0.7 mills/kwhre at a conversion r a t i o of 0.9, The most important uncertaint ies i n t h i s calculation arise i n connec-
t i on with (a) the behavior of xenon i n the core, (b) costs estimated f o r
t he Fluoride Vola t i l i ty processing plant , ( c ) va l id i ty of the base charges
assigned t o the materials and (d ) cost of packaging the spent f u e l f o r shipment.
cost assumptions i n Sec. 6.7,
reference design case are a t ta inable (and it should be possible t o achieve
the assumed performance by improving t h e graphite and the sparging process),
then a l l t he uncertainty\resides i n the processing cost . costs are only about 0.08 mills/kwhre (Table 6,101, even a large e r ro r would
not s ign i f icant ly influence the t o t a l fuel cycle cost .
The influence of xenon behavior is examined i n Sec. 606, and the
If the losses t o xenon assumed f o r t he
Since processing
Uncertainties i n regard t o technical f e a s i b i l i t y arise i n connection
with compatibility and s t a b i l i t y of the graphite moderator (Sec, 4,2.2), of the reac tor vessel and i ts in t e rna l s t ruc ture (Sec. 4.2.2Ie
hazards associated with the proposed methods of control (Sec. 4 ,2 ,3) have
not been evaluated.
Also, t he
L

142
6.5.1 Specifications
Case 3 was selected for the reference design before the complete curve was generated; its fuel cost is not significantly greater than the minimum. design are given in Section 4, nuclear data in Table 6.6.
The reactor characteristics and operating data for the reference
Table 6.6. Nuclear Characteristics of 1000 Mwe Molten Salt Converter Reactor
Case No. 3 Carbon/thorium atom ratio -300
Thorium/fissile uranium atom ratio -27
Fraction of fissions in thermal neutron group Fraction of fissions in 235u Fraction of fissions in 2 3 3 ~
‘ 0.82 ,0.15 0.85
Ratio of total fissions to fissions in 233U and 235U Mean eta of 233U Mean eta of 235U
1.0018
2.253 1 979
Mean eta of all fissions* Effective resonance integral of 232Th mermal cross section of 233~a
2.219 66 barns 39 barns
Effective resonance integral of 233Pa Average power density in core
900 barns 14.1 kw/liter
Ratio peak-to-radial average power density 2.1 Maximum graphite exposure rate, nvt/yr
c
Neutron energy X.1 MeV Neutron energy >1.0 MeV
5.0 X 10²¹ 1.8 X 10²¹
Average thermal flk Average fast flux
3.7 x 10¹³ 4.2 x 10¹³
Fissions per 235U atom added 9.2 Fissions per fissile atom processed Exposure, Mwd/tonne of thorium
1.5 47,000
Specific power, Mwt/kg fissile 0.9 ~~
233u *Neutrons produced from all sources per absorption in and 235U.
P

143
6.5.2 Neutron Ecdnomy
From Table 6.7, it is seen t h a t f i s s ions i n 232Th contribute very
l i t t l e t o neutron production. are appreciably less than those of 238U3 moreover, the fast f lux i n the
MSCR is not par t icu lar ly high (Table 6.6). Also, t he thorium is ra ther
d i lu t e compared t o concentrations customarily proposed f o r blankets,
The fast f i s s ion cross sect ions of thorium
The nuclear loss resu l t ing from absorptions i n Pa is appreciable but
It could be reduced by reducing fur ther the volume f rac t ion not serious.
of f u e l i n the core, but t h i s is already about as low (0,l) as seems tech- n i ca l ly feasible; a fur ther decrease would probably add more t o the fue l
cost i n terms of increased inventory charges (since concentration of tho-
rium and uranium i n the fue l stream would increase, while the external volume would remain the same) than would be saved i n terms of f u e l replace-
ment costs. Increasing the external volume i n order t o d i l u t e the Pa would
not be economical f o r t he same reason. The nuclear loss t o Pa could be reduced by removing the Pa rapidly
In from the c i rcu la t ing stream and holding it u n t i l it decays t o 233U. order t o be effect ive, such a process would have t o treat the e n t i r e f u e l stream for Pa removal i n a period not greater than ten days (mean l i€e of
Pa is about 40 days). Thus an extremely simple and e f f i c i en t process is required, as f o r example, the passage of the fue l stream through beds where
Pa is se lec t ive ly absorbed and retained u n t i l 233U is formed, which then desorbs i n t h e presence of large amounts of uranium i n solution.
process is presently known, although s q e work has been reported (19 p. 117,
74) on the precipi ta t ion of protactinium oxide from molten salt solut ions containing up t o 2000 ppm of ur or U O i "
appreciably and add W.01 un i t s t o the conversion ratio,
N o such
ium by contacting the melt with BeO, Thop,
Development of such a process might reduce the losses t o Pa
For reasons indicated i n Sec, 6.1, the concentration of 234U used i n \
the equilibrium calculation was av
Although the reactor was assumed t o be i n i t i a l l y fueled with enriched ura- nium containing 1.0% 234U and t o be supplied with make-up f u e l of the same
:composition, ninety-nine per cent of the 234U is formed by transmutation of 233U.
aged over a period of 30 years,
It disappears from the reac tor by transmutation t o 235U and l o s s i n

144
.
Table 6.7. Neutron Economya i n the 1000 Mwe Molten Sa l t Converter Reference Design Reactor
. Item Captures Fissions Absorptions
2321111
2 3 3 ~ a 2 3 3uC
’ 2 3 4 0
23 5u
2 3 6 ~
237Np 2 3811
Carrier sa l t Graphite
13 5 ~ e
Other f iss ion products
Corrosion products Delayed neutrons
Leakage
Neutron yielda
Processing losses
Net conversion ratio
b
d
0,8535
0.0084
0.0888
0.0572
0 . 0301 0 . 0184
0 . 0074
0 . 0029
0.0387
0 . 0564 0 . 0170’
0 0867
0.0082
0.0046
0 . 0513
0 . 0011
0.0000
0 7488
0.0002
0 . 1323
0 . 0001
-- 0 . 0000 --
-- -- -- _- _- --
0 . 8546
0 . 0084
0.8376
0 . 0574
0 1624
0 . OA85 0 . 0074
0.0029
0 . 0387 0.0564
0 . O m c
0.0867
0 . 0082
0 . 0046
0 . 0513
2 0 2121
0.005
0.90
Neutrons per neutron absorbed ‘in 233U and 235U0 a
Processing loss of O03%/pass for 233U and 235U, and b undecayed 233Pa.
Loss corresponding t o graphi e having gas porosity of 1% and diffusion coef f ic ien t of IOo‘ compared t o current graph- i t e properties of 10% and lo”.
dExcluding captures i n 238U and correcting for f i ss ions
C
of thorium.

I 145
the processing cycle (0.3% per pass). Since 23% is in fe r io r with respect
t o 233U as a nuclear fue l , it is advantageous t o keep the concentration of 234U as low as possible.
’
t h i s , inasmuch as the only menas of removing it is t o s e l l spent f u e l t o
However, the designer has l i t t l e control over
the AEC, and t h i s , as shown i n Sec. 6.8,3, is not advantageous.
t h i r t y years, s t a r t i n g with a clean reac tor containing no 236U.
case, the only source is capture of neutrons i n 235U; t he s inks are trans- mutation t o 237U (which decays promptly t o 237Np) and losses (0.3% per
pass) i n the processing cycle. over 236U is by varying the conversion r a t i o thus varying the amount of
235U fed t o the system, and by sale of spent fue l .
The concentration of 2 3 6 U used was a l so averaged over a period of In t h i s
The only e f fec t ive control the designer has
It is assumed t h a t 237Np was removed 100 per cent per pass through the
processing cycle,
conversion r a t i o ) ; however, special processing f o r t h i s reason does not appear t o be worthwhile, although it might be for other reasons.
Parasitic captures are appreciable (0.0074 uni t s on the
Parasitic captures i n carrier sal t resul ted i n a conversion loss of Of t h i s , captures i n 6 L i contributed 0,014 uni ts . 0,039 units.
Of sa l t used (99.995% 7 L i ) appears t o be about the best avai lable at attractive prices.
The grade
On the other hand, use of i n fe r io r grades would not
result i n lower f u e l costs.
The bes t way t o control losses t o 6 L i is t o recycle carrier s a l t from
processing instead of discarding it as w a s assumed i n the reference design. The p o s s i b i l i t i e s are examined i n Sec. 6.8, where it is shown t h a t about 0.01 uni t s might plausibly be saved on the conversion r a t i o , and about 0,08 m i l l s i n replacement
The fue l cost was opt t h respect t o p a r a s i t i c captures i n
moderator and neutron leakage simultaneously as described i n Sec. 6a4.
Losses t o graphite might be decreased by decreasing the C/Th r a t i o , but the
gain would be more than offset by losses i n eta of 233U and,increased
leakage.
is insensi t ive, as shown i n Table 6.4.
use of a graphite reflector were not successful (Appendix M ) , largely
because of the necessary presence of a fue l annulus a t least one inch thick
Leakage decreases slowly with increasing diameter, but f u e l cost
Efforts t o reduce t h e leakage by

146
at the periphery of t he core as a r e su l t of tolerance allowance for dif- f e r e n t i a l thermal expansion.
The estimate of the l o s s of neutrons t o xenon (0.017 un i t s on C.R.)
was based on an assumed diffusion coeff ic ient of
accessible t o gas of 1 , O per cent, and a sparging rate of 10 per cent (16-ft3/sec) of the c i rcu la t ing f u e l stream with 100 per cent removal of
xenon per pass (Sec. 6.8,2), The prospects are good f o r the development of grades of graphite t h a t would reduce the losses t o xenon i n the WSCR to no
cm2/seco, a porosity
,
more than 0,005 units on the conversion r a t io . ~
Captures i n samarium (149Sm and 151Sm) r e s u l t i n a loss of 0,013 un i t s
i n conversion r a t io . cept at very short cycle times of the order of days.
much prospect of reducing t h i s l o s s except by the application of some simple, rapid process similar t o t h a t suggested for 233Pa above.
This loss is independent of the processing rate ex- Thus, there is not
Captures i n other f i ss ion products can be controlled by varying the
processing rate. against increased processing cost. For the par t icu lar pr ice s t ruc ture and
nuclear properties assumed, the optimum rate of processing is 9 . 7 ft3/day
(53 kg of Th/day). captures i n other f ission products is 0.074 units.
it was assumed t h a t xenon is sparged as described above, noble metals are reduced by chromium i n metal structures t o the zero valence state and
The savings from grea te r fue l conversion must be balanced
The corresponding l o s s i n conversion r a t i o due t o
In t h i s calculat ion,
"plated out," and a l l other f i s s ion products are removed by passage thraugh
the processing cycle which, a t the costs estimated i n Sec. 5.1, optimized
a t a cycle time of %1500 days.
If the processing cost schedule (Sec, 3,2 and 5.1) were t o change i n
the direct ion of lower costs, t h e optimum processing rate would increase, and the f i s s ion product captures could be decreased.
ments and economies i n the Fluoride Vo la t i l i t y process are t o be expected,
the remote operations and maintenance cos ts of t h i s process are l i ke ly t o
remain high; therefore the process eventually used should be as simple as possible. The solut ion may l i e i n the d i rec t ion of d i s t i l l a t i o n or frac-
t i ona l c rys ta l l iza t ion (80, p, 80), or perhaps extraction with l iqu id
metals .
Although improve-

I
f
147
The estimated loss i n conversion r a t i o t o corrosion products was 0.006 uni t s ; a lo s s of 0.008 u n i t s was allowed i n the calculations (Sec. 6.3).
Since the concentration of corrosion products (Fe, N i , and C r ) i n the melt appears t o reach an equilibrium i n times t h a t are short compared t o the
processing cycle time, it seems unlikely t h a t the processing w i l l have much
influence on the concentrations of corrosion products, and the associated
loss of neutrons seems unavoidable,
6.5.3 Inventories and Processing Rates
,
It may be inferred from Table 6.8, Column 1, t h a t t he spec i f i c power
of the MSCR is 0,35 Mwe/kg fissile, which is comparable with many of the
advanced systems currently being put forward, Mwdt/tonne of thorium) is of the same order as t h a t of "competitive"
reactors ,
The exposure (about 40,000
Table 6.8. Inventories of Nuclear Materials -1000 Mwe Molten Sa l t Converter Reference Design Reactor
Material
Inventories, kg
Reactor Processing Total Plant
232Th 80,000 6500 86,500 3 ~ a 95.5 7.8 10 3
2 3 3 ~ 2110 17 2 2,282 484 39.6 524 234"
23 5 420 45* 465 2 3 6 ~ 682 56 738
-
NP 49 5 54 2 3 8 ~ 109 11 120
- 237
Sa l t 109,000 8,900 117,900 Fission products 4,400 360 4,760 Corrosion products 82 7 89
~~~ ~ ~~
*Including 10.6 kg i n reserve t o keep reac tor i n operation f o r 30 days after unscheduled interrupt ion of recycle from processing plant.

148 Is-
The processing rates given i n Table 6.9 are the amounts removed ,
dai ly from the circulat ing fue l stream. mulated f o r 116 days t o form a processing batch.
duct ac t iv i ty i n the material as processed corresponds t o an e f fec t ive
holding time of about 90 days (based on the Way-Wigner correlat ion as re- ported i n reference 55, p. 81).
thorium; t h i s is processed a t the rate of 1000 kg/day f o r uranium recovery,
taking 1\17 days t o process and two days for "turn-around."
These da i ly increments are accu- The average f i s s ion pro-
Thus, a process batch contains 6500 kg of
Table 6.9. Process and Make-up Rates -1000 Mwe Molten Sa l t Converter Reference Design Reactor
\
Rate, kg/day
Processing Make-up To Material
2 32Th
* 3 ~ a 233" 234u 23 5" 236u 237 238u NP
Sa l t
53.3 0,064 1 . 400 0 . 322 0.280 0.463 0 . 033 0.073 72.7
3.66
0 . 003 0 324
Fission products 2.94 Corrosion products 0.055
6 .5 .4 Fuel Cycle Cost
The f u e l cycle cost for the reference design reactor , which is near
optimum on the bases chosen, comes t o 0.68 mills/kwhre. given i n T a b l e 6.10.
A breakdown is
Inventory of fissile materials costs about 1/11 mills/kwhre, when
optimized with respect t o the processing rate. It could possibly be re-
duced at a given processing rate by improving the graphite t o reduce xenon
poisoning and by reducing the volume of fue l i n t he external heat transfer P
W - c i r c u i t at the expense of grea te r pumping power costs. c

149
Table 6.10. Fuel Cycle Cost -1000 Mwe Molten Sa l t Converter Reference Design Reactor with Sa l t Discard
Charges,* mills/kwhre
Inventory Replacement Processing Total Material
2 32m 2 3 3 ~ a 233u 23 5u
Total
Sa l t costs Total charges
0.03 0,Ol 0.18 0,04
0.26
0.06
-
0.04
0.16
0.20
0.08
- [0.08]
- 0.08
- 0.54
0,14 0.68
*Cost bases are given i n Sec. 3
Replacement cos ts f o r f issi le material a re most sens i t ive t o conver-
sion r a t io . Increasing t h i s from 0.90, as i n the reference design reactor ,
t o 0.95 would cut the cost i n ha l f , The increase i n conversion r a t i o might
be achieved by means discussed i n Sec. 6.7.3.
The inventory charge f o r sa l t is s t r i c t l y a function of the f u e l sa l t
The replacement cost depends on the processing rate, and was volume.
optimized.
the processing plant f o r recovering l i thium and beryllium.
A major improvement here would consis t of adding equipment i n
The f u e l cycle cost of 0.68 mills/kwhre estimated for the MSCR is con-
servat ively based on the scale-up of proven technology (including the pro-
cessing) with the following minor exceptions:
Technology of reac tor vessel design. 1. 2. Graphite technology,
3. Xenon sparging technology
These, however, are considered within the reach of current technology, i.e., no developmental break-throughs are required.
Although d i f f i c u l t problems i n gamma heating may be encountered i n t he
design of the reac tor vessel and its in t e rna l members, it appears t h a t
these can be solved. The problem i n r e l a t ion t o graphite is t o produce u

150
pieces of the size required t h a t are chemically compatible with fue l sa l t
and have porosity and permeability suitably.low with respect t o xenon ab- sorption (Sec. 6.8.2).
6,6 Parameter Studies
In t h i s section, the effect on the fuel cycle cost of various assump-
t i ons concerning the processing cost , and of several modes of processing are considered.
6.6.1 Processing Cost.as’Parameter
The fue l cycle cost reported i n Sec. 6.7 (Table 6.10) was based on the assumed use of a central Fluoride Vola t i l i ty f a c i l i t y requiring approxi- mately $20 million i n c a p i t a l investment and having an annual operating ex- pense of $2 mill ion (Table 5.7). In Sec. 5.4, t h i s estimate was compared
with other current estimates f o r s i m i l a r p lants and f o r Thorex p lan ts of comparable capacity. I n t h i s sect ion, t he processing plant c a p i t a l invest-
ment and the operating cost are considered as parameters, without regard t o the kind of plant. various processing rates of varying processing costs f o r a plant having a nominal capacity of 1000 kg Th/day (30 f t /day of reference design salt) was calculated. In all cases, the output of t he reac tor was accumulated
u n t i l a processing batch of about 6000 kg of Th was collected; t h i s was then shipped t o the processing plant and processed a t a rate of 1000 kg
Thlday.
corresponding t o da i ly charges of -$20,000 ‘ t o $60,000.
the conversion ratio range from 0.8 t o 0,9, the f u e l cycle cost is not very
sens i t ive t o the processing cost; i n t he reference design, the f u e l cycle cost does not exceed 0.85 mills/kuhre a t a da i ly charge of $40 thousand,
and only s l i g h t l y exceeds 1.0 mills/kwhre for a charge of $60 thousand. A t
$40 thousand, t h e minimum f u e l cycle cost is less than 0.8 mills/kwhre a t a
conversion ratio of about 0 .85 , and the cost remains below 1,O mills/kwhre
f o r conversion ratios up t o about 0.92,
The effect on the f u e l cycle cost of the MSCR a t
3
The turn-around time was assumed t o be 2 days, The r e s u l t s of t he calculat ion are presented i n Fig, 6.2. The curves
It is seen t h a t , i n

2.0
1.8
1.6
1.4
1.2
1.0
0.8
0.6
15 1
O m - D W G . 65-791
PX $60,000 daily ) I
$40,000
0.80
Fig. 6.2. MSCR
0.85 0.90
CONVERSION W T I O
Processing Cost Versus Conversion
0.95
Rat io.

152
. ,- w - I
It w a s concluded t h a t , on any reasonable cost basis , the optimum fue l
cycle cost for the MSCR w i l l not exceed 0.8 mills/kwhre, and t h a t conver- sion r a t i o s up t o 0.92 can be obtained at f u e l cycle cos ts not exceeding
1.0 mills/kwhre.
6.6.2 Effect of Xenon Removal
The so lub i l i t y of xenon i n LiF-BeF2 is very low (107); i n t he refer- ence design reactor the equilibrium pressure is about 0.06 atmospheres.
Xenon thus tends t o leave the sal t a t any phase boundary, moved rapidly by spraying a portion of the c i rcu la t ing stream i n t o a space
f i l l e d with helium o r by subsurface sparging. clinging t o the surface of t he graphite moderator, and it w i l l tend t o diffuse i n t o pores i n the graphite, including pores inaccessible t o the salt. Xenon is also removed from the system by decay t o 135Cs and by react ion with neutrons t o form Ij6Xe, which is s t ab le and has a l o w neutron capture cross section.
It can be re-
It may form microbubbles
Xenon poisoning i n the MSCR was calculated by the method of Watson and
Evans (1071, as shown i n Appendix G. The important physical propert ies are the porosity, e, of the graphite ( f ract ion of graphite volume accessible t o
xenon) and the d i f fus iv i ty of xenon, D (cm2/sec), t he diameter of the graphite logs, the f u e l c i rcu la t ion rate, and the
sparging fract ion, r, ( f rac t ion of c i rcu la t ing stream sparged o r sprayed t o removed xenon).
eter, and the c i rcu la t ion rate is 160 ft3/sec,
The key var iables are
In the reference design, the logs are s i x inches i n diam-
In the reference design reactor , a gas-accessible porosity of 0,Ol and
a diffusion coeff ic ient of
would r e s u l t i n a tolerable xenon poison f rac t ion of 0,017 neutrons per
neutron absorbed by fissile atoms. order of magnitude smaller than those of current ly avai lable graphite where
e = 0.1 and I) = 10”; however, the assumed values are both presently a t ta in-
able i n small pieces of graphite (107) and the control of xenon poisoning i n the MSCR appears t o l i e within the reach of developing technology.
with a sparging fract ion of 0,1 (16 ft3/sec),
These physical property values are an
The conversion ra t io increases and the f u e l cycle cost decreases with II
decreasing xenon poisoning, T a b l e 6.11 compares the calculated r e s u l t s f o r U

15 3
T a b l e 6.11. Effect of Graphite Properties and Sparge Rate -L u on Performance of 1000 Mwe Molten Sa l t Converter Reactor
. . . . _ _ -~~~
Conve r s ion Fuel Cycle Cost Ratio mills/kwhre Case Xe P,F.
a 0.054 0.84 0.79
b 0 . 045 (O.86)* (0.77 )*
C 0.017 d 0 0 001
0.90
0,92
0.68
0.66
*Interpolated
three cases: (a) with no sparging; (b) available graphite with eD = Reference Design Reactor with eD = lo'* ant? r-=- O-.l; (d) "impermeable"
case, with a very porous graphite (say AGOT) and
and r = 0.1; (c)
graphite with eD = 0 and r = 0.1.
b e t t e r than the llworstll graphite (Case a), nevertheless, the fue l cycle
cost is only 0.1 mill/kwhre higher than f o r "impermeable" graphite (Case d). It is concluded t h a t the fue l cost is not very sens i t ive t o xenon poison-
ing, t h a t it w i l l be less than 0 ,8 mills/kwhre, with avai lable graphite, and t h a t with modest improvements over avai lable graphite (to e of 0.01 and D of lO"), the fuel cost w i l l be not more t
6.6 .3
It is seen t h a t while available graphite (Case b) is not s ign i f icant ly
Effect of Product Sale Without Recycle
A t least two benef i t s accrue from the sale of recovered fissile iso- topes (as UF6) t o the AEC: radioactive and could be compounded with f resh sa l t i n a d i r ec t ly main-
ta ined and operated f a c i l i t y ; (b) t he reactor would tend t o be purged of
236U.
w i l l eventually capture a neutron i n some reac tor somewhere, and therefore
reduces the value of the recovered isotopes by an appropriate amount.
(a) Make-up f u e l (235U) would then be non-
The second benefi t is r e a l l y i l lusory , inasmuch as the 236U prdduced
On the other hand a penalty is incurred i n t h a t 233U, a superior f u e l i n thermal reactors , is a l so l o s t from the system.
the penal t ies outweigh the advantages considerably.
A s seen i n Table,6.12, W

154
Table 6;12. Effect of Sale of Spent Fuel on MSCR Performance
Cas e A B
Spent f u e l is . Recycled
Absorptions i n 23%~ 0,0185
Mean Eta 2.21
Conversion Ratio 0090
Fuel Cycle Cost, mills/kwhre
Inventory Charges 0.32
Replacement Charges 0028
Processing Charges 0.08 Production Credit e- -
N e t Fuel Cost, mills/kwhre 0.68
Sold
0 0105
2011
0.82
0036
1.38
0.08
0.53
1.29 -
6.7 Alternative Design and Cost Eases
6.7.1 Thorex Processing Cost Estimates
The preferred method of processing MSCR fue l is by f luorinat ion
(Sec. 5.2) , mainly because t h e processing can conveniently be integrated
with the reactor and thus achieve very l o w f u e l cycle costs , However, f o r
one reason or another, it may be desirable t o process the spent f u e l from
the first MSCR ins t a l l a t ions i n a central Thorex f a c i l i t y .
t he f a c i l i t y specif ied i n t he Guide t o Nuclear Power Cost Evaluation (52,
104) was modified appropriately as described i n Sec. 5.3 t o handle MSCR
fuel. treatment was made.
The turn-around time was eight days and the shipping charge was $17/kg for
Accordingly,
An allowance of $500,000 addi t ional c a p i t a l cost f o r t he head-end
Costs w e r e calculated on the bases given i n the Guide.
round t r i p . The assumed loss of f iss i le material was 1.3 per cent/pass. The fue l cycle costs for the reference design reac tor (Tables 6,6
through 6.10) were recomputed using a cost schedule estimated f r o m the - Guide (521, as shown i n Table 6,13, where they &e compared t o correspond-
ing r e s u l t s f o r cen t r a l Floride Vola t i l i ty processing (Sec. 5.2).

15 5
Table 6.13. Effect of Processing Method 'on Fuel Cycle Cost
Central Central Fluoride Thorex Vola t i l i ty
Processing cost , $/kg Th 75,2 44.8
Processing losses , per cent/pass 1 . 3 0 0 3
Conversion Ratio 0.89 0.90
Fuel cycle cost , mills/kwh
Inventory charges 0 0 3 3 0 0 3 2
Replacement charges Oa24 0 .28
Processing charges 0.17 0 0 0 8
Total, mills/kwh 0,74 0.68 - -
Thus, even though processed through the AEC reference plant , the costs of which appear t o be conservatively high, the f u e l cycle cost f o r the re f -
erence design MSCR w i l l not exceed 0,75 mills/kwh, . .. .. .. .. .
6 . 7 . 2 .Redctd~-Integrated.Fluoride Vola t i l i ty Processing
Several advantages can be real ized by integrat ing the pmcessing with ". reac tor operations. The pr inc ipa l saving resul ts from sharing reac tor shielding and remote maintenance equipment. i t i e s and personnel are also-important. ceiving facil i t ies are eliminated,
lay of about $25 million and would need t o service f i f t e e n to twenty
1000 Mwe MSCR's i n order t o achieve the un i t processing costs estimated i n
Section 5.2.
the uni t processing cost w i l l be, of course, independent of t he number of
reactors i n useo
Savings i n laboratory facil-
Shipping cos ts and associated re-
3 A 30 f t /day central f luor ide v o l a t i l i t y plant requires a cap i t a l out-
An integrated plant requires a much smaller investment and
An integrated f a c i l i t y should be designed for continuous flow process-
ing, a t least i n the f l u o r h a t o r and the UF6 reduction reactor , i n order t h a t the equipment and the volume of fuel-sal t held up might both be small.

f
156
6.7.3 Reactor-1ntegrated.Pecipitation Process
3 A t a processing rate of 1.7 f t /day, the concentration of rare ear th f luorides i n the fuel salt w i l l be approximately 0.5 mole per cent, which
is perhaps s l i g h t l y i n excess of t he so lub i l i t y l i m i t a t the minimum f u e l temperature of llOO°Fo
rare ear ths f i ss ion products from the MSCR f u e l stream by f r ac t iona l crys-
t a l l i z a t i o n -an extremely a t t r a c t i v e poss ib i l i ty , for such a process could conveniently be carr ied out i n the reac tor cel l and closely integrated with
the reactor system, only the t r ans fe r of l iqu ids and heat, and is the re fo re inherently safe and
This suggests t h a t it may be possible t o remove
The s teps involved are exceedingly simple, involving
economical. The f i s s ion product neutron poisoning estimated for the reference de-
s ign can be approximately matched by charging every day f ive cubic feet of f u e l s a l t containing 0.5 mole per cent rare ear th thorides t o a crystal- lizer. The salt is cooled t o 900°F, which is 13OF above the temperature a t which s o l i d solutions containing Th or U separate. A t t h i s temperature, the so lub i l i t y of t he rare ear th f luorides is 0.2 mole per cent or less, judging from the data of Ward e t a l , , (108, 106). Thus about 60 per cent of the rare ear ths w i l l p rec ip i ta te or l'freeze'l on the walls of the crys-
t a l l i z e r . f u e l salt is returned t o the reactor system, the f i s s ion products are dis-
solved i n f lush salt
The t o t a l mass of the so l id s w i l l be only 6-8 kg. After the
The process described should e f fec t ive ly remove rare ear ths from the
f u e l salt. cellaneous other metals,
It w i l l not remove alkali metals, a lkal ine ear ths , and m i s - These w i l l accumulate i n the fuel , but t h e i r in-
. growth can be p a r t i a l l y compensated by operating the freeze-process a t a s l i g h t l y more rapid rate and maintaining the rare ear th concentration at say 0.45 mole per cent or by discarding barren fue l - sa l t i n a 1500 day
cycle . 608 Evolution of a Self-sustaining MSCR
r
Although t h e MSCR concept may not have the capabi l i ty of evolving i n t o L J a breeder reactor (see Sec. 7.1) having a doubling t i m e less than 25 years,

157
t he poss ib i l i t y exists, however, t h a t it could, without increase i n power costs , achieve a net conversion r a t i o s l i g h t l y grea te r than unity, and thus become self-sustaining and independent of outside supplies of f iss i le isotopes,
discussed below,,
Conditions under which t h i s might be achieved are l i s t e d and
6.8.1 Reduction of Leakage
With the advent of separated 92M0, it becomes feas ib le t o surround the
core of the MSCR with a t h i n blanket of high-density thorium sal t (25% ThF,,,
75% LiF).
c i rcu la ted slowly through 6-inch diameter molybdenum tubes replacing the
outer two layers of graphite moderator logs, and replacing 1-ft end sec-
t i ons of the central logs. 2200 m / s cross sect ion of 6 millibarns.
This salt , having a l iquidus temperature below llOO°F, could be
The isotope 92M0 is a magic nuclide, having a The epithermal cross sect ion is
current ly being measured a t OWL, and preliminary r e su l t s indicate t h a t the resonance in t eg ra l is a l so very small. capture only a negl igible f rac t ion of neutrons.
Thus, s t r u c t u r a l molybdenum should
It would be necessary t o remove the bred 233U rapidly from the fe r t i l e
stream f o r two reasons: ( a ) f i s s ions i n the fe r t i l e stream would tend t o
increase the leakage, (b) f i ss ion products i n the f e r t i l e stream would capture neutrons.
nation, the concentration of 233U could be kept very low, f i s s ions would be suppressed, the inventory charge for 233U would be largely avoided. The fe r t i l e stream carrier salt could be recycled without fu r the r treatment.
The rap id i ty of the processing, however, implies the use of an on-site, reactor-integrated f a c i l i t y such as t h a t described i n Sec. 6.9.2,
If the fer t i le stream were processed rapidly by f luori-
,
By t h i s means perhaps half the leakage neutrons could be saved, adding *Out 0.025 un i t s t o the conversion ratio.
6.8,2 Reduction 'of Xenon 'Captures i
In the reference design, graphite propert ies an order of magnitude b e t t e r than those cha rac t e r i s t i c of current graphites were assumed, resu l t -
ing i n a loss i n conversion ra t io due t o captures i n 135Xe absorbed i n the graphite of only 0.017 units. By fur ther improvements (e.g., by spraying a
t h i n coating of 92M0 on the moderator logs and carburizing t o prevent xenon
LiJ
- - I

,
15 8
from penetrating the moderator) perhaps another 0.01 uni t s on the con- version r a t i o could be saved.
6.8.3 Reduction of Fissfon.Product Poisoning
Somewhat over 0.085 un i t s were l o s t from the conversion ra t io as a r e s u l t of captures i n f i s s ion products i n the reference design ( T a b l e 6.7).
The processing cost i n a cen t r a l Fluoride Vola t i l i ty f a c i l i t y was about 0.08 mills/kwhr,
HF-Solution f a c i l i t y were used (Sec. 2.2,14), the rate of removal of rare
ear ths could be increased perhaps by a fac to r of 10, Solubles ( C s , Ba, etc.) could be purged by discarding sa l t i n a 1500 day cycle, as i n t h e
reference design. f i s s ion products could be reduced t o about 0,010 uni ts .
If an on-site, reactor-integrated Fluoride Vo la t i l i t y and
If t h i s were done, t he loss of conversion ra t io t o
6.8.4 Improvement of Mean 'Eta and Reduction of 236U Captures
Other than by varying the C/Th r a t i o , t he designer has no direct con- t r o l over these. Nevertheless, t he above improvements i n neutron economy have an effect on the conversion ratio t h a t is grea te r than t h e i r cumula- t i v e sum, f o r 233U is superior t o 235U i n respect t o neutron production, and moreover yields a f e r t i l e isotope (234U) upon capture of a neutron. An increase i n r e l a t i v e concentration of 233U by any means increases the
number of neutrons avai lable for breeding, and reduction of 235U feed rate r e s u l t s i n a decrease i n 236U concentration,
The above l i s t e d improvements should r e s u l t i n an increase i n eta of 0.01 un i t s and a reduction of captures i n 236U by 0.01 un i t s , a t least.
6,8.5 Ultimate Bree g 'Poten t ia1 of MSCR . f . . . . . . . .
The conversion r a t i o i n the reference design is about 0,900 With _. improvements l i s t e d above, conversions s l i g h t l y i n excess of 1,O may be
achieved, as shown i n Table 60140 .- .
Thus, t he MSCR may be capable of evolving stepwise i n t o an economidal, self-sustaining breeder reac tor with f u e l cycle cos ts probably i n t h e range of 0.7 - 1 , O mills/kwhre.
It should be emphasized t h a t the l imit ing conversion ra t io estimated
It has been f o r - t h e MSCR does not apply t o molten salt breeder reactors ,
. c.
w -

i 15 9
Table 6.14. Ultimate Breeding Potent ia l of Molten Sa l t Converter Concept
Conversion r a t i o i n reference design 0.90
Savings due to:
Reduct ion i n leakage 0,025
Reduction i n xenon captures 0,010
Improvement i n eta and reduction of captures i n 236U Reduction of f i s s ion product captures 0 . 075
0.020 7
Ultimate conversion r a t i o 1.03
shown ( 3 1 t h a t two-region, two-fluid, thermal reactors optimized with respect t o breeding are capable of achieving doubling times of 25 years or less, (See also Sec. 1.7.) In addition, the advent af s t ruc tu ra l 92M0
makes possible, i n principle, . the design of two-region, two-fluid, fast molten-salt reactors which may have doubling times as short as t en years,
which w i l l not need t o use separated 6 L i i n t he carrier salt, and which therefore may be processed economically by f luorinat ion only.

,
160
7. MSCR CAPITAL INVESTMENT, FIXED CHARGES, AND OPERATING EXPENSE
. h
W 8
7.1 Introduction
The equipment, auxi l ia r ies , and auxi l iary services described i n Sec, 4
were costed f o r ORNL by Sargent and Lundy Engineers of Chicago, I l l i n o i s
(95, 96). and building cost estimates were made.
i n the referenced reports ,
Equipment arrangement drawings su f f i c i en t for piping take-offs
Details of these s tud ies are given
. . . . .
7.2 .Summar?y'of MSCR Capital Investment
In T a b l e 7.1 are l i s t e d the pr incipal i t e m s of cost i n t h e MSCR ref-
The account erence design.
numbers correspond, where applicable, t o t he AEC systems of accounts given
i n The Guide t o Nuclear'Power Cost Evaluation (52).
A de ta i led breakdown is given i n Appendix No
Table 7.1. 1000 Mwe Molten Sa l t Converter Reactor Capital Investment
Fission energy release rate, Mwt Net station power Gross s t a t i o n power Stat ion eff ic iency Heat rate Plant factor Total c a p i t a l investment
Direct Construction Costs
2 1 Structures and Improvements
2U. Improvements t o s i t e 212 Buildings 218 Stacks
Reactor Container
Total Account 2 1
2500 Mwt 1038 Mwe 1083 Mwe 41,5% 8220 Btu/kwhr 0.8 $143/kwe
$ 501,500 5,465,450
31,000
(Included i n 212)
(5,997,950)
.- Lid-
*
c

161
i
V ' i
Table 7.1, Continued
22 Reactor P l a n t '
221 Reactor equipment 222 Heat transfer system 223 Fuel f a b r i c a t i o n and handling system 224 Fuel processing system waste d i s p o s a l 225 Low-level r a d i o a c t i v e waste d i s p o s a l 226 Instrumentat ion and controls 227 Feed water supply 228 229 Other r e a c t o r equipment
Steam, condensate, and water p ip ing
Total Account 22
23 Energy Conversion System
231 Turbo-generator un i t 232 C i rcu la t ing water system 233 Condensers and auxiliaries 234 Central lubrication system 235 236 Turbine plant p ip ing 237 Auxi l ia ry equipment f o r genera tors 238 Other equipment
Turbine p l a n t instruments E con t ro l s
Total Account 23
24 Accessory Electrical Equipment
241 Switchgear 242 Switchboards 243 P ro tec t ion equipment 244 Electrical structures 245 Conduit 246 Power and control wir ing 247 S t a t i o n service equipment
Total Account 24
$ 8,823,300 23,609,700
1,517,200
361,150
4,939,500 7,925,000 3,048,500
(51,324,350)
(Not inc luded)
1,100,000
21,495,000 1,644,200 3,104,900
36,000 426,000
137,000
26,843,700
(Included i n 228)
( Included i n 228)
637,400 286,000 131,600 213,200
2,281,900 615,000
4,375,300
210,200
25 Miscellaneous P lan t Equipment
251 Cranes and h o i s t s 252 253 Other
A i r compressors and vacuum pumps
Total Account 25
Total Direct Construction Cost
I n d i r e c t Construct ion Costs
Construction overhead (20% of d i r e c t l a b o r ) General and adminis t ra t ion (2,5% of d i r e c t c o s t s )
Sub to ta l
195,000 64,900
540,000
799,900
89,341,200
2,333,300 5,775,500
(97,450,000)

-
162
Table 7.1. Continued . . . . . . . .
Miscellaneous costs (1.2% of subto ta l ) Sub t o t a1
Engineering Dssign and Inspection Architect-engineers (11.1% of subto ta l ) Subtotal Nuclear engineers (3.8% of subtotal) Start-up expense (35% annual O&M expense)
Subtotal Land and land r igh t s
Contingency (10% of subto ta l ) Sub t o t a l
In t e re s t during construction (9.4% of subto ta l ) Total Indirect Construction Costs
Total Construction Costs Intermediate Coolant- Salt Inventory* TOTAL MSCR CAPITAL INVESTMENT
$ 974 , 500 (98,424,500)
-.
9.
n
w *
10,925,000 (109 , 349 , 500 )
4,155,300 746,900 360,000
(114,611,700)
11,461,200 (126,O72,900)
11,850,900 48,582,600
137,923,800 10,951,800
$ $48 , 875,600
*Including in t e re s t during s t a r tup
7.3 MSCR Fixed Charges c
The fixed charges were computed i n accordance with the ins t ruc t ions i n The Guide t o Nuclear Power Cost Evaluation, Vol. 5, Production Costs, page 510-2 (52), for an investor-owned public u t i l i t y , and are shown i n Tables 7.2 and 7.3.

163
Table 7.2. Nation-Wide .Approximated Fixed Charge Rates
Percent P e r Year
Depreciating Non-Depreciating
@of i t on investment Depreciation (30-yr sinking fuqd) Interim replacements
Property insurance Federal income taxes Sta te and loca l taxes
Total
6,75
1.11
0.35
0.40
3.40
2.45
6.75 -- -- 0.40
3,40
2.45
14 46 13,OO
Table 7,3. 1000 Mwe Molten Sa l t Converter Reactor Fixed Charges
Item Rate Annual Expense Power Cost
Investment %/yr S/yr Mills/kwhre
Depreciating c a p i t a l 137,600,000 14.46 19,950,000 2.74
Non-depreciating cap i t a l
1 , 530,000 0.21 450,000
340,000 0.05
21,820,000 3.0
Land, etc. 360,000 13.0 Coolant Working c a p i t a l
Nuclear insurance ..-- Annual fixed charges
164
... r..............
7.4 MSCR Operating'and-Maintenance Cost Estimate
The MSCR is a s ingle reactor, s ing le turbine plant , and, although its I
power generation capacity is high, i ts manpower requirements are r e l a t ive ly
low because of the s ing le u n i t operation, a cost of $872,000 per year,
Plant personnel t o t a l s 1 0 1 with Materials cost $220,000, Maintenance, in-
cluding provision f o r periodic equipment overhaul , spec ia l services pro- vided by off-site personnel and organizations, t o t a l s $800,000, With an
allowance of 14 percent for cen t r a l office expense, the t o t a l cost is $2,154,000 or 0,30 m/kwh, 'The Guide t o Nuclear Power Cost Evaluation (52)
criteria were followed where applicable i n determining plant organization.
7,4,1 Labor and Materlals . I
The manpower requirements of the 1000-Mwe MSCR plant are shown i n Table 7.4 for operations and general supervision.
plant may require fewer people, par t icu lar ly on the technical staff,
view of reactor plant personnel requirements developed by Sargent and Lundy
(941, and Kaiser Engineers (51) f o r 300 Mwe (ne t ) p lan ts are compared i n T a b l e 7.4 f o r s ing le un i t systems.
Routine operation of the , . Re-
In pract ice , t he actual d is t r ibu t ion of manpower may s h i f t , but t he For example, one t o t a l labor cost should remain approximately as shown.
storekeeper may be insuf f ic ien t , i n which case an engineering a s s i s t an t or maintenance mechanic helper might be replaced by a s to re s c lerk,
In general, the turbine room operation includes, i n addition t o the .)
turbo-generator proper, (a) water supply and disposal systems, e o g o , sani- t a ry service, t r ea t ed and c i rcu la t ing water systems, (b) bo i l e r feed
systems which include bo i l e r feed pumps, steam c i rcu la tors , and Loeffler
.
boi le rs , and (c) the turbine aux i l i a r i e s , e ,go , lubricat ing o i l systems,
l iqu id and gas coolant systems, and instrument and compressed a i r systems. The reactor operation includes (a) salt charging systems, (b) salt with-
drawal systems, (c) salt shipping facil i t ies, (d) l iqu id and gaseous waste disposal systems, and (e) pressurized gas supply and treatment systems,
These faci l i t ies are s t a f f ed on a semi-automated basis ; f o r f u l l y automated
operation, t h e manpower requirements would be less.
.-. u-
f

16 5
Table 7.4. Personnel Requirement Estimates
Sargent & Lundy Kaiser AEC Guide MSCR 150 MW - 350 MW 300 MW 300 Mw(PWR) 1000 MW
P lan t Management, Office & Stores
Operating Dspt
Technical S t a f f
Maintenance Dept e
Total
9 4,
47 32-39 26 6
20 13 - - 95 62-69
4 7
36 49
6 16
29 13
59 101 - -
7.4.2. Operation and Maintenance Cost
The estimate of $2,154,000 shown i n Table 7.5 does not t a k e i n t o
account any unforeseen d i f f i c u l t i e s and expenses t h a t may be encountered
i n t h e MSCR.
for maintaining a rad ioac t ive molten s a l t system are greater than estimated - poss ib ly by as much as a f a c t o r of th ree ,
It may well be t h a t requirements f o r personnel and equipment
This cannot be accura te ly
determined u n t i l maintenance procedures have been more c l e a r l y defined and
t h e r e a c t o r p l an t designed i n greater d e t a i l than was poss ib le i n t h e
present study.
Based on 1038 Mwe net and a p l a n t f a c t o r of 0.8, t h e cont r ibu t ion t o the power cost is 0,3 mills/kwhre.
T a b l e 7.5. 1000 Mwe MSCR Annual Operating and Maintenance Expense
Salary or Personnel Annual Wage Rate Required Expense
Wages E S a l a r i e s
P lan t Management
S ta t ion Supt ., $ 15,00O/yr 1 $ 15,000
Clerk-Steno 2,50/hr 1 5,200
Clerk-Steno 2 50/hr 1 5,200
7 59,000
Ass ' t Supt , 12 ,OOO/yr 2 24,000
Clerk-Typist 2 31/hr 2 9,600 -

166
t
A
1
Table 7.5. Continued . . . . . . . .
Salary or Personnel Annual Wage Rate Required Expense
+(L) Denotes l icensed r e a c t o r operator.
Technical S t a f f
Supv. Eng. (L)* $ Nuclear Eng. (L) Engineer Health Physics Supv. Eng. A s s ' t . Lab Technician Radiation Protection
Operating S t a f f S h i f t Supto (L) Senior Control oper. (L) Control Qer. (L) Turbine Oper. Equipment Attendant Spec ia l Operator (L) Janitor Watchman
Maintenance S t a f f
Maintenance Supt. Foreman Instrument Mechanic Electrician Pipe Fitter-Welder Machin is t Mechanic Helper
Total Labor
Fringe Benefits at 20%
To ta l Wages & S a l a r i e s
Materials for Routine Operations
O i l Supply Gas Supply Treated Water Coolant S a l t Make-up Office Supplies Laboratory Supplies & Chem.
11,00O/yr 9,60O/yr 8,400/yr 8,40O/yr 6,00O/yr
2.85/hr 3 25/hr
10,80O/yr 3 . 7 5 /hr 3.65/hr 3 . SO/hr 3 . OO/hr 3.50/hr 2,25/hr 2 25/hr
10,80O/yr 7 ,SOO/yr
3.25/hr 3.25/hr 3.25/hr 3 . 25/hr 3 . 25/hr 2 . 65/hr
1 1 3 1 3 5 2
16 - 5 6 4
10 8 9 2 5
49
1 3 6 5 2 2 8 2
29
101
-
-
$ 11,000 9,600 25,200
8,400 18,000 29,700 13,500
115,400
54,000 46,800 30,400 72,800 50,000 65,500
9,400 23,400
352,300
10,800 22,500 40,600 33,800 13,500 13,500 54,100 11,100
200,000
725,700
145,300
872,000
84,000 4,000
40,000 2,000
15,000 5,000
P
f
-. W--
0

167
T a b l e 7.5. Continued ~ ~~
Salary or Personnel Annual Wage Rate Required Expense
Miscellaneous (e.g., r ad ia t ion
Consulting Services
Subto ta l Contingency
Tota l Materials
pro tec t ion , c lo th ing E equip.
Maintenance Turbine & t u rb ine a u x i l i a r i e s
r o u t i n e maintenance materials Reactor E r e a c t o r a u x i l i a r i e s
rou t ine maintenance materials Turbine 3-yr overhaul (p ro ra t a ) Turbine system auxiliaries overhaul Reactor system overhaul Reactor auxiliaries overhaul
Subto ta l
Contingency Tota l Maintenance
Cent ra l Office, General E Admin, Expenses at 14 Percent Grand Tota l Operating E Maintenance Expense
,
$ 50,000
10,000
210,000
10,000
220,000
150,000
300,000
50,000
100,000 50,000
100,000
50,000
700,000
800,000
262,000
$2,154,000

168
8. RESULTS AND CONCLUSIONS
The cost of electric power is commonly resolved i n t o three components:
The fue l cost , the fixed charges, and operation and maintenance expense.
8 ,1 Fuel Cost
As shown i n Sec. 6, t he fuel cycle cost i n the MSCR ranges from
2 mills/kwhr (electrical) down t o 0.7 depending on the conversion r a t i o
desired and the method and/or cost of processing assumed. For present pur-
poses, the minimum cost associated with the reference design reac tor summa- r ized i n Table 6.6 was selected as representative,
term" and predicated on the scale-up of current technology with the ex- ception of the moderator graphite, which was an order of magnitude b e t t e r than current ly available. graphite i n respect t o porosity and permeability.
The f u e l cycle cost , using Fluoride Vola t i l i ty processing i n a central plant with discard of carrier salt and contained thorium and recycle of
isotopes of uranium, was reported i n Sec. 6.7,l.
This reactor is "near-
Table 8.1 1000 Mwe Molten Sa l t Converter , .Reactor Fuel Cycle Cost
Item Mills/kwhr ~~
Inventories
F e r t i l e Fissile Sa l t
Replacement
F e r t i l e F i s s i l e (95% 235U) Sa l t
Reprocessing
Total, mills/kwhr
0.03 - 0.23 - 0.06 0.32
0,04 - 0.16 - O,O8 0.28
0.08 0.08
0.68 -

169
8.2 . Fixed ' Charges
The c a p i t a l investment f o r t h e 1000 Mwe (1038 Mwe n e t ) s t a t i o n was
est imated by Sargent and Lundy, Engineers from information suppl ied by
OWL, as reported i n Sec, 7, and summarized i n Table 7.1. comprised $137,564,000 for deprec ia t ing c a p i t a l items, and $11,311,800 for
non-depreciating items (coolant s a l t and land) .
are included i n f u e l cyc le cost,
The investment
Fuel s a l t f ixed charges
Working c a p i t a l was estimated according t o t h e p re sc r ip t ion given i n
t h e Guide (521, and is shown i n Table 8.2. - Table 8,2, 1000 Mwe MSCR Working Cap i t a l
1. $ 200,000
2. 25% of annual maintenance and materials: 250,000 Total Working Cap i t a l $ 450,000
2.7% of annual opera t ing labor and f u e l cos ts :
S imi la r ly , t h e nuc lear hazard insurance premium was est imated by
p resc r ip t ion at $340,000 pe r year.
Table 8.3.
The f ixed charges are co l l ec t ed i n
Table 8.3, 1000 Mwe Molten S a l t Converter Reactor Fixed Charges
Item Rate Annual Expense Power Cost Mi l l s /kwhr %/yr S/yr
Investment
Depreciating c a p i t a l 137,600,000 14.46 19,950,000 2.74
Non-depreciating c a p i t a l 11,760,000 1 3 , O 1,530,000 0.21
Nuclear insurance 340,000 0.05 3,O Annual f ixed charges 21,820,000

170
8.3 Operation .and 'Maintenance Expense
This expense was estimated i n Sec, 7,2 and amounted t o $2,154,000 per year, of which $1,020,000 was f o r maintenance and materials and the rest
was f o r labor, supervision, and management, bution t o the power cost is 0.3 mills/kwhr (electrical),
A t 1038 Mwe net , the contri-
8.4 .Cost of Power
The three components of the power cost are assembled i n T a b l e 8.4.
T a b l e 8*&. Cost of Power i n a 1000 Mwe Molten Sa l t Converter Reactor
Item Mills /Kwhr
Fuel cycle cost 0.7
Fixed charges 3.0
0.3
Cost of power, mills/Kwhr 400 Operation and maintenance -
In regard t o the f u e l cycle cost , it was shown i n Sec. 608 t h a t t h i s would not exceed 1.0 mill/kwhr even though the f u e l were processed i n a 1.0 tonne/day Thorex plant costing up t o $60 thousand per day t o operate. Such a general purpose plant could provide processing of f u e l from thorium
reactors having a t o t a l power capabi l i ty of about 20,000 Mwe at an exposure of 50,000 Mwd/tonne ,
The energy conversion system, accessory electrical equipment, and miscellaneous plant equipment (Items 23, 24, and 25 i n Table 7.1) are con- ventional items, and the estimation of t h e i r cost appears t o be r e l a t ive ly
unambiguous. t a in ty .
i t e m is $11 mill ion,
Items 2 1 and 22 are perhaps subject t o considerable uncer- - - W
But t h e i r to ta l is only about $57 mill ion, whereas t h e contingency
However, the poss ib i l i t y e x i s t s t h a t Item 21 was .

I
171
grossly underestimated, or t h a t the effect of radiat ion shielding require-
ments on building costs was underestimated,
$18 mill ion ( fac tor of 31, and allowing another $5 mill ion f o r the reac tor plant ( l o % ) , the investment comes t o $166/kw, and the fixed charges t o 3.5 mills/kwhr, as an upper l i m i t .
Supposing Item 2 1 t o be
Provision f o r labor i n Sec. 7.2 seems adequate, Materials and supplies
accounted for about ha l f the operation and maintenance costs ; i f t h i s were doubled, the contribution t o the cost of power would be about 0.5 mills/kwhr.
Collecting these probable upper l i m i t s on the cost of power i n the MSCR, t h e sum is 5.0 mills/kwhr.
8.5 Breeding Potent ia l of t he MSCR
The nuclear capabi l i ty of the reference design MSCR is summarized i n
Fig, 8.1. cycle cost is about 0.7 mill/kwhr and the conversion ra t io about 0.9 a t a
processing cycle time of 1500 days,
version r a t i o t o perhaps as high as 0.93, but the f u e l cost rises steeply.
Fluoride Vola t i l i ty f a c i l i t y would increase the fue l cost by only 0.1
mill/kwhr i n the 1000 Mwe s t a t ion ,
With cent ra l Fluoride Vola t i l i ty processing, the minimum fue l
Increasing the rate increases the con-
The use of an on-site reactor-integrated ( inside the reac tor cel l )
The use of an on-site reactor-integrated precipi ta t ion process f o r
By taking advantage of po ten t ia l improvements i n neutron economy (but removing rare ear ths might reduce the fue l cost below 0.5 mills/kwhr,
re ta ining the e s sen t i a l features of the MSCR) an upper l i m i t on the con- version r a t i o of 1,03 was estimated.
t he MSCR is capable of evolving i n t o a self-sustaining reactor requiring only thorium feed,
This was interpreted t o mean t h a t
Outside source of f issi le isotopes would not be needed.
This l imi ta t ion does not apply t o two-region breeders, which were
shown previously t o b capable of doubling times as short as 25 years (1).

1. I
le0
0.9
0.0
0.7
0.6
0.5
014
0.0
172
ORNL- LR- DWG 76712
I I Q: 0
#
b
I I
Symbols 0 Central Fluoride V o l a t j l i ~ Processing CI Full Xenon Poisoning 0 Xenon €xclusion
- Q Reference Design Case I I I
01 9 I10
CONVERSION RATIO I, I
Fig. 8.1. Nuclear Capability of 1000 Mwe Molten Salt Converter Reactor.
*- we

173
8.6 'Conclusions
The 1000 Mwe MSCR requires a cap i t a l investment of S143Jkwhr.
fixed charges are 3.0 mills/kwhr, t he fue l cost is 0,7 mills/kwhr, the maintenance and operation expense of 003 m i l l s / k w h r , and the net power cost
is 4.0 mills/kwhr.
The
Subst i tut ion of sodium f o r LiF-BeF2 as the intermediate coolant and
replacement of the Loeffler boiler-superheater complex with a more con- ventional sodium-heated bo i l e r would reduce the cap i t a l investment t o about $125/kwhr,
p i ta t ion of rare ear th f luorides) provides poten t ia l f o r reducing f u e l
cycle cost ,
should be capable of evolving i n t o a self-sustaining breeder reac tor (BR % l o o ) not dependent on outside sources of f iss i le isotopes.
Development of a l te rna t ive methods of processing (e .g. , preci-
An examination of the neutron economy indicates t h a t the MSCR
8 .7 ' .Recommendations
The comprehensive program of research and development f o r molten salt
reactors i n progress a t ORNL is concerned a t present with the construction
and operation of t he MSRE, addi t ional areas of study, research, and development important t o the
rea l iza t ion of the nuclear and economic poten t ia l of molten salt reactors. These areas are l i s t e d below, together with spec i f ic examples i n each area.
This MSCR evaluation has disclosed cer ta in
8,7.1 T i t l e 1 Design Study of MSCR
This should be performed f o r two plant capaci t ies (100 and 1000 Mwe)
i n order t o de tec t unrecognized development problems and t o ver i fy the economic predictions made i n t h i s report .
conducted by an organizatio and cooperation i n spe chemical processing) e
bridge the gap between the MSRE (10 M w t ) and a ful l -scale prototype.
The study preferably should be
s ide the Laboratory, but with close l iason
a1 s tudies (cog., nuclear design, reactor-integrated study of 100 Mwe ins t a l l a t ion is desirable t o

174
8.7.2 Conceptual Design Studies'of'Advanced Breeder Reactors
P r i o r s tudies have established the nuclear po ten t ia l of a thermal molten salt-thorium breeder,
and developed i n grea te r d e t a i l i n the l i g h t of the technology accumulated i n recent years. In addition, t he poten t ia l of fast molten-salt breeders,
However, t h i s concept should be re-examined
233" including those breeding plutonium, or possibly both plutonium and 9
should be evaluated.
not clear, a t present, which of these of fe rs t he grea tes t ult imate poten-
A number of concepts have been proposed, and it is
t i a l coupled with the least d i f f i c u l t y of development,
8.7.3 Fundamental Studies of Alternative Chemical Processes
While the f luoride v o l a t i l i t y process is su i tab le for the recovery of isotopes of uranium f r o m short-cooled fue l , its use alone does e n t a i l t he discard of the carrier salt t o r i d the system f i ss ion products.
l i m i t s t he processing rate and conversion ratio i n thermal reactors using valuable isotopes of l i thium and beryllium, although fast reactors using
f luorides of sodium and potassium, etc,, are not so l imited, thermal reactors a t least, an a l te rna t ive process is needed i n which sepa-
r a t ion of valuable components (thorium, uranium, l i thium, beryllium) from f i s s ion product isotopes is effected by t ransfer between f l u i d phases,
e.og., by extraction of molten salt f u e l with a l iqu id metal. forces for the t ransfer can be provided by the use of ac t ive metals and eas i ly reduced f luorides or perhaps by the application of electric
potent ia ls .
8.7.4 Engineering Laboratory .Study_ of. Precipi ta t ion Processing
T h i s fact
For the
Driving
. . . . . . . . . . .
This process, which has great poten t ia l f o r reducing the f u e l cycle cost i n the MSCR and which, by necessity, must be integrated with the
operation of the reac tor and placed within the reac tor cel l , could make
the introduction of HSCR power reac tor p lan ts independent of t he availa-
b i l i t y of cen t r a l processing facil i t ies f o r molten salts, enormous advantage f o r t he i n i t i a l i n s t a l l a t ions , par t icu lar ly i f these are widely scat tered i n remote locations.
of t he smaller in s t a l l a t ions (100 Mwe) would be improved,
This is an
Also, the competitive posit ion

175
8.7.5 Pilot Plant Studv of'HF Dissolution Process
This process, though not e s sent ia l t o the rea l i za t ion of the economic
potent ia l of the MSCR would, if developed, make possible the evolution of the MSCR in to a self-sustaining system, and would const i tute a large s t ep i n the development of two-region, two-fluid breederso


. .
177
APPEND1 CES
Introduction
I n t h i s portion of the report are collected reference materials, preliminary studies, and de- t a i l e d discussions t h a t support the assumptions used or conclusions drawn i n the main body of the report .
Literature references i n the Appendices do not r e fe r t o the Bibliography which follows, but t o separate l i s t s of references given a t the end of each sub-appendix.

,
.

179
Appendix A
MULTIGROUP CROSS SECTIONS FOR MSCR CALCULATIONS
C. W. Nestor
Table A . l . Group Structure
~
Group - au U Energy ( e ~ )
1 2 3 4 5 6 7 8 9 10 11 12 13 14 15 16 17 18 19 20 21 22 23 24 25 26 27 28 29 30 31 32 33 Ep. Thermal 34 Thermal Group
0.91629 0.69315 0 69315 0 20400 1.09860 1 20400 1 09860 11.20400 1.09860 0 91629 0.98083 0 40547 0 10536 0.11778 0.20764 0.26236 0 10536 0 19574 0 11441 0.09531 0.18232
0.16252 0.23052 0.30010 0 28768
0 22314
0 31015 0 31845 0 47000 0 57982 0 55962 0.28768 0.31705 (1200°F)
0.916 1.609 2.302 3.506 4 605 5.808 6.907 8.111 9.210
10.126 11.107 11 512 11 617 11 735 11 942 12.204 12.309 12.505 12.619 12.714 12.896
13.282
13.813
13 119
13 572
14 101 14 411 14 729 15 199 15 779 16 339 16 627 16 944
4 x io6 + 107 2 x lo6 + 4 x 10⁶ 1 4 2 x 10⁶ 3 x 10⁵ + 106 1 x io5 -+ 3 x io5 3 x io4 -+ 1 x 10⁵ 1 x io4 -+ 3 x 10⁴ 3 x io3 1 x io4 1 x io3 -+ 3 x io3 400 -+ io3 150 4 400 100 + 150 90 -+ 100 80 3 90 65 -+ 80 50 -+ 65 45 3 50 37 + 4 5 33 + 37 30 -+ 33 25 4 30 20 3 25 17 3 20 13.5 -17 10 13.5 7.5 310 5.5 3 7 . 5 4 -5.5 2.5 4 4 1.4 -+ 2.5 0.8 j l . 4
0.437 3 0 . 6 0.07940
0.6 4098

180
Table A.2. Lithium-6
Group
1 2 3 4 5 6 7 8 9 10 11 3 2 13 14 15 16 17 18 19 20 21 22 23 24 25 26 27 28 29 30 31 32 33 34
fa,
6.16 X 10⁻¹ 4.19 X 10⁻¹ 4.36 X 10⁻¹ 2.02 x 10⁻¹ 4.99 x 10⁻¹
7.38 x 10⁻¹ 4.96 X 10⁻¹
1.11 1.75 2.62 4.04 4.81 5.05 5.32 5.83
6.85 7.48
8.28 8.91 9.93 1.07 X 10 1.20 x 10 1.38 X 10 1.57 X 10 1.81 x 10 2.12 x 10 2.69 X 10 4.35 x 10 5.61 X 10 6.39 X 10 7.49 x 10 7.49 x 10
6.52
7.92
a R
Y'f
6.74 X 1.618 X 10-1 2.530 X 10⁻¹ 7.142 X 10⁻¹ 1.463 X 10-' 7.680 X 10⁻¹ 1.163
3.650 6.020 9.689 1.359 X 10 1.542 X 10 1.631 X 10 1.770 X 10 1.991 x 10 2.181 x 10 2.353 X 10 2.542 X 10 2.678 X 10 2.872 x 10 3.179 X 10 3.500 X 10 3.863 X 10 4.413 X 10 5.110 X 10 5.940 X 10 6.950 X 10 8.470 X 10
1.470 X lo2 1.810 X lo2 4.720 X lo2
2 057
1.100 x lo2
2.21 x 10²
0 0 0 0 0 0 0 0 0 0 0 0 0 0 0 0 0 0 0 0 0 0 0 0 0 0 0 0 0 0 0 0 0 0
5.04 4.76 3.78 7.59 1.22 x 10 4.55 5.92 9*87 1.67 X 10 2.64 X 10 4.07 X 10 5.55 x 10 6.24 X 10 6.56 X 10 7.07 X 10 7.88 X 10 8.56 X 10 9.18 X 10 9.85 X 10 1.01 x 10² 1.10 x 10² 1.21 x 10² 1.32 X lo2 1.44 X lo2 1.63 X lo2 1.87 X lo2 2.14 X lo2 2.47 X lo2 2.97 X lo2 3.78 X lo2 4.90 X lo2 6.70 X lo2 5.94 x 1 0 2
1.42 x lo3
1

i i - 1 -
181
Table A.3. Lithium-?
Group - CJ a 3’tr
1 2 3 4 5 6 7 8 9 10 11 12 13 14 15 16 17 18 19 20 21 22 23 24 25 26 27 2% 29 30 31 32 33
4.45 x 10”
3.28 X 10’’ 7.86 X 10’’ 1.34 x 2.75 X 10‘’ 2.75 X 10⁻¹ 2.75 X 10’’ 2.75 X 10⁻¹ 1.31 x 2.75 X 10” 2.75 X 10⁻¹ 2.75, X 10-1 2.75 X 10’’ 2.75 X 10‘’ 2.75 X 10’’ 2.75 X 10’’ 2.75 X 10’’ 2.75 X lo-’ 2.75 X 10’’ 8.73 x 2.75 X lo-’ 1.11 x 2.75 X 10-1 2.75 X 10’’ 2.75 X lo-’ 1.11 x 2.75 X 10-1 2.75 X lo-’ 1.50 x 2.75 X 10’’ 2.75 X 10‘’ 2.75 x 10⁻¹ 2.75 X 10⁻¹ 2.75 X lo-’ 2.75 X 10-l 2.75 X 10” 2.75 X 10’’
2.11 x 10-
7.37 x 10⁻⁶
2.66 x 10‘~ 4.08 x 10’~ 7.31 x 10-~
2.03 x 10’~ 3.44 x 10’~ 4.57 x 10’~ 5.75 x 10⁻⁴ 5.75 x 10⁻⁴ 5.75 x 10’~ 7.31 x 10’~ 7.73 x log4 7.73 x 10⁻⁴
1.11 x 10⁻³ 1.11 x 10⁻³
1.30 x l o w 3
2.00 x 10⁻³ 2.00 x 10’~ 2.55 x 10’~ 3.36 x 10’~ 3.36 x 10⁻³ 5.12 x 10’~ 6.17 x 10’~ 7.24 x 10’~
4.06 X 10⁻¹ 3.28 X 10’’
3.17 X lom6 5.76 X lom6
0 0 0 0 0 0 0 0 0 0 0 0 0 0 0 0 0 0 0 0 0 0 0 0 0 0 0 0 0 0 0 0 0
4.915 3.502 3 451 4.947 6 286 2.850 2.850 2.850 2.850 2.850 2.850 2.850 2.850 2.850 2.850 2.850 2.850 2 850 2.850 2.850 2.850 2.850 2.850 2.850 2.850 2.850 2.850 2.850 2.850 2.850 2 850 2.850 2.850
0 2 850 34 2.75 X 10’’ 1.66 X

182
i
Table A.4. Beryllium-9
1 2 3 4 5 6 7 8 9
10 ll 12 13 14 15 16 17 18 19 20 21 22 23 24 25 26 27 28 29 30 31 32 33 34
0 4608 0 3240 0 6813 0.8700 1 1913 1.2122 1.2122 1.2122 1.2122 1.2122 1.2122 1.2122 1.2122 1.2122 1.2122 1.2122 1.2122 1.2122 1.2122 1.2122 1.2122 1.2122 1.2122 1.2122 1.2122 1.2122 1.2122 1.2122 1.2122 1.2122 1.2122 1.2122 1.24 1.24
6.3425 X
1.3362 X 2.1688 X 3.8471 X 6.8585 X 1.2165 X lom5 2.1688 X 2.8471 X 6.3425 X 1.0204 X
1.6236 X 1.7167 X 1.8628 X 2.0956 X 2.2960 X los4 2.4762 X 2.6752 X 2.8190 X lou4 3.0224 X
3.6832 X
9.4485 x 10-7
1.4312 x
3.3454 x 10'~
4.0646 x 4.6430 x 10-4 5.3775 x 10⁻⁴ 6.2450 X lom4 7.3085 X 8.1920 X 1.1601 X 1.5142 X 1.9013 X 2.15 x 5.048 x 10-3
0 0 0 0 0 0 0 0 0 0 0 0 0 0 0 0 0 0 0 0 0 0 0 0 0 0 0 0 0 0 0 0 0 0
5.2490
6.6914 1.0649 X 10 1.3588 X 10 1.6068 X 10 1.6112 X 10 1.6112 X 10 1.6112 X 10 1.6112 X 10 1.6112 X 10 1.6112 X 10 1.6112 X 10 1.6112 X 10 1.6ll2 X 10 1.6112 X 10 1.6112 X 10 1.6112 X 10 1.6112 X 10 1.6112 X 10 1.6112 X 10 1.6112 X 10 1.6112 X 10 1.6112 X 10 1.6112 X 10 1.6112 X 10 1.6112 X 10 1.6112 X 10 1.6112 X 10 1.6112 X 10 1.6112 X 10 1.6112 X 10 1.611 X 10 1.611 X 10
6 6160

. . . 1 -
1
183
Table A.5. Carbon-12
Croup " t r
1 2 3 4 5 6 7 8 9
10 11 12 13 14 1 5 16 17 18 19 20 21 22 23 24 25 26 27 28 29 30 31 32 33 34
0 303676 0.2686 0.4108
0.694568 0.74181 0.7584
0.7584 0 7584 0 7584 0.7584 0.7584 0.7584 0.7584 0.7584 0.7584 0 7584
0 6241
0 7584
0 7584 0 7584 0 7584 0.7584 0.7584 0 7584 0 7584 0.7584 0 7584 0 0 7584 0 7584 0.7584 0 7584 0.7584
2.1565 X 3 213 4 544 7.380 1.308 X 2.332 X 4.187 X 7.375 x 1.308 X 2 157 3.470 4.866
5.830 6.335
7.805 8.420
9.585
1.138
1.382
1.829
2.485 3.030 3.944 5 245 6 465
5 520
7 125
9.095
1.028 X
1.253
1.579
2 124
4
7.585 X 10⁻¹ 1.85 x 7.585 X 10-1 5.048 x
0 0 0 0 0 0 0 0 0 0 0 0 0 0 0 0 0 0 0 0 0 0 0 0 0 0 0 0 0 0 0 0 0 0
3.7354 5 4204 0.0604
1.19114 X 10 1.28686 X 10 1.35370 X 10
1.35936 X 10 1.35936 X 10
1.35936 X 10 1.35936 X 10
1.35936 X 10 1.35936 X 10 1.35936 X 10
9 2352
1.35936 X 10
1.35936 X 10
1.35936 X 10
1.35936 X 10 1.35936 X 10 1.35936 X 10
1.35936 X 10 1.35936 X 10
1.35936 X 10 1.35936 X 10
1.35936 X 10 1.35936 X 10 1.35936 X 10 1.35936 X 10
1.35936 X 10
1.35936 X 10
1.35936 X 10
1.35936 X 10 1.359 X 10 1.359 X 10

184
Table A.6. Fluorine-19
Group - U a
1 2 3 4 5 6 7 8 9
10 11 l2 I3 14 15 16 17 18 19 20 21 22 23 24 25 26 27 28 29 30 31 32 33 34
1.62 X 10⁻¹ 2.00 x 10⁻¹ 3.45 x 10⁻¹ 3.50 X 10-l- 7.70 X 10⁻¹ 2.55 x 10⁻¹ 4.35 x 10⁻¹ 3.70 X 10⁻¹ 3.70 X 10⁻¹ 3.70 X 10⁻¹ 3.70 X 10-l- 3.70 X 10-l- 3.50 X 10⁻¹ 3.50 X 10” 3.50 X 10⁻¹ 3.50 X 10⁻¹ 3.50 X 10⁻¹ 3.50 X 10⁻¹ 3.50 X 10⁻¹ 3.50 X 10⁻¹ 3.50 X 10⁻¹ 3.50 X 10⁻¹ 3.50 X 10⁻¹ 3.50 X 10⁻¹ 3.50 X 10⁻¹ 3.50 X 10⁻¹ 3.50 X 10⁻¹ 3.50 X 10⁻¹ 3.50 X 10⁻¹ 3.50 X 10” 3.50 X 10⁻¹ 3.50 X 10⁻¹ 3.59 x 10⁻¹ 3.59 x 10⁻¹
2.00 x 10⁻¹
LOO x LOO x 10-~ 3.00 x
0 0
0 0 0 0 0 0 0 0 0 0 0 0 0 0 0 0 0 0 0 0 0 0 0 0 0 0
1.80 X . 4.5 x
0 0 0 0 0 0 0 0 0 0 0 0 0 0 0 0 0 0 0 0 0 0 0 0 0 0 0 0 0 0 0 0 0 0
5.40 7.50 9.60 1.35 X 10 2.40 X 10 1.50 X 10 1.35 X 10 1.u. x 10 1.11 x 10 1.11 x 10 1.11 x 10 1.11 x 10 1.05 X 10 1.05 X 10 1.05 X 10 1.05 X 10 1.05 X 10 1.05 X 10 1.05 X 10 1.05 X 10 1.05 X 10 1.05 X 10 1.05 X 10 1.05 X 10 1.05 X 10 1.05 X 10 1.05 X 10 1.05 X 10 1.05 X 10 1.05 X 10 1.05 X 10 1.05 X 10 1.05 X 10 1.05 X 10

!
j
185
Table 4.7. INOR-8
1 2 3 4 5 6 7 8 9
10 11 12 13 14 15 16 17 18 19 20 21 22 23 24 25 26 27 28 29 30 31 32 33 34
5.98 x 10⁻¹ 5.89 X 10⁻¹ 6.98 x 10⁻¹ 1.010 2 375 3.158 3.165
3.010 2.939 2.930 2.941
3 - 175
2 * 967 2 967 2 967 2 967 2 967 2 967 2.977 3.018 3.018 3.018 3.018
2.978 2 995
3 077 3 - 077 3.156 3.270
3.141 3.152 3.285 3.285
3.270
0 0 0 0 0 0 0 0 0 0 0 0 0 0 0 0 0 0 0 0 0 0 0 0 0 0 0 0 0 0 0 0 0 0
10.347 10.693 10.521 10.760 13.270 14.48 20.793 42.011 48.153 54.372 59.116 57 - 442 56 977 57.488 57.58
58.23
56.00 57.070 56.140 57 349 58 698 57 628 58.698 58.837 58.930 59.116 58.279 58.279 57.349 57 e 74 58 695 58.693
57 62
57.30
1.868 x 10⁻¹ 1.904 x 10⁻¹ 1.936 X 10⁻¹ 1.972 x 10⁻¹ 2.006 x 10⁻¹ 2.031 x 10⁻¹
2.096 x 10⁻¹ 2.264 x 10⁻¹ 2.544 x 10-l 3.531 x 10⁻¹
2.057 X 10-l
5.778 x 10⁻¹ 1.159 1.159 1 159 1.159 1.160 1 161 9,800 x 10-l 2.009 x 10⁻¹ 2.016 X 10⁻¹ 2.027 X 10⁻¹ 2.043 x 10-l 2.092 x 10-l 2.291 X 10⁻¹ 2.652 x 10⁻¹ 3.038 x 10⁻¹ 3.554 x 10’1 4.215 x 10⁻¹ 5.099 x 10-l
8.809 x 10⁻¹ 6.740 X 10⁻¹
1.258 2 874

186
Table A. 8. Xenon-135
3% -
Group EST 'a
1 0 2 0 3 0 4 0 5 0 6 0 7 0 8 c 9 0 10 0 11 0 I2 0 13 0 14 0 15 0 16 0 17 0 18 0 1 4 0 20 0 21 0 22 0 23 0 24 0 25 0 26 0 27 0 28 0 29 0 30 0 31 0 32 0 33 0 34 0
7.43 x 10'2 3.908 x 10⁻¹ 7.242 X 10⁻¹ 9.843 x 10⁻¹ 9.546 X 10⁻¹ 3.960 X 10⁻¹ 1.515 x 10 3.045 x 10 5.133 X 10 e.580 x 10 1.047 X lo2 1.870 X lo2 2.198 X lo2 2.198 X lo2 2.198 x lo2 3.050 X lo2 3.282 X lo2 3.282 X lo2 4.222 X lo2 8.254 X lo2 8.254 X lo2 8.254 X lo2 8.254 x 10' 7.035 X lo2 6.781 X lo2 2.439 X lo3 2.439 X lo3 8.561 X lo3 1.720 X lo4 1.720 X lo4 5.697 X lo4 1.60 X lo6
2.100 x lo4 4.20 x lo4
0 0 0 0 0 0 0 0 0 0 0 0 0 0 0 0 0 0 0 0 0 0 0 0 0 0 0 0 0 0 0 0 0 0
0 0 0 0 0 0 0 0 0 0 0 0 0 0 0 0 0 0 O J 0 0 0 0 0 0 0 0 0 0 0 0 0 0 0

187
Table A. 9. Samarium-149
,
Group Sa,
1 2 3 4 5 6 7 8 9
10 11 12 13 14 15 16 17 18 19 20 21 22 23 24 25 26 27 28 29 30 31 32 33 34
0 0 0 0 0 0 0 0 0 0 0 0 0 0 0 0 0 0 0 0 0 0 0 0 0 0 0 0 0 0 0 0 0 0
3.000 X 10⁻¹ 3.000 x 10⁻¹ 3.262 x 10⁻¹ 3.600 x 10⁻¹ 1.027 1.570 1.570 2.240 1.641 X 10 4.857 X 10 4.857 X 10 8.829 x 10 1.911 x 1 0 2 1.911 x 1 0 2 1.911 x 1 0 2 1.756 X lo2 1.714 X lo2 1.586 X lo2 1.037 X lo2 1.037 X lo2 1.037 X lo2 1.463 X lo2 5.991 X lo2 5.991 X lo2 5.991 X lo2
1.714 x lo2
1.037 x lo2
1.887 x lo2
1.000 x 10² 1.000 x 10²
4.774 x 10³ 7.95 x 10² 4.20 x lo4
1.391 X lo3
0 0 0 0 0 0 0 0 0 0 0 0 0 0 0 0 0 0 0 0 0 0 0 0 0 0 0 0 0 0 0 0 0 0
0 0 0 0 0 0 0 0 0 0 0 0 0 0 0 0 0 0 0 0 0 0 0 0 0 0 0 0 0 0 0 0 0 0

188
Table A.10. Samarium-151
Group ..-L -- a: a 3'tr
0-26 27 28 29 30 31 32 33 34
0 0 0 5.50 x lo2 0 0 0 1.30 x lo2 0 7.20 X lo2 0 2.28 x io3 0 7.25 x lo2 0 9.80 x 10² 0 4.91 x io3
Table A.11. Thorium-232 (Infinite Dilution)*
Group
1 2 3 4 5 6 7 8 9 10 11 12 13 14 15 16 17 18 19 20 21 22 23 24 25
6.100 X 5.669 X 5.841 x lom2 8.160 x loe2 1.039 X 10⁻¹ 1.119 x 10⁻¹ 1.130 X 10⁻¹ 1.156 X 10⁻¹
1.180 X 10⁻¹ 1.168 x 1O-I
1.339 x 10⁻¹ 1.824 x 10⁻¹ 1.202 x 10⁻¹ 1.204 x 10⁻¹
1.213 x 10⁻¹ 1.217 x 10⁻¹ 1.219 x 10⁻¹
5.117 x 10⁻¹ 1.232 x 10⁻¹ 1.236 x 10⁻¹ 1.242 x 10⁻¹
2.301 X 10-l 1.728 X 10⁻¹
1.221 x 10⁻¹ 1.224 X 10⁻¹
0.2408 0.1684 0.1450 0.1622 0.2708
0.5680 0.7958 1.029 1.168
20.802 1.481
82.755 16 568
0 4627
7 234
1.502
1.615 1 646 1 678 1 701 1.731
198.0 1.819 1.864 1.927
5.642 X 10⁻¹ 3.190 X 10⁻¹ 1.306 X 10⁻¹
0 0 0 0 0 0 0 0 0 0 0 0 0 0 0 0 0 0 0 0 0 0
1.883 x 10 1.998 x 10
2.366 x 10 3.132 x 10 3.718 X 10 3.739 x 10 3.739 x 10 3.739 x 10 3.739 x 10 4.658 x 10 6.349 X 10 3.739 x 10 3.739 x 10 8.040 x 10 6.014 x 10 3.739 x 10 3.739 x 10 3.739 x 10 3.739 x 10 3.739 x 10 2
1.781 X 10 3.739 x 10 3.739 x 10 3.739 x 10
1.966 X 10
-- w - I
*Groups ll, 12, 15, 16, 22 computed in Appendix B.

189
Table A. 11 (continued)
c 7
Group Ea, 0 a "Of 3'tr
26 27 28 29 30 31 32 33 34
1.249 X 10⁻¹ 1.256 x 10⁻¹ 1.263 x 10⁻¹ 1.274 x 10⁻¹ 1.290 x 10⁻¹ 1.305 X 10⁻¹ 1.314 x 10⁻¹ 1.324 x 10⁻¹ 1.324 x 10⁻¹
2.000 2 076 2.160 2.269 2.424 2.604 2 745 2.848 3.77
3.739 x 10 3.739 x 10 3.739 x 10 3.739 x 10 3.739 x 10 3.739 x 10 3.739 x l o 4.591 x 10 4.87 X 10
Table A.12 . F'rotactinium-233
Group S O T c U a
- f VU 3'tr
1 2 3 4 5 6 7 8 9
10 11 12 13 14 15 16 17 $8 19 20 21 22 23 24 25 26 27
4.285 x 0.002403 4.286 x 0.00358 8.569 x 0.00506 8.577 X loe2 0.00822 8.589 x 0.01457 8.613 x 0.02599 8.652 x 0.4609 8.728 x 0.08218 8.851 x 0 1457 9.020 x 0 2403 9.312 X 0 3866 9.480 x IOv2 0 5422 9.530 X 0 6151 9.589 x 0.6502
9.862 x 0.7939
1.007 X loT1 1.1608 1.016 X 10⁻¹ 1.0130 1.024 x 10⁻¹ 1 0680
9.702 X 0 7059
9.932 x 0 8697
1.040 x 10⁻¹ 1.145 1.062 x 10⁻¹ 1.267 1.079 X 10⁻¹ 1.396 1.106 x 10⁻¹ 1.540
1.192 x 10⁻¹ 2.037 1.147 X 10⁻¹ 1.759
1.248 X 10⁻¹ 2 366
0 0 0 0 0 0 0 0 0 0 0 0 0 0 0 0 0 0 0 0 0 0 0 0 0 0 0
1.496 X 10 1.496 x 10 1.496 X 10 2.991 X 10 2.991 X 10 2.991 X 10 2.991 X 10 2.991 x 10 2.991 x 10 2.991 x 10
2.991 x 10
2.991 x 10
2.991 X 10 2.991 X 10
2.991 X 10
2,991 X 10 2.991 X 10 2.991 X 10 2.991 x 10 2.991 x 10 2.991 X 10 2.991 X 10 2.991 X 10 2.991 x 10 2.991 X 10 2.991 X 10 2.991 x 10

190
Table A.12 (continued)
G - t
- - -- Group ea, ’U a Vaf %r
28 1.316 x 10’” 2 769 0 2.991 X 10 29 1.438 X 10’” 3.376 0 2.991 X 10 30 1.630 x 10⁻¹ 737.0 0 2.991 X 10 31 1.885 x 10⁻¹ 764.0 0 2.991 X PO 32 2.044 x lo-” 7-204 0 2.991 X 10 33 2.25 X 8 374 0 7.486 X 10 34 2.25 X 10⁻¹ 18.943 0 1.32 X lo2
Table A.13. Uranium-233
1 2 3 4 5 6 7 8 9
10 11 I2 13 14 15 16 17 18 19 20 21 22 23 24 25 26 27 28 29 30
\
7.400 X 7.110 X 6.950 X 9.320 X 1.140 X 10-1 1.263 X 10⁻¹ 1.371 X 10⁻¹ 2.366 X 10”-
2.427 X 10⁻¹ 3.309 X 10’” 4.451 X 10⁻¹ 4.324 X 10⁻¹ 3.673 X 10‘” 5.273 X 10⁻¹ 3.253 X 10⁻¹ 2.351 X 10’” 6.391 X 10⁻¹ 6.420 X 10⁻¹ 5.564 x 10’1 7.434 x 10⁻¹ 5.650 X 10⁻¹ 7.289 X 10⁻¹ 1.019 x 10⁻¹ 2.284 x 10⁻¹ 1.050 X 10”- 6.010 X 10⁻¹ 6.350 X 10⁻¹ 6.010 X 10⁻¹ 8.750 X 10⁻¹
1.838 x 10⁻¹
1.940
1.950 2.160 2.610 3.560 5.864 1.698 X 10 1.008 x 10 1.411 X 10 2.131 X 10 3.832 X 10
1.810
5.031 x 10 4.089 x 10 4.352 X 10 4.614 X 10 3.679 X 10 3.923 x 10 7.249 X 10 6.879 X 10 6.837 X la 1.525 X lo2 2.148 X lo2 1.158 x lo2 2.059 x lo2 5.000 x 10
8.38 x 10 9.26 x 10
1.900 x 1 0 2
5.29 X lo2
6.570 5.190 5.240 5.430 6.180 8.120 1.319 X 10 3.801 X 10 2.268 X 10 3.175 X 10 4.795 x 10 8.622 X 10 1.132 X lo2 9.201 X 10 9.799 x 10 1.038 X lo2 8.277 X 10
1.631 X lo2 1.548 X lo2 1.480 X lo2 3.30 x lo2 4.65 X lo2 2.51 X lo2 4.46 x lo2 1.14 X lo2 1.83 x lo2
8.828 x 10
3.73 x 10²
1.90 x 1 0 2 1.01 x 10³
1.230 X 10 1.442 1.191 1 461 2 271 2 930 2 991 2.390 3.739 3.739 3.739 3.739 3.739 3.739 3.739 3.739 3.739 3 739 3.739 3.739 3.739 3.739 3.739 3.739 3.739 1.80 X lo2 6.00 2.80 3.00 1.50 x lo3
3.39 2.87 2.69 2.51 2.37 2.28
2.24 2-25
2.25 2.25 2.25 2.25 2-25 2.25 2.25 2.25 2.25 2.25
2.25 2.25
2.16 2.16 2.16 2.17 2-17 2 e.28 2.07 2.18 2.05 1.91
3.39 2.87 2.69 2.51 2.50 2.50 2.50 2.50 2.50
2.50 2.50
2.50
2.50 2.50 2.50
2.50 2.50 2.50 2.50 2.50
2-50
2.50 2-50 2.50 2.50 2-50 2-50 - -
W 2.50 2.50 2.50

191
T a b l e A.13 (continued)
31 2 740 1-79 X lo2 3.990 X lo2 5.40 X I O 2 2.23 2.50 32 1 430 1.405 x lo2 3.217 x lo2 3.739 x 10 2.29 2.50 33 1.545 1.27 x lo2 2.9 x 10’ 5.40 x lo2 2.29 2.50 34 1 545 3.40 X 10 6.54 x lo2 8.47 x io2 2.29 2.50
-~ ~ ~~~
T a b l e A.14. Uranium-234
Group ‘a
1 7.298 X 1.556 2 6.865 X 1.529 3 6.718 X 1- 353 4 8.020 x 0-673 5 1.007 X 10⁻¹ 0.083 6 1.122 0.067 7 1.188 0 118 8 1 167 2.104
10 1 258 0 615 11 1.044 9.054 12 1.068 2.077 X 10 13 1.075 5.957 x 10 14 1.083 5.486 15 1.099 1.833 X 10 16 1.122 2.109 X 10
9 1.234 0.373
17 1.132 7.901 X 10 18 1.152 2 402 19 1.165 2 595 20 1.176 2.690 X lo2 21 1.199 2 932 22 1.229 3.245 23 1.254 3 573 24 1.293 3 943 25 1.350 4.504 26 1.244 5 216 27 1-324 6.509 X lo2 28 1.420 1.158 X lo3
30 1.871 1.125 X 10 31 2.228 1.496 X 10 32 2 454 1.844 X 10
34 2.749 X 10-’- 5.54 x 10
29 1.593 8 645
33 2.749 X 10⁻¹ 2.144 x 10
~ ~~ ~-
3 875 1.754 X 10 3.800 2.019 X 10
1.630 2.347 X 10 0.121 3.176 X 10 ‘ 0 3.709 X 10
3.350 1.990 x 10
0 4.011 x 10 0 4.104 x 10
0 3.290 x 10 0 3.290 x 10
0 4.187 X 10 0 4.187 X 10
0 3.290 X 10 0 3.290 X 10 0 3.290 X 10 0 3.290 x 10
0 3.290 X 10 0 3.290 X 10
0 3,290 X 10 0 3.290 X 10 0 3.290 X 10
0 3.290 X 10 0 3.290 X 10 0 3.290 X 10
0 3.290 x 10
0 2.692 X 10 0 2.692 X 10 0 2.692 X 10 0 2.692 X 10 0 2.692 X 10
0 2.692 X 10 0 2.692 x 10
0 9.104 x 10 0 2.20 x 10²

192
Table A.15. Uranium-235
1 2 3 4 5 6 7 8 9 10 11 12 13 14 15 16 17 18 19 20 21 22 23 24 25 26 27 28 29 30 31 32 33 34
6.62 X loe2 6.11 X 5.71 X 7.73 x 10-2 1.00 x 10'1 1.14 X 10⁻¹ 1.23 x 10⁻¹ 2.03 x 10⁻¹ 2.46 x 1O-I 2.38 x 10⁻¹ 3.44 x 10'1 2.86 x 10⁻¹ 3.82 x 10⁻¹ 3.24 X 10⁻¹ 3.44 x 10⁻¹ 6.79 X 10⁻¹ 5.94 x 10⁻¹ 4.04 x 10⁻¹ 3.82 x 10⁻¹ 2.12 x 10⁻¹ 5.40 X 10" 3.99 x 10⁻¹ 4.42 x 10⁻¹ 4.03 x 10⁻¹ 2.80 X 10⁻¹ 1.81 x 10'' 2.39 x 10⁻¹ 2.29 x 10⁻¹ 2.97 X 10"- 3.27 X 10⁻¹ 6.45 X 10-l 7.89 X 10⁻¹ 1.12 1.12
2.80 2.80 2.80 2.80 2.80 2.80 4 173 7.44 1.36 X 10 1.97 X 10 2.66 X 10 2.78 X 10 2.78 X 10 3.76 X 10 2.85 X 10 5.12 x 10 5.40 X 10 4.52 x 10 1.58 X lo2 5.97 x 10 4.91 X 10 1.01 x 10² 1.47 X lo2 6.19 X 10 1.28 x lo2 1.14 X lo2 7.02 X 10 2.95 x 10 4.21 X 10 3.39 x 10 7.20 x 10 7.17 X 10 9.22 X 10 3.05 X lo2
3.547 2 195 3 185 3.124 3.852 5-36 8.143 1.14 X 10 1.74 X 10 2.92 X 10 4.44 x 10 5-63 X 10 4.73 x 10 7.08 X 10 6.95 X 10 1.09 x 10²
2.00 x 10² 1.04 x 10²
9.14 X 10 9.42 X 10
8.99 x 10 1.29 X lo2 2.07 X lo2 8.46 X 10 1.31 X lo2 2.38 X lo2 7-60 X 10 2.40 X 10 7.53 x 10 4.09 X 10 1.42 X lo2 1.45 X lo2 6.29 X lo2 1.99 x 10²
1.23 X 10 1.44 X 10 1.19 x 10 1.46 X 10 2.27 x 10 2.92 X 10 2.99 x 10 3.74 x 10 3.74 x 10 3.74 x 10 3.74 x 10 3.74 x 10 3.74 x 10 3.74 x 10 3.74 x 10 3.74 x 10 3.74 x 10 3.74 x 10 3.74 x 10 3.74 x 10 3.74 x 10 3.74 x 10 3.74 x 10 3.74 x 10 3.74 x 10 3.74 x 10 3.74 x 10 3.74 x 10 3.74 x 10 3.74 x 10 3.74 x 10 3.74 x 10 3.25 X lo2 9.62 X lo2
3.31
2.50 2.26 2.09 1.92 1.76 1.54 1.28 1.48 1.67 2.02 1.70 1.88
2.14 1.69 2.08 1.27 1.75 1.83 1.28 1.41 1.37 1.03 2.09 1.08 0.81 1.79 1.21 1.98 2.03 2.16 2.06
2.76
2.43
- --- b- I

D I
-& c$ 193
Table A.16. Uranium-236
- Group Ea, O,. v'f 3'tr
f 1 2 3 4 5 6 7 8 9 10 11 12 13 14 15 16 17 18 19 20 21 22 23 24 25 26 27 28 29 30 31 32 33 34
6.759 X 6.167 X 5.992 x 7.831 x 9.924 x 1.106 x 10-1 1.166 x 10⁻¹ 1.136 x 10⁻¹ 1.186 x 10⁻¹ 1.188 x 10⁻¹ 9.371 x 9.388 x
9.400 x 9.411 x 9.427 x 9.434 x 9.449 x 10'2 9.458 x 9.466 x 9.482 x 9.504 x 9.522 x 9.550 x 9.591 x
8.004 x 8.073 x lo'* 8.196 x lom2 8.395 x 7.710 x io-2 7.726 X 9.85 x 9.85 x
9.394 x 10'2
7.946 x 10'2
1 196 9.344 x 10⁻¹ 8.993 x 10⁻¹ 3.88 x io-* 2.69 x 10⁻³ 4.80 x 10⁻³ 8.50 x 10⁻³ 1.52 x 2.69 x lo'* 4.44 x 10'2 7-14 X 1.944 x 10 1.136 x 10⁻¹ 8.035 x 10 1.304 x 10⁻¹ 1.467 X 10⁻¹ 9.507 X 10 7.022 X 10 7.142 X 10 1.405 x 10 7 452 2.342 x 2.578 x 10-1 2.845 x 10⁻¹ 3.250 x 10⁻¹ 3.764 x 10⁻¹ 3.712 x lo2 3.616 X lo2 6.238 x 10⁻¹ 8.120 x 10'1 1.079 1.331 1-54 2.10
2 965 2.242
9.325 x 10 0 0 0 0 0 0 0 0 0 0 0 0 0 0 0 0 0 0 0 0 0 0 0 0 0 0 0 0 0 0
1.592
1.754 X 10 2.019 X 10 1.990 x 10 2.347 X 10 3.176 X 10 3.709 X 10 4.011 X 10 4.104 X 10 4.187 X 10 4.187 X 10 3.290 X 10 3.290 x 10 3.290 x 10 3.290 x 10 3.290 x 10 3.290 x 10 3.290 x 10 3.290 x 10 3.290 x 10 3.290 x 10 3.290 x 10 3.290 x 10
3.290 x 10 3.290 x 10 2.692 x 10
2.692 x 10
2.692 x 10 2.692 X 10 3.45 x 10 3.05 x 10
3.290 X 10
2.692 X 10 2.692 X 10
2.692 X 10
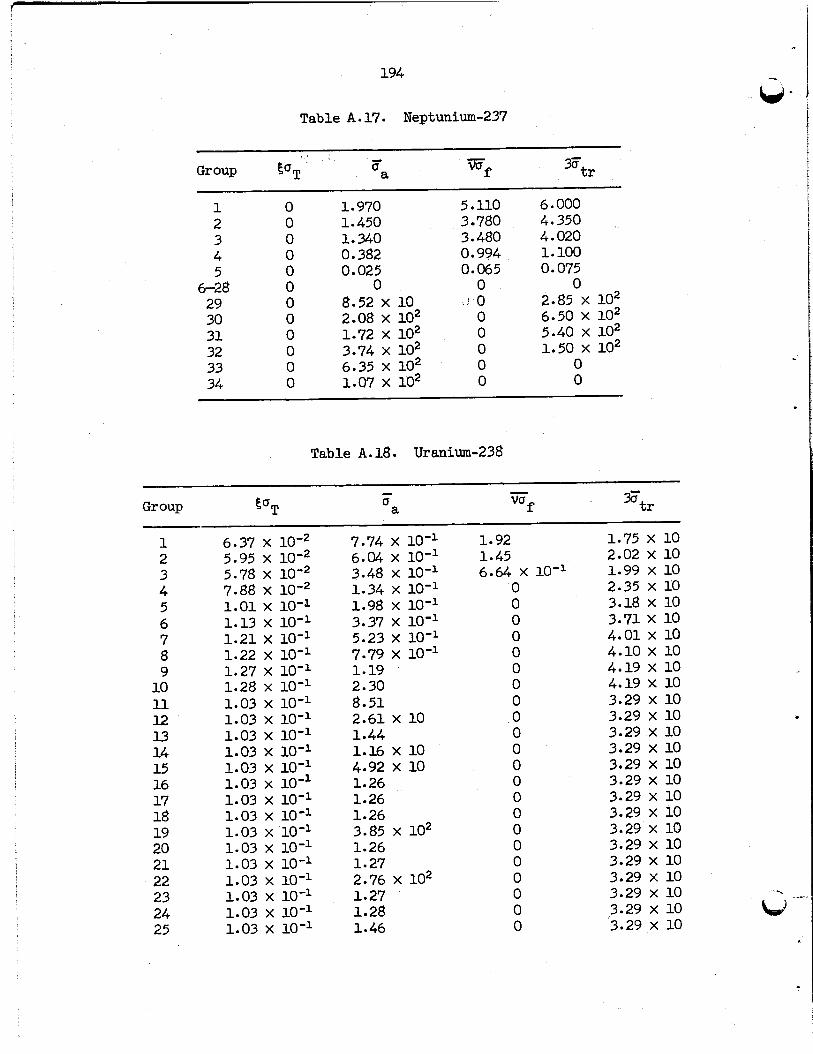
194
Table A.17. Neptunium-237
- - Group Ea, (T a *f %tr
1 2 3 4 5
6-28 29 30 31 32 33 34
0 0 0 0 0 0 0 0 0 0 0 0
1.970 1.450 1.340 0.382 0.025
0 8.52 X 10 2.08 x lo2 1.72 X lo2 6.35 X lo2 1.07 X lo2
3.74 x 10²
5.110 3 780 3.480 0.994 0.065
0 : o
0 0 0 0 0
6.000 4.350 4.020 1.100 0.075
0 2.85 X lo2 6.50 X lo2 5.40 x lo2 1.50 X lo2
0 0
w-
Table A. 18. Uranium-238
Group - CJ a %I-
1 2 3 4 5 6 7 8 9 10 11 I 2 13 14 15 16 17 18 19 20 21 22 23 24 25
6.37 X 5.95 x 10’2 5.78 X 7.88 x 1.01 x 10-1
1.21 x 10’’ 1.22 x 10” 1.27 X 10” 1.28 x 10’’ 1.03 X 10” 1.03 x 10⁻¹ 1.03 X 10” 1.03 X 10’’ 1.03 X 10⁻¹ 1.03 x 10⁻¹ 1.03 X 10” 1.03 x 10’’ 1.03 x 10’’ 1.03 x 10’’
1.13 X 10”
1.03 X 10” 1.03 X 10” 1.03 X 10” 1.03 X 10” 1.03 X 10”
7.74 x 10” 6.04 X 10” 3.48 X 10” 1.34 X 10⁻¹ 1.98 x 10‘’ 3.37 x 10”
7.79 x 10” 5.23 X 10”
1.19 2.30 8.51 2.61 X 10
1.16 X 10 4.92 X 10
1.44
1.26 1.26 1.26 3.85 x lo2 1.26
2.76 X lo2 1.27 1.28 1.46
1.27
1.92
6.64 X 1o-I 1.45
0 0 0 0 0 0 0 0 0 0 0 0 0 0 0 0 0 0 0 0 0 0
1.75 X 10 2.02 x 10 1.99 x 10 2.35 X 10 3.18 X 10 3.71 X 10 4.01 X 10 4.10 X 10 4.19 X 10 4.19 X 10 3.29 X 10 3.29 X 10 3.29 X 10 3.29 X 10 3.29 X 10 3.29 X 10
3.29 X 10 3.29 X 10 3.29 X 10 3.29 X 10 3.29 X 10 3.29 X 10 3.29 X 10 3.29 X 10
3.29 x 10
6 --
a

19 5
Table A. 18 (continued)
- ~-
Group Sa, - a a
?JE f 3Ftr
26 27 28 29 30 3 1 32 33 34
8.62 X 8.62 X 8.63 X 8,63 X lom2
8.65 X lom2 8.65 X
8.64 x 10"
7.98 x 10⁻² 7.98 x 10'2
1.28 4.14 X lo2 1.29 1.30 1.31 1.32 1.32 6.01 X 10" 1.36
2.69 X 10 2.69 X 10 2.69 X 10 2.69 X 10 2.69 X 10 2.69 X 10 2.69 X 10 2.85 X 10 3.47 x 10

j
i i !
, I
!
i
!
i i
196
Appendix B
EFFECTIVE THORIUM RESONANCE 1NTEG.RAT.S
J. W. Miller"
In t rodwt ion
The "effective" resonance integral t o lethargy um of a particular isotope i n a mixture of isotopes i s defined by the equation
The value of (uao)eff i s a complex function of a number of variables. A most important item i s the scattering power of the medium, measured by
u macroscopic scattering cross section per t h o r i m atom, P'
u = C N ak/Nth p t L k s
The greater the scattering power, the greater the probability tha t a
neutron w i l l be slowed through a resonance without absorption. motion of absorber nuclei, on the other hand, increases the probability of absorption due t o Doppler broadening of the resonances. small a t 2OoC, the standard temperature for reporting measured values, but increases at higher temperatures. Dresner has developed a method for com- puting the temperature e f fec t fo r resolved resonances.'
The thermal
This e f fec t i s
Group averaged cross sections for thorium are re la ted t o the effective resonance integral and were calculated by means of the equation
where i i s the group number.
~ ~~~ ~
*Adapted from ORNL-CF 61-1-26.

197
Analysis
By assuming a Maxwell-Boltzmann speed distribution for the moderating medium and the Breit-Wigner formula for a single resonance, Dresner2 has arrived at the following equation for the resonance integral, Ierfrfor a single absorption resonance:
where
In f3 + 5 In 10 In 2 k =
Other terms are defined in the nomenclature. The function J(E,k) is tabula%ed in ref. 1. The tabulated su l t
have been plotted as the family of curves in Fig. B.l. The reduced mass of the neutron p is equal to neutron mass (-1.0)
multiplied by M/(M+l), where M is the mass of the absorbing atoms. the mass of thorium is 232, p was taken as unity for these calculations.
Since
Table B.l lists the resonance parameters for--each of the 13 resolved
for computing the resonance integral for each resonance. (Since these thorium resonances (2).
Ieff calculations were performed, additional thorium resonances have been re- solved, and improved parameter values for previously resolved resonances have been obtained. The total resonance integral for each energy group is then obtained by ad- ding together the separate integrals for each resonance.
These parameters were used in the equation for
The effect of these new values has not been evaluatdd.)
Table B.l also

198
I O 2
8
6
4
2
6
4
2
4 0
ORNL-LR-DWG. 8 4 6 0 4 ~
0 . I 0.2 0.3 0.4
E 0 . 5 0.6 0 . 7
Fig. B. l . J(k,k) Versus E for k = 6.16.
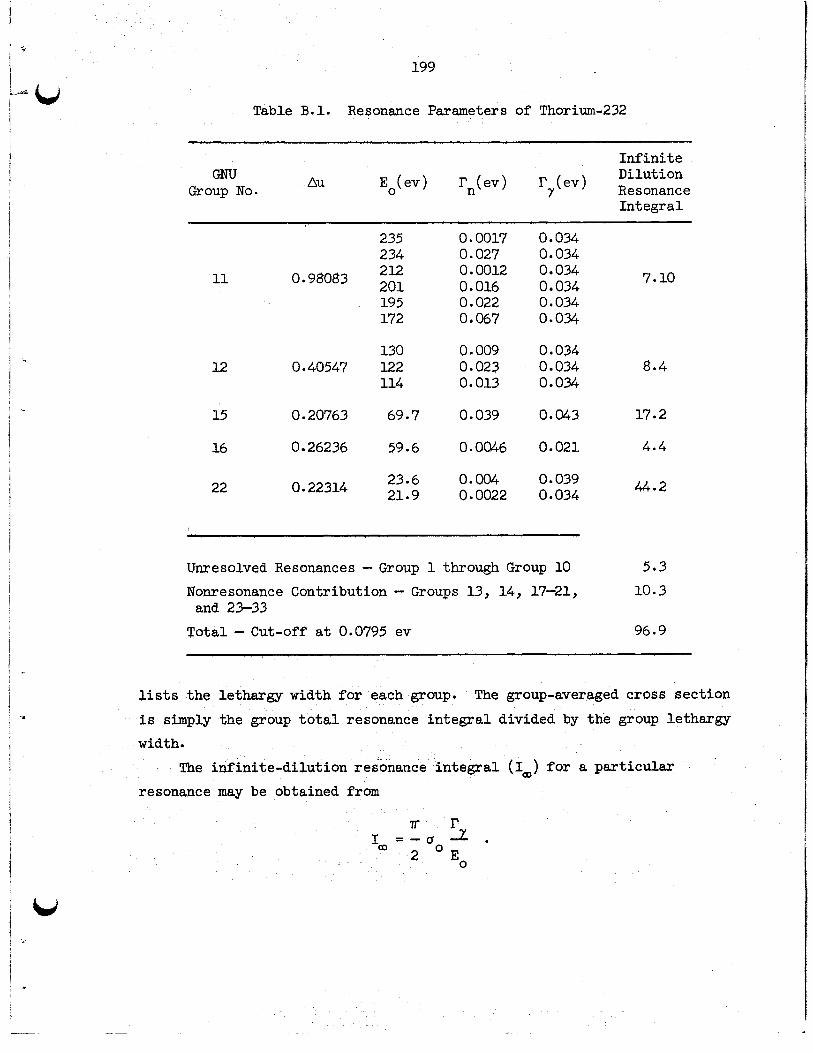
199 I L c, ,
11
, , -
Table B.l. Resonance Parameters of Thorium-232
Infinite Dilution
AU Eo(ev) rn(ev) ry(ev) Resonance GNU
Group No. Integral
235 234 212 0.98083 201 195 172
130 12 0.40547 122
114
15 0.20763 69.7
16 0 26236 59.6
22 23.6 0.22314 21.9
0.0017 0.027 0.0012 0.016 0.022 0.067
0.009 0.023 0.013
0.039
0.0046
0.004 0.0022
0 034 0.034
7.10 0 034 0 034 0.034 0.034
0 034 0 034 8.4 0.034
0.043 17.2
0.021 4.4
0.039 0.034 4.4.2
Unresolved Resonances - Group 1 through Group 10 5.3 10.3 Nonresonance Contribution - Groups 13, 14, 17-21,
Total- Cut-off at 0.0795 ev 96.9 and 2 3 3 3
lists the lethargy width for each goup. The group-averaged cross section is simply the group total resonance integral divided by the group lethargy width
The infinite-dilution resonance integral (Irn) for a particular resonance may be obtained from

200
Sample Calculation
.
Example: thorium resonance at 23.6 ev with a carbon-to-thorium ratio of 200 and an
Compute the effective resonance integral (Ieff) for the
absorber temperature of 649°C. The nonresonance scatkering cross section, u ', of carbon is 4.8 barns, and section, u m, is 12.5 barns.
S
S
1.
2.
3.
4.
5 .
6.
the thorium nonresonance scattering cross
U S Th+(k)(JP
972.5 barns
2
0.877 X cm2 .
10,250 barns
2 uO
0.0949 .
0.1797 .
r - A
0.2393

7 .
201
In 8 + 5 I n 10 I n 2 k =
8- J(5,k) = J(0.2393, 13.2)
E 7.6 (from Fig. B . 1 ) .
= 12.2 barns .
The inf ini te-di lut ion resonance integral (I,) obtained i s 26.6 barns
for the case considered.
The MERC-1 program used i n the MSCR study i s a 34-group diffusion-
theory code.
thorium f a l l i n t o f ive grbups: 11, 12, 15, 16, and 22. The group-averaged absorption cross section for each of these f ive groups as a function of u
a t 649OC I s plotted i n Fig. 8-2.
The group structure i s such tha t the resolved resonances of
P The t o t a l resolved resonance in tegra l i s
plotted i n Fig. B-3 for three reactor temperatures.
Symbols
r'
I'n = Neutron width (ev)
= Radiative capture width (ev) Y
F = ,Total width (ev)
(d Wavelength of the neutron 2 3 c =
Eo = Resonance energy (ev)

202
ORNL-LR-DWG. 64606
2 4 6 8 io3 2 4 io2 up (barns)
Fig. B . 2 . Group Averaged Absorption Cross Section Versus up 649°C.

C
a
6
W
4 0 Z h
Zb a:
> W -I+ 0 2 w - W [r: 10
a
6
A B C
I I I I I I I I CURVE TEMPERATURE, "C -
9 2 5 6 4 9 2 8 0
~ 6 ' 402 2 4 io3 cr ( b a r n s )
P
Fig. B . 3 . Total Resolved Resonance Integral Versus op for Moderator Temperatures of 280°C, 649"C, and 925OC.
c

204
u = Nonresonance scattering cross section (macroscopic scattering cross section per thorium atom density)
E = Relative energy in the center-of-mass-system M = Mass of absorbing nucleus (mu)
KT = Absorber temperature in energy units (ev) p = Reduced mass of neutrons (mu)
References
1. Lawrence Dresner, Tables for Computing Effective Resonance Integrals Including Doppler Broadening of Nucleas Resonances, USAEC Report ORNL-CF 55-9-74, Oak Ridge National Laboratory, September 19, 1955.
2. D* J. Hughes and R. B. Schwartz, Neutron Cross Sections, USAEC Report BNL-325, Brookhaven National Laboratory, July 1, 1958.

i
!
*
205
Appendix C
ENERGY DEPENDENCE OF ETA OF 233U*
C. W. Nestor
A parameter of great in te res t i n nuclear calculations of a thorium
reactor i s q, the number of neutrons produced per neutron absorbed.
perimental information on the energy dependence of q i n the range of 0
t o 10 ev as measured a t the MTR was used t o calculate group averaged f i s -
sion cross sections, using absorption cross sections calculated from the
recent t o t a l cross section data1,* and the scat ter ing cross section as
calculated by Vogt.’
t ions was normalized t o a 2200 m/sec value of 2.29.3
Ex-
The q values used i n preparation of the cross sec-
In the energy range of 0 t o 0.8 ev, q was assumed t o be constant a t
2.29.
values of Ef = qua were calculated by numerical evaluation of the inte- gra l s
I n the range of 0.8 ev t o 10 ev, as mentioned, group averaged -
where Au denotes the lethargy width of the group*
I n the range of 10 ev t o 30 ev q was estimated t o be 2.17; the data
of Gaerttner and Yeater4 indicate an average q i n t h i s range of about 0.95 times the 2200 m/sec value.
*Adapted from ORNL-CF 61-6-87 (Rev).

206
From 30 ev t o 30 kev, q w a s assumed t o be 2.25; t h i s i s the value
reported by Spiv&’ e t al . , at 30 kev.
From 20 kev t o 900 kev, measurements of q are a ~ a i l a b l e ; ~ f iss ion cross sections are reported i n BNL-325 fo r the range 30 kev t o 10 MeV. The t o t a l cross section i n th i s range w a s taken t o be equal t o tha t of
235U, as suggested by J. A. Harvey.l The value of V was assumed t o be l inear i n energy with a 2200 m/sec value of 2.50 ( re f . 3) and a slope of 0.127 per
values from 0.01 ev t o l k e v i s shown i n Fig. C.l. l i s t e d i n Table A . l of Appendix A.
A plot of the experimental q and the group averaged
Group values are also

? i
2 07
1
; *
, - , I
.

208
References
1. J. A. Harvey, ORNL, personal communication t o C. W. Nestor, ORNL, March 1960.
2- M. S. Moore, MTB Nuclear physics Group, personal communication t o C. W. Nestor, ORNL, March 1960.
3 . J. E. Evans, reported a t the Argonne National Laboratory Conference on the physics of Breeding, October 1959.
4. E. R. Gaerttner and M. L. Yeater, Reports t o the AEC Nuclear Cross Section Advisory Group, USAEC Report Wash-194, USAEC, February 1958.
5. P. E. Spivak e t a l . , Measurement of Eta fo r 233U, 235U, and 239Pu with Epithermal Neutrons, J. Nucl. Energy, 4:70 (January 1957).
G. N. Smirenkin e t al., J. Nucl. Energy, 9:155 (1955). 6-
.

209
Appendix D
THE MERC-1 EQUILIBRIUM RUCTOR CODE
T. W. Kerlin
Introduction
The M E N - 1 code automatically calculates the composition of a fluid- fuel reactor so that equilibrium and criticality conditions are simul- taneously satisfied. code and the ERC-10 equilibrium reactor code as chain links. were previously used separately at ORNL in iterative calculations to de-
MERC-1 uses the MODRIC' multigroup-diffusion-theory These codes
termine equilibrium reactor compositions. Central Data Processing Group at the Oak Ridge Gaseous Diffusion Plant as a replacement for GNU.2 of ERC-!jO3 one chain link to the other until sufficient iterations have been performed to cause criticality and equilibrium requirements to be satisfied simul- taneously. The output consists of equilibrium concentrations, a neutron
MODEIC was developed by the
The ERC-10 code was prepared as a later version The MERC-1 code automatically transmits necessary data from
balance, and fuel-cycle costs. The system which is considered in the MERC-1 analysis is shown in
Fig. D.1. A complete specification of data required for controlling the f l o w and losses in each stream is included in the MERC-1 input. Note in Fig. D.1that material is removed from the reactor system by losses, waste, and sale as well as by nuclear transformation (decay and neutron absorp- tion), and that fresh material is fed to the system. Therefore, the cal- culated equilibrium concentrations are in equilibrium with respect to the fee4 and discharge rates as well as with respect to nuclear transformation rates.
"heory
MODRIC is a typical neutron-diffusion-theory code. It allows 50
neutron energy groups with downscattering from a group to any of the

210
OR NL- LR - DWG 768 24
Recycle
4 Processing
1 Plant
I- 2
Losses
Waste
Sales
IC. Loss
-&- Waste
=8- Sales
The reactor may have os many as two active regions, ondeach region * may contain either or &oth of the fluid streams
Fig. D.l. The Reactor System.

211
following ten groups. It will perform concentration searches on specified elements. tions, group macroscopic cross sections, normalized nuclear events (ab- sorptions, fission,leakage, etc. ) by region and group, absorptions and fissions by material and region, group flu distributions, and fission
The output consists of criticality search converged concentra-
density distributions. ERC-IO requires extensive input. Rewriting of large quantities of
input is avoided by using basic input decks which include lnformation ap- plicable to a number of cases. only to specify changes in the basic input deck. prepare a basic input deck for a particular reactor with a given power level. A set of cases with different power levels would need only the basic input deck and the new power level as input.
. To specify a new case, it is necessary
For instance, one might
Basically, ERC solves two equations. They are:
dN.. f V. = Qij + Rij + Fij + Tij + Dij
df
or if the material must be fed to maintain criticality
Equation (2) is just the conservation requirement, saying that enough fis- sile material must be added (or removed) h iteration 's to Overcame the neutron production deficiency (or excess) in iteration (s-1). These are inner iterations in ERC. The terms are defined as:
v Nij
= volume of stream j , cm3, =,atoms of material i per barn cm of stream j ,
j
U t = time, sec,

212
= feed rate of material i into stream j, atms/sec, = rate of growth of material i in stream j due to recycle from
= rate of growth of fission fragment i in stream j, atoms/sec, = rate of growth of material i in stream j due to neutron ab-
= rate of growth of material i in stream j due to radioactive
= rate coefficient for loss of material i in stream j because
= rate coefficient for loss of material i in stream j because
Qi j Ri j
Fi j
other streams, atoms/sec ,
sorptions in other materials, atoms/sec,
decay of other materials, atoms/sec,
of neutron capture, atoms per sec per atom/parn cm,
Di j
diJ of radioactive decay, atoms per sec per atm/barn’cm, \
= rate coefficient for loss of material i in stream j because
= rate coefficient for growth of material i in stream j because
qij
r ij
of processing removal, atoms per sec per atm/barn cm,
of recycle frm stream j, atoms per sec per atom/ba;rn cm, = neutrons produced per fission in material i, “i
.P A
= reaction rate coefficient, number of fissions in material i Cijk
a
per atom/barn cm in stream j in region k per fission neutron born in reactor,
Cijk = reaction rate coefficient, number of absorptions in material i per atm/barn cm in stream j in region k per fission neutron born in reactor.
Superscripts:
i = material, j = stream, k = region.
The use of stream and region indexes allows reactors with two streatns in 3 the same region to be analyzed. <
The equilibrium concentration calculdtions in ERC use reaction rate coefficients (Cijk) obtained frum an earlier MQDRIC calculation. the initial concentrations used in the MODRIC calculation will not, in general, agree with the equilibrium concentrations computed by ERC. This new set of concentrations will alter the neutron spectrum and flux level, thereby changing the reactioi rate coefficients. Therefore, it is neces- say to repeat the MOD3IC criticality calculation with the latest value for the estimated concentrations to get new reaction rate coefficients-
However,

213
This process is repeated until the MODRIC and ERC concentrations are equal. The flow of information in the code is shown in Fig. D.2.
The reaction rate coefficients (Cijk) used in ERC are spectrum-averaged cross sections which are available directly from MODRIC. culation gives A material i in region k, normalized to 1.0 total neutron produced. distribution of nuclear events between two streams in a region is accom- plished by introducing the stream volume fractions, fjk, in this manner:
The MODRIC cal- and VFik, the absorptions and neutron productions in ik
The
atoms of i in stream j in region k a. Aijk = Aik*( atoms of 3. in region k
, atoms of i in stream j in region k f atoms of i in region k yiFijk = YiFik
The multiplying factor in each term is
atoms of i in stream j in region k , atoms of i in region k
j where the units on these factors are
- atoms of i in stream j - Nij barn cm of stream j '
cm3 of stream j in region k f = jk cm3 of region k
The material, stream, and region dependent absorption and production terms are automatically transfe MERC-1 calculatian. ERC obtains the reaction rate coefficients (intensive quantities) from the absorption and production terms (extensive quantities )
ed from the MODRIC link .t;o the ERC link of the
by dividing by Nij, the stream concentration ~

t
214
OR N L - LR- DWG 7682 5
First Guess at Concent raf ions
1 - 1
I I I I I I 1 -i I I I I I I
-------- J
-..-------- ------ ------eo--
MODRIC and ERC agree on all concentrations
Is maximum number of ffoM ~ iterations exceeded Nohs t Output
t Output
Fig. D.2. The MERC Flow Diagram.

2 15
V F i ijk Ni j
Vi Cijk - -
The absolute reaction rate coefficient Ei jk is obtained in the ERC cal-
culation using the total neutron production rate as determined by the re- actor power
-a - a X 3.1 X 10l6 P T X lo-", 'ijk - 'ijk
where
3.1 X 10l6 = number of fissions per sec per megawatt,
P = power level in megawatts,
V = average number of neutrons produced per fission -
Nij Cijk f Vi - i jk -
E N i j Cf ijk i jk
A similar argument applies for the fission reaction rate. The restriction to fluid-fuel reactors occurs because the ERC calcu-
lation requires that the reactor discharge composition be equal to the mean reactor canposition. This restriction i s satisfied in fluid-fuel re- actors but not in solid-fuel reactors where the discharge has experienced a much greater exposure than the mean.
products were calculated by reference to a standard absorber exposed to the MSCR spectrum of neutrons as generated by the multigroup program Modric. The thermal cross section and the resonance integral can be used in a two- group model to calculate relative one-group cross sections.
In ERC-10, effective, one-group cross sections of individual fission
Thus, set
where the bar denotes effective, one-group values, "e" denotes "eipthermal," and "t" denotes "thermal." Rearranging and taking a ratio of the cross

216
section of the ith material to that of a standard material, denoted by the subscript "s,"
. The epithermal cross section is defined in terms of the resonance integral by the relation
u = e RI ue
= -
. where ue is the lethargy at the lower energy bound of the epithermal group.
The ratio - is obtained by equating the slowing down current from the epithermal group to neutrons absorbed or leaking in the thermal group.
@e @t
where C is the "removal" cross section. r,e
Let C r 6 CT,JUe r,e
where T denotes "total." Ignoring leakage gives
Combining these results gives
- . - [u t ,e u i = u s [ut,s + K(RI)s]
,

217
where
The spectral index, K, is computed by Modric from input data. The reference element was the standard absorber referred to above. reference element cross section and the effective flux integrated Over the core is computed from Modric output by dividing the fraction of neutrons as absorbed by the reference element by its atomic density, Ns. product is the desired number for use in the ERC calculations; the working e quat i on be come s
The product of the
This
The thermal cross sections u are computed from the 2200 m/s cross t sections by multiplying by a factor that averages them Over a Maxwell- Boltzman spectrum around the reactor temperature. for a l/v enera dependence of the kross section and applied uniformly to all fission product isotopes, except noble gases,
This factor was canputed
In all, 115 fission product isotopes were so treated, linked by trans- mutation and decay into chains. each at a rate determined by its chemical or physical properties in rela- tion to the processing method. For instance, xenon is removed rapidly by transpiration in an expansion chamber, whereas rare earths are removed only by discard of the fuel salt with a period measured in hundreds of days.
Xenon was treated separately in the Modric calculation, not only to
Provision was made in ERC-11 to remove
determine accurately its effective cross section in the MSCR neutron spec- trum but also to permit special treatment of its exceptional behavior. It may be possible to remove xenon rapidly from the fuel solution by circulat- ing a portion of the salt through the dome of the expansion tank mounted over the core (Sec. 4.2.2) provided the xenon does not diffuse rapidly into the moderator graphite. the extreme cases (complete absorption in graphite vs. zero absorption) as well as intermediate situations where remmal competes with absorption.
Provision was made in ERC-11 to calculate

,- 218
w - Samarium was also treated separately because of its importance. The fission product calculation is thought to result in a reasonably
good approximation of the poisoning in reactors where the fission products are exposed to neutrons for a lo?zg time. generation isotopes by transmutation and decay is treated in detail. transient period following start-up of a clean reactor with an initial loading of 235U is ignored, and all concentrations are calculated at their maximm, equilibrium values. Hence, the poisoning is overestimated - some- what, thus providing a margin of safety in respect to assignment of the
The ingrowth of second and higher The
cross sections and resonance integrals. The fission-product reaction rate coefficient is obtained by reference
to a specified standard absorber:
where
CFp = fission-product reaction rate coefficient,
CR = reference material reaction rate coefficient,
oFP = effective fission-product absorption cross Fection,
crR = effective reference material absorption cross section.
The effective cross section ratio is obtained from a two-group formu- lation:
(J FP ((Jl g1/g2 + u2
R ’ - = (J R (B1 g1/g2 + (321
where
= fast absorption cross section u1
th U th U

219
- U 2 = ak;sor>tion cross section averaged Over the thermal flux,
= fast flux,
f12 = average thermal flux.
For a two-group treatment, all neutrons removed from the fast group must either be absorbed or leak from the reactor while thermal:
= c G~ + D B ~ d2 'R $1 a 2 1
Ignoring leakage,
Also,
where
f = thermal spectrum factor = q l ~ ) ~ 29' + 273 ) for a -ell- Boltzmann distribution,
02200 = 2200 m/s absorption cross section. a
Substituting Eqs. (CC), (5), and (6) into Eq. ( 3 ) gives
where
K is calculated as follows:
K = WS,
c

220
w=-- - input t o linkage section of input, f a u
S = ca &, = value automatically calculated by MODRIC. 2
The value of a m u s t be specified i f f i ss ion product option 1 i s speci: iel
on card BN=5. for K. culated by the code using the l a t e s t value of K. c r 2 2 0 0 and R I f o r a special reference material are b u i l t i n to the code for f i ss ion product option 2. a 2200 m/s cross section of 1.0 barns are bu i l t i n to the code. t o use f i ss ion product option 2, the reference element must correspond t o an a r t i f i c i a l element i n MODRIC which has cross sections fo r a l /v absorber
This value should be calculated using an estimated value If f i ss ion product option 2 is specified on card BN-5, a i s cal-
The required values of
a The nuclear constants fo r a l/v absorber with
Therefore,
with g;*Oo = 1.0.
R e f e re nc e s
1. J. Replogle, MODRIC - A One-Dimensional Neutron Diffusion Code, USAM: Report K-1520, Oak Ridge Gaseous Diffusion Plant, September 1962.
2. C. L. Davis, J. M. Bookston, and B. E. Smith, GNU-11, A Multigroup One-Dimensional Diffusion Program f o r the IBM-704, GMR-101, General Motors, November 12, 1957.
L. G. Alexander, ERC-5 Program f o r Computing the Equilibrium States of Two-Region Thorium Breeder Reactors, USAEZ Report ORNL CF-60-10-87, Oak Ridge National Laboratory, October 1960.
3.

221
Appendix E
FISSION mODUCT NUCLEAR DATAa
L. G. Alexander
Cross Resonance
go, barns RI, barns
b Fission Yield B, Decay Section Integral h, sec-l Number Isotope
233u 2 3 5 ~
26 27 28
& 29 30 31 32 33 34 35 36 37 38 39 40 41 42 43 44 45 46 47 48 49 50 51 52 53 54 55 56 57 58 59 60 61 62
m
0.007 0.0045
0.012 0.019 0.006 0.032 0.019 0.040
0.050 0.065 0.065 0.065 0.067 0.070 0.068 0.057
0.062
0.053 0.052 0.044 0.048
0.030 0.024 0.0097 0.016
0.005 0.0028 0.0015 0.0006 0.0003
0.0028 0.0014
0.00544 0.010 0.00293 0.0202 0.010 0 249
0.0357 0.0479 0.0577 0.0584 0.0603 0.0645 0.0640 0.0633
0.0627
0.0609 0.0578 0.0630 0.0606
0.050 0.041 0.018 0.030
0.009 0.0038 0.0019 0.0007 0.00024
0.214 X
0.298 X lom5
0.229 x
Compiled from Appendix E list of references.. a
2.1 3.3 45 205 0.16 7 0.06 0.91 0.13 1.3
0.0055 1.31 1 1.2 0.15 1.1 0.076 0.053
1.4 60 45 201
29 5.5
0.04 0.67 O.2lc (0.6)
0.06 0.78 1.8 9 0.55 28 0.2 0.07
13.9 1.2 2.2 0.51 0.3 22.2 1.7 5 1.44 0.7
184 6 11 6 10 10.7 0.28
109 34 16 5.6 6.2
140 7 77 11 8
1030 19 76 I2 40 169 10
bAtoms per fission. C ad Values in parentheses estimated by comparison with similar nuclides.

222
Fission Product Nuclear Data (continued)
Fission Yield Cross Resonance
ga, barns RI, barns Decay Section Integral A, sec'l Number Isotope
23321 23 5u
63 lo',,
64 1llCd 65 112Cd
68 l151n
66 l13Cd 67 l14Cd
69 116Sn 70 125Te 71 1.26Te 72 128Te
75 128xe 76 l2 'Xe 77 l3 Oxe 78 131xe 79 l3 2 ~ e 80 133Xe 81 134Xe 82 1 3 5 ~ e 83 l3 6 ~ e 84 133Cs 85 134cs 86 135cs 87 136cs 88 137cs 89 138cs
73 1 2 7 ~ 74 lZg1
90 134Ba 91 136Ba 92 137Ba 93 138Ba 94 139La 95 140ce 96 14%e 97 142ce 98 1 4 3 ~ e
101 143Pr
99 141- 100 142-
102 144-
103 143Nd 104 144Nd 105 la5Nd 106 146Nd 107 147Nd
0.0004 0.00025 0.0002 0.0002 0.0002 0.0002
0.0024 0.010 0.0039 0.02
0 037 0.051
0 066d 0 067 0.069 0.062
0.067e
0.072
0.068 0.064 0.061
0 057
0.059
0.052 0.041 0.030 0.023
0.0003 0.00019 o.ooo1 0.0001 0.0001 0.0001
0.0005 0.0037 0.0013 0.009
0.0293 0.0438
0 0806d 0.0641 0 0646 0.0659
0.0641
0.0615
0.0574 0-0655 0.0644
0.0595
0.064
0 0598 0 - 0567 0.0395 0.0307
c
0.152 X
0.211 x 10'~
0.110 x 10⁻⁷
0.296 X
0.617 X 0.666 X lo'' 0.362 X
0.251 X
0.601 X
0.660 X
0.710 X
dIncludes indirect yield from 13Q. e Included in Xe yields.
91 u20 2 52 1 13
59,500 652 1.2 15
228 3300 0.006
0.8 12 0.3 2 6.2 154 27 39 5 45 45 302 5 45
I20 806 0.2 1.8
190 I270
1.56 (0.8)
0.2 0.6 3.344 X 10 0.6512 X 10
0.15 28 137 8.7
0.11 8-7 2 0.4 4.9 0.68 8.9 0.66
0.94 6
18.0 89
308 5 67 10 180
11.5
0.1 420 1400 62.0
0.3 62 (1) (0.2 1 (2.5) 0.3 11.0 0.5
1.3 (3) 23.5 (9.0)
(0.45 x 10)
130 12 245 25
2510

223
Fission Product Nuclear Data con t inued )
~ - ~~ ~ ~~~~~~~
Fission Yield Cross Resonance
gu, barns RI, barns Number Isotope Decay Section Integral
2 3 3 ~ 2 3 5 u h, sec-l
108 109 110 111 112 113 114 115 116 117 118 119 120 I21 I22 I23 124 125 I26 127 128 129 130 131 132 133 134 135 136 137 138 I39 Ut0
TOTAL
148Nd l4 'Nd lS0Nd lS1Nd 1 4 7 h 14 8-
1lc7sm lc8sm l4 '~m
Osm 15%m l5 2 ~ m 1 5 3 ~ m 1 5 4 ~ m 1 5 3 ~ ~ 1 5 4 ~ ~ 1 5 5m
1 5 4 ~ 1 5 5 ~ 1 5 6 ~ 1 5 7 ~ 1 5 8 ~ 1 5 5~
6 E ~
l5 'Tb %r " ~ r 1351
l3 5Ba 1 5 1 ~ ~ 1 5 2 ~ ~
160Tb 13'Te
0.012
0.0048
0.017
0.0062
0.0026 0.0017
0.00037 0.00095
0.00015 0.00005 0.5 x 10-~ 0.1 x 10⁻⁴
0.5 x 10⁻⁵
(f)
0 027
0.0170
0.0067
0.0238
0.0113
0.0045 0.00285
0.00077 0.0015
0.0003 0.00013 0.78 x 10⁻⁴ 0.2 x 10⁻⁴
0.1 x 10⁻⁴
(f 1
0.020
0.963 X
0.700 X 0.846 X 0.151 X
0.301 X
0.410 X
0.137 X
0.521 X 0.129 x 10'~
0.107 X
0.148 X
0.289 X
3.4
1.5
180 27,000
87 9
87,770 85
10,260 194
5 382
1500 8490
58,000 4
0.24 X lo6 3.9
46 130 1.5
5.6 8400 5500
525 0.5
48
14
2510
690 50
2440 460 3565 2500
25 1380 750 4245
1630 44 740 29
420 (65) 0.7
(3 1 (4200) (2750) (262 )
2.6
2.02285 2.06485
'Yield of 1351 combined with that of 135Xe.

224
References
1.
2.
3.
4.
5.
6.
7.
8.
9.
10.
11.
J. 0. Blomeke and M. F. Todd, Uranium-235 Fission-Product Production A s a Function of the T h e m 1 Neutron Flux, I r radiat ion Time, and Decay Time. 11: Summations of Individual Chains, Elements, and the Rare-Gas and Rare-Earth Groups, USAEC Report ORNL-2127, Pt. 11, Vols. 1, 2, and 3, Oak Ridge National Laboratory, November 1958.
J. D. Garrison and B. W . Roos, Fission Product Capture Cross Sections, Nucl. Sci . Eng., 12: 115 (January 1962).
E. A. Ne hew, Thermal and Resonance Absorption Cross Section of the 233U 9 23%, and 23%u Fission Products, USAEC Report OW-2869, Oak Ridge National Laboratory, March 1960.
J. J. Pattenden, Fission Product Poisoning Data, USAEC Report ORNL 2778, Oak Ridge National Laboratory, October 1959.
C . R. Greenhow and E. C. Hensen, Thermal and Resonance Fission-Product Poisoning f o r 23% System, USAEC Report WL-2172, Knolls Atomic Power Laboratory, October 1961.
N. F. Wikner and S. Jaye, Energy-Dependent and Spectrum-Averaged Thermal Cross Sections f o r the Heavy Elements and Fission Products f o r Various Temperatures and C: "'U Atom Ratios, USAEC Report GA-2113, General Atomic, June 1961.
R. L. Ferguson and G. D. O'Kelley, A Survey and Evaluation of 233U Fission Yield Data, WAEC R e p o r t ORNL (37-62-3-71, Oak Ridge National Laboratory, March 1962.
E . C . Hensen, A Cr i t i ca l E W n a t i o n of the Uncertainties i n Predicted Gross Fission Product Poisoning, USAEC Report KAPL-M-ECH-8, Knolls Atomic Power Laboratory, March 1962.
E. C. Hensen and C. R. Greenhow, An Improved Generalized Analysis of Fission Product Poisoning and Thermal and Resonance Fission Fragment Cross Sections, USAEC Report KAPL-M-ECH-7, Knolls Atomic Power Laboratory, September 1960.
C . H. Wescott, Effective Cross Section Values f o r Well-Moderated Thermal Reactor Spectra, Canadian Report ~ ~ - 7 8 7 (Rev. August 1958)s
J. 0. Blomeke, Nuclear Properties of 235U Fission Products, USAEC Report OW-1783, Oak Ridge National Laboratory, April 1957.
A E C L - ~ ~ O .

225
Appendix F
TREATMENT OF DELAYED NEUTRONS
T. W. Kerlin
Summar v
Circulating fuel reactors lose neutrons because some of the delayed neutrons are emitted outside of the core. residence time, external loop residence time, and decay characteristics of the precursors.
These losses depend on core
A symbolic representation of the system is
where
+-4-, Exchanger
= decay constant o he ith precursor from fissionable material
= number of ith precursors formed per fission neutron from fis-
'i j
"j sionable material j,
j,
E atms of ith precursor per unit volume of fuel stream in the N i j ~ core resulting from fissions in material j,
= atoms of ith precursor per unit volume of fuel stream in the N i j ~ external loops resulting from fissions in material j,
f = volume fraction of fuel in the core, C

226
fE = volume fraction of fue l i n the external loops,
Vc = core volume,
VE = external loop volume,
V C @fcVc = r a t e of production of f i ss ion neutrons i n the core from fissionable material j . j f j
The precursor concentrations are described by these equations:
mi *c J = $. .v.c .@ - mijc , dtC 13 J fJ
mi *E dtE J = -hNijE ,
where
t = time i n the core,
tE = time i n the external loops. C
The boundary conditions are:
where
T
TE = t h e for the fue l stream t o pass through the external loops.
= time for the fue l stream t o pass through the core, C
The solution t o Eqs. (1) and (2) are:
-A. .t Y
1J C -A. .t
- - i j Ni j c

227
-A t ij E NijE NijE ( 0 ) e
Note that the precursor production rate is assumed constant for the fuel stream during its stay in the core. This idealized case would exist only for uniform power density along the fuel stream or for core residence times which are short compared to the half-life of the precursor.
The boundary conditions become
-A T ij E Ni jc ('1 E NijE(o) e - -
Eliminating N (0) in Eqs. (7) and (8) apd substituting Eq. ( 6 ) gives
i jc the result in
( 9 ) i
NijE - 1 - e
L J
The rate of decay of precursors in the external loops is
ij E 1 - e f V . L = Ni E E E TE
The total rate of precursor cay (at equilibrium) is f3. V . C g5f V . Thus fraction of the delayed
J fj C C utrons which appear in external loops is
Ni jEfEvE fEVE ( 1 - e -hi jTc ) [ 1 - 2 -%,jTE)
(11) TE - BijVjCfjg5fcVc - -A. .(Tc + TE) 1 '
the

228
f ~ V ~ T~ fcVc Tc
Since - = - , Eq. (119 becomes -A T (1-e - e -hijTE
-A. .(Tc + TE) ij c) ( !?LE=
I ' pi j
For using these results in an equilibrium reactor code such as ERC-51
the term V.C .# Fay be replaced by a neutron production rate given by J fJ
where
cf = reaction rate coefficient for fissions in material j. 3
Using this in Eq. (12) gives the following result for the number of neutrons lost in the external loops per neutron produced:
-Ai jTE f . ( 1 - e +ijTc) ( 1 - e
I losses = 1 N j C j v j 3 i -A. .(Tc + TE)
The necessary constants for 232Th, 233U, 235U, 238U, and 239Pu are:2
235u 2 3 8 ~ 23 9pu 232m 233u Group Ai( see'' ) - 1 0.0128 0.00085 0.00020 0.0003 0.00015 0.0001 2 0.0315 0.0035 0.00075 0.0018 0.0017 0.0006 3 0. I25 0.0045 0.00105 0.0022 0.0028 O.OOOCt5 4 0.325 0.0120 0.00075 0.0023 0.0071 0.00085
6 4.5 0.0009 0.0002 0.0015 5 1.55 0.0045 0.00025 0.0007 0.0042 0=0003
0.02625 0.0030 0.0075 0.01745 0.0023

229
References
1. L. G. Alexander, ERC-5 Program for Computing the Equilibrium Sta tes of Two-Region, Thorium Breeder Reactors, ORNL-CF-60-10-87 (October 20, 1960 ) .
2- A. M. Weinberg and E. P. Wigner, The Physical Theory of Neutron Chain Reactors, p. 136, The University of Chicago Press, Chicago, 1958.

230
Appendix G
TREATMENT OF XENON ABSORPTION IN GRAPHITE
L. G. Alexander
Introduction
Some 135Xe is formed directly during fission; however, the major part (>9@) is formed by the decay of 1351 which has a half-life of 6.7 hours. The iodine remains in solution as the iodide ion (I-)= equilibrium, the rate of formation of xenon in the fuel is proportional to the sum of the direct fission yields of xenon and iodine, here taken to be 0.066 atoms per fission.
life for the decay of 1351 is long compared to the time required for the fuel to make one complete trip around the fuel circuit (about 15 seconds), the rate of release of 135Xe is nearly uniform throughout the fuel volume, being augmented somewhat in the core by the direct fission yield. purposes of this study, the concentration of xenon in the salt was assumed to be uniform.
Thus, at
All of the xenon is released in the fuel salt, and since the half-
For
The solubility of noble gases in molten salts is low (l), especially A concentration of only 2 X loi5 atoms of xenon in mixtures of LiF-BeF2.
per cc of salt at 1200°F is in equilibrium with a partial pressure of xenon in the gas phase of one atmosphere. the equilibrium pressure is about 0.06 atmosphere.
In the reference design case,
Xenon thus tends to leave the salt at any phase boundary. It may form microbubbles clinging to the surface of the graphite moderator. will tend to diffuse into the pores of the graphite. rapidly by spraying a portion of the circulating stream into a space filled with helium or by subsurface sparging with helium.
action with neutrons to form 136Xe, which is stable and has a low neutron capture cross section.
It It can be removed
Xenon is also removed from the system by decay to 135CS and by re-

1
231
Ana ly s i s
I
Watson and Evans1 have analyzed the equilibrium xenon poisoning re- sulting from the interaction of all these modes of production and removal, obtaining an equation which may be rendered in the form
?iy Xe P.F. = - - V
where
P.F. = Poison &action, or number of neutrons absorbed by xenon per neutron absorbed in fissile isotopes,
- q = neutron productions, number of neutrons produced from all
sources per neutron absorbed in fissile isotopes (2.21 in reference design),
Y = sum of fission yields of 135Xe and 13%, taken as 0.066 atoms per fission,
c
V = neutron yield, or number of neutrons produced from fission per fission ( 2.50 in reference design),
gc = mean effective flux in reactor core (neut-cm/cm3 sec),
Captures a = effective 13%e neutron capture cross section neut-cm Atom Xe,
cc
= volume of fuel stream in core (600 ft3), vf c Vf = volume of fuel stream (2500 ft3),
'i\ = decay constant for 135Xe, 2.09 X 10'5/sec,
d - ti - rate of diffusion of xenon into graphite, atoms/sec,
= rate of removal of xenon by sparging, atoms/sec, S
n = number of atoms of xenon dissolved in fuel salt. f

- f--
232
u4 The produce a i s readi ly evaluated by reference t o a multigroup
C calculation. Thus
g c a N c V c = F V A
where
N = concentration of xenon atoms i n the cor
V = volume of core, cc, C
C
F = f i ss ion r a t e i n core, fissions/sec,
I tom /C
A = f ract ion of a l l neutrons captured i n 135Xe.
The f i ss ion r a t e i s readily calculated from the power, using the conver- sion: 3.1 X 10l6 fissions/Mw-sec. Solving for the product;
3.1 X loL6 P V
vC Fc 0 =
The r a t i o A/Nc is, a t low concentrations, independent of pJc and may
In the re f - be determined by means of a multigroup neutron calculation. erence reactor it has a value of 2.22 X
By insertion of numerical values, it i s found tha t gc a equals 2.54 X
captures/ c c atom Xe sec .
cc
The r a t i o is/nf i s equal t o the volumetric r a t e of sparging divided
Let Q be the f u e l stream r a t e of flow by the volume of the f u e l stream. through the core (160 f t3/sec) and r be the fract ion of t h i s diverted through a sparrge or spray chamber. Then
:s/nf = rQ/Vf
For the term Ad, Watson and Evans give a r e l a t ion which may be rendered
1/ 2 n = N* A D(gc a + A)] d g g
i
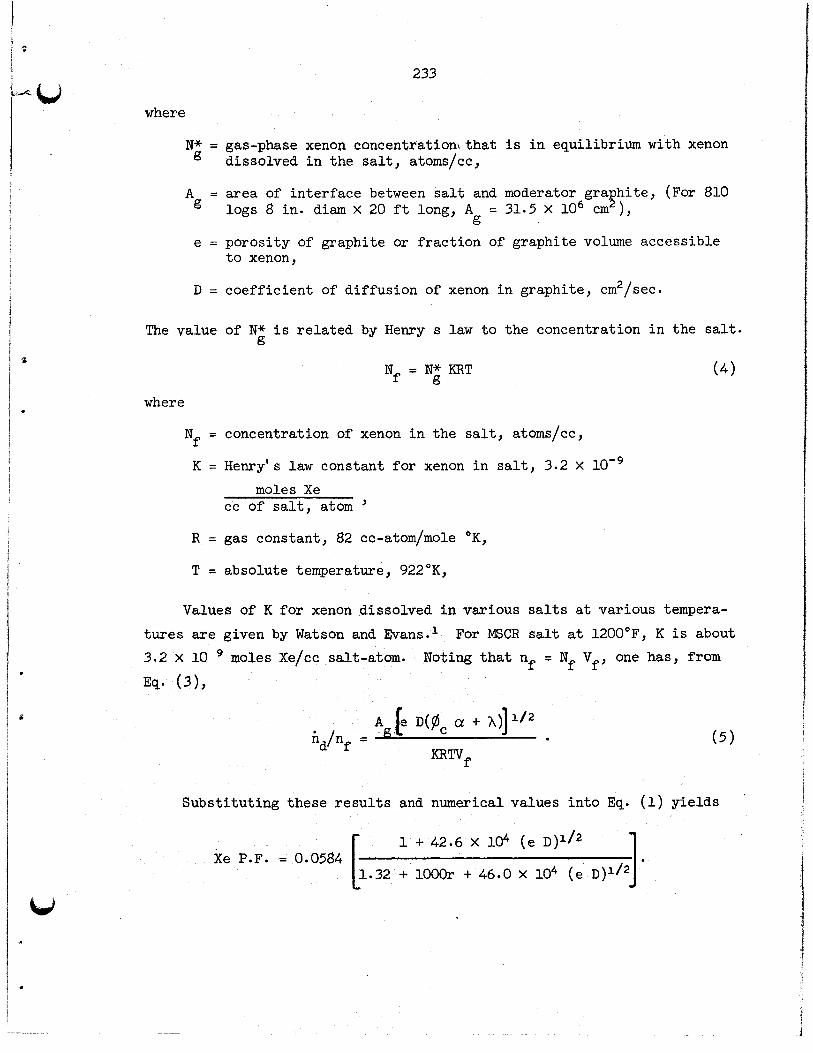
233
where
N* = gas-phase xenon cancentrationithat is in equilibrium with xenon dissolved in the salt, atoms/cc,
A = area of interface between salt and moderator gra hite, (For 810 8 logs 8 in. diam X 20 ft long, A = 31.5 X lo6 cm ), g
e = porosity of graphite or fraction of graphite volume accessible to xenon,
D = coefficient of diffusion of xenon in graphite, cm2/sec.
The value of N* is related by Henry s law to the concentration in the salt. g
Nf = Ng” KRT where
(4)
Nf = concentration of xenon in the salt, atoms/cc,
K = Henry’ s law constant for xenon in salt, 3.2 X 10’’
moles Xe cc of salt, atom ’
R = gas constant, 82 cc-atom/mole OK,
T = absolute temperature, 922OK,
Values Of K for xenon dissolved in various salts at various tempera- tures are given by Watson and E3ans.l 3.2 X 1Q
For MSCR salt at 1200°F, K is about moles Xe/cc salt-atom. Noting that nf E; Nf Vf, one has, from
Eq* (3 1,
Ag[e D(FC a + tid/nf =
mwf
Substituting these results and numerical values into Eq. (1) yields
1 + 42.6 X lo4 (e D ) l 1 2
-k l O O O r + 46.0 x lo4 (e Xe P.F. = 0.0584

2
234
Values of the poison f r ac t ion calculated by means of t h i s equation for
various values of r and the product e D axe displayed below i n Table G.1.
Table G.l. Xenon Poison Fraction i n MSCR
0.1 0.054 0.0445 0.0173 0.0006
0.01 0.054 0.053 0.0445 0.0052
0.001 0.054 0.054 0.053 0.0251 ~~
a I n cm2/sec.
Reference
1. G. M. Watson and R. B. Evans 111, XenoiDiffusion i n Graphite: of Xenon Absorption i n Molten S a l t Reactors Containing Graphite, USAEC Report ORNL CF-61-2-59, Oak Ridge National Laboratory, February 1961.
Effects

235
Appendix H
state is obtained by setting the time derivative of the nuclide concen-
THE EQUILIBRIUM STATE AS A BASIS FOR ECONOMIC EVALUATION OF THORIUM REACTORS
T. W. Kerlin
Introduction
The equilibrium condition is currently being used as the basis for fluid-fuel reactor economic evaluation and for new computer code develop- ment. the equilibrium state, it is advisable to clearly define equilibrium and to assess the validity of evaluations based on the equilibrium condition. These problems were considered in this study for thorium-fueled reactors, fueled initially with 235U, and particularly for the molten-salt converter reactor (MSCR).
Because of this increasing application of calculations based on
The equilibrium condition is defined as that condition in which the reactor composition is time independent because of a balance between nuclide production rates and loss rates. these are the total production and loss rates (including feed, recycle, discharge, processing losses, etc.) and are not restricted to nuclear transformation rates.
It is important to note that
The mathematical formulation of the equilibrium
where
Ni = nuclide concentra of ith nuclide,
t = time, f Qi = feed rate,
= recycle rate, ad Ri

236 . .
= f i ss ion fragment formation r a t e ,
= growth r a t e due t o neutron capture i n other materials,
= growth r a t e due t o radioactive decay i n other materials,
Fi
Ti
Di
= loss r a t e due t o neutron capture i n ith nuclide, ti
= loss r a t e due t o radioactive decay of ith nuclide, di
qi = processing loss ra te .
Equation (1) should be val id for reactor evaluation i f Che nuclide con-
centration i s near equilibrium (90-.95$) Over a large fract ion (90-.95$) of the reactor 's operating l i f e .
Estimates of the s a t x a t i o n behavior of the nuclides of in te res t i n
thorium-fueled reactors were made using the methods discussed below.
Methods
The time-dependent behavior of the nuclide concentrations i n a thorium-
\ fueled reactor, fueled i n i t i a l l y w i t h 235U, w a s calculated by solving
m= (1) without the r e s t r i c t ion tha t dNi/dt = 0. individual isotopes along w i t h special assumption f o r each case i s given
The treatment fo r the
below:
1. Fission Products
Assume tha t f i s s ion products xre produced a t a constant ra te , S, and
are removed by neutron capture, radioactive decay, and processing.
leads t o This
- mi = si d t
where
T = time t o process a complete reactor volume.
Solving Eq. (2 ) gives

!
I
t t I I t I
237
c
The fractional saturation is
Nib) -(ti + di + &) 7 -- - 1 - e Ni (a)
( 4 1
A lower limit on the fractional saturation at any time may be obtained by setting ti = di = 0. This gives
2. Uranium-233
Neglecting processing losses and captures in 233Pa, the concentration of 233U is given by
where
N23 = concentration of 233U,
NO2 = concentration of 232Th (assumed invariant),
'2 = effective capture cross section of 2 3 2 ~ ,
$5 = neutron flux (defined below),
u23 = effective absorption cross section of 233uD a
The neutron flux is given by
Wf@ = P x 3.1 X lolo , (7)

238
where
P 3.1 X lolo . >'
f 0
P = reactor power (watts),
v = fuel volume (cc),
Nf = concentration of fuel (atoms/cc),
af = effective fission cross section (average over all fissile nuclides ) .
The term, VNf, is the total number of fissile atoms. atomic weight of the fissile nuclides as 235 gives
Taking the average
I
VNf = W X 2.563 X lo2' , (9) i
where
w = mass of fissile material (grams).
Substituting Eq. (9) into Eq. (8) gives
1.21 x B = 1;) x c
af
Solving Eq. (6) and using Eq. (10) gives
P - - x - x 3.816 X T
J af = 1 - e N23(t)
N23(m)
where
T = time (years).
The term, P/W, is the specific power of the fuel in units of watts/g. ratio, u*~/u~, is about 1.2 for the molten-salt converter reactor (MSCR).
The
a

239
3. Uranium-234
The concentration of 234U is given by
where
N24 = concentration of 234U,
023 = capture cross section of 233~,
u24 = absorption cross section of 234U. C
a
Solving Eqs. (6), (lo), and (12) simultaneously gives
N"(a3)
(13) - e $3
c
- a
a 1--
a24
The ratio, c724/uf, is about 0.4 for the MSCR. a
4 . uranium-235
The concentration of 2 3 5 ~ t any time is that required by the criti- cality condition. ventory is constant. This gives
For these estimates, it is assumed that the fissile in-
N25(t) = N25(a) + N23(~) - N23(t),
= 1 + N25(t) N2*5 (a) N2' (a)

240 -
-- w - I
If c~~~ = u25, as is approximately the case in the MSCR, then a a
N23 (a) CR
N25(a) 1 - CR - - ,
where
CR = corrversion ratio (assumed constant).
Using Eqs. (ll) and (15) in Eq. (14) gives
N25 (t) P a23 - - 2- x 3.816 x T w u43 CR
= 1 + e I
N25(a) 1 - CR
(15)'
The assumptions of constant fissile inventory and constant conversion ratio are very crude, but will suffice for the qualitative evaluation desired in this study.
5. Uranium-236
The concentration of 236U is given by
where
~~6 = concentration of 236~,
025 = capture cross section of 235~,
u~~ = absorption cross section of 236U0 C
a
Solving Eq. (17) and using Eqs. (10) and (16) gives

241
The r a t io , 026/of, i s about 0.1 for the MSCR. a
c
,
5
P o:6
N 2 6 ( t l = l - e uf - - - x 3.816 x T
' (18) 1 N 2 6 ( a)
P U i 6 23
X 3.816X10'4 T - - - x 3.816 ~ 1 0 ' ~ T P aa
- e 023 a 1-- o2 a
+ CRCR I ' 6. Uranium-238
The 238U appears only i n the feed along with 235U
- = ( 2 3 5 U feed r a t e ) - N 2 8 $8 @
a ' d t
where
N~~ = concentration of 23% ' a28 = absorption cross section of 238U. a
The 235U feed r a t e is equal t o the nuclear transmutation r a t e
235U feed r a t e = N 2 5 ( t ) u i 5 @ = N 2 5 ( a ) + N 2 3 ( a ) - N 2 3 ( t ) u : ~ @ I (20)

i
!
242
Solving Eq. (20) gives
. . 28 - - - a' x 3.816 x T w Of
N 2 8 ( t )
N28 (a) = 1 - e
- 28 r . . 1
- - - a' x 3.816 x T
1- w Of N 2 8 ( t )
N28 (a) = 1 - e
1
1 - CR
1 (--J 23
--- a, X 3.816 X T e af
a23
($-1)
The r a t io , i s about 0.1 fo r the MSCR. a
Results and Conclusions
The resu l t s are shown i n Figs. H.l through H.6. They are discussed
individually below:
1. Fission Products
Figure H . l shows the saturation behavior of a material removed only
by processing. In actual operation, the approach t o saturation would be
faster because of nuclear transformations. It i s clear from Fig. 1 that
the f iss ion product nuclides which saturate slowly with respect t o their
nuclear reaction ra tes are at equilibrium (9@ or greater) fo r 9% Of a
30-year reactor l i f e for processing times of less than 500 days.
day processing time ( typical for the MSCR) gives equilibrium (9w or
greater) for only 8% of the time. Therefore, the equilibrium treatment
i s doubtful for fission-product nuclides with l o w cross sections or long
half l ives .
A 1000-
However, these effects are small.

243
1
Reactor Operating Time (years)
Fig. H.1. Fission Product Saturation.
1

244
!
1.0
.9
.8
.7
-6 h
8 v m (u
.5 '== 4J v m (u 2
.4
.3
.2
.1
0
ORNLLR-
1 1 1 1 1 1 l l
(si = specific power (watts/gram)
0 2 4 6 8 10 I 2 14 16 18 20 22 24 26 28 30
Reactor Operating Time (years)
Fig . H.2. 233U Saturation.

245
j s
i
1.0
.9
.8
.7
* 6
8
2
+,
v * N
> .5 v .t N e-4
.4
.3
.2
.1
0
5
I 1;) = specific power (watts/gram) !
WG. 728t
/
6 8 10 12 14 16 18 20 22 24 26 28 30
Reactor Operating Time (years )
Fig. H . 3 . 234U Saturation.

246
10
8 - 8
2
v
2 6 2 9 4
” 2
W
In N
0
ORNGLELDWG. 72864 [;I = specif ic power (watts/gram)
CR = -9
0 4 8 I 2 16 20 24
5
4 n 8
: 3 2 ‘r=. + > 2
”
W
v y\ N
1
, I I
0 0 4 8 I 2 16 20 24
,
4
8 3 v
N 2 L 2
0 0 4 8 16 20 24
Reactor Operating Time (years)
Fig. H.4. 235U Saturation.

247
1.0
u) tu 0
0
.4 cu
.2
0
1.0
.8
8 w .6
.2
0
0 4 8 12 16 20 24 28
I 1 / 2000 -
1000 750
1.0
.8
0 4 8 12 16 20 24 28
0 0 4 8 12 16 20 24
Reactor Operating Time (years)
Fig. H.5. 236U Saturation.
28

248
.4
.2
0
P - = specific power (watts/gram) W .
CR = -8 1.0
-8
8 -6 v to N z5
b
\ -4
.2
0
to N
0 4 8 12 16 20 24 28
CR = .7 1.0
.8 - 8
2
z
- -6
.4
* .2
0
to N
to N
0 4 8 12 16 20 24 28
Fig. H.6. 238U Saturation.

249
2. Uranium-233
Figure H.2 shows the saturation behavior of 233U. The curves show that equilibrium (9w or greater) exists for 90$ of the reactor life only if the specific power is greater than about 1800 w/gram. of 750 w/gram (typical for the MSCR) insures equilibrium (90$ or greater) for 89 of the 30-year reactor life.
A specific power
3. Uranium-234
Figure H.3 shows that 234U saturates very slowly for all practical values of specific power. A specific power of 750 w/gram (typical for
the MSCR) gives an average concentration over the 30-year reactor life only 65% of the equilibrium value.
4. Uranium-235
Figure 4 shows the saturation behavior of 235U. For a conversion ratio of 0.8 and a specific power of 750 w/gram (typical M3CR conditions), the 235U concentration is within 1% of the equilibrium concentration for 65$ of the reactor operating life.
I
1 .
. .
5. Uranium-236
Figure 5 shows that the approach to equilibrium is quite slow for 236U* (typical M C R conditions), the 236LJ concentration never reaches 9C$ of the
equilibrium concentration.
6. Uranium-238
For a conversion ratio of 0.8 and a specific power of 750 w/gram
Figure H.6 shows the approach to saturation for 238U. For a con- version ratio of 0.8 and a sp conditions) equilibrium (9%
reactor operating lifetime.
fic power of 750 w/grm (typical MSCR
greater) is insured for 2% of a 30-year
The results for the six materials considered in this study are Shawn in Table H.1 for MSCR conditions.
Consideration of the methods used to obtain the results in Table H.1 does not indicate high accuracy. However, the results should be qualitatively

,
250
Table H.l. Percentage of MSCR Lifetime Having Nuclide Concentrations Within 1% of Equilibrium
MSCR Lifetime Having Nuclide Concen- tration Within 1% of Equilibrium Nuclide
( 4 ) Fission Products
processing ) ( 1000-day
2 3 3 u
2 3 4 u
23 5 u
2 3 6 u
2 3 8 ~
80
80
20 65 0 20
correct; and they should create some concern Over the validity of the equilibrium state as a suitable condition for reactor economic evaluation. Table H . 2 shows the expected direction of the error introduced by assuming the equilibrium condition for the nuclides considered. from Table H . 2 that it is not possible to predict whether equilibrium cal- culations are intrinsically optimistic or conservative from these results. Also, since the relative magnitude of the competing effects depends on re- actor type, the characteristics of the particular reactor must enter into an assessment of the direction and magnitude of the error associated with the equilibrium assumption.
It is apparent
The magnitude of the effect of these factors on reactor economic evaluations is not known. However, an extensive study should be made to examine these problems. dition are so convenient, economical, and unambiguous that they should be used if possible.
Reactor evaluations based on the equilibrium con-

!
251
Table H.2. Effect of the Equilibrium Assumption on Calculated Reactor Performance
Material Effect on Calculated Performance
Fission Products Conservative (overestimate) 2 3 3 ~ Optimistic (overestimate) 2 3 4 u Conservative" (overestimate )
2 3 6 u Conservative* (overestimate 3 23813 Conservative* (overestimate)
Optimi s t ic ( under estimate ) 2 3 5 ~
*These conclusions are based on an equilibrium calculation with no corrections. These materials are actually calculated using adjustment factors which average the concentrations over the life of the re- actor. The direction of the expected error under this assumption is not known.
c

252
Appendix I
ESTIMATES OF PHYSICAL PROPERTIES OF LITHIUM-BERYLLIUM MSCR FUEL AND COOLANT SALTS
R. Van Winkle
Introduction
Estimated physical properties of three fuel salt mixtures at 1 2 O O O F
and one coolant salt at 1062OF for use in heat transfer and pressure drop calculations of the MSCR study are listed below in Table 1.1,
Table 1.1, MSCR Salt Properties
Mixture MSCR No, 1 MSCR No. 2 MSCR No. 3 Coolant
Temperature , OF Composition mole % LiF-BeF2-ThF,+
Liquidus Temp, OF Mol. Wt. Density, lb / f t Density, g/cc Viscosity, lb/hr-ft Thermal Conductivity Btu/hr- f t - O F
Heat Capacity ,
3
Bt u / l b - O F
1200
7 1- 16 - 13 941
66 , 03 215 6
3 . 454 24.2
2.67
0,318
1200
68-23-9
887
56,2
190 . 1 3.045
21
2.91
0,383
1200
66-29-5
860
46.2
163.0
2.610
18.9
3.10
0.449
1062
66-34-0
851
33.14
120.5
1,931
20.0
3.5
0 , 526
The bases for these estimates, some temperature-dependent relation- ships and atom number densities are given for cases of interest,

253
Viscosi ty
Experimental values of t h e v i s c o s i t y of s e v e r a l d i f f e r e n t composi-
t i o n s of t h e mixture LiF-BeF2-UF4-ThF4 (and some est imated va lues) are
l i s t e d i n T a b l e I , 2 a t temperatures of 600°, 700" and 800°C, These are
p l o t t e d i n Fig, 1.1 which a l s o includes p l o t s of what appear t o be rea-
sonable estimates of t h e v i scos i ty of MSCR S a l t s 2 and 3,
on t h e s e two salts depend on t h e fact t h a t t h e i r compositions l i e between
those of Mixture 75 and Mixture 133 (which is t h e same as MSCR No. 1); hence, t h e i r v i s c o s i t y curves may be expected t o l i e between t h e curves
of t h e two known mixtures. c o s i t y equations of MSRE f u e l and coolant salts are l i s t e d i n Tables 1.3
The es t imates
Vi scos i t i e s and temperature-dependent v i s -
and 1.4 for comparison,
The v i s c o s i t y equation for Mixture 133 (MSCR No. 1) is (1):
rl = 0.0526 exp(4838/T OK) cen t ipo i se
T a b l e 1.2. Some Physical P rope r t i e s of Various Lithium-Beryllium Molten Fluoride S a l t s
Mixture Composition, m/o Viscosi ty , cp Heat Capacity(:! Number LiF-BeF2LUFq-ThF4 600 700 800°C a t 700°C Mol . Wt .
74 69 31 0 0 7 , s 4,9 3.45(5) 0.67*(5) 32.4 7,25 4.54 3.10(6)
75 67 30.5 2.5 0 80 5.5* 3.8*(5) 0 . 57*(5 1 39.5
111 71 16 12 13.0 7.1 4.8(5) 0 . 37a ( 5 66.02
112 50 50 0.65*(5 1 36.5
131 60 36 4 0 3.0 7.96 5,30(6) -- 44.96
132 57 43 0 0 3.4 7.38 4.50(6) -I 35.03
133 71 16 0 1 3 13.4 7.55 4.76(1) 0 e 306 (1) 66 . 03
t
22.5 11.6 6.03(6)
*Estimated values (all o t h e r s l i s t e d are experimental) . Numbers i n parenthes is are references.
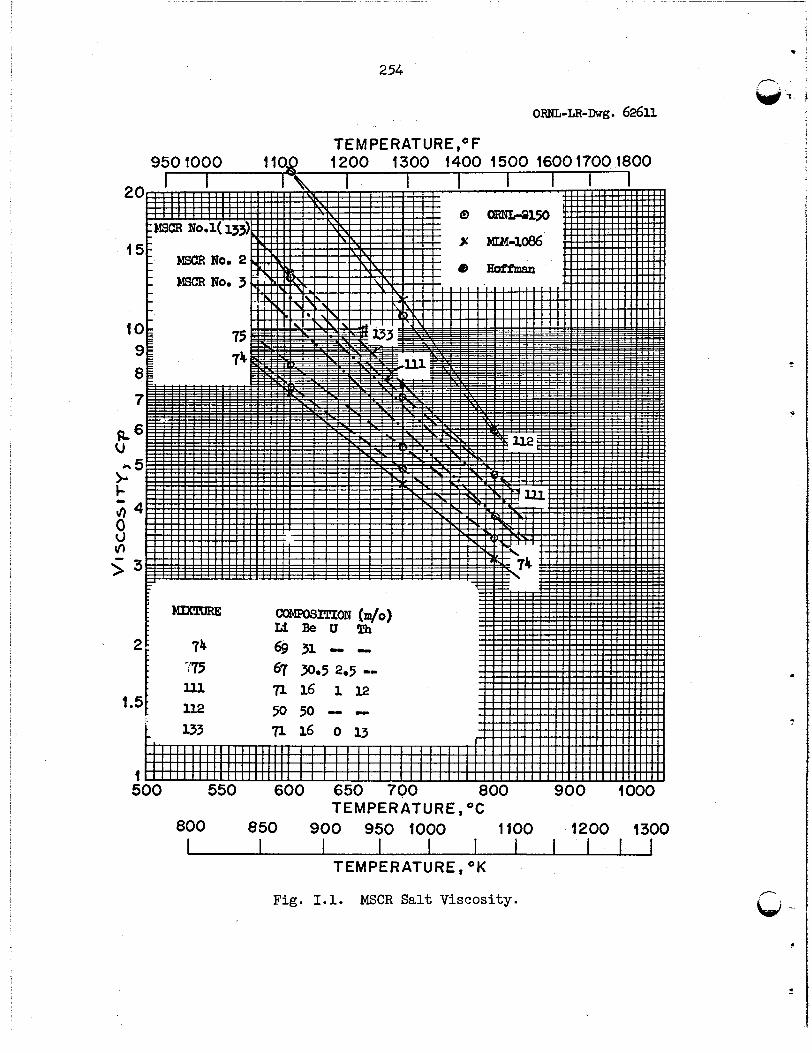
t
254
ORNL-LR-Dwg . 62611 TEMPERATURE,OF
950 1000 1109 I 2 0 0 1300 1400 1500 16001700 1800
TEMPERATURE, OC 800 850 900 950 I000 I100 1200 1300
TEMPERATURE, O K
Fig. 1.1. MSCR Salt Viscosity.

255
Table 1.3. Composition and P rope r t i e s of Fuel S a l t for MSRE
-V
I. Chemical Composition
LiF
BeF2
ZrF4
ThF4
uF4
11. Molecular w t
111. Phys ica l P rope r t i e s 3 Density (above l i q u i d u s ) lb/ft
t i n OF @ 12OOOF
Liquidus, OF
Heat capac i ty , Btu/lb-OF
So l id 212 - 806OF
Liquid 887 - 1472OF
@ 120OOF
Heat of fus ion (@ 842OF), Btu/lb
Viscos i ty , cen t ipo i se , T i n OF
Range: 1122-1472OF
@ 12OOOF Thermal conduct iv i ty , Btu/hr-ft-OF
t .in OF @ 1 2 O O O F
Mole Percent
70
23
5
1
1
43 0 59
154.5
842
0.132 + (4,033 x 10'4)t
0.575 - (9.99 X lO")t
0.455
138 e 6 0.1534 e 6476/T
7.64
2.74 + (5.516 x 10m4) t
- (1.37 x 10-71t2
3.21
Table 1 ,4* Composition and P rope r t i e s of Coolant Salt for MSRE
I. Chemical Composition Mole Percent
LiF 66
Be F2 34
11. Molecular Weight 33 14

256
T a b l e 1.4, Continued
111. Physical Properties ( a t normal ave operating Temperature, (1062OF)
3 Density, l b / f t 120 e 5
Viscosity, lb/f t -hr 2000
Specific heat, Btu/lb-OF
Solid (122 - 68OOF) 0.210 + (4.71 1 0 - ~ ) t
Liquid (896 - 1508OF)
@ 1062OF 0 . 526
Btu-ft/ft2-hr-OF
0.174 + (3.31 x 10'4)t
Thermal conductivity, 3.5
Liquidus temperature, OF 851
Heat Capacity
I
The temperature-dependent equation for heat capacity of Mixture 133
is (1):
C = 0.473 - 0.000238 T cal/g-OC (T = OC) P
Values of heat capacity of MSCR S a l t s 2 and 3 at a given temperature may
be estimated by interpolat ing between published values of other salts of
d i f f e ren t molecular weights, since heat capacity of molten salts probably
var ies inversely with molecular weight, Published values of heat capa-
c i t y a t 7OOOC of some known salts are shown i n Fig, 1.2, which contains
a p lo t of heat capacity as a function of molecular weight.
Heat capacity re la t ionships for MSRE fue l and coolant sa l ts are
shown i n Tables 1.3 and 1.4.
Thermal Conductivity
Like heat capacity, thermal conductivity can be expected t o vary
inversely with molecular weight. An estimate of the thermal conductivi-
t ies of the MSCR fue l salts has been made by extrapolating the published

257
i
0.7
0.6 0
P rl \ 5 -P m .. 3 0.5 .?I s 2 V -9 ld
0.4
0.3
/- E R E Coolant Sa l t (700OC) e
MSRE Coolant S a l t (572°C)
I
I W
I I - I \ I I I I \J I
(700OC)
30 40 50 60 70
Mol. W t *
Fig. 1.2. MSCR Salt Thermal Conductivity and Heat Capacity.
. - -

258
values of the lower molecular weight MSRE salts t o the higher weights of
the MSCR salts. This extrapolation is shown i n Fig. 1.2. However, the
published values may not have much precision or accuracy (1) . Density
Temperature dependent re la t ionships for calculat ing the dens i t ies of
the three MSCR sal ts are (2):
= 3.934 - 7,4 x 20 -4 T g/cm (T = OC)
P
P~~~~ NO. 1
%SCR NO. 2
"MSCR NO. 3
3.480 - 6.7 x l O - " f
= 2.993 - 5.9 x 10 -4 T
The bas is f o r these estimates is the same as given i n reference (31,
page 123 with an added term for the ion ic volume of thorium equal t o 2.82 - 2.94 x 10⁻³T.
Liquidus Temperature
Figure 1.3 (from reference 4) was used t o obtain the l iquidus t e m -
perature for t he MSCR salts. temperature of 505OC (p. 58, ref. 4).
Mixture 133 (MSCR No. 1 ) has a l iquidus

.
259
Thg 4 4 4 4
A ORNL-LR-DWG 37420AR2
TEMPERATURE IN OC
COMPOSITION IN mole Oi0
526
BeF2 548
P 465 E 370
Fig. 1.3. The System LiF-BeFZ-ThF4.

1.
20
30
40
5 0
260
References
Private communication from H. W. Hoffman.
Private communication from S. Cantor.
Oak Ridge National Laboratory, MSRP Semiann. Prop, Rept. August 1, 1960 t o February 28, 1961, USAEC Report ORNL 3122.
C. F. Weaver e t al., Phase Equi l ibr ia i n Molten Sa l t Breeder Reactor Fuels. 1. The System LiF-BeF2-UF4-ThFbr USAEC Report ORNL-2896, Oak Ridge National Laboratory, December 27, 1960,
S o I. Cohen, W. D o Powers, and No D. Greene, A Physical Property Summary for ANP Fluoride Mixtures, USAEC Report ORNL-2150, Oak Ridge National Laboratory, August 23 e 1956.
Bo C. Blanke e t al., Density and Viscosity of Fused Mixtures of Lithium, Beryllium, and Uranium Fluorides, USAEC Report MLM-1086, Monsanto Research Corporation, March 23, 1959.
W. L. Breazeale, Revisions t o MSRE Design Data Sheets - Issue No. 4,
(Declassified 11/24/59. .
MSR-61-100, August 15, 19610 ..
i i
c 1

i
261
Appendix J
FUEL AND CARRIER SALT COST BASES
W, L o Carter
Introduction
A survey was conducted among suppliers of ThF4, Tho2, LiF, BeF2,
ZrF4 and NaF t o determine current market prices,
and a recommended s e t of values t o be used i n molten sal t converter and
breeder reactor calculations is presented, The cost data are needed i n calculat ing f u e l cycle costs ,
The data are evaluated
The following values are recommended fo r use i n molten sal t reactor
calculations:
, ThF4 $ 6.50 per pound
BeF2 7,OO per pound
L i F l4,,70 per pound
ZrF4 4.00 per pound
One o f t h e purposes of t he study of thorium breeder and converter
reactors is t o furnish comparative f u e l cycle cost data on the various
systems as w e l l as nuclear performance data. The market survey w a s con- ducted t o obtain current and re l iab le price information on several chem-
ical compounds which w i l l be needed i n r a the r large inventory and f o r
which the consumption rate may be s igni f icant .
cerned primarily with molten sa l t reac tor materials, namely, thorium
f luoride, l i thium f lo r ide , beryllium f luoride, zirconium f luoride and
sodium fluoride; i n addition, pr ices were obtained f o r thorium oxide.
Several manufacturers of these chemicals were contacted, and a sum-
mary of t h e i r p r ice schedules is given i n Tables J.l through J060 Since it is appropriate t o associate a date with a market quotation, it may be
noted t h a t these da ta were obtained during the period November 1961 - January 1962, There is one exception: the comparative f igures quoted
from document Y-1312 were published i n December 1959,
The inquir ies were con-

Table J.1. Cost Data for Thorium Fluoride
cost
$/lb ThFba $/lb ThF4 $/kg Tha $/kg'Th ~ ~~
Vendor or Source of Information GCDb Y-1312' GCD Y-1312 Quantity
Initial order of 127,000 kg
Replacement rate of 37,100
Initial or der of 1,271,000
Replacement rate of 371,000
m 4
kg TW4/Jn.
kg w 4
kg W 4 / Y r
6.00d '
(a)
6. OOd
6.50 17 52: 18.98
(a)
17. 52d
%o assay given for the material. bGCD - General Chemical Division, Allied Chemical Corporation, P.d. Box 70,
Morristown, New Jersey.
is not based on the indicated quantity.
This vendor says price is only a rough estimate. R. G. Orrison, Thorium Metal Processes, Y-1312 (December 18, 1959). This price C
%o distinction made in price because of quantity or rate.
e,

Table 5.2. Cost and Composition Data for Thorium Oxide
Cost Data cost
$/lb Tho2 $/lb Tho2 $/lb Tho2 $/kg Th $/kg Th $/kg Th
Vendor or Source of Information ma AP Y-1312b AP AP Y-1312 Material Designation Code 111 Code 112 Code 111 Code 112 Material Form Powder Powder Not stated Powder Powder Not stated Cost quoted for
Initial order of 127,000 kg 7.00 7.50 5.75-8.50 17.52 18.78 14.39-21.28
Replacement rate of 37,100 7.00 7.50 17 52 18.78 Tho2
kg Tho2/Y-r Initial order of 1,270,000 7.00 7.50 kg Tho2
17.52 18.78
Replacement rate of 371,000 7.00 kg Tho2/Yr
7.50 17.52 18.78
Composition Data
Typical Analysis (ppm unless indicated)
Vendor or Source of Information AP AP Y-1312 Element or Campound
Tho2 9976 min 9% rnin Not given a
bR. G. Orrison, Thorium Metal Processes, Y-1312 (December 18, 1959).
AI? -American Potash and Chemical Corporation, 99 Park Avenue, New York 16, New York.
This price is not based on the indicated quantity.

...... - . .. , . . .... . , i . .............. . . . . . . . . . . . . . ...........
Table J. 2 (continued)
Composition Data
Typical Analysis (ppm unless indicated)
AP Y-1312 Vendor or Source of Information Elememt or Compound (continued)
AP
Rare earth oxide 50 30 Sulfate, SO3 100 50
Fe 50 6
100 1 2000 1
Phosphate, P2 05 50 10
CaO 100 10 Mgo
Silica, Si02 500 5 Boron, B 0.1 Uranium, U 10 Loss on ignition 5000 5000 Sm 10 1-2 Esl 1 0.2 Gd 10 1
5 1 QY
Na + K + Li

i
F
Table 5.3. Cost Data' for Lithium Fluoride
b Cost
Quantity
( e ) Initial order of 16,000 kg Li Replacement rate of 5,100 kg Li/yr ( e )
a sion-Oak Ridge Operations, Oak Ridge Gaseous Diffusion Plant, and Union Carbide Company - Y-12 Plant.
bThe price is for (c) basic charge for the material produced as the monohydrate (LiOH*H20) plus a conversion cost for LiOH-H20 + LiF plus a feed cost plus an AEC overhead cost.
The sources of information are Atomic Energy Commis-
at. $ 7Li and includes a
'C3.as si f ied information.
C

Table J.4. Cost and Composition Data for Beryllium Fluoride
Cost Data - Cost
Vendor Quantity'
$/lb BeF2 $/kg Be
BBCO' BCorpb BBCo BCorp
Initial order of Replacement rate Initial order of Replacement rate
Element or Compound
BeF2
Fe Ni Cr. * A1 S
H2O
23,800 kg BeF2 6.66 7-25 76.52 83.29 of 6,950 kg BeFz/yr 6.00 7.25 68.93 83.29
of 69,500 kg BeFn/yr 6900 6.95 68.93 79.85 238,000 kg BeF2 6.48 6-95 74.45 79.85
Composition Data
Manufacturing Specifications 99.5 2 0 . 5 wt $ 0.1 - 0.5 wt 8 400 ppm rnax 100 ppm max 100 ppm max 200 ppm max 500 ppm max
Typical Analysis of Manufactured Mater iald
99.5 w t $ min 0.06 wt$ 25 PPm
\ 20 ppm PPm
90 PPm 750 ppm
%rush Beryllium Company, 5209 Euclid Avenue, Cleveland 3, Ohio. bThe Beryllium Corporation, Reading, Pennsylvania.
dThe analysis given is for BBCo material; no analysis was given for BCorp Shipped as I X 1 X 1-inch lumps. C
material.
1 I

Not given 98.5+ 0.007 0.003 0.01 0.03 0.003
~~ ~~
"TAD - Titanium Alloy Manufacturing Division, National Lead Go., No assay was given; however, the 111 Broadway, New York 6, New York.
bid was fo r Hf-free material. bGCD - General Chemical Division, Allied Chemical Corp., P.O. Box
This vendor says the price is approximate. 70, Morristown, New Jersey. C No cost distinction is made for quantity or aate.
Table J.5. Cost and Component Data for Zirconium Fluoride
Cost Data
Vendor
cost
TADa GCDb TAD GCD Quantity
Initial order of 55,100 kg ZrF4 4.00 4.50 16.13 18.15 Replacement rate of 16,100 kg ZrFq/yr 4.00 (c ) 16.13 Initial order of 551,000 kg ZrF4 3.55 (c) 14.32 Replacement rate of 161,000 kg ZrF4/yr 3.55 (c) 14.32
Composition Data
Vendor Element or Compound
ZrF4 Chlorides S €if Fe Ni
Typical Assay (wt 4 6 ) TAD GCD
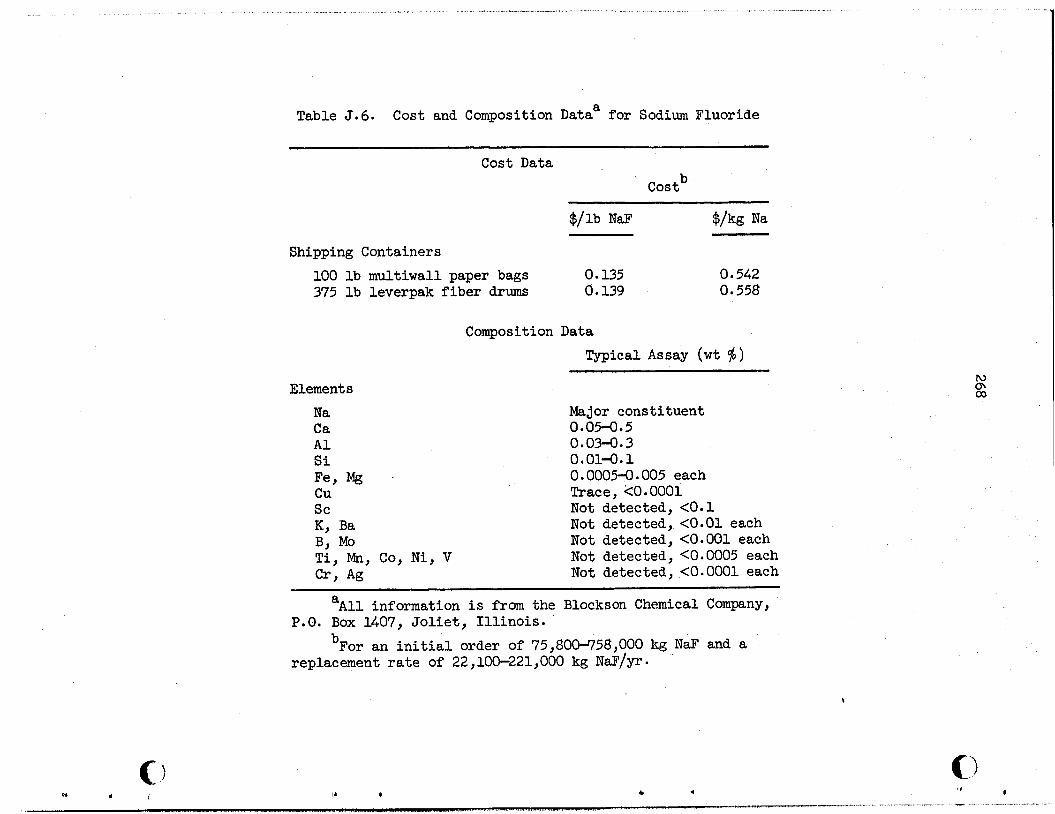
Table J.6. Cost and Composition Data' for Sodium Fluoride
Cost Data b cost
Shipping Containers 100 l b multiwall paper bags 375 l b leverpak f ibe r drums
Elements N a C a A1 S i Fe, Mg cu s c K, Ba B, Mo T i , Mn, Co, N i , V C r , Ag
$/lb NaF $/kg Na
0.135 0.542 0.139 0.558
Composition Data Typical Assay ( w t $)
Major constituent 0.05-0.5 0 .034*3 0.01-0.1 0.0005-0.005 each Trace, <0.0001 Not detected, <O. 1 Not detected, <0.01 each Not detected, <0.001 each Not detected, <0.0005 each Not detected, <0.0001 each
'Al l information is from the Blockson Chemical Company,
bFor an i n i t i a l order of 75,80o-r758,000 kg NaF and a
P.O. Box l407, J o l i e t , I l l i no i s .
replacement r a t e of 22,100-221,000 kg NaF/yr .
C)

I
269
Bases f o r Establishing Prices
It was assumed t h a t pr ices would be established f o r a large molten
sa l t , power-producing system. Two conditions were visualized: (a) A
1000 Mwe (2500 Mwt) s t a t ion and (b) t en of these 1000 Mwe s t a t ions i n
simultaneous operation.
tory requirements
t h a t t he fue l sa l t would be discarded after removal of fissile material on a 1000-day cycle,
not be decontaminated and recovered.
These conditions established the i n i t i a l inven-
The consumption rates were calculated by assuming
I t was assumed t h a t thorium and carrier s a l t could
Vendors were asked t o quote prices on the basis of producing mate-
r ia ls i n the quant i t ies desired by exis t ing methods and according t o
current specifications.
dor i n an information-seeking survey such as t h i s t o do much research i n t o manufacturing procedures and schedules i f h i s operations would be
s igni f icant ly affected by these additional quant i t ies .
r i g i d specif icat ions were affixed t o these chemicals other than the ob-
vious one t h a t a l l materials should have extremely low concentrations of
high neutron cross section materials,
It was not considered appropriate t o ask a ven-
Consequently, no
General Comments on Price Quotations
Thorium Fluoride
Only one manufacturer was in te res ted i n making a quotation f o r ThF,+, and it was admitted t h a t t h i s was a rough approximation.
pared favorably with the value quoted by Orrison (1) i n a previous
market survey,
The pr ice com-
Zirconium Fluoride
Vendors were asked t o quote on hafnium-free ZrF4. The quant i t ies
requested are apparently qui te large compared with available production.

270
Beryllium Fluoride
The suppliers indicate t h a t there would be no problem i n supplying the quant i t ies requested.
i n the production of beryllium metal. the pr ices quoted are ten ta t ive , they are probably r a the r accurate.
Beryllium fluoride is an intermediate compound Although the vendors state t h a t
Sodium Fluoride
This chemical is avai lable i n large supply. The quoted pr ices should
be qui te firm. reactor contributes negligibly t o the fue l cycle cost ,
Sodium fluoride is so inexpensive t h a t its use i n a
Thorium Oxide
Thorium oxide is avai lable i n large supply; t he quoted pr ices are perhaps rather f i r m .
by Orrison (1).
The quotes compare favorably w i t h t h e values given
Lithium Fluoride
Lithium f luoride occupies a s ingular posit ion i n t h e molten sa l t f u e l system par t icu lar ly with regard t o a v a i l a b i l i t y and price.
the l i thium content must have a high 'Li assay, t he only source of mate- r i a l is from AEC production facil i t ies. sonnel (2 ) were instrumental i n developing a classified pr ice schedule for high isotopic puri ty 'Li i n quant i t ies t o meet the requirements of
a large molten sa l t power ins ta l la t ion .
Since
AEC-ORO, Y-12 and ORGDP per-
Lithium is produced as Li0H.H 0 for which a reasonably accurate 2 pr ice can be computed. converting the hydroxide t o an anhydrous f luoride product s ince t h i s
operation has not been attempted except i n small-scale batches; t h i s
charge was estimated. for computing the pr ice of l i thium f luoride i n 99.995 at. % 'Li:
However, an uncertainty e x i s t s i n the charge for
A schedule of basic charges was recommended (3,4)
i

271
$/kg Li*
- L i O H H2 0 - LiOH*H20 - L i F conversion = Cascade feed cost ( 4 ) - Base cost - Plus 15% AEC overhead (4) -
- - -
The values have not been released by the Atomic Energy Commission as an o f f i c i a l p r ice f o r high puri ty 7Li ; they are confident ia l information
f o r i n t e rna l use only. The o f f i c i a l p r ice was $l?O/kg of L i metal as the f luoride i n
7 November 1959 (5) f o r a grade containing 99.99% of
adopted f o r material containing 99.995%
L i . This pr ice w a s 7 L i produced i n large quant i t ies .
Recommended Values f o r Molten Sa l t Fuel
Based on the values given i n Tables J.1, 5 .3 , J 0 4 , and J . 5 , t he fol-
lowing pr ices are recommended for use i n molten sal t reac tor f u e l cycle
calculations. These pr ices were chosen more or less a r b i t r a r i l y from the
accumulated data since value than another.
Element
Thorium
Beryllium Lithium Zirconium
there was no reason t o have more credence i n one
$/lb of $/kg of m e t a l f luoride compound (as f luoride
6,50 19 * 00
7.00 80.42
14.70 120 b 00
4.00 16.13
*This information is classified.

272
References
1, R. G. Orrison, Thorium Metal Processes, Y-1312 (December 18, 1959),
2, Personal communications with E. E, Keller, AEC-ORO, Neal Dow, UCC- Y-12 Plant, and Murray Hanig, UCC-ORGDP,
3, Letter from R, G o Jordan (Y-12) t o C, A, Keller (AEC-ORO), No, Y-AO-2314, January 10, 1962,
4, Personal communicarion with E. L. Keller, AEC-OR0 (January 18, 19621,
5, Nucleonics, 17(11): 31 (November 1959).
,

273
Appendix K
MSCR POWEX LIMITATION RESULTING FROM MODEBATOR THERMAL STRESS
R. H. Chapman
Summary
c
I n order t o achieve the m a x i m u m performance from the MSCR, it i s
necessary t o operate a t a power l eve l corresponding t o some l imit ing con- d i t ion . or it may be an inherent feature i n the design. I n cer ta in conceivable s i tua t ions thermal s t r e s s i n the graphite moderator may l i m i t the power output of a single reactor core. the m a x i m u m power output as a function of core diameter for the case where thermal s t r e s s i s the l imit ing condition.
The l imit ing condition may be a r b i t r a r i l y imposed upon the system
It i s therefore of i n t e re s t t o estimate
It i s assumed fo r the purpose of th i s memorandum that the reactor core i s a cylinder of L/D = 1.0.
the proper spacing of hexagonal graphite moderator prisms. of estimating the thermal s t r e s s , it i s a l so assumed that the hexagonal
prisms can be approximated by a r igh t c i rcu lar cylinder of a diameter equal
t o the distance across the f la t s of the hex. It i s noted from the geometry of the hexagonal un i t c e l l that the f u e l volume fract ion, fv, the f u e l channel thickness, tc, and the distance across f lats, dc, are in te r re la ted . Figure K . 1 shows the relat ionship f o r the region of in te res t . of the uni t c e l l is obtained by adding the channel thickness t o the dis-
tance across f la t s of the moderator prisms.
Honeycomb shaped f u e l channels are formed by For the purpose
The s i ze
Assuming uniform heat generation, the maximum thermal s t r e s s ( a t the surface) i s given' fo r a so l id cylinder as
2 1 aE q"/ ro * t = - - 2 1-V 4k
where
u - tangent ia l thermal s t r e s s , ps i , t -
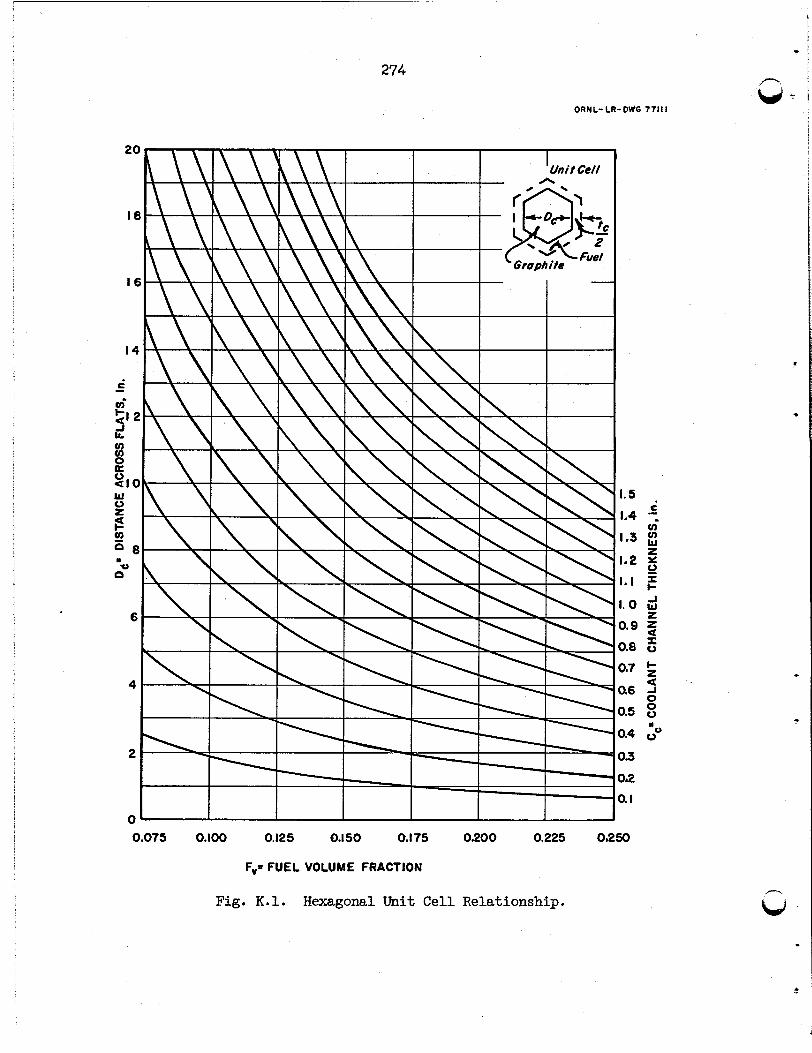
274
ORNL-LR-DWG 77111
1.5
1.4 7
1.3
c
v)
2 1.2 8
1.0 d 3.9 5 3.8
3.7 g
3.5 g 3.4 "*
- I. I
t
I
16 2 ll
3.3
)I2 3. I
0.075 0.100 0.125 0.150 0.175 0.20 0 0.225 01250
Fv= FUEL VOLUME FRACTION
Fig. K . l . Hexagonal Unit Cell Relationship.

275
in . "F ' a = coeff ic ient of thermal expansion, in.
E = modulus of e l a s t i c i ty , ps i ,
tr = Poisson's r a t i o , BTU
hr f t 3 q/// = volumetric heat source, >
r = radius of cylinder, f t , 0
BTU ' hr f t "F k = thermal conductivity
It i s assumed t h a t the uniform volumetric heat generation term can be r e -
la ted t o the core heat production r a t e by
where
f
Qc = core heat production r a t e , Mwt,
VM = volume moderator i n core, f t3 ,
= f rac t ion of t o t a l heat which i s produced i n moderator, P
BTU h r - M w ' C = conversion factor = 3.413 X lo6 1
7- 'max - r a t i o of' peak-to-average core power density. - P
The core moderator volume i s given for L/Dc = 1.0 as
Substi tuting Eq. (2) and ( 3 ) i n t o (1) and remranging, the following ex-
pression i s obtained:

276
Assuming values for the various properties of graphite, i.e., ut, a, E, V ,
and k, and representative values for the fraction of total heat generated in the graphite and for the peak-to-average power density ratio, a family of curves of heat production versus diameter may be plotted wherein ro is the parameter.
Choosing an allowable stress value of graphite I s a somewhat arbitrary operation. the EGCR (16 in. X 16 in. X 20 ft long columns) that the mechanical prop- erties vary widely between different blocks of the material, vary across the cross-section of the large blocks, and depend on the orientation rela- tive to the direction of extrusion.2 Fracture strain is probably a better criteria for failure than stress, since it has been shown to be fairly constant at about 0.1 to 0.2%. Tests have also shown that strength is not temperature dependent at least up to 1100°F. Since the ratio of stress to modulus of elasticity appears in Eq. ( 4 ) ) the value of the fracture strain can be substituted and thus side-step the issue of fraction stress. value of 0.1% is assumed as a failure criterion.
coefficient of expansion, a value of 2.7 X loa6 in./in. OF is used.3 value of 15 BTU/hr-ft*"F is used for the thermal conductivity at ~ ~ O O " F O ~ A value of 2.5 is assumed for the ratio of peak-to-average power density to account for the maximum thermal stress condition. This is about the value computed for the MSRE.5 of total heat produced in the moderator, essentially the same as for the Msm.
Experience has shown in the production of AGOT graphite for
A
For Poisson's ratio a value of 0.4 is recommended, and for the thermal A
A value of 0.05 is assumed for the fraction
Multiplying the heat rate by the overall net thermodynamic efficiency, one obtains the net power output. used. With these assumptions Eq. ( 4 ) becomes
An assumed value of 40$ efficiency is
P Dc3 = 0.0196 -, Mwe (net) . 2 r 0
1 - fv ( 5 )
!
c
t

277
Figure K.2 i s a p lo t of Eq. ( 5 ) fo r the range of in te res t . Also
shown i n the f igure a re 500 and 1000 Mwe condition f o r f u e l volume frac-
t ions of 0.10, 0.15, and 0.20. conditions one is able t o estimate quickly the m a x i m u m graphite s ize per-
mitted by thermal s t r e s s considerations.
t o provide 1000 Mwe w i t h single core of 20 f t dim and 10 vol. i s seen from the f igure tha t the la rges t graphite moderator prism i s l imited t o about 9 in. across f lats.
With %he figure, and f o r a given s e t of
For example, i f it i s desired
fuel , it
It should be pointed out t h a t the data used i n constructing the f igure
Design data for large sections of a re subject t o considerable uncertainty. graphite such as l i k e l y t o be used i n the MSCR axe, of course, unavailable a t t h i s time. f igure w i l l be conservative.
However, it i s believed tha t the r e su l t s obtained from the

1800
I600
I40C
l20C
Q L
tom .
8oa
6oa
4oc
20c
278
QRNL-LR-DWG 76828
L5"
4.0"
0.5"
5rO"
64"
7.0 "
880"
ro= IO"
I I I 1 I
IO 12 15 17. 5 19 20
0
Cube of Core Diam, ft.
Core Diarn, ft.'
I I I I I
Fig. K.2. Thermal Stress Power Limitation.

279
References
1. Ralph Hankel, S t ress Temperature Distributions, Nucleonics, Vol. 18, No. 11, pp. 168-169 (November 1960 ) .
2. B. L. Greenstreet, Oak Ridge National Laboratory, personal communica- t ion.
3 . S . E. Moore, Oak Ridge National Laboratory, personal communication.
4. L. G. Alexander e t al . , Thorium Breeder Reactor Evaluation, Par t 1 - Fuel Yield and Fuel Cycle Costs i n Five Thermal Breeders -Appendices, ORNL-CF-61-3-9, Appendices, p. 33 (May 24, 1961).
5 . C. W, Nestor, WRE Preliminary Physics Report, ORNL-CF-61-4-62 (Apri l 9, 1961).

280
Appendix L
VOWMES OF FUEL SALT AND INTERMEDIATE COOLANT SALT FOR 1000 Mwe MOLTEN SALT CONVERTER REACTOR
D. B. Janney
I n t r cduc t ion
The volumes of the salt streams (including heels i n dump tanks, etc. ) were calculated fo r the reference design described i n Sec. 4 .
Fuel Sa l t Volume
Table L.l . Volume of WCR Fuel Sa l t
A. Reactor 1360 f t3
B. Piping 320 f t3
c. pumps 130 f t3
D. Primary Heat Exchangers 575 f t 3
E. Dump Tanks, Control Tanks 115 f t3
TOTAL 2500 f t3
These volumes were calculated as follows:
A. Reactor
Core ( L = 20 f t , D = 20 f t )
Annulus ( L = 20 f t , t = 1 in . )
Top Plenum (h = 13 in., D = 20 f t , incl . core hold-down grid* of
= 4 in . , t = 1 in . ) ht3
*See Fig. 4 . 8 .
0.785 (20)3 X 1% = 630 f t3
(20)2 = 105 f t3 I2
I
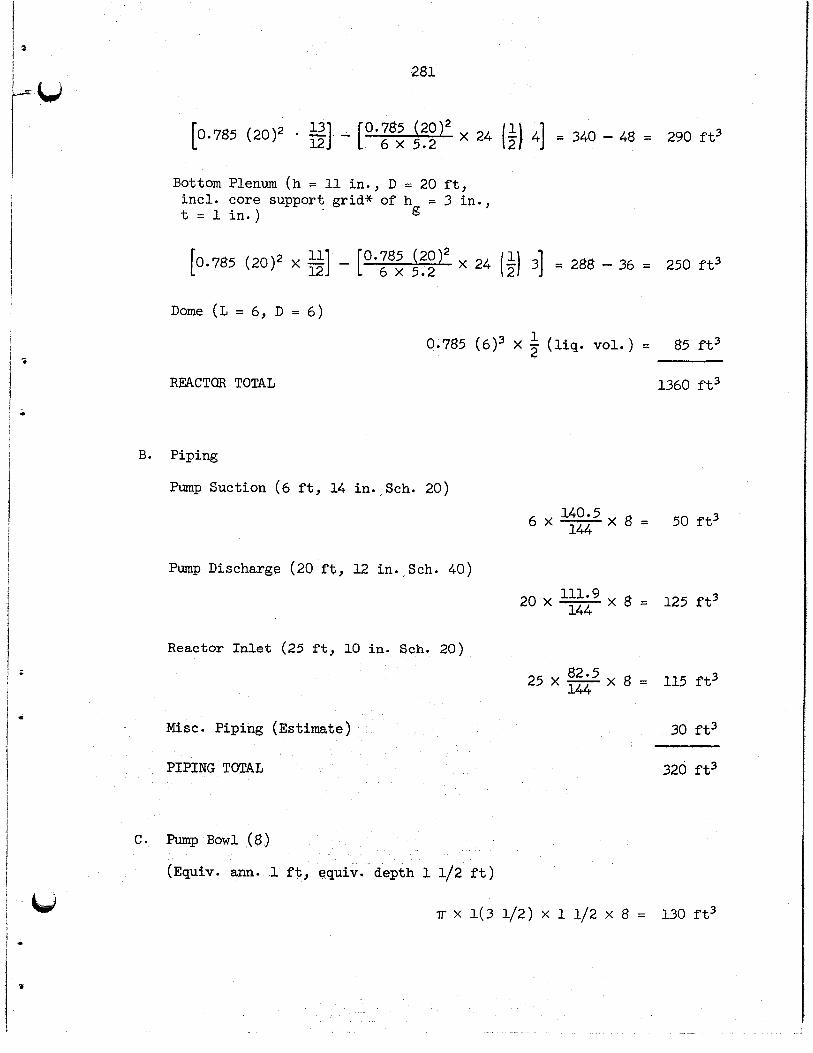
281
p.785 (20 )2 g] - [0*785 ( 2 0 ) 2 x 24 [$I 41 = 340 - 48 = 290 f t 3 6 X 5.2
Bottom Plenum (h = 11 in . , D = 20 f t , inc l . core support grid* of h t = 1 i n . )
( 2 0 > 2 E] - [ 0.785 6 x i . 2 20)2 x 24 I$] 31 = 288 - 36 = 250 f t3
Dome ( L = 6 , D = 6 )
REACTOR TO!TAL
1 0.785 (6 )3 x 2 ( l i q . vol.) = 85 f t 3
1360 f t3
B. Piping
Pump Suction ( 6 f t , 14 i n . , Sch. 2 0 )
140.5 " x - 144
Pump Discharge (20 f t , 12
Reactor Inlet ( 2 5 ft, 10
t3
i n . . Sch.
20 x - 111.9 x 8 = 125 f t3 144
n. Sch. 0 )
25 x 82.5 x 8 = 115 f t3 144
Misc. Piping (Estimate) 30 f t3
PIPING TOTAL 320 f t3
C. Pump Bowl (8)
(Equiv. ann. 1 f t , equiv. depth 1 1 / 2 f t )
T X l(3 1 / 2 ) X 1 1 / 2 X 8 = 130 f t3

282
D. Primary Heat Exchanger ( 8 )
(Shell I D 43.75 in. , s h e l l length 13 1 /2 f t )
0.785 (43.75)2 - 0.785 ( 0 . 5 ) 4050] 13.5 x 8 144
+ E 0.667 x T ($j)3 (1 - g)] 8 = 530 + 45 = 575 ft3
coolant Sa l t volume
Table L.2. Volume of Coolant S a l t
A. Superheaters 2425 f t3
B. Reheaters 485 f t3
C. Primary Heat Exchangers 510 ft3 D. Piping 2710 f t3
F. Flush S a l t 2385 ft3
TOTAL 8615 ft3
E. Pumps 100 f t 3
These volumes were calculated as follows:
A. Superheaters ( 16 )
(Shell I D 31.5 in . , U-shell length 58 f t , 0.5 in. tube bundle annulus)
(0.0029 f t3 S ~ ~ ~ ~ ~ * x 785 x 58 x 16)
+ [" yz (31) X 58 X 161 = 2112 + 313 = 2425 ft3
J
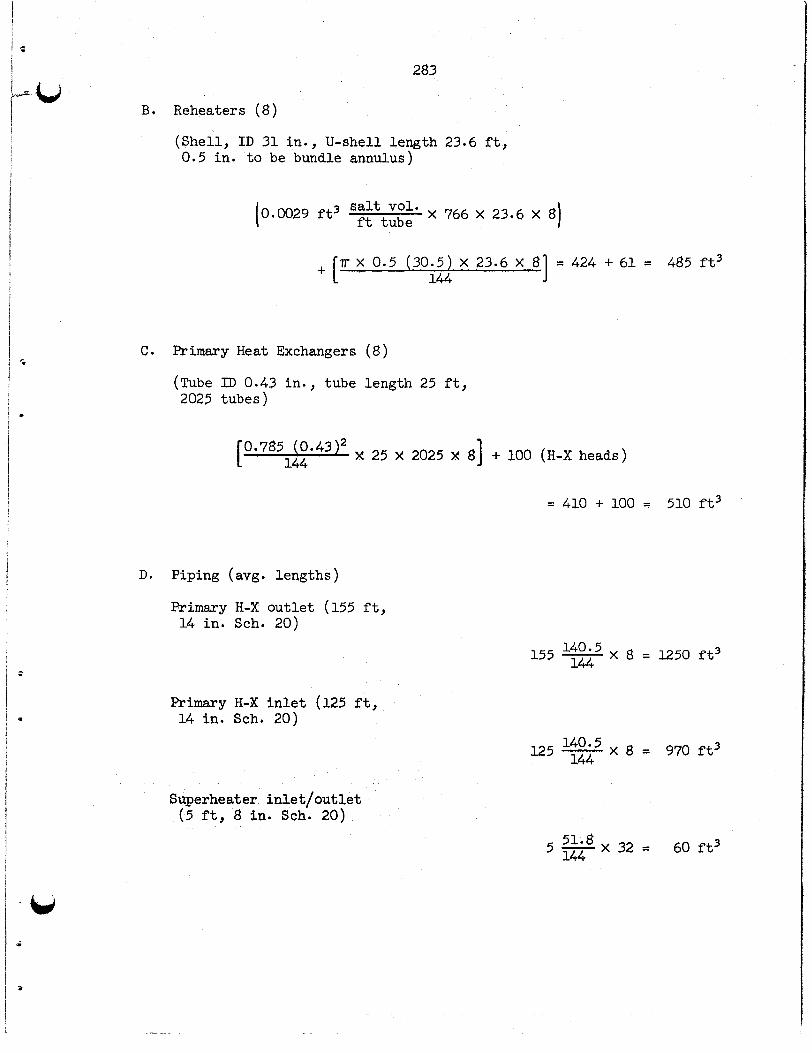
283
B. Rehaaters (8)
(Shell , I D 31 in . , U-shell length 23.6 f t , 0.5 i n . t o be bundle annulus)
X 766 X 23.6 X 81 3 salt vol. f t f t tube
C. Primary Heat Exchangers (8)
(Tube ID 0.43 i n . , tube length 25 f t , 2025 tubes)
[0*7851240*43)2 x 25 x 2025 x 81 + 100 (H-X heads)
D. Piping (avg. lengths)
Primary H-X ou t le t (155 f t , 14 in. Sch. 2 0 )
= 410 + 100 = 510 f t3
155 X 8 = I250 ft3
Primary H-X i n l e t (125 f t , 14 in. Sch. 2 0 )
140.5 144 I25 - X 8 = 970 f t3
Superheater i n l e t /ou t le t ( 5 f t , 8 in . Sch. 20)
5 - 5 1 8 X 32 = 60 f t3 144

t
- 284 n
w - Reheater inlet /out le t ( 5 f t ,
5 in. Sch. 40)
5 - 20 X 16 = 10 ft3 144
Pump Suction (70 f t , 12 in. Sch. 20)
PIPING TOTAL
118 70 - X 144 8 = 460 f t3
2710 f t3
E. h p s (System pressurizing and s a l t sampling volume only)
100 f t 3
F. Flush Sa l t (Amount required equal t o reactor system volume )
2385 f t3

2 85
Appendix M
EVALUATION OF A GRAPHITE REFLECTOR FOR THE MOLTEN SALT CONVERTER REACTOR
T o W, Kerlin
Introduct ion
Nuclear ca l cu la t ions on l a r g e molten sal t converter r e a c t o r s (MSCR) i n d i c a t e t h a t t h e neutron leakage is l a r g e enough ( 2 t o 4% o f t h e neutrons produced) t o warrant considerat ion o f a graphi te reflector, A r e a c t o r was chosen from a set p re sen t ly under s tudy t o eva lua te t h e d e s i r a b i l i t y of a
reflector. optimum with r e spec t t o f u e l cycle costs, has t h e c h a r a c t e r i s t i c s given i n T a b l e M . 1 .
This r e a c t o r , which cur ren t r e s u l t s i n d i c a t e is near t h e
Table M . 1 . Typical Charac t e r i s t i c s of MSCR
Diameter of core, f t 17.7 Height of core, f t 17.7 Carbon-to-thorium ra t io 293 Fuel salt composition 68LiF-23BeF2-SThF,+ Fuel sa l t volume fractio Fuel processing rate, f t /day
0.10 2 9
The core c o n s i s t s of a g raph i t e matrix i n s i d e a 2-inr-thick INOR-8 vessel . vessel w i l l move away from t h e g raph i t e when t h e reactor is a t power,
c r ea t ing an annulus.
able, t h i s annulus w i l l conta in fuel salt .
Because of t h e d i f f e r e n t c o e f f i c i e n t s of thermal expansion, t h e
Since no adequate metal-to-graphite seal is ava i l -
,
The designer may choose t o p lace a reflector between t h e core and t h e annulus by merely increas ing t h e size of t h e g raph i t e region and omit t ing
f u e l channels i n t h e outer port ion.
g raph i t e blocks t o t h e i n s i d e of t h e ves se l so t h a t t h e r e f l e c t o r moves
with t h e ves se l , c r ea t ing an annulus between t h e core and t h e reflector.
The designer a l s o might choose t o p in

286
A t h i r d poss ib i l i t y is a combination of the above ,NO methods, crea ing an
annulus between two re f l ec to r regions.
Calculations were made t o determine the r e l a t ive charac te r i s t ics of
the MSCR with (a) no r e f l ec to r , (b) a 15-in0 r e f l ec to r outside the annulus,
( c ) a 7.5-in. graphite region between the core and annulus and a 7,S-in.
graphite region outside the annulus.
by an i t e r a t i v e procedure t o achieve equilibrium with respect t o a 2 ft3/day f u e l processing rate.
The core composition was determined
' 'Results
The r e s u l t s are summarized i n Table M.2. Here the materials cost is the sum of the inventory and replacement costs. The leakage includes a l l neutrons which escape from the system, are captured i n the vessel, o r are captured i n the reflector.
Table M.2. Materials Cost and Nuclear Character is t ics of MSCR as a Function of Reflector Condition . . . . .
Case Materials Cost Conversion Leakage (mills/kwhr)a Ratio % Reflect o r
1 None 0.783 0 . 828 2.62
2 Outside annulus 0.740 0 . 849 l o g o
3 Between core and annulus 0,805 0.812 3.16
4 Between core and annulus 0 . 784 0,823 2.81 plus outside annulus.. .. .
These resu l t s show t h a t t he r e f l e c t o r outside of t he annulus improves
performance s l igh t ly , but t h a t t he other re f lec ted reactors have poorer
performanceo
d is t r ibu t ions shown i n Fig, M.1.
This behavior can be c l a r i f i e d by examining the power density
The reac tor with the r e f l e c t o r outside the annulus shows a large peak
i n power i n the annulus because of t h e la rge thermal f lux from t he re f lec tor .
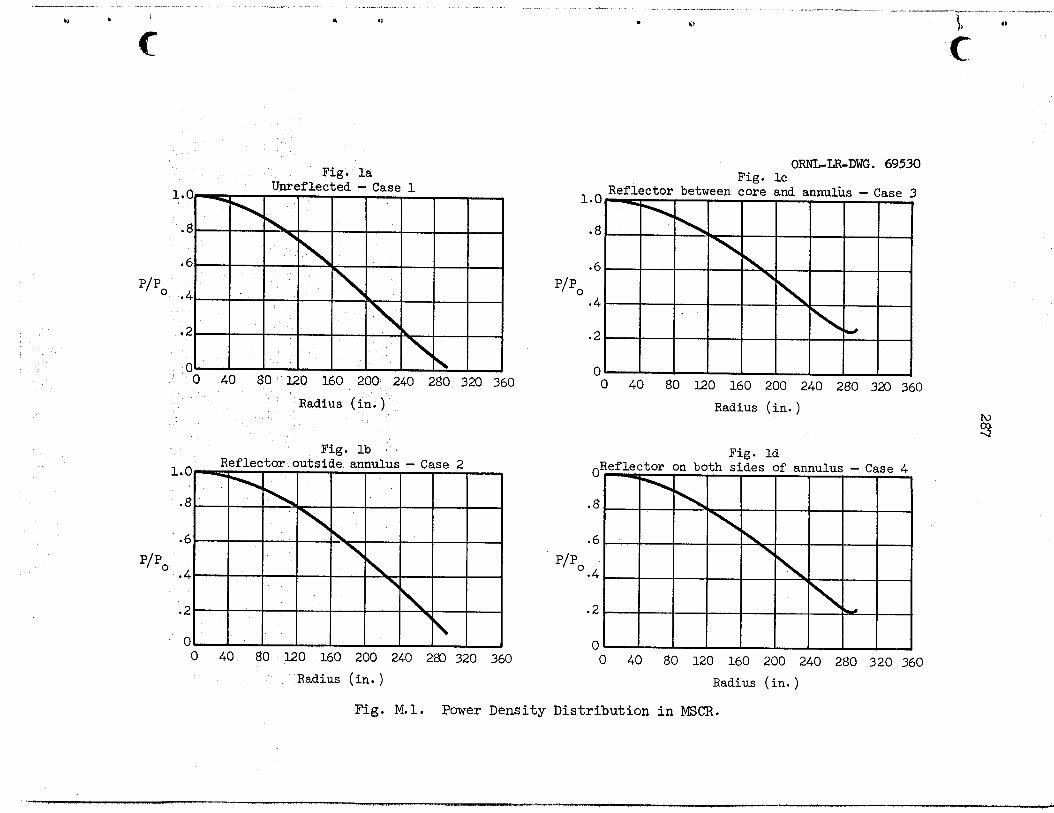
Fig. l a Unreflected - Case 1
Radius ( i n . )
Fig. lb
c
0-LR-DWG. 69530 Fin. IC
0 40 80 120 160 200 240 280 320 360
Radius ( i n . )
Fig. I d
0 40 80 120 160 200 240 280 320 360
Radius ( i n . ) 0 40 80 120 160 200 240 280 320 360
Radius ( i n . )
Fig. M . l . Power Density Distribution in MSCR.

288
Since a peak i n the f i s s ion rate occurs, the source of neutrons aimed out
of t he reac tor is increased; however, the r e f l ec to r re turns many of t he neutrons leaving the annulus. s l i g h t reduction i n leakage,
The net effect, as shown i n Table M.2, is a
The reactor with the r e f l ec to r between the core and annulus experi-
ences a considerable f la t ten ing of the power dis t r ibut ion.
r a t e i n the annulus remains large and furnishes a large source of neutrons adjacent t o the reactor periphery. This source is la rger than f o r the un-
re f lec ted case, and a higher leakage results.
The f i ss ion
The reactor with the graphite regions on each s ide of the annulus com-
bines the bad features of cases 2 and 30
annulus,' giving a large source for neutrons t o the reac tor periphery.
Thus it is seen t h a t the main reason t h a t a r e f l e c t o r has such a
The f i s s ion rate is large i n the
small effect is the presence of t h e f u e l annulus. t o r increases the f i s s ion rate i n t h i s region. close t o the reactor periphery, where they may be absorbed i n the vessel or leak out of the reactor.
a design which eliminated the f u e l annulus could be devised.
Any addition of reflec- These f i s s i o n neutrons are
A r e f l e c t o r would be much more benef ic ia l i f
Conclusions
Use of a r e f l ec to r i n t h e MSCR improved the reac tor performance only
s l i g h t l y L0.02 increase i n conversion r a t i o and 0.04 mills/kwhr (electrical) decrease i n f u e l cycle costs].
considered, the reac tor with the r e f l e c t o r outside of t h e f u e l annulus was the only one which improved performance. graphite t o the vessel without leaving large cracks is unknown.
extra cost of fabricat ing an INOR-8 vessel 2.5 ft l a rge r is unknown.
Therefore, i n view of the s l i g h t benefi t t o be gained and t h e added design uncertaint ies and complexity, it appears t h a t no r e f l e c t o r should be used i n the MSCR study.
improvements i n performance become important, t he gains avai lable with a
a
O f the reflected-reactor configurations
However, a method of pinning
Also, t he
If these uncertaint ies should be removed and s l i g h t
- r e f l ec to r should be exploited. W

289
Appendix N
DETAILED ESTIMATE OF 1000 Mwe MSCR CAPITAL INVESTMENT*
C, H, Hatstat**
Summary
The cycle chosen f o r t h i s analysis is shown i n elementary form i n Fig. 4.3, A 2500 M w t reactor is cooled with a fuel-bearing molten sal t ,
from which heat is t ransferred t o an i n e r t s a l t i n e ight v e r t i c a l she l l - and-tube heat exchangers; t he heat i n the i n e r t salt is removed i n a sys-
tem of 16 shell-and-tube superheaters and eight reheaters, of a design similar t o t h a t of the superheaters. steam flows t o a system of four Loeffler boi le rs , where it produces satu- ra ted steam by mixing with the turbine feed water,.
heated steam is delivered a t 2400 ps i , 1000°F, t o the t h r o t t l e of the steam
turbine. Exhaust steam f r o m the high-pressure turbine elements is reheated
t o 1000°F i n the reheaters and flows t o the intermediate pressure turbine,
from which it flows t o a 6-flow low-pressure unit . Condensate is returned
t o the Loeffler bo i le rs through eight s tages of feed-water heating.
gross power output of t h e cycle is 1083 Mwe a t a t h r o t t l e steam flow of
approximately 8 x l o 6 lb/hr and a condenser pressure of 1.5-in. Hg.
site i n Western Massachusetts,
source of c i rcu la t ing water for the turbine, pressure of the reac tor coolant, high-pressure containment is not consid- ered necessary; t he reac tor and i ts auxiliaries are contained i n a sealed,
s t ee l l ined concrete structure which forms ai par t of a subdivided biolo- g i c a l sh ie ld with a to ta l thickness of 10 feet.
Approximately 63% of the superheated
The remaining super-
The
The plant design is based on an Atomic Energy Commission reference The site is assumed t o have an adequate
Because of the low vapor
The turbine-generator and the other components of the steam-condensate system are housed i n a conventional steel frame building. The turbine
*&-bracted from SL-1554, SL-19?4.
*%argent and Lundy, Engineers, Chicago, I l l i n o i s .

290 w -
building and the reac tor building are arranged so t h a t one t ravel ing bridge crane services both buildings.
Other s t ruc tures on the s i te which are included i n the cost estimate
are the crib house, c i rcu la t ing water intake and discharge flumes and tunnels, waste disposal building and stack, and foundations for o i l and
condensate tanks, Road and r a i l access are a l s o provided f o r the plant. The cost estimate includes a l l systems and components necessary for
a complete plant. following equipment and/or systems are estimated i n de t a i l .
In addition t o the energy conversion components, the
1. 2.
3.
4.
5.
6 .
7.
8.
9.
10.
11.
12.
13.
14. 15
16
Radioactive waste treatment and disposal systems and building. Cover gas supply and d is t r ibu t ion system,
Reagent gas supply and disposal system. UF4 addition f a c i l i t y , Fuel salt handling, sampling and storage systems. Reactor vessel and primary pumps. Thermal sh ie ld and cooling system.
Emergency shutdown cooling system. Reactor control system.
Fuel salt chemical treatment system. Intermediate salt chemical treatment system.
Intermediate salt handling, sampling and storage systems. Coolant pump lubricat ing o i l systems.
Hot sampling facil i t ies , Remote maintenance f a c i l i t y .
Subdivided shielded areas €or reac tor aux i l i a r i e s i n the reac tor
building. d
Investment Requirements
The c a p i t a l investment required for the concept which is described i n
t h i s report has been estimated on the bas i s of preliminary design and
material quant i t ies prepared by O a k Ridge National Laboratory and Sargent P
f Lundy. The estimating data for the heat cycle, auxi l ia ry systems, and h, primary and intermediate system components were prepared by Oak Ridge .

291
National Laboratory.
using accounting procedures spec i f i ed by t h e U. S. Atomic Energy Commission
i n t h e Guide t o Nuclear Power Cost Evaluation.
The cost estimate was prepared by Sargent f Lundy,
The d i r e c t cons t ruc t ion cost and i n d i r e c t c o s t are summarized below.
The d e t a i l e d estimate is presented on subsequent pages.
Estimated Direct Construction Cost $ 89,341,200
I n d i r e c t Costs 48,582,600
To ta l Cap i t a l Investment for $137,923,800 S t ruc tu res and Equipment
Coolant S a l t Inventory p lus 1,5% for Interest During Construction
Total Investment, Excluding Fuel S a l t
\
ti . 3
10,951,800
$148,875,600

Table N . l . 1000 Mwe Molten Salt Converter Reactor Plant -Estimate of Capital
Investment
ONE (1) 2500 MWt MOLTEN SALT REACTOR ONE (1) 1000 MWe REHEAT TURBINE GENFZATOR
UNIT C.C.6F 40" L.S.B. (2400 Psi. - 1000°F - 1000°F)
(Prices as o f 11-1-62 and Based on a 40 Hour Work Week)
.1
.ll
.12
.13
.14
.15
.1.6
.2
.21
.22
.23
.231
ACCOUNT 21 - STRUCTURES & IMPROVEMENTS 211 Ground Improvements
Access Roads for Permanent
c 1
QUANTITY MATERIAL OR EQUIPMENT
Use Grading 1 Surf acing 1
Guards & Signs > Lighting 1 Grading & Landscaping Lot
15 Miles Culverts Bridges & Trestles )
General Yard Improvements
Roads Sidewalks & Parking Areas 47,000 SF Retaining Walls, Fences & Railings Fence, Post, Gates 2,450 LF
LABOR TOTALS
In Place
$6,000 $19,200 $25,200
16,500 7,600 24,100
8,500 3,200 11,700

Table N . l (continued)
ACCOUNT 21 - STRUCTURES & TMPROVEMENTS (Cont’d.) 211 Ground Improvements (Cont’d.)
.2 General Yard Improvements (Cont’d.)
.24 Outside Water Distribution Systems Including Fire Hydrants &Water Tanks for General Use
.241 Domestic Water System ,2411 500 G.P.M. Deep Wells,)
1 Including Pump & 1 Accessories
.2412 Storage Tank, 300 Gal.) 1 & Controls
.2413 Water Softener, 1 Piping & Controls 1
.2414 Piping 1
QUANTITY MATERIAL OR
Lot
.242 Fire Protection System
.2421 Water Storage Tank )
.2422 2000 GPM Fire Pump 6 ) Motor Drive 1
.2423 Other Fire Protection ) Lot Equipment 1
.2424 Piping, Including 1 Hydrants 1
) .2425 Hose & Hose Houses
EQUIPMENT
13,000
27,500
LABOR
17,600
27,500
TOTALS
30 , 600
55 , 000

Table N. 1 (continued)
LABOR QUANTITY MATERIAL OR EQUIPMENT
ACCOUNT 21 - STRUCTURES & IMPROVEMENTS (Cont'd.) 211 Ground Immmvements (Cont'd.)
.2 General Yard Impravements
.25 Sewers & Drainage Systems:
.251 Yard Drainage & Culverts
.252 Sanitary Sewer System
.2521 Septic Tank
.2522 Dosing Syphon Lot $12,000 18,400
.2523 Distribution Box
.2524 T i l e Field (Drainage) )
(Cont d . ) Lot 4 000 7 000
,253 Storm Sewer System: ,2531 Excavation & Backfil l ) .2532 Vi t r i f ied Clay T i l e
(6'' & 8")
(27" & 30") .2534 Manholes .2535 Outfall Structure .26 Roadway & General Lighting .261 Security Fence Lighting)
.263 Parkway Cable
.264 Trenching for Parkway )
.2533 Reinforced Concrete Pipe ) Lot
.262 Roadway Lighting 1
Cable
Lot
13,000 11 200
8 , 000 11,200
TOTALS
11,000
h, 0 &
30,400
24,200
19 ,200
I h 4 L
e.

c
Table N. 1 (continued)
QUANTITY MATERIAL OR EQUIPMENT
ACCOUNT 21 - STRUCTURES & IMPROVEMENTS (Cont'd.) 211 Ground Improvements (Cont'd.)
.3 Railroads
.31 Off Site .3l1 Grading .312 Bridges, Culverts & Trestles) 5 Miles
.314 Signals & Interlocks
.32 On Site
.321 Ballast & Track 265 LF
.313 Ballast & Track 1
TOTAL ACCOUNT 211
LABOR
135,000 132,000
1,500 1,600 $245,000 $256,500
212 Buildings
.1 Excavation & Backfill
.ll Earth Excavation 11,500 CY
.12 Rock Excavation 5,650 CY
.13 Backfill 6,350 CY
.14 Disposal 10,800 CY
.15 Dewatering Lot
.3 Substructure Concrete
.31 Forms
.32 Reinforcing
.33 Concrete
.34 Waterproofing ) 6,750 CY
.35 Patch & Finish ) Conc.
.36 Miscellaneous Anchor Bolts,) Sleeves Etc. Embedded in Concrete
- - 2,000
-
232,000
11,500 45,200 9,400 4,400 75,000
218,400
TOTAU
267,000
3,100 $501,500
11,500 45,200 11,400 4,400 75,000
450,400

Table N. 1 (continued)
QUANTITY
ACCOUNT 21 - STRUCTURES & IMPROVEMENTS (Cont'd.) 212 Buildinns (Cont'd.) 212A Turbine Generator Building
Including Off ices Control Roam, Cable Ram. Switch Gear Room(Cont'd.) .4 .41 .411 .412 .413 .42
.421
.422
.43
.431
.432
.44
.441
.442
.443
.444
Superstructure Superstructure Concrete Forms 1 Reinforcing ) Concrete 1 Structural Steel & Miscellaneous Metal Structural Steel 1,650 T Stairs, Ladders, Railings, Walkways, Gratings, Etc. Lot Exterior Wall s
34,000 SF of Floor
Masonry - Sasulated Metal Siding 56,400 SF Roofing & Flashing Pre-Cast Roof Slabs ) Built-up Roofing & ) Flashing 1 Poured Concrete Roof 35,600 SF Deck 1 Insulation 1
MATERIAL OR EQUIPMENT
LABOR
$57,500 $49 , 000
535,000 128,000
55,000 21,000
- - 134 , 000 46,400
32,000 36 , 000
TOTALS
Iu \D 0
$106 , 500
663,000
79,000
180i400
68,000

Table N. 1 (continued)
QUANTITY MATERIAL OR EQUIPMENT
ACCOUNT. 21 - STRUCTURES & IMPROVEMENTS (Cont'd.) 212 Buildings (Cont'd.) 212A Turbine Generator Buildinq
Including Office, Control Room, Cable Room. Switch Gear Roam .4 Superstructure (Cont'd.) .45 Interior Masonry &
Part it ions .451 Structural Tile 29,800 SP .46 Doors & Windows -461 Doors Lot .46 2 Windows .47 Wall and Ceiling
12,600 SF
Finish .471 Glazed Tile 1 .472 Metal Ceiling 1
A74 Acoustical Ttle 1
.482 Tile 1
.491 Painting Lot
-473 Plastering Including ) 6,200 SF Lathing and Furring )
.48 Floor Finish
.481 Cement )
.49 Painting Glazing and Lot
Insulation
,492 Glass and Glazing -
5,000
30,000
10 , 500 -
$15,100
11 , 500 48 , 000
.5 Stack (Heating Boiler and Auxiliary Boiler ) 1 4,000
LABOR
$20,300
4,400 20,000
4,400
38, loo
32,400 -
1 , 600
TOTAL
$35,400
15,900 68 , 000
9,400
68 , 100
42,900 Incl. 462
5,600
C

Table N. 1 (continued)
QUANTITY MATERIAL OR EQUIPMENT
ACCOUNT 21 - STRUCTURES & IMPROV~~(Cont'd.) 212 Buildings (Cont Id.) 212A Turbine Generator Building
Including Office Control Room, Cable Roam, Switch G e q Room (Cont'd.) .6 .61 ,611 ,612 .613 .614 .615 .62 .621 .622 .623 .624 .625 .626 ,627 .628
Building Services Plumbing & Drainage Systems ) Plumbing Drainage 1 Duplex Sump Pump 1 Domestic Cold Water Tank 1 Damestic Hot Water Tank 1
Heating Boiler )
Discharge Ducts 1
Flash Tank 1
Heating Boiler & Accessoriea
Unit Heaters
Condensate Pump & Receiver )
Pip ing Fuel Oil Transfer Pump ) Heating Oil Tanks - Day ) & Storage 1
Lot
Lot
.6221 Berm for Fuel Oil Storage j
.6222 Foundation for Heating Oil )
.63 Ventilating System
.641 Air-conditioning Control Roam Lot
.643 Laboratory Air Conditioning
Tank )
Day Tank 1
.64 Air-conditioning System 1
.642 Off ice Air-Condit ioning 1
$60,000
77,000
LABOR TOTALS
$32,000
50,400
$92,000
127,400
55,000 28, ooo 83 , 000
(i c.i

Table N. 1 (continued)
LABOR TOTALS QUANTITY MATERIAL OR EQUIPMENT
ACCOUNT 2 1 - STRUCTURES & IMPROVEMENTS (Cont'd.) 212 Buildings (Cont'd.) 21% Turbine Generator Building
Including Office, Control loom, Cable Room, Switch Gear Room (Cont'd.) .6 Building Services (Cont'd.) .66 Lighting & Service Wiring .661 Control Panels & Cabinets 1 .662 Condui 1 .663 Wiring 1 .664 Fixtures Switches & Receptacles ) .67 F i r e Protect ion System (Water
Lines, Hose, Sprinkler, E t c .) TOTAL ACCOUNT 212A
Lot
Lot
$46,500 $39,200 $85,700
12,000 $1,422,100
2,400 14,400 iu $920,500 $2,342,600 3
212D Waste Disposal Building .1 Excavation and Backfil l .ll Excavation .111 Earth .112 Rock .12 Backfi l l ,121 Earth .13 Disposal .131 Earth ) .132 Rock ) .15 Dewatering .151 Pumping . 3 Substructure Concrete
.31 Bottom Slab )
.32 Walls t o Grade )
Including, Forms, Anchored S tee l
a5 C.Y. - 100 . - 100 - 45 c.y. 100 100
50 .50 c.y. 50
Lot 1,000 1,000
100 c.y. 3,500 3,200 6,700
I

Table N . l (continued)
QUANTITY MATERIAL OR LABOR EQUIPMENT
TOTALS
ACCOUNT 21 - STRUCTURES & IMPROVEMENTS (Cont'd.) 212D Waste Disposal Building (Cont'd.)
4 Supers truc ture .42 Structural Steel and
.421 Structural Steel and Girts
.422 Miscellaneous Steel Galleries
Miscellaneous Steel
Stairs, Landiilg, Handrailing, Ladders, Etc.
.43 Exterior Walls
.431 Insulated Metal Siding
.44 Floors, Barrierc, Including
.441 Walls Above Grade
.442 Floors ,4421 Pre-Cast Roof Slab .45 Interior Masonry and
.46 Doors and Windows
.461 Doors
.462 Windows
.48 Floor Finish (Cement)
.49 Exterior and Interior
.491 Painting Floor and Walls
.492 Painting Structural and) Miscellaneous Steel
Reinforcing, Forms, Etc.
Par tit ions
Finishes
.493 Heavy Duty Coating 1
.494 Exterior Coating Below Grade
$34 , 000 $8,000 $42,000 105 Tons
2,000
4,900
6 , 500 Lot 4 j 500
13,600 18,500 6,800 s.f. w 0 0
10,500 5,000 4,000
135 c.y. 80 c.y.
2,200 8.f.
6 , 500 3,200 2,000
4,000 1,800 2,000
1 , 000 2,000 1 , 500
3 , 000 6,500 2,000
2 , 000 4,500
500
Lot
3,500 s.f. 1,200 s.f.
25 , 000 45,000 20,000 Lot
C)

Table N. 1 (continued)
QUANTITY ~ T E R I A Z . OR LABOR EQUIPMENT
TOTALS
ACCOUNT 21 - STRUCTURES & IMPROVEMENTS (Cont'd.) 212D Waste Disposal Building (Cont'd .I
.6 Building Services Plumbing and Drainage
Conduit
TOTAL ACCOUNT 212D
212F Miscellaneous Structures
.67 Fire-Protection System
.1 Gate House
.2 Electrical
.3 Waste Storage Pond T ACCOUNT 212F
Lot $4,800 $2,200 $7,000
Lot Lot
1, 200 1 800 3,000 1 Io00
$56,650 5; 000 CJ
$165,950 8 4,000 $109,300
Lot Lot Each
$5,500 3,000 2 , 800
$11,300
$5,200 2,800 5,200
$13,200
$10,700 5 , 800 8 000
$24 , 500 212G Reactor Plant Building
.1 Excavation & Backfill
.ll Earth Excavation
.12 Rock Excavation
.13 Backfill
.14 Disposal
.15 Dewatering
5,655 c.y. 1,090 c.y. 755 c.y.
5,990 Cay. Lot
$5,700 21,800 1,200 2,400
55 , 000
$5,700 21,800 1,200 2,400
55,000

ACCOUNT 21 - STRUCTURES & IMPROVEMENTS (Cont'd.) 212 Buildings (Cont'd.)
Table N. 1 (continued)
212G Reactor Plant Building (Cont'd.) .3 .31 .32 .33 .34 .35 .36
.4
.41
.411
.412
.413
.42
.421
.422
.43
.431 ,432 .433
Substructure Concrete Forms Reinforcing 1 Concrete 1 Waterproof ing Patch & Finish Miscellaneous Anchor Bolts, ) Sleeves Etc. Embedded i n ) Concrete Superstructure Superstructure Concrete Forms 1 Re inf orc lng 1 Concrete I n t e r i o r ) Struc tura l Steel & Miscellaneous S tee l S t ruc tura l Steel & Reactor Supports S t a i r s , Ladders, Railings, Walkways, Grating, E t c . Exterior Wa 11s Masonry Insulated Metal Siding Concrete Walls
c',
QUANTITY MATERIAL OR EQUIPMENT
5,730 c.y.
6,981 c.y.
$200,000
365,000
964 T 305,000
30,000 Lot
- - 54,100 s.f. 110,000
5,150 c.y. 250,000
LABOR TOTALS
$185,000 $385,000
225,000
80,000
14,500
- 38,000
157,000
590,000
385,000
44,500
- 148,000 407,000
w 8

c c
Table N. 1 (continued)
QUANTITY MATERIAL OR EQUIPMENT
ACCOUNT 21 - STRUCTURES & IMPROVEMENTS (Cont'd.) 212 Buildings (Cont'd.) 212G Reactor Plant Building (Cont'd.)
.4 Superstructure (Cont'd.)
.44 Roofing & Flashing
.442 Built-up Roofing & Flashing) 23,300 s . f .
.443 Insulation
.45 Interior Ma
.451 Structural Tile -
.453 Hot Cells
.46 Doors & Windows
.461 Doors
.462 Windows
.48 Floor Finish
.481 Cement
.49 Painting Glazing Insulation
,491 Painting .492 Glass and Glazing .493 Insulation of Reactor
Chamber .5 Stack (When Supported
on Building) .6 Building Services .61 Plumbing & Drainage System .611 Plumbing ) .612 Drainage ) .613 Sump Pump )
.441 Pre-Cast Roof Slabs 1
Lot
Lot 7,250 s.f.
35,000 s.f.
Lot
Lot
LABOR
$21,000 $21,600
- 400,000
2,500 27,000
- 80,000
1,200 12,000
14,400 12,000
7,000 18,500 Included .462
Incl. in Acct. 221.32
Incl. in Acct. 212A
15,000 8,000
TOTALS
$42,600
- 480,000 w
0 w 3.700 39;OOO
26,400
25,500
23,000

Table N . l (continued)
ACCOUNT 21 - STRUCTURES 61 IMPROVEMENTS (Cont'd.) 212 Buildings (Cont'd.) 212G Reactor Plant Building (Cont'd.)
.6 Buildings (Cont'd.)
.62 Cooling System )
.63 Ventilating System )
.66 Lighting & Service
.661 Control Panels & ) Cabinet 1
.662 Conduit 1
.663 Wiring 1
& Receptacles 1 .664 Fixtures, Switches )
.67 Fire Protection System (Water Lines, Hose, Sprinkler, Etc .) TOTAL ACCOUNT 212G
TOTAL ACCOUNT 212
218 Stacks 218A Concrete Chimney
.1 Excavation and Backfill )
.2 Substructure Concrete
.6 Obstruction Lighting )
.4 Concrete Chimney 1 TOTAL ACCOUNT 218A
TOTAL ACCOUNT 218
TOTAL ACCOUNT 21
QUANTITY MATERIAL OR LABOR EQUIPMENT
1
TOTALS
Lot
Lot
$130,000
17,000
$70,000 $200,000
36 , 600 19,600
Lot 8 500 1 500 10 ¶ 000 $1,032,400 $2,932,400 $1 , 900,000
$3,442,700 $2,022,750 $5,465,450
15,000 16 , 000 31,000
$15,000 $16,000 $31 , 000 $15,000 $16 , 000 $31,000
$3,702,700 $2,295,250 $5,997,950
Y I.

ACCOUNT 22 - REACTOR PLANT EQUIPMENT 221 Reactor Equipment
Table N . l (continued)
QUANTITY
L o t
Lot
.1 Reactor Vessel and Supports
.ll Reactor Vessel Supports
.12 Vessel and Internals )
.13 Pump Suction Columns )
.15 Heaters
.16 Insulat ion
.2 Reactor Controls -21 Reactor Control Sa l t Addition
.22 Reactivity Control Drain Tanks
.23 Drain Tank Condenser
.231 Condensate Pump
.24 BF3 In jec t ion System
.241 BF3 Cylinders
.25 Piping, Valves, Etc.
.3 Reactor Shielding
.31 Thermal Shield System
.14 Graphite Rods 1
Tank
.311 Thermal Shield & Supports 1 ,312 Surge Tank, 2000 Gal. 1 .313 Circulating Pumps 2 .314 Heat Exchanger 1 .315 L'iping, Valves, and Insulat ion Lot 1 .32 Biological Shielding -
Insulation, Shield Plugs, Etc. Lot
.34 Shield Cooling System
.341 Closed Loop Liquid System ,3411 Shield Cooling Heat
Exchanger (4000 Ft . Surface - Admiralty) 2
MATERIAL OR LABOR EQUIPMENT
TOTALS
$15,000 $8,000 $23,000
7,540,000 560,000 8,100,000
37,500 Included 37,500 7,000 6,400 13,400
6,200 1 QO 6,300
1,200 100 1,300 cJ 300 100 400 g
42,400 800 43,200
Not Included Incl . Account 228
75,000 16,000 2,400 200 2,600 200
25,000 500 Inc l . Account 228
255,000 124,000
35,000 2,500
91,000 2,600 2,800
25,500
379,000
37,500
I
I . , , , , , , ,,,.,,,,, , , , , , , ~P, -. , *_*I

. . . ._ " . . . . . . . , . .. . . -. . . . . . . ... . . .~ ~
Table N. 1 (continued)
QUANTITY MATERIAL OR EQUIPMENT
ACCOUNT 22 - REACTOR PLANT EQUIPMENT (Cont'd.) 221 Reactor Equipment (Cont 'd .)
Reactor Shields (Cont'd.) .J .34 .341 .3412
.3413
.3414
.3415
.7
Shield Cooling System (Cont'd.) Closed Loop Liquid System (Cont ' d .) Shield Cooling Circulating Pumps & Motors (2500 GPM 75 HP Motor) Piping & Valves Cooling Coils Embedded in Concrete (16000 Ft. 1" Steel) H20 Storage Tank 3000 Gallons Reactor Plant Cranes &Hoists TOTAL ACCOUNT 221
222 Heat Transfer Systems .1 .ll
.12
.13
.2
.21
.211
.212
.213
Reactor Coolant Systems Reactor Salt Circulating Pumps 9075 GPM Including 1600 HP Motors Reactor Salt Piping Insulation Intermediate Coolant System Pumps Including Supports Coolant Salt Pumps - 13,900 GPM Including 2,000 HP Motors Auxiliary Pumps and Drives Insulation
LABOR TOTALS
3 Lot
Lot
1
8 Lot Lot
8
-
$7,500 800 8,300 Included in Account 228
w tn 17,500 32,500 50,000 0
1,200 300 1,500 Included in Account 251
$8,070,800 $752,500 $8,823,300
2,768,000 25,000 2,793,000 235,000
5,000 5,600 10,600 215,000 20,000
3,640,000 30,000 3,670,000
- - - Included in Account 228
C ) c.s

Table N. 1 (continued)
QUANTITY
ACCOUNT 22 - REACTOR PLANT EQUIPMENT (Cont'd.) 222 Heat Transfer Systems (Cont'd.)
.2 Intermediate Coolant System (Cont'd.)
.22 Intermediate Coolant Piping
.221 Pipe, Valves, Supports, E t c . Lot
.222 Insulat ion Lot
and Valves
.223 Coolant S a l t Drain Tanks Including Heaters and Insu la t ion 2
,23 Primary Heat Exchangers & Supports 8
.3 Steam Generators Superheaters
.31 Loeff ler Boi lers 4
.32 Superheaters 16
.322 Steam Reheaters 8
.35 Auxiliary Start-up Boiler
C Reheaters
(300 P s i . 50,000 lblhr .
.36 Insulat ion f o r Above Equipment
.4 Reactor Coolant Receiving Supply and Treatment
.411 F e r t i l e S a l t Addition System .4111 F e r t i l e S a l t Addition Tank .42 Reagent Gas System
.422 HF Supply
.423 Piping
.431 Reactor S a l t Pu r i f i ca t ion System
.4311 Chemical Treatment Tank
.4312 F e r t i l e S a l t Storage Tank
o i l Fired) 1
-421 H2 Supply
1
1 1
MATERIAL OR EQUIPMENT
LABOR TOTALS
$1,925,000 172,000 $2,097,000 98,000 50,000 48,000
70,000 12,800 82,800
2,320,000 28,000 2,348,000
4,000,000 160,000 4,160,000 6,350,000 48,000 6,398,000 1,400,000 10,000 1,410,000
60,000 5,000 65,000
Included i n Account 228
1,200 50 1,250
Not Included Not Inc luded
Included i n Account 228
46,600 400 47,000 27,500 300 27,800
a 0 i l

Table N. 1 (continued)
QUANTITY
ACCOUNT 22 - REACTOR PLANT EQUIPMENT (Cont'd.) 222 Heat Transfer Systems (Cont'd.)
.4 Reactor Coolant Receiving Supply and Treatment (Cont * d .)
,431 Reactor Salt Purification S y s t em (Con t ' d . )
.4313 Radioactive Salt Sampler Lot
.432 Intermediate Salt Purification System
.4321 Chemical Treatment Tank 1
.44 Reactor Salt Charge System
.441 Reactor Salt Preparation System
.4411 Salt Melt Tank and Appurtenances
1
.4412 UP4 Addition System 1
.442 Intermediate Salt Charge
.4421 Intermediate Salt Preparation System
Tank and Appurtenances 1
MATERIAL OR LABOR EQUIPMENT
TOTALS
$67 500
19,200
30 000
3 , 000
30 , 000
$1,600 $69,100
200 19,400
1,000 31 , 000 500 3,500
1 , 000 31 000
b b

Table N. 1 (continued)
QUANTITY
. ACCOUNT 22 - REACTOR PLANT EQUIPMENT (Cont'd .)
222 Heat Transfer Systems (Cont'd.) .4 Reactor Coolant Receiving
Supply and Treatment (Cont 'd .) .45 Cover Gas Supply and
Purification System .4531 Dryer .4532 Heater .4533 02 Removal Unit .4534 Coolers A535 Pure He Reservoir .4536 02 Analyzer .454 Piping .5 Intermediate Coolant
Storage Tanks, Etc. TOTAL ACCOUNT 222
223 Fuel Handling and Storage Equipment .31 Fuel Salt Drain and
Storage System
.312 Drain Tank Condenser
.3121 Condensate Pump
.313 Decay Storage Tank Including
.314 Fuel Withdrawal Transfer Tank
' .311 Drain Tanks & Cooling Jacket
Cooling Jacket
2
54 1 2
5 1
MATERIAL OR LABOR EQUIPMENT
TOTALS
200 50 250 400 100 500
3,000 200 3,200 c*,
2 00 100 300 0 400 100 500 \c)
7,000 500 7,500 Included Acct. 228
70,000 2,000 72,000 $23,039,200 $570,500 $23,609,700
$1,269,000 8,000 1,400
55,000 37,000
$16,800 $1,285,800 300 8,300 100 1,500
1,000 56,000 100 3,800

Table N. 1 (continued)
ACCOUNT 22 - REACTOR PLANT EQUIPMENT (Cont'd.) 223 Fuel Handling and Storage
Eauivment .321 Fuel Withdrawal Metering Tanks .33 Flush Sa l t Storage Tanks .34 Piping
TOTAL ACCOUNT 223
225 Radioactive Waste Treatment & Disposal .1 .ll .111 .112 .113 .114 .13 .14
.15
.151
.16
.161
.17
.2
.21
.211
.212
~~
Liquid Waste Sys terns High Level Storage Tank H.L. Storage Tank Pump H.L. Waste Evaporator H.L. Waste Condenser Evaporator Recycle Pump Demi 8 t e r H.L. Concentrated Waste Storage Tank KOH Scrubber KOH Make-up Tank & Pump H2 Burner H Burner Condenser P Zp ing Gas Waste Stack Blower Absolute F i l t e r . Roughing F i l t e r
QUANTITY
1 5
2 1 1
MATERIAL OR EQUIPMENT
LABOR TOTALS
$6,200 $300 $6,500 152.500 2,800 155,300
Included i n Account 228 $1,495,800 $21,400 $1,517,200
12,400 600 400 100
2,000 100 600 50 1
400 100 600 50
2,500 150 12,100 400 1,400 100
225 75 1,000 100
Included i n Account 228
20,000 2,400 4,000 400 1,200 200
w P 0 13.000
500 2,100
650 500 6 50
2,650 12,500 1,500
300 1,100
22,400 4,400 1,400
E:,

c
ACCOUNT 22 , - REACTOR PLANT EQUIPMENT (Cont'd.) 225 Radioactive Waste Treatment
& Disposal (Cont'd .) .22 H .F. Absorbers Including
Charcoal .221 Absorber Coolers .222 Vacuum Pump .223 H.F. Absorber Vacuum Tank
Air Cooled Absorbers Including Charcoal 1.5" Finned Tubes
.232 3" Finned Tubes ,233 6" Finned Tubes .234 .24 Water Cooled Absorbers .241 112" Tubes .242 1" Tubes .243 1-112'' Tubes .244 2" Tubes .25 Decay Tank .26 Absorber Cooling Water
.27 Helium Recycle Compressor
Dilution Air Duct & Dampers
Condenser
.28 BF3 Stripper
.281 Vacuum Pump
.29 Piping TOTAL ACCOUNT 225
226 Instrumentation and Controls .1 Reactor .2 Heat Transfer Systems
Table N. 1 (continued)
QUANTITY
c
MATERIAL OR LABOR EQUIPMENT
TOTALS
$16,000 $2,400 $18,400 100 50 150 500 50 5 50 300 50 350
3,600 8,000 15,000 8,000
23,200 60,.400 51,400 49,600 12,500
900 2,000 28,000
500
400 4,000 600 800
3,230
CI, 8,600 c-' 15,800 p 11,200
800 24,000 1,900 62,300 1,900 53,300 1,800 51,400 800 13,300
100 1,000 200 2,200
2,400 30,400 50 550
Included in Account 228 $338,825 $22,325 $361,150
$300,000 $170,000 $470,000 70,000 50,000 120,000

Table N. 1 (continued)
ACCOUNT 22 - REACTOR PLANT EQUIPMENT (Cont'd.) 226 Instrumentation and Controls (Cont'd.)
.3 Service to Fuel Handling and Storage
.4 Service to Radioactive Waste 6 Disposal
. 5 Radiation Monitoring
.6 Steam Generators
.7 Control & Instrument Piping & Wiring
.8 Electrical Connections
.9 Other Miscellaneous TOTAL ACCOUNT 226
. 227 Feed Water Supply and Treatment .1 .2 .21 .22
.23
.24
.25
.26
.27
.28
.29
.3
Raw Water Supply Make-up Water Treatment Evaporator Ion Exchange Equipment, Filters, Etc . Acid h Caustic Transf. Pumps & Drives Demineralized Water Storage Tanks Caustic Tank Acid Tank Foundation Piping & Valves Insulation Steam Generator Feed- Water Purification
QUANTITY MATERIAL OR EQUIPMENT
1 Lot
1 Lot
2
2 1 1 1 Lot 1 Lot
TOTALS LABOR
C r
$120,000 $80,000 $200,000
60,000 50 000 110,000 120,000 80 , 000 200 , 000
Included in Account 235
Included in Account 235 Included in Account 235 Included in Account 235
$670,000 $430,000 $1,100,000
Included in Account 211
$45,000 $10,000 $55,000
600 200 800
30,000 Included 30 , 000 2,200 400 2,600 2 J 200 400 2,600 3,500 2,500 6 , 000
Included in Account 228 Included in Account 228

* $ 1 .I t
Table N. 1 (continued)
QUANTITY MATERIAL OR EQUIPMENT
I
ACCOUNT 22 - REACTOR PLANT EQUIPMENT (Cont'd.) 227 Feed Water Supply and Treatment
(Cont'd .) Feed-Water Heaters Deaerating Heaters - "E" 4,020,000 #/Hr. 150 Psig. Closed Heaters L.P. Heater "A" L .P . Heater "B1* L .P. Heater "C" L .P . Heater "D" H.P. Heater "F" H.P. Heater "G" H .P. Heater "H" Feed-Water Pumps and Drives Feed-Water Pumps & Drives 6600 GPM Pumps - 2465 Psig Hd. 11,300H.P. - B.F. Pump Turbine Drive 5600 RPM Motor Driven Star t -up F.W. Pump 6000 GPM Pump 850 Psig. Hd. 3500 H.P. Star t -up FW Pump Motor Heater "A" Drain Pumps and Drives 620 GPM Pump 285 Psig . Hd. 125 H.P. Heater "A" Drain
)
.4
.41
.42
.421
.422 ,423 .424 .425 .426 .427 .5 .51 .511 .512
.52
.521
.522
.53
.531
.532
2
3 3 3 3 3 3 3
3
3
1 1
3
$240,000
75,000 63,000 63,000 81,000 315,000 429,000 441,000
405,000
750,000
70,000 55,000
22,500 Pump Motor 1
C
LABOR TOTALS
$15,000
5,000 5,000 3,000 3,000 3,000 3,000 3,000
12,000
30,000
3,000 2,000
1,500
$255,000
80,000 68,000 66,000 84,000 318,000 432,000 444,000
417,000
780,000
73,000 57,000
24,000

Table N. 1 (continued)
ACCOUNT 22 - REACTOR PLANT EQUIPMENT (Cont'd.) 227 Feed Water Supply and Treatment
(Cont ' d .)
C)
.5
.54
.541
.542
.55
.551
.552
.553
QUANTITY
Feed-Water Pumps and Drives (Cont'd.) Heater "C" Drain Pumps and Drives 700 GPM Pumps 210 Psig. Hd.) 100 H.P. Heater "C" Drain ) 3 Pump Motor 1 Boiler Steam Circulators and Drives 5,300,000 #/Hr . Steam Circulator - 2500 1675'F 5000 H.P. Turbine Drive f o r Steam Circulator 500 # Steam; 10,000 RPM 5000 H.P. Motor f o r Steam Circulator Including Gear and Mag. Coup1 ing TOTAL ACCOUNT 227
228 Steam, Condensate, Feed Water, and a l l Other Piping, Valves E t c . - For Turbine Plant , Crib House and Other Reactor Plant Auxil iar ies .1 Pipe, Valves, F i t t i n g s , E t c .
.12 Other I n t e r i o r Piping )
.ll Turbine Plant 1
.13 Yard Pipe Etc. 1 1 Lot
MATERLAL OR EQUIPMENT
$30,000
9 7 5,000
560,000
100,000 $4,758,000
LABOR TOTALS
$2,500 $32,500
40,000 1,015,000
30,000 590 ,.ooo
7,000 107,000 $181,500 $4,939,500
$4,025,000 $2,575,000 $6,600,000
w P .fc
c:,

Table N. 1 (continued)
QUANTITY
ACCOUNT 22 - REACTOR PUNT EQUIPMENT (Cont'd.)
and a l l Other Piping, Valves E t c . - For Turbine Plant , Crib House and Other Reactor Plant Auxil iar ies (Cont'd.) .2 Insulat ion .21 Piping Insulat ion .22 Equipment Insulat ion
TOTAL ACCOUNT 228
228 Steam, Condensate, Feed Water,
229 Other Reactor Plant Equipment .2 Remote Maintenance
.4
.41
.42
.43
.44
.45
.62
.621
F a c i l i t i e s Coolant Pump Lube O i l System Storage Tank ) Pumps 1 O i l Coolers ) F i l t e r s 1 Piping Intermediate S a l t Sampling System Sampler and Appurtenances TOTAL ACCOUNT 229
TOTAL ACCOUNT 22
1 Lot 1 Lot
Lot
1 2 2 2
Lot
Lot
MATERIAL OR EQUIPMENT
TOTALS LABOR
$455,000 $520,000 $975,000 155;OOO 195,000 350,000
$4,635,000 $3,290,000 $7,925,000 E
3,000,000 Included 3,000,000
29,400 600 30,000
Included i n Account 225
16,500 $3,045,900
2,000 18,500 $2,600 $3,048,500
in
$5,270,825 $51,324,350

ACCOUNT 23 - TURBINE GDTEFtATOR UNITS 231 Turblne Generators
* Turbine Foundations
Table N.l (continued)
QUANTITY
1 U;ic 1 Lot
Concrete - Including Reinforcing St eel, Eto . Miscallaneoue Turbine Generators Turbine Generator Units - As Follows8 1000 MWe Rehest W M n e Generator Unit C.C.6F. 40” L.S.B. Complete with Acceesories Steam C O n d i t i O n 8
Generators: 1,280,OOO KVA Total
Accessoples - Other Than Sttrndard Generator Exciter (Motor Driven) Reserve Exciter l”AL ACCOUNT 231
2i@ P d - 1000.F -1000°F
.85 P.F. and .64 SCR 1
1
232 Circulating Water System .1 -ping and Regulating Systana .11 m p s , Drives & Contlola .112 134,000 GPM Vertical Mixed
Flow Circulating Water p\rmps Head 30 ft. 6
, t Y
MTEIUAL OR EJUIPMIWT
$175,000 10,Ooo
19,815, OoO
LABOR TOTAU
Included i n Account 231.a Included i n Account 231.21 Included i n Account 231.21
’ 360,000
4
18,000 m,m

.I * h
c
Table N. 1 (continued)
ACCOrDUI) 23 - TURKlNE GEIWUTOR UNITS (Canted.) 232 Circulating Mater System (Conttd.)
(Contfd.) .ll Pumps, Drives & Contmls (Cont'd.) ,113 1250 H.P, Motor Drive for
Circulating Water Pumps 6 e12 Traveling Screens, Etc. ,121 Traveling Screens Complete
with Kotors 7 e 1 2 2 1200 GPM Scr
230 Ft. Discharge Head 2 .123 100 H.P. Motor for Screen
Wash hrmp 2 ,124 Trash Rake Complete with
Appurt enanc es 1 .I25 Pipe & Valves 1 Lot e2 Circulating Water Lines .21 .2ll Circulating Water Piping,
e 2 l l l S t e d Circulating Water
e22 Discharge Lines - From
,221 Circulating Water Piping,
-1 b p b g a d Regulating Systms
Supply Lines - To Condenser
Valves, Fittings, Etc.
Piping, Valves Expansion
Cond enaer
Valves, Fit t ings, B c .
Joints, Fit t ings, Etc. 1 Lot
$80 p 000
122,500
5,000
4, 500
27 , 500

Table N. 1 (continued)
QUANTITY
ACCOUNT 23 - TUiZBINE GaJERA'KR UNITS (Cont'd.) 232 Circulating Water System (Cont'd.)
-2 Circulating Water Lines (Cont'd.) .22
.2211
.3
31 .311
.312
.3121
.3122 3 2 3 .313 3131 e3132 *3133 -3134 e32 .321
.322
Discharge h e 8 - From Condenser (Cont'd.) Steel Circulating Water Piping Valves, Expansion Joint 8 Fit t ings, Etc . Intake and Discharge S t ructuree Intake Structures River Dredging & Rock Removal Intake Flume Intake Flume Proper Floating Born Concrete Retaining Walls Intake Crib House Substructure Superstructure S ted Electr ical Work Discharge Seal Well & Discharge Tunnel Discharge Flume
1 Lot
1 Lot
1 LQt 1 2
1 Lot
35 T 1 Lot
-
Lot Lot
LABOR
Included i n Account P2.P
29 , 500 4,500
$12,000
45,000
29,200 10,400
28,400 22 400
57,900 26,900

a b c b' L i,
Te-le N. 1 (continued)
QUANTITn
1 Lot 1 Lot
MATERIAL OR EQUIPMENT
LABOR TOTALS
ACCOUNT 23 - TURBINE GENEWi'IUR UNITS (So3t'd.) 232 Circulating Water Systaf, (Coct'd.)
.4 Fouling, Corrosion Contro l and Water Treatmat
.W Chlorinating System
.w1 Chlorination Equipcent 4 2 Chlorine Handling Facilities
TOTAL ACCOUNT 232
233 Condmsers and Auxiliaries .1 Condensers .U Foundation8 .12 Condenser Shell and
Appurtmances .121 225,000 Sq. Ft. Single Pass
Condensers Complete with Appurtenances Including Shell, Water Boxes, Tube Sheets, Tube Supports, Hot Well, Mended Neck with Expansion Joint , Etc. 50 F t . Long Admiralty Condenser Tubes
.13
2 7 Instruments & Accessories .2 Condensate Pumps .P Pwnm & Drives ,211 1875 a Condensate h p s
Complete with Appurtenances, Mscharge Head - 325 F t .
3
3 3 Sets
3 Sets Included 15,000
6 6,000 93,000

ACCOUHI 23 - TURFSINE GENERATOR UNITS (Contpd.) 233 Condensers and A w d 2 i a r i e s (Cont'd.)
Table N. 1 (continued)
.2 Condensate Pump8 (Cont'd.)
.a. Pumps & Drlvea (Cont'd.) -212 400 H.P. Motors for
-22 Suction Piping .3 A i r Renoval Equipment and
-31
.32 Air Suctlon Piping -33 PrinLing Ejectors
Condensate Pumps
P i p a Steam Jet Air Ejector, with I n t e r & After Condensera
T@TAL ACCOUIV" 233
QUANTIm
6 Int
6 Lot Lot
234 Centm2 Lubricating System .1 Treating & -ping Esuiranent 1 Lot .2 Storage-Tanks & App&e-mcea 1 Lot .3 Fire Protection 1 L O t
TOTAL ACCOUNT 234
100,OOO
235 Turbine ?lant Boards Instrument8 & Controls .1 Control -pent .11 blechanicd. Contml Boards ) -12 Isolated Contmller, 1
Transmitters B c . 1
Meters & Instruments 1
1 Lot .2 Isolated Recording Gauges )
$275,000
LABm
F L I 200 $51,000 Included i.n Accoun, 233.121
9 , o o 1098 Included i n Account 228 k?
Included 5
2,000 19, Ooo 3.m 17.000
Included Account

Table N. 1 (continued)
QUAI lTITP
ACCOUNT 23 - TURBINE GENERATOR UNITS (Contcd.) 235 !l’urbine Plant Boards Instruments
& Controls .3 Control dc Instrument -
mAL ACCOUIE 235
Piping & Tubing 1 Lot .4 Electrical Connectione 1 Lot
236 Turbine Plant Piping .1 Main Steam Between Stor,
Valves and Turbine I n l t
Piping and Valves TOTAL 236
.2 Drip, Drain and V e n t
237 AwdliaryEqu - i m e n t for Gen erato FB .1 Excitation Panels.
Switches 13 iiheostk,ts
Systens
systan
Cooling system
cooling System
.2 Generator Cooling Water
.21 Lubricating O i l Cooling
.22 Qazerator Hydrogen
.23 Generator Liquid
Lot
MATERIAL aR pi[xT=
$2o..ooo
LABOR TOTAM
Included i n Account 231.2
Included in Account 228 Included i n Account 228
IncludcZ i n Account 231.2
60,000 :.?,reo 72, OOO

Table N. 1 (continued)
QUANTITY MATERIAL OR LABOR TOTALS EQUIPMENT
ACCOUNT 23 - TURBINE GENERATORS UNITS (Contld.) 237 Auxiliary Equipment for
Generators (Cont'd.) .3 Central Hydrogen Cooling
.4 F i re Extinguishing Equipment) Including Piping and C02 )
Sy6fClB - - - -
Lot $50,000 $15 , 000 $65 , 000 System Exclusively for 1 Generators 1
.5 F i r e Extinguishing 1 Equipment for O i l Ram, E tc . ) TOTAL ACCOUNT 237 $110 , 000 $27,000 $137,000
238 Other Turbine Plant Equipment .1 Gland Seal Water System .2 Vacuum Priming System
TOTAL ACCOUNT 238
1
TOTAL ACCOUNT 23
ACCOUNT 24 - ACCESSORY ELECTRIC EQUIPMeNT 241 Switchgear
.1 Generator Main and Neutral
.ll Generator Potential C i r cu i t s
Transformer Compartment 2 .12 Surge Protection Equipment 2 .13 Generator Neutral Equipment 1 .14 Miscellaneous Items Lot
$38,000 14,000 6,000
. 10,000
t Inc luded i n Account 228 ----C Included i n Account 228 e Included i n Account 228
f. le6 403 $26 , 843,700
$4,000 1,600
800 19,200
$42,000 15 , 600 6 , 800
29 , 200

.. . ..................... ............................ .. . . . . . . . . . . . . . . I .I" ._- - 1411-_1. ..... ........... 1111 I
w 4 (. .\ (1
................ ........ . . 1 1 1 1 _ ___...l__l ............ ...I .... ...... .....
Table N. 1 (continued)
QUA" ITY MATERIAL OR LABOR TOTALS EQUIPMENT
=
365 , 000 110,000
$543 , 000
$82 , 000
ACCOUNT 24 - ACCESSORY ELECTRIC EQUIPMENT 241 Switchgear. (Cont'd.)
(Cont ' d .I .2 Station Service .21 13.8 KV Switchgear .22 4160 V. Switchgear .23 480 V. Switchgear
TOTAL ACCOUNT 241
242 Switchboards .1 Main Cont .2 Auxiliary Power Battery &
.21 Battery & Battery Charging
.22 D.C. Control & Auxiliary
Signal Board
Pane 1 s 1
Lot Lot Lot
- 51.200
- 416,200
Lot $31,200 $113 , 200
15,000 5,600 20,600
Pane 1 s 2 18,000 .23 A.C. Control & Instrument Panels 1 7,000 .24 Motor Control Centers Lot 80,000 .25 Miscellaneous Panels &
4,800 1,600 13,600
22,800 8,600 93,600
Lot Boards TOTAL ACCOUNT 242
243 Protective Equipment .l General Station Grounding
E qu i pme n t .2 Fire Protection System
TOTAL ACCOUNT 243
16,000 $218,000
11,200 $68,000
27 I 200 $286,000
$48,800 Lot $60,000 Lot 14,000
$74,000
$108,800 81800
$57,600

Y
Table N. 1 (continued)
QUANTITY MATERIAL OR EQUIPMENT
LABOR TOTALS
ACCOUNT 24 - ACCESSORY FUCTRIC EQUIPMENT (Cont'd.) 244 Electr ical Structures
.1 Concrete Cable TUnnels, Compartmenta and Cable Trenches i n Earth Lot $14,000
. 2 Cable Traya 6 Supports 192,000 lb . 80,000
.3 Pipe and Steel Frames and Supports Lot 7 , 000
.4 Foundations & Pads for Elec t r ica l Equipment Lot 5,000 TOTAL ACCOUNT 244 $106 , 000
$21,600 72,000
$35,600 152,000
8,000 15,000
5.600 $107,200
10.600 $213,200
245 Conduit .1 Conduit .ll Power Conduit .12 Control and Instrument
Conduit . 2 Concrete Envelopes .21 10" Transita Pipe Duct Run .22 Iron Conduit Enclosed i n
Concrete .3 Manholes & Covers
TOTAL ACCOUNT 245
Lot $61,200 $86,200 $25,000
22, OoO 54,400 76,400
12.800
Lot
6 , 000 6,800 Lot
Lot 5
24.200 9,000 5.000
$67 , 000
15,200 5.600
$143,200
246 Power and Control Wirinq .1 Main Power Cables and Bus
Duct .ll Isolated Phase Bus Duct
(Generator) .12 Main Power Cables
Lot 1
$576 , 000 110,000
$625 , 600 126,000
$49,600 16 , 000

c C
Table N . 1 {continued)
. QUANTITY MATERIAL OR
ACCOUNT 25 - MISCELLANEOUS POWER PLANT EQUIPMENT (Cont ' d ,) Cranes and Hoisting Equipment (Cont'd.) .2 Miscellaneous Cranes and Hoists
251
TOTAL ACCOUNT 251
252 Compressed A i r and Vacuum Cleaning System .1 Compressors and Accessories ,11 200 C.F.M. S ta t ion A i r
Compres sore Including Motor Drives
.12 250 C.F.M. Control A i r Compressors including Motors
.13 A i r Drying Equipment f o r Control A i r System
.14 Receivers ,141 S ta t ion A i r .142 Control A i r .2 Pipe Valves and F i t t i n g s .3 Vacuum Cleaning System
TOTAL ACCOUNT 252
253 Other Power Plant Equipment .l Local Communication, Signal
and Cal l System ,2 F i r e Extinguishing Equipment .21 2000 GPM Fi re Pump Including
Drive and Accessories .22 Other F i r e Protect ion
Equipment
Lot
2 2
Lot Lot
Lot
Lot
EQUIPMENT
$23,000 $173,000
LABOR
$2,000 $22,000
TOTALS
$25,000 $195,000
$13,500 $1,200 $14,700
15,500 1,200 16,700
9,000 500 9,500
1,300 300 1,600 1,300 300 1,600
-Included i n Account 228 4
20,000 $64,100
4.(30Q $7,500
16.ooo $56,600
$50,000 $44,800 $94,800
$19,000
Included i n Account 211.24
$1,000 $20,000

Table N. 1 (continued)
QUANTITP
ACCOUNT 25 - MISCELLANEOUS POWER PLANT (Cont'd.) 253 Other Power Plant Esuiranent (Cont'd.)
Furniture and Fixtures Lot .I .4 05 .6
.7
71 72
09
Lockers, Shelves, and Catd.net8 Lot Cleaning Equipent Int Machine Tools & Other Station Maintenance Equipnent Lot Laboratory, Test & Weath er Ins trmnent s Radiation Monitoring Equipment Lot Miscellaneous Laborat.org, Telst & Weather Instruments Lot Diesel Generator Unit loo0 KW Including Oil Tank 1 TOTAL ACCOUNT 253
TOTAL ACCOUNT 25
TOTAL DIRECT CONSTRUCTION COST
INDIRECT COSTS Contractor's O'HD and PmfMt 20% SUB-TOTAL
mer& and Administrative 6.3% SUB-TOT&
Miscellmneous Construction 3% SUB-TOTAL
C)
HATEFUL OR EQUIPMENT
240,000
23,000
20, Ooo
LABm
$10,000
2,000
897,300
$11,166,574
TOTAIS
23 333,300 $91,674,500
5,775 9 5 0 0 $97,440 ,m
974,500 $98,424,50(?

g G I N E E R I N G DESIGN AND INSECTION A - E Design and Inspection U.lk SUB-TUTAL
Nuclear Engineering 3 . s SUB-rnAL
start SUB-TOTAL
Land and Land Right8 SUB-TUTAL
Contingency l@ SUB-TOTAL
Table N. 1 (continued)
QUANTXTY MATEXAL OB EQUIPMENT
Interest During Construction 9.G SUETCYl'AL
Fuel Charge
Int ennediate Coolant Salt Investment, and 1.5% fop Interest During Construction
TOTAL CAPITAL INlUiSDENT
LABOR TOTAM
360,000 4bU-4, 6 ~ ~ ~ 7 0 0
11,461,200 $126 , 072,900
Not Inc lwi ed
l0,790,000 161,800
8U.8 875,600

328
!
zi. t Appendix 0
DESIGN REQUIREMENTS FOR THE MSCR MODERATOR
Lo Go Alexander
Introduction
The reactor vessel contains the moderator and holds it i n q s t ab le posit ion during a l l phases of operation, provides for accepting f u e l dis-
charged from the heat exchangers, passage of f u e l through the moderator, and discharge t o the f u e l pumps,
The reactor m u s t be designed t o expose the fue l t o neutrons at a spe- The graphite must be sup- c i f i ed ra t io of graphite volume t o fue l volume,
ported and rest ra ined under a l l circumstances, including the drained condition. Allowance must be made for d i f f e ren t i a l expansion between
graphite and vessel, fue l over t he core entrance, and for col lect ing the flow a t the ex i t ,
Provision must be made f o r d i s t r ibu t ing the flow of A
free surface i n an expansion chamber must be provided somewhere i n the f u e l
c i r c u i t , and c i rcu la t ion through the expansion chamber must be maintained. Provision must be made for preheating the reac tor vessel p r io r t o charging
molten sal t , and fo r cooling the reactor vessel during operation and after shutdown. This cooling must be accomplished without t he generation of ex- cessive thermal stresses. The vessel must be designed i n conformance with the pressure vessel codeo Means of sparging the f u e l i n the expansion
chamber with an i n e r t gas must be provided t o remove xenon and other vola-' t i l e materials.
and it must be composed of pieces su f f i c i en t ly small t h a t d i f f e r e n t i a l shrinkage due t o exposure t o neutrons w i l l be to le rab le i n each piece,
graphite and metal s t ruc ture must be avoided i f such stagnation leads to ' excessive temperatures or stresses i n e i t h e r t he fuel , graphite, or metal s t ructure ,
Excessive thermal stress i n the graphi te must be avoided,
Stagnation of the f u e l between adjacent blocks of graphite or between ,
Temperature at the fuel-graphite in te r face should be below t h a t at which chemical reaction, i f any,
rate, and below the temperature a t which
\
takes place a t an appreciable
any important const i tuent of the

329
sa l t (other than vo la t i l e f i ss ion products) has appreciable vapor pres-
sure (e.g., i f UF were t o vaporize appreciably and d i f fuse i n t o pores
i n the graphite, t h i s would be disadvantageous and perhaps hazardous
Temperature gradients i n the graphite near stagnation areas should not
exceed those corresponding t o to le rab le thermal stresseso
4
In the MSCR it is desirable, i n order t o reduce the graphite surface
exposed t o permeation by s a l t and f i ss ion product gases, t o use moderator elements of la rger diameter than i n the MSRE. On the other hand, s e t t i n g
an allowable thermal s t r a i n of 0.001 imposes an upper l i m i t , A diameter
of about s i x t o e ight inches appears t o be a su i tab le compromise between
the confl ic t ing requirements, It would be desirable f o r t he logs t o extend the length of t h e core,
but radiat ion damage may induce a tendency f o r t he logs t o bow outward
and t h i s would increase the volume f rac t ion of fue l i n the core. This
increase is controlled and largely eliminated by using logs 24 in. long
and stacking these i n a v e r t i c a l posit ion, The ends are mated by means of pins and sockets,,
modated by a s l i g h t rotat ion about the pins.
Different ia l shrinkage of the graphite is now accom-
Fuel sa l t should permeate the graphite not more than O o l % by volume.
With t h i s penetration, and 10 volume per cent of f u e l i n the core, about
one per cent of the fuel w i l l be i n the pores i n the graphite.
probably tolerable , especial ly i f the accessible pores are those near t he surface, as seems t o be the case,
is closely re la ted t o the problem of a f te rhea t , since the f u e l so in-
volved is probably not readi ly drainable.
sa l t thus retained must be provided i f possible, and i f t h i s is not
possible, means must be provided of removing t h e heat generated i n the core after drainage,
This is
Fuel stagnation i n cracks between blocks and i n pores i n t h e blocks
Means of flushing t h e fuel-
Temperature r i g e and thermal stress i n the reac tor vessel must be
l imited t o to le rab le levels . gap between t h e graphite s t ruc ture and the reac tor vessel not less than
1 in , i n the r a d i a l direct ion.
through t h i s annulus not only t o remove the heat generated there , but
a l so t o cool t he reac tor vessel ,
Different ia l thermal expansion w i l l leave a
It w i l l be necessary t o provide some flow

: 330 n w * 1
It w i l l be necessary t o o r i f i ce the flow channels, or otherwise vary the i r width systematically i n order t o d is t r ibu te the flow through
the core compatibly w i t h the power density dis t r ibut ion t o achieve uni-
form teGerature r i s e i n a l l fue l chaonels.
Moderator
In the &ERE (l), the moderator i s constructed of square graphite
bars measuring 2 inches on the sides and 63 inches long. ioches deep and 1.2 inches wide a re machined in to al ternate faces of the
bars, which are pinned loosely t o beams lying across the bottom of the
Channels 0.4
vessel. The channels occupy 22.5% of the volume of the matrix.
The shape, size, and spacing of the MSRE moderator elements a re not suitable for the MSCR.
f u e l needs t o be of the order of 10 percent.
The pieces need t o be larger and the volume of
The void fract ion i n a matrix formed by closely packed cylinders of uniform diameter i s 0.093.
stable, i s easi ly assembled i n a close array, and provides a minimum of
contact between individual pieces.
amount of stagnant f u e l i s probably roughly proportional t o the t o t a l
area of contact. Small var ia t ions i n radius, c i rcu lar i ty , and s t ra ight-
ness of the cylinders can be tolerated, and a voidage as low as lo$ s t i l l be achieved.
of the swface of the cylinders; i n fac t , the voidage can be systema-
t i c a l l y varied both rad ia l ly and ax ia l ly i n t h i s way.
positions of the logs a re fixed by contact of the unmachined portions a t
the top and bottom. It should thus be possible t o reduce power peaking
i n the reactor and, by a combination of or i f ic ing and power f la t tening,
t o obtain a good match between radial dis t r ibut ions of flow and power
density and thus achieve approximate equal temperature r i s e i n a l l f u e l
channels.
Such a matrix appears t o be s t ruc tura l ly
This l a s t i s important i n tha t the
Higher voidages can be obtained by machining away portions
The r e l a t ive
I n the MSCR study, fuel-volume fract ions i n the range from 0.1 t o
0.2 were investigated. The optimum fraction appears t o be s l igh t ly
.
i
i
331
g r e a t e r than 0.1. f u e l f r a c t i o n much smaller than t h i s .
to le rances i n t h e machining of t h e logs and assembling of t h e matrix in-
troduce unce r t a in t i e s t h a t become an appreciable f r a c t i o n of t h e f u e l volume.
c ross sec t ion , but there are l i m i t s , v iz , : log t h a t can cu r ren t ly or i n t h e foreseeable fu tu re be manufactured; (b )
a l i m i t imposed by thermal stress i n t h e log, which becomes excessive
with increas ing size. be made now (1962); while t hese are not of a grade s a t i s f a c t o r y f o r use i n t h e MSCR, it is not a g r e a t ex t rapola t ion of cur ren t technology t o
pos tu l a t e t h e a v a i l a b i l i t y o f graphi te logs o f s a t i s f a c t o r y grade i n s i z e s up t o 8- inches i n diameter, and t h i s appears t o be as l a r g e as
thermal s t r a i n considerations w i l l allow.
It appears undesirable t o design a matrix having a A t low f u e l f r ac t ions , dimensional
This uncer ta in ty can be reduced somewhat by using logs o f l a r g e
(a) a l i m i t on t h e s i z e of
Graphite logs measuring 16 inches i n diameter can
If t h e volume f r a c t i o n of f u e l i n t h e core is small, then any s l i g h t
va r i a t ion i n t h i s volume f r a c t i o n would have an appreciable effect on t h e
r e a c t i v i t y and might r e s u l t i n power excursionso arise i n any of a number of ways.
r e s u l t i n t h e accumulation of stresses i n t h e graphi te which, upon sudden removal of external restraints (such as by t h e f a i l u r e of t h e hoops,
etc.) or by t h e y i e ld ing of t h e ma te r i a l i tself , might r e s u l t i n gross
movement of t h e matrix, and a sudden increase i n r e a c t i v i t y ,
Also, a t very low volume f r a c t i o n s , t h e optimum concentrations of
f i s s i le and fer t i le i so topes i n t h e f u e l stream becomes high, and t h i s
imposes requirements on t h e design of t h e external system i n regard t o hold-up, v e l o c i t i e s , etc., t h a t are d i f f i c u l t t o meet.
These va r i a t ions might
For instance, r a d i a t i o n damage might
Permeation of Graphite by Salt
Graphite is not impervious t o salt. The presence of an appreciable
f r a c t i o n of t h e sa l t i n stagnant pockets introduces a number of problems
(such as t h a t assoc ia ted with t h e fate of f i s s i o n products generated i n stagnant fue l ) . MSRE graph i t e has a bulk dens i ty o f about 1.83, and thus t h e pore
The " theore t ica l" dens i ty of graphi te is 2.25 grams/cc.

, 4
332
f rac t ion is about 0.16.
as kerosene o r a gas, however, amount t o only 0.07% of the volume, Graphite is not wetted by molten f luoride salts, and the penetration is an order less than t h a t of a wetting f lu id . several methods (5) reduces the penetration fur ther , e i t h e r by f i l l i n g
the pores, by closing them, or by making the entrances smaller.
which CGB-X graphite, newly proposed f o r t he MSRE, was exposed t o sa l t
at 130OOF and 150 p s i fo r 100 hours resul ted i n volume fract ion permea- t i ons of 0,001 and 0,0002 (2, p, 931,
a t the surface, and were presumably i n reasonably good d i f fus iona l com-
munication with the bulk f lu id ,
small, and the proportion of surface exposed was high,
on expected frequency of surface pores i n la rger pieces led t o a predic- t i o n of a penetration not greater than 0.0016 i n the MSRE graphite a t 65 p s i pressure i n the sa l t (2 , p. 91). Taking advantage of t he fact
t h a t the number of surface pores can be reduced by proper or ien ta t ion of
the surface grains and t h a t with la rger bars the ra t io of surface-to-
The pores accessible t o a wetting f lu id , such
Treatment by any one of
Tests i n
The occlusions of sa l t l ay mostly
The pieces tes ted were necessarily Estimates based
volume is less, it appears plausible t h a t a sal t -accessible pore f rac t ion
of 0.001 can be assumed for MSCR graphite. Now, i f t he graphite occupies
90% of the matrix, salt-accessible pores i n t he graphite amount t o
roughly 0,1%, which is only 1% of the to ta l fue l f rac t ion ,
fuel i n these pores may be retained when the reac tor is drained, and
t h i s may present a ser ious operational d i f f i cu l ty i n regard t o cooling
the reac tor after shutdown, especial ly i f t h e core is drained shor t ly
after operation a t power,
However, the
Graphite Shrinkage
The graphite w i l l , of course, be subjected t o radiat ion damage,
mostly from fast neutrons.
the graphite w i l l shrink, of t he core w i l l absorb more radiat ion than the outer s ide , t he logs
A t t he temperatures ant ic ipated i n the MSCR,
Since t h a t s ide of a log c loses t t o the center
A
w i l l tend t o bow outward, and increase the volume f rac t ion of the fuel , LJ These effects w i l l t a k e place slowly, of course, and can e a s i l y be
b
c

333
compensated, i n r e spec t t o c r i t i c a l i t y , by increas ing t h e concentrat ion
of thorium i n t h e f u e l or by decreasing t h a t of t h e uranium.
ra t io w i l l necessa r i ly decrease, however, due t o s h i f t i n g of t h e C/Th/U ra t io from t h e optimum. As mentioned above, t h e effect is minimized by
t h e use of s h o r t logs.
The breeding
Graphite Replacement
The p rec i se effect of g raph i t e shrinkage on t h e performance (as mea-
sured by t h e f u e l cycle cost) has not been determined; however, i f it
proves t o be se r ious , one or more of s e v e r a l countermeasures may be taken. The s imples t would be t o rep lace t h e graphi te pe r iod ica l ly .
s ink ing fund cost (@ 6.75%) over t h a t corresponding t o s ink ing fund amor- t i z a t i o n over a th i r ty -yea r l i f e (loll%, and which is charged o f f t o cap-
i t a l costs) is l i s t e d below i n Table 0.1 for s e v e r a l replacements per iods.
The excess
Table 0,l. Power Cost Increment for Replacement of Graphite* Moderator i n MSCR
~~
Replacement Period Incremental Power Cost (years 1 (mills/kwhr)
~~
1 0.58 5 0.096
10 0.037
15 0.018
20 0,008
*@ $6/lb.
It is seen t h a t , i f t h e replacement occurs no o f t e n e r than once i n ten years , t h e incremental cost is t o l e r a b l e , being less than 10% of a typical f u e l c o s t of 0.75 mills/kwhr.
If t h e shr inkage rate is such as t o r equ i r e replacement more o f t e n
than t h i s , then p a r t of t h e f u e l volume f r a c t i o n increase might be avoided
by r e s t r a i n i n g t h e core and preventing t h e bowing of t h e logs. Hoops of

334
molydbenum, which have a coeff ic ient of thermal expansion very nearly
equal t o t h a t of graphite ( 3 ) could be placed around the core (4, p. 32).
O f course, should the hoops f a i l suddenly, an excursion i n the power
l eve l might resu l t . stresses i n the graphite might r e s u l t i n the formation of cracks i n which
the f u e l might stagnate with deleterious effect,
On the other hand, . i f the hoops held, accumulated
The fue l volume f rac t ion can be made self-preserving i n s p i t e of
radiat ion induced shrinkage by use of interlocking blocks of graphite. The moderator elements are cubes having four holes, or sockets, i n the
four quadrants of the upper face and four corresponding pegs extending from the lower face.
of the next layer are positioned so t h a t t he ax i s of each block l ies over
the intersect ions of the f u e l channel planes between adjacent blocks i n t h e lower layer, with its pins f i t t i n g i n t o sockets i n four blocks i n
t h a t layer. l ayer above and four i n the layer below. With cubes measuring 8 inches
along an edge, and a void fract ion of lo%, t he thickness of t h e passage between adjacent cubes is approximately 0.4 inches when the blocks rest d i r ec t ly on the blocks below, and 0.3 inches when uniform clearance is provided on a l l s i x s ides of t he blocks.
fue l volume fraction i s iavariant, since t h i s i s determined by the
spacing of the pegs and sockets and the dimensions of t he blocks.
After a layer of blocks has been l a i d , the blocks
Thus each cube is pinned t o four overlapping cubes i n the
Now, as the blocks shrink, the
This arrangement, while solving one problem, introduces others,
chief of which is a much increased resistance t o flow of the f u e l through
the core, which may increase by a fac tor of perhaps 20,
crease the pumping cost and the design requirements for pumps, heat
exchangers and reac tor vessel.
This would in-
If d i f f i c u l t y with short-circuit ing of the fue l through t h e annular gap between moderator and reac tor vessel is encountered, t h i s could be
controlled by eliminating the gaps between the outer blocks of graphite
so t h a t the blocks f i t t i g h t l y one against t he other. The annulus thus
becomes a channel unconnected t o the voids i n the moderator, and the
flow through it could be or i f iced a t the top where the p i l e floats up
against t he upper support g r id ,
.

335
The foregoing discussion of the problem of graphite shrinkage indi- cates some solutions t h a t might be applied i f the problem should prove
to be ser ious, but it should not be inferred therefrom t h a t the problem
is known t o be ser ious, f o r i n fact, it may not be,
t i ons (6) t h a t radiat ion damage may anneal and sa tura te a t t he tempera-
t u re of operation.
after the steady state is reached, the f u e l volume f rac t ion is a t the
desired value.
There are indica-
I n t h a t event, t h e core would be designed so t h a t ,
Di f fe ren t ia l Expansion
The coeff ic ient of thermal expansion of graphite is smaller than t h a t of INOR (compare Tables 3.2 and 3.1).
graphite j u s t f i l l i n g the vessel a t room temperature, there w i l l be a gap about 2/3-in0 wide between the graphite and the vessel w a l l a t l lOO°F.
If fur ther allowance is made f o r dimensional tolerances between metal and
graphite during assembly, the gap cannot be much less than one inch thick
a t operating temperatures,
Thus, i n a 20-ft core with the
This gap w i l l contain fue l sa l t , and t h i s fact must be taken i n t o account i n evaluating the performance of the reactor and i n the design of
the core and the reac tor vessel. of f u e l i n the annulus amounts t o % 100 ft3, which is an appreciable
fraction of t he volume of f u e l i n t h e matrix (% 600 ft3).
i n a region of low neutron population so t h a t it adds l i t t l e t o the re- ac t iv i ty ,
absorbed, multiplied by eta, and re-emitted as fast neutrons, thus in- creasing the leakage.
In a 20 f t cy l indr ica l core the volume
This f u e l l i e s
Also, it is nearly opaque t o thermal neutrons which are
This concentrated source of fast neutrons and
concomitant gamma radiat ion adjacent t o the duces design problems, It may be necessary
between the f u e l annulus and t h e w a l l . The
reac tor vessel w a l l in t ro-
t o provide a thermal sh ie ld
most sui table material f o r t h i s sh ie ld is INOR, but t h i s must be cooled,
cooling medium i n t h i s s i t ua t ion is the f u e l sa l t , and i ts use f o r t h i s
purpose fur ther increases the nonactive inventory of valuable materials.
The only avai lable

336
It may be possible t o use the f u e l annulus as a downcomer for f u e l coming from the heat exchangers. This may or may not resu l t i n some . saving i n fue l inventory, depending on the location of t he exchangers
and t h e i r requirements f o r draining, etc,
MSRE (1).
The annulus is so used i n the
1.
2.
3.
4.
5.
References
A, Lo Boch e t al., The Molten-Salt Reactor Experiment, Power Reactor Experiments, Vol. I, pp. 247-292, Internat ional Atomic Energy Agency, Vienna, 1962.
Oak Ridge National Laboratory, MSRP Semiann. Prop . Rept, Feb. 28, 1962, USAEC Report ORNL-3282 . S. E. Beall e t al., Molten-Salt Reactor Experiment Preliminary Hazards Report, USAEC Report ORNL CF-61-2-46 (with Addenda 1 and 21, Oak Ridge National Labo=atory, February 1961.
Oak Ridge National Laboratory, MSRP Quarterly Progr. Rept. July 31, 1960, USAEC Report OWL-3014.
J. W. H. Simmons, The Effects of I r rad ia t ion on the Mechanical Proper- t ies of Graphite, Proceedings of t he Third Conference on Carbon, Sections E and F, Pereamon Press. 1959.

1.
2.
3 .
4.
5.
6.
7.
8.
9.
10.
11
12.
13 *
337
BIBLIOGRAPHY
L. G. Alexander e t al . , Nuclear Characterist ics of Spherical, Homo- geneous, Two-Region, Molten-Fluoride-Salt Reactors, USAEC Report ORNL-2751, Oak Ridge National Laboratory, September 1959.
L. G. Alexander e t a l . , Experimental Molten-Salt-Fueled 30 Mw Power Reactor, USAEC Report ORNL-2795, Oak Ridge National Laboratory, March 1960
L. G. Alexander e t al . , Thorium Breeder Reactor Evaluation - P a r t I - Fuel Yield and Fuel Cycle Costs i n Five Thermal BTeeders, USAEC Report ORNL-CF-61-3-9, Oak Ridge National Laboratory, March 1961, and USAEC Report ORNL-CF-61-3-9 (Appendices ), Oak Ridge National Laboratory, March 1961-
Robert Avery e t al . , Report of the Fluid Fuel Reactors Task Force t o the Division of Reactor Development, USAEC, USAEC Report TID-8507, United S ta tes Atomic Energy Commission, February 1959.
S. E. Beall e t a l . , Molten-Salt Reactor Experiment Preliminary Hazards Report, USAEC Report OWL-CF-61-2-46, (Addendum 1 and 2 ) , Oak Ridge National Labor a t ory , Febmary 1961.
E. S. Bet t i s e t al . , The Aircraf t Reactor Experiment - Design and Construction, Nuclear Science Engineering, 2:804 (November 1957).
E. S. Bet t i s e t al . , The Aircraf t Reactor Experiment - Operation, Nuclear Science Engineering, 2: 841 (November 1957).
B. C. Blanke e t al . , Density and Viscosity of Fused Mixtures of Lithium, Beryllium, and Uranium Fluorides, USAEC Report MLM-1086, Mound Laboratory, March 1959.
J. 0, Blomeke, Nuclear Properties of 235U Fission Products, USAEC Report ORNL-1783, Oak Ridge National Laboratory, April 1957.
J. 0. Blomeke and M. F. Todd, Uranium-235 Fission Product Production, USAEC Report ORNL-2127, Oak Ridge National Laboratory, November 1958.
C. M Blood, Solubi l i ty and S t a b i l i t y of S t ruc tura l Metal Difluorides i n Molten Fluoride Mixtures, USAEC Report ORNL-CF-61-5-4, Oak Ridge National Laboratory, May 1961.
A. L. Boch e t al., The Molten-Salt Reactor Experiment, Power Reactor Experiments, Vol. I, Internat ional Atomic Energy Agency, Vienna, 1962, pp. 247-292.
J. 0. Bradfute e t a l . , An Evaluation of Mercury Cooled Breeder Reactors, USAEC Report ATL-A-102, Advanced Technology Laboratory, October 1959.

14
15
16.
17
18.
19
20.
21
22.
23.
24.
25 -
26 -
27 -
338 v
R. C. Briant and A. M. Weinberg, Molten Fluorides as Power Reactor Fuels, Nuc. Sci. Eng., 2:797 (November 1957).
J. Bulmer e t al . , Fused S a l t Fast Breeder, USAEC Report ORNL-CF-56- 8-204 (Del. ), Oak Ridge National Laboratory, August 1956.
D. 0. Campbell and G. I. Cathers, Processing of Molten Sa l t Power Reactor Fuels, Ind. Fhg . Chero., 52:4l (January 1960).
M. C. Cannon e t a l . , Adsorption of Xenon and Argon on Graphite, USAEC Report ORNL-2955, Oak Ridge National Laboratory, November 1960.
W. H. C a r r e t al., Uraniwn-Zirconium Alloy Fuel Processing i n the ORNL Vola t i l i ty P i lo t Plant, USAEC Report ORNL-2661, Oak Ridge National Laboratory, July 1962.
W. L. Carter, Thorium Uti l izat ion Program: A Survey of Processing Methods for Thorium Reactor Fuel, USAEC Report OTNL-TM-241, Oak Ridge National Laboratory, July 1962.
W. L. Carter, Thorium Util izat ion Program: Fuel Cycle Cost estimates for the Molten Sa l t Converter Reactor, USAEC Report ORNL-CF-62-12-55, Oak Ridge National Laboratory, December 1962.
W. L. Carter, R. P. Milford, and W. G. Stockdale, Design Studies and Cost Estimates of Two Fluoride Volat i l i ty Plants, USAEC Report ORNL-TM ( i n preparation), Oak Ridge National Laboratory, October 1962.
G. I. Cathers e t al., The Fused S a l t Fluoride Vola t i l i ty Process for Recovering Uranium, USAEC Report ORNL-2661, Oak Ridge National Labora- tory, April 1959.
G. I. Cathers e t al . , Use of Fused-Salt Fluoride Vola t i l i ty Process With Irradiated Urania Decayed 15-30 Days, USAEC Report ORNL-2380, Oak Ridge National Laboratory, September 1962.
S. I. Cohen e t al. , A Physical Property Summary fo r ANP Fluoride Mixtures, USAEC Report ORNL-2l.50 (Declassified), Oak Ridge National Laboratory, A u g u s t 1956.
S. I. Cohen and T. N. Jones, A Summary of Density Measurements on Molten Fluoride Mixtures and a Correlation for Predicting Densities of Fluoride Mixtures, USAEC Report ORNL-1702 (Declassified), Oak Ridge National Laboratory, July 1954.
J. K. Davidson and W. L. Robb, A Molten-Salt Thorium Converter for Power Production, USAEC Report KAPL-M-JKD-10 (Declassified), Knolls Atomic Power Laboratory, October 1956.
R. W. Davies e t al . , 600 Mw Fused Sa l t Homogeneous Reactor Power Plant, USAEC Report CF-56-8-208 {Deleted), Oak Ridge National Labora- tory, August 1956.
28.
29.
30
31
32
33.
34.
35
36
37.
38.
39.
40
41.
339
J. H. DeVan and R. B. Evans 111, Corrosion Behavior of Reactor Materials i n Fluoride S a l t Mixtures, USAEC Report ORNL-TM-328, Oak Ridge National Laboratory, September 19, 1962.
Lawrence Dresner, Tables for Computing Effective Resonance Integrals , Including Doppler Broadening of Nuclear Resonances, USAEC Report ORNL-CF-55-9-74, O a k Ridge National Laboratory, September 1955.
T. A. Eastwood and R. D. Werner, The Thermal Neutron Capture Cross Section and Resonance Capture In tegra l of Protactinium-233, Can Jr. Phys. , 38: 751 (June 1960).
W. K. Ergen e t a l . , The Aircraf t Reactor Experiment - Physics, - Nuc. Sei. Eng., 2:826, November 1957.
W. H. Farrow, Jr., Radiochemical Separations Plant Study, Part 11. Design and Cost Estimates, USAEC Report DP-566, E. I. du Pont de Nemours and Co., March 1961.
D. E. Ferguson, Fuel Cycle Development: Semiannual Progress Report, USAEC Report ORNL-3142, Oak Ridge National Laboratory, July 1961.
R. L. Ferguson and G. D. O’Kelley, A Survey and Evaluation of 233U Fission Yield Data, USAEC Report ORNL-CF-62-3-71, O a k Ridge National Laboratory, March 1962.
J. D. Gabor e t al. , Spray Fluorination of Fused S a l t as a Uranium Recovery Process, USAEC Report ANL-6131, Argonne National Laboratory, March 1960.
E. R. Gaerttner and M. L. Yeater, Reports t o the AEC Nuclear Cross Section Advisory Group, USAEC Report WASH-194, Nuclear Cross Sections Advisory Group, AEC, February 1958.”
J. D. Garrison and B. W. Roos, Fission Product Capture Cross Sections, Nuc. Sci. Eng., l2:115 (January 1962).
P. F. Gorman, 1000 Mw Unit Conceptual Design Supercr i t ical Double Re- heat Coal Fired, (No document number), Jackson and Moreland, Inc., New York, January 1962.
C. R. Greenhow and E. C. Hansen, Thermal and Resonance Fission-Product Poisoning for 235U System, USAEC Report KAPL-2172, Knolls Atomic Power Laboratory, October 1961.
W. R. Grimes e t al . , Reactor Chemistry Division Annual Progress Report f o r Period Ending January 31, 1960, USAEC Report ORNL-2931, pp. 87-88, Oak Ridge National Laboratory, April 1960.
C. E. Guthrie, Fuel Cycle Costs i n a Graphite Moderated 235U-Th Fueled Fused S a l t Reactor, USAEC Report ORNL-CF-59-2-82, Oak Ridge National Laboratory, February 1959.

42.
43 9
44
45
46
47
48
49.
50.
51.
52
53
54
55.
340
R. Gwin and D. W. Magnuson, Determination of Eta by Comparison of 233U and 235U in a Flux Trap Critical Assembly, Nuc. Sci. Eng., U(3): 359, March 1962.
R. Gwin and D. W. Magnuson, The Measurement of Eta and Other Nuclear Properties of 233U and 239Pu in Critical Aqueous Solutions, Nuc. Sci. Eng., l2(3):364, March 1962.
J. A. Harvey, Oak Ridge National Laboratory, personal communication to C. W. Nestor, Oak Ridge National Laboratory, March 1960.
E. C. Hensen, A Critical Examination of the Uncertainties in Pre- dicted Gross Fissioa Product Poisoning, USAEC Report KAPL-M-ECHi8, Knolls Atomic Power Laboratory, March 1962.
E. C. Hensen and C. R. Greenhaw, An Improved Generalized Analysis of Fission Product Poisoning and Thermal and Resonance Fission Fragment Cross Sections, US.4EC Report KAPL-M-ECH-7, Knolls Atomic Power Lab- oratory, September 1960.
I). J. Hughes and R. B. Schwartz, Neutron Cross Sections, USAEC Report BNL-325, Brookhaven National Laboratory, July 1958.
The Industrial Graphite Engineering Handbook, National Carbon Company, Division of Union Carbide Corporation, 30 East 42nd Street, New York 17, New York, 1962.
T. Jarvis et al., Reactor Design and Feasibility Problem, USAEC Report ORNL-CF-53-10-26 (Casssif ied), pak Ridge National Laboratory, August 1953.
L V. Jones et al., Phase Equilibria in the LiF-BeF2-UF4 Ternary Fused Salt System, USAEC Report MLM-1080, Mound Laboratory, June 1957.
Kaiser Engineers Division, Steam-Cooled Pawer Reactor Evaluation, Capital and Power Generation Costs, USAEC Report TID-l2747, H. J. Kaiser Co., W c h 1961.
Kaiser Engineers, Guide to Nuclear Power Cost Evaluation, mAEC Report TID-7025 (Vol. 13), Kaiser Engineers, March 1962.
r
B. W. Kinyon and G. D. Whitman, Steam Generator-Superheater for Molten Salt Power Reactor, Paper No. 61-WA-228, Am. SOC. Mech. Engrs., November 1961.
B. W. Kinyon and F. E. Romie, Two Thermodynamic Systems for Molten Fluoride Reactors, Trans. Am. Inst. Chem. Engrs. Preprint No. 177, Third Nuclear Science and Engineering Conference, March 1958.
W. E. Knabe and G. E. Putnam, Activity of Fission Products of 235U Y
USAEC Report APEX-448, General Electric Atomic Products Division, October 1958.

341
56
57.
58.
59.
60.
61.
62
63
64.
65
66
67
68
69.
J. A. Lane, H. G. MacPherson, and F. Maslan (ed i tors ) , Fluid Fuel Reactors, Addison-Wesley Publishing Company, Reading, Massachusetts, 1958.
H. G. MacPherson, Molten S a l t s for Civil ian Power, USAEC Report ORNL-CF-57-10-41, Oak Ridge National Laboratory, October 1957.
H. G. MacPherson e t a l . , A Preliminary Study of Molten S a l t Power Reactors, USAEC Report CF-57-4-27 (Rev., Del. ), Oak Ridge National Laboratory, April 1957.
H. G. MacPherson e t al. , Molten S a l t Reactor Program Status Report, USAEC Report ORNL-2634, O a k Ridge National Laboratory, November 1958.
H. G. MacPherson e t al . , A Preliminary Study of a Graphite-Moderated Molten S a l t Power Reactor, USAEC Report CF-59-1-26, Oak Ridge National Laboratory, January 1959.
H. G. MacPherson, Optimizing the Molten-Salt Reactor fo r Minimum Doubling Time, p. 335 of Proceedings of the Conference on the Physics of Breeding, USAEC Report ANL-6122, Argonne National Laboratory, October 1959.
H. G. MacPherson, Molten-Salt Breeder Reactors, USAEC Report ORNL-CF- 59-12-64 (Revised), Oak Ridge National Laboratory, December 1959.
H. G. MacFnerson, Molten-Salt Reactors: Report fo r 1960 Ten-Year Plan Evaluation, USAEC Report ORNL-CF-60-6-97, Oak Ridge National Labora- tory, June 1960.
B. Manowitz, Fuel Reprocessing Costs, Nucleonics, 20(2):60, February 1962
W. B. McDonald and C. I. McGlothlan, Remote Maintenance of Molten S a l t Reactors, USAEC Report ORNL-2981, 0% Ridge National Laboratory ( i n preparation September 1962).
R. P. Milford e t al. , Recovering Uranium Submarine Reactor Fuels, Ind. Ehg. Chem., 53:357, May 1961.
J. W. Miller, Thorium Resonance Cross-Sections fo r Thermal Breeder Reactor Study, USAEC Report ORNL-CF-61-1-26, Oak Ridge National Lab- oratory, January 1961.
E. C. Moncrief, Corrosion of the Vo la t i l i t y P i lo t Plant INOR-8 Hyctro- f luorinator and L-Nickel Fluorinator after 21 Nonradioactive Dissolu- t i on Funs, USAEC Report ORNL-TM-186, Oak Ridge National Laboratory, March 1962.
M. S. Moore, MTR Nuclear Physics Group, pezsonal communication t o C. W. Nestor, O a k Ridge National Laboratory, March 1960.

70 t
71
72
73.
74
75.
76
77 9
78.
79
80.
81.
82.
342
J. P. Murray e t al., Economics of Unirradiated Processing Phases of Uranium Fuel Cycles, Proceedings of the Second International Con- ference on the Peaceful Uses of Atomic Energy, Geneva, 1958, Vol. 13, Paper No. Pp439, p. 582, United Nations, New York, 1958.
E. A. Ne hew 233U, 23%, j3'Pu Fission Products, USAEC Report ORNL-2869, Oak Ridge National Laboratory, Mach 1960.
T'nermal and Resonance Absorption Cross Section of the
C. W. Mestor, Multigroup Neutron Cross Sections, USAEC Report ORNL-CF- 61-6-87 (Rev. ), Oak Ridge National Laboratory, June 1961.
Oak Ridge National Laboratory, Chemical Technology Division Unit Opera- t ions Section Monthly Progress Report, USAEC Report ORNL-TM-34, p. 44 (7.0 Vola t i l i ty ) Oak Ridge National Laboratory, June 1961.
Oak Ridge National Laboratory, Reactor Chemistry Division Annual Pro- gress Report fo r Period Ending Jazuary 21, 1951, U " U C Report ORXL- 3127
Oak Ridge National Laboratory, Molten-Salt Reactor Program Quarterly Progress Report for Period Ending October 31, 1957, USAEC Report ORNL-2431-
Oak Ridge Xational Laboratory, Molten-Salt Reactor Program Quarterly Progress Report for Period Ending June 31, 1958, USAEC Report ORNL- 2551.
Oak Ridge National Laboratory, Molten-Salt Reactor Program Quarterly Progress Report for Period Ending October 31, 1958, USAEC Report ORNL-2626 - Oak Ridge National Laboratory, Molten-Salt Reactor Project Quarterly Progress Report for Period Ending January 31, 1959, USAEC Report ORNL-2684.
Oak Ridge National Laboratory, Molten-Salt Reactor Project Quarterly Progress Report fo r Period Ending April 30, 1959, USAEC Report ORNL- 2723
Oak Ridge National Laboratory, Molten-Salt Reactor Program Quarterly Progress Report fo r Period Ending July 31, 1959, USAEC Report ORNL- 2799.
Oak Ridge National Laboratory, Molten-Salt Reactor Program Quarterly Progress Report for Period Ending October 31, 1959, USAEC Report ORNL-2890.
Oak Ridge National Laboratory, Molten-Salt Reactor Program Quarterly Progress Report fo r Periods Ending January 31 and April 30, 1960, USAEC Report O'HTL-2973
c
m

83.
84.
85.
86
87.
88.
89.
90.
91
92
93 *
94.
95.
96.
343
O a k Ridge National Laboratory, Molten-Salt Reactor Program Quarterly Progress Report f o r Period Ending July 31, 1960, USAEC Report ORNL- 3014.
Oak Ridge National Laboratory, Molten-Salt Reactor Program Progress Report for Period from August 1, 1960 t o February 28, 1961, USAEC Report ORNL-3122.
Oak Ridge National Laboratory, Molten-Salt Reactor Program Progress Report f o r Period from March 1 t o August 31, 1961, USAEC Report ORNL- 3215
Oak Ridge National Laboratory, Molten-Salt Reactor Program Semiannual Progress Report f o r Period Ending February 28, 1962, USAEC Report ORNL-3282 - Oak Ridge National Laboratory, Molten-Salt Reactor Program Semiannual Progress Report for Period Ending August 31, 1962, USAEC Report ORNL- 3369
Organization f o r European Economic Cooperation, Nuclear Graphite, OEEC Dragon Project, Proceedings of the Symposium Held a t Bournemouth, G.B. Europ. Nuclear Energy Agency, p. 259 Session I-V, NP-11221, November 1959
R. G communication t o L. G. Alexander, Oak Ridge National Laboratory, December 1959.
Orrison, Union Carbide Nuclear Company (Y-12 Plant) , personal
J. J. Pattenden, Fission Product Poisoning Data, USAEC Report ORNL- 2778, O a k Ridge National Laboratory, October 1959.
W. D. Powers and G. C. Blalock, Enthalpies and Heat Capacities of Sol id and Molten Fluoride Mixtures, USAEC Report ORNL-1956, Oak Ridge National Laboratory, January 1956.
C. C. Randall e t al. , Study of Mercury Binary Cycles f o r Nuclear Power Plants, Report WCAP-1832, Westinghouse Elec t r ic Corp., July 1961.
J. E. Ricci, Guide t o the Phase Diagrams of the Fluoride Systems, USAEC Report ORNL-2396, Oak Ridge National Laboratory, November 1958.
Sargent and Lundy, Engineers, Power Cost Normalization Studies, Civil ian Power Reactor Program - 1959, USAEC Report SL-1674, January 1960.
Sargent and Lundy, Engineers, Capital Cost Evaluation 1000 Mwe Molten S a l t Converter Reactor Power Plants, USAEC Report SL-1954, June 1962.
Sargent and Lundy, Engineers, Capital Investment fo r 1000 Mwe Molten S a l t Converter Reference Design Power Reactor, USAEC Report SL-1994, December 1962.

344
97.
98
99.
lQ0.
101.
102.
103.
105.
106
107.
108.
109.
J. H. Shaffer, W. R. Grimes, and G. M. Watson, Boron P i f l u o r i d e as a Soluble Poison i n Molten S a l t Reactor Fuels, Nuclear Sci. Eng., 12:337, March 1962.
J. W. €3. Simmons, The Effects of I r radiat ion on the Mechanical Pro- per t ies of Graphite, i n Psoceedings of the Third Conference on Carbon, Sections E and F, Pergamon Press, 1959.
I. Spiewak and L. F. Parsly, Ebaluation of External Hold-up of Circu- l a t ing Fuel Thermal Breeders as Related t o Cost and Feasibi l i ty , USAEC Report ORNL-CF-60-5-93, Oak Ridge National Laboratory, May 1960.
P. E. Spivak e t al . , Measurement of E t a for 233U, 235U, and 239Pu with Epithermal Neutrons, J. NUC. Energy, 4:70, January 1957.
R. E. Thoma, Crystall ization Reactions i n the Mixture LiF-BeF2-ThF4 (67.5-17.5-15 mole 4 ) BELT-15, USAEC Report ORNL-CF-59-4-49, Oak Ridge National Laborstory, April 1959.
R. E. Thana (Editor) Phase Diagrams of Nuclear Reactor Materials, USAEC Report ORNL-2548, Oak Ridge National Laboratory, November 1959.
R. E. Thoma and W. R. Grimes, Phase Equilibrium Diagrams fo r Fused Sa l t Systems, USAEC Report ORNL-2295 (Decl. ), Oak Ridge National Laboratory, June 1959.
USAEE, Summary Report: Report WASH-743, October 1957.
W. T. Ward e t al., Rare Earth and Y t t r i u m Fluorides -So lub i l i t y Relations i n Various Molten NaF-ZrF4 and NaF-ZrFb-UF4 Solvents, USAEC Report ORNL-2421, Oak Ridge National Laboratory, January 1958.
AEC Reference Fuel Processing Plant, USAEC
W. T. Ward e t a l . , Solubi l i ty Relations Among Rare-Earth Fluorides i n Selected Molten Fluoride Solvents, USAEC Report ORNL-2749, Oak Ridge National Laboratory, October 1959.
G. M. Watson and R. B. Evans 111, Xenon Diffusion i n Graphite: Effects of Xenon Absorption i n Molten Sa l t Reactors Containing Graphite, USAEC Report ORNL-CF-61-2-59, Oak Ridge National Laboratory, February 1961.
C. F. Weaver e t al . , Phase Equilibria i n Molten Sa l t Breeder Reactor Fuels, 1- The System LiF-BeFz-ThF4, USAEC Report ORNL-2896, Oak Ridge National Laboratory, December 1960.
D. B. Wehmeyer e t al . , Study of a Fused S a l t Breeder Reactor for Power Production, USAEC Report ORNL-CF-53-10-25, O a k Ridge National Labora- tory, Septernber 1953.

i u i P ! I !
345
110. C. H. Wescott, Effective Cross SectionTalues for Well-Moderated Thermal Reactor Spectra, Canadian Report CRRP-787, Chalk River, Ontario AECL-670, August 1, 1958 (Rev. 1958)..
111. N. F. Wikner and S. Jaye, Energy-Dependent and Spectrum-Averaged Thermal Cross Sections for the Heavy Elements and Fission Products for Various Temperatures and C:235U Atom Ratios, USAEC Report GA- 2113, General Atomic Division, General Dynamics Corporation, June 1961
112. H. U. Woelk, Molten Salts in Nuclear Technology, Chemie-Ingenieur- Technik, 32:765, 1960. Stone, Oak Ridge National Laboratory, August 1961.
AEC-TR-4774 by A. R. Saunders and H. H.
19 i

I
- *
1. 2-20.
21. 22. 23 24. 25. 26. 27. 28. 29. 30. 31. 32 33. 34. 35. 36 37. 38. 39. 40. 41. 42. 43. 44. 45. 46. 47 48. 49. 50. 5 1 52 53 54 55 . 56. 57 58 59. 60 61 * 62. 63 * 64 65. 66. 67.
347
In te rna l Distribution
T. D. Anderson L. G. Alexander H. F. Bauman S. E. Beall L. L. Bennett E. S. Be t t i s F. F. Blankenship E. P. Blizard A. L. Boch E. G. Bohlmann C. J. Borkowski R. B. Briggs F. R , Bruce D. 0. Campbell S. Cantor W. L. Carter G. I. Cgthers R. H. Chapman R. S. Carlsmith C. W. Collins
C. W, Craven F. L. Culler S. G. Delene J. H. DeVan R. G. Donnelly D. A. Douglas J. R . Engel W. K. Ergen A. P. Fraas J. H. Frye, Jr. W. R. G a l l E. H. G i f t H. E. Goeller W. R. Grimes A. G. Grindell C. E. Guthrie R. P. Hammond P. N. Haubenreich E. C. Hise H. W. Hoffman D. B. Janney (K-25) W. H. Jo,rdan P. R. Kasten R. J. Ked1 M. T. Kelley T. W. Kerlin J. A. Lane C. E. Larson
W. H. Cook
68. 69. 70 * 7 1 72 73. 74. 75. 76 77. 78 79. 80. 81. 82. 83. 84. 85. 86. 87. 88. 89. 90. 91. 92 93. 94. 95 9
96. 97. 98. 99 100 101. 102. 103. 104. 105. 106. 107.
108-109. 110-111
112-113
114-115. 116-145
146.
C. G. Lawson R. B. Lindauer J. L. Lucius M. I. Lundin R. N. Lyon H. G. Macherson H. C. McCurdy W. B. McDonald H. F. McDuffie R. P. Milford A. J. Miller R. L. Moore J. C . Moyers R. W. Olson H. R. Payne A. M. Perry B. E. Prince R. C. Robertson M. W. Rosenthal H. W. Savage A. W. Savolainen
J. H. Schaffer M. J. Skinner I. Spiewak W. G. Stockdale A. Taboada J. R. Tallackson R. E. Thoma D. B. Trauger J. W . Ullman D. R . Vondy R. Van Winkle G. M. Watson A . M. Weinberg J. H. Westsik G. D. Whitman
Gale Young Biology Library Reactor Division Library MSRP Director 's Office, Room 219, Building 9204-1 ORNL Y-12 Technical Library, Document Reference Section Central Research Library Laboratory Records Department Laboratory Records, ORNL, R . C .
D. Scott
K. J. Y O S t
348
External Distribution
_-. - Lli
147. 148.
149-150 151. 152. 153. 154. 155 - 156
157-158
159. 160.
161 162. 163. 164. 165 166 167 168. 169 170
171-185.
G. Beasley, TVA, EGCR Site, Oak Ridge, Tennessee W. R. Cooper, WA, EGCR Site, Oak Ridge, Tennessee D. F. Cope, AEC, OR0 W. E. Dean, Jr., TVA, Chattanooga, Tennessee Division of Research and Development, AEC, OR0 J. Ebersole, TVA, EGCR Site, Oak Ridge, Tennessee W. F. Mons, TVA, Knoxsrille, Tennessee R. W. Garrison, AEC, Washington, D. C. R. Harris, AEC, OR0 C. A. Hatstat and W. Chittenden, Sargent and Lundy, Chicago, Illinois S. Jaye, General Atomic, San Diego, California R . W. McNamee, Manager, Research Administration, UCC, New York, N. Y. G. P. Palo, TVA, Knoxville, Tennessee R. E. Pahler, AEC, Washington, D. C. P. F. Pasqua, University of Tennessee, Knoxville, Tennessee R. L. Phillipone, Reactor Division, AEC, OR0 H. M. Roth, Division of Research and Development, AEC, OR0 F. P. Self, AEC, Washington, D. C. W. L. Smalley, Research Division, AEC, OR0 J. M. Vallance, AEC, Washington, D. C. M. J. Whitman, AEC, Washington, D. C. J. Wett, AEC, Washington, D. C. Division of Technical Information Extension (DTIE)