Embed Size (px)
Citation preview
O
GLCMA
Bic
M2sl
Rdmt
Cn
Km
Ctnc(faAnor
d
F
A
R
0d
RIGINAL ARTICLES
reater Cortical Gray Matter Density inithium-Treated Patients with Bipolar Disorder
arrie E. Bearden, Paul M. Thompson, Manish Dalwani, Kiralee M. Hayashi, Agatha D. Lee,ark Nicoletti, Michael Trakhtenbroit, David C. Glahn, Paolo Brambilla, Roberto B. Sassi,lan G. Mallinger, Ellen Frank, David J. Kupfer, and Jair C. Soares
ackground: The neurobiological underpinnings of bipolar disorder are not well understood. Previous neuroimaging findings have beennconsistent; however, new methods for three-dimensional (3-D) computational image analysis may better characterize neuroanatomichanges than standard volumetric measures.
ethods: We used high-resolution magnetic resonance imaging and cortical pattern matching methods to map gray matter differences in8 adults with bipolar disorder, 70% of whom were lithium-treated (mean age � 36.1 � 10.5; 13 female subject), and 28 healthy controlubjects (mean age � 35.9 � 8.5; 11 female subjects). Detailed spatial analyses of gray matter density (GMD) were conducted by measuringocal proportions of gray matter at thousands of homologous cortical locations.
esults: Gray matter density was significantly greater in bipolar patients relative to control subjects in diffuse cortical regions. Greatestifferences were found in bilateral cingulate and paralimbic cortices, brain regions critical for attentional, motivational, and emotionalodulation. Secondary region of interest (ROI) analyses indicated significantly greater GMD in the right anterior cingulate among lithium-
reated bipolar patients (n � 20) relative to those not taking lithium (n � 8).
onclusions: These brain maps are consistent with previous voxel-based morphometry reports of greater GMD in portions of the anterior limbic
etwork in bipolar patients and suggest neurotrophic effects of lithium as a possible etiology of these neuroanatomic differences.ey Words: Bipolar disorder, cortical pattern matching, lithium,agnetic resonance imaging, mood disorders, neuroprotection
onventional volumetric magnetic resonance imaging (MRI)studies and postmortem brain studies suggest that at least aproportion of patients with bipolar disorder have reduc-
ions in regional brain volumes, accompanied by reductions ineuronal and glial density, particularly in the ventral frontalortex (Drevets 2000; Rajkowska 2000) and anterior cingulateLochhead et al. 2004; Lyoo et al. 2004). However, previousindings have been inconsistent, with both volumetric increasesnd decreases reported (see Brambilla et al. 2005 for a review).s such, it is not yet known whether these changes reflecteurodevelopmental anomalies, part of the disease progression,r functional sequelae of biochemical changes that accompanyepeated illness episodes.
A recent meta-analysis of regional morphometry in bipolarisorder found no significant differences in total brain volume or
rom the Department of Psychiatry and Biobehavioral Sciences (CEB), SemelInstitute for Neuroscience and Human Behavior; and Laboratory ofNeuroImaging (PMT, KMH, ADL), Department of Neurology, Universityof California, Los Angeles, California; Departments of Psychiatry (MD,MN, MT, DCG, JCS) and Radiology (DCG, JCS), University of Texas HealthScience Center at San Antonio, San Antonio, Texas; Department of Pa-thology and Experimental & Clinical Medicine (PB), University of Udine,Udine, Italy & Scientific Institute, IRCCS E Medea, Udine, Italy; Depart-ment of Psychiatry (RBS), University of Sao Paulo School of Medicine, SaoPaulo, Brazil; Department of Psychiatry (AGM, EF, DJK), University ofPittsburgh School of Medicine, Pittsburgh, Pennsylvania; and Audie L.Murphy Division (JCS), South Texas Veterans Health Care System, SanAntonio, Texas.
ddress reprint requests to Carrie E. Bearden, Ph.D., Dept. of Psychiatry andBiobehavioral Sciences, University of California, Los Angeles, 300 Build-ing Medical Plaza, Suite 2265, Los Angeles, CA 90095; E-mail:[email protected].
eceived February 2, 2006; revised July 11, 2006; accepted October 4, 2006.
006-3223/07/$32.00oi:10.1016/j.biopsych.2006.10.027
whole brain gray or white matter between bipolar and compar-ison subjects or in the volume of individual cortical, subcortical,or limbic structures (McDonald et al. 2004). However, theauthors noted significant heterogeneity across studies for severalbrain structures, including the amygdala, left subgenual prefron-tal cortex, and thalamus. Psychotropic medication usage may bea potentially important contributor to the observed heterogene-ity.
In particular, lithium has been the reference standard medicationtreatment for bipolar disorder for over 50 years (Brambilla et al.2001). While lithium’s mechanism of therapeutic action is currentlyunknown, recent human studies offer evidence that pharmacolog-ically induced increases in cortical gray matter may occur withchronic lithium use in patients with bipolar disorder. Notably,Moore et al. (2000b) observed that lithium significantly increasedtotal gray matter volume in bipolar patients by 3%, on average, after4 weeks. More recently, Sassi et al. (2002) found larger total graymatter volume in lithium-treated bipolar patients, as compared withboth untreated patients and control subjects. In a partially overlap-ping sample, decreased left anterior cingulate volumes were ob-served in untreated bipolar patients, whereas lithium-treated pa-tients were not significantly different from healthy control subjects(Sassi et al. 2004). In addition, magnetic resonance spectroscopy(MRS) has revealed increases in cortical N-acetyl-aspartate (NAA), aputative marker of neuronal integrity, in both bipolar patients andnormal control subjects following lithium administration (Moore etal. 2000a; Silverstone et al. 2003).
While these studies suggest potential neuroprotective effectsof this agent, the few in vivo neuroimaging studies published todate have used relatively crude or region-specific volumetricmeasures. With advances in computational image analysis, dif-ferences in cortical anatomy can be examined at high spatialresolution. Here, we apply these algorithms to map gray matterabnormalities over the entire cortical surface in bipolar patientsand to determine whether, if present, these changes are influ-
enced by lithium treatment.BIOL PSYCHIATRY 2007;62:7–16© 2007 Society of Biological Psychiatry
M
P
BcscoioocI(atlBD1teErd2
apdmfdl
T
A%%ER
%%HBDANC
%
8 BIOL PSYCHIATRY 2007;62:7–16 C.E. Bearden et al.
w
ethods and Materials
articipantsThis study was approved by the University of Pittsburgh
iomedical Institutional Review Board, and written informedonsent was obtained from all subjects prior to participation. Theample included 28 patients with bipolar disorder and 28 healthyomparison subjects matched for age, sex, handedness, and levelf education; a subset of this sample was previously reported onn Sassi et al. (2004). Patients were recruited through theutpatient facilities of the University of Pittsburgh Medical Centerr through advertisements in the local media. The inclusionriteria were a DSM-IV diagnosis of bipolar disorder, subtype I orI, as determined by the Structured Clinical Interview for DSM-IVSCID-IV) (First et al. 1998), in any mood state, age between 18nd 65 years, and no lithium treatment for at least 1 month at theime of the MRI scan (for the untreated group) or receivingithium for at least 2 weeks for the lithium-treated group. Theech-Rafaelsen Mania Scale (Bech et al. 1979) and the Hamiltonepression Rating Scale (25-item version) (HDRS) (Hamilton960) were used to rate clinical symptoms and were adminis-ered within 1 week of the scan. All subjects had normal physicalxamination results and no history of neurologic problems.xclusion criteria were any comorbid psychiatric disorder, cur-ent medical problems, and/or alcohol or substance abuse orependence within 6 months preceding the study (see Sassi et al.004 for further details).
Healthy comparison subjects were recruited through localdvertisements, according to the same exclusion criteria used foratients. Healthy control subjects had no DSM-IV Axis I disor-ers, as determined by the SCID-IV (First et al. 1998); no currentedical problems; and no history of psychiatric disorders among
irst-degree relatives. The ethnic and racial makeup of the groupsid not differ from each other, and there were no differences inevel of education (Table 1).
able 1. Sample Demographics
Lithium-Positive Patients withBipolar Disorder (n � 20)
LithiB
ge (Mean � SD) 35.1 � 10.8Female (n) 45% (9)Right Handed (n) 100% (20)
ducation Level 15.0 � 2.7ace
% Caucasian (n) 100% (20)% Asian (n) 0% African American (n) 0% Biracial (n) 0Bipolar I Disorder 90% (18)Bipolar II Disorder 10% (2)
DRS 6.9 � 8.6ech-Rafaelsen Mania Scale .67 � 1.7uration of Illness (Years) 15.1 � 8.2ge at Onset 18.6 � 6.1umber of Episodes 20.5 � 25.9urrent Mood StateDepressed 30% (6)Hypomanic 0% (0)Euthymic 70% (14)with Previous (Lifetime)
Antipsychotic Use (n) 25% (5)
Mean � standard deviation, age, and education levels are expressed in
HDRS, Hamilton Depression Rating Scale.ww.sobp.org/journal
Bipolar patients were outpatients at the time of assessment,with treatment histories of varying lengths (mean age of onset of20 � 6.9 years). At the time of MRI scan, 36% of patients (n � 10)were in a depressed state, 61% (n � 17) were euthymic, and 3%(n � 1) was hypomanic. Six patients (21%) had bipolar IIdisorder, whereas 22 (79%) had bipolar I disorder. Bipolar Idisorder patients did not differ from bipolar II disorder patients interms of length of illness [F (1,26) � 2.84, p � .11], age at onset[F (1,26) � .47, p � .50], depression or mania severity scores[HDRS: F (1,26) � 2.56, p � .12; Bech-Rafaelsen Mania Scale:F (1,26) � .43, p � .52], or mood state at scan time [�2(2) � .019,p � .89]. All analyses were run with and without the six bipolarII disorder subjects. Although p values changed slightly, this didnot affect whether each result was statistically significant, so wepresent results for the full sample.
The majority (n � 20, 71%) were taking lithium at the time ofevaluation (Table 1) for a mean duration of 128 weeks (�230weeks; range 3–1000 weeks), at a mean dosage of 1158.8 mg/day(�362.1; range 675–2100 mg/day). In addition to lithium, twopatients were also taking tranylcypromine (10 to 20 mg), one wastaking levothyroxine, and one was taking citalopram (60 mg) pluslevothyroxine. The other patients in the lithium-treated group wereall on lithium monotherapy. Of the eight patients that were nottaking lithium, one was taking citalopram (20 mg), and the otherswere on no medication. Further information regarding clinical andmedication history for each patient is provided in Supplement 1.
MRI ScanningMagnetic resonance imaging scans were acquired with a 1.5T GE
Signa Imaging System (GE Medical Systems, Waukesha, Wisconsin)running Signa version 5.4.3 software. The scanning protocol wasidentical to that used in Sassi et al. (2004). All magnetic resonance(MR) images were processed with a series of manual and automatedprocedures developed at the UCLA Laboratory of NeuroImaging
egative Patients withr Disorder (n � 8)
Healthy ComparisonSubjects (n � 28)
Between-GroupDifferences
38.6 � 10.0 35.9 � 8.5 F � .40, p � .674 (50%) 39% (11) �2 � .35, p � .84
100% (8) 100% (28) �2 � .00, p � 1.015.5 � 3.3 15.4 � 2.7 F � .20, p � .82
88% (7) 89% (25) �2 � 4.1, p � .250 4% (1)0 7% (2)4% (1) 0
50% (4) �2 � 5.43, p � .0450% (4) NA
15.3 � 11.8 NA F � 3.76, p � .071.63 � 2.0 NA F � 1.31, p � .2715.1 � 8.3 NA F � .00, p � .9923.5 � 7.8 NA F � 3.03, p � .09416.3 � 17.5 NA F � .16, p � .70
�2 � 4.13, p � .1350% (4) NA12% (1)38% (3)
12% (1) NA �2 � .89, p � .64
.
um-Nipola
years
ta
I
t2ddNtdAemdt(gtfsac1
A
2ItrtdIchtaLpara(hittta(cboTaac.
C
a
C.E. Bearden et al. BIOL PSYCHIATRY 2007;62:7–16 9
hat are described in detail in other reports (Thompson et al. 2004)nd summarized below.
mage ProcessingFirst, each image volume was resliced into a standard orien-
ation by trained image analysts (M.D., M.N., M.T.) who “tagged”0 standardized anatomical landmarks in each subject’s imageataset corresponding to the same 20 anatomical landmarksefined on the ICBM-53 average brain (Thompson et al. 2003).ext, brain image volumes were more carefully spatially regis-
ered to each other by defining 80 standardized, manuallyefined anatomical landmarks on each brain (Sowell et al. 2001).
least-squares, rigid-body transformation spatially matchedach individual to the average of all the control subjects. In thisanner, all individual brains were matched in space, but globalifferences in brain size and shape remained intact. Automatedissue classification used a partial volume correction methodShattuck et al. 2001) to classify voxels as most representative ofray matter, white matter, or cerebrospinal fluid (CSF). Nonbrainissue (i.e., scalp, orbits) was removed from the spatially trans-ormed, tissue-segmented images. Then, each individual corticalurface was extracted and three-dimensionally rendered usingutomated software (MacDonald et al. 2000). Each resultingortical surface was represented as a high-resolution mesh of31,072 surface triangles spanning 65,536 surface points.
natomical AnalysisCortical pattern matching methods (Thompson et al. 2003,
004) were used to localize disease effects on cortical anatomy.mage analysts (M.D., M.N., M.T.), blind to all subject informa-ion, traced each of 30 sulci in each hemisphere on the surfaceendering of each subject’s brain (13 on the medial surface, 17 onhe lateral surface), employing previously validated anatomicelineation protocols (Sowell et al. 2003; Thompson et al. 2003).n addition to contouring the major sulci, six midline landmarkurves bordering the longitudinal fissure were outlined in eachemisphere to establish hemispheric gyral limits. Spatially regis-ered image volumes in coronal, axial, and sagittal planes werevailable simultaneously to help disambiguate brain anatomy.andmarks were defined according to a detailed anatomicalrotocol (Sowell et al. 2001) based on the Ono et al. (1990) sulcaltlas. These criteria, along with methods for assessing interratereliability, have been described previously (Sowell et al. 2001)nd the written anatomical protocols are available via the Internethttp://www.loni.ucla.edu/�khayashi/Public/medial_surface/ andttp://www.loni.ucla.edu/�esowell/new_sulcvar.html). Briefly,nterrater variability of manual outlining was measured as thehree-dimensional (3-D) root mean square difference in millime-ers between 100 equidistant points from each sulcal landmarkraced in six test brains by each rater, relative to a gold standardrrived at by a consensus of raters, as previously reportedSowell et al. 2003). Interrater reliability was determined byomparing the three-dimensional root mean square distanceetween equidistant surface points from sulcal landmarks fromne test brain traced six times by each rater (M.D., M.N., M.T.).hree-dimensional root mean square disparities were � 2 mm,nd on average � 1 mm, between points for all landmarks withinnd between raters. This equates to interrater reliability coeffi-ient (intraclass correlation coefficient [ICC]) values ranging from95 to .975.
ortical Gray Matter MapsPoints on the cortical surfaces were calculated using the
veraged sulcal contours as anchors to drive into correspon-
dence the 3-D cortical surface mesh models from each subject(Thompson et al. 2003). Because deformation maps (acquiredduring matching of the cortical surfaces) associate correspondinganatomical features of the cortex across patients and controlsubjects based on sulcal contours drawn in every individual, alocal measurement termed gray matter density (GMD) can becalculated at every point over the surface of the brain for everypatient and control subject and averaged across correspondingregions of cortex (Ashburner and Friston 2000; Thompson et al.2003). Briefly, a sphere with a radius of 15 mm centered at everycortical surface point was made and referenced to the samespatial location in the gray matter maps for every participantderived earlier in the tissue classification. The proportion ofsegmented grey matter voxels relative to the total number ofvoxels in this sphere is calculated at every point and stored as amap of proportional gray matter—with possible values rangingfrom .0 to 1.0—for every patient and control subject. Theproportion of gray matter in each sphere at every point in everyparticipant indicates, in part, local cortical thickness that variesover different regions of the brain. Given the large anatomicvariability in some cortical regions, high-dimensional elasticmatching of cortical patterns (Thompson et al. 2004) was used toassociate GMD measures from homologous cortical regionsacross subjects. One advantage of cortical matching is that itlocalizes deficits relative to gyral landmarks; it also averages datafrom corresponding gyri, which would be impossible if datawere only linearly mapped into stereotaxic space.
Mapping Gray Matter DifferencesStatistical maps were generated indicating group differences
in local GMD. To do this, at each cortical point, a multipleregression was run to assess whether the quantity of gray matterat that point depended on group membership. The p-valuedescribing the significance of this linkage was plotted at eachcortical point using a color code to produce a statistical map(e.g., Figure 2). Permutation methods (Bullmore et al. 1999;Thompson et al. 2003) assessed the significance of the statis-tical maps and corrected for multiple comparisons. In eachcase, the covariate (group membership) was permuted1,000,000 times on a Reality Monster supercomputer (SiliconGraphics, Inc, Mountain View, California) with 32 internalR10000 processors, and a null distribution was developed forthe area of the average cortex with group difference statisticsabove a fixed threshold in the significance maps. An algorithmwas then used to determine the significance probability for theoverall difference patterns in each map (Thompson et al.2003). In addition, based on our a priori hypotheses regardingspecific brain regions that might be affected in bipolar disor-der patients, we conducted permutation tests in two specificregions of interest (ROIs), the anterior cingulate gyrus andfrontal lobe, considering only effects within that ROI whencompiling a reference distribution from the randomized data.The anterior cingulate ROI consisted of the entire anteriorcingulate gyrus and was defined with boundaries encompass-ing the cingulate sulcus (anterior, superior, and inferiorboundaries); the paracentral sulcus (posterior boundary); andthe pericallosal sulcus (inferior and posterior boundaries),while the frontal lobe ROI consisted of all portions of thefrontal cortex anterior to the genu of the corpus callosum.These ROIs were traced by a single rater blind to diagnosis(K.M.H.) who had established excellent reliability (�.98)relative to a gold standard arrived at by a consensus of raters.
Anatomic criteria for these ROIs are defined in detail inwww.sobp.org/journal
pttwcb
R
O
avcc.s4wrmp
M
wmapggspfpra1
mbtcIrNw
E
(efpiardadiss
10 BIOL PSYCHIATRY 2007;62:7–16 C.E. Bearden et al.
w
revious publications (Ballmaier et al. 2004). The total supra-hreshold volume, within the ROI, is assessed in the permu-ation test that corrects for multiple comparisons at all voxelsithin the ROI. This procedure is similar to the small-volume
orrection conducted in statistical parametric mapping (Ash-urner and Friston 2000).
esults
verall Volumetric DifferencesTo provide context for the cortical gray matter maps, we first
nalyzed overall differences in total gray and white matterolume in patients with bipolar disorder, as compared withontrol subjects. The bipolar group overall did not differ fromomparison subjects in total brain volume [F (1,54) � .069, p �79] or total white matter volume [F (1,54) � .28, p � .60] but hadignificantly larger overall gray matter volume by 6.6% [F (1,54) �.01, p � .05]. Left and right hemisphere gray matter volumesere significantly greater by 7.6% (p � .05) and 6.5% (p � .01),
espectively, but there were no differences in hemispheric whiteatter volumes (left: 1% smaller, p � .72, ns; right: 1.9% smaller,� .60, ns).
apping Cortical Gray Matter DifferencesIn bipolar patients, highly significant gray matter enlargement
as observed in a broad anatomical region encompassing theedial frontal and parietal cortices and portions of the temporal
nd occipital cortex (left hemisphere: p � .025, right hemisphere:� .0075, corrected). On the lateral brain surface, GMD was
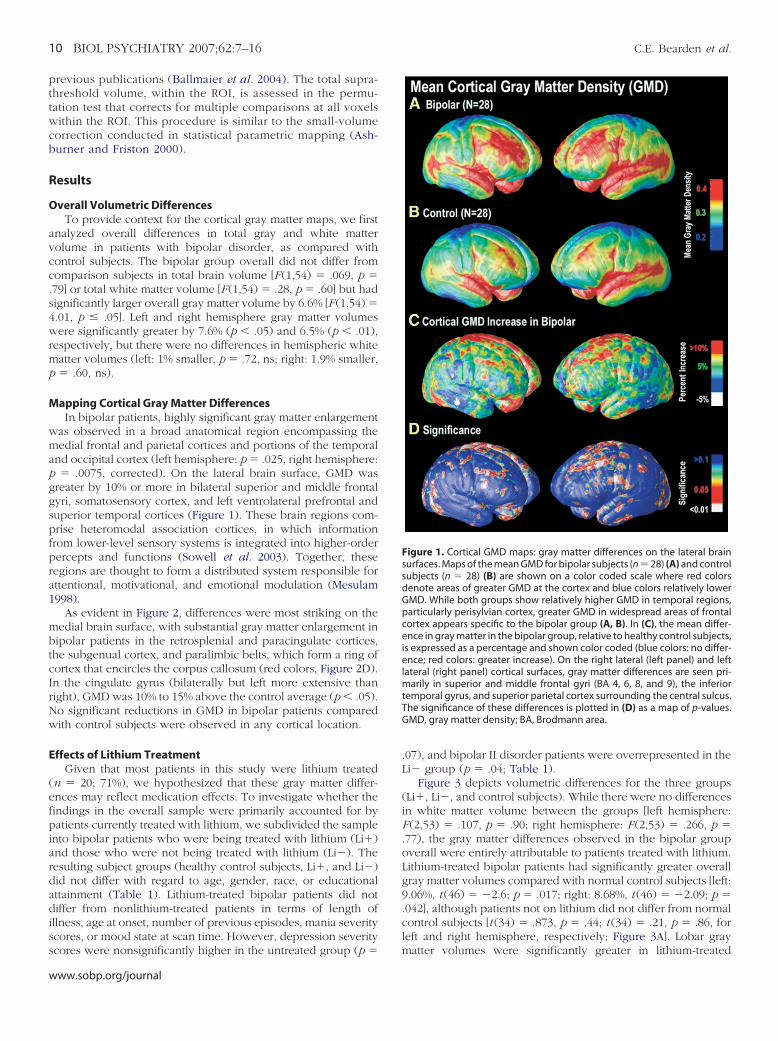
reater by 10% or more in bilateral superior and middle frontalyri, somatosensory cortex, and left ventrolateral prefrontal anduperior temporal cortices (Figure 1). These brain regions com-rise heteromodal association cortices, in which informationrom lower-level sensory systems is integrated into higher-orderercepts and functions (Sowell et al. 2003). Together, theseegions are thought to form a distributed system responsible forttentional, motivational, and emotional modulation (Mesulam998).
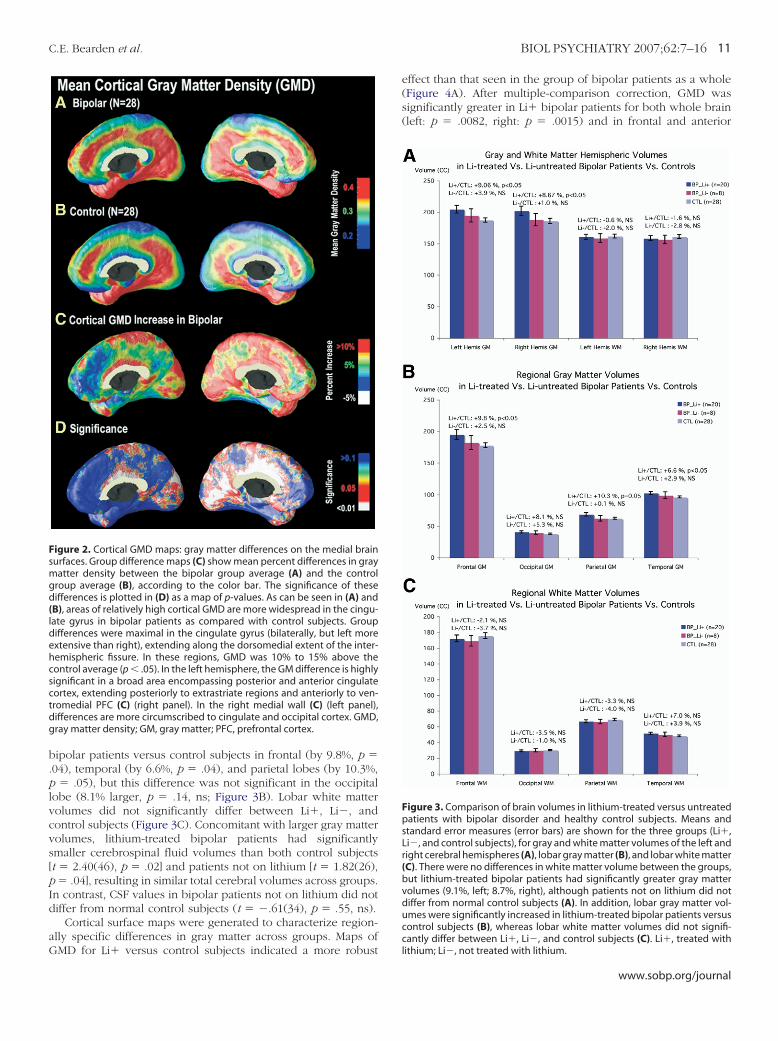
As evident in Figure 2, differences were most striking on theedial brain surface, with substantial gray matter enlargement inipolar patients in the retrosplenial and paracingulate cortices,he subgenual cortex, and paralimbic belts, which form a ring ofortex that encircles the corpus callosum (red colors, Figure 2D).n the cingulate gyrus (bilaterally but left more extensive thanight), GMD was 10% to 15% above the control average (p � .05).o significant reductions in GMD in bipolar patients comparedith control subjects were observed in any cortical location.
ffects of Lithium TreatmentGiven that most patients in this study were lithium treated
n � 20; 71%), we hypothesized that these gray matter differ-nces may reflect medication effects. To investigate whether theindings in the overall sample were primarily accounted for byatients currently treated with lithium, we subdivided the sample
nto bipolar patients who were being treated with lithium (Li�)nd those who were not being treated with lithium (Li�). Theesulting subject groups (healthy control subjects, Li�, and Li�)id not differ with regard to age, gender, race, or educationalttainment (Table 1). Lithium-treated bipolar patients did notiffer from nonlithium-treated patients in terms of length ofllness, age at onset, number of previous episodes, mania severitycores, or mood state at scan time. However, depression severity
cores were nonsignificantly higher in the untreated group (p �ww.sobp.org/journal
.07), and bipolar II disorder patients were overrepresented in theLi� group (p � .04; Table 1).
Figure 3 depicts volumetric differences for the three groups(Li�, Li�, and control subjects). While there were no differencesin white matter volume between the groups [left hemisphere:F (2,53) � .107, p � .90; right hemisphere: F (2,53) � .266, p �.77), the gray matter differences observed in the bipolar groupoverall were entirely attributable to patients treated with lithium.Lithium-treated bipolar patients had significantly greater overallgray matter volumes compared with normal control subjects [left:9.06%, t (46) � �2.6; p � .017; right: 8.68%, t (46) � �2.09; p �.042], although patients not on lithium did not differ from normalcontrol subjects [t (34) � .873, p � .44; t (34) � .21, p � .86, forleft and right hemisphere, respectively; Figure 3A]. Lobar gray
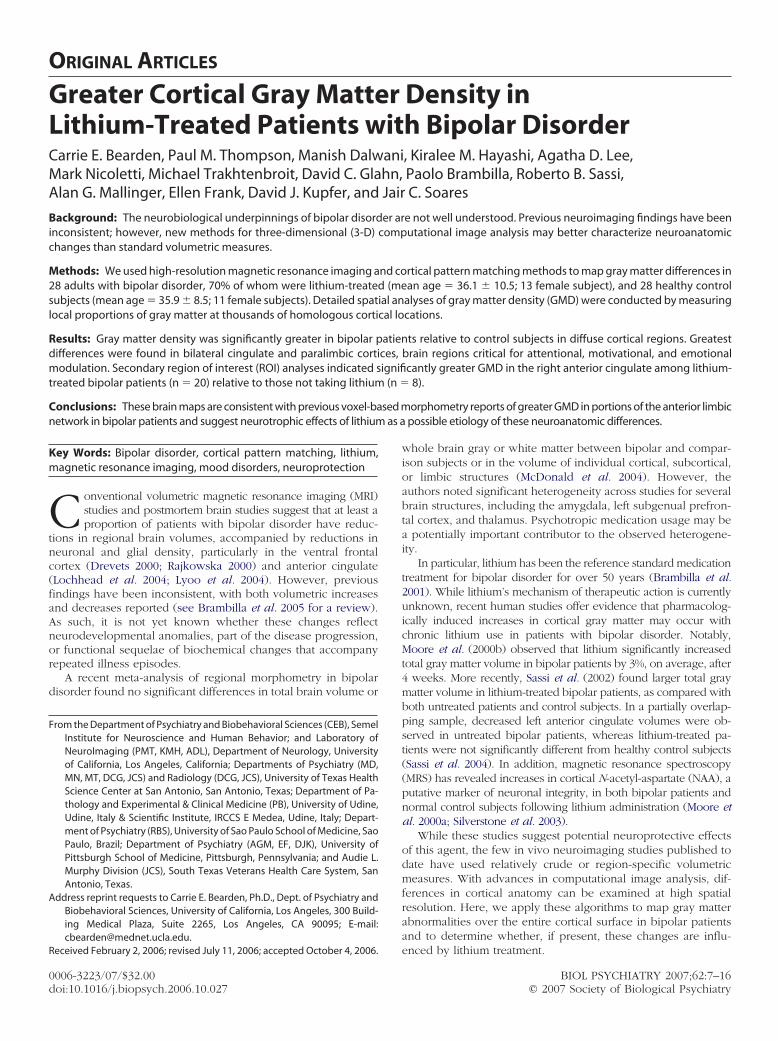
Figure 1. Cortical GMD maps: gray matter differences on the lateral brainsurfaces. Maps of the mean GMD for bipolar subjects (n � 28) (A) and controlsubjects (n � 28) (B) are shown on a color coded scale where red colorsdenote areas of greater GMD at the cortex and blue colors relatively lowerGMD. While both groups show relatively higher GMD in temporal regions,particularly perisylvian cortex, greater GMD in widespread areas of frontalcortex appears specific to the bipolar group (A, B). In (C), the mean differ-ence in gray matter in the bipolar group, relative to healthy control subjects,is expressed as a percentage and shown color coded (blue colors: no differ-ence; red colors: greater increase). On the right lateral (left panel) and leftlateral (right panel) cortical surfaces, gray matter differences are seen pri-marily in superior and middle frontal gyri (BA 4, 6, 8, and 9), the inferiortemporal gyrus, and superior parietal cortex surrounding the central sulcus.The significance of these differences is plotted in (D) as a map of p-values.GMD, gray matter density; BA, Brodmann area.
matter volumes were significantly greater in lithium-treated
b.plvcvs[pId
aG
Fsmgd(ldehcsctdg
C.E. Bearden et al. BIOL PSYCHIATRY 2007;62:7–16 11
ipolar patients versus control subjects in frontal (by 9.8%, p �04), temporal (by 6.6%, p � .04), and parietal lobes (by 10.3%,
� .05), but this difference was not significant in the occipitalobe (8.1% larger, p � .14, ns; Figure 3B). Lobar white matterolumes did not significantly differ between Li�, Li�, andontrol subjects (Figure 3C). Concomitant with larger gray matterolumes, lithium-treated bipolar patients had significantlymaller cerebrospinal fluid volumes than both control subjectst � 2.40(46), p � .02] and patients not on lithium [t � 1.82(26),� .04], resulting in similar total cerebral volumes across groups.
n contrast, CSF values in bipolar patients not on lithium did notiffer from normal control subjects (t � �.61(34), p � .55, ns).
Cortical surface maps were generated to characterize region-lly specific differences in gray matter across groups. Maps of
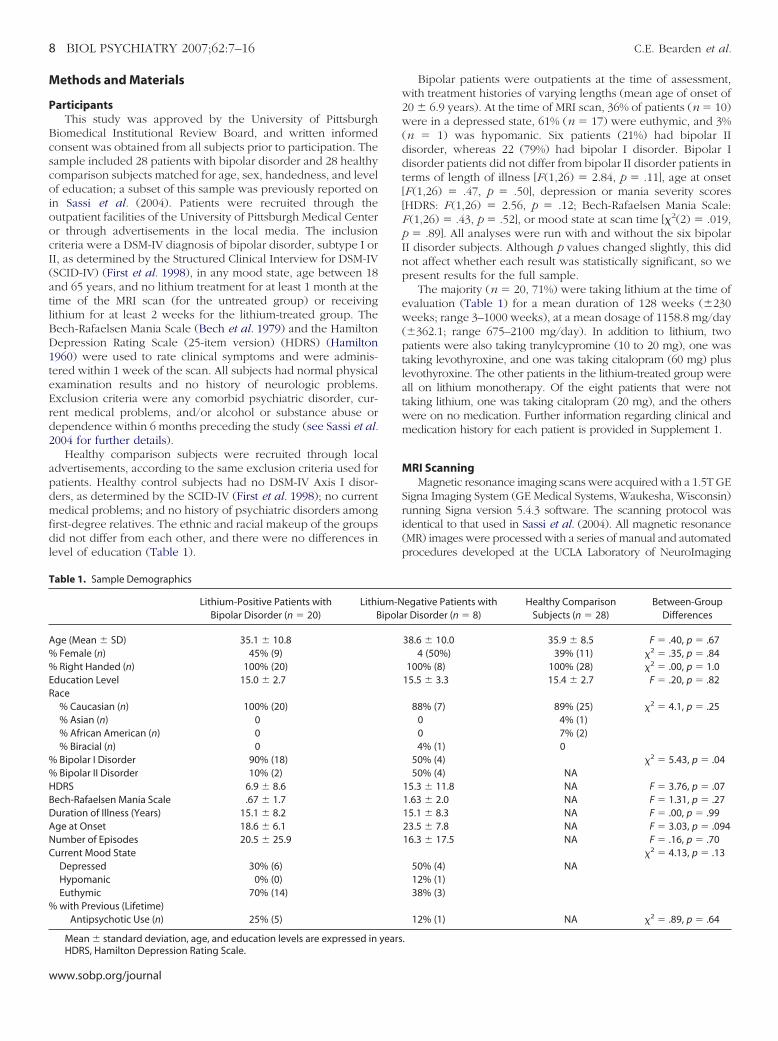
igure 2. Cortical GMD maps: gray matter differences on the medial brainurfaces. Group difference maps (C) show mean percent differences in gray
atter density between the bipolar group average (A) and the controlroup average (B), according to the color bar. The significance of theseifferences is plotted in (D) as a map of p-values. As can be seen in (A) and
B), areas of relatively high cortical GMD are more widespread in the cingu-ate gyrus in bipolar patients as compared with control subjects. Groupifferences were maximal in the cingulate gyrus (bilaterally, but left morextensive than right), extending along the dorsomedial extent of the inter-emispheric fissure. In these regions, GMD was 10% to 15% above theontrol average (p � .05). In the left hemisphere, the GM difference is highlyignificant in a broad area encompassing posterior and anterior cingulateortex, extending posteriorly to extrastriate regions and anteriorly to ven-romedial PFC (C) (right panel). In the right medial wall (C) (left panel),ifferences are more circumscribed to cingulate and occipital cortex. GMD,ray matter density; GM, gray matter; PFC, prefrontal cortex.
MD for Li� versus control subjects indicated a more robust
effect than that seen in the group of bipolar patients as a whole(Figure 4A). After multiple-comparison correction, GMD wassignificantly greater in Li� bipolar patients for both whole brain(left: p � .0082, right: p � .0015) and in frontal and anterior
Figure 3. Comparison of brain volumes in lithium-treated versus untreatedpatients with bipolar disorder and healthy control subjects. Means andstandard error measures (error bars) are shown for the three groups (Li�,Li�, and control subjects), for gray and white matter volumes of the left andright cerebral hemispheres (A), lobar gray matter (B), and lobar white matter(C). There were no differences in white matter volume between the groups,but lithium-treated bipolar patients had significantly greater gray mattervolumes (9.1%, left; 8.7%, right), although patients not on lithium did notdiffer from normal control subjects (A). In addition, lobar gray matter vol-umes were significantly increased in lithium-treated bipolar patients versuscontrol subjects (B), whereas lobar white matter volumes did not signifi-cantly differ between Li�, Li�, and control subjects (C). Li�, treated with
lithium; Li�, not treated with lithium.www.sobp.org/journal
cmalclmt
FscelgpapfB
T
M
G
G
G
12 BIOL PSYCHIATRY 2007;62:7–16 C.E. Bearden et al.
w
ingulate ROIs (Table 2). Gray matter differences were mostarked in the superior aspects of primary motor cortex bilater-
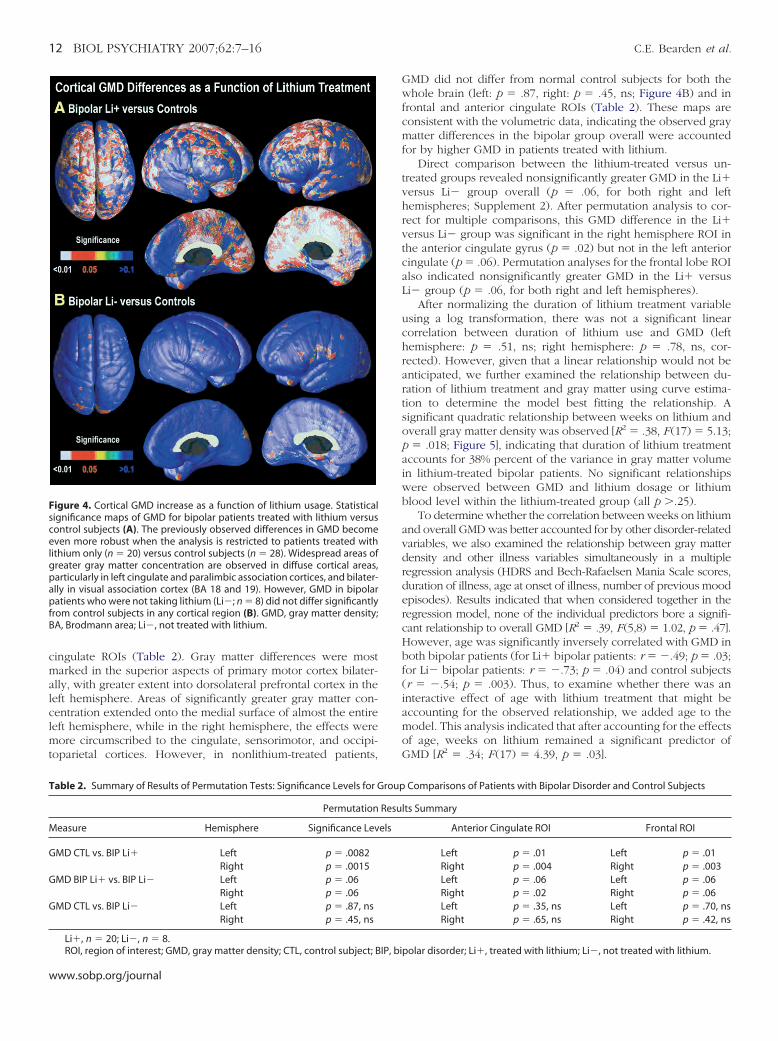
lly, with greater extent into dorsolateral prefrontal cortex in theeft hemisphere. Areas of significantly greater gray matter con-entration extended onto the medial surface of almost the entireeft hemisphere, while in the right hemisphere, the effects wereore circumscribed to the cingulate, sensorimotor, and occipi-
oparietal cortices. However, in nonlithium-treated patients,
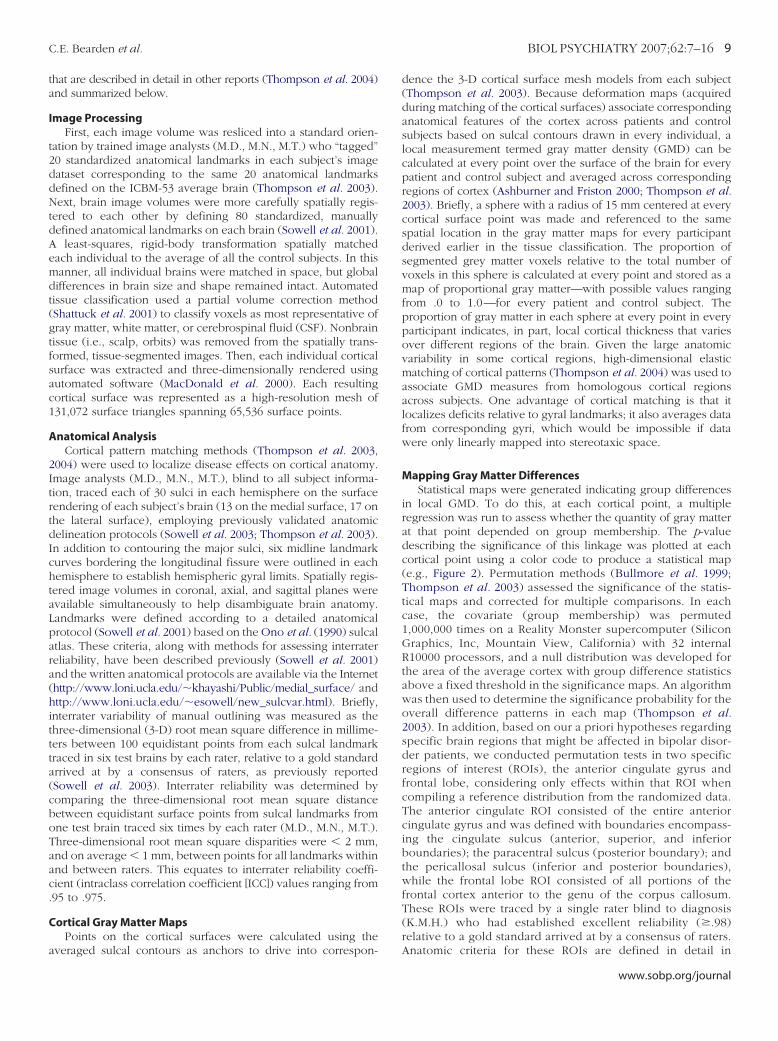
igure 4. Cortical GMD increase as a function of lithium usage. Statisticalignificance maps of GMD for bipolar patients treated with lithium versusontrol subjects (A). The previously observed differences in GMD becomeven more robust when the analysis is restricted to patients treated with
ithium only (n � 20) versus control subjects (n � 28). Widespread areas ofreater gray matter concentration are observed in diffuse cortical areas,articularly in left cingulate and paralimbic association cortices, and bilater-lly in visual association cortex (BA 18 and 19). However, GMD in bipolaratients who were not taking lithium (Li�; n � 8) did not differ significantly
rom control subjects in any cortical region (B). GMD, gray matter density;A, Brodmann area; Li�, not treated with lithium.
able 2. Summary of Results of Permutation Tests: Significance Levels for G
Permutation
easure Hemisphere Significance Lev
MD CTL vs. BIP Li� Left p � .0082Right p � .0015
MD BIP Li� vs. BIP Li� Left p � .06Right p � .06
MD CTL vs. BIP Li� Left p � .87, nsRight p � .45, ns
Li�, n � 20; Li�, n � 8.
ROI, region of interest; GMD, gray matter density; CTL, control subject; BIP, biww.sobp.org/journal
GMD did not differ from normal control subjects for both thewhole brain (left: p � .87, right: p � .45, ns; Figure 4B) and infrontal and anterior cingulate ROIs (Table 2). These maps areconsistent with the volumetric data, indicating the observed graymatter differences in the bipolar group overall were accountedfor by higher GMD in patients treated with lithium.
Direct comparison between the lithium-treated versus un-treated groups revealed nonsignificantly greater GMD in the Li�versus Li� group overall (p � .06, for both right and lefthemispheres; Supplement 2). After permutation analysis to cor-rect for multiple comparisons, this GMD difference in the Li�versus Li� group was significant in the right hemisphere ROI inthe anterior cingulate gyrus (p � .02) but not in the left anteriorcingulate (p � .06). Permutation analyses for the frontal lobe ROIalso indicated nonsignificantly greater GMD in the Li� versusLi� group (p � .06, for both right and left hemispheres).
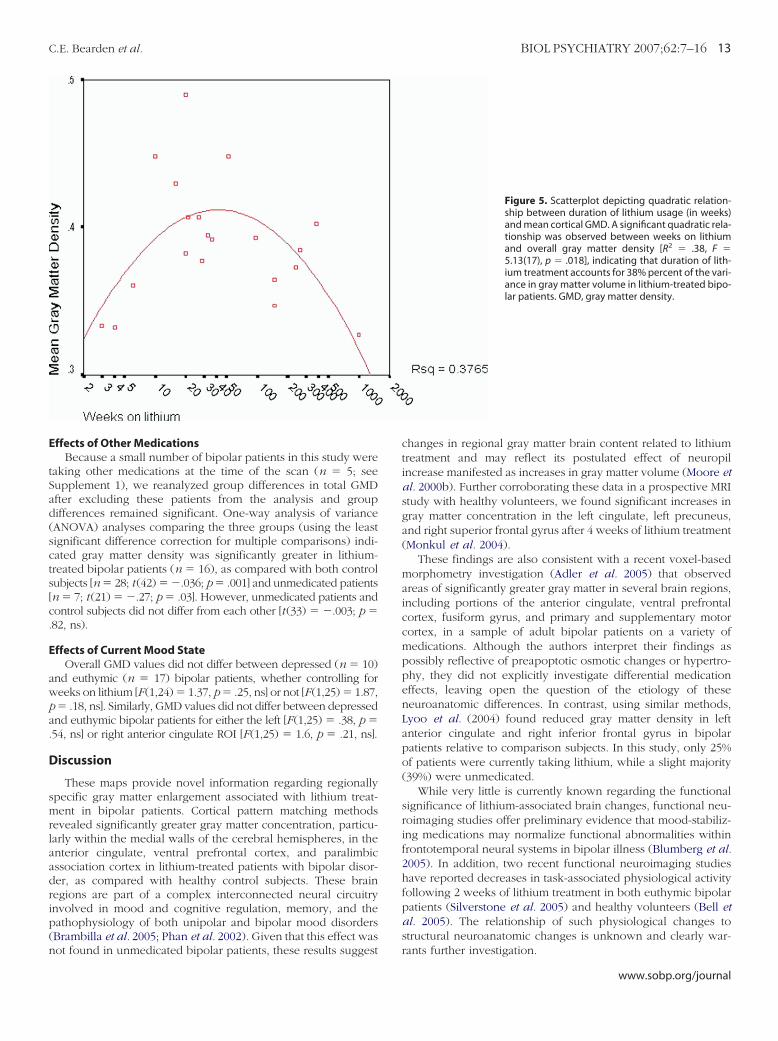
After normalizing the duration of lithium treatment variableusing a log transformation, there was not a significant linearcorrelation between duration of lithium use and GMD (lefthemisphere: p � .51, ns; right hemisphere: p � .78, ns, cor-rected). However, given that a linear relationship would not beanticipated, we further examined the relationship between du-ration of lithium treatment and gray matter using curve estima-tion to determine the model best fitting the relationship. Asignificant quadratic relationship between weeks on lithium andoverall gray matter density was observed [R2 � .38, F (17) � 5.13;p � .018; Figure 5], indicating that duration of lithium treatmentaccounts for 38% percent of the variance in gray matter volumein lithium-treated bipolar patients. No significant relationshipswere observed between GMD and lithium dosage or lithiumblood level within the lithium-treated group (all p �.25).
To determine whether the correlation between weeks on lithiumand overall GMD was better accounted for by other disorder-relatedvariables, we also examined the relationship between gray matterdensity and other illness variables simultaneously in a multipleregression analysis (HDRS and Bech-Rafaelsen Mania Scale scores,duration of illness, age at onset of illness, number of previous moodepisodes). Results indicated that when considered together in theregression model, none of the individual predictors bore a signifi-cant relationship to overall GMD [R2 � .39, F(5,8) � 1.02, p � .47].However, age was significantly inversely correlated with GMD inboth bipolar patients (for Li� bipolar patients: r � �.49; p � .03;for Li� bipolar patients: r � �.73; p � .04) and control subjects(r � �.54; p � .003). Thus, to examine whether there was aninteractive effect of age with lithium treatment that might beaccounting for the observed relationship, we added age to themodel. This analysis indicated that after accounting for the effectsof age, weeks on lithium remained a significant predictor ofGMD [R2 � .34; F (17) � 4.39, p � .03].
Comparisons of Patients with Bipolar Disorder and Control Subjects
lts Summary
Anterior Cingulate ROI Frontal ROI
Left p � .01 Left p � .01Right p � .004 Right p � .003Left p � .06 Left p � .06Right p � .02 Right p � .06Left p � .35, ns Left p � .70, nsRight p � .65, ns Right p � .42, ns
roup
Resu
els
polar disorder; Li�, treated with lithium; Li�, not treated with lithium.
E
tSad(scts[c.
E
awpa.
D
smrlaadrip(n
C.E. Bearden et al. BIOL PSYCHIATRY 2007;62:7–16 13
ffects of Other MedicationsBecause a small number of bipolar patients in this study were
aking other medications at the time of the scan (n � 5; seeupplement 1), we reanalyzed group differences in total GMDfter excluding these patients from the analysis and groupifferences remained significant. One-way analysis of varianceANOVA) analyses comparing the three groups (using the leastignificant difference correction for multiple comparisons) indi-ated gray matter density was significantly greater in lithium-reated bipolar patients (n � 16), as compared with both controlubjects [n � 28; t (42) � �.036; p � .001] and unmedicated patientsn � 7; t (21) � �.27; p � .03]. However, unmedicated patients andontrol subjects did not differ from each other [t (33) � �.003; p �82, ns).
ffects of Current Mood StateOverall GMD values did not differ between depressed (n � 10)
nd euthymic (n � 17) bipolar patients, whether controlling foreeks on lithium [F(1,24) � 1.37, p � .25, ns] or not [F(1,25) � 1.87,� .18, ns]. Similarly, GMD values did not differ between depressednd euthymic bipolar patients for either the left [F(1,25) � .38, p �54, ns] or right anterior cingulate ROI [F(1,25) � 1.6, p � .21, ns].
iscussion
These maps provide novel information regarding regionallypecific gray matter enlargement associated with lithium treat-ent in bipolar patients. Cortical pattern matching methods
evealed significantly greater gray matter concentration, particu-arly within the medial walls of the cerebral hemispheres, in thenterior cingulate, ventral prefrontal cortex, and paralimbicssociation cortex in lithium-treated patients with bipolar disor-er, as compared with healthy control subjects. These brainegions are part of a complex interconnected neural circuitrynvolved in mood and cognitive regulation, memory, and theathophysiology of both unipolar and bipolar mood disordersBrambilla et al. 2005; Phan et al. 2002). Given that this effect was
ot found in unmedicated bipolar patients, these results suggestchanges in regional gray matter brain content related to lithiumtreatment and may reflect its postulated effect of neuropilincrease manifested as increases in gray matter volume (Moore etal. 2000b). Further corroborating these data in a prospective MRIstudy with healthy volunteers, we found significant increases ingray matter concentration in the left cingulate, left precuneus,and right superior frontal gyrus after 4 weeks of lithium treatment(Monkul et al. 2004).
These findings are also consistent with a recent voxel-basedmorphometry investigation (Adler et al. 2005) that observedareas of significantly greater gray matter in several brain regions,including portions of the anterior cingulate, ventral prefrontalcortex, fusiform gyrus, and primary and supplementary motorcortex, in a sample of adult bipolar patients on a variety ofmedications. Although the authors interpret their findings aspossibly reflective of preapoptotic osmotic changes or hypertro-phy, they did not explicitly investigate differential medicationeffects, leaving open the question of the etiology of theseneuroanatomic differences. In contrast, using similar methods,Lyoo et al. (2004) found reduced gray matter density in leftanterior cingulate and right inferior frontal gyrus in bipolarpatients relative to comparison subjects. In this study, only 25%of patients were currently taking lithium, while a slight majority(39%) were unmedicated.
While very little is currently known regarding the functionalsignificance of lithium-associated brain changes, functional neu-roimaging studies offer preliminary evidence that mood-stabiliz-ing medications may normalize functional abnormalities withinfrontotemporal neural systems in bipolar illness (Blumberg et al.2005). In addition, two recent functional neuroimaging studieshave reported decreases in task-associated physiological activityfollowing 2 weeks of lithium treatment in both euthymic bipolarpatients (Silverstone et al. 2005) and healthy volunteers (Bell etal. 2005). The relationship of such physiological changes tostructural neuroanatomic changes is unknown and clearly war-
Figure 5. Scatterplot depicting quadratic relation-ship between duration of lithium usage (in weeks)and mean cortical GMD. A significant quadratic rela-tionship was observed between weeks on lithiumand overall gray matter density [R2 � .38, F �5.13(17), p � .018], indicating that duration of lith-ium treatment accounts for 38% percent of the vari-ance in gray matter volume in lithium-treated bipo-lar patients. GMD, gray matter density.
rants further investigation.
www.sobp.org/journal
lHswtiprpdsfrgcC
mpt2dnlsubcnnas
tdrniplsstvs
ucrbrfpnBftgidMp
14 BIOL PSYCHIATRY 2007;62:7–16 C.E. Bearden et al.
w
We did not detect an effect of lithium dosage or a significantinear correlation between duration of lithium usage and GMD.owever, in this naturalistic study, a quadratic (inverted U-
haped) relationship was observed between overall GMD andeeks of lithium treatment. The onset of lithium’s neuroprotec-
ive action appears to require about 7 days of treatment, at leastn cultured cells (Manji and Lenox 2000). Moreover, the thera-eutic effects of mood stabilizers are generally not immediatelyeversed on discontinuation, suggesting a progressive and com-lex biological response (Manji et al. 2000a). In rats treated byiet for 2 or 4 weeks, lithium at therapeutic doses has beenhown to increase the activity of two prominent transcriptionactors, AP-1 and cyclic adenosine monophosphate (cAMP)-esponse element binding protein (CREB), in cultured cerebellarranule cells and in distinct brain regions, including the frontalortex, amygdala, hippocampus, and cerebellum (Ozaki andhuang 1997).
However, it is difficult to infer from these animal studies whatight be predicted over a longer time course in humans. Whilerior studies in human subjects have detected effects of lithiumreatment on gray matter volume within 4 weeks (Moore et al.000a, 2000b), it is unsurprising that the relationship betweenuration of treatment and brain changes is complex andonlinear. Although gray matter increases attributable toithium treatment would be expected to reach asymptote atome point, the inverted U-shaped function is somewhatnexpected and may possibly reflect a complex interactionetween effects of lithium treatment and normal aging pro-esses. Because these questions cannot be addressed in thisaturalistic, cross-sectional study, we are actively investigatingeuroanatomic, as well as neurocognitive, effects of durationnd dosage of lithium treatment in a longitudinal follow-uptudy.
Our findings suggest that some of the inconsistencies be-ween prior neuroanatomic studies of patients with bipolarisorder may be attributable to competing processes of disease-elated atrophy and/or tissue reduction pitted against possibleeurotrophic or neuroprotective effects of mood-stabilizing med-cation. Consistent with this possibility, Drevets et al. (1997)reviously reported that a small subregion of the anterior cingu-
ate, the subgenual prefrontal cortex (SGPFC), was about 40%maller in patients with bipolar disorder than in matched controlubjects; however, they subsequently found that the patientsreated with lithium or valproate had significantly higher SGPFColumes than nontreated patients and did not differ from controlubjects.
Although the mechanism of action of lithium is still largelynknown, recent animal and human studies have providedonverging evidence for its potential neuroprotective and neu-otrophic effects (e.g., Manji et al. 2000a). At the molecular level,oth lithium and valproate robustly increase levels of the neu-oprotective protein B-cell lymphoma protein-2 (bcl-2) in therontal cortex (Chen et al. 1999) and inhibit the proapoptoticrotein glycogen synthase kinase-3 (GSK-3) in the centralervous system (CNS) (Chen et al. 1999; Manji et al. 2000a).-cell lymphoma protein-2 is part of a well-characterized protein
amily that regulates apoptotic cell death, acting on mitochondriao stabilize membrane integrity and prevent release of apopto-enic factors (Manji et al. 2000b). Glycogen synthase kinase-3 ismplicated in regulation of various cytoskeletal processes andisease-related neuronal death (Chen et al. 1999; Jope 1999;anji et al. 2000a). Its inhibition by lithium is thought to be
rotective against processes of programmed cell death (Hetmanww.sobp.org/journal
et al. 2000). It is unclear which of these cellular actions is relatedto lithium’s therapeutic effects; an increasing number of studiesare now attempting to elucidate the processes that convert thesesecond messenger-mediated events into long-term cellular phe-notypic changes.
Notably, recent postmortem neuropathologic studies havedocumented reduced neuronal density in brain regions in whichwe found evidence for robustly increased gray matter density inlithium-treated patients, particularly the anterior cingulate (Beneset al. 2001; Bouras et al. 2001). Although effects of mood-stabilizing medications were not explicitly examined in thesestudies, the question of whether lithium treatment has long-termneuroprotective benefits that persist following termination oftreatment is also of fundamental importance.
Certain limitations of the current study must be noted. Be-cause we did not specifically design this study to examine theeffects of lithium treatment, we were unable to match the patientgroups on all clinical variables; specifically, there was a nonsig-nificant trend toward higher depression severity scores in theuntreated group at the time of scanning. However, given thatprior studies have not reported structural anatomic differences asa function of current mood state (Brambilla et al. 2005), we donot believe that this presents a significant confound. Further,while patients with bipolar II disorder were proportionallyoverrepresented in the untreated group, bipolar II disorderpatients did not significantly differ from bipolar I disorderpatients in terms of GMD [means: bipolar I disorder � .38 � .03versus .38 � .06 for bipolar II disorder; F (1,26) � .12, p � .73].Thus, the higher proportion of bipolar II disorder patients in theuntreated group cannot account for this pattern of findings. Withregard to medication treatment, our sample included patientswho had been on lithium for varying time periods and dosageswere not uniform across subjects. In the context of a clinical trial,such variables could be better controlled. In addition, whilesome subjects were taking more than one medication, results didnot change when these subjects were excluded from analysis.These limitations notwithstanding, as this study is, to our knowl-edge, the first to characterize the pattern of gray matter differ-ences across the cortical surface in lithium-treated bipolar pa-tients, replication with a larger homogenous group of subjectsmay serve to confirm the results observed here.
Given the small sample size in the lithium-untreated groupand the cross-sectional nature of this investigation, these findingsdo not conclusively demonstrate that greater gray matter con-centration in the lithium-treated group results from medicationeffects alone. Although robust differences were detected be-tween the lithium-treated group and normal control subjects, thegroup difference comparison for lithium-treated versus untreatedbipolar patients reached statistical significance only for the rightanterior cingulate after permutation analysis to correct for mul-tiple comparisons. Thus, it cannot be ruled out that theseregional increases were present prior to initiation of lithium andinstead reflect neuronal pathology intrinsic to bipolar illness,perhaps resulting from a selective failure of these systems tomyelinate, which could result in more tissue segmenting as graymatter in these brain regions. However, this explanation isunlikely, given the clear absence of differences between theuntreated group and normal control subjects, as well as converg-ing evidence demonstrating gray matter increases resulting fromshort-term lithium treatment in healthy volunteers (Monkul et al.2004; Moore et al. 2000b). In addition, while we cannot excludethe possibility that the observed gray matter differences in the
lithium-treated group are related to osmotic effects of lithium
la(aacoeats
eeiroanostiolwbvo
MRTtSttBI
FPAp
arI
m
o
A
A
B
C.E. Bearden et al. BIOL PSYCHIATRY 2007;62:7–16 15
eading to changes in water content in the brain, a purely osmoticction would be unlikely to be restricted to gray matter aloneSassi et al. 2002); the absence of any differences in white matterrgues against this interpretation. Notably, other psychotropicgents, including valproate (Chen et al. 1999) and atypical antipsy-hotics (Braus et al. 2001), may also affect neuronal viability. Thesebservations demonstrate the importance of taking medicationffects into account when interpreting data from in vivo neuroim-ging studies and postmortem reports. Furthermore, other factorshat may contribute to GMD increases in bipolar patients should beystematically examined in future investigations.
In conclusion, the sensitive cortical pattern matching methodsmployed in this study were able to detect prominent gray matternlargement, most pronounced in bilateral cingulate and paral-mbic cortices, in lithium-treated patients with bipolar disorderelative to healthy control subjects. It is tempting to infer that thebserved gray matter increases may suggest a mechanism ofction for lithium’s therapeutic effects, but these findings clearlyeed to be replicated in other studies. The pattern of resultsbserved here, combined with those of prior studies indicatingtructural and neurochemical differences as a function of lithiumreatment, suggest that reanalysis of previously collected neuro-maging data may be an efficient way to substantially increaseur current understanding of the magnitude and time course ofithium’s effects on the brain. Future studies should also assesshether valproate or other medications that effectively treatipolar disorder lead to similar increases in brain gray matter inivo and further investigate the clinical and functional relevancef these results.
This work was partly supported by K23 MH074644-01 (CEB),H 29618, MH 01736, MH 030915, MH 068662, MH 068766,R020571, Krus Endowed Chair in Psychiatry (University ofexas Health Science Center San Antonio), Veterans Adminis-ration (VA Merit Review), National Alliance for Research onchizophrenia and Depression (NARSAD), and CAPES Founda-ion (Brazil). Algorithm development was funded by the Na-ional Center for Research Resources, the National Institute foriomedical Imaging and Bioengineering, and the National
nstitute on Aging (EB01651, RR019771, AG021431).DJK has served on Advisory Boards of Eli Lilly & Company,
orest Pharmaceuticals, Inc., Pfizer, Inc., and Solvay/Wyethharmaceuticals and also served as a Consultant for Serviermerique. None of the other authors have financial disclosuresertinent to the contents of the manuscript.
EF serves on advisory boards for Pfizer, Inc., and Eli Lilly, asconsultant to Pfizer, Italia, and Novartis, USA, and is the
ecipient of an investigator-initiated grant from Forest Researchnstitute.
We thank Robert M. Bilder, Ph.D., ABPP, for helpful com-ents on the manuscript.
Supplementary materials cited in this article are availablenline.
dler C, Levine A, DelBello M, Strakowski S (2005): Changes in gray mattervolume in patients with bipolar disorder. Biol Psychiatry 58:151–157.
shburner J, Friston KJ (2000): Voxel-based morphometry—the methods.Neuroimage 11:805– 821.
allmaier M, Sowell ER, Thompson PM, Kumar A, Narr KL, Lavretsky H, et al.(2004): Mapping brain size and cortical gray matter changes in elderly
depression. Biol Psychiatry 55(4):382–389.Bech P, Bolwig TG, Kramp P, Rafaelsen OJ (1979): The Bech-Rafaelsen ManiaScale and the Hamilton Depression Scale. Acta Psychiatr Scand 59:420 –430.
Bell EC, Willson MC, Wilman AH, Dave S, Silverstone PH (2005): Differentialeffects of chronic lithium and valproate on brain activation in healthyvolunteers. Hum Psychopharmacol 20:415– 424.
Benes FM, Vincent SL, Todtenkopf M (2001): The density of pyramidal andnonpyramidal neurons in anterior cingulate cortex of schizophrenic andbipolar subjects. Biol Psychiatry 50:395– 406.
Blumberg HP, Donegan NH, Sanislow CA, Collins S, Lacadie C, Skudlarski P, etal. (2005): Preliminary evidence for medication effects on functionalabnormalities in the amygdala and anterior cingulate in bipolar disor-der. Psychopharmacology (Berl) 183(3):308 –313.
Bouras C, Kovari E, Hof PR, Riederer BM, Giannakopoulos P (2001): Anteriorcingulate cortex pathology in schizophrenia and bipolar disorder. ActaNeuropathol (Berl) 102:373–379.
Brambilla P, Barale F, Soares JC (2001): Perspectives on the use of anticon-vulsants in the treatment of bipolar disorder. Int J Neuropsychopharma-col 4:421– 446.
Brambilla P, Glahn DC, Balestrieri M, Soares JC (2005): Magnetic resonancefindings in bipolar disorder. Psychiatr Clin North Am 28:443– 467.
Braus D, Ende G, Weber-Fahr W, Demirakca T, Henn F (2001): Favorable effecton neuronal viability in the anterior cingulate gyrus due to long-termtreatment with atypical antipsychotics: An MRSI study. Pharmacopsy-chiatry 34:251–253.
Bullmore ET, Suckling J, Overmeyer S, Rabe-Hesketh S, Taylor E, Brammer MJ(1999): Global, voxel, and cluster tests, by theory and permutation, for adifference between two groups of structural MR images of the brain. IEEETrans Med Imaging 18:32– 42.
Chen G, Zeng WZ, Yuan PX, Huang LD, Jiang YM, Zhao ZH, et al. (1999): Themood-stabilizing agents lithium and valproate robustly increase thelevels of the neuroprotective protein bcl-2 in the CNS. J Neurochem72:879 – 882.
Drevets WC (2000): Neuroimaging studies of mood disorders. Biol Psychiatry48:813– 829.
Drevets WC, Price JL, Simpson JR Jr, Todd RD, Reich T, Vannier M, et al. (1997):Subgenual prefrontal cortex abnormalities in mood disorders. Nature386:824 – 827.
First M, Spitzer R, Gibbon M, Williams J (1998): Structured Clinical Interview forDSM-IV Axis I Disorders, Research Version. New York: New York State Psy-chiatric Institute.
Hamilton M (1960): A rating scale for depression. J Neurol Neurosurg Psychi-atry 23:56 – 62.
Hetman M, Cavanaugh JE, Kimelman D, Xia Z (2000): Role of glycogensynthase kinase-3beta in neuronal apoptosis induced by trophic with-drawal. J Neurosci 20:2567–2574.
Jope RS (1999): Anti-bipolar therapy: Mechanism of action of lithium. MolPsychiatry 4:117–128.
Lochhead RA, Parsey RV, Oquendo MA, Mann JJ (2004): Regional brain graymatter volume differences in patients with bipolar disorder as assessedby optimized voxel-based morphometry. Biol Psychiatry 55:1154 –1162.
Lyoo IK, Kim MJ, Stoll AL, Demopulos CM, Parow AM, Dager SR, et al. (2004):Frontal lobe gray matter density decreases in bipolar I disorder. BiolPsychiatry 55:648 – 651.
MacDonald D, Kabani N, Avis D, Evans AC (2000): Automated 3-D extractionof inner and outer surfaces of cerebral cortex from MRI. Neuroimage12:340 –356.
Manji HK, Lenox RH (2000): Signaling: Cellular insights into the pathophysi-ology of bipolar disorder. Biol Psychiatry 48:518 –530.
Manji HK, Moore GJ, Chen G (2000a): Clinical and preclinical evidence for theneurotrophic effects of mood stabilizers: Implications for the patho-physiology and treatment of manic-depressive illness. Biol Psychiatry48:740 –754.
Manji HK, Moore GJ, Chen G (2000b): Lithium up-regulates the cytoprotec-tive protein Bcl-2 in the CNS in vivo: A role for neurotrophic and neuro-protective effects in manic depressive illness. J Clin Psychiatry 61(suppl9):82–96.
McDonald C, Zanelli J, Rabe-Hesketh S, Ellison-Wright I, Sham P, Kalidindi S,et al. (2004): Meta-analysis of magnetic resonance imaging brain mor-phometry studies in bipolar disorder. Biol Psychiatry 56:411– 417.
Mesulam MM (1998): From sensation to cognition. Brain 121:1013–1052.
www.sobp.org/journal
M
M
M
O
O
P
R
S
S
16 BIOL PSYCHIATRY 2007;62:7–16 C.E. Bearden et al.
w
onkul E, Dalwani M, Nicoletti M, Soares J (2004): Brain gray matter changesafter lithium treatment: A voxel-based morphometry study in healthyindividuals. Biol Psychiatry 55:202S.
oore GJ, Bebchuk JM, Hasanat K, Chen G, Seraji-Bozorgzad N, Wilds IB, et al.(2000a): Lithium increases N-acetyl-aspartate in the human brain: In vivoevidence in support of bcl-2’s neurotrophic effects? Biol Psychiatry 48:1– 8.
oore GJ, Bebchuk JM, Wilds IB, Chen G, Manji HK (2000b): Lithium-inducedincrease in human brain grey matter. Lancet 356:1241–1242.
no M, Kubik S, Abernathey C (1990): Atlas of the Cerebral Sulci. Stuttgart,Germany: Thieme.
zaki N, Chuang DM (1997): Lithium increases transcription factor bindingto AP-1 and cyclic AMP-responsive element in cultured neurons and ratbrain. J Neurochem 69(6):2336 –2344.
han KL, Wager T, Taylor SF, Liberzon I (2002): Functional neuroanatomy ofemotion: A meta-analysis of emotion activation studies in PET and fMRI.Neuroimage 16:331–348.
ajkowska G (2000): Postmortem studies in mood disorders indicate alterednumbers of neurons and glial cells. Biol Psychiatry 48:766 –777.
assi RB, Brambilla P, Hatch JP, Nicoletti MA, Mallinger AG, Frank E, et al.(2004): Reduced left anterior cingulate volumes in untreated bipolarpatients. Biol Psychiatry 56:467– 475.
assi RB, Nicoletti M, Brambilla P, Mallinger AG, Frank E, Kupfer DJ, et al.
(2002): Increased gray matter volume in lithium-treated bipolar disorderpatients. Neurosci Lett 329:243–245.ww.sobp.org/journal
Shattuck DW, Sandor-Leahy SR, Schaper KA, Rottenberg DA, Leahy RM(2001): Magnetic resonance image tissue classification using a partialvolume model. Neuroimage 13:856 – 876.
Silverstone PH, Bell EC, Willson MC, Dave S, Wilman AH (2005): Lithium altersbrain activation in bipolar disorder in a task- and state-dependent man-ner: An fMRI study. Ann Gen Psychiatry 4:14.
Silverstone PH, Wu RH, O’Donnell T, Ulrich M, Asghar SJ, Hanstock CC (2003):Chronic treatment with lithium, but not sodium valproate, increasescortical N-acetyl-aspartate concentrations in euthymic bipolar patients.Int Clin Psychopharmacol 18:73–79.
Sowell ER, Thompson PM, Tessner KD, Toga AW (2001): Mapping continuedbrain growth and gray matter density reduction in dorsal frontal cortex:Inverse relationships during postadolescent brain maturation. J Neurosci21:8819 – 8829.
Sowell ER, Thompson PM, Welcome SE, Henkenius AL, Toga AW, Peterson BS(2003): Cortical abnormalities in children and adolescents with attention-deficit hyperactivity disorder. Lancet 362:1699–1707.
Thompson PM, Hayashi KM, de Zubicaray G, Janke AL, Rose SE, Semple J, etal. (2003): Dynamics of gray matter loss in Alzheimer’s disease. J Neurosci23:994 –1005.
Thompson PM, Hayashi KM, Sowell ER, Gogtay N, Giedd JN, Rapoport JL,et al. (2004): Mapping cortical change in Alzheimer’s disease,brain development, and schizophrenia. Neuroimage 23(suppl 1):S2–
S18.