Embed Size (px)
Citation preview
www.mjms.usm.my © Penerbit Universiti Sains Malaysia, 2012For permission, please email:[email protected]
Introduction
Hearing loss is associated with numerousfactors (1–8), primarily age (9–11), exposure tovarioussourcesofnoise(12,13)andlengthoftimeexposed to noise (14,15). It has been reportedthat when male steelworkers are exposed to90–99 dBA noise levels, their hearing abilityis significantly affected (1), with a mean shiftof 6.8–7.8 dB after 6–8 years. The incidence ofpresbycusis(9)insubjectsaged65yearsandolderis37.8%and8.3% for the≥27dBHLcriterionandthe≥41dBHLcriterion,respectively.Thereis also a significant difference in the hearing
Original Article
Submitted: 22Feb2011Accepted: 20June2012
thresholdofmenandwomenaged65yearsandolder.Thenoise-inducedhearing loss (NIHL) issignificant at 4 kHz, a well-established clinicalsign(4,7,12,14).Thisfrequencyisalsoconsideredthe typical notch frequency where hearing losshasitsmaximumdipwhencomparedwithotherhighfencefrequencies.Thedegreeofassociationis even strongerwhen the intensity of thenoiseand the temporary hearing threshold shift arehigh(16). The aims of the studywere to describe thehearing threshold based on audiometry dataandnoiselevels invariousareasofanopencastchromitemine inOdisha, India. The study also
Hearing Threshold, Loss, Noise Levels and Worker’s Profiles of an Open Cast Chromite Mines in Odisha, IndiaSunamani KerKetta1, Rajendra Gartia2, Somanath BaGh2
1 Ministry of Environment and Forests, ERO, Bhubaneswar, 751023 Odisha, India
2 Department of Statistics, Sambalpur University, 768019 Odisha, India
Abstract Objectives:TheaimsofthestudyweretodescribethenoiselevelsatanopencastchromitemineinOdisha,India,andthehearingthresholdofitsworkersandtoassociatetheirhearinglosswiththeirage,workstationandlengthofemploymentatthemine. Method:Weperformedacross-sectionalstudyofthehearingthresholdofchromitemineworkers.Audiometricdatafrom500subjectswascollectedat themines’hospital intheSukindaValleyofJajpur,Odisha,India.Thelatestaudiometrydataavailablefortheperiod2002to2008was used in the analysis. Audiometric screeningwas performed using an audiometer (TRIVENITAM-256025A)inaquietenvironmentbyqualifiedtechnicians,audiologistsorphysicians.Testswereconductedonthesubjectsaftertheyhadcompletelyrestedfor16hoursormoreaftertheirdayshift. Results:Amaximumof262subjects(52.4%)wereemployedintheworkzoneareaandaminimumof2subjects(0.4%)hadlessthan5yearsworkingexperience.Theageofthesubjectsrangedfrom29to59yearsandtheirworkingexperiencerangedfrom4to37years.Thesubjects’averagemeanhearingthresholdsat4,6and8kHzwere21.53dBA,23.40dBAand21.90dBA,respectively.ThemaximumLeq and L90 levels exceeded the prescribed limits for commercial, residential andsilencezones.ThemaximumLeqlevelsexceeded95dBAforlargeandmediumheavyearthmovingmachineries(HEMMs),bothoutsideandattheoperator’sposition.Hearinglossduetothesubjects’workexperiencewasfoundtobegreaterthanthatattributabletoageandworkstation. Conclusion: In our study population, the maximum noise levels for large and mediumHEMMsandinsidethecabinsofHEMMswerefoundtobemorethan95dBA.ThisindicatesthatoperatorsinthisparticularchromitemineatOdisha,Indiawereexposedtonoiselevelsexceeding95 dBA formore than 10%of themonitoring time. The subjects’ hearing losswas also found toincreaseforevery10-yearageintervalandthatforevery5yearsofworkexperienceathighfence.Thesubjects’ageandexperiencearesignificantlyassociatedwithhearinglossatalllevelsforfrequenciesof4.0,6.0,and8.0kHz,witholderandmoreexperiencedworkershavingahigher incidenceofhearingloss.
Keywords:hearing loss, noise, presbycusis
63Malays J Med Sci. Oct-Dec 2012; 19(4): 63-71
64 www.mjms.usm.my
Malays J Med Sci. Oct-Dec 2012; 19(4): 63-71
soughttofindanassociationbetweenhearinglossandthevariousprofilesofworkersatanopencastchromiteminefrom2002to2008.
Materials and Methods
Study area TheminesiteislocatedintheSukindavalleyof Jajpur, Odisha, India. The mine produceschromiteore inboth friableand lumpyvarietiesandhasachromeorebeneficiation(COB)plant.Themine is located160kmfromBhubaneswar,thestatecapitalofOdisha,65kmfromNationalHighway5(NH-5)and52kmfromJKRoad,thenearestrailwaystation.
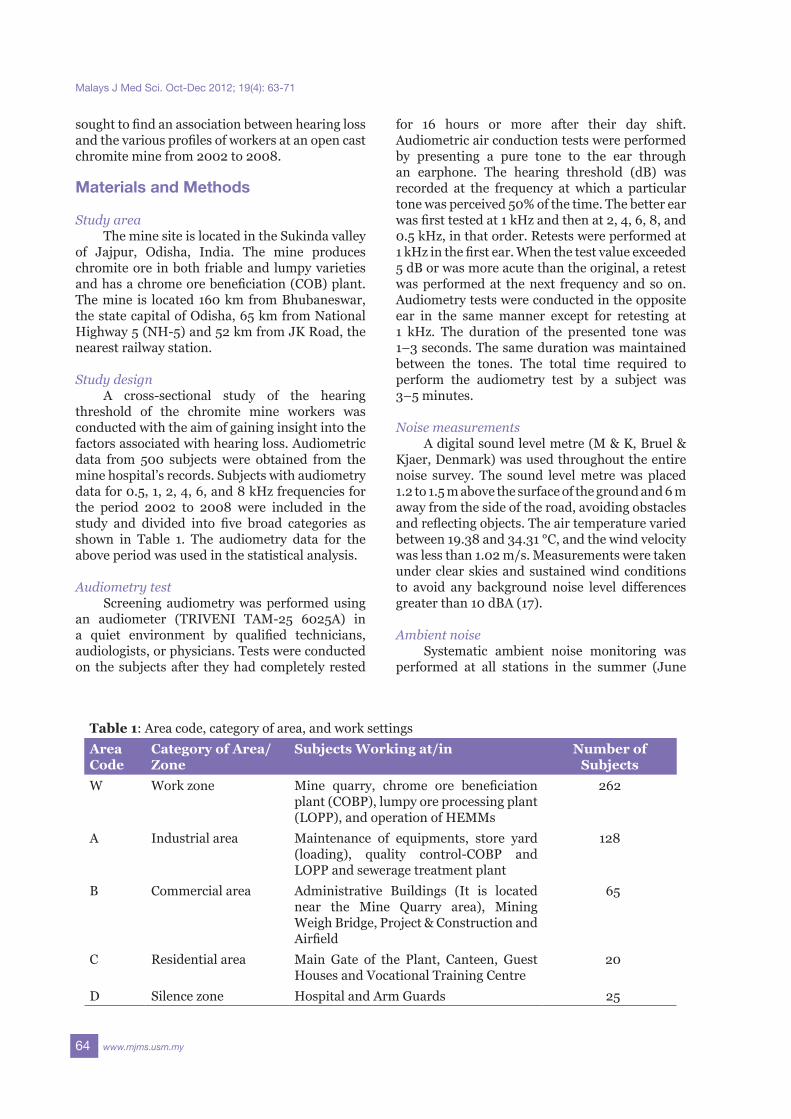
Study design A cross-sectional study of the hearingthreshold of the chromite mine workers wasconductedwiththeaimofgaininginsightintothefactorsassociatedwithhearingloss.Audiometricdata from 500 subjects were obtained from theminehospital’srecords.Subjectswithaudiometrydatafor0.5,1,2,4,6,and8kHzfrequenciesforthe period 2002 to 2008 were included in thestudy and divided into five broad categories asshown in Table 1. The audiometry data for theaboveperiodwasusedinthestatisticalanalysis.
Audiometry test Screening audiometrywasperformedusingan audiometer (TRIVENI TAM-25 6025A) ina quiet environment by qualified technicians,audiologists,orphysicians.Testswereconductedon the subjectsafter theyhadcompletely rested
for 16 hours or more after their day shift.Audiometricairconductiontestswereperformedby presenting a pure tone to the ear throughan earphone. The hearing threshold (dB) wasrecorded at the frequency at which a particulartonewasperceived50%ofthetime.Thebetterearwasfirsttestedat1kHzandthenat2,4,6,8,and0.5kHz,inthatorder.Retestswereperformedat1kHzinthefirstear.Whenthetestvalueexceeded5dBorwasmoreacutethantheoriginal,aretestwasperformedat thenext frequencyandsoon.Audiometrytestswereconductedintheoppositeear in the same manner except for retesting at1 kHz. The duration of the presented tone was1–3seconds.Thesamedurationwasmaintainedbetween the tones. The total time required toperform the audiometry test by a subject was3–5minutes.
Noise measurements Adigitalsoundlevelmetre(M&K,Bruel&Kjaer,Denmark)wasusedthroughouttheentirenoise survey. The sound levelmetrewas placed1.2to1.5mabovethesurfaceofthegroundand6mawayfromthesideoftheroad,avoidingobstaclesandreflectingobjects.Theairtemperaturevariedbetween19.38and34.31°C,andthewindvelocitywaslessthan1.02m/s.Measurementsweretakenunderclearskiesandsustainedwindconditionsto avoid any background noise level differencesgreaterthan10dBA(17).
Ambient noise Systematic ambient noise monitoring wasperformed at all stations in the summer (June
Table1:Areacode,categoryofarea,andworksettingsAreaCode
CategoryofArea/Zone
SubjectsWorkingat/in NumberofSubjects
W Workzone Mine quarry, chrome ore beneficiationplant(COBP),lumpyoreprocessingplant(LOPP),andoperationofHEMMs
262
A Industrialarea Maintenance of equipments, store yard(loading), quality control-COBP andLOPPandseweragetreatmentplant
128
B Commercialarea Administrative Buildings (It is locatednear the Mine Quarry area), MiningWeighBridge,Project&ConstructionandAirfield
65
C Residentialarea Main Gate of the Plant, Canteen, GuestHousesandVocationalTrainingCentre
20
D Silencezone HospitalandArmGuards 25

Original Article |Hearingthreshold,loss
www.mjms.usm.my 65
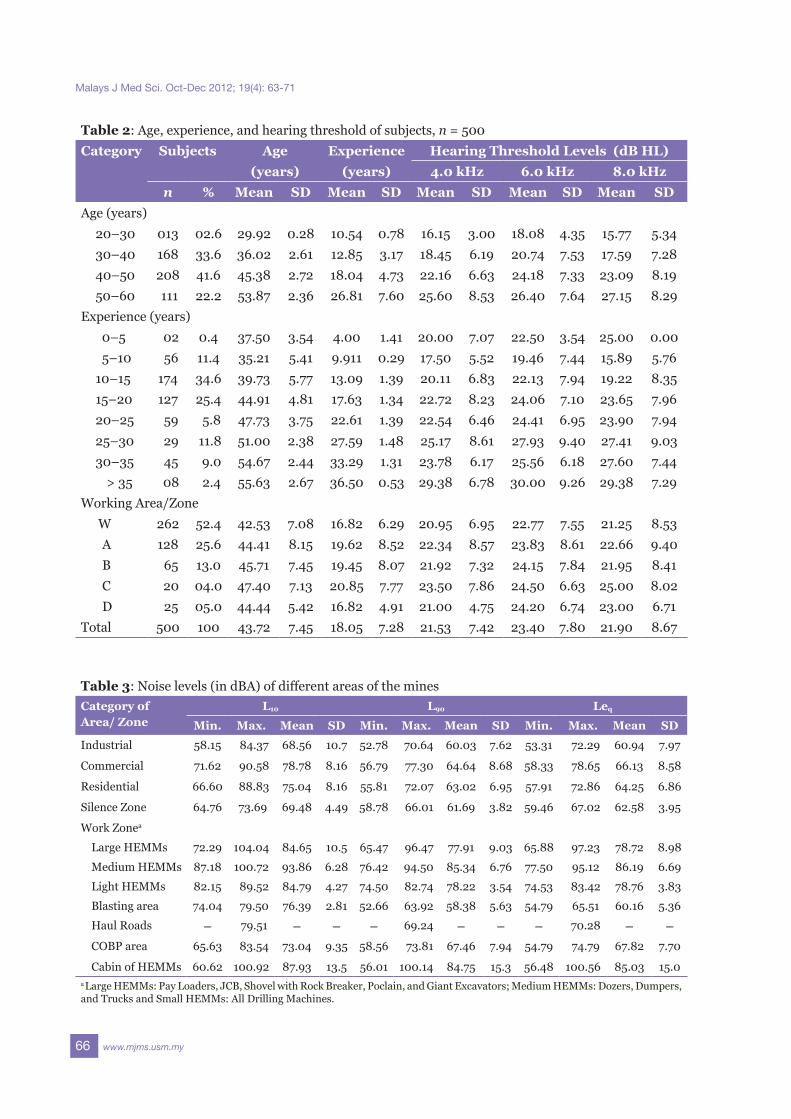
2008) and winter (November 2009) between0700 and 2200 hours. For blasting operations,thesurveywasconductedhalfanhourbeforeandafter the blasting operations at a distanceof 100 m from the blasting site for threeconsecutive days in April, 2010. As shown inTable 1, the working areas were categorizedbased on the individual administrative records.Table 2 shows the descriptive statistics of500 subjects in the demographic categories ofage(4groups),experience(8groups)andworkingarea (5 groups). Table 3 shows a summary ofthe various noise parameters in the work zone,the industrial area, the commercial area, theresidential area and the silence zone. A timegapof60secondswasobservedduring thefirstmonitoring between two consecutive readingsand15secondsduringthesecondandthirdnoisesurvey.
Noise parameters Thenoiselevelswerequantifiedintermsofvarioussoundlevels,withL10,L90,andLeqdefinedasfollows: L10:maximumnoiselevelmeasuredformore
than10%ofthemonitoringtime. L90:minimumnoiselevelmeasuredformore
than 90% of themonitoring time, alsodesignatedasbackgroundnoise.
Leq : the equivalent noise level over aparticularmonitoringtimeperiod.
ThefollowingequationwasusedtoestimateL10,L90andLeqvalues(18):
Lav=10log10∑10Li/10………(1)
Where;
Lav = averagenoise level of L10, L90, andLeqindBA
Li=theithsoundpressurelevelindBA i=1,2,3,……,N N= thenumber of readings of a particular
parameter
In the present study, audiometric datafrom 500 subjects was obtained for the period2002–2008toevaluatethepossibilityofadiporanotchathighfencefrequencies(i.e.at4,6,and8kHz)duetothesubjects’exposuretodifferentlevelsofnoise.Thesubjects’agesvariedbetween29 and 59 years and their working experiencerangedfrom4to37years. Datawere entered and cleaned using SPSSversion16.0forWindows.Wedescribedthedata
using means, standard deviations, frequenciesandpercentageswhereapplicable.Lineplotswereusedtodepictthehearingthresholdsfordifferentfrequencies. The associations between thesubjects’ age, workstation and work experienceandtheirhearinglosswereassessedusingtheChi-squaretest.TheresultsweredeemedsignificantiftheP-valueswerelessthan0.05(2tailed).
Results
Thecodesandcategoriesforthevariousareasand thework settingsof theopencast chromitemine are shown in Table 1. The profiles of the500subjectswithrespecttoage,workexperienceandhearingthresholdareshowninTable2. Equation1wasusedtoevaluatethedifferentnoise parameters (viz., L10, L90, and Leq) at eachstation.ThesummaryofthesenoiseparametersispresentedinTable3.WefoundthatthemaximumLeq,andL90levelsexceededtheprescribedlimits(19)incommercial,residentialandsilencezones.Themaximumnoiselevelswerefoundtobemorethan90dBA(19),thewarninglimitforlargeandmedium HEMMs, both at 7 m away from theequipment and at the operator’s position. ThemaximumvalueofL10wasfoundtobe100.92dBAinside the cabin. Almost all of the subjects hadbeenexposedtothistypeofnoise;thus,withoutpersonal ear protection equipment, a change inhearing threshold from their normal hearing isunavoidable. Figures 1 to 3 indicate the variation inhearinglossforallsubjectsatalltestfrequencieswithrespecttoage,experienceandworkstation.The audiograms indicate bilateral hearing loss,nohearinglossbelowlowfencefrequencies(0.5,1,and2kHz),moderateflatslopinghearinglossfrom2to6kHz,asmallnotchat6kHzandthenaslightrecoveryat8kHzforalmostallsubgroups.However,thereisnoclearsignofadiporanotchatthecharacteristic4kHzfrequency.Therefore,thePearsonChi-squaretestwasusedtoestimatethe association of hearing loss with differentsubjectgroups. Table4describestheChi-squaretestforthevarioussubjectcategories.Thehearingthresholdlevelsforallsubjectsweredividedintotwogroups(viz.,≤25dBHLand>25dBHL)toidentifythedegreeofhearing loss at4, 6 and8kHzand toform an ‘n x k’ table for the three demographiccategoriesseparately.Wefoundthattheexpectednumberinthecellwas lessthan5 inthe20–30agegroup,0–5,5–10,and>35yearsexperiencegroupsat4,6,and8kHzandalsotheresidentialandsilencezoneat4and6kHz.AsthePearson
66 www.mjms.usm.my
Malays J Med Sci. Oct-Dec 2012; 19(4): 63-71
Table2:Age,experience,andhearingthresholdofsubjects,n=500Category Subjects Age Experience HearingThresholdLevels(dBHL)
(years) (years) 4.0kHz 6.0kHz 8.0kHzn % Mean SD Mean SD Mean SD Mean SD Mean SD
Age(years)20–30 013 02.6 29.92 0.28 10.54 0.78 16.15 3.00 18.08 4.35 15.77 5.3430–40 168 33.6 36.02 2.61 12.85 3.17 18.45 6.19 20.74 7.53 17.59 7.2840–50 208 41.6 45.38 2.72 18.04 4.73 22.16 6.63 24.18 7.33 23.09 8.1950–60 111 22.2 53.87 2.36 26.81 7.60 25.60 8.53 26.40 7.64 27.15 8.29
Experience(years)0–5 02 0.4 37.50 3.54 4.00 1.41 20.00 7.07 22.50 3.54 25.00 0.005–10 56 11.4 35.21 5.41 9.911 0.29 17.50 5.52 19.46 7.44 15.89 5.7610–15 174 34.6 39.73 5.77 13.09 1.39 20.11 6.83 22.13 7.94 19.22 8.3515–20 127 25.4 44.91 4.81 17.63 1.34 22.72 8.23 24.06 7.10 23.65 7.9620–25 59 5.8 47.73 3.75 22.61 1.39 22.54 6.46 24.41 6.95 23.90 7.94
25–30 29 11.8 51.00 2.38 27.59 1.48 25.17 8.61 27.93 9.40 27.41 9.0330–35 45 9.0 54.67 2.44 33.29 1.31 23.78 6.17 25.56 6.18 27.60 7.44>35 08 2.4 55.63 2.67 36.50 0.53 29.38 6.78 30.00 9.26 29.38 7.29
WorkingArea/ZoneW 262 52.4 42.53 7.08 16.82 6.29 20.95 6.95 22.77 7.55 21.25 8.53A 128 25.6 44.41 8.15 19.62 8.52 22.34 8.57 23.83 8.61 22.66 9.40B 65 13.0 45.71 7.45 19.45 8.07 21.92 7.32 24.15 7.84 21.95 8.41C 20 04.0 47.40 7.13 20.85 7.77 23.50 7.86 24.50 6.63 25.00 8.02D 25 05.0 44.44 5.42 16.82 4.91 21.00 4.75 24.20 6.74 23.00 6.71
Total 500 100 43.72 7.45 18.05 7.28 21.53 7.42 23.40 7.80 21.90 8.67
Table3:Noiselevels(indBA)ofdifferentareasoftheminesCategoryofArea/Zone
L10 L90 LeqMin. Max. Mean SD Min. Max. Mean SD Min. Max. Mean SD
Industrial 58.15 84.37 68.56 10.7 52.78 70.64 60.03 7.62 53.31 72.29 60.94 7.97
Commercial 71.62 90.58 78.78 8.16 56.79 77.30 64.64 8.68 58.33 78.65 66.13 8.58
Residential 66.60 88.83 75.04 8.16 55.81 72.07 63.02 6.95 57.91 72.86 64.25 6.86
SilenceZone 64.76 73.69 69.48 4.49 58.78 66.01 61.69 3.82 59.46 67.02 62.58 3.95
WorkZonea
LargeHEMMs 72.29 104.04 84.65 10.5 65.47 96.47 77.91 9.03 65.88 97.23 78.72 8.98
MediumHEMMs 87.18 100.72 93.86 6.28 76.42 94.50 85.34 6.76 77.50 95.12 86.19 6.69
LightHEMMs 82.15 89.52 84.79 4.27 74.50 82.74 78.22 3.54 74.53 83.42 78.76 3.83
Blastingarea 74.04 79.50 76.39 2.81 52.66 63.92 58.38 5.63 54.79 65.51 60.16 5.36
HaulRoads – 79.51 – – – 69.24 – – – 70.28 – –COBParea 65.63 83.54 73.04 9.35 58.56 73.81 67.46 7.94 54.79 74.79 67.82 7.70
CabinofHEMMs 60.62 100.92 87.93 13.5 56.01 100.14 84.75 15.3 56.48 100.56 85.03 15.0aLargeHEMMs:PayLoaders,JCB,ShovelwithRockBreaker,Poclain,andGiantExcavators;MediumHEMMs:Dozers,Dumpers,andTrucksandSmallHEMMs:AllDrillingMachines.

Original Article |Hearingthreshold,loss
www.mjms.usm.my 67
Figure1:HearingThresholdVs.age.
Figure2:HearingThresholdVs.experience.
Figure3:HearingThresholdVs.workstations.
Chi-squaretest isrobustenoughfor thissamplesize, there is no serious disadvantage in thepresentstudy(1). ThePearsonChi-squaretestwasperformedfor the subject categories by assuming thefollowinghypothesis:Theagegroup, experiencegroupandtheworkinggroupareindependentofhearinglossatthe4,6,and8kHztestfrequencies. Given that P < 0.01, the hypothesis wasrejectedatthe1%levelofsignificancefortheagegroupandexperiencegroupatthe4,6and8kHz
testfrequencies.However,thePearsonChi-squaretestwasrejectedatthe5%levelofsignificancefortheworkingareagroupat6kHzbecauseP<0.05butwasacceptedat4and8kHz. The Pearson Chi-square test revealed anassociation between hearing loss and the agegroupsforalltestfrequencies(4,6,and8kHz),and the degree of association varied from 0.22to 0.27. There was also a relationship betweenhearing loss and the years of work experience,with the degree of association between 0.22and 0.30. Similarly, the hearing threshold wasalso associated with working at the variousworkstations, and the value of the associationwas between 0.08 and 0.14. Hearing loss wasassociatedwithageandworkexperience for the4,6,and8kHzfrequenciesandwiththesubjects’differentworking areas for the6 kHz frequencyonly.
Discussion
Table3 shows that themaximumLeq levelexceeded90dBAforallareasexcepttheindustrialarea as did L90, the background noise level.Similarly, themaximumnoise levelswere foundto bemore than 90 dBA for large andmediumHEMMs,bothat7mawayfromtheequipmentandattheoperator’sposition.Itmaybeinferredfromthis that the subjects, particularly the HEMMsoperators, are overexposed to noise during thecourseoftheirworkingshift.Inaddition,theL10valueforthelargeHEMMswasfoundtobemorethan100dBA.Therefore,itmaybeinferredthatthesubjectsareexposedtosuchhighnoiselevelsthattheymaysufferfromhearinglossduringtheworkshiftatdifferentareasofthemine. Themaximumassociation betweenhearingloss and age for 8.0 kHz implies that hearingloss increases with age and noise frequency.Themaximumassociation between hearing lossandworkexperiencefor4.0kHzindicatesadipat the characteristic frequency. The maximumassociationbetweenhearinglossandworkstationoccurredat6.0kHzinsteadofatthecharacteristic4 kHz frequency. Therefore, it may be inferredthat a number of the subjects may have beenexposed to areas with high noise levels in the6.0kHzfrequency. As indicated inTable4, theChi-square testof independence revealed that hearing loss andageweredependent,withadegreeofassociationof 0.27 at 8 kHz. Franks (20) has shown that90%ofcoalminersand49%ofmetal/non-metalminersundergoahearing lossby theageof50.Johansson et al., (11) have also shown a strong

68 www.mjms.usm.my
Malays J Med Sci. Oct-Dec 2012; 19(4): 63-71
Table4:PearsonChi-squaretestofthesubjects(n=500)Category %ageofsubjectsat χ2* P(2-tailed)
≤25dBHL >25dBHLa.Subjectsprofilesandstatusofhearinglossat4.0kHz
Age(years)
20–30 100.0 0.0 32.82 0.001
30–40 94.1 5.9
40–50 81.2 18.8
50–60 69.4 30.6
Experience(years)
0–5 100.0 0.0 44.92 0.001
5–10 96.4 3.6
10–15 89.1 10.9
15–20 77.2 22.8
20–25 79.7 20.3
25–30 79.3 20.7
30–35 82.2 17.8
>35 12.5 87.5
WorkingArea/Zone
W 84.7 15.3 3.15 0.534
A 79.7 20.3
B 81.5 18.5
C 85.0 15.0
D 92.0 8.0
b.Subjectsprofilesandstatusofhearinglossat6.0kHz
Age(years)
20–30 92.3 7.7 23.80 0.001
30–40 87.5 12.5
40–50 71.6 28.4
50–60 64.9 35.1
Experience(years)
0–5 100.0 0.0 24.68 0.001
5–10 87.5 12.5
10–15 83.9 16.1
15–20 70.1 29.9
20-25 71.2 28.8
25–30 62.1 37.9
30–35 68.9 31.1
>35 37.5 62.5
WorkingArea/Zone
W 81.3 18.7 9.89 0.042
A 71.1 28.9
B 72.3 27.7
C 60.0 40.0
D 68.0 32.0

Original Article |Hearingthreshold,loss
www.mjms.usm.my 69
Category %ageofsubjectsat χ2* P(2-tailed)≤25dBHL >25dBHL
c.Subjectsprofilesandstatusofhearinglossat8.0kHzAge(years)
20–30 92.3 7.7 35.5 0.00130–40 90.540–50 75.050–60 61.3
Experience(years)0–5 100.0 0.0 33.39 0.001
5–10 92.9 7.110–15 85.6 14.415–20 71.6 28.420–25 74.6 25.425–30 65.5 34.530–35 62.2 37.8>35 37.5 62.5
WorkingArea/ZoneW 79.0 21.0 3.24 0.518A 75.0 25.0B 81.5 18.5C 65.0 35.0D 76.0 24.0
NB:*Chi-squarevalue.
association between hearing threshold levelsandage.Theyalsodemonstratedthatreductionsinhearing threshold levels startmore rapidly inthe50-yearagegroupforfrequenciesover3kHz.Edwards (21)demonstrateda strongassociationbetweenhearing loss andage in a studyof goldminers.Furthermore,ithasbeenshownthattheaveragedeterioration in thepure tone thresholdofgoldminers is 14.16dB forevery tenyearsat6kHz.Thus,itcanbeconcludedthatthesubjects’hearing threshold is positively associated withage for the 8 kHz frequency. This finding alsoindicates that hearing loss continues every10yearsuptotheageof50to60years. Thereisalsoarelationshipbetweenhearinglossandthelengthoftimeofjobexposureatthe1%levelofsignificance,withamaximumdegreeofassociationof0.30at4kHz,thecharacteristicfrequency.Celiketal.,(4)havefoundthatworkersat a hydroelectric power plant demonstratehearing loss within the first 10 years of noiseexposureandthatthereisaslightprogressioninthefollowingyearsinthefrequencyrangeof4to
6kHz.Abbateetal., (13)are inagreementwiththe present study and found that noise-inducedhearinglossisobservedinoccupationalexposureexceeding 17 years at 4 kHz in two bottlingplants. However, the present study reveals thatsubjects’hearinglossincreaseswithevery5yearsofworking experience in an open cast chromitemineat4kHz. Similarly, hearing loss and working atdifferent stations are dependent at the 5% levelof significance, with a maximum association of0.14at6kHz,wherethenotchisfound.Theworkzonewas foundtobe themostsignificant factoraffectingthesubjects’hearinglossfor6kHzatthe5%levelofsignificance.Spenceretal.(22)agreewith these findings and have shown that thereis a strong association between noise exposureand heavy construction equipment operators.Edwards (21) showed that there is also a strongassociationbetweenhearinglossandrockdrillers,themostseverelyaffectedofwhomaregoldmineworkers.

70 www.mjms.usm.my
Malays J Med Sci. Oct-Dec 2012; 19(4): 63-71
Conclusion
In our study population, the maximumnoise levels for large andmediumHEMMs andinsidetheHEMMcabinswerefoundtobemorethan95dBA.Thisindicatesthattheoperatorsinthat particular chromite mine of Odisha, India,were exposed to noise levels exceeding 95 dBAformore than 10% of themonitoring time. Thesubjects’hearing losswasalsofoundto increasefor every 10-year age interval and for every5yearsofworkexperienceexposedtohighfencefrequencies.Thesubjects’ageandexperienceweresignificantly associated with hearing loss at alllevelsfor4.0,6.0,and8.0kHzfrequencies,withahigherpercentageofolderandmoreexperiencedworkersexperiencinghearingloss.
Authors’ Contribution
Conceptionanddesign,analysisandinterpretationof the data, drafting of the article, provision ofstudy materials or patients, and collection andassemblyofdata:SKConceptionanddesign,analysisandinterpretationof the data, critical revision of the article forimportant intellectual content, and statisticalexpertise:RGConceptionanddesign,analysisandinterpretationof the data, critical revision of the article forimportant intellectual content, final approvalof the article, provision of study materials orpatients,andstatisticalexpertise:SB
Correspondence
DrSunamaniKerkettaPhDMinistryofEnvironmentandForestsEasternRegionalOffice,Bhubaneswar751023Odisha,IndiaTel:+916-742302453Fax:+916-742302432E-mail:[email protected]
References
1. HowellRW.Aseven-yearreviewofmeasuredhearinglevels inmalemanual steelworkerswithhigh initialthresholds.Br J Ind Med.1978;35(1):27–31.
2. EvansWA,MingHY.IndustrialnoiseinducedhearinglossinHongKong–Acomparativestudy.Ann Occup Hyg.1982;25(1):63–80.
3. MiyakitaT,UedaA.Estimatesofworkerswithnoise-inducedhearinglossandpopulationatrisk.J Sound Vibration.1997;205(4):441–449.
4. Celik O, Yalcin S, Ozturk A. Hearing parametersin noise exposed industrial workers. Auris Nasus Larynx.1998;25:369–375.
5. Kanchan HS, Shrinagesh AE, Mukherjee A.Health Status of employees working in underground mines our experience at Tata Collieries, Jharia division.Dhanbad (India): Proceedings of the 7th NationalSymposiumonEnvironment,IndianSchoolofMines;1998.p.S65–S67.
6. Ishiyama T, Hashimoto T. The impact of soundqualityonannoyancecausedbyroadtrafficnoise:Aninfluenceof frequencyspectraonannoyance.Japan Soc of Auto Engr Review.2000;21:225–230.
7. BorchgrevinkHM.DoesHealthPromotionWork inRelationtoNoise?Noise Health.2003;5(18):25–30.
8. Joshi SK, Devkota S, Chamling S, Shrestha S.EnvironmentalNoiseInducedHearinglossinNepal.Kathamandu Univ Med J.2003;1(3):177–183.
9. KimHN,KimSG,LeeHK,OhrrH,MoonSK,ChiJ,etal.IncidenceofPresbycusisofKoreanPopulationsinSeoul,KyunggiandKangwonprovinces.J Korean Med Sci.2000;15:580–584.
10. ToppilaE.A systems approach to individual hearing conservation (master’s thesis). Helsinki (Finland):UniversityofHelsinki;2000.
11. Johansson MSK, Arlinger SD. Hearing thresholdlevels for an otologically unscreened, non-occupationallynoiseexposedpopulation inSweden.Int J Audio.2002;41:180–194.
12. Amedofu GA. Hearing impairment among workersinasurfaceGoldMiningCompanyinGhanna. Afr J Hlth Sci.2002;9:91–97.
13. Abbate C, Concetto G, Fortunato M, BrecciaroliR, Tringali MA, Beninato G, et al. Influence ofenvironmental factorson the evolutionof industrialNoise-Induced Hearing Loss. J Env Monitoring Assessment.2005;7(1-3):351–361.
14. McBridge DI, Williams S. Audiometric notch as asignofnoiseinducedhearingloss. J Occup Env Med.2001;58:46–51.
15. HarmadjiS,KabullahH.Noiseinducedhearinglossin steel factoryworkers.Folia Medica Indonesiana.2004;40(4):171–174.
16. Bisbee KM.An evaluation of existing occupational noise standards (master’s thesis).Texas:TexasTechUniversity;1974.
17. HeimannD.Meteorological aspect in modeling noise propagation outdoors.Naples:EuroNoise;2003.
18. Irwin JD, Graf ER. Industrial Noise and Vibration Control. Englewood Cliffs (New Jersey): Prentice-HallInc;1939.p.16.
19. Maiti SK.Handbook of Methods in Environmental Studies Vol. 2: Air, Noise, Soil and Overburden Analysis. 1st ed. Jaipur (India): ADB Publishers;2003.

Original Article |Hearingthreshold,loss
www.mjms.usm.my 71
20. FranksJR.Analysis of audiograms of a large cohort of noise-exposed miners. Cincinnati (OH): InternalReportNationalInstituteforOccupationalSafetyandHealth;1996.p.S3–S8.
21. Edwards AK. Characteristics of noise-induced hearing loss in gold miners (master’s thesis).Pretoria:UniversityofPretoria;2008.
22. SpencerE,KovalchikP.Heavyconstructionequipmentnoisestudyusingdosimetryandtime-motionstudies.Noise Control Engr J.2007;55(4):408–416.