Embed Size (px)
Citation preview

EXCLI Journal 2015;14:1232-1255 – ISSN 1611-2156 Received: May 01, 2015, accepted: November 19, 2015, published: December 15, 2015
1232
Original article:
AN ENHANCED ALGORITHM FOR MULTIPLE SEQUENCE ALIGNMENT OF PROTEIN SEQUENCES USING
GENETIC ALGORITHM Manish Kumar Department of Computer Science and Engineering, Indian School of Mines, Dhanbad, Jharkhand, India, e-mail: [email protected] http://dx.doi.org/10.17179/excli2015-302
This is an Open Access article distributed under the terms of the Creative Commons Attribution License (http://creativecommons.org/licenses/by/4.0/).
ABSTRACT
One of the most fundamental operations in biological sequence analysis is multiple sequence alignment (MSA). The basic of multiple sequence alignment problems is to determine the most biologically plausible alignments of protein or DNA sequences. In this paper, an alignment method using genetic algorithm for multiple sequence alignment has been proposed. Two different genetic operators mainly crossover and mutation were defined and implemented with the proposed method in order to know the population evolution and quality of the sequence aligned. The proposed method is assessed with protein benchmark dataset, e.g., BALIBASE, by comparing the obtained results to those obtained with other alignment algorithms, e.g., SAGA, RBT-GA, PRRP, HMMT, SB-PIMA, CLUSTALX, CLUSTAL W, DIALIGN and PILEUP8 etc. Experiments on a wide range of data have shown that the proposed algorithm is much better (it terms of score) than previously proposed algorithms in its ability to achieve high alignment quality. Keywords: bioinformatics, multiple sequence alignment, genetic algorithm, crossover operator, mutation opera-tor
INTRODUCTION
The sequence alignment of three or more biological sequences such as the Protein, DNA or RNA (Auyeung and Melcher, 2005; Wei et al., 2013) is known as the multiple sequence alignment (Hamidi et al., 2013). One of the standard techniques in bioinfor-matics for reviling the relationship between collections of evolutionarily or structurally related protein is sequence alignment.
Sequence alignment are extensively be used for improving the secondary and ter-tiary structure of protein and RNA sequenc-es, which is used for drug designing and also to find distance between organism. In MSA, the foremost effort is made to find the opti-mal alignment for a group of biological se-quences. In the past research, we have ob-served several reliable and efficient tech-niques for alignment of multiple sequences,
which includes evolutionary algorithm (GA) (Peng et al., 2011), HMM (Eddy, 1998) and the generic probabilistic metaheuristic for the global optimization problem (Kirkpatrick et al., 1983).
One of the widely studied branches in bi-oinformatics is sequence similarity, also known as a subset of sequence analysis. The available molecular sequence data have enough resources that can teach us about the structure, function and evolution of biologi-cal macromolecules. The main objective of an MSA is to align sequences which can show the biological relationship between the input sequences, but to develop a reliable MSA program is never easy. In general the MSA problem can be seen as: Let N number of sequences is supplied as input with a pre-determined scoring scheme for finding the best matches among the letters (as every se-

EXCLI Journal 2015;14:1232-1255 – ISSN 1611-2156 Received: May 01, 2015, accepted: November 19, 2015, published: December 15, 2015
1233
quences consists of a series of letter). Alt-hough, definition stated here is simple but still it requires certain input such as the se-lection of input sequence and comparison model along with the optimization of the model to get completed in all respect. There are various issues demonstrated in the litera-ture (Aniba et al., 2010; Pop and Salzberg, 2008; Sellers,1984) for alignment of protein sequences. First, the protein family described in sequences databases have complex multi domain architecture with huge unstructured regions. Second, the new sequences selected through automatic methods contains relevant amount of sequence error (Yonghua et al., 2004; Wen and Tan, 1996 ).
There are various methods which can be used to solve MSA problem such as the it-erative (Mohsen et al., 2007) classical, pro-gressive algorithms (Kupis and Mandziuk, 2007). All these algorithms are based on global or local alignment (Wei et al., 2013; Changjin and Tewfik, 2009, Ankit and Huang, 2008) techniques. The Global align-ment technique, aids in making the sequenc-es aligned from end to end points. Whereas, the local alignment technique first identifies a substring within a string and then tries to align it with the target string.
In general, local alignment is considered for sequence alignment but some time it cre-ates problem because here in local alignment we have to deal with an additional challenge of identifying the regions of similarity. A dynamic programming based approach which are mostly used as the local and global alignment technique is the Smith–Waterman algorithm (Haoyue et al., 2009) and Needle-man-Wunsch algorithm (Needleman and Wunsch, 1970). The dynamic programming (DP) (Zhimin and Zhong, 2013) approach are considered to be good alignment option for not more than two sequences. Here, one thing is to be noted that MSA is a combina-torial problem (NP-hard) (Kececioglu and Starrett, 2004) and when the number of se-quences increases the computational effort becomes prohibitive. Feng and Doolittle (1987) proposed a progressive alignment al-
gorithm (tree-base algorithm), which uses the method of Needleman and Wunsch and for constructing an evolutionary tree (Bhattacharjee et al., 2006) to know the rela-tionship between sequences. The progressive alignment algorithms perform it operation through branching order of a guide tree and thus often get trapped to local optima (Naz-nin et al., 2012). To avoid such kind of local optima it is suggested in the literatures to use either stochastic or iterative procedure (Mohsen et al., 2007; Gotoh, 1982).
By referring to various literature studies (Devereux et al., 1984; Jagadamba et al., 2011; Nguyen and Yi, 2011; Katoh et al., 2005; Pei and Grishin, 2007; Li et al., 2004, Ma et al., 2002; Pearson, 2000), it can be concluded that none of the existing algo-rithms were accurate enough to provide an optimal alignment for all the datasets. As a result, with the uses of iterative refinement strategies (Gotoh, 1982), Hidden Markov Models (Eddy, 1998) or Genetic Algorithms (Peng et al., 2011) an iterative algorithms (Mohsen et al., 2007) were developed to construct more reliable and efficient multiple alignments. Also, all these methods listed above have shown their superiority in align-ing distantly related sequences for a variety of datasets (Blackshields et al., 2006; Thompson et al., 1999). However, some ac-curacy was degraded while considering the distantly related sequences.
The above paragraph gives a clear indi-cation that none of the method listed above can provide an accurate or meaningful alignment in all possible situations, irrespec-tive of their advantages or disadvantages. Progressive alignment methods are known to be very fast and deterministic, but it suffers from a problem in which if any error occurs in the initial alignment and somehow gets propagated to other sequences than it cannot be corrected. However, this type of problem does not exist for iterative methods. In gen-eral, iterative methods are much slower in comparison to progressive methods and are used in a place where the best possible

EXCLI Journal 2015;14:1232-1255 – ISSN 1611-2156 Received: May 01, 2015, accepted: November 19, 2015, published: December 15, 2015
1234
alignment is of prime importance and not the computational cost.
Evolutionary algorithms such as the ge-netic algorithm, which are based on the natu-ral selection processes, are used for imple-menting iterative methods. Such algorithms have an upper edge with respect to others in the sense that these algorithms are independ-ent for any types of scoring function. This gives an independency that without much al-teration to the alignments, different objective functions can easily be tasted. Also, evolu-tionary algorithms can give low-cost clusters and multi-core processors because of they can be easily parallelize to meets the current trend.
In this study, genetic algorithms (Pengfei et al., 2010) has been considered for experi-mental analysis. The main advantage of us-ing GA for MSA problem is that it does not requires any particular source of algorithm to solve a given problem. Only, requirement for GA is the fitness function (Dongardive and Abraham, 2012), for necessary analysis and evaluation of solutions. Because GA is an highly implicitly parallel technique there-fore, it can be used to solve various large scale and real time problems such as the travelling sales man problem (Zhang and Wong, 1997; Ulder et al., 1991). For a se-quences of smaller length it can be possible to do the alignment manually but sequences of larger length requires an algorithm for successful alignment. Progressive alignment technique such as the dynamic programming (DP) suffers from a problem of early con-vergence or local optima problem and hence cannot be used for alignment of larger se-quences. Since, this research work is based on sequences of larger length (see Table 2) therefore approaches like GA is considered over DP.
Analyzing the importance of protein se-quences in near future (Thompson et al., 2011) provoked the author for considering MSA of protein sequences for this research work. Till date, sequence homology is con-sidered to be the main method for predicting protein structure and function along with
their evolutionary history (Kimura, 1980). It has been observed that in the recent years, the tools (Gelly et al., 2011) for MSA of pro-tein sequences has improved. Various litera-ture and related studied have confirmed that the further improvement in protein sequenc-es can only be possible by combining se-quence alignment with some know protein structures. A better performance of align-ment of protein sequences can be excepted by proper utilizing the phylogenetic relation-ships among sequences (Cai et al., 2000).
Literature studies (Wong et al., 2000; Taylor, 2000; Razmara et al., 2009; Mott, 2005) says that there are still a number of challenges in aligning protein sequences. First, the misaligned or less aligned locally conserved regions within the sequences are major and foremost challenges in aligning protein sequences. Second, the misalignment of motif which is found in natively disor-dered regions. Third, the protein sequences which are found in various databases across the globe contain huge amount of alignment error (Loytynoja and Goldman, 2008).
On the basic of literature survey (Deve-reux et al., 1984; Jagadamba et al., 2011; Nguyen and Yi, 2011; Razmara et al., 2009; Mott, 2005) and in order to test the feasibil-ity of the proposed approach a comparison study were made between the proposed method and some of the existing methods such as the SAGA (Notredame and Higgins, 1996), MSA-GA (Gondro and Kinghorn, 2007), RBT-GA (Taheri and Zomaya, 2009), CLUSTALX (Thompson et al., 1997), CLUSTALW (Thompson et al., 1994), HMMT (Eddy,1995), PRRP (Gotoh, 1996), PILEUP8 (Devereux et al., 1984) and DIALI (Morgenstern et al., 1996) by calculating the corresponding BAliscore. Some of these methods are iterative and some of these are progressive. Each of these methods has their own advantages and disadvantages in terms of speed, time, convergence, robustness and ability to align different lengths sequences etc. All such factors which promoted the au-thor to select these different methods for the

EXCLI Journal 2015;14:1232-1255 – ISSN 1611-2156 Received: May 01, 2015, accepted: November 19, 2015, published: December 15, 2015
1235
experimental study are mentioned in the par-agraph that follows.
SAGA, MSA-GA and RBT-GA are the GA based methods. The time complexity of SAGA is larger and are not suffers from the problem of local minima. RBT is an iterative algorithm for sequence alignment using a DP table. CLUSTALW can be seen as an exam-ple of progressive approach, and can be used to short out the local optimality problem for the progressive alignment approach. This is the most popular, accurate and practical method in the category of hierarchical meth-ods. The widely used programs for MSA are CLUSTAL W and CLUSTAL X. They are very fast and easy to handle and are capable of aligning datasets of medium sized. The sequences so produced by these methods are of sufficient quality and not requires any manual editing or adjustment. HMMT is based on simulated annealing method. PRRP is a global alignment program which is based on a progressive and iterative approach. This approach is robust. PIMA (Smith and Smith, 1992) uses a local dynamic programming to align only the most conserved motifs. DI-ANLIGN (Morgenstern et al., 1996) uses a local alignment approach that construct MSA based on a segment to segment com-parison rather than residue to residue com-parison.
T-Coffee (Notredame et al; 2000) meth-od which was able to make very accurate alignments of very divergent proteins but on-ly for small sets of sequences and therefore not considered for this experimental study. Also this method is often tapped at local minima. It also has a high computational cost with respect to other methods mentioned above. MAFFT (Katoh et al., 2005) is very fast and can align sequences ranging from hundred to thousand. It is quite similar to CLUSTAL when it comes to alignment ac-curacy. But we have also not considered this method in the proposed research work, as the dataset and the fitness measure used by this algorithm is totally different than those used in this experimental approach.
The rest of the paper is organized as fol-low. The next section describes the relevant preliminaries on Alignment, Sequence alignment, MSA, GA, BAliBase and PAM Matrix, followed by the proposed approach section which describes the concepts under-lying the research work. The experiments setups required in order to validate and ob-serve the results are discussed in the next section. The second last section explains about the detailed results over different da-tasets. Finally, the concluding section pre-sents the final consideration.
PRELIMINARIES
This section provides a detail idea about the basic concept of the related terms used in the paper such as Alignment, Sequence Alignment, Multiple Sequence Alignment, GAP, BAliBase and PAM Matrix.
Alignment
The arrangement of two or more biologi-cal sequences in such a way that tells us at what point the sequences are similar and at what point they differ is known as alignment. An alignment is said to be the optimal one, if it has more similar sequences as compared to dissimilar sequences.
Sequence alignment
Sequence alignment is a way of arrang-ing the biological sequences so as to identify the region of similarity that may be a result of structural, functional, or evolutionary rela-tionships between the sequences (Hicks et al., 2011). In bioinformatics, the aligned se-quences of DNA, RNA, or Protein are repre-sented inside the matrix, in the form of rows. Gaps are inserted at some point in the se-quences to achieve maximum similar charac-ter in a column.
It aims to infer clues about the unknown sequence by inferring biological characteris-tics of the matched sequence. One of the most challenging tasks in sequence align-ment is its repetitive and time-consuming alignment matrix computations (Weiwei and Sanzheng, 2000).

EXCLI Journal 2015;14:1232-1255 – ISSN 1611-2156 Received: May 01, 2015, accepted: November 19, 2015, published: December 15, 2015
1236
Multiple sequence alignment By referring to Figure 1, we can define
multiple sequence alignment (MSA) as the optimal alignment technique of three or more sequences with or without inserting gaps (Loytynoja and Goldman, 2008). It plays an important role in sequence analysis and can also be used to judge and identify the simi-larity between DNA, RNA or protein se-quences. With these features, MSA is proved as an important tool for prediction of func-tion and/or structure (Layeb and Deneche, 2007) of an unknown protein sequences.
Figure 1: Example of a multiple sequence alignment
An MSA can be obtained by inserting gaps “-” at proper places such that no col-umn in the sequences contains only gap character. Insertion of gaps will result in equal length sequences in the resulting alignment. Note 1: Consider an input string N1, N2.....Np where a MSA maps them to some other string M1, M2....Mc, where 1. |M1| = |M2| =....=|Mc| 2. Mi by removing all “-” gap characters is equal to Ni.
3. None of the column contains only the gap character. In MSA, there are various measures to eval-uate alignment. Gaps
In order to have the best resulting align-ment, gaps are permitted within the sequenc-es along with a user defined mechanism for penalizing these gaps. Gaps are inserted be-tween the residues so that identical or similar characters are aligned in successive columns.
The values of gap penalties depend on the choice of matrix such as the PAM250 (Dayhoff et al., 1978) (refer to PAM matrix
section), PAM350 or the Substitution matri-ces such as BLOSUM which are used for se-quence alignment of proteins. A Substitution matrix assigns a score for aligning any pos-sible pair of residues and must balance their values. Adopting a high gap plenty scheme will restrict the appearance of gaps within the alignment. On the other hand, a too low gap plenty scheme will allow the gaps to ap-pear everywhere in the alignment.
Genetic algorithm
Genetic algorithm is a type of iterative algorithms which allows an efficient and ro-bust search. In the search process, a genetic algorithm starts with an initial state (popula-tion) in the solution space and in every search step, it produces a new and usually a better set of solutions. At each stage, GA moves forward towards producing a better solution which may led to minimize the change of getting trapped into a local extre-ma (Michalewicz, 1992). Genetic algorithms are capable of handling large and complex scale problems (Jong, 1998). Some applica-tions of genetic algorithms for solving MSA problem can be found in (Goldberg, 1987; Grefenstette and Fitzpatrick, 1985; Hol-land,1975; Hillsdale and Lawrence, 1987; Buckles et al., 1990). The references cited above, explain the GA approach and its abil-ity to produce optimal solution for solving MSA problem of protein sequences. With addition to the above, there are various mer-its of genetic algorithms which can be uti-lized for prediction, alignment and classifica-tion of protein, DNA and RNA sequences and their structural and behavioral study (Dandekar and Argos, 1992; Unger and Moult, 1993; van Batenburg et al., 1995).
The major elements of genetic algorithm consists of representing a solution space, a fitness function, reproduction, crossover and mutation. In every step of GA operation, the genetic operators were applied to the solu-tion space in order to produce new and better individuals for coming generations. A search may terminate when no further improvement is observed in the coming generation as

EXCLI Journal 2015;14:1232-1255 – ISSN 1611-2156 Received: May 01, 2015, accepted: November 19, 2015, published: December 15, 2015
1237
compared to its previous one or when a pre-defined condition is met.
BAliBase
BAliBase dataset is considered to be the standard dataset for alignment of protein se-quences. It consists of variable lengths pro-tein sequences which includes 218 sets of sequences taken from different sources. Here, the sequences are differentiated based on their similarity and structure in PDB da-tabase (Neshich et al; 1998). To evaluate the quality of the obtained alignment, the BAli-Base defined two sets of score namely SP Score and TC Score.
PAM Matrix
PAM which stands for point accepted mutation is used for the replacement of ami-no acid in the primary structure of protein. This statement will not involve any point mutation in the DNA of an organism. In general, silent mutation is not considered to be a point accepted mutation or lethal muta-tion.
PAM matrices encode the evolutionary change recorded at the amino acid level and are known as amino acid substitution matri-ces. The PAM matrix is constructed in such a way, that it can easily compare two se-quences which are a specific number of PAM units apart. For example, the PAM120 score matrix is used to compare such se-quences which are 120 PAM units apart.
PROPOSED APPROACH
This section detailed about the proposed approach which is based on various parame-ters and are described below.
Representation and initial generation
In the proposed approach, the population is initially randomly generated at first. Based on the largest sequence size, the initially generated population is filled with a random gap sign to make the initially generated se-quences equals to the largest sequence in the set. Also, the gaps are inserted within the se-quences keeping in mind that the total size of
the gap does not exceed 25 % total length of the largest sequence. After the initialization process is over, the solution set is combined and then mutated for further operation so as to produce new individuals with a defined number of generations (iterations), which is 50 for this experimental study.
Scoring function
In this section, a formal definition of the sum-of-pairs of multiple sequence alignment is introduced which is used as a tool to cal-culate fitness.
Proteins or genes perform the same func-tion because of their similar sequences. DNA stores all genetic information of an organism while the Proteins act as the building blocks for all the cells. There are total 20 linear chain of amino acid for protein which are denoted as:
E,P,A,C,G,Q,V,M,T,R,K,W,Y,D,N,H,S,F,L and I.
Similarly, DNA is represented by four nucleotides namely A, C, G, T. Therefore, in general we usually represent protein and DNA sequence through a string of small al-phabetical letters. Here, for every protein se-quences the sum of scores based on their fit-ness functions is calculated. Obtaining a best alignment is dependent upon the scoring cri-teria followed in order to build that align-ment. Therefore, a scoring matrix know as the sum of pair score and the match column score is adopted to calculate the alignment scores between two characters within a col-umn (Otman et al., 2012). For the experiment, the gap penalty is taken as: J={E,P,A,C,G,Q,V,M,T,R,K,W,Y,D,N,H,S,F,L and I }

EXCLI Journal 2015;14:1232-1255 – ISSN 1611-2156 Received: May 01, 2015, accepted: November 19, 2015, published: December 15, 2015
1238
Equation (1) suggests that If p Є J and q = then the gap penalty is taken as 2. If p = and q Є J then the gap penalty is taken as 3. And if, p = and q = then the gap penalty will be taken as 1.
If p Є J and q Є J then use PAM 250 ma-trix. In case of match occurs refer to PAM 250 (Dayhoff et al., 1978) matrix available online.
Here, the gap penalty stated in equation 1 is user defined and will remain fix for a complete set of experiment. Here, the penal-ty for gap extension and opening is not same. Fitness evaluation
To judge the quality of different align-ments based on their scores, a fitness func-tion is proposed which is defined in equation 2.
For scoring purpose, PAM 250 Matrix has been used as a scoring matrix to calcu-late score between different alignments.
In the experiment the fitness is calculated as:-
Fitness = ∑ ∑ , .. (2) Where, n = number of sequences, li = first sequence, lj = second sequence
The score for each column in an align-ment is scored by summing the score of each pair of symbols. The overall alignment score is then calculated by using equation 1 and 2, which should be best possible maximum value.
Selection strategies description The selection methods used in this re-
search is here under: Sorting of individuals is done in the mat-
ing pool according to their fitness and then every two best individuals are selected for crossover.
Child generation
In order to generate a child population of 100 individuals in every generation, two ge-netic operators namely Crossover and Muta-tion have been considered for the experi-mental study, which are described below in details.
Crossover
Crossover operation is performed over the two strings of biological sequences by randomly selecting a cutting point and swap-ping the string from that point with a prede-fined probability.
Crossover operator I
As shown in Figure 2, this operator first chooses a column randomly in the parent alignments and defines a cut point there. Then by interchanging the different parts of parents it form two new offsprings, also known as Childs. For doing this type of op-eration gaps may be added to the resulting offsprings.
Crossover operator II
Same as in I and as described in Figure 3, this operator also chooses a point in the giv-en parent alignment and cuts the alignment from that point. Again by swapping different parts of parent alignment it produces child alignment by inserting gaps at required posi-tions.

EXCLI Journal 2015;14:1232-1255 – ISSN 1611-2156 Received: May 01, 2015, accepted: November 19, 2015, published: December 15, 2015
1239
Figure 2: One point crossover I
Figure 3: One point crossover II Mutation
After crossover, the strings are moved for mutation (Otman et al., 2012). Mutation pre-vents the algorithm to be trapped in a local minimum. It distributes the genetic infor-mation randomly among other individuals and helps to recover the lost genetic materi-als. Mutation operation involves randomly flipping of few bits in a chromosome. For example, the string 00100100 might be mu-tated in its second position to yield 01100100. Mutation operation can happen with very small probability at each bit posi-tion in a string.
The mutation operators are exclusively being used in this experimental study. As we
all know the mutation operators are used for regaining the lost genetic operator therefore, in this study the mutation operators are used with a very least probability of 0.01 to im-prove the overall quality of the sequences or for getting a good aligned sequences. In this approach, when the sequences are subjected for mutation operation, then flipping or swapping of nucleotides is being done within the sequences so as to improve the overall score of the alignment which ultimately re-sults in high quality solutions. Flipping or swapping of nucleotides and placing it to somewhere else in the sequences may results in improving the alignment quality of the se-quences. As matching of nucleotides in the

EXCLI Journal 2015;14:1232-1255 – ISSN 1611-2156 Received: May 01, 2015, accepted: November 19, 2015, published: December 15, 2015
1240
same row or column is possible by swapping or flipping of nucleotides. All the defined mutations operators are used one by one to check which of these operators gives a better result in terms of score. The operator which give the highest results is considered and rest are declined for that particular sequences (dataset).
All the different mutation operators de-fined were selected at a random basic to solve a given set of problem with a very small probability of 0.01. Here, in the pro-posed approach when one of the randomly selected mutation operator fails to given an optimal results, then a different mutation op-erators from the defined one is selected and applied to solve the given problem. All the proposed mutation operators for the experi-mental analysis are described below.
Exchange mutation operator
This mutation operator is explained in Figure 4 in which, the position of two nucle-otide (position 4 and 6) are exchanged which are randomly chosen.
Reverse mutation operator This mutation operator is clearly illus-
trated in Figure 5. Here, a sequence S has taken which is limited by two randomly cho-sen position 2 and 5. The order of nucleotide in this sequence will be reversed in the same order as covered in the previous operation.
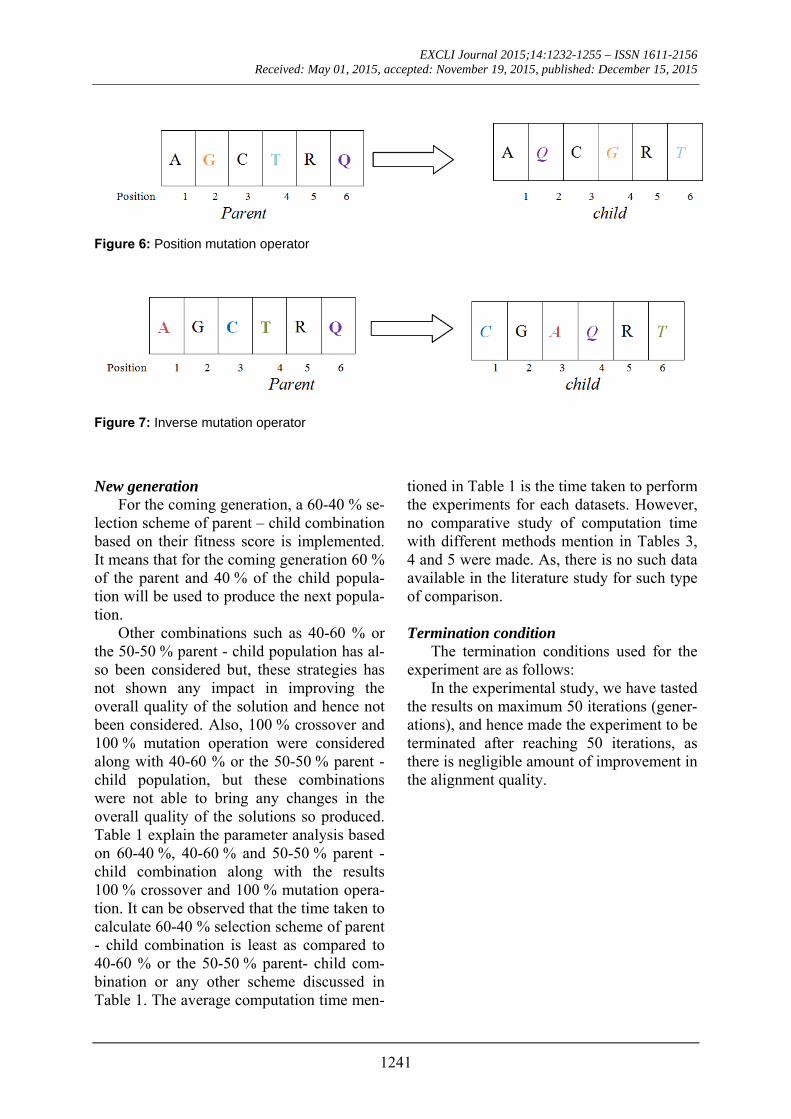
Position mutation operator
In this mutation operator, Three nucleo-tide were randomly chosen which shall take the different positions not necessarily suc-cessive 2 < 4 < 6. The nucleotide who is cur-rently at the position of 2 will take the posi-tion of 4 and one who was at 4 will take the position 6 and again the nucleotide holding this position currently will occupy the posi-tion of 2. Figure 6 demonstrate the processes discussed above.
Inverse mutation operator
In Figure 7, two sections of nucleotide were made by dividing the chromosomes in-to two sections. All nucleotide in each sec-tion are copied and are placed inversely in the same section of a child.
Figure 4: Exchange Mutation operator
Figure 5: Reverse Mutation operator
EXCLI Journal 2015;14:1232-1255 – ISSN 1611-2156 Received: May 01, 2015, accepted: November 19, 2015, published: December 15, 2015
1241
Figure 6: Position mutation operator
Figure 7: Inverse mutation operator
New generation
For the coming generation, a 60-40 % se-lection scheme of parent – child combination based on their fitness score is implemented. It means that for the coming generation 60 % of the parent and 40 % of the child popula-tion will be used to produce the next popula-tion.
Other combinations such as 40-60 % or the 50-50 % parent - child population has al-so been considered but, these strategies has not shown any impact in improving the overall quality of the solution and hence not been considered. Also, 100 % crossover and 100 % mutation operation were considered along with 40-60 % or the 50-50 % parent - child population, but these combinations were not able to bring any changes in the overall quality of the solutions so produced. Table 1 explain the parameter analysis based on 60-40 %, 40-60 % and 50-50 % parent - child combination along with the results 100 % crossover and 100 % mutation opera-tion. It can be observed that the time taken to calculate 60-40 % selection scheme of parent - child combination is least as compared to 40-60 % or the 50-50 % parent- child com-bination or any other scheme discussed in Table 1. The average computation time men-
tioned in Table 1 is the time taken to perform the experiments for each datasets. However, no comparative study of computation time with different methods mention in Tables 3, 4 and 5 were made. As, there is no such data available in the literature study for such type of comparison.
Termination condition
The termination conditions used for the experiment are as follows:
In the experimental study, we have tasted the results on maximum 50 iterations (gener-ations), and hence made the experiment to be terminated after reaching 50 iterations, as there is negligible amount of improvement in the alignment quality.

EXCLI Journal 2015;14:1232-1255 – ISSN 1611-2156 Received: May 01, 2015, accepted: November 19, 2015, published: December 15, 2015
1242
Table 1: Average Computation Times(s) comparison over Ref. 1, 2, 3, 4 and 5
Name of datasets
60-40 % parent–child combination
40-60 % parent–child combination
50-50 % parent–child combination
100 % Crossover 100 % Mutation
Corre-sponding BAliscore
Average Computa-tion Times
(s)
Corre-sponding BAliscore
Average Computa-tion Times
(s)
Corre-sponding BAliscore
Average Computa-tion Times
(s)
Corre-sponding BAliscore
Average Computa-tion Times
(s)
Corre-sponding BAliscore
Average Computa-tion Times
(s)
Ref. 1
1idy 0.452 234.20 0.357 347.76 0.284 367.98 0.335 286.21 0.402 254.36
1ar5A 0.986 567.00 0.786 678.98 0.796 689.87 0.721 632.87 0.685 617.00
1ad2 0.962 678.80 0.834 698.67 0.678 765.60 0.765 689.14 0.721 785.36
kinase 0.981 598.58 0.653 687.80 0.562 755.80 0.552 693.21 0.525 612.87
1krn 0.995 535.86 0.754 578.64 0.792 591.98 0.691 562.34 0.687 549.78
2myr 0.621 416.90 0.349 469.60 0.567 510.70 0.321 459.71 0.295 463.52
1ycc 0.898 490.78 0.756 534.87 0.617 576.81 0.712 521.69 0.756 526.66
3cyr 0.958 612.87 0.451 670.80 0.786 697.40 0.465 623.48 0.512 654.18
1taq 0.984 590.25 0.845 634.76 0.560 698.39 0.721 612.54 0.659 655.47
1ldg 0.752 498.80 0.879 387.89 0.789 567.76 0.552 512.46 0.502 510.24
1fieA 0.985 634.60 0.697 734.68 0.512 768.87 0.652 752.14 0.621 712.96
1sesA 0.994 529.75 0.876 598.87 0.823 619.70 0.763 593.15 0.715 603.21
2fxb 0.989 645.50 0.635 712.31 0.781 756.69 0.615 654.21 0.636 659.00
1amk 0.752 498.80 0.678 456.61 0.875 312.78 0.751 359.14 0.746 341.89
Ref. 3
1idy 0.668 398.78 0.451 465.60 0.542 470.68 0.386 235.14 0.412 320.58
1wit 0.587 378.82 0.865 267.90 0.798 456.64 0.524 269.48 0.652 301.25
1pamA 0.894 519.63 0.560 576.70 0.765 597.32 0.496 425.71 0.521 401.38
2myr 0.941 697.65 0.765 765.78 0.871 789.98 0.754 642.78 0.716 612.45
4enl 0.845 517.84 0.812 569.53 0.795 667.80 0.725 596.12 0.696 578.12
1ped 0.975 634.76 0.658 736.50 0.871 768.52 0.947 693.12 0.926 652.15

EXCLI Journal 2015;14:1232-1255 – ISSN 1611-2156 Received: May 01, 2015, accepted: November 19, 2015, published: December 15, 2015
1243
Table 1 (cont.): Average Computation Times(s) comparison over Ref. 1, 2, 3, 4 and 5
1r69 0.544 412.34 0.540 534.98 0.745 346.65 0.425 369.29 0.459 425.89
kinase 0.847 529.56 0.764 645.87 0.709 670.59 0.719 625.34 0.736 724.12
1ajsA 0.249 298.56 0.326 324.74 0.456 236.41 0.254 297.15 0.310 301.23
1uky 0.452 238.67 0.346 345.97 0.278 398.80 0.314 296.15 0.298 321.25
1ubi 0.579 478.54 0.512 572.84 0.484 589.75 0.458 521.48 0.448 498.27
Ref. 2
1lvl 0.812 428.32 0.752 459.25 0.756 563.49 0.726 496.17 0.754 456.21
4enl 0.929 614.14 0.863 638.20 0.863 635.24 0.652 647.19 0.602 635.65
1sbp 0.892 530.64 0.751 693.45 0.695 596.48 0.716 562.18 0.693 539.54
1cpt 0.836 651.27 0.795 633.78 0.658 752.31 0.858 521.35 0.745 698.14
3grs 0.793 522.89 0.655 693.41 0.589 596.29 0.612 542.31 0.579 584.76
Ref.4 1dynA 0.785 452.21 0.514 463.21 0.458 481.24 0.654 468.54 0.584 471.23
Ref.5 S51 0.597 421.58 0.519 435.12 0.536 486.74 0.541 453.28 0.584 493.17
Average Score 0.797 508.09 0.656 562.97 0.665 587.03 0.605 519.22 0.599 530.05

EXCLI Journal 2015;14:1232-1255 – ISSN 1611-2156 Received: May 01, 2015, accepted: November 19, 2015, published: December 15, 2015
1244
ALGORITHM FOR THE PROPOSED METHOD
Step 1 : Population initialization x1,x2,...,xn. Step 2 : Column(N) = 1.2 x nmax. Gaps (-) may be placed in the sequences for proper alignment. Step 3 : Compute fitness. Step 4 : Select individuals for genetic opera-tions. Two different genetic operators mainly crossover and mutation is used with proba-bility of 0.8 % and 0.01 %. Step 5 : Do crossover operation by randomly choosing any one of the defined crossover operator. Step 6 : Randomly choose and apply all of the defined mutation operator one by one. Step 7 : Check all the four solution quality, and choose the one who is the best among all four solutions in terms of scores. Step 8: New population generated and fitness evaluated. Step 9 : Stop if sufficient solution quality or max search terms reached, which is 50 itera-tion.
EXPERIMENTAL SET UP
This section gives an overview of the pa-rameters and the systems components used for the experiment.
Parameters setting for the experiment
The population size was established to 100 individuals and the maximum number of generations (iteration) was 50 with a crosso-ver probability of 0.8 %, mutation rate of 0.01 %. The scoring matrix used for the ex-periment is PAM 250 for each Protein se-quences. Here, the population size of 100 suggests that for each generation/iteration the algorithm runs for producing 100 childs with the help of proposed genetic operators. And among these 100 childs so produced, the two best childs based on their scores are selected to be the parents for the next genera-tion.
System components The main objective of this research work
is to observe the role of proposed crossover and mutation operators in solving MSA problem of protein sequences in terms of quality and scores of the sequence aligned. Here, quality of an aligned sequence is judged by the scores it obtains after success-fully aligning. In this study, the experiments for the proposed approach have been per-formed using genetic algorithm with C pro-gramming on an Intel Core 2 Duo processor having 2.53 GHz CPU with 2 GB RAM run-ning on the Linux platform.
RESULTS AND DISCUSSIONS
In this section, the experimental method-ology followed in this work is detailed. Moreover, results obtained with the proposed method are presented and discussed.
For all the tests, the different crossover and mutation operators are randomly chosen with equal probability of selection within each generation. To test the proposed ap-proach, the experiments are carried out with different datasets (ref. 1, ref. 2 and ref. 3) of different lengths from the BAliBase database (refer Table 2). The author used these da-tasets for the experimental study because of their performance with other related algo-rithm, which are gained by referring various literature studies (Devereux et al., 1984; Jagadamba et al., 2011; Nguyen and Yi, 2011; Razmara et al., 2009; Mott, 2005 ). As stated earlier, for every experiment the alignments were performed with the pro-posed method and were compared with the methods described in the literature study stated earlier.
For evolution of the proposed approach, the algorithm were executed for 50 inde-pendent run (iterations) for 30 datasets (some of all datasets in Table 3, 4 and 5) and then the best, average and the worst score were calculated. Table 2 indicates the best, aver-age and the worst score over different da-tasets with their corresponding BAliscores. As, the fitness score depends upon the level of similarity among the residue in the se-

EXCLI Journal 2015;14:1232-1255 – ISSN 1611-2156 Received: May 01, 2015, accepted: November 19, 2015, published: December 15, 2015
1245
quences therefore, the scores can be either positive or negative. Here, one point is to be noted that if the residues among the compa-rable sequences are similar, then small num-bers of gaps (“-”) are needed to make the se-quences aligned properly. On the other hand, if the majority of the residues are dissimilar then a large number of gaps are needed for necessary sequence alignment.
To analyze the quality and accuracy of solutions produced by the proposed ap-proach, we have considered a BAliscore, which is an open source program of the BAliBase benchmark. BAliBase scores a so-lution (multiple sequence alignment) be-tween 0.0 and 1.0. A score of 1.0 indicates that the solution is same or identical to that of manually created reference alignment. Unfortunately, with the proposed approach we are unable to get a score equals to 1(see Tables 3, 4 and 5). If the score is 0 then it in-dicates that nothing matches to the reference alignment. This can be observed with some of the datasets in Table 4 (reference 3).The score between 0 and 1 indicates that some part matches with the reference alignment. The scores which are closer to 1, gives a bet-ter alignment for a given dataset. A compari-son over different datasets with different methods is being made in Tables 3, 4 and 5. By referring to these tables, we can conclude that the proposed method solution is much more efficient than other methods in terms of scores as indicated in the tables. Figures 8, 9, 11, 12 and 14 shows comparative results be-tween the proposed and the other methods discussed in the literature review earlier. Figures 10, 13 and 15 indicates about the av-erage scores comparison among different methods and gives a clear indication about the superiority of the proposed approach over the others.
In order to evaluate the overall perfor-mance of the proposed method, the average score of all test cases were evaluated (bottom of Tables 3, 4 and 5). The average score sug-gest that the proposed method approach is
better among all other methods that are con-sidered. The score is calculated considering the standard BAliBase dataset. The bold faced data`s in the tables indicates the best scores among the methods.
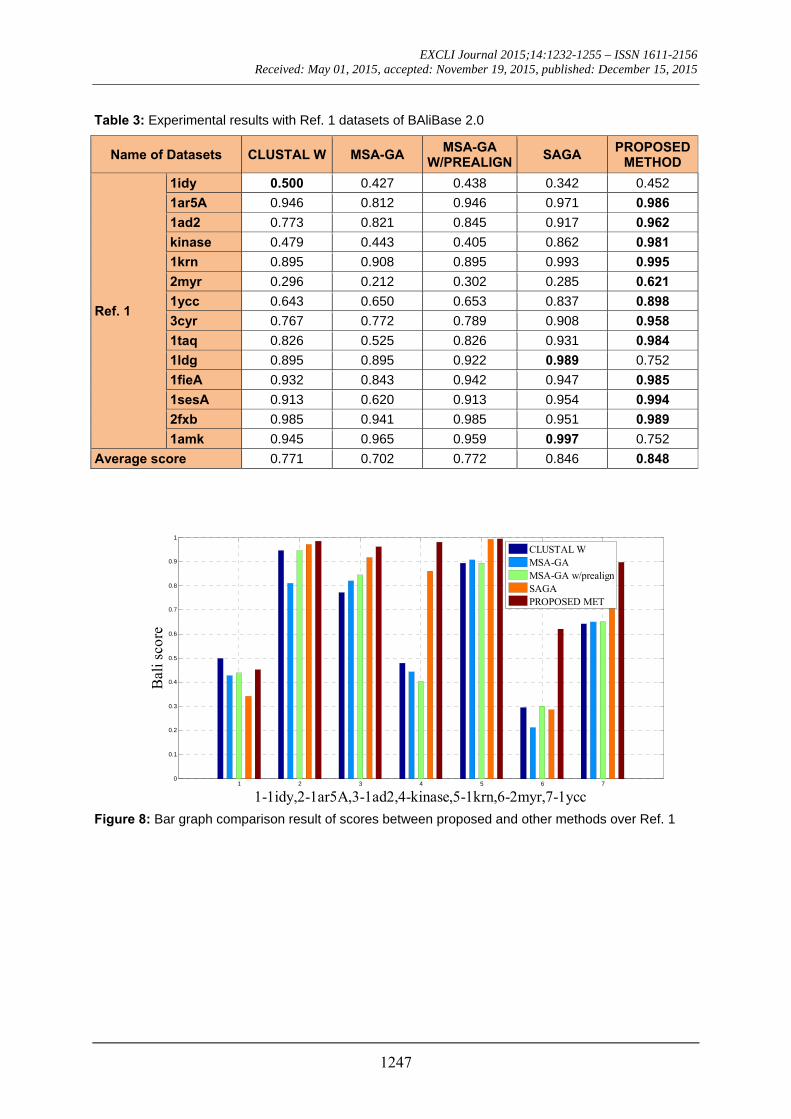
Performance of the proposed method with Ref. 1
The 14 datasets of reference 1 shown in Table 3 are of different lengths and sequenc-es (refer Table 2). In order to compare the proposed method with respect to BAliscore, the proposed approach were compared with that of CLUSTAL W,MSA-GA, MSA-GA w/ prealign and SAGA. From comparison in Figure 8 and 9, it can be seen that out of 14 test cases, the proposed method has success-fully overcome other methods solutions in 11 test cases and in three test cases, the pro-posed method solution were very close to the best.
Performance of the proposed method with Ref. 3
In this experimental study, eleven test cases were considered from references 3, again out of 11 test cases the proposed meth-od shows better solution for 9 test cases. On-ly, RBT-GA for 1wit dataset and PRRP for 1r69 dataset shows better performance than the proposed method. The results are provid-ed in Table 4 and Figure 11, 12 and 13.
Performance of the proposed method with Ref. 2
As detailed in Table 5 and Figure 14 and 15, five dataset from ref. 2 were considered for evaluating the proposed approach with some standard methods such as the CLUS-TAL X, SB-PIMA, HMMT, ML-PIMA and PILEUP8. Experiment on benchmarks (BAliBase 2.0) were conducted and observed that the proposed method technique is much efficient than the other compared ones.

EXCLI Journal 2015;14:1232-1255 – ISSN 1611-2156 Received: May 01, 2015, accepted: November 19, 2015, published: December 15, 2015
1246
Table 2: Summary of the test results of proposed method
Name of Datasets Sequence Number
Sequence Length
With Fitness Value Corre-sponding BAliscore Best Score
Worst Score
Avg. Score
Ref. 1
1idy 5 58 85.52 23.55 48.41 0.452
1ar5A 4 203 26.12 11.21 14.12 0.986
1ad2 4 213 54.77 31.25 39.44 0.962
kinase 5 276 61.47 34.25 43.24 0.981
1krn 4 82 -29.32 -62.47 -41.38 0.995
2myr 4 474 -64.78 -95.03 -71.28 0.621
1ycc 4 116 18.20 11.78 12.25 0.898
3cyr 4 109 34.88 28.86 32.20 0.958
1taq 5 928 624.07 356.25 425.57 0.984
1ldg 4 675 126.12 93.52 96.02 0.752
1fieA 5 442 -49.29 -74.37 -98.24 0.985
1sesA 5 63 389.78 171.98 201.25 0.994
2fxb 5 63 -89.74 -174.02 -154.58 0.989
1amk 5 258 63.41 41.02 49.78 0.752
Ref. 3
1idy 27 60 -365.75 -845.50 -475.57 0.668
1wit 19 102 -136.03 -352.41 -245.19 0.587
1pamA 19 511 -641.27 -987.13 -542.02 0.894
2myr 21 482 621.78 245.02 365.03 0.941
4enl 19 427 -25.45 -84.26 -39.89 0.845
1ped 21 388 -654.91 -954.17 -521.25 0.975
1r69 23 78 -524.78 -988.56 -632.03 0.544
kinase 18 287 355.55 212.58 312.89 0.847
1ajsA 28 396 -3654.27 -6524.59 -3714.67 0.249
1uky 24 220 -2579.36 -5241.60 -2546.18 0.452
1ubi 22 97 -542.87 -947.34 -521.64 0.576
Ref. 2
1cpt 15 434 532.14 230.45 321.45 0.836
1lvl 23 473 651.24 457.65 627.48 0.812
4enl 17 440 -321.48 -651.78 -451.21 0.929
1sbp 16 262 379.14 264.75 254.19 0.892
3grs 15 237 601.59 422.64 434.58 0.793
EXCLI Journal 2015;14:1232-1255 – ISSN 1611-2156 Received: May 01, 2015, accepted: November 19, 2015, published: December 15, 2015
1247
Table 3: Experimental results with Ref. 1 datasets of BAliBase 2.0
Name of Datasets CLUSTAL W MSA-GA MSA-GA
W/PREALIGNSAGA
PROPOSED METHOD
Ref. 1
1idy 0.500 0.427 0.438 0.342 0.452
1ar5A 0.946 0.812 0.946 0.971 0.986
1ad2 0.773 0.821 0.845 0.917 0.962
kinase 0.479 0.443 0.405 0.862 0.981
1krn 0.895 0.908 0.895 0.993 0.995
2myr 0.296 0.212 0.302 0.285 0.621
1ycc 0.643 0.650 0.653 0.837 0.898
3cyr 0.767 0.772 0.789 0.908 0.958
1taq 0.826 0.525 0.826 0.931 0.984
1ldg 0.895 0.895 0.922 0.989 0.752
1fieA 0.932 0.843 0.942 0.947 0.985
1sesA 0.913 0.620 0.913 0.954 0.994
2fxb 0.985 0.941 0.985 0.951 0.989
1amk 0.945 0.965 0.959 0.997 0.752
Average score 0.771 0.702 0.772 0.846 0.848
Figure 8: Bar graph comparison result of scores between proposed and other methods over Ref. 1
1 2 3 4 5 6 70
0.1
0.2
0.3
0.4
0.5
0.6
0.7
0.8
0.9
1
1-1idy,2-1ar5A,3-1ad2,4-kinase,5-1krn,6-2myr,7-1ycc
Bal
i sco
re
CLUSTAL W MSA-GAMSA-GA w/prealignSAGAPROPOSED MET

EXCLI Journal 2015;14:1232-1255 – ISSN 1611-2156 Received: May 01, 2015, accepted: November 19, 2015, published: December 15, 2015
1248
Figure 9: Bar graph comparison result of scores between proposed and other methods over Ref. 1
Figure 10: Average score comparison between proposed and other methods over Ref. 1
Figure 11: Bar graph comparison result of scores between proposed and other methods over Ref. 3
1 2 3 4 5 6 70
0.2
0.4
0.6
0.8
1
1-3cyr,2-1taq,3-lldg,4-1fieA,5-1sesA,6-2fxb,7-1amk
Bal
i sco
re
CLUSTAL W MSA-GA MSA-GA w/prealign SAGA PROPOSED METHOD
1 2 3 4 50
0.1
0.2
0.3
0.4
0.5
0.6
0.7
0.8
0.9
1-CLUSTAL X,2-MSA-GA,3-MSA-GA w/prealign ,4-SAGA,5-Proposed
Bal
i sc
ore
1 2 3 4 5 60
0.1
0.2
0.3
0.4
0.5
0.6
0.7
0.8
0.9
1
1-1idy,2-1wit,3-lpamA ,4-2myr,5-4enl,6-1ped
Bal
i sco
re
p p p
CLUSTAL X PRRP DIALI RBT-GA PILEUP8 PROPOSED MET.

EXCLI Journal 2015;14:1232-1255 – ISSN 1611-2156 Received: May 01, 2015, accepted: November 19, 2015, published: December 15, 2015
1249
Table 4: Experimental results with Ref. 3 datasets of BAliBase 2.0
Name of Datasets CLUSTAL X PRRP DIALI RBT-GA PILEUP8 PROPOSED
METHOD
Ref. 3
1idy 0.273 0.000 0.000 0.546 0.000 0.668
1wit 0.565 0.742 0.500 0.78 0.210 0.587
1pamA 0.678 0.683 0.683 0.525 0.754 0.894
2myr 0.538 0.646 0.272 0.33 0.310 0.941
4enl 0.547 0.736 0.050 0.68 0.498 0.845
1ped 0.627 0.679 0.641 0.425 0.722 0.975
1r69 0.524 0.905 0.524 0.374 0.000 0.544
kinase 0.720 0.783 0.650 0.697 0.599 0.847
1ajsA 0.163 0.128 0.000 0.18 0.110 0.249
1uky 0.130 0.139 0.139 0.35 0.083 0.452
1ubi 0.146 0.415 0.000 0.31 0.268 0.576
Average score 0.446 0.532 0.314 0.472 0.323 0.689
Figure 12: Bar graph comparison result of scores between proposed and other methods over Ref. 3
1 2 3 4 50
0.1
0.2
0.3
0.4
0.5
0.6
0.7
0.8
0.9
1
1-1r69,2-kinase,3-lajsA ,4-1uky,5-ubi
Bal
i sco
re
CLUSTAL X PRRPDIALIRBT-GAPILEUP8PROPOSED MET.

EXCLI Journal 2015;14:1232-1255 – ISSN 1611-2156 Received: May 01, 2015, accepted: November 19, 2015, published: December 15, 2015
1250
Figure 13: Average score comparison between proposed and other methods over Ref. 3
Table 5: Experimental results with Ref. 2 datasets of BAliBase 2.0
Name of Datasets CLUSTAL X SB−PIMA HMMT ML−PIMA PILEUP8 PROPOSED
METHOD
Ref. 2
1cpt 0.66 0.184 0.388 0.277 0.688 0.836
1lvl 0.746 0.62 0.539 0.688 0.678 0.812
4enl 0.375 0.096 0.213 0.092 0.224 0.929
1sbp 0.217 0.043 0.214 0.054 0.177 0.892
3grs 0.192 0.183 0.141 0.211 0.159 0.793
Average score 0.438 0.225 0.299 0.264 0.385 0.852
Figure 14: Bar graph comparison result of scores between proposed and other methods over Ref. 2
1 2 3 4 5 60
0.1
0.2
0.3
0.4
0.5
0.6
0.7
1-CLUSTAL X,2-PRRP,3- DIALI ,4-RBT-GA,5-PILEUP8, 6-PROPOSED
Bal
i sc
ore
1 2 3 4 5 60
0.1
0.2
0.3
0.4
0.5
0.6
0.7
0.8
0.9
1
1-1cpt , 2-1lvl,3-4enl,4- 1sbp,5-3grs
Bal
isco
re
CLUSTAL X SB-PIMA HMMT ML-PIMA PILEUP8 PROPOSED METHOD

EXCLI Journal 2015;14:1232-1255 – ISSN 1611-2156 Received: May 01, 2015, accepted: November 19, 2015, published: December 15, 2015
1251
Figure 15: Average score comparison between proposed and other methods over Ref. 2
Performance characterization of proposed algorithm
Two different components namely the proposed genetic operators and random pop-ulation initialization plays an important role in making the performance of the proposed algorithm better than other algorithms. Two different set of experiments have been de-signed in order to investigate the perfor-mance of the proposed algorithm. In the first case, a different approach for population ini-tialization is adopted (different than the pro-posed scheme). Here, the proposed algorithm was made to run with a randomly generated population, constructed with the help of guide tree. In the second case, a hill climbing approach (Huiying and Zheng, 2013) (for searching instead of proposed algorithm) has been used, which starts from the same ran-dom initial population used in this work. The fitness evaluation scheme will remain the same as discussed in the proposed approach section. A total of fifteen BAliBase datasets (five from each ref 1, 2 and 3) is considered for the experiments. Each datasets was made to run with the proposed algorithm (with two different cases stated above) for fifty itera-tions. Based on the BAliBase score the best scores were recorded, and it was analyzed that the proposed algorithm with random ini-tial population generation outperformed the guide tree initial generation technique for all the datasets. The average improvement of
9.72 % was recorded with randomly generat-ed population. Similarly, with hill climbing approach the proposed algorithm was rec-orded with an average improvement of 7.23 %. Thus, with the above discussions we can say that the proposed algorithm with randomly generated initial population and proposed genetic operator is superior to other algorithm in terms of performances. The de-tail experimental results are available in Ta-ble 6.
CONCLUSION
As we all know that the multiple se-quence alignment is a known problem in bio-informatics, but still MSA remains a chal-lenging task to explore. The arrangement of molecular sequences within an alignment to find similarities and differences among them is not an easy task, due to the complex size of the sequences and the search space. Be-cause of the ability to handle complex scale problems, genetic algorithm is used as a genuine solution for the multiple sequence alignment problem. In this paper, a novel approach has been developed, which uses genetic algorithm for performing multiple sequence alignment. The motive of the study reported in this paper is to judge the efficien-cy of the proposed approach by comparing it with different algorithm over standard da-tasets. In order to evaluate the efficiency and
1 2 3 4 5 60
0.1
0.2
0.3
0.4
0.5
0.6
0.7
0.8
0.9
Bal
isco
re
1-CLUSTAL -X,2-SB-PIMA,3-HMMT,4-ML-PIMA,5-PILEUP 8,6-PROPOSED METHOD

EXCLI Journal 2015;14:1232-1255 – ISSN 1611-2156 Received: May 01, 2015, accepted: November 19, 2015, published: December 15, 2015
1252
Table 6: Performance evaluation of the proposed algorithm with hill climbing approach and randomly generated population through guide tree
Name of the Datasets
Proposed Algorithm (BAliscore)
Hill Climbing (BAliscore)
Proposed Algorithm with randomly generated population through
Guide Tree (BAliscore)
Ref. 1
1ar5A 0.986 0.917 0.937
1ycc 0.898 0.823 0.844
1ldg 0.752 0.694 0.716
1taq 0.984 0.905 0.917
1krn 0.995 0.879 0.928
Ref. 2
1cpt 0.836 0.925 0.951
1lvl 0.812 0.389 0.406
4enl 0.929 0.315 0.337
1sbp 0.892 0.665 0.697
3grs 0.793 0.295 0.287
Ref. 3
1ajsA 0.249 0.204 0.219
1idy 0.668 0.528 0.516
2myr 0.941 0.902 0.932
1ped 0.975 0.924 0.941
1ubi 0.576 0.514 0.529
Average Score 0.723 0.660 0.678
Average performance improvement of proposed algorithm in term of percentage ( %)
9.72 % 7.23 %
feasibility of the proposed approach, a benchmark datasets from BAliBase 2.0 is considered, because most of the methods discussed in this paper uses BaliBase da-tasets to access the quality of the multiple sequence alignments. When compared to other methods listed in (Notredame and Hig-gins,1996; Gondro and Kinghorn, 2007; Taheri and Zomaya, 2009; Thompson et al., 1997; Eddy, 1995; Gotoh, 1996; Devereux et al., 1984; Morgenstern et al., 1996), the pro-posed method improves the overall quality of the alignment. The experimental result pro-vides a better scope for multiple sequences alignment, as there is an increase in the alignment quality, which can be observed by the scores of different datasets. It was also observed that the proposed method solution gives some unsatisfied results in some test cases. By the above discussions, we can easi-ly conclude that the innovative approach adopted in this paper gives a better and im-
proved result when compared with other methods in most of the testcases.
REFERENCES
Aniba MR, Poch O. Thompson JD. Issues in bioin-formatics benchmarking: the case study of multiple sequence alignment. Nucleic Acids Res. 2010;38: 7353–63.
Ankit A, Huang X. Pairwise statistical significance of local sequence alignment using substitution matrices with sequence-pair-specific distance. Proc Int Conf Inform Technol. 2008:94-9.
Auyeung A, Melcher U. Evaluations of protein se-quence alignments using structural information. Int Conf Inform Technol: Coding and Computing. 2005;2:748-9.
Bhattacharjee A, Sultana KZ, Shams Z. Dynamic and parallel approaches to optimal evolutionary tree con-struction. Can Conf Electr Comp Engin. 2006:119-2.
Blackshields G, Wallace IM, Larkin M, Higgins DG. Analysis and comparison of benchmarks for multiple sequence alignment. In Silico Biol. 2006;6:321–39.

EXCLI Journal 2015;14:1232-1255 – ISSN 1611-2156 Received: May 01, 2015, accepted: November 19, 2015, published: December 15, 2015
1253
Buckles BP, Petry FE, Kuester RL. Schema survival rates and heuristic search in genetic algorithms. Proc Tools Artificial Intelligence. Los Alamitos CA: IEEE Comput Soc Press, 1990.
Cai L, Juedes D, Liakhovitch E. Evolutionary compu-tation techniques for multiple sequence alignment. Proc CEC. 2000:829–35.
Changjin H, Tewfik AH. Heuristic reusable dynamic programming: efficient updates of local sequence alignment. IEEE/ACM Trans Comput Biol Bioin-form. 2009;6:570-82.
Dandekar T, Argos P. Potential of genetic algorithms in protein folding and protein engineering simula-tions. Protein Eng. 1992;5:637–45.
Dayhoff MO, Schwartz RM, Orcutt BC. A model of evolutionary change in proteins. Atlas Protein Se-quence Structure.1978;5:345–51.
Devereux J, Haeberli P, Smithies O. A comprehensive set of sequence analysis programs for the VAX. Nu-cleic Acids Res. 1984;12:387–95.
Dongardive J, Abraham S. Finding consensus by se-quence evolution: An application of differential evo-lution. World Congress on Information and Commu-nication Technologies. 2012:248-53.
Eddy SR. Multiple alignment using hidden Markov models. Proc Int Conf Intell Syst Mol Biol. 1995;3: 114–20.
Eddy S. Profile hidden Markov models. Bioinformat-ics. 1998;14:755–63.
Feng DF, Dolittle RF. Progressive sequence align-ment as a prerequisite to correct phylogenetic trees. J Mol Evol. 1987;25:351–60.
Gelly JC, Joseph AP, Srinivasan N, Brevern AG. iPBA: a tool for protein structure comparison using sequence alignment strategies. Nucleic Acids Res. 2011;39:18–23.
Gondro C, Kinghorn BP. A simple genetic algorithm for multiple sequence alignment. Genet Mol Res. 2007;6:964–82.
Goldberg DE. Simple genetic algorithms and the min-imal, deceptive problem. Genetic Algorithms and Simulated Annealing. 1987:74–8.
Gotoh O. An improved algorithm for matching bio-logical sequences. J Mol Biol. 1982;162:705-8.
Grefenstette JJ, Fitzpatrick JM. Genetic search with approximate function evaluations. Proc Int Conf Ge-netic Algorithms Appl. 1985:112–20.
Hamidi S, Naghibzadeh M, Sadri J. Protein multiple sequence alignment based on secondary structure sim-ilarity. International Conference on Advances in Computing, Communications and Informatics. 2013:1224-9.
Haoyue F, Dingyu X, Zhang X, Cangzhi J. Conserved secondary structure prediction for similar highly group of related RNA sequences. Control and Deci-sion Conference. 2009:5158-63.
Hicks S, Wheeler DA, Plon SE, Kimmel M. Predic-tion of missense mutation functionality depends on both the algorithm and sequence alignment employed. Hum Mutat. 2011;32:661–8.
Hillsdale NJ, Lawrence E. Genetic algorithms and classifier systems: foundations and future directions genetic algorithms their applications. Proc 2nd Int Conf Genetic Algorithms. 1987:82-9.
Holland JH. Adoption in natural and artificial sys-tems. Ann Arbor, MI: Univ. Michigan Press,1975.
Huiying X, Zheng Z. Hill-climbing genetic algorithm optimization in cognitive radio decision engine. IEEE Int Conf Commun Technol. 2013:17-9.
Jagadamba PVSL, Babu MSP, Rao AA. An improved algorithm for multiple sequence alignment using par-ticle swarm optimization. IEEE 2nd International Conference on Software Engineering and Service Sci-ence (ICSESS). 2011:544-7.
Jong K. Learning with genetic algorithms: An over-view. Machine learning 3 (pp 121-38). Hingham, MA: Kluwer, 1988.
Katoh K, Kuma K, Toh H, Miyata T. MAFFT version 5: Improvement in accuracy of multiple sequence alignment. Nucleic Acids Res. 2005;33:511-8.
Kececioglu J, Starrett D. Aligning alignments exactly. RECOMB. 2004.
Kimura M. A simple method for estimating evolu-tionary rates of base substitutions through compara-tive studies of nucleotide sequences. J Mol Evol. 1980;16:111–20.
Kirkpatrick S, Gelatt, JCD, Vecchi MP. Optimization by simulated annealing. Science 220;1983:671–80.
Kupis P, Mandziuk J.Evolutionary-progressive meth-od for multiple sequence alignment. IEEE Symposi-um on Computational Intelligence and Bioinformatics and Computational Biology. 2007:291-7.

EXCLI Journal 2015;14:1232-1255 – ISSN 1611-2156 Received: May 01, 2015, accepted: November 19, 2015, published: December 15, 2015
1254
Layeb A, Deneche AH. Multiple sequence alignment by immune artificial system. IEEE/ACS International Conference on Computer Systems and Applications. 2007:336-42.
Löytynoja A, Goldman N. Phylogeny-aware gap placement prevents errors in sequence alignment and evolutionary analysis. Science. 2008;320:1632–5.
Li M, Ma B, Kisman D, Tromp J. Pattern Hunter II: highly sensitive and fast homology search. J Bioin-form Comput Biol. 2004;2:417-39.
Ma B, Tromp J, Li M. Pattern Hunter: faster and more sensitive homology search. Bioinformatics. 2002;18: 440-5.
Michalewicz Z. Genetic Algorithms + Data Structures = Evolution Programs. New York: Springer-Verlag, 1992.
Mohsen B, Balaji P, Devavrat S, Mayank S. Iterative scheduling algorithms. IEEE INFOCOM Proc. 2007.
Morgenstern B, Dress A, Werner T. Multiple DNA and protein sequence alignment based on segment-to-segment comparison. Proc Natl Acad Sci USA. 1996; 93:12098–103.
Mott R. Alignment: statistical significance. Encyclo-pedia Life Science. 2005.
Naznin F, Sarker R, Essam D. Progressive alignment method using genetic algorithm for multiple sequence alignment. IEEE Transactions on Evolutionary Com-putation. 2012;16:615-31.
Needleman SB, Wunsch CD. A general method appli-cable to the search for similarities in the amino acid sequence of two proteins. J Mol Biol.1970;48:443–53.
Neshich G, Togawa R, Vilella W, Honig B. STING (Sequence to and withIn graphics). PDB viewer. Pro-tein Data Bank Quart Newslett. 1998;85:6-7.
Nguyen KD, Yi P. An improved scoring method for protein residue conservation and multiple sequence alignment. IEEE Transactions on NanoBiosci-ence.2011;10:275-85.
Notredame C, Higgins DG. SAGA: Sequence align-ment by genetic algorithm. Nucleic Acids Res. 1996; 24:1515–24.
Notredame C, Higgins DG, Heringa J. T-coffee: A novel method for fast and accurate multiple sequence alignment. J Mol Biol. 2000;302:205–17.
Otman A, Jaafar A. Chakir TAJANI analyzing the performance of mutation operators to solve the travel-ling salesman problem. Int J Emerging Sciences. 2012;2:61-7.
Pearson WR. Flexible sequence similarity searching with the FASTA3 program package. Methods Mol Biol. 2000;132:185-219.
Pei J, Grishin N. PROMALS: towards accurate multi-ple sequence alignments of distantly related proteins. Bioinformatics. 2007;23:802–8.
Peng Y, Dong C, Zheng H. Research on genetic algo-rithm based on pyramid model. 2nd International Symposium on Intelligence Information Processing and Trusted Computing. 2011:83-6.
Pengfei G, Xuezhi Wa, Yingshi H. The enhanced ge-netic algorithms for the optimization design. 3rd In-ternational Conference on Biomedical Engineering and Informatics. 2010;7:2990-4.
Pop M, Salzberg SL. Bioinformatics challenges of new sequencing technology. Trends Gene. 2008;24: 142–9.
Razmara J, Deris SB, Parvizpour S. Text-based pro-tein structure modeling for structure comparison. In-ternational Conference of Soft Computing and Pattern Recognition. 2009:490-6.
Sellers PH. Pattern recognition in genetic sequences by mismatch density. Bull Math Biol. 1984;46;501-14.
Smith RF, Smith TF. Pattern-induced multi-sequence alignment (PIMA) algorithm employing secondary structure-dependent gap penalties for use in compara-tive protein modelling. Protein Eng. 1992;5:35–41.
Taheri J, Zomaya AY. RBT-GA: A novel metaheuris-tic for solving the multiple sequence alignment prob-lem. BMC Genomics. 2009;10:1–11.
Taylor WR. Protein structure comparison using SAP. Methods Mol Biol. 2000;143:19–32.
Thompson JD, Higgins DG, Gibson TJ. CLUSTAL W: Improving the sensitivity of progressive multiple sequence alignment through sequence weighting, po-sition-specific gap penalties and weight matrix choice. Nucleic Acids Res. 1994;22;4673–80.
Thompson JD, Gibson TJ, Plewniak F, Jeanmougin F, Higgins DG. The CLUSTAL−X windows interface: Flexible strategies for multiple sequence alignment aided by quality analysis tools. Nucleic Acids Res. 1997;25:4876–82.

EXCLI Journal 2015;14:1232-1255 – ISSN 1611-2156 Received: May 01, 2015, accepted: November 19, 2015, published: December 15, 2015
1255
Thompson JD, Plewniak F, Poch O. A comprehensive comparison of multiple sequence alignment programs. Nucleic Acids Res. 1999;27:2682–90.
Thompson JD, Linard B, Lecompte O, Poch O. A comprehensive benchmark study of multiple sequence alignment methods: current challenges and future per-spectives. PLoS ONE. 2011;6(3):e18093.
Ulder NLJ, Aarts EHL, Bandelt HJ, Van Laarhoven PJM, Pesch E. Genetic local search algorithms for the traveling salesman problem. Proc 1st Workshop PPSN. 1991;496:109–16.
Unger R, Moult J.Genetic algorithms for protein fold-ing simulations. J Mol Biol. 1993;231:75–81.
van Batenburg FHD, Gultyaev AP, Pleij CWA. An APL programmed genetic algorithm for the prediction of RNA secondary structure. J Theor Biol. 1995;174: 269–80.
Wei-C C, Yu JC, Chien CC, Der TL, Jan MH. Opti-mizing a map reduce module of preprocessing high-throughput DNA sequencing data. IEEE International Conference on Big Data. 2013:6-9.
Weiwei G, Sanzheng Q. Multithreaded implementa-tion of a biomolecular sequence alignment algorithm-software/information technology. Canadian Confer-ence on Electrical and Computer Engineering. 2000;1;494-8.
Wen WC, Tan HT. Statistical characterization of error sequences and its applications to error control. Pro-ceedings of Digital Signal Processing Applications. 1996;2:625-9.
Wong WC, Maurer Stroh S, Eisenhaber F. More than 1,001 problems with protein domain databases: transmembrane regions, signal peptides and the issue of sequence homology. PLoS Comput Biol. 2010; 6(7):e1000867.
Yonghua H, Bin M, Kaizhong Z. SPIDER: software for protein identification from sequence tags with de novo sequencing error. Proceedings of Computational Systems Bioinformatics Conference. 2004;206-15.
Zhang E, Wong AKC. A genetic algorithm for multi-ple molecular sequence alignment. Comput Applicat Biosci. 1997;13:565–81.
Zhimin Zh, Zhong WC. Dynamic programming for protein sequence alignment. Int BioScience Bio Technol. 2013:5.


![A SIMPLIFIED DOLPHIN ECHOLOCATION OPTIMIZATION …ijoce.iust.ac.ir/article-1-183-en.pdf · Optimization algorithm (CBO) [12] and Enhanced colliding bodies optimization [13]. Recently,](https://img.dokumen.tips/doc/110x75/5edec40dad6a402d666a1d84/a-simplified-dolphin-echolocation-optimization-ijoceiustacirarticle-1-183-enpdf.jpg)