Embed Size (px)
Citation preview

HAL Id: hal-03140925https://hal.archives-ouvertes.fr/hal-03140925
Submitted on 14 Feb 2021
HAL is a multi-disciplinary open accessarchive for the deposit and dissemination of sci-entific research documents, whether they are pub-lished or not. The documents may come fromteaching and research institutions in France orabroad, or from public or private research centers.
L’archive ouverte pluridisciplinaire HAL, estdestinée au dépôt et à la diffusion de documentsscientifiques de niveau recherche, publiés ou non,émanant des établissements d’enseignement et derecherche français ou étrangers, des laboratoirespublics ou privés.
Origin of the inertial deviation from Darcy’s law: Aninvestigation from a microscopic flow analysis on
two-dimensional model structuresMehrez Agnaou, Didier Lasseux, Azita Ahmadi
To cite this version:Mehrez Agnaou, Didier Lasseux, Azita Ahmadi. Origin of the inertial deviation from Darcy’s law: Aninvestigation from a microscopic flow analysis on two-dimensional model structures. Physical ReviewE , American Physical Society (APS), 2017, 96 (4), �10.1103/PhysRevE.96.043105�. �hal-03140925�

PHYSICAL REVIEW E 96, 043105 (2017)
Origin of the inertial deviation from Darcy's law: An investigation from a microscopic flow analysis
on two-dimensional model structures
Mehrez Agnaou,* Didier Lasseux,t and Azita Ahmadi CNRS, ENSAM, University of Bordeaux, JPB-l2M, UMR5295, Esplanade des Arts et Metiers, 33405 Talence Cedex, France
Inertial flow in porous media occurs in many situations of practical relevance among which one can cite flows in column reactors, in filters, in aquifers, or near wells for hydrocarbon recovery. It is characterized by a deviation from Darcy's law that leads to a nonlinear relationship between the pressure drop and the filtration velocity. In this work, this deviation, also known as the nonlinear, inertial, correction to Darcy's law, which is subject to controversy upon its origin and dependence on the filtration velocity, is studied through numerical simulations. First, the microscopic flow problem was solved computationally for a wide range of Reynolds numbers up to the limit of steady flow within ordered and disordered porous structures. In a second step, the macroscopic characteristics of the porous medium and flow (permeability and inertial correction tensors) that appear in the macroscale model were computed. From these results, different flow regimes were identified: ( 1) the weak inertia regime where the inertial correction has a cubic dependence on the filtration velocity and (2) the strong inertia (Forchheimer) regime where the inertial correction depends on the square of the filtration velocity. However, the existence and origin of those regimes, which depend also on the microstructure and flow orientation, are still not well understood in terms of their physical interpretations, as many causes have been conjectured in the literature. In the present study, we provide an in-depth analysis of the flow structure to identify the origin of the deviation from Darcy's law. For accuracy and clarity purposes, this is carried out on two-dimensional structures. Unlike the previous studies reported in the literature, where the origin of inertial effects is often identified on a heuristic basis, a theoretical justification is presented in this work. Indeed, a decomposition of the convective inertial term into two components is carried out formally allowing the identification of a correlation between the flow structure and the different inertial regimes. These components correspond to the curvature of the flow streamlines weighted by the local fluid kinetic energy on the one hand and the distribution of the kinetic energy along these lines on the other hand. In addition, the role of the recirculation zones in the occurrence and in the form of the deviation from Darcy's law was thoroughly analyzed. For the porous structures under consideration, it is shown that ( 1) the kinetic energy lost in the vortices is insignificant even at high filtration velocities and (2) the shape of the flow streamlines induced by the recirculation zones plays an important role in the variation of the flow structure, which is correlated itself to the different flow regimes.
DOI: I 0.1103/PhysRevE.96.043105
I. INTRODUCTION
Creeping flow in porous media, where viscous forces are dominant compared to inertial ones, is generally characterized by Reynolds numbers Red < 1 with Red = Pl(v)ld.
In this
a nondeformable porous medium, in isothermal conditions, in a one-dimensional form, by
definition, I (v) I is the magnitude of the filtration velocity of the fluid phase {3, p and /L are, respectively, the density and the dynamic viscosity of the {3-phase, and d, the reference length, can be considered as the average grain diameter. In porous media, a flow in the creeping regime (also known as the Darcy regime) is generally modeled at the macroscopic scale by means of Darcy's law. It describes a linear relationship between the pressure drop and the filtration velocity and was derived empirically first [I]. This law has been widely used for more than 150 years in a broad range of fields, especially in hydrology, petroleum engineering, and chemical engineering. Later several works provided a theoretical justification for Darcy's law by means of different up-scaling techniques [2-6]. It is given for an incompressible Newtonian fluid {3, saturating
*[email protected]; Also at the University of Waterloo,Waterloo, Ontario, Canada.
(1)
where a(p)f! /ax, (vx), and gx are, respectively, the gradient of the average pressure, the filtration velocity of the fluid {3, and the gravitational acceleration along the x axis, k being the permeability of the porous medium.
As the Reynolds number becomes larger, the inertial forces are no longer negligible and Darcy's law loses accuracy. Many studies treated the upper limit of the validity of Darcy's law. The limit Reynolds number ranges from I to IO according to different authors [7-9]. Above this limit, the flow becomes inertial after a gradual transition [9] but remains steady and laminar.
Many situations of practical relevance can be raised where the inertial effects may be important and Darcy's law becomes invalid. Among these situations, one can cite flows in column reactors, in filters, in aquifers, in soil remediation, and near hydrocarbon recovery wells, for instance. Forchheimer was the first to propose an equation derived empirically [10] to describe inertial flow in porous media at the macroscopic scale. Forchheimer's equation consists of Darcy's law to which

MEHREZ AGNAOU, DIDIER LASSEUX, AND AZITA AHMADI
correction terms are introduced to account for inertia leading to a nonlinear relationship between the filtration velocity and the macroscopic pressure gradient. After Forchheimer's works, several studies focused on modeling rapid flows in porous media [2,11-18] and consolidated the Forchheimer's equation type. This latter equation can be given, in one dimension, under the following form:
B(p)13
1-l 2 2 3 � = -k(vx) - pfJ(vx) - p y(vx) , (2)
where f3 and y are parameters intrinsic to the porous medium. The quadratic correction in Eq. (2) is the Forchheimer correction and was confirmed by different authors [19,20]. Equation (2) is also valid for creeping flow, where it reduces to Darcy's law, and steady laminar inertial flow regimes. The steady inertial flow in porous media is then followed by a quasiperiodic regime and turbulent flow at higher Reynolds numbers [21]. Many efforts have been made in order to classify the inertial flow in porous media into different subregimes depending on the form of the inertial correction. A generally accepted classification distinguishes the following three inertial regimes:
(1) Weak inertia regime [18,20,22] where the inertialcorrection scales as ( v x ) 3 . It appears at the onset of the nonlinearity in the flow. It must be emphasized here that, even if this regime was identified by almost all authors [23-32], it is generally ignored in practical situations, as in petroleum engineering, due to its short range of validity compared to the other inertial regimes for flow in natural porous media. In fact, some authors discussed the existence of this regime and considered it as a transition to strong inertia regime [33].
(2) Strong inertia regime, also known as Forchheimerregime, where the correction scales as ( v x) 2. It occurs at Reynolds number values between 1 and 10, but its existence and range of validity remain controversial. Recent works demonstrated that this regime is not identified for all flow configurations and depends strongly on the microstructure and the orientation of the macroscopic pressure gradient [24,29,30,32].
(3) At Reynolds numbers above the limit of validity of theForchheimer regime, some authors identified a third inertial regime. The existence of a regime above strong inertia, called "transition to turbulence regime," was reported [34,35]. The occurrence of this regime was confirmed later [24,36] characterized by different inertial correction forms depending on the morphology of the porous medium [34]. In summary, the existence of those regimes and their range of validity are strongly dependent on the microstructure and the flow [24,29,30,32], thus requiring more investigation to understand the phenomena that trigger their apparition. Furthermore, even the precise origin of the deviation from Darcy's law itselfremains controversial. Indeed, many postulates have been put forth to explain the origin of inertial effects.
The origin of the deviation from Darcy's law was first attributed to turbulence [37]. It has been supported by different authors [38,39] until a study indicated that the onset of turbulence in porous media was not enough to explain the deviation from Darcy's law [19]. Subsequently, different authors supported this latter idea after observing deviations from Darcy's law in the laminar flow regime [20,40,41].
Various origins of the deviation were mentioned in a heuristic way in the literature. Among them, one can mention pore roughness [ 42,43], loss of kinetic energy in restrictions and constrictions [44], development of inertial cores [9,45], bends in the flow paths [46], formation of a hydrodynamic boundary layer [15], change in spatial distribution of the kinetic energy within the structure [ 4 7], flow tortuosity [ 48], and pore-throat curvature [ 49]. Some authors distinguished contributions due to linear losses in pores and channels and quadratic losses in contractions and expansions [50].
Furthermore, more precise physical justifications of the deviation from Darcy's law were given. Indeed, they stated that, at the onset of nonlinearities, macroscopic inertial forces are negligible compared to microscopic ones [13,15] that are themselves larger than viscous ones [51,52]. A dependence between microscopic inertial and viscous origins of the nonlinearity was also reported. In fact, inertial effects contribute to the change of the microscopic streamlines shapes and flow patterns in pore space, causing positive nonlinear changes in the microscopic drag forces [51]. The microscopic inertial origin of the deviation from Darcy's law is generally accepted [ 14,53]. However, the existence and origin of different inertial regimes are still not well understood in terms of their physical interpretations, which is the motivation of this work.
The present study was carried out considering twodimensional (2D) ordered and disordered model porous structures (see Fig. 1). Since the objective is to capture the physical mechanisms at play to explain the occurrence of the different regimes, 2D configurations were used in this work. This is further motivated by the fact that accurate numerical simulations are tractable, and their results can be more easily and more clearly interpreted in that case. Moreover, a thorough analysis of 2D and three-dimensional (3D) configurations showed that the deviation from Darcy's law resulting from inertia exhibits the same behavior in both cases [32]. The ordered structures, referred to as OS (OC), correspond to ordered arrays of parallel cylinders of square (circular) cross sections. The disordered structures, referred to as DS (DC), were obtained from a random placement of the cylinders in each original unit cell of the OS (OC) following a procedure described earlier [24]. All porous media have a porosity of 7 5%. The choice of such a high porosity is motivated by the fact that inertial effects are stronger when the porosity increases for a given value of the macroscopic pressure gradient applied to the structure [23]. This article is organized as follows:
(1) The nonlinear, inertial, correction to Darcy's law forthe stationary inertial and incompressible flow of a single phase Newtonian fluid through the model porous structures of Fig. 1 was obtained numerically. The effective properties appearing in the macroscopic model [15], resulting from the volume averaging of the mass and momentum (Navier-Stokes) equations at the pore scale, were determined by means of the resolution of the closure problem resulting from the up-scaling procedure. The physical model and the numerical method adopted for its resolution are presented in Sec. IL
(2) The results of the numerical simulations are presentedin Sec. III. The different inertial regimes are first investigated for the considered model porous structures. The dependence of the correction to Darcy's law on the microstructure and on the orientation of the macroscopic pressure gradient is then

ORIGIN OF THE INERTIAL DEVIATION FROM DARCY's ...
fluid phase f3 8olid phase
(J"
fluid pha8e /3
(b) ( c) (d)
FIG. 1. 2D model structures of porous media corresponding to ordered (a, b) and disordered (c, d) arrays of parallel cylinders of square (a, c) and circular (b, d) cross sections. (a) OS, (b) OC, (c) DS, and (d) DC. Representative elementary volume (REV) made of 1 x 1 (a, b) and30 x 30 (c, d) geometrical unit cells. Porosity E = 75%.
discussed. In a final step, since the deviation from Darcy's law has microscopic origins as mentioned earlier, attention is focused on the analysis of the microscopic flow structure that is correlated to different inertial regimes. The originality of this work lies in the fact that a formal derivation of the quantities characterizing the flow structure is provided from the decomposition of the convective inertial term. Moreover, the role of the recirculation zones is thoroughly analyzed.
(3) Finally, the general conclusions of this work aresummarized and presented in Sec. IV.
II. PHYSICAL MODEL AND METHODOLOGY
A. Initial boundary value problem
The problem under consideration is that of a singlephase, permanent, isothermal, and incompressible flow of a Newtonian fluid f3 through nondeformable model porous structures. A representative elementary volume (REV), of characteristic length scale l, containing all the microscopic information of the original structure, of length scale L, from which it is extracted is considered (see Fig. 2). Indeed, for steady flow, the REV of a periodic structure corresponds to the geometrical unit cell [21] over which periodic boundary conditions are employed.
□□□□□□□□□□ y
□□□□□□□□QD-·
□□ □ □ □ □ □I□f□□ □□□□□□□□Q □
□ □ □ □ □ □ □ □ 0,□
□□□□□□□□□ ti!
□□□□□□□□□ 01\□□□□□□□□□□ \
0000000000
□□□□□□□□□□
• d
a--phase
,8-phase X
l
FIG. 2. Large (macroscopic) scale structure (OS) and the periodic unit cell that corresponds to the REV for steady flow.
Periodicity is applied to the fluid velocity v and pressure deviation p that is obtained from the decomposition of the pressure p according to [5 4,5 5]
p = (p)fJ + p, (3)
where (p)f3 is the intrinsic average of p. Considering VfJ as the volume of the fluid phase f3 within the REV of volume V, the intrinsic volume average of a quantity 1/r is defined by
(1/r)fJ = 2_ ( 1/r dV.VfJ lvf
(4)
The superficial average is given by (1/r) = E(ljr)f3 where E =
VfJ / V is the porosity of the structure. The dimensionless physical quantities are denoted using
the superscript *: velocity v*, pressure p*, and time t*. These quantities are defined from their dimensional reference values, respectively,given byvref = flV(p)f31,Pref = ZIV(p)f31,and t,ef = µ)(l IV (p)f3 I) considering l as the reference length and where p and /L are, respectively, the density and the dynamic viscosity of the f3 phase. The dimensionless initial boundary value problem, where the dimensionless operator V* = IV is noted in the same way as its dimensional analog V for simplicity, is given, in its general 3D form, by
V · v* = 0 in VfJ,
Re* - + v* • Vv* = -V p* + V2v* - V (p*)fJ(av*
)Bt* Re*
(5a)
+Pr
ez in VfJ, (5b)
v* = 0 at v*(r* + 17) = v*(r) p*(r* + 17) = p*(r*)
v* =0 in
p* =0 m
AfJrr , i = 1,2,3,
i = 1,2,3, vfJ at t* = 0, v
fJ at t* = 0.
(5c) (5d) (Se) (5f) (5g)
In Eq. (5c), AfJrr represents the fluid-solid interface within the f3 phase volume VfJ and the vector 17 = (171 ,z72,Z;*,),

MEHREZ AGNAOU, DIDIER LASSEUX, AND AZITA AHMADI
i = l, 2, 3, characterizes the periodic REV. The Froude numbergiven by Fr= 1' 1:Vf 1
2
, where g = gez is the gravity acceleration, was kept in Eq. (Sb) for the sake of completeness although the analysis is carried out in the absence of gravity in the remainder of the article thus assuming �' « 1. Since periodic boundary conditions are adopted for v* and p*, it should be noted that the flow is induced by the gradient of the average pressure V (p*)fl, which is a unit vector. The Reynolds number Re* appearing in Eq. (5b) is given by
pl3
Re*= -2
IV (p)fll. µ,
(6)
The classical Reynolds number, based on the characteristic dimension d of the solid phase (see Fig. 2) and the average velocity, is related to Re* by
Rect = I (v*) ld*Re*. (7)
The choice of the intensity of the macroscopic pressure gradient V (p)fl that forces the flow is made by setting the value of Re*, while the orientation of the macroscopic flow is specified from the unit vector V (p*)fl in Eq. (5b ).
B. Macroscopic model
Satisfying the condition of quasisteady flow and the length scale constraint d « l « L where d is the characteristic microscopic length scale (pore or solid grain diameter), l is the characteristic size of the averaging volume, and L is the macroscopic length scale, a macroscopic transport model [15] derived using the volume averaging method applied to the microscopic mass and momentum equations [Eqs. (5)] over a REV has been obtained [15]. This macroscopic model is more complete compared to the classical Forchheimer equation (2) that is based on empirical correction coefficients. In adimensionless form, based on the reference variables defined above, it is given by
(v*) = -K* . (V (p*)fl) - F . (v*), (Sa)
V · (v*) = 0, (Sb)
where K* = K/ /2 is the intrinsic permeability tensor andF the inertial correction tensor. Equation (Sa) can also be written as
(Sc)
where H* = (I+ F)- 1 K* = H/ l2 is the apparent permeability tensor. It must be emphasized that, while K* is only dependent on the structure of the porous medium, H* and F depend on both the structure of the porous medium and flow configuration (i.e., the Reynolds number Re* and orientation of V (p*)fl).
C. Closure problem
Determination of the macroscopic tensors K* and F appearing in the macroscopic model [Eqs. (Sa) and (Sc)] requires the solution of the associated closure problem resulting from the up-scaling procedure [15] using periodic boundary conditions on a periodic or pseudoperiodic model of a porous medium.
In a dimensionless general 3D form, this closure problem is given by
Re*v* · VM* = -Vm* + V2M* + I, (9a)
V · M* = 0, (9b)
M* = 0 at AfJu , (9c)
m*(r* + 17) = m*(r*), i = 1,2,3, (9d)
M*(r* + 17) = M*(r*), i = 1,2,3, (9e)
(M*) = H*, (9f)
where m* and M* are closure variables that map (v*) onto p* and v*, respectively [15]. Under this form, the closure problem requires the solution of the microscopic velocity field [Eqs. (5)] present in Eq. (9a). The solution of the closure problem [Eqs. (9)] for Re* = 0 allows to determine the intrinsicpermeability tensor that is given, in these circumstances, by (M*)= K*. In addition, the solution ofEqs. (9) for a prescribed Re* provides the correction tensor F that is given by
F = K* · H*- 1 - I. (9g)
D. Closure problem under a closed form
The procedure described above to compute H* and F was followed by different authors [24,29-32,56]. A more elegant approach which does not require the microscopic flow problem solution can be used, as developed earlier [57]. In fact, the microscopic velocity can be expressed in terms of the closure and macroscopic quantities as [15]
(10)
or, when Eq. (Sc) is taken into account,
v* = -V(p*)fl • M*r. (11)
Replacing this expression back into the original closure problem [Eqs. (9)], a closed form is obtained, given by
- Re*V (p*)fl · M*T · VM* = -Vm* + V2M* + I, (12a)
V · M* = 0, (12b)
M* = 0 at AfJa, (12c)
m*(r* + 17) = m*(r*), i = 1,2,3, (12d)
M*(r* + 17) = M*(r*), i = 1,2,3, (12e)
(M*) = H* = ; . (12f)
As before, the solution of this closed form of the closure problem allows the determination of K* ( with Re* = 0), H*, and F. Moreover, the microscopic pressure and velocity fields can be reconstructed from Eq. (11) for the velocity and
(13)
for the pressure deviation. It must emphasized that, while the solution of Eqs. (5) and (9) can be achieved by making use of a Navier-Stokes solver, the solution of Eqs. (12) requires a specific treatment due to the coupling between the different terms of the closure tensor M* in the left-hand side ofEq. ( 12a).

ORIGIN OF THE INERTIAL DEVIATION FROM DARCY's ...
In this work, the latter form of the closure problem was solved considering the ordered and disordered model porous structures of Fig. 1 for Reynolds numbers up to the limit of steady flow [21] in order to investigate the impact of the microstructure on macroscopic inertial effects. For a stationary flow on the ordered structure, the REV clearly corresponds to the geometric periodic unit cell as a result of symmetry. For the disordered structures, REVs containing 30 x 30 inclusions were considered as they proved to have the same macroscopic behavior as the infinite disordered structure, in agreement with previous studies [24,32]. Furthermore, in order to analyze the effect of flow orientation, two different macroscopic pressure gradients were considered, namely, V (p*)f, = ex (i.e., 0 = 0°) and V (p/3 = (ex + ey)/ ✓'i (i.e., 0 = 45°). The analysis of the deviation from Darcy's law is performed considering the dimensionless inertial correction vector fc given by [24]
-F · (v*) (v*) + K* · V (p*)f,
f - ---- - -------c - l(v*)I - l(v*)I
(14)
The analysis of inertial effects is performed with respect to the Reynolds number Rek based on macroscopic quantities only and given by [24]
# Rek = l(v*)l#Re* = -Red, d*
(15)
where k* is the permeability such that, for an orthotropic structure, K* = k*I in the 2D plane of Fig. 1. It must be noted that, while the intrinsic permeability tensor is always symmetric [58], the F and H* tensors are not [24] even if H* can be decomposed in its symmetric and skew-symmetric irreducible parts on a physical basis [59].
E. Numerical method
The numerical tool COMSOL Multiphysics [60] based on the Finite Element Method was used to solve the closure problem under consideration [Eqs. (12)]. The computational domain was discretized using a triangular mesh. Control volumes are defined around each node by joining the centers of mesh elements, and values obtained at mesh nodes are interpolated using linear Lagrangian interpolation for the components ofm*, whereas a quadratic interpolation is adopted for the components of M*. The problem under consideration was implemented using the COMSOL PDE General Form Module under the following form:
V · r = <I>, V · M* = 0
(16a) (16b)
with the associated boundary conditions [see Eqs. (12)]. The two terms r and <I> are defined by
r = -m*I + VM*, (16c) <I> = -Re*V (p*)f, · M*T · VM* - I. (16d)
The system of equations is solved with the COMSOL Stationary Solver. The solution is sought by making use of a Newton-Raphson algorithm that starts with the initial conditions as an initial guess. The resulting system of linearized equations, within each Newton-Raphson iteration,
Xumber of grid block� in DS and DC 1.00125 0.5 0. 75 1 1.25 1.5 1. 75 2.25
C)01.001
"g ce 1.00075 -ifJ0
� 1.0005 *�½
...:::::., 1.00025 -
-DS
--,•··DC
2.5 X )Of,
1.01
1.0075
1.005 vQ-c - 1.0025 @ ifJQ.s "
0.9975s::' 'h � 0.995-..:::::,,
0.9925
0 0.2 0.4 0.6 0.8 1 1.2 1.4 1.6 1.8 :.\'"umber of grid block� in OS and OC
2 2.2 X 10⁵ 0·99
FIG. 3. Normalized intrinsic average of the x component of the velocity, ((v;)1\, versus the number of grid blocks. Model porous structures of Fig. 1. Normalization with respect to ( v_;) fi obtained with the finest mesh. OS, Re* = 17 500 (Rek = 23.41 ); OC, Re* = 17 500 (Rek = 21.09); DS, Re* = 30 000 (Rek = 18.5 8); DC, Re* = 30 000 (Rek = 19.87); E = 75%; V (p*)il = e
x,
is solved using the Parallel Sparse Direct Solver MUMPS (MUltifrontal Massively Parallel sparse direct Solver) [61] based on LU factorization with a relative tolerance of 10-8. To avoid interpolation operations while imposing periodic boundary conditions, opposite edges of the computational domains are discretized with duplicate segments. Simulations are initiated with the fluid at rest.
F. Mesh sensitivity
Sensitivity of the solution to the problem [Eqs. (12)] with respect to the number of grid blocks used to discretize the computational domain Vf, was analyzed for the four model porous structures of Fig. 1. The dependence of ((v;)f,\, the intrinsic average of the dimensionless x component of the velocity, normalized by (v;l obtained with the finest mesh, is represented versus the number of grid blocks in Fig. 3. For each structure, the analysis was carried out for the maximum Reynolds numbers considered in this study, which correspond to the limit of steady flow, keeping in mind that the number of grid blocks ensuring mesh convergence increases with the Reynolds number [24]. The maximum Reynolds numbers considered in this study are Re* = 17 500 (Rek = 23.41 and Red= 102.52) for the OS, Re*= 17 500 (Rek = 21.09 and Red= 101.39) for the OC, Re*= 30 000 (Rek = 18.58 and Red = 80.8) for the DS, and Re* = 30 000 (Rek = 19.87 and Red = 93.46) for the DC. The gradient of average pressure is V (p*)f, = ex (0 = 0°).
Figure 3 shows that the value of ( (v;l\ is quasi insensitive to the number of grid blocks for the investigated range of mesh sizes. Indeed, for each ordered structure (OS and OC), increasing the number of grid blocks ~ 39 times leads to a relative error on ( (v;)f,)n of less than 0.12%. The same applies to the disordered structures (DS, DC), where the relative error on ((v;)f,\ is less than 0.86% while increasing the number of grid blocks ~ 3.3 times. Thus, meshes adopted in this work comprise 168 662 elements for the OS, 1726 80

MEHREZ AGNAOU, DIDIER LASSEUX, AND AZITA AHMADI
elements for the OC, 573 190 elements for the DS, and 692 007 elements for the DC. Correspondingly, numbers of grid blocks across d (see Fig. 2) are 144 and 10 in the OS and DS configurations, respectively, while, for the OC and DC structures, 512 and 36 nodes were placed on the circumference of each circular inclusion respectively. These meshes yield grid block sizes smaller than the minimum required to ensure mesh convergence. This choice was made in order to guarantee an accurate computation of the flow streamlines to analyze the flow structure discussed in the next section.
III. RESULTS AND DISCUSSION
The inertial correction fe = Cfex Jey) [Eq. (14)] was com
puted for the different Reynolds numbers under consideration. It must be noted that, for 0 = 0° , fey
is zero for the ordered structures and perfectly negligible for the disordered media, while, for 0 = 45° , fex and fe
y are equal for ordered structures
and do not differ significantly for disordered ones. Hence, in the remainder of this article, focus is laid upon fex only as it fully characterizes the deviation from Darcy's law. While simulations were limited to a pressure gradient aligned with ex (0 = 0°) for disordered structures, two orientations, 0 = 0° and 0 = 45° , were adopted for the ordered ones. Computational results on fex allow the identification of the different inertial regimes by fitting the curves fex (Rek) defined by Eqs. (17) to (19) under the constraint on the Pearson correlation coefficient [62,63] R2 ? 0.999. For the weak inertia regime, where the inertial correction fex scales as Rek 2
(or (v;) 3), the following correlation is obtained:
fex = ARek2 + B. (17)
In the same way, for the strong inertia regime, where the inertial correction fex scales as Rek (or (v;) 2), the linear relation is given by
fex = CRek + D. (18)
Finally, for the regime above strong inertia, the dependence of the inertial correction fex on Rek can be described by a polynomial of the form
(19)
Comparisons can be made between the inertial factors f3 and y of the empirical equation (2) and the coefficients A and C identified with Eqs. (17) and (18), respectively, using the following relations:
f3 = C/✓k
,
y = A/f.,l. (20)
Coefficients B and D are assumed to be zero in Eq. (2). The gradual transition from weak to strong inertia regimes can be characterized by a critical Reynolds number [24], Rekc, defined as the value that minimizes the difference on fex estimated from the models in these two regimes [a(8fex)/aRek = OJ, yielding
C Rekc = 2A
. (21)
Intervals of Rek corresponding to the different inertial regimes and the corresponding coefficients A, C, E, and F
are summarized in Table I. For completeness, the values of the intrinsic permeability, k*, of the different model structures (Fig. 1) are also reported in Table I. Values of k* show that the ordered structure of circular cylinders, OC, is slightly more permeable than the ordered structure of square cylinders, OS, with a relative increase of 5.68%. Furthermore, the structural disorder slightly increases the intrinsic permeability as DS is 1.38% more permeable than OS and DC is 4.57% more permeable than OC. In addition, porous structures were also characterized at the macroscale by means of the streamlines tortuosity T, whose values are indicated in Table I. A thorough discussion on the tortuosity will be provided later in this section.
TABLE I. Summary table: Model porous structures of Fig. 1: OS, OC, DS, and DC with diameters d* of the solid inclusions. Two different orientations of the macroscopic pressure gradient, V (p*) �, with respect to the horizontal principal axis (ex ) of the porous structures are considered: 0 = 0° and 0 = 45° . Intrinsic permeabilities k* of the model porous structures. Streamlines tortuosity, T, determined for Rek = 0 using Eq. (23). Reynolds number, Rek, ranges of validity of weak, strong, and above strong inertia regimes. Coefficients A, C, E, and F
of Eqs. ( 17)-( 19) obtained from fittings of computational results satisfying the Pearson coefficient constraint R2 ? 0.999. Critical Reynolds number Rekc characterizing the transition from weak to strong inertia regimes obtained from Eq. (21). Porosity E = 75%.
Structure OS oc DS DC
d* 0.5 0.564 0.5 0.564 Inclination of V (p*)� on ex 0 = 0° 0 = 45° 0 = 0° 0 = 45° 0 = 0° 0 = 0°
k* 0.01303 0.01377 0.01321 0.01440 T (Rek = 0) 1.018 1.192 1.039 1.164 1.127 1.115
Weak inertia Rek E [0.03,0.33] [0.03,0.44] [0.03,0.48] [0.032,0.45] [1.51 X 10⁻⁵ ,0.22] [1.71 X IQ-5 ,0.26] regime A 0.0102 0.0622 0.0212 0.0363 0.0683 0.0631
Rekc 0.75 1.33 0.97 1.13 0.72 0.83 Strong inertia Rek E [0.89,2.31] [2,3.56] [1.1,2.68] [2.08,6.33] [ 1.13, 5 .16] [ 1.27, 6. 77] regime C 0.0153 0.1654 0.0411 0.0824 0.0989 0.1042
Regime above Rek E [8.16,23.41 l [3.62,6.76] [5.53,21.09] [6.66,9.66] [5.54, 18.58] [7.14, 19.87]
E -10-4 0.025 -4.6 X 10⁻⁴ 0.0033 -83 X 10-5 -1 J.7 X 10-4
strong inertia F 0.0053 -0.012 0.0228 0.038 0.0915 0.1025

ORIGIN OF THE INERTIAL DEVIATION FROM DARCY's ...
1.6
1.4
1.2 -- OS0 = 0°
1 --+- oc 0 = 0°
-- OS0 = 45°
H 0.8 - ........... oc 0 = 45
°
-- DS0 = 0°
0.6 ........... DC 0 = 0°
0.4
0.2 -
0
0 2 4 6 8 10 12 14 16 18 20 22 24
Rek
FIG. 4. x component of the inertial correction vector, .fcx , versus the Reynolds number Rek for the model porous structures of Fig. 1 (OS, OC, DS, and DC) and two different orientations of V (p*)f!: 0 =0° (V (p*)f! = ex ) and 0 = 45° [V (p*)fl = (ex + ey )/ -v12]. PorosityE = 75%.
A. Analysis of the deviation from Darcy's law
In Fig. 4 we have reported lex versus Rek for the different structures and pressure gradient orientations. Clearly inertial effects are stronger for the OC compared to the OS when 0 = 0°. This can be explained by a higher resistance to the flow for the former structure, supported by the larger value of the tortuosity in the OC [T(Rek = 0) = 1.039] compared to the OS [T(Rek = 0) = 1.018] indicating that flow paths are longer in the OC. The shape of the solid inclusions plays an important role on the intensity of inertia by affecting the streamlines tortuosity. When a structure as the OS with a solid phase presenting straight edges is subject to a flow along one of its principal axis, flow is conditioned by the straight edges and develops quasistraight streamlines [see Figs. 5(a) and 5(b)]. This leads to a channeling effect with a flow that closely resembles that in channels characterized by a tortuosity close to unity and, hence, to weak inertial effects.
When 0 = 45° for V (p* /3, intensity of inertial effects
increases compared to 0 = 0° (Fig. 4). This confirms the dependence of the deviation from Darcy's law on the orientation of the macroscopic pressure gradient [24]. This increase of inertia can be explained by the fact that, when 0 = 45° , flow paths become longer and tortuosity increases (see Table I). While a channeling effect is observed for 0 = 0° , the flow structure is a succession of constrictions and enlargements for 0 = 45° leading to more curved streamlines (see Fig. 5).
Figure 4 highlights the dependence of the deviation from Darcy's law on structural disorder. Inertial effects increase when disorder is introduced for 0 = 0°. This increase can be explained by the fact that, for the disordered porous structures, disturbed positions of the cylinders break the channeling effect observed on the ordered ones as in Figs. 5(a) and 5(b ). Therefore, streamlines tend to be longer in order to bypass the cylinders leading to an increase of the tortuosity (see Table I) and, consequently, of inertial effects. Furthermore, when structural disorder is introduced into the porous structure, the
influence of the shape of the solid inclusions on the deviation from Darcy's law decreases. In fact, leARek) corresponding to the DS and DC are closer to each other compared to lex (Rek) corresponding to the OS and OC for 0 = 0° . This indicates that structural disorder has a more significant contribution to inertial effects than the shape of solid inclusions.
In order to illustrate the relationship between the inertial correction and the filtration velocity ( or Reynolds number), the normalized first derivative of lex with respect to Rek versus Rek, (a lex ;aRek)
n(Rek), is plotted in Fig. 6 for all cases under
study. The weak inertia regime, where lex has a quadratic dependence upon Rek (cubic upon (v;)), is identified in all configurations at low Reynolds numbers, Rek � 0.5, over short intervals. These intervals are centered on inflexion points of (alex /aRek)n (Rek) located at Rek � 0.25. Ranges of validity of the weak inertia regime are reported in Table I. Whereas the interval of validity of the latter regime is quasi-insensitive to the shape of the solid inclusions and orientation of V (p*)f3, it is shorter in the presence of structural disorder (see Table I) as it has been observed in previous works [24], even on 3D structures [29].
The identification of the strong inertia regime (where lex
scales as Rek) from (alcx /aRek)n(Rek) is less obvious than the
weak inertia. For the OS and OC with 0 = 0° , the strong inertia regime corresponds to narrow intervals around the maxima of (alcx /aRek)n (Rek) located at Rek � 1.61 for the OS and Rek � 1.84 for the OC. These intervals also correspond to short ranges centered on inflexion points of leARek) (see Fig. 4). Although the range of validity of the strong inertia regime is not significantly affected by the shape of solid inclusions, it remains very small compared to the whole range of steady laminar flow. Furthermore, for V (p*)f3 oriented with 0 = 45° , the range of validity of strong inertia regime on the OC is larger than for 0 = 0° . Indeed, (alcx /aRek)
11(Rek)
corresponding to the OC (0 = 45°) presents a plateau for 2.08 � Rek � 6.33. However, still for 0 = 45° , the inertial regime in question has a shorter and much less evident interval of validity for the OS. Regarding the disordered structures, DS and DC, the Forchheimer regime is identified on a larger interval than for the corresponding ordered media (see Table I). Thus, it can be concluded that, unlike the weak inertia regime, the Forchheimer regime is not well-identified in all configurations but appears to be clearly more distinguishable on disordered porous structures.
From Table I and Fig. 6, it can be noted that the Forchheimer regime does not persist until the end of steady laminar regime. A regime above strong inertia is identified on a wide range of Rek. Except for the OS with 0 = 45° , the regime above strong inertia resembles the Forchheimer regime since coefficients Fof Eq. (19) are at least one order of magnitude larger than E (see Table I). Hence, relaxing the Pearson coefficient constraint to R2 � 0.98, lex scales as Rek (or (v;)2) on this Reynolds number interval. However, this regime is not considered as a strong inertia regime for two main reasons. First, it occurs at high velocities, which are rarely reached in reality such as for flows of water or oil in geological formations. Second, it implies a large transition interval from weak to strong inertia regimes. Moreover, for the OS with 0 = 45° , the regime above strong inertia appears more like the weak inertia regime rather than the Forchheimer one. From Table I, coefficient F is
MEHREZ AGNAOU, DIDIER LASSEUX, AND AZITA AHMADI
.t. l.526xlo·'
0.0014
0.0012
0.001
0.0008
0.0006
0.0004
0.0002
(a) 0
... 0
.t. 9.208x10·4
xl0-5
90
80
70
60
50
40
30
20
10
(c) 0
... 0
(b)
(d)
.t. l.l 718xlO"'
0.001
0.0008
0.0006
0.0004
0.0002
0 ... 0
.t. 2.3723x10·4
xl◊-s
20
10
0 ... 0
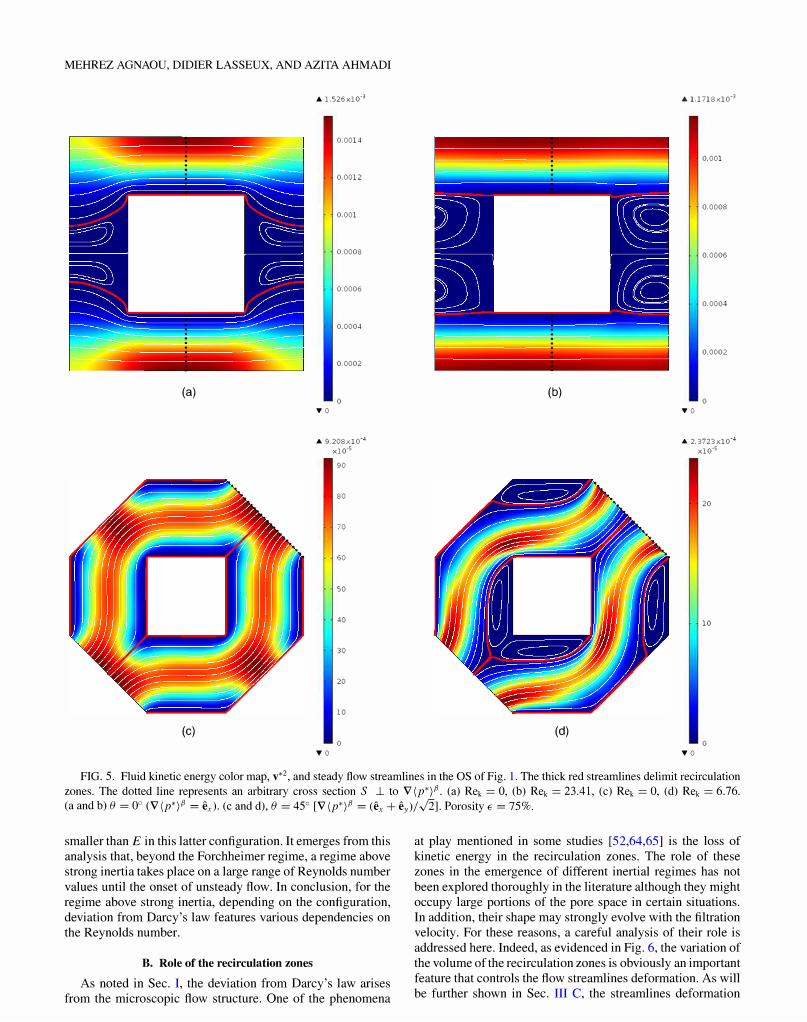
FIG. 5. Fluid kinetic energy color map, v*2, and steady flow streamlines in the OS of Fig. 1. The thick red streamlines delimit recirculation zones. The dotted line represents an arbitrary cross section S J_ to V(p*)f!. (a) Rek = 0, (b) Rek = 23.41, (c) Rek = 0, (d) Rek = 6.76. (a and b) 0 = 0° (V (p*)f! = ex )- (c and d), 0 = 45° [V (p*)f! = (ex + e
y)/ v'2]. Porosity E = 75%.
smaller than E in this latter configuration. It emerges from this analysis that, beyond the Forchheimer regime, a regime above strong inertia takes place on a large range of Reynolds number values until the onset of unsteady flow. In conclusion, for the regime above strong inertia, depending on the configuration, deviation from Darcy's law features various dependencies on the Reynolds number.
B. Role of the recirculation zones
As noted in Sec. I, the deviation from Darcy's law arises from the microscopic flow structure. One of the phenomena
at play mentioned in some studies [52,64,65] is the loss of kinetic energy in the recirculation zones. The role of these zones in the emergence of different inertial regimes has not been explored thoroughly in the literature although they might occupy large portions of the pore space in certain situations. In addition, their shape may strongly evolve with the filtration velocity. For these reasons, a careful analysis of their role is addressed here. Indeed, as evidenced in Fig. 6, the variation of the volume of the recirculation zones is obviously an important feature that controls the flow streamlines deformation. As will be further shown in Sec. III C, the streamlines deformation

ORIGIN OF THE INERTIAL DEVIATION FROM DARCY's ...
1 -- OS 0 = 45° -+- OC 0 = 45°
0.8 - -- DS0 = 0° -+- DC0 = 0°
0.6 -
0.4 -
�
0.2 -
0
0 2 4 6 8 10 12 14 16 18 20 22 24 Rek
FIG. 6. First derivative of the x component of the inertial correction normalized by its maximum value (afcx /aRek)n versus Rek for the model porous structures of Fig. 1 (OS, OC, DS, and DC) and two different orientations of V (p*)fl : 0 = 0° (V (p*)fl = e,) and 0 = 45° [V (p*)fl = (e, + ey )/ v12]. Porosity E = 75%.
results in a change of the rate of inertial losses with respect to the Reynolds number.
For clarity, the analysis of the impact of the recirculation zones is performed on the ordered model porous structures of Fig. 1 (OS and OC) for a macroscopic pressure gradient, V (p* )f! , oriented at 0 = 0° and 0 = 45° . As shown in Fig. 5, recirculation zones, limited by red flow streamlines, consist in two vortices downstream the cylinders. In order to distinguish different inertial regimes and identify correlations between their onset and the change in flow structure, in all the following investigations of Figs. 7 through 12, flow regimes were identified from data in Table I. In Fig. 7, the ratio between
4
3
*c 2 l"1
□ \Veale inertia regime Transition
o Strong inertia regime o Regime above strong inertia
OC0 = 45°
[3, - - - -13- - -0- -0- E]-QO{JEE13�J',,
OS 0 �-45-o -13- - -0- -0- El-OO<JEE13EHD< ...
OSI!= 0°
0 OC0 = 0°
10-1 101
FIG. 7. Ratio between the fluid kinetic energy in the vortices and the total fluid kinetic energy, E ct0rt/ E c*, versus the Reynolds numberRek. Ordered model porous structures OS and OC of Fig. I. Two different orientations of the macroscopic pressure gradient, 0 = 0°
and 0 = 45°. Identification of flow regimes from data in Table I. Porosity E = 75%.
0.35
0.3
0.25
□ \Vcak inertia regime Transition
o Strong inertia regime ◊ Regime above strong inertia
:C. 0.2 - OS /J = 0°
t 1 0.15
0.1
0.05
OC/J = 0°
10-1 10'
FIG. 8. Ratio between the volume occupied by vortices and the total volume of fluid {3, Vflvort/ V/l , versus the Reynolds number Rek.Ordered model porous structures OS and OC of Fig. 1. Two different orientations of the macroscopic pressure gradient, 0 = 0° and 0 = 45°. Identification of flow regimes from data in Table I. Porosity E = 75%.
the fluid kinetic energy in the vortices and the total fluid kinetic energy, E ct0n/ E c*, is represented versus the Reynolds number Rek. We note here that Ecton = ½ J v*2
dV* and VflVort
Ee* = ½ J v*2 dV* where Vf!vort is the domain occupied by
Vp
the vortices in Vf! . The quantity E ct0n/ E c* remains constant in the weak inertia regime and then exhibits different behaviors beyond this regime. However, the most important result emerging from Ect0,1/ Ec*(Rek) is that the kinetic energy lost in the recirculation zones is always insignificant as it remains less than 0.5% of the total energy in the system. Therefore, it cannot be considered as the origin of the deviation from Darcy's law. This contrasts with the situation of turbulent flow where the kinetic energy lost in the vortices can be important.
The ratio between the volume of the vortices and the total volume of the f3 phase, Vf!von/ Vf! , versus Rek, is represented in Fig. 8. This ratio remains constant (or very slightly varying) in the weak inertia regime for all configurations under study. This indicates an invariant flow structure for this regime that resembles that observed in the creeping flow regime. At the onset of the transition from weak to strong inertia, Vf!von/ Vf!
starts increasing with Rek even if the rate of increase is insignificant for 0 = 45° . The increment in this ratio indicates the expansion of the recirculation zones with Rek as illustrated in Fig. 5 and evidences the correlation between the microscopic flow structure and the transition from weak to strong inertia regimes. However, beyond the transition from weak to strong inertia regimes, different behaviors are observed depending on the configuration (see Fig. 8). For 0 = 0° , a well-identified increase of Vf!vorr/ Vf! at the onset of the Forchheimer regime can be noticed with different slopes for the OS and OC. For 0 = 45° , Vf!vonl Vf! slightly decreases at the onset of strong inertia regime for the OC and slowly increases for the OS. Regarding the onset of the regime above strong inertia,

MEHREZ AGNAOU, DIDIER LASSEUX, AND AZITA AHMADI
an increase of VfJVort! V/3 with Rek with different slopes is observed for all configurations. The only general correlation between this ratio and inertial regimes, that is valid for all configurations, is at the onset of the transition from weak to strong inertia regimes. The other regimes that were found to be strongly dependent on the shape of the solid inclusions as well as on the orientation of V (p*)f3 and structural disorder cannot be differentiated from each other using this ratio. Beyond the transition from the weak inertia regime to the Forchheimer one, enlargement or contraction of recirculation zones occurs with different rates depending on the configuration. This may explain why, beyond this latter regimes, the behavior of the deviation from Darcy's law is not universal.
From Fig. 8, the recirculation zones fill up to~ 35% of the total volume occupied by the f3 phase. Compared to the ratio of kinetic energies, that is, Ect0r1/ Ee* < 0.5% in all situations, the volume ratio, VfJVmt/ VfJ , is not negligible. This shows the important role of the recirculation zones in the apparition of the different inertial regimes through the variation ( enlargement or contraction) of their volume with the filtration velocity. This variation affects the shape of the flow streamlines and the distribution of kinetic energy in the active part of the flow as will be shown below. We note that the resulting streamlines deformation contributes to either lengthen or shorten them and may hence be characterized by the flow tortuosity.
1. Effect of the recirculation wnes on flow tortuosity
In light of the above observation, the present subsection is dedicated to the analysis of the streamlines tortuosity, T. It is computed on the two ordered structures OS and OC for the two orientations of V (p*)f3 under consideration (see Fig. 9). The analysis is also extended to the disordered structures DS and DC. A similar analysis on the tortuosity, was reported recently [48] on a disordered structure of cylinders of circular cross section comparable to DC. One should note two main weaknesses in this reference, however. First, no justification
.f
1.2
1.18
1.16
1.14
1.12
� 1.1
� 1.08
1.06
1.04
1.02
DS0 = 0°
<>-El-OaaDIQC0 = 45°
13- - - - - -El- -0- - - - £1- -0- - - - - B- -c:El313::E£13EDJD3-� DC0=O°
• .. "<>q
□ "\Veak inertia regime 1:,,. Transition o Strong inertia regime OC e = oo ◊ Regime above strong inertia 13-i...,..EEBI.....,.__
0S0 = 0°
10-5 10-1 10-1
(I)
101
FIG. 9. Streamlines tortuosity, T, versus the Reynolds number Rek for the model porous structures of Fig. 1 (OS, OC, DS, and DC) and two different orientations of V (p*)f!: 0 = 0° (V (p*)f! = ex), and 0 = 45° [V (p*)fl = (ex + ey)/ ,J'.2]. Identification of flow regimes from data in Table I. Porosity E = 75%.
was provided for the choice of this parameter (i.e., T) to explain the origin of the deviation from Darcy's law. It should be emphasized here that this remark applies for most of the studies mentioned in Sec. I that attempted to investigate the origin of the inertial regimes. Second, conclusions of the reported study [48] are based on a single flow configuration only, and it will be shown that the conclusions reached in this reference cannot be generalized to other configurations.
In this work, the flow tortuosity is investigated in various situations in order to draw more general conclusions on the dependence of this parameter on Rek and its correlation with the onset of the different flow regimes. The theoretical justification of the use of this parameter will be addressed in Sec. III C.
Several definitions of the tortuosity, T, can be found in the literature [66-68]. The most popular one, given in a continuous form, is
T =
fs r(q)dq > l fs dq 1/ '
(22)
where S is an arbitrary cross section perpendicular to the macroscopic flow direction (i.e., perpendicular to V (p*)f3 in this study), r(q) = r(q )/ l' is the tortuosity of the streamline crossing S at point q , while r ( q) is the length of the streamline passing through q and l' the length of the porous structure along V (p*)f3. The expression of T in Eq. (22) can be discretized to give
I N
T � N
LT(q;);;,: 1. (23)
i=l
In the present study, S is an arbitrary edge of the structure and is discretized using N equidistant points q;. For the ordered structures (OS and QC), S is materialized by a dotted line in Figs. 5(a) and 5(b) for() = 0° and on Figs. 5(c) and 5(d) for () = 45° . For the disordered structures (DS and DC), S is defined on the right boundary (inlet) of the unit cell (see Fig. I). For() = 0° , S is discretized using N = 500 points for the OS and OC and N = 10 000 points for the DS and DC. For() = 45° , N = 400 for the OS and N = 480 for the OC. It must be noted that flow streamlines in the recirculation zones are not taken into account in the computation of T. The value of N adopted for each configuration was chosen based on a sensitivity analysis of T with respect to N.
In Fig. 9 we have represented the tortuosity, T, versus Rek. As expected from the analysis of V{Jvor1/ VfJ(Rek) of Fig. 8, T remains constant in the weak inertia regime and decreases for larger Rek for all the different configurations. This can be explained by the small volume of the recirculation zones in the weak inertia regime, which leads to longer flow streamlines to adapt to the shape of the solid inclusions (see Fig. 5). At the beginning of the transition from weak inertia to the Forchheimer regime, a well-identified decrease of Tcan be observed. In fact, the growing recirculation zones at the onset of this transition result in shorter flow streamlines and thus lower tortuosity. However, as observed above for the dependence of the recirculation zones on the Reynolds number, beyond this latter transition, the behavior of the tortuosity with Rek in the strong inertia regime cannot be distinguished from that in the regime above strong inertia. Figure 9 also shows that,

ORIGIN OF THE INERTIAL DEVIATION FROM DARCY's ...
unlike the other configurations where the tortuosity is always decreasing beyond the transition from weak to strong inertia, Tconverges to its lower bound (T = 1) for the ordered structures when 0 = 0°. Indeed, for the OS and OC for 0 = 0° , at high Reynolds numbers, the recirculation zones fill the whole space between successive cylinders [see Fig. 5(b )], leading to quasistraight flow streamlines (i.e., a strong channeling effect).
Analyzing Figs. 8 and 9, for the OS and0Cfor0 = 45° , one can observe that, while the recirculation zones do not markedly grow at the transition from weak to strong inertia regimes (see Fig. 8), a significant decrease of T with Rek can be observed for the same range of Rek (Fig. 9). This decrease of T can be explained by the elongation of the recirculation zones in the direction of the flow while their volume remains almost the same, yielding straighter streamlines. This shows that, in addition to the variation of the volume of the recirculation zones, change in their shape affects the flow tortuosity and the intensity of inertia.
Furthermore, Fig. 9 shows that the sigmoidal form of T(Rek), reported in a previous work [48], is observed here only for the OS and OC for 0 = 0°. This demonstrates that, apart from the fact that T remains quasiconstant in the weak inertia regime and decreases at the onset of the transition to the Forchheimer regime, no other conclusion regarding the behavior of T can be generalized to all the porous structures, at least in the laminar stationary regime.
2. Effect of the recirculation zones on the distribution
of kinetic energy
The distribution of the fluid kinetic energy in V/l with respect to the Reynolds number is investigated in this subsection. It is quantified by the variance of v*2, Var(v*2) as shown in Fig. 10. As for the flow tortuosity, this type of analysis was mentioned in a previous study [47] over a disordered structure of square cylinders comparable to DS. However, conclusions
-10-7
N
l, �
r: oc l3:,;. a� -[3 - 8 - - - - 8- El- - - - El- -caxm� ....
v 4
4 DS0 = 0°
3
2
0
□ ..
0
,veak inertia. regime Transition
Strong inertia regime ◊ Regime above strong inertia
10-s 10-4 10-3 10-2 Rek
10-1 101 10'
FIG. 10. Variance of the fluid kinetic energy, Var(v*2), versus the Reynolds number Rek for the model porous structures of Fig. I (OS, OC, DS, and DC) and two different orientations of V (p*)fi: 0 = 0° (V (p*)fJ =ex ) and 0 = 45° [V (p*)fJ = (ex + ey )/ .J2]. Identification of flow regimes from data in Table I. Porosity E = 75%.
drawn from this analysis suggest the same questioning as those regarding the flow tortuosity [ 48].
The variance of the kinetic energy, Var(v*2), is given by
Var(v*2) = (v*4)/l - ((v*2)/l)2 _ (24)
As observed on T(Rek) (Fig. 9), Var(v*2) versus Rek in Fig. 10 shows that the variance of the kinetic energy remains constant in the weak inertia regime for all the configurations under investigation. After this regime, for higher Rek, a well-identified decrease of Var( v*2) characterizing the transition to the strong inertia regime is observed, highlighting a more homogeneous distribution of the fluid kinetic energy in the structure. The decrease of Var(v*2) with Rek can be explained by the fact that, in the weak inertia regime, the confined recirculation zones force the flow to be tortuous [see Figs. 5(a) and 5(c)]. As a consequence, the cross section of the pseudochannels, bounded by the solid phase and the recirculation zones, presents constrictions and enlargements. Invoking the mass flow rate conservation argument, the velocity (and hence the kinetic energy) is then mostly concentrated in the constrictions. Moreover, at higher Reynolds numbers, the expansion of the recirculation zones, that yields a decrease of flow tortuosity and marked preferential channels, results in a quasiconstant pseudochannels' cross section. Thus, a more homogeneous distribution of the kinetic energy is observed [see Figs. 5(b) and 5(d)].
The microscopic flow structure stays invariant in the weak inertia regime for all the configurations investigated here (different porous structures and orientations of V (p*)f3), and it explains why this regime is always well identified. For regimes occurring at larger filtration velocities, the flow structure is subject to complex and contrasted variations depending on the configuration justifying many different behaviors of the deviation from Darcy's law observed earlier.
C. Relation between the convective acceleration term and the
microscopic flow structure
In the present subsection, we attempt to provide a theoretical justification to the analysis of the flow tortuosity and distribution of the fluid kinetic energy from the microscale flow fields as indicators of the macroscale flow regimes. To do so, the microscopic flow structure is analyzed through quantities obtained from a formal decomposition of the inertia term, (v* • V)v* at the microscopic scale. Paradoxically, the macroscopic counterpart of this term has a perfectly negligible contribution [13,15,51,52].
In order to analyze the impact of the inertia term on the flow structure, a decomposition of (v* • V)v* is performed in the local Frenet frame (t, fi) where the unit vectors t and fi form an orthonormal basis. We recall that t =
1 �:1
= Ctx , ty) isalways tangent to flow streamlines and directed along the flow velocity while fi = ( -t y, t x) is the normal direct vector. It can be easily shown that the decomposition is given by
1 dv*2, (v* • V)v* = v*2Kfi + 2-dst, (25)
where Kfi = � is the local curvature of the flow streamlines and s is a curvilinear abscissa. This decomposition suggests that the microscopic flow structure can be analyzed through

MEHREZ AGNAOU, DIDIER LASSEUX, AND AZITA AHMADI
-10-:J 1
0.9
0.8
0.7 DC0 = 0°
Q.G 13- ----13-B----B- El---- £1- -EBJCE3IDCB:1cJ;i4..6_m.
.... , 0.5 - DS 0ia-=-0°---e---&----s--e----&-f'EEH3133EEH>a..._._ 'a, 0.4
0.3 -
0.2
0.1
0
□ \Veak inertia regime Transition
o Strong inertia regime ◊ Regime above strong inertia
ace= 0°
0S0 = 0°
FIG. 11. Intrinsic average of the absolute value of the streamlines curvature weighted by the local kinetic energy, (lv*2Kfil/, versusthe Reynolds number Rek for the model porous structures of Fig. 1 (OS, OC, DS, and DC) and two different orientations of V (p*)f!: 0 = 0° (V (p*)f! =ex ) and 0 = 45° [V (p*)f! = (ex + ey )/ .J2]. Identification of flow regimes from data in Table I. Porosity E = 75%.
the local normal and tangential terms on the right-hand side of Eq. (25). By taking the intrinsic average of the magnitude of these two terms, it can be noted that ( I v*2 Kll I i-8 corresponds to the intrinsic average of the absolute value of the streamlines curvature weighted by the local kinetic energy and can be further thought as being related to the average streamlines
I dv'2 A f! . tortuosity. The second term, 2 ( I Ts t I) , charactenzes the variation of the kinetic energy along the streamlines in the flow direction. Both quantities are considered in terms of their magnitude since, due to the flow symmetry, in the ordered structures, (v*2Kni-8 = 0 and ½ ( dl;
2 t/ = 0 over the wholeunit cell.
1. Analysis of (lv*2Kfil)/l
Plots of (lv*2Knll versus Rek (see Fig. 11) show that the quantity (lv*2Knll remains constant in the weak inertia regime. As already observed, this attests that the flow structure does not vary in this regime. It is close to that observed in the creeping flow regime with tortuous streamlines as shown in Figs. 5(a) and 5(c). At the beginning of the transition to the strong inertia regime, (lv*2Knll decreases with Rek for all configurations. This indicates that the streamlines become less curved as the filtration velocity increases [see Figs. 5(b) and 5(d)]. After this transition, ( lv*2Knll continues to decrease with Rek. However, it is impossible to distinguish the Forchheimer regime from that above strong inertia.
Comparison between flow tortuosity, T (Fig. 9), and the average of the streamlines curvature weighted by the local kinetic energy, (lv*2Knll (Fig. 11), shows that these two quantities have very similar behaviors with respect to the Reynolds number. This justifies why the tortuosity, usually invoked in a heuristic way, can be correlated to the onset of inertial regimes, and it can be further explained by the fact that the streamlines tortuosity is obviously related to their
-10-4 7
4
DCB= 0°
G----B-B----B-EI----EI--EBJCE3aJiB:3cE44.ti_ OCB = 0° \
DS0 = 0°
2 - □ Weak inertia regime fransition
1 o Strong inertia regime ◊ Regime above strong inertia
FIG. 12. Variation of the kinetic energy along the streamlines in I d
,2 A fJ the direction offlow, 2 (1-i:-tl) , versus the Reynolds number Rek forthe model porous structures of Fig. 1 (OS, OC, DS, and DC) and two different orientations of V (p*)f!: 0 = 0° (V (p*)f! = ex ) and 0 = 45°
[V (p*)f! = (ex + ey)/ .J2]. Identification of flow regimes from data in Table I.
curvature. Indeed, highly curved streamlines lead to longer flow paths and larger tortuosity. However, it should be noted that, for other flow configurations, a difference between T and ( lv*2Kfil i-8, in terms of their dependence with respect to the Reynolds number, may be observed due to the fact that for the tortuosity, the streamlines have equal contribution in T independently of their kinetic energy. As a matter of fact, this suggests that, rather than T, (lv*2Knll might be a better indicator of the flow structure modification by inertia as it has a clear physical basis.
2. Analysis of½ ( I d;;2
tl)fl
The dependence of the second term on the right-hand I d*2A f! • side of Eq. (25), 2 ( I ls ti) , on the Reynolds number 1s
represented in Fig. 12. As observed earlier during the analysis of other quantities characterizing the flow at the pore scale, ½ ( I dl;
2
ti/ is constant in the weak inertia regime. When Rek increases, a decrease of this quantity occurs at the beginning of the transition to the Forchheimer regime. This decrease indicates that the variation of the fluid kinetic energy along the streamlines becomes smaller as Rek increases. As noted for the
2 l d'2A f!analysis ofVar(v*) in Sec. IIIB, the decrease of 2(1 ls ti) with Rek is due to the channeling effect in favor of a fluid flow in pseudochannels of identical cross-sectional area [see Figs. 5(b) and 5(d)].
Results of flow simulations on OS structures reported earlier for small values of E (down to ~0.15) [21] show that, in this range of porosity, the flow structure is similar to that between parallel planes with quasistraight streamlines (see, for instance, Fig. 13 in this reference). This yields weak streamlines curvature, a homogeneous distribution of kinetic energy along these lines and weak inertial effects. This is fully consistent with the fact that fcx decreases with E at a given V (p)f!, confirming the fact that the

ORIGIN OF THE INERTIAL DEVIATION FROM DARCY's ...
two parameters are physically relevant signatures of inertial
effects.
As a conclusion, the analysis of the microscopic flow
structure showed that flow paths stay unchanged in an
interval of Rek that coincides with the weak inertia regime.
This explains why this regime is well identified on all the
configurations under consideration. The flow structure can be
related to two quantities: the streamlines curvature and the
variation of the kinetic energy along these lines. Each graph of
these two quantities versus log(Rek) is such that (1) the plateau
corresponds to the weak inertia regime in accordance with flow
paths that remain unmodified; (2) a strong decrease following
the plateau is obtained as a signature of the transition towards
the strong inertia regime; and (3) the strong inertia regime
is featured by a quasilinear decrease. The different modes of
variation and the coupling between these two quantities explain
the different forms of the inertial correction to Darcy's law that
have been observed. It must be emphasized that tese variations
are enhanced by the expansion of the recirculation zones. The
two quantities evaluated here, obtained from the microscopic
inertial term, are related to those evaluated in Sec. III B, T and
Var(v*2). This justifies their use in the literature as indicators
of inertial regimes.
IV. CONCLUSIONS
In this work, the inertial correction to Darcy's law, for
ordered and disordered model porous structures, was analyzed,
and its behavior was correlated to that of the flow structure.
The inertial correction was obtained from numerical resolution
of the closure problem written in a closed form, resulting from
the up-scaling of the Navier-Stokes equations with volume
averaging. The dependence of the deviation from Darcy's
law on the microstructure and orientation of the macroscopic
pressure gradient was demonstrated. It is explained by the fact
that these two parameters directly affect the flow tortuosity, on
which the intensity of inertia depends. It was also shown that
the influence of the shape of the solid inclusions on the inertial
correction becomes weak in the presence of structural disorder,
which otherwise, significantly amplifies the intensity of inertia.
As a function of the different behaviors of the deviation from
Darcy's law, the flow was classified in different regimes calling
upon the following remarks:
(1) The weak inertia regime, where the inertial correction
has a cubic dependence upon the filtration velocity, is well
defined for the two different shapes of the solid inclusions,
different orientations of the pressure gradient, and both on
ordered and disordered structures. However, its interval of
validity is shorter when structural disorder is introduced to the
structure. This confirms previous results [24].
(2) Regarding the strong inertia regime (or Forchheimer
regime), where the inertial correction is proportional to the
square of the filtration velocity, it was observed that this regime
is not clearly identified and thus is only an approximation that
depends on the microstructure and orientation of the pressure
gradient. It is important to note, however, that the structural
disorder leads to a larger validity interval of this regime.
This is consistent with previous published observations
[24].
(3) A regime above strong inertia was identified, on large
ranges of Reynolds number, in all configurations, from the
upper limit of validity of the Forchheimer regime to the limit
of steady flow. For this regime, the dependence of the inertial
correction upon the filtration velocity is quadratic, or cubic
depending on the porous structure and on the orientation of
the pressure gradient.
Furthermore, the analysis of the recirculation zones in the flow
showed that the kinetic energy lost in these zones is negligible
compared to that of the total fluid phase and hence cannot be
at the origin of the deviation from Darcy's law. By contrast,
the volume of these zones is particularly important, not only
in comparison to the total volume of fluid, but also from the
point of view of its evolution with the Reynolds number that
was correlated to the flow regimes. Indeed, the volume of these
zones remains constant on the weak inertia regime, and then
starts to grow at the onset of the transition from weak to strong
inertia regimes.
In addition, the flow structure was also analyzed through
the average of the streamlines curvature weighted by the local
kinetic energy and the variation of the kinetic energy along
these lines. These quantities were derived from a decomposi
tion (in the Frenet frame) of the convective acceleration term
in the momentum transport equation. They give a theoretical
basis to the analysis in terms of streamlines tortuosity and
distribution of the kinetic energy invoked in a heuristic
way in the literature. From these analysis, we found the
following:
(1) As a consequence of the constant volume of the
recirculation zones in the weak inertia regime, this regime
is characterized by a constant flow streamlines curvature (and
hence, constant tortuosity). In addition, the variation of fluid
kinetic energy along these lines also remains constant. This
explains why this regime is always well identified.
(2) From the transition to the strong inertia regime, the
expansion of the recirculation zones with the Reynolds number
leads to a decrease in the streamlines curvature (a decrease
of the tortuosity as well). This expansion also tends to
homogenize the distribution of the kinetic energy in the system
and to reduce the variation of the kinetic energy along the
streamlines. The streamlines curvature weighted by the local
kinetic energy and the variation of the kinetic energy along
these lines feature a quasilinear dependence upon log(Rek)
in the strong inertia regime, although different forms of the
deviation from Darcy's law can be observed depending on
the porous structure and on the orientation of the pressure
gradient.
A thorough analysis in 3D configurations still needs to
be carried out to generalize the conclusions drawn from the
present work. However, previous results [32] indicate that the
behavior, at least regarding fcx , is similar on 3D ordered or
disordered structures made of cubic or spherical inclusions.
Since in three dimensions the decomposition of the convective
acceleration indicated by Eq. (25) remains valid in the Frenet
frame of coordinates (i.e., trajectory curvature weighted by
the kinetic energy in the normal direction and variation of
the kinetic energy along the trajectory for the tangential
component), results of such an analysis in three dimensions
that is currently under progress are expected to be analogous
to those in the present 2D case.

MEHREZ AGNAOU, DIDIER LASSEUX, AND AZITA AHMADI
[1] H. Darcy, Fontaines publiques de la ville de Dijon (Librairie des
Corps Imperiaux des Ponts et Chaussees et des Mines, Paris,
1856).
[2] S. Irmay, On the theoretical derivation of Darcy and Forchheimer
formulas, EOS, Trans. Am. Geophys. Union 39, 702 (1958).
[3] S. Whitaker, Flow in porous media I: A theoretical derivation of
Darcy's law, Transp. Porous Media 1, 3 (1986).
[4] S. P. Neuman, Theoretical derivation of Darcy's law, Acta Mech.
25, 153 (1977).
[5] E. Sanchez-Palencia, Non Homogeneous Media and Vibration
Theory, Lecture Notes in Physics, Vol. 127 (Springer, Berlin,
Germany, 1980).
[6] J. L. Auriault, in Applied Micromechanics of Porous Materials,
edited by L. Dormieux and F. J. Ulm, Courses and Lectures
vol. 840 (Springer, New York, 2005), pp. 3-56.
[7] M. R. Tek, Development of a generalized Darcy equation,
J. Petrol. Technol. 9, 45 (1957).
[8] G. S. Beavers and E. M. Sparrow, Non-Darcy flow through
fibrous porous media, J. Appl. Mech. 36, 711 (1969).
[9] A. Dybbs and R. V. Edwards, A new look at porous media fluid
mechanics-Darcy to turbulent, in Fundamentals of Transport
Phenomena in Porous Media (Springer, New York, 1984), pp.
199-256.
[10] P. H. Forchheimer, Wasserbewegung durch boden, Zeitz. Ver.
Duetch Ing. 45, 1782 ( 1901 ).
[11] E. F. Blick, Capillary-orifice model for high-speed flow through
porous media, Ind. Eng. Chem. Process Des. Dev. 5, 90 (1966).
[12] V. D. Cvetkovic, A continuum approach to high velocity flow in
a porous medium, Transp. Porous Media 1, 63 (1986).
[13] S. M. Hassanizadeh and W. G. Gray, High velocity flow in
porous media, Transp. Porous Media 2, 521 (1987).
[14] H. Ma and D. W. Ruth, The microscopic analysis of high
Forchheimer number flow in porous media, Transp. Porous
Media 13, 139 (1993).
[15] S. Whitaker, The Forchheimer equation: A theoretical develop
ment, Transp. Porous Media 25, 27 (1996).
[16] T. Giorgi, Derivation of the Forchheimer law via matched
asymptotic expansions, Transp. Porous Media 29, 191 (1997).
[17] Z. Chen, S. L. Lyons, and G. Qin, Derivation of the Forch
heimer law via homogenization, Transp. Porous Media 44, 325
(2001).
[18] C. C. Mei and J. L. Auriault, The effect of weak inertia on flow
through a porous medium, J. Fluid Mech. 222,647 (1991).
[19] L. Green and P. Duwez, Fluid flow through porous metals, J.
Appl. Mech. 18, 39 (1951).
[20] G. Chauveteau and C. L. Thirriot, Regimes d'ecoulement en
milieu poreux et limite de la loi de Darcy, Houille Blanche 2,
141 (1967).
[21] M. Agnaou, D. Lasseux, and A. Ahmadi, From steady to un
steady laminar flow in model porous structures: An investigation
of the first Hopf bifurcation, Comput. Fluids 136, 67 (2016).
[22] M. Rasoloarijaona and J. L. Auriault, Nonlinear seepage flow
through a rigid porous medium, Eur. J. Mech. B/Fluids 13, 177
(1994).
[23] D. L. Koch and A. J. Ladd, Moderate Reynolds number flows
through periodic and random arrays of aligned cylinders, J. Fluid
Mech. 349, 31 (1997).
[24] D. Lasseux, A. A. Arani, and A. Ahmadi, On the stationary
macroscopic inertial effects for one phase flow in ordered and
disordered porous media, Phys. Fluids 23, 073103 (2011 ).
[25] S. Rojas and J. Koplik, Nonlinear flow in porous media,
Phys. Rev. E 58, 4776 (1998).
[26] E. Skjetne and J. L. Auriault, New insights on steady, non-linear
flow in porous media, Eur. J. Mech. B Fluids 18, 131 (1999).
[27] A. Sohankar, C. Norberg, and L. Davidson, Low-Reynolds
number flow around a square cylinder at incidence: Study
of blockage, onset of vortex shedding and outlet boundary
condition, Int. J. Numer. Methods Fluids 26, 39 (1998).
[28] H. P. A. Souto and C. Moyne, Dispersion in two-dimensional
periodic porous media. Part I. Hydrodynamics, Phys. Fluids 9,
2243 (1997).
[29] M. Agnaou, D. Lasseux, and A. Ahmadi, Inertial flow in porous
media: A numerical investigation on model structures, in 5th
International Conference on Porous Media & Annual Meeting,
May 21-24, 2013, Prague, Czech Republic, 2013.
[30] M. Agnaou, D. Lasseux, and A. Ahmadi, Simulations
d'ecoulements inertiels en milieu poreux, in 2leme Congres
Franr;ais de Mecanique, 26 au 30 aout 2013, Bordeaux, France
(AFM, Maison de la Mecanique, Courbevoie, France, 2013).
[31] M. Agnaou, D. Lasseux, and A. Ahmadi, Etude numerique de
la correction a la loi de Darcy sur des structures poreuses 3d
desordonnees, in 12 emes journees d' etudes des milieux poreux
2014, October 9-10, 2014, Toulouse, France, 2014.
[32] M. Agnaou, D. Lasseux, and A. Ahmadi, Une etude numerique
des ecoulements mono et diphasique inertiels en milieux poreux,
Ph.D. thesis, Paris, ENSAM (2015).
[33] M. Fourar, G. Radilla, R. Lenormand, and C. Moyne, On the
non-linear behavior of a laminar single-phase flow through two
and three-dimensional porous media, Adv. Water Resour. 27,
669 (2004).
[34] R. M. Fand, B. Y. K. Kim, A. C. C. Lam, and R. T. Phan,
Resistance to the flow of fluids through simple and complex
porous media whose matrices are composed of randomly packed
spheres, J. Fluids Eng. 109, 268 (1987).
[35] I. Kececioglu and Y. Jiang, Flow through porous media of packed
spheres saturated with water, J. Fluids Eng. 116, 164 (1994).
[36] J. L. Lage, B. V. Antohe, and D. A. Nield, Two types of nonlinear
pressure-drop versus flow-rate relation observed for saturated
porous media, J. Fluids Eng. 119, 700 (1997).
[37] 0. Reynolds, in Papers on Mechanical and Physical Subjects,
No. 2 (Cambridge University Press, Cambridge, England, 1901),
pp. 734-738.
[38] G. H. Fancher and J. A. Lewis, Flow of simple fluids through
porous materials, Ind. Eng. Chem. 25, 1139 (1933).
[39] L. E. Brownell and D. L. Katz, Flow of fluids through porous
media. 1. Single homogeneous fluids, Chem. Eng. Prog. 43, 537
(1947).
[ 40] M. R. Tek, K. H. Coats, and D. L. Katz, The effect of turbulence
on flow of natural gas through porous reservoirs, J. Petrol.
Technol. 14, 799 (1962).
[41] G. Chauveteau, Essai sur la loi de Darcy, These, Universite de
Toulouse (1965).
[42] E. M. Minsky, On the turbulent flow through porous media, In
Dokl Acad Nauk SSSR 58,409 (1951).
[43] C. Chukwudozie and M. Tyagi, Pore scale inertial flow sim
ulations in 3-D smooth and rough sphere packs using lattice
Boltzmann method, AIChE J. 59, 4858 (2013).
[ 44] A. Houpeurt, Etude analogique de l' ecoulement radial circulaire
transitoire des gaz dans les milieux poreux Rev. Inst. Fr. Petr. 8,
129 (1953); 5, 193 (1953); 6, 248 ( 1953).

ORIGIN OF THE INERTIAL DEVIATION FROM DARCY's ...
[45] D. Hlushkou and U. Tallarek, Transition from creeping via
viscous-inertial to turbulent flow in fixed beds, J. Chromatogr.
A 1126, 70 (2006).
[46] R. E. Hayes, A. Afacan, and B. Boulanger, An equation of
motion for an incompressible Newtonian fluid in a packed bed,
Transp. Porous Media 18, 185 (1995).
[47] J. S. Andrade, Jr., U. M. S. Costa, M. P. Almeida, H. A. Makse,
and H. E. Stanley, Inertial Effects on Fluid Flow Through
Disordered Porous Media, Phys. Rev. Lett. 82, 5249, (1999).
[48] R. Sivanesapillai, H. Steeb, and A. Hartmaier, Transition of
effective hydraulic properties from low to high Reynolds number
flow in porous media, Geophys. Res. Lett. 41, 4920 (2014).
[49] M. Veyskarami, A.H. Bassani, and M. H. Ghazanfari, Modeling
of non-Darcy flow through anisotropic porous media: Role of
pore space profiles, Chem. Eng. Sci. 151, 93 (2016).
[50] F. Larachi, R. Hannaoui, P. Horgue, F. Angier, Y. Haroun, S.
Youssef, E. Rosenberg, M. Prat, and M. Quintard, X-ray micro
tomography and pore network modeling of single-phase fixed
bed reactors, Chem. Eng. J. 240, 290 (2014).
[51] A. Z. Barak, Comments on 'High velocity flow in porous
media' by Hassanizadeh and Gray, Transp. Porous Media 2, 533
(1987).
[52] M. Panfilov and M. Fourar, Physical splitting of nonlinear effects
in high-velocity stable flow through porous media, Adv. Water
Resour. 29, 30 (2006).
[53] T. Suekane, Y. Yokouchi, and S. Hirai, Inertial flow structures
in a simple-packed bed of spheres, AIChE J. 49, IO (2003).
[54] W. G. Gray, A derivation of the equations for multi-phase
transport, Chem. Eng. Sci. 30, 229 (1975).
[55] M. Zuzovsky, P. M. Adler, and H. Brenner, Spatially periodic
suspensions of convex particles in linear shear flows. III. Dilute
arrays of spheres suspended in Newtonian fluids, Phys. Fluids
26, 1714 (1983).
[56] M. Agnaou, D. Lasseux, and A. Ahmadi, Hopf bifurcation
for one-phase flow in model porous media, 13 emes journees
d'etudes des milieux poreux 2016, October 11-14, 2016, Anglet,
France, 2016.
[57] F. J. Valdes-Parada, D. Lasseux, and F. Bellet, A new formu
lation of the dispersion tensor in homogeneous porous media,
Adv. Water Resour. 90, 70 (2016).
[58] H. I. Ene and E. Sanchez-Palencia, Equations et phenomenes
de surface pour l' ecoulement dans un modele de milieu poreux,
J. Mee. 14, 73 (1975).
[59] D. Lasseux and F. J. Valdes-Parada, Symmetry properties of
macroscopic transport coefficients in porous media, Phys. Fluids
29, 043303 (2017).
[60] COMSOL Multiphysics, Comsol multiphysics user's guide
version 4.3a, October 2012.
[61] P.R. Amestoy, I. S. Duff, J. Y. L'Excellent, and J. Koster, A fully
asynchronous multifrontal solver using distributed dynamic
scheduling, SIAM J. Matrix Anal. Appl. 23, 15 (2001).
[62] K. Pearson, Note on regression and inheritance in the case of
two parents, Proc. R. Soc. London 58, 240 (1895).
[63] J. Lee Rodgers and W. A. Nicewander, Thirteen ways to look at
the correlation coefficient, Am. Stat. 42, 59 (1988).
[64] I. Panfilova, M. Bues, and M. Panfilov, High-rate Navier
Stokes flow in porous media: d' Alembert paradox and its
solution, in Poromechanics fl, Second Biot Conference on
Poromechanics, Grenoble, France, edited by Auriault et al.,
(Swets and Zeitlinger, Lisse, 2000), pp. 495-500.
[65] M. Panfilov, C. Oltean, I. Panfilova, and M. Bues, Singular
nature of nonlinear macroscale effects in high-rate flow through
porous media, C.R. Mee. 331, 41 (2003).
[66] J. Bear, Dynamics of Fluid Flow in Porous Media (American
Elsevier, New York, 1972).
[67] A. Duda, Z. Koza, and M. Matyka, Hydraulic tortuosity
in arbitrary porous media flow, Phys. Rev. E 84, 036319
(2011).
[ 68] M. Matyka and Z. Koza, How to calculate tortuosity easily? AIP
Conf. Proc. 1453, 17 (2012).