Embed Size (px)
Citation preview

Managing firms in an emerging economy:id f th ti f I di CEOevidence from the time use of Indian CEOs
Oriana BandieraLondon School of Economics
Istanbul May 2013Istanbul, May 2013
based on work joint with Andrea Prat (CBS) and Raffaella Sadun (HBS)

Some firms systematically perform better than others
• Ra differences in firm• Raw differences in firm productivity
• Control for location…• … industry• … size 90%
plant
• … capital employed• … labor employed
bl f t
90%plant
• … any measurable factor• Still large, persistent differences• Even larger in emerging markets
10%plant
10%plantEven larger in emerging markets
• Due to management?
p
US India
2
US India
The CEO Factor is a popular explanation
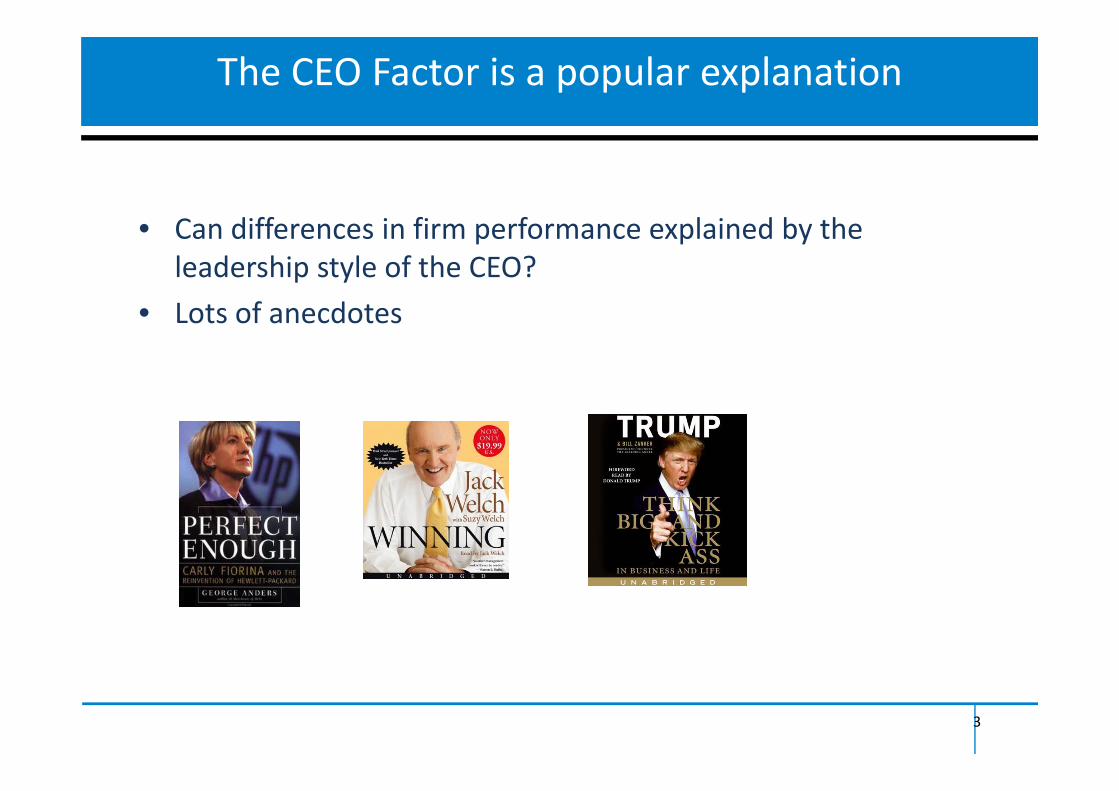
• Can differences in firm performance explained by the leadership style of the CEO?L t f d t• Lots of anecdotes
3

Yet little is known about what CEOs do
how do CEOs use their time?how do CEOs use their time?is it correlated with firm performance?
if so, why do different CEOs do different things?

We ask them
• Develop a new survey methodology to collect data on time use of CEOs
• Time use:– what they do– who with– how far in advance they plan..y p
• provide systematic quantitative evidence on what CEO do, whether it correlates with firm performance pand whether (and why) it differs across firms
• builds on case‐study “shadowing” approach

Previous Research
Mintzberg 1973: 5 CEOs over a week
6

Our Research
2009: 94 Italian CEOs over a week
7

Our Research (Today)
2012: 354 CEOs of medium/large Indian firms
8

Our Research
Ongoing: 600+ CEOs in US, Brazil, France, Germany, UK
9
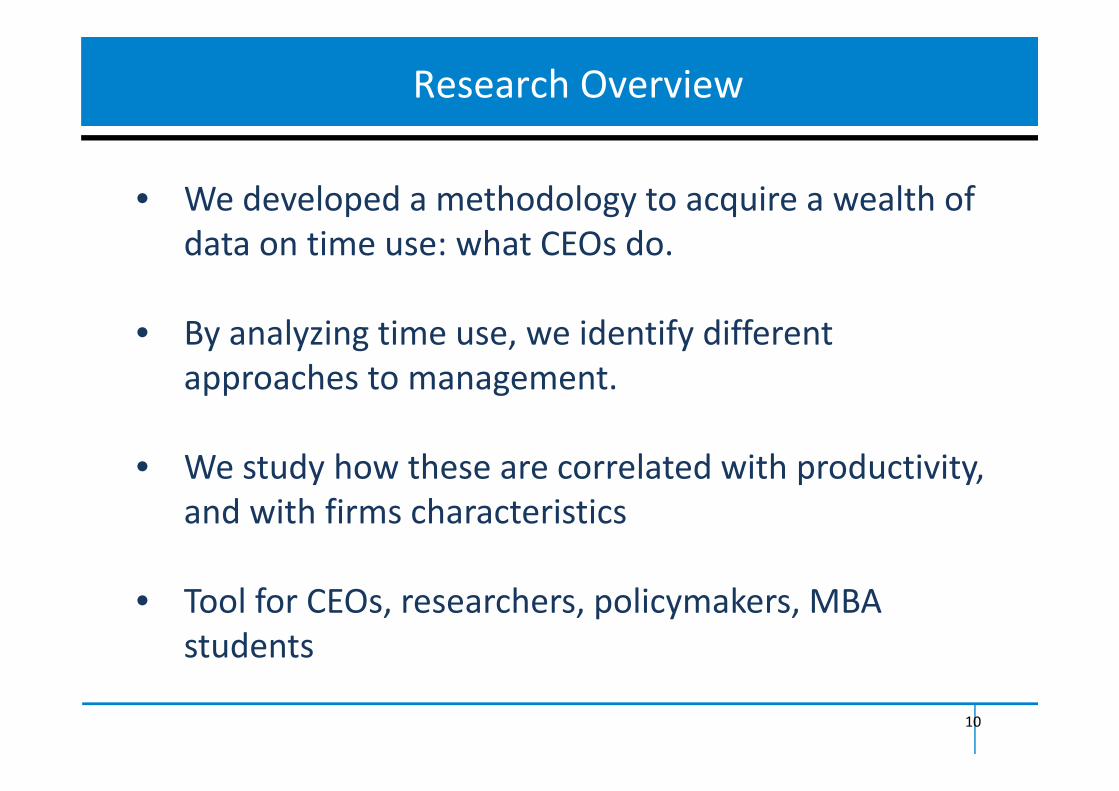
Research Overview
• We developed a methodology to acquire a wealth of p gy qdata on time use: what CEOs do.
• By analyzing time use, we identify different approaches to management.pp g
• We study how these are correlated with productivity, and with firms characteristics
• Tool for CEOs, researchers, policymakers, MBA students
10

Our Methodology
Our rich data set allows us to go beyond organizational charts to observe how CEOs use their time.
What They Say
CEO
What They Do• Priorities: Share of time spent
CEO
A
a
B
a
C
a
with different functions.• Skipping levels: Time spent not
with direct reportsa
b
c
a
b
a
b
c
with direct reports• Mode: Type of activity,
duration, location, number of l
d
e
people• Inside/Outside: Time spent in
activities with outsiders.• Planning: Spontaneous vs
planned activities.But two identical org chartscan correspond to completely different activities
11
different activities…

Our sample
• 354 CEOs of listed manufacturing gfirms across 15 Indian statesIndian states
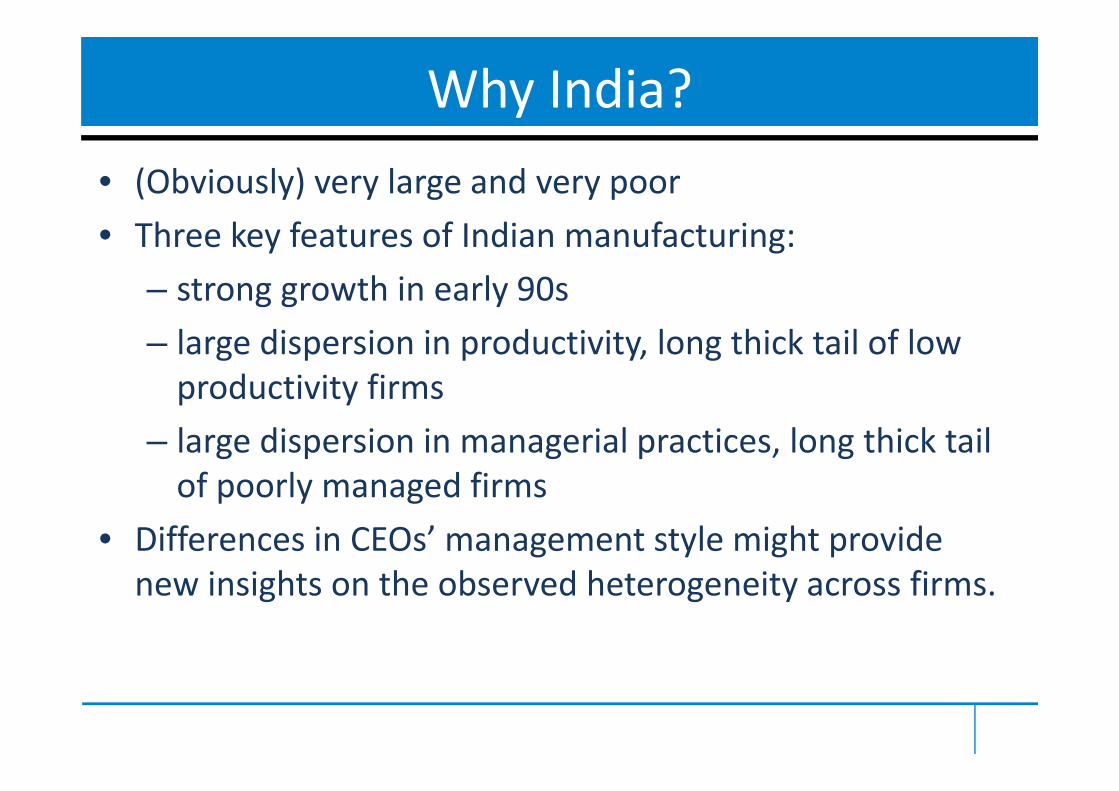
Why India?• (Obviously) very large and very poor• Three key features of Indian manufacturing:
– strong growth in early 90sg g y– large dispersion in productivity, long thick tail of low productivity firmsproductivity firms
– large dispersion in managerial practices, long thick tail of poorly managed firmsof poorly managed firms
• Differences in CEOs’ management style might provide i i ht th b d h t it finew insights on the observed heterogeneity across firms.

Roadmapp
1. what do CEOs do?1. what do CEOs do?2. is it correlated with firm performance?3. if so, why do different CEOs do different
things?g

Sample selection• Sampling frame is: 8,000 listed manufacturing firms with accounting data on ORBIS
p
with accounting data on ORBIS• Restricted to:
– firms active since 2006– firms active since 2006– largest states + $2 million in sales
• Out of 3 500 firms we could find contact details for• Out of 3,500 firms we could find contact details for 1,429 CEOs. Of th 26% d t ti i t• Of these, 26% agreed to participate
• Sample firms have 1.8% lower sales but no significant selection on performance

Our Samplep
• Firm characteristics– 1220 employees avg. (median=400)– 15 states (Maharashtra 36%, Gujarat 15%)– 70% family CEO
• CEO characteristics– 50 years old– 13 years in post– 41% with MBA– all men

Collecting time use datag
f l d b d i• Team of 15 analysts and 3 managers based in Mumbai‐May to July 2011
• Cold call CEOs to get their approval (offer personalized time use analysis in exchange)p y g )
• Call each CEO’s PA every day for a week• Collect detailed information on all activities• Collect detailed information on all activities longer than 15 minutes
• Final check with the CEO at the end of the week
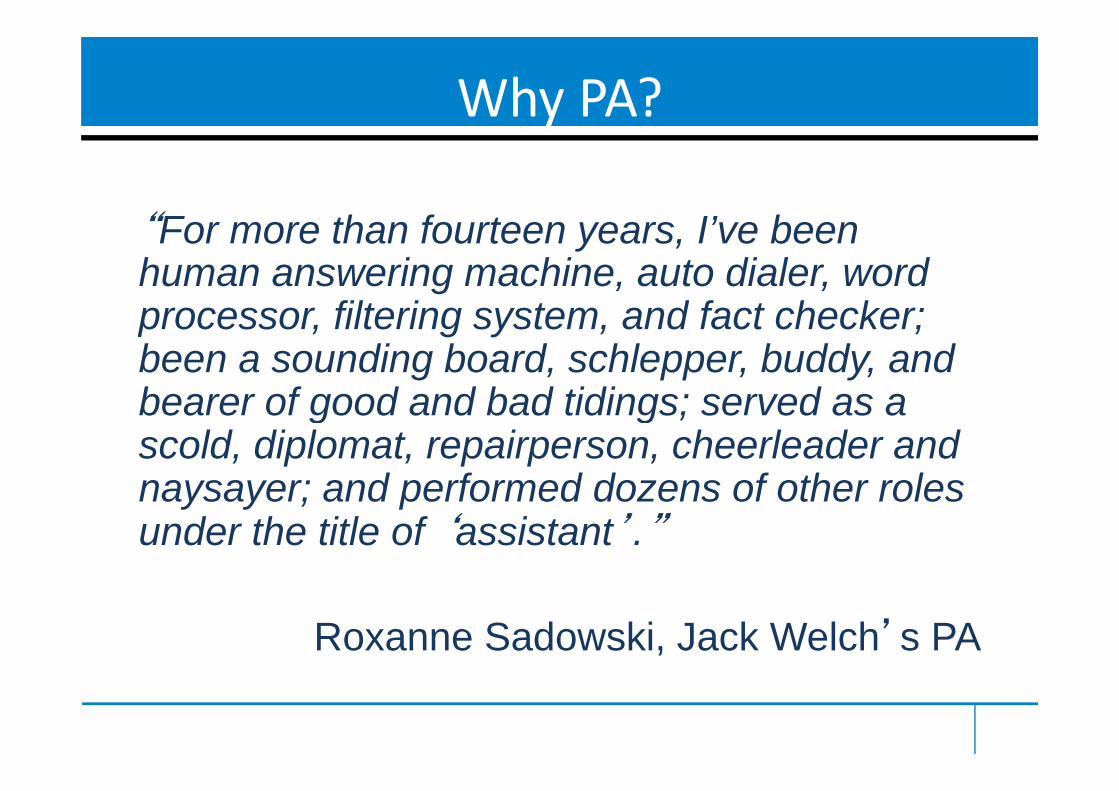
Why PA?
“F th f t I’ b
y
“For more than fourteen years, I’ve been human answering machine, auto dialer, word
filt i t d f t h kprocessor, filtering system, and fact checker; been a sounding board, schlepper, buddy, and bearer of good and bad tidings; served as abearer of good and bad tidings; served as a scold, diplomat, repairperson, cheerleader and naysayer; and performed dozens of other rolesnaysayer; and performed dozens of other roles under the title of ‘assistant’.”
Roxanne Sadowski, Jack Welch’s PA

Collecting time use datag
mondaynight
• ask about activities done on mondayand schedule for tuesdaynight y
tuesdaynight
• ask about activities done on tuesday and schedule for wednesday
d dwednesdaynight • ….

We first ask for a list of all the activities undertaken
We then ask a LOT of detail for each activity

Limitations
• we do not measure activities out of business hours that are not on the CEOs diaries
• we do not measure activities shorter than 15 minutesminutes
• this implies we understate hours worked• but can still meet our goal of measuring CEOs management stylemanagement style

Time use or noise?• a week might not be enough to capture typical CEO behavior e g due to high frequency shocksCEO behavior, e.g. due to high frequency shocks
• three reassuring pieces of evidence:– time use is systematically linked to specific firm characteristics (e.g., firm size) ( g , )
– large correlation across dayssubstantial heterogeneity in time use even if we– substantial heterogeneity in time use even if we restrict the sample to the 60% of CEOs who score the survey week as highly representativesurvey week as highly representative
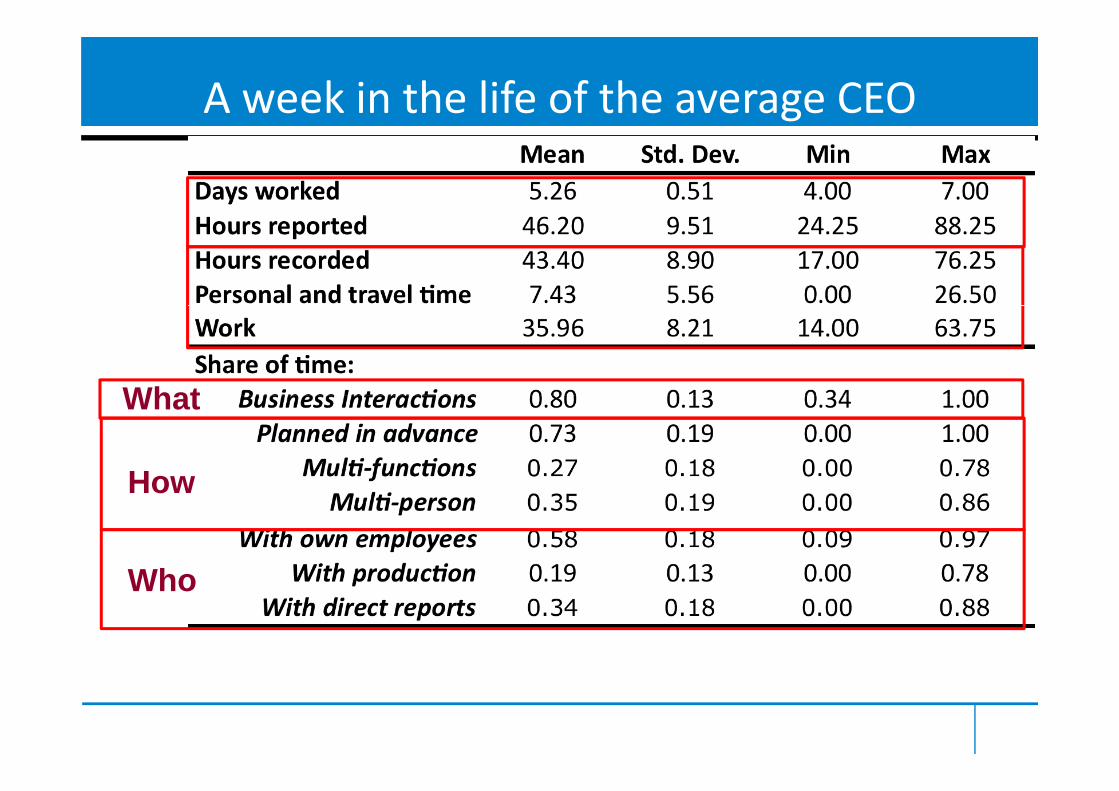
A week in the life of the average CEO
What
How
What
How
WhoWho

CEOs work very different hours

They do different thingsy g
meetings
share of working time

Organize their time differentlyg y
pre‐planned
share of working time

Interact with different people...p p
t idoutsiders
insidersep
orts
direct re
share of working time

…and functions
alcapita
share of working time
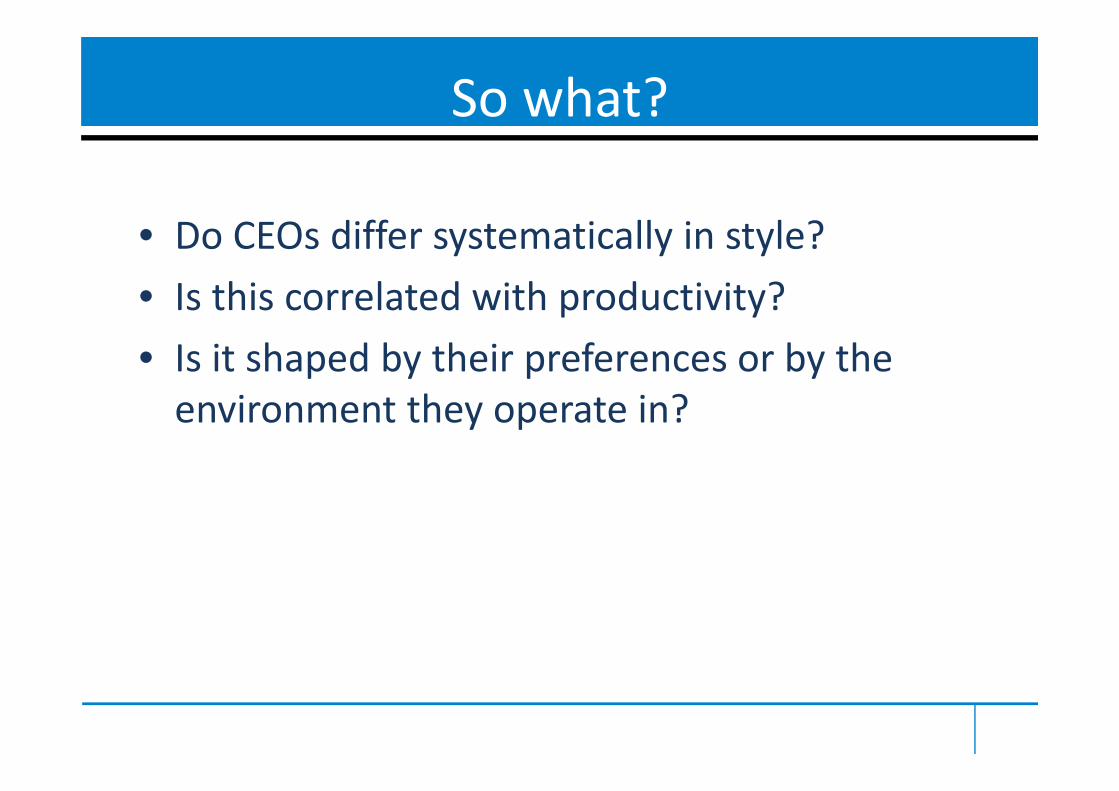
So what?
• Do CEOs differ systematically in style?• Is this correlated with productivity?Is this correlated with productivity?• Is it shaped by their preferences or by the
i h i ?environment they operate in?

Looking for “style”g y
i l k l l i d• We use a simple k‐cluster analysis to reduce multi‐dimensionality of time data to a simpler classification
• Assign CEOs into groups so that CEOs in the g g psame cluster are more similar to each other than to those in other clusters
• Start from minimum interesting number of groups: k=2groups: k=2
• Data reveals two very different CEO styles

Management Style Profilesg yBlue CEOs spend more time with outsiders. Green CEOs spend more time with insiders.
Percent of time spent inInsiders
51%
75%
Percent of time spent in meetings that include at least one person who is not a firm employee
75%
Outsiders49%
25%25%
31

Management Style Profilesg yBlue CEOs prefer one‐function activities. Green CEOs spend more time on multi‐function activities.
One58%
Percent of time spent in meetings that involve more than one function ( fi k ti One
function83%(e.g. finance, marketing,
production)
Multiple 42%
functions 17%
32

Management Style Profiles
Blue CEOs Green CEOs61% 39%
S l dStructure
Spontaneous PlannedSkip‐level reports Direct reports
Outsiders InsidersFocus
Outsiders InsidersNon‐core Ops/production
One‐on‐one Many participantsSpan
One on one Many participantsOne function Multi‐functions
Controlling for all firm characteristics, which style is associated with better firm performance?
33
which style is associated with better firm performance?

Which style goes with performance?Control for industry, location, capital, labor, and all other observable f t
1.34 1.371.19
factors.
1.00 1.00 1.00
Revenue Profit ROCE
Blue: spontaneous, non‐hierarchical, outward, non‐core, one‐on‐oneGreen: planned direct reports inward production multiGreen: planned, direct reports, inward, production, multi‐function
34

CEO time use and firm performance•Collect external measures of firm performance from ORBIS and estimate simple production function by OLSp p y
y(it)=log sales, l(it)=log employees, k(it)=log capitalh(i)=ln CEO labor supply (time invariant)( ) pp y ( )Dstyle(i)=dummy Green (time invariant)
– Use panel accounting data, clustering at the firm level– Keep only years when CEO is in officeKeep only years when CEO is in office– Keep only max three most recent years in data per CEO to avoid selection on long tenureg

Both hours worked and style are correlated with firm performance
Table 1 ‐ CEO labor supply, style and firm performance(1) (2) (3) (4) (5) (6)
Dependent Variable ln(Profits) ROCEln(Sales)p ( )
ln(Average Number of Hours Worked) 1.773*** 0.875** 0.833** 0.862** 1.370*** 4.809*
( )
(0.575) (0.375) (0.404) (0.430) (0.422) (2.548)Style Green 0.717*** 0.332** 0.307** 0.319** 0.365** 1.867*
(0.233) (0.149) (0.153) (0.158) (0.182) (1.030)L (E l t) 0 041 0 021*** 0 246*** 0 214** 0 293*** 0 053Ln(Employment) 0.041 0.021*** 0.246*** 0.214** 0.293*** 0.053
(0.027) (0.006) (0.085) (0.083) (0.110) (0.591)Ln(Capital) 0.738*** 0.665*** 0.698*** 0.648*** ‐0.211
(0.044) (0.053) (0.059) (0.061) (0.354)1 sd in log(hrs) = 20% higher productivity (19% of cross sectional sd in TFP)(0.044) (0.053) (0.059) (0.061) (0.354)
Constant ‐2.557** ‐5.666*** ‐6.320*** ‐5.801*** ‐6.553*** ‐1.086(0.987) (0.693) (0.885) (1.942) (1.963) (12.271)
R‐squared 0.158 0.649 0.680 0.699 0.683 0.150
sectional sd in TFP)
Style 1 = 32% higher productivity Observations 753 753 753 753 617 669Number of firms 281 281 281 281 258 267Year dummies y y y y y yIndustry dummies y y y yIndustry dummies y y y yState dummies y y y
Notes: Errors clustered at the firm level, 2003-2010 data, max 3 years per CEO

Interpretation • Reverse causality bias a priori ambiguous
p
– Positive if productivity shock increases returns to CEO labor supply, reduces need to firefight, etc
– Negative if productivity shock generates free cash flows, allows for substitution with labor,
• Omitted variablesE g matching firms and CEO types– E.g. matching firms and CEO types
– Placebo test shows no correlation between hours, l d f i b f CEO i i ffistyle and performance in years before CEO is in office

Why do CEOs differ?y
• If effort and style green are associated to higher performance, why are there differences across CEOs?
1. optimal response to external constraints:– Weak rule of law creates incentive for hands‐on approach – Bad infrastructures might constrain ability to plan
2. differences in production functions2. differences in production functions3. differences in preferences/incentives/accountability

Why do CEOs differ?y
• We estimateS 'S I ' I F 'F C 'Cxi S 'Si
I ' I i F 'Fi
C 'Ci i
x(i)=ln CEO labor supply or style green dummyS=State characteristics (gdp pc, financial development,
k ll l f f )average skills, quality of infrastructures)I=Industry characteristics (2 digit SIC dummies)C=CEO characteristics (age, tenure, external engagements)F= firm characteristics (ownership, size)

External environment explains littlep
• In fact, most of the variation in the data is within states and industries rather than between them– State variables not significantly correlated with time usetime use
– Industry fixed effects significant, but account for small fraction of variancesmall fraction of variance

Firm ownership mattersp
• Family CEOs (2nd generation, affiliated to the family)– Lower labor supply (7%)– Less likely to be green (13 pp)
• Difference between Family CEOs and professional• Difference between Family CEOs and professional managers robust to inclusion of firm, CEO, industry, state and noise controlsstate and noise controls

Family CEOs and Labor Supply

Family CEOs and Style
Dependent variable(1) (2) (3) (4) (5) (7)
Family ownership & CEO ‐0.178*** ‐0.165*** ‐0.172*** ‐0.178*** ‐0.194*** ‐0.129*( ) ( ) ( ) ( ) ( ) ( )
1 if style is Green
(0.057) (0.058) (0.066) (0.068) (0.073) (0.078)Ln(Employment) 0.049** 0.045* 0.051** 0.050** 0.048**
(0.022) (0.023) (0.023) (0.024) (0.024)Ln(Firm age) 0.001 0.001 0.007 0.014 0.021g
(0.050) (0.050) (0.054) (0.058) (0.055)CEO works for other firms 0.034 0.024 0.035 ‐0.036
(0.070) (0.071) (0.077) (0.074)CEO sits on other boards ‐0 000 ‐0 011 ‐0 008 0 073CEO sits on other boards ‐0.000 ‐0.011 ‐0.008 0.073
(0.063) (0.065) (0.071) (0.068)Ln(CEO age) 0.038 0.035 0.117 0.070
(0.137) (0.140) (0.147) (0.146)L (1 C O i ) 0 002 0 010 0 008 0 000Ln(1+CEO tenure in post) 0.002 0.010 0.008 ‐0.000
(0.034) (0.035) (0.038) (0.039)Constant 0.491*** 0.179 0.041 ‐0.309 5.304** 4.923*
(0.048) (0.187) (0.521) (0.486) (2.610) (2.569)R‐squared 0.026 0.040 0.030 0.030 0.048 0.139Number of firms 354 354 354 354 354 354Firm controls y y y y yCEO controls y y y yCEO controls y y y yState dummies y y yIndustry dummies y yNoise controls y

Why do we care?
• Why is this interesting?– Large fraction of business worldwide family owned g y– Existing evidence indicates worse performanceTime use could be an underlying mechanism– Time use could be an underlying mechanism
• What do cross‐sectional differences tell us?• Cannot separate differences due to
technology/organization and totechnology/organization and to preferences/ability

Identification
• Find factors that affect the cost or benefit of effort regardless of ownership structure g p
• Exploit changes in these factors to separate differences due to technology/organizationdifferences due to technology/organization
• Two factors:– competitive pressure– rainrain

Identification 1: Competitionp
• Suppose that in a more competitive environment, only sufficiently productive y y pfirms survive, all else equal.
• The d i d (ownership/competition) identifies• The d‐i‐d (ownership/competition) identifies differences in motivation/ability from ff h ldifferences in technology
• … but cannot separate motivation and ability… but cannot separate motivation and ability

Difference in labor supply is larger when competition is lower
Dependent Variable ln(CEO Hours)p(1) (2) (3) (4) (5) (6)
Family ownership & CEO ‐0.058* ‐0.058* ‐0.057** ‐0.057**
( )
HC=MNE/EXPORT HC=LERNER
(0.033) (0.032) (0.028) (0.029)LC ‐0.063** ‐0.048*
(0.032) (0.026)Family ownership & CEO HC 0 051 0 044Family ownership & CEO ‐ HC ‐0.051 ‐0.044
(0.033) (0.028)Family ownership & CEO ‐ LC ‐0.129*** ‐0.107**
(0.045) (0.045)(0.045) (0.045)Other ownership ‐ LC ‐0.023 ‐0.015
(0.073) (0.034)Number of firms 354 354 354 331 331 331Test Family CEO HC= Family CEO LC 0.03 0.08Test Other LC= Family CEO LC 0.20 0.09
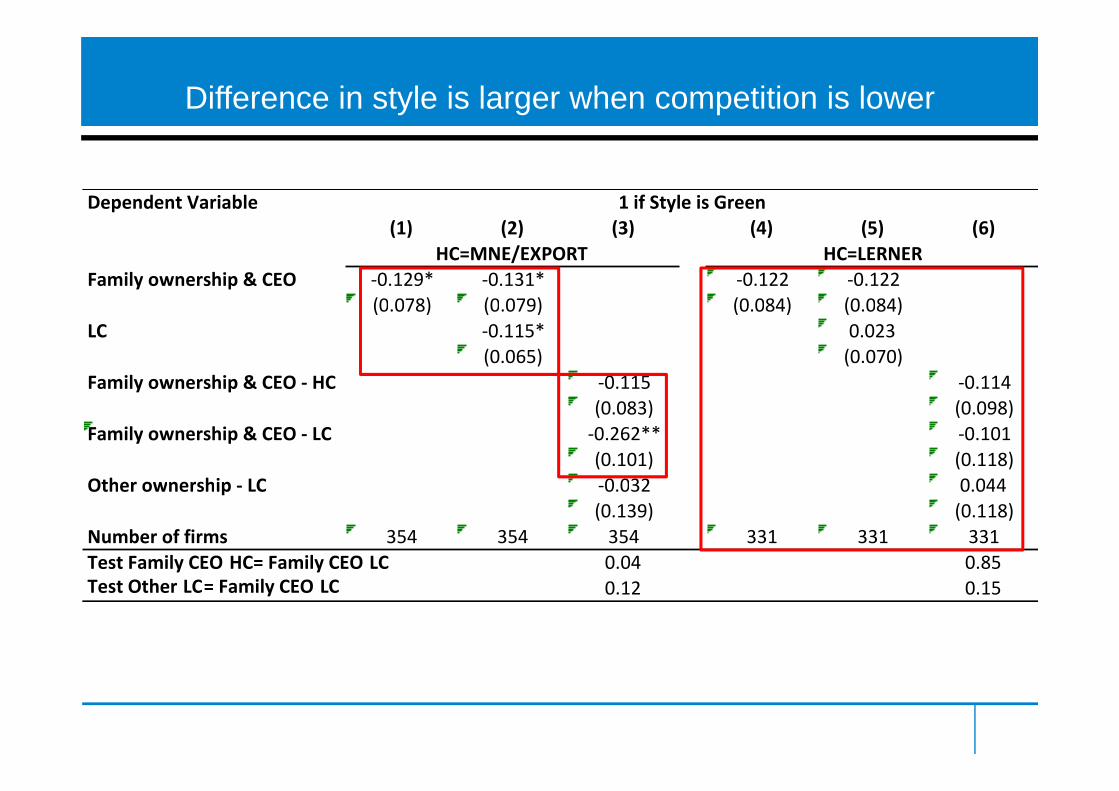
Difference in style is larger when competition is lower
Dependent Variable 1 if Style is Green(1) (2) (3) (4) (5) (6)
Family ownership & CEO ‐0.129* ‐0.131* ‐0.122 ‐0.122(0 078) (0 079) (0 084) (0 084)
HC=MNE/EXPORT HC=LERNER
(0.078) (0.079) (0.084) (0.084)LC ‐0.115* 0.023
(0.065) (0.070)Family ownership & CEO ‐ HC ‐0.115 ‐0.114
(0.083) (0.098)Family ownership & CEO ‐ LC ‐0.262** ‐0.101
(0.101) (0.118)Other ownership LC 0 032 0 044Other ownership ‐ LC ‐0.032 0.044
(0.139) (0.118)Number of firms 354 354 354 331 331 331Test Family CEO HC= Family CEO LC 0.04 0.85Test Other LC= Family CEO LC 0.12 0.15

Interpretationp
• Difference between family and professional CEOs driven by firms that face low ycompetition
• Inconsistent with hypothesis that the time use• Inconsistent with hypothesis that the time use of family CEOs is optimal response to different
h l /technology/organization• Suggests that family CEOs have lowerSuggests that family CEOs have lower motivation/ability
Identification 2: Monsoons
• Suppose that the cost of going to work is higher when monsoon rains hitg
• The d‐i‐d (ownership/weather) identifies differences in motivation/ability fromdifferences in motivation/ability from differences in technology
• … but cannot separate motivation and ability

Shock: Monsoon Rain

The onset of the Monsoon in India
• Monsoons officially started on May 29th 2011 and lasted
til S t b 15thuntil September 15th
• Onset varies across states (Tamil Nadu hit on May 29th(Tamil Nadu hit on May 29th, Rajasthan on July 1st)
• 70% of CEOs data collected• 70% of CEOs data collected after Monsoon hit the area
• Activity specific zip codeActivity specific zip code used to match CEO use of time with daily rainfall data collected in closest weather station
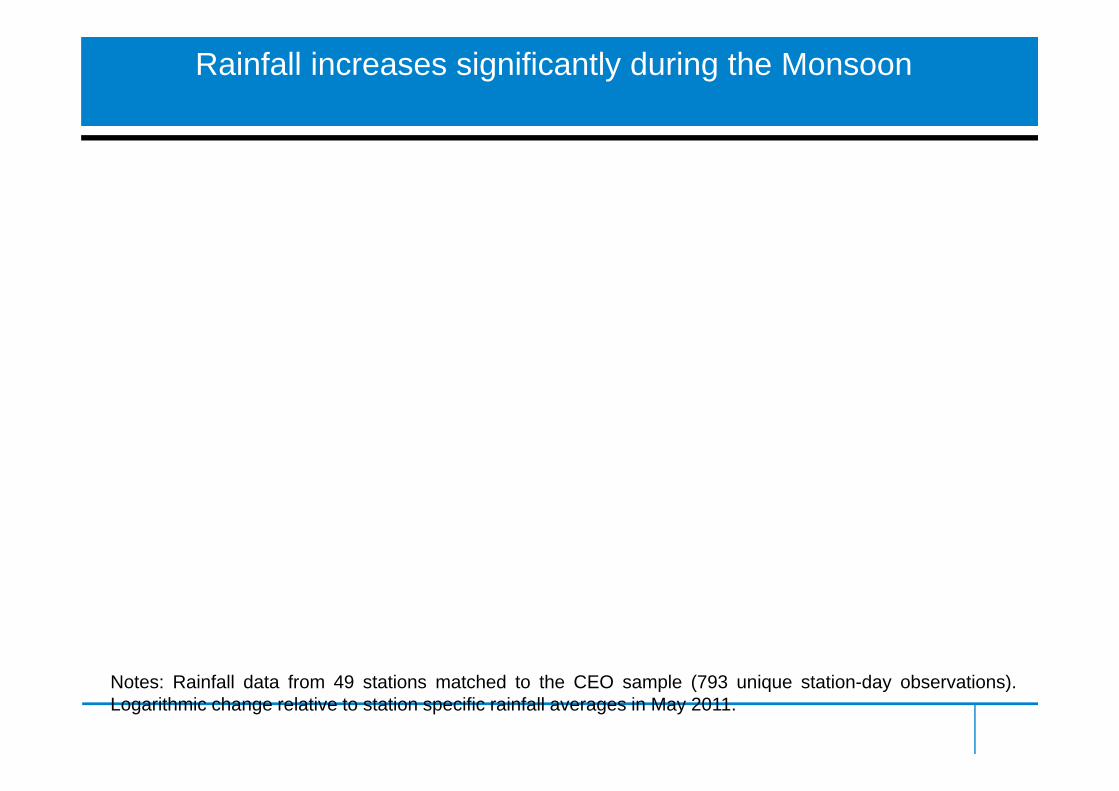
Rainfall increases significantly during the Monsoon
Weeks before/after onset of the Monsoon in the StateNotes: Rainfall data from 49 stations matched to the CEO sample (793 unique station-day observations).Logarithmic change relative to station specific rainfall averages in May 2011.

Rainfall intensity also varies within a week
Weeks before/after onset of the Monsoon in the StateNotes: Rainfall data from 49 stations matched to the CEO sample (793 unique station-day observations).Intense rain dummy=1 if logarithmic change relative to station specific rainfall averages in May 2011 is in thethird tercile of the distribution.
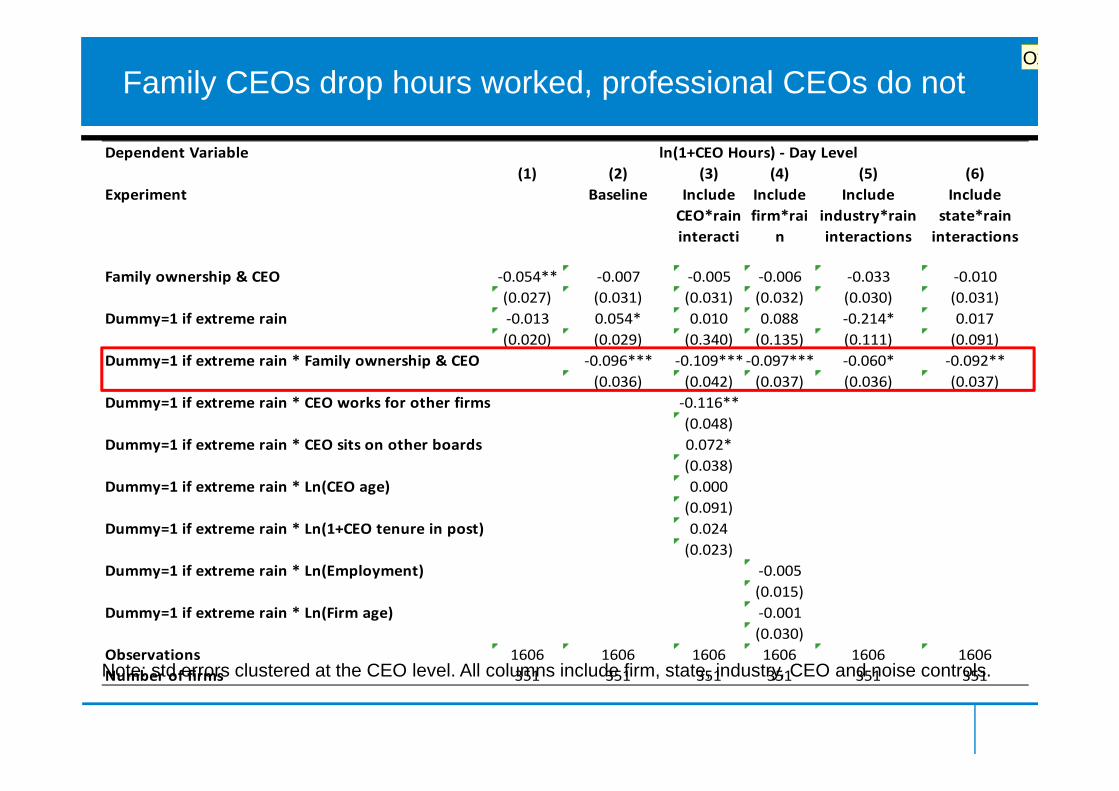
Family CEOs drop hours worked, professional CEOs do not
Dependent Variable(1) (2) (3) (4) (5) (6)
Experiment Baseline Include CEO*rain
Include firm*rai
Include industry*rain
Include state*rain
ln(1+CEO Hours) ‐ Day Level
CEO rain interacti
firm rain
industry rain interactions
state rain interactions
Family ownership & CEO ‐0.054** ‐0.007 ‐0.005 ‐0.006 ‐0.033 ‐0.010(0.027) (0.031) (0.031) (0.032) (0.030) (0.031)
Dummy=1 if extreme rain ‐0.013 0.054* 0.010 0.088 ‐0.214* 0.017(0.020) (0.029) (0.340) (0.135) (0.111) (0.091)
Dummy=1 if extreme rain * Family ownership & CEO ‐0.096*** ‐0.109*** ‐0.097*** ‐0.060* ‐0.092**(0.036) (0.042) (0.037) (0.036) (0.037)
Dummy=1 if extreme rain * CEO works for other firms ‐0.116**(0.048)
Dummy=1 if extreme rain * CEO sits on other boards 0.072*(0.038)
Dummy=1 if extreme rain * Ln(CEO age) 0 000Dummy=1 if extreme rain * Ln(CEO age) 0.000(0.091)
Dummy=1 if extreme rain * Ln(1+CEO tenure in post) 0.024(0.023)
Dummy=1 if extreme rain * Ln(Employment) ‐0.005
N t td l t d t th CEO l l All l i l d fi t t i d t CEO d i t l
Dummy 1 if extreme rain Ln(Employment) 0.005(0.015)
Dummy=1 if extreme rain * Ln(Firm age) ‐0.001(0.030)
Observations 1606 1606 1606 1606 1606 1606Note: std errors clustered at the CEO level. All columns include firm, state, industry, CEO and noise controls. Number of firms 351 351 351 351 351 351
O1

Slide 55
O1 we need to show the distribution and definition of the extreme rain variableOriana; 06.11.2012

but only if they face low competition
Table 7: Response to Rain Shocks by Ownership Types and CompetitionDependent Variable
(1) (2) (3) (4)Extreme Rain ‐0.012 0.059* ‐0.018 0.045
ln(1+CEO Hours) ‐ Day Level HC=MNE/EXPORT HC=LERNER
(0.020) (0.030) (0.024) (0.045)Family ownership & CEO ‐ High Competition ‐0.051* ‐0.010 ‐0.047** ‐0.022
(0.027) (0.033) (0.022) (0.037)Family ownership & CEO ‐ Low Competition ‐0 138*** ‐0 068 ‐0 087** ‐0 006Family ownership & CEO Low Competition 0.138 0.068 0.087 0.006
(0.037) (0.041) (0.036) (0.037)Other ownership ‐ Low Competition ‐0.051 ‐0.052 ‐0.009 ‐0.003
(0.056) (0.084) (0.030) (0.046)Extreme rain * Family ownership & CEO High Competition 0 086** 0 053Extreme rain * Family ownership & CEO ‐ High Competition ‐0.086** ‐0.053
(0.038) (0.055)Extreme rain * Family ownership & CEO ‐ Low Competition ‐0.158** ‐0.166***
(0.062) (0.060)* h hExtreme rain * Other ownership & CEO ‐ Low Competition ‐0.011 ‐0.020
(0.103) (0.057)Observations 1606 1606 1499 1499
Note: std errors clustered at the CEO level in cols 1 and 2, at the CEO and industry level in cols 3 and 4. All regressions include noise, CEO, state, industry and firm controls
Summaryy
• Time use analysis reveals that different CEOs work• Time use analysis reveals that different CEOs work different hours and have different “styles”
h ff d l l d h f• Both effort and style are correlated with performance• Family CEOs work less / choose the less productive style• In line with differences in preferences or incentives rather than optimal responses to different technologyp p gy

Open questions and next stepsp q p
• is the same style associated with performance outside of India?
• does the process of development leads to convergence to style green and long workingconvergence to style green and long working hours?
• ongoing data collection: US, France, Germany, UK, Brazil
Thank you for your time!
http://sticerd.lse.ac.uk/executivetimehttp://sticerd.lse.ac.uk/executivetimeuse/default.asp