Embed Size (px)
Citation preview

J.C.J. Bart, Polymer Additive Analytics: Industrial Practice and Case Studies, ISBN: 88-8453-378-3, © 2006 Firenze University Press
chaPTer 4The test is in the tasting
Organoleptic Product Quality
4.1 Sensory analysis . . . . . . . . . . . . . . . . 2234.2 Instrumental methods in off-odour/off-taste problems . . . . . . . 226
Organoleptic is defined as “capable of being perceived by one or more sense organs”, where the common senses are touch, hearing, smell, taste and sight. The perception of odour/taste is a key factor for product quality and usually derives from a combination of chemical compo-nents. Complex issues such as off-odours, off-taste, contamination in raw materials, interme-diates and final products can be detrimental to the quality of a product, comfort and impact on health, and are major causes of consumer com-plaints worldwide. Emissions from polymers in the end application often cause nuisance smells (“plastic” or “rubber”-like) and affect air quality, especially in closed spaces, and taste perform-ance in liquid packaging applications. As many of these materials are used in cars, trains, air-crafts, in buildings and factories, it is necessary to select polymers with low emission of (poten-tially hazardous) volatile compounds. This also calls for sensitive and selective ways to charac-terise volatile organic chemicals (VOCs) and to identify/taste odour sources both in product and process control. The economic impact of pro-duction variations is increasing dramatically and has led to rapid advancement in the field of char-acterisation of odours, off-taste and tainting.
Taste is the ultimate measure of the quality of a food product. Industry has invested countless
years identifying contaminants that detract from the unique taste of high profile products. There are only five major taste receptor types – bitter, sweet, sour, salty and umami. As opposed to the low hundreds of uniquely discriminated tastes, with typical character impact compounds such as 2,3-butanediol (“butter”) or isoamylacetate (“banana”), for odours this is in the order of the low thousands. Most of the odours are caused by organic volatile chemicals, rather than by particulates such as smoke or fog. Odorant mol-ecules are typically hydrophobic and polar with molecular masses of up to about 300 Da. Gas chromatography has been, and still is, the in-strumental method of choice for identifying the source of off-odour. In recent years, progress in sensor technology has enabled development of instruments (“electronic noses”, e-noses or EN) that can mimic the human sense of smell and provide low-cost and rapid sensory information. These instruments cannot identify the chemical compounds responsible for odour, but can com-pare samples and categorise them, after proper training. Input from a sensory panel is required and constitutes the link between instrumental methods and real practice. They can thus be used as quick screening tools or for monitoring air streams to detect the presence of chemical compounds.
4.3 Artificial olfaction . . . . . . . . . . . . . . . 235Bibliography . . . . . . . . . . . . . . . . . . . . . . . 244References . . . . . . . . . . . . . . . . . . . . . . . . 245

220 organolePTic ProducT QualiTy
Unlike a purely physical entity that can be clearly attributed to one isolated physical phe-nomenon (such as current, which is a flow of electrons, or colour, determined by photons impinging on a surface), odour is triggered by a multitude of different compounds interacting with millions of neurons. As shown in Fig. 4.1, odour perception is a multi-tiered phenomenon involving at least three dimensions: stimuli space (in which “odour active” chemicals are located), sensor reaction space (which maps the presence and quantity of odour active chemicals) and per-ceptual odour space (which maps output signals to a perceptual, mental, or mathematical pattern). It is of fundamental interest to determine wheth-er the perceptual odour space, which is the tar-get of e-noses, is a metric space. It is well known that the much simpler perceptual colour space gives no clear evidence for a metric function. In a non-metric space there are no “basic vectors”. The existence of basic vectors would mean that there are “primary odours” out of which all ex-isting odours can be synthesised. Intuitively it is understood that this is not the case. Then, if no primary odours exist, an “electronic nose” is not an analytical instrument either (an analytical in-strument decomposes a compound entity into its individual constituents).
Trying to “image” an odour is thus difficult and presents a number of potential problems. Some of the limitations are of principal rather than technical nature; they cannot be overcome by perfecting sensor technology or by chang-ing the “analysis” method altogether. It has been argued by Stoll [1] that there is no gener-ally applicable “distance function” and hence
no possibility to do measurements (that would correspond to the mathematical definition of that term) in perceptual odour space. In the ab-sence of a generally applicable co-ordinate sys-tem there is also no common frame of reference for “odour data” measured for different types of sensors. Consequently, vendor- and technology-independent databases of odour are unlikely to ever become a reality. Nevertheless, experiments show that there is a strong correlation between odour perception and patterns derived from sen-sor signals. Properly calibrated electronic noses based on multiple chemical sensor arrays can provide an excellent aid in classifying and char-acterising odours. The implication then is that, while no metric for odour space in general can be assumed to exist, for a limited “sub-regime” per-taining to one particular type of odours there may well exist one. It is then the point how to find a metric sub-space for a given odour problem.
The lack of a “primary odour” system means that, for some time to come, each instrument/sen-sor type will be constrained within the “feature space” it spans. GC- or MS-based “noses” do not score any better than multi-sensor systems in this respect. Chances are enhanced with the applica-tion of different sensor and transduction princi-ples simultaneously. The gap between stimuli and perceptual odour spaces must be bridged by cross-validation with a human sensory panel for each type of application.
Odour problems in polymers generally arise from:(i) outgassing of residual monomers, process
solvents or chain transfer agents;(ii) low-MW oligomers, oils and waxes trapped
in the polymer;(iii) thermal degradation of the polymer during
processing, end-product manufacturing and use;
(iv) additives with high vapour pressure (e.g. BHT and 2-hydroxy-4-octoxybenzophenone);
(v) degradation or interaction of additives in the polymer formulation;
(vi) volatiles produced during curing of thermo-sets, adhesives, sealants, etc.;
(vii) radiation sterilisation of plastic packaging;(viii) trace impurities;(ix) chemical reactions with the environment
(e.g. hydrolysis, oxidation); and(x) external sources.
Fig. 4.1 Three-layer model of odour perception and mapping

221
Apart from residual monomers and process solvents, some common types of outgassing are formaldehyde vapours (from urea-formaldehyde resins), emissions from car interiors, synthetic carpets, etc. The contribution of a compound to release an odour from a polymer is determined by the odour threshold, molecular weight and polarity. Processing conditions also have some impact; accurate degassing during compound-ing is absolutely necessary. For typical process-ing temperatures of most common polymers, cfr. ref. [2]. Production variables have a po-tential effect on polymer odour in PE manu-facture [3]. The type of polymerisation process (low-MW waxes), the activity and level of metal catalyst residues, solvents, oxidation of the pol-ymer and additives may all contribute to odour formation. Incorporation of fillers can also lead to considerable odour generation in compounds, although fillers do not smell. The reason for this effect probably can be found in the interaction of active sites and/or heavy metal traces of the filler with the polymer or the stabilising system. Yet, in most cases the polymer pellets produced are not to be blamed; odour/taste problems often arise from critical processing conditions of the polymer. Organoleptic properties are not to be measured on granulate but on the end-product.
The source of odours can not always even be assumed to be related to the polymer, the ad-ditives formulation, or manufacturing process. Other sources of odours that may be picked up during storage, handling, transport and us-age should be considered, e.g. contamination from repeat-use containers, cross-contamina-tion from storage silos, odours emanating from other products stored in warehouses, possum/cat urine contamination, etc. Controlling the odour generation of compounds is particularly important for automotive applications, house-hold appliances, food and drug packaging, and affects indoor air quality in offices and homes. Many odour problems in polymeric materi-als are related to the formation of breakdown products, in particular aldehydes and ketones with very low odour thresholds. Thermal oxi-dation of PE yields various aldehydes, thermal degradation of PET leads to acetaldehyde and poly(hydroxy butyrate) yields crotonaldehyde. Erucamide yields nonanal upon thermal degra-dation, whereas de-esterification of nucleating
agents such as dibenzylidene sorbitol gives 4-methylbenzaldehyde.
Off-odour may be classified as a common type of failure. Base packaging material can itself contain solvent residues, either from coatings or, where the base packaging material is a laminate, from an adhesive. Such solvent residues can be ethyl acetate, toluene and THF, all of which have strong odours. Printing inks also often contain solvents with well-defined odours. A criterion for selection of a solvent for use in packaging man-ufacture, e.g. for printing inks, is a high odour threshold (OT) value (10-100 mg/m3). There are no generally agreed maximum levels for residual solvents in food packaging. The total level of residual solvents should preferably not exceed 30 mg/m3; for some of the more odorous sol-vents, such as isopropyl acetate, individual levels should be less than 5 mg/m3. Some types of pack-aging, particularly printed materials, can have detectable odours immediately after production but lose much of the odour during normal storage before use. Samples of such packaging should only be taken after the normal storage period. For substances of known chemical nature and origin, quantitative measurements can be carried out to confirm the cause of the odour. Where the off-odour is due to impurities, reaction products, or contaminants, the task of identification can be difficult. Potential odour problems related to ad-ditives are listed in Table 4.1.
The standard definition of taint (ISO, 1992) is a taste or odour foreign to the product; off-fla-vours involve an internal deteriorative change. Common sources of taints and off-flavours may derive from direct contact (e.g. liquid packag-ing systems, pallets, cleaning materials), water and aerial contamination (e.g. flooring materi-als, paints, insulation materials), chemical or microbial reaction (e.g. autoxidation reactions). Examples of some common chemical taints are phenols in flooring materials, halophenols and -anisoles in bleached paper/board materials, hy-drocarbons (e.g. residual styrene monomer in PS), acrylates in UV-cured inks and varnishes, etc. Taints are derived from a wide variety of chemicals (phenols, halophenols, haloanisoles, sulphur containing compounds, alcohols, hydro-carbons, esters and ethers, amines, chlorinated hydrocarbons, carbonyl compounds, furans and oxygen-ring compounds, fatty acids, etc.).
organolePTic ProducT QualiTy

222 organolePTic ProducT QualiTy
For purposes of odour control, deodorising powders (e.g. AbscentsTM, UOP) remove odour from the environment by an adsorption process. These materials exhibit extremely strong ad-sorption behaviour, reaching the adsorption lim-it at a partial pressure that is typically below the olfactory threshold of the odour. Organophilic molecular sieve-based deodorising powders are particularly effective for adsorbing low-MW or-
ganics, including ammonia, aliphatics, olefins, chlorinated hydrocarbons, aldehydes, ketones, sulphur compounds (mercaptans), alcohols, organic acids, esters, amines, indoles and aro-matics; large multi-aromatic ring compounds are not adsorbed. Applications include removal of odours in cosmetics, body powder, personal care and plastics applications. In the application as a polymer additive, deodorising powders are
Potential odour problems related to additive types
Additive(s) Polymer(s) Origin of odours
-cumylperesters
Methyl ethyl ketone;
Mercaptans, dodecanethiol
DEHP
Cadmium red, orange, yellow;
ultramarine blue
Thioesters
Organotin mercaptides
Red phosphorous
Ba/Cd heat stabilisers
ESBO
Ca/Zn stearates
Fatty acid amides
Oleamide
Erucamide
Bis-toluidine sorbitol
Dicumyl peroxide
Azodicarbonamide
PVC
LDPE
PMMA
PVC
Various
Polyolefins
PVC
PET, PC
PVC
PVC
HDPE
LDPE
LLDPE, LLDPE/LDPE
LDPE
PP
XPE
Various
Acetophenone
Residual chain-transfer agents
Hydrolysis products ( 2-
ethylhexanol)
Acidity (H2S)
Sulphoxide conversion products
Organotin mercaptides
Hydrolysis (phosphine)
Free fatty acids, phenols, residual
solvents
Oxidation
Thermal decompositon (aldehydes)
Oxidation (aldehydes, nitriles)
Degradation
Degradation
Decomposition (4-methyl-
benzaldehyde)
Decomposition (acetophenone, cumyl
alcohol, cumene, -methyl styrene)
Thermal degradation (NH3, isocyanic
acid)
223
recommended for use with reactive compounds like aldehydes and ketones in adhesives and coat-ings, and for removal odour from polyolefinic material such as containers, wraps, barrier film and bottles, as well as in elastomers and poly-urethanes (in foot-soles). Antimicrobials, such as Irgaguard® B1000, are used for odour control of HDPE waste bins, as odour suppressant in flexible PUR mattresses and shoe insoles, and in PET textile fibres [4].
Packaging materials as a source of taints have been reviewed [5]. A monograph dealing with food taints and off-flavours is available [6]. For odour, tainting and outgassing problems with polymers, cfr. also ref. [3].
4.1 SENSORY ANALYSIS
Principles and Characteristics The only way to select compounds responsible for an or-ganoleptic problem is the use of sensory analy-sis. Identification and clarification of off-odours is often connected with significant time and cost expenses (cfr. Table 4.2). Sensory analysis, which was born in the 1930s in the food-process-ing industry, is a science with clearly defined basic principles. The main advances are being made in analysing and interpreting sensory data, and in relating sensory data to instrumental data.
Complex multivariate statistical analyses are of-ten needed. The ambition of sensory metrology is to measure the senses. Sensory data are rarely universal.
The threshold limits of chemical compounds can lie over a range of 10 orders of magnitude or more; saturated hydrocarbons have a high thresh-old limit and are relatively odourless, esters and unsaturated aldehydes and ketones are intensive odoriphores. Some extreme odour threshold (OT) values in air are 103 mg/m3 for octane and nonane, and 10-4-10-5 mg/m3 for 1-octene-3-one and 1-nonene-3-one [8]. It is generally accepted that the threshold of the human sense of smell is usually lower than the detection limit of any analytical instrument and, so, organoleptic tests are still held as being the most reliable for deter-mining off-odours.
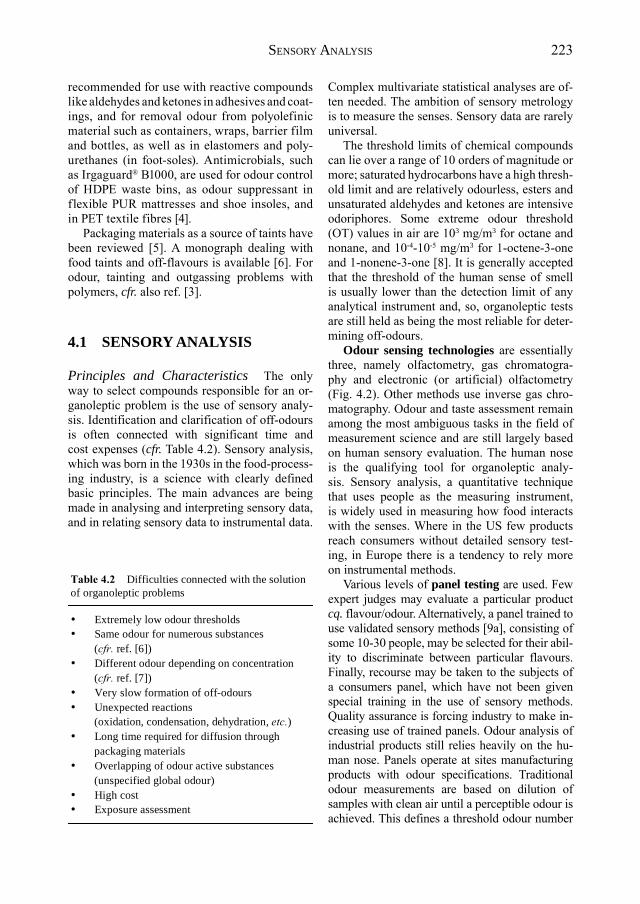
Odour sensing technologies are essentially three, namely olfactometry, gas chromatogra-phy and electronic (or artificial) olfactometry (Fig. 4.2). Other methods use inverse gas chro-matography. Odour and taste assessment remain among the most ambiguous tasks in the field of measurement science and are still largely based on human sensory evaluation. The human nose is the qualifying tool for organoleptic analy-sis. Sensory analysis, a quantitative technique that uses people as the measuring instrument, is widely used in measuring how food interacts with the senses. Where in the US few products reach consumers without detailed sensory test-ing, in Europe there is a tendency to rely more on instrumental methods.
Various levels of panel testing are used. Few expert judges may evaluate a particular product cq. flavour/odour. Alternatively, a panel trained to use validated sensory methods [9a], consisting of some 10-30 people, may be selected for their abil-ity to discriminate between particular flavours. Finally, recourse may be taken to the subjects of a consumers panel, which have not been given special training in the use of sensory methods. Quality assurance is forcing industry to make in-creasing use of trained panels. Odour analysis of industrial products still relies heavily on the hu-man nose. Panels operate at sites manufacturing products with odour specifications. Traditional odour measurements are based on dilution of samples with clean air until a perceptible odour is achieved. This defines a threshold odour number
Difficulties connected with the solutionof organoleptic problems
Extremely low odour thresholdsSame odour for numerous substances( ref. [6])Different odour depending on concentration( ref. [7])Very slow formation of off-odoursUnexpected reactions(oxidation, condensation, dehydration, )Long time required for diffusion throughpackaging materialsOverlapping of odour active substances(unspecified global odour)High costExposure assessment
SenSory analySiS
224 organolePTic ProducT QualiTy
(TON). For taste panels samples are diluted with water (problem: which water?). Despite having high performances at low concentrations (down to about 108 molecules/mL) the use of human panel-lists for odour and taste characterisation has some severe drawbacks (Table 4.3). It is not easy to ob-tain a positive “identification” for an odour, even with a trained panel of assessors. The sensory de-scriptor for a particular compound may change with concentration and the medium. Possible chemical compounds related to specific sensory descriptors (“musty”, “painty”, “plastics”, etc.) are listed elsewhere [6]. Some examples of com-pounds that may be associated with “plastics” odour are benzothiazole, methyl(meth)acrylate, trans-2-nonenal, oct-1-en-3-one, trans-1,3-pen-tadiene and styrene. Compounds contributing to the “plastics” odour of HDPE are 1-alkenes, con-stituting some 50 % of the total volatiles. Odour perception varies with concentration. Typically,
Fig. 4.2 Odour sensing technologiesAfter Nitz [9].
Drawbacks of panel testing
Time-consuming; high cost and elaboratemethods of sensory analysisSustained training required for each type ofproductPanellists operate for short periods of timeand within restricted time windows
Low degree of reliabilityHighly subjective human sensory evaluation,not suitable for certain types of analysisDifficult staffing of odour panels for routineQC testing (potential toxicity of syntheticchemicals)Need for standardisation of manyexperimental conditionsVast effort required for standardisationbetween different production sites
Difficult intercomparison of panels

225
4-mercapto-4-methyl-2-pentanone at low con-centrations provides the flavour impression of the Sauvignon grape but the off-odour associated with cat urine at high concentrations.
In order to be perceived as a taint, a chemical need not only be positively recognised, but must be characterised as deterioration in flavour qual-ity. Characteristic food taints are often detectable at sub-ppm levels. Some testing procedures for odour and taint are as follows: UK standard sensory test method BS 3755: Methods of Test for The Assessment of Odour from Packaging Materials used for Foodstuffs (1964/11971); ASTM Standard E 462-84: Standard Test Method for Odor and Taste Transfer from Packaging Film (1989); ASTM Standard E 619-84: Standard Practice for Evaluating Foreign Odors in Paper Packaging (1989); and DIN Standard 10955: Sensory Analysis. Testing of Container Materials and Container for Food Products (1983). European standards for odour and off-flavour mostly set only the principles of testing. Test methods for the assessment of migration, odour and flavour of plastics piping systems for hot and cold water installation are under preparation. As taste and odour can only be assessed by people making subjective judgements a calibration and valida-tion procedure is needed (and being developed) based on different substances that possess the typical odours or off-flavours of paper and card-board [10]. Sensory evaluation methodologies of taints and off-flavours were reviewed [5,11,12].
Applications In product development, sensory analysis can be used to determine whether one product is liked more or less than another and to identify the particular characteristics responsible. On the other hand, the use of taste and odour pan-els is also a common way to determine off-taste cq. off-odour. As water is a most sensitive odour and taste medium, the organoleptic properties of liquid packaging material need to be outstand-ing. Odours that can be present with PE and PP and various copolymers are not usually caused by residual monomers. Odours from polyolefin plastics mostly arise from compounds produced by oxidation. It has been found that trace levels of 1-nonene present in LDPE plastics were oxidised to highly odorous 2-nonenal probably by a free-radical mechanism [8]. Plastics in use for min-
eral water bottles are PVC, PET, PC and HDPE. Storm van Leeuwen et al. [13], using both a taste panel and instrumental methods (cfr. Chp. 4.2), have tested the hypothesis that very low concen-trations of aldehydes, ketones in combination with acids from extrusion coated LDPE gives a “plastic-like” off-taste in water and indicated the concentration range of the off-taste area (cfr. Fig. 4.7). Tainting from PET plastics can occur due to acetaldehyde (5-10 ppm), which is formed as a degradation product during the manufacture of the polymer, and processing into the finished packaging. The odour detection limit of acetalde-hyde is about 0.2 ppm.
Because the slip additive erucamide is made from a natural raw material it can contain low levels of compounds that are oxidatively unsta-ble. Any breakdown products can potentially contribute to taste and odour. Maltby et al. [14] used panel odour testing for the evaluation of various fatty acid amides in HDPE caps of PET bottles. In a special grade of erucamide (Incroslip C, Croda) the problem compounds are removed, resulting in extremely high oxidative stability and hence improved organoleptic properties.
Typical AO systems used in polyolefin hot-wa-ter pipes are combinations of hindered phenols, P-based processing stabilisers and S-based co-sta-bilisers. Because of the possible deterioration of the organoleptic properties that can originate from the oxidation products of thio-stabilisers combina-tions with HAS are recommended. Hostavin N30, Chimassorb 944 and Tinuvin 783 were tested [15].
A typical multilayer structure in modern packaging consists of paper or board laminated to one or more plastics layers with a foil inter-mediate. Plastic/board composites are now com-monly used for liquid packaging, such as milk. With such multicomponent packaging, each layer can contain substances that could be odor-ous and/or cause tainting in the packaged foods. Odorous and tainting substances can also origi-nate from printing and adhesives. Recently, in-fant milk (Nestlé - Milupa) in Italy was found contamined by an offset printing ink component (Itx) used for TetraPak containers. In paper used for packaging various additives such as sizing agents and fillers can be present, as well as residues of substances used in the manufac-turing process, such as defoaming agents and slimicides. Unlike many printed plastics, which
SenSory analySiS

226 organolePTic ProducT QualiTy
usually become less odorous some time after manufacture, some board materials have been found to become more odorous on storage. This is attributed to ongoing oxidation reactions, most probably catalysed by metal ion residues, liberat-ing further quantities of aldehydes. Odours that can be present in paper and board materials have been attributed to substances arising from bac-teria/moulds, autoxidation of residual resins and degradation of processing chemicals. An odor-ous oxidation compound identified as 1-hepten-3-one was found to be formed from 2-ethyl-hex-anol detected in paper board samples. Surface coatings applied to boards usually consist of a filler such as China clay or calcium carbonate, with a synthetic resins binder. Where the binder is of the styrene/butadiene type, several volatile substances have been identified, including sty-rene and by-products from the styrene/butadiene polymerisation process such as vinyl cyclohex-ene, ethyl benzene, styrene, cumene (isopropyl benzene), n-propyl benzene, α-methyl styrene, 4-phenyl cyclohexene or other alkyl substituted benzenes [5]. All of these substances are odor-ous. Plastics coatings on the surface of carton board are a barrier to migration of off-flavour substances from the board [16]; PET is more ef-fective than either LDPE or PP.
Tamm [17] has discussed the requirements for film additives in water ink technology in the case of printing of PE film for packaging. Inks require slip additives and must have low- or no-VOC emissions.
Due to their extremely low sensory odour thre-shold values, chloro- (TCA) and bromoanisoles (TBA) are strong odoriphores. Formation of TCA and TBA from the corresponding halogenated phenols by microorganisms is known and like-wise the use of such phenols as wood preserva-tives (contamination of PE granulate from wood pallets). Trace amounts down to approximately 50 ppt of TCA and TBA can be mass detected in affected packaging [18].
Piringer et al. [7] have discussed sensory problems caused by food and packaging inter-actions. Methods of sensory and tactile evalu-ation as applied to plastic, rubbers and painted surfaces in automobile interiors, in particular soft touch, were discussed [19,20]. As opposed to sight, touch is a slow sensibility because the procedure of collecting information is long.
4.2 INSTRUMENTAL METHODS IN OFF-ODOUR/ OFF-TASTE PROBLEMS
Principles and Characteristics Analysis of off-odours poses a special problem due to sev-eral factors (cfr. Table 4.2), amongst which the low concentration of the odoriphores. Moreover, some off-odour components are thermally labile, which requires care during their isolation, con-centration and analysis. A further complication may arise from the presence of trace components having low sensory detection thresholds; such compounds, even when present in ng/g levels can influence the overall flavour more than other volatiles present in much greater amounts. Steps in off-odour analysis are as follows:(i) qualitative and quantitative global sensory
analysis (odour impression and intensity);(ii) headspace analysis (affinity to test media
such as water, fat, etc.);(iii) extraction cq. desorption from the packaging
sample, enrichment;(iv) separation and identification (GC, GC-MS,
GC-O);(v) synthesis of odoriphore (validation); and(vi) identification of cause of off-odour generation.
Replacement of sensory analysis with instru-mental techniques is not a trivial matter. This may easily be understood if one considers that the unique mixtures that characterise a particular food (or equally well the smell of old books [21], for that matter) may be composed of hundreds of flavour compounds. To analyse these instru-mentally and determine which components are important in human perception is generally con-sidered impossible for all but the simplest cases. Often only a few chemical classes are responsi-ble for the off-odour/off-taste (cfr. ref. [13]).
Analytical methods for VOC analysis com-prise: (i) sensory evaluation; (ii) chromato-graphic techniques and their associated sam-pling methods, including the “hot-jar” method and dynamic headspace sampling; (iii) gas chro-matography-olfactory sensing; and (iv) artificial olfaction or “electronic nose” technology [22]. Sampling is the single most critical step also in odour problem solving as it conditions all the subsequent steps of the investigation. Table 4.4 compares a few of the most commonly used sam-

227
pling techniques for that purpose [23] including sorptive extraction and passive sampling. The “hot-jar” method [24] involves heating a poly-mer in a sealed chamber and injection of a sam-ple of the headspace gas directly onto a chro-matographic column. Polymer pellets may also be kept in contact with mineral water at 40°C or 60°C for days to weeks. Techniques used in odour/flavour investigations include steam distillation-solvent extraction (SDE) [25], SPE, static or dynamic headspace sampling (SHS, DHS), followed by TD analysis [26]. Some of these techniques are more applicable to the less volatile substances. Since in DTD analysis vola-tiles are thermally sparged directly from the an-alyte matrix into the GC, errors due to trapping efficiency and volatility are greatly reduced or totally eliminated. However, in this technique artifact production via thermal decomposition reactions is more frequent and high-moisture samples can cause chromatography problems (column plugging). In general, DTD-GC analy-sis may be applied to (semi)solid samples with moisture contents below 5 % and volatile fla-vour levels in the 1-100,000 ppm range.
Odour analysis requires a technique that concentrates odour-causing compounds down to ppt concentration. These may be trapping on a TenaxTM trap (followed by thermal desorption) or passing a liquid sample over a column packed with purified Amberlite® XAD-2 (poly(styrene-co-divinylbenzene)) resin. Identification of vola-tile substances from packaging materials at very low levels is often carried out using a concen-tration procedure, usually DHS, mostly in the DHS-TD-GCO-MS/FID combination [27-29]. DHS-GC-MS is particularly useful in determin-ing the additives which contribute most to the overall odour of plastic products; the sample is
heated for a relatively long period of time at a relatively low temperature (e.g. 50°C in excess of 30 min), which helps to ensure that additional volatile species are not generated as a result of degradation of the sample. Where reliance as to the true odour profile of a polymeric material is placed on direct headspace sampling or dy-namic purge-and-trap headspace analysis con-cern may be expressed about possible thermal conversion of labile compounds during thermal desorption from Tenax traps; use of scCO
2 elu-
tion is an alternative. Static headspace-SPME can be put forward as an alternative analytical tool to collect volatile and semi-volatile com-pounds from polymers [30]. VOC analysis may serve as a fingerprint of polymer type. With HS-SPME the volume of the headspace influences the amount of analyte adsorbed on the SPME fibre. The amount adsorbed decreases with in-creasing headspace volume, so to obtain higher sensitivity the sample headspace should be kept as small as possible. During sample preparation and analysis, care should be exercised so that the isolate retains the sensory properties of the polymeric materials from which it was isolated.
Thermally generated VOC emissions can be determined quantitatively by means of FID de-tection and use of a calibration standard [31]. Portable FID monitors for total VOC measure-ment at concentrations between 1 and 10� ppm are ideally suited for emission measurements.
None of these separation methods is ideal for flavour analysis because of: (i) solvent impuri-ties; (ii) loss of volatiles; and (iii) thermally in-duced changes. The analysis of taints and off-fla-vours is somewhat different from that of volatile compounds contributing positively to flavour [12]. The differences are caused by the fact that, in gen-eral, many compounds contribute to the flavour of
inSTruMenTal MeThodS in off-odour/off-TaSTe ProbleMS
Gas analysis sampling techniques
Sampling technique Sampling volume Mode Limit of detection
Headspace autosampler
Bag
Purge-and-trap
SPME
20 mL
0.5-100 L
100 mL -
1 mL – 1L
Static
Static
Dynamic
Static or dynamic
0.1 to 1 ppma
Variable (< 1 ppt)
Variable (< 1 ppt)
Variable (< 1 ppt)
a Lower limits attainable by preconcentration methods.
228 organolePTic ProducT QualiTy
a product but only a few to taints and off-flavours. Like flavour compounds, off-flavour compounds often occur in very low concentrations and may have extremely low threshold values. Selection and identification is therefore very demanding.
Instrumental techniques frequently employed in odour analysis include GC, GC-MS, and HS-GC, with FID, FPD, ECD, TID or MS detectors, often in combination with advanced statistical techniques. With MSD and AED detectors, only a few chemicals with exceptionally low air odour threshold may require more sensitive sampling methods than regular headspace GC, i.e. without the need for time-consuming pre-concentration techniques. However, the resulting chromato-grams do not present a true and accurate repre-sentation of the odour-active components. The differences in sensitivities of GC detectors to various volatile compounds do not correspond to those of mammalian taste or nose. A chemical compound at very low concentration (possibly below the detection limits) can generate strong odour. Further complications arise from the com-plexities of naturally occurring odours and the instability of the odour molecules.
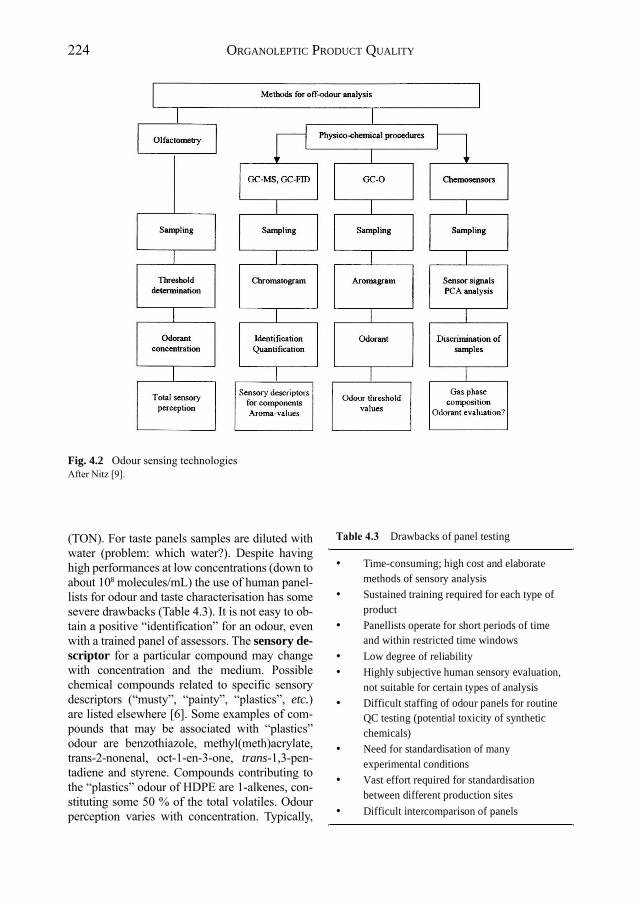
SHS-GC-FID can be used to measure sol-vents in printed packaging [32,33]. Provided the solvents used in printing are known, the solvent residues can be quantified by external calibra-tion. The test may not, however, measure the total concentration of the solvent residue in the packaging, as complete volatilisation into the headspace may not occur. The alternative TD-GC-MS method for determining residual sol-vents in packaging is relatively quick with a total analysis time of around 20 min. The method is particularly suitable for production monitoring and process control. GC-MS is frequently used for off-odour and flavour analysis. Table 4.5
compares the method to the performance of a sensory panel and e-noses for the same purpose.
Gas chromatography-olfactometry (GC-O) is a unique analytical technique which associates the resolution power of capillary GC with the se-lectivity and sensitivity of the human nose (cfr. Fig. 4.3). GC-O was first rationalised by Acree et al. [34], who proposed CHARM (Combined Hedonic And Response Measurement) analysis. This consists of the GC injection of increasing di-lutions of the odoriphore extract until no odour is perceived at the sniffing port. Grosch et al. [35] have later proposed a similar procedure (AEDA, Aroma Extract Dilution Analysis). These dilution techniques are widely used to determine aroma impact of many foods. In modern GC-O the olfac-tory detector outlet is designed to take the outlet stream of a GC and transfer it to a nose cone in which it is mixed with humidified air. Special ol-factory detector ports enable sensory detection of odours simultaneously with GC detection. This allows the human nose to identify individual com-ponents as they elute from the capillary column. It can be combined with MS detection. It is impor-tant to maintain similar elution time to both detec-tors [36]. Recently, odorant quantitation by GC-O on the basis of the detection frequency of odorants by a sensory panel was reported [37]. It appears that GC-O can compete with the most sensitive and selective techniques, such as MS, for deter-mination of extremely intense odorants, because little sample preparation is required and there is no need for synthesis of labelled compounds. Any quantitation requires optimisation of the analyti-cal procedure for the target compound.
Although sniffing the effluent of a GC is a useful means of determining which components of a complex mixture of volatiles are odorous [38], the odour descriptors of the separately
Comparison of key technologies for off-odour analysis
Feature GC-MS Sensory panel e-nose
Qualitative informationQuantitative informationComparative screeningSkilled operatorProduction controlAroma profile
++-+--
--++-+
--+-++

229
eluted compounds are often quite different from the descriptor for a complex mixture of VOCs. This difference makes it difficult to correlate a given SEP evaluation with the corresponding in-strumental analysis. It is reasonable expectation
that GCxGC will be applied to tackle organolep-tic problems. GC analysis with support from a panel enables identification of the problem caus-ing components; no such structural information will be obtained from an e-nose.
inSTruMenTal MeThodS in off-odour/off-TaSTe ProbleMS
Fig. 4.3 Schematic diagram of a gas chromatograph with thermal desorption unit and dual Fourier transform infrared spectrometer and mass spectrometer detectors, plus odour sniffing port.After Saxby [6].
Fig. 4.4 Flow chart for complex odour problem solving.After Huby. [23].

230 organolePTic ProducT QualiTy
Huby [23] has developed a protocol for com-plex odour problem solving (Fig. 4.4). The ap-proach of odour analysis depends on whether the analytes are unknown (problem solving) or known (target analysis) compounds. Once an odour panel has categorised a sample as good or bad, GC-AED analysis is focused on N (amine), S (mercaptan, sulphide) or halogen related odours and/or GC-FID examines differences between good/bad samples. At low concentra-tions reproducibility is a problem. If differences are observed, GC-MS analysis is used to identify the compounds detected by GC-FID. After one or more candidate odour causing compounds are identified and quantified, good samples are spiked with the measured amounts of those com-pounds and submitted as unknowns to the odour panel to compare them with the actual samples.
Gas chromatography involves high tempera-tures that may degrade labile compounds. In that case HPLC can be used after trapping the vola-tile compounds in a liquid. HPLC has not found many applications in off-flavour studies. One of the main reasons is that it is impossible with the usual eluents to evaluate by sensory analysis the contribution of separated compounds/frac-tions to an off-flavour of a compound. HPLC has been used in the study of less-volatile tainting substances of which the identity is known, e.g. chlorophenols [39]. HPLC-MS can be used for identification of tainting and odorous substances but this combination is less well established than GC-MS.
Major problems raised by a chromatographic approach are therefore: (i) lack of sensitivity; (ii) difficulty to identify the chromatographic peaks of interest; and (iii) difficulty to establish the correlation between the perceived odour and observed chromatographic peaks. Moreover, the relationship between the physicochemical prop-erties of odorant molecules and their sensory im-pact is still unclear [40]. The results may there-fore be inconclusive. Selected-ion monitoring mass spectrometry (SIM-MS) is frequently used in off-flavour studies for compounds of known identity. Despite the high sensitivity of APCI-MS systems (ca. 10 ppb) a higher level of sensitiv-ity is still needed to detect compounds that have odour thresholds in the ppt range. ToF-SIMS is a very sensitive technique for characterising vola-tiles emanating from polymer surfaces.
ASTM D 4526-96 describes the determina-tion of volatiles in polymers by SHS-GC [41]. Other relevant standard methods are BS 6455: Monitoring the Levels of Residual Solvents in Flexible Packaging Materials (1984) and ASTM Standard F 151-86: Standard Test Methods for Residual Solvents in Flexible Barrier Materials (1991). Standard testing procedures (ASTM E 595-77/84/90) have been developed to quantify the total mass loss (TML) and collected volatile condensable materials (CVCMs). Automotive materials and systems specifications for odour are available [42,43]. A European standard to determine odour concentration has been devel-oped [44]. Analysis of food volatiles has been reviewed [12,45].
Applications Dynamic headspace sampling has been used as a test procedure for analysing vapours emitted by polymers [46]. In a batch of polyacetol components causing smell and head-ache complaints trioxane, the cyclic trimer of for-maldehyde, was detected using TG-GC-FTIR-FID [47]. Hartman et al. [45] have described flavour characterisation using adsorbent trapping-ther-mal desorption or DTD-GC and DTD-GC-MS.
Many techniques have been used to charac-terise the organoleptic properties of degraded PE formulations, including sensory evaluation [48-50], DHS-GC [49-51], GC-FID [52], GC-MS [48,49,53] and GC-olfactory detection [54]. Sampling techniques include SFE [55], selective volatile extraction [54,56], vacuum distillation [48], and water/steam extraction [57]. Processing polyethylene into packaging materials often takes place between 200 and 370°C. Hoff et al. [58] trapped the volatiles produced by PE thermo-oxidative degradation over the temperature range of 264-289°C using GC-MS for identification and GC-FID for quantification. Bravo et al. [56] have identified a total of 84 C
�-C
23 compounds,
mainly hydrocarbons, aldehydes, ketones and olefins, produced during thermal oxidation of PE in the presence of excess O
2 at 150-350°C for 5-
15 min using DHS-GC-MS and GC-FID. Many of the compounds identified have odour and/or toxicological significance. Although DHS-GC-MS enables very small amounts of VOCs derived from PE to be separated and identified, such an approach does not enable a direct evaluation of
231
the odour level due to each separate VOC. For this purpose GC-olfactory is necessary. Bravo et al. [54] have detected 14 and identified 8 odour-ac-tive compounds (C
6-C
9 saturated and unsaturated
aldehydes and ketones) resulting from the thermal oxidative degradation of PE at 250°C by means of CHARM Analysis [59]. In most cases, these compounds occurred at concentrations that did not produce measurable peaks in the GC-MS to-tal ion current plots and so would not have been normally detected. A review of VOCs originating from PE by thermal oxidation, irradiation, storage, handling and package-product interactions has appeared [22]. The source of undesirable VOCs is not always related to the polymer, but may also be associated with additives, contamination from repeat-use containers, cross-contamination from storage silos, etc. Thermal decomposition of met-al stearate additives to produce stearic acid, which can undergo further reaction to produce carbonyl species, is a source of off-odour generated during PE processing. A rancid odour may be produced during PE processing due to the thermo-oxidation of the slip agents erucamide and oleamide [60].
Off-odour compounds formed during extru-sion coating of (unstabilised) LDPE at 285°C and 315°C were analysed by Tenax desorption, TD and DHS-GC-MS analysis with simultaneous sniffing [61,62]. The most odorous compounds were identified as carboxylic acids while most of the volatile compounds were hydrocarbons. The main VOCs derived from irradiated LDPE were identified by GC-MS to be aliphatic hydrocar-bons, C
2 to C
� aldehydes, C
4 to C
8 ketones, and
C2 to C
� carboxylic acids [63].
In HDPE/(Vitamin E, glycerol, PEG-400, GMC) extrusion glyceryl monocaprylate/caprate (GMC) greatly contributed to off-odour (sensory panel and GC-MS analysis), and Vitamin E to yellow colour formation [64]. Odour and taste problems in HDPE (granules and water) were analysed by P&T techniques in combination with GC-MS-SNIFF and GC-FTIR-SNIFF [65]. Off-flavour compounds in HDPE water pipes were identified mainly as carbonyl compounds.
In an attempt to identify the chemical origin of undesirable odour of coffee cups, extraction of volatile compounds from PP sheets by hot water (steam distillation-extraction according to Likens et al. [25]) was carried out to assess the organoleptic consequences of the temperature of
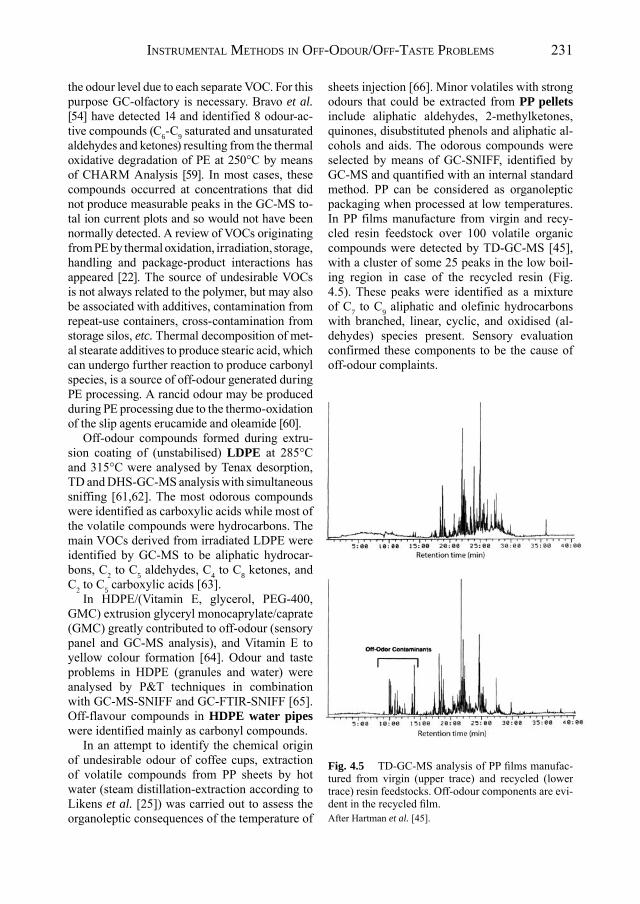
sheets injection [66]. Minor volatiles with strong odours that could be extracted from PP pellets include aliphatic aldehydes, 2-methylketones, quinones, disubstituted phenols and aliphatic al-cohols and aids. The odorous compounds were selected by means of GC-SNIFF, identified by GC-MS and quantified with an internal standard method. PP can be considered as organoleptic packaging when processed at low temperatures. In PP films manufacture from virgin and recy-cled resin feedstock over 100 volatile organic compounds were detected by TD-GC-MS [45], with a cluster of some 25 peaks in the low boil-ing region in case of the recycled resin (Fig. 4.5). These peaks were identified as a mixture of C
� to C
9 aliphatic and olefinic hydrocarbons
with branched, linear, cyclic, and oxidised (al-dehydes) species present. Sensory evaluation confirmed these components to be the cause of off-odour complaints.
inSTruMenTal MeThodS in off-odour/off-TaSTe ProbleMS
Fig. 4.5 TD-GC-MS analysis of PP films manufac-tured from virgin (upper trace) and recycled (lower trace) resin feedstocks. Off-odour components are evi-dent in the recycled film.After Hartman et al. [45].

232 organolePTic ProducT QualiTy
Sensory changes and migration caused by ra-diolysis products were discussed only in a few papers [29,63,67-70a]. Irradiation results in for-mation of volatile products (aldehydes, ketones and carboxylic acids from PE and PP) and additive related decomposition products. Many radiolysis products are well known, such as 1,3-di-t-butyl-benzene and 2,4-di-t-butylphenol (both ex Irgafos 168). Although the volatile radiolysis products go undetected by overall migration studies (in con-formity with EU regulations), their formation is quite evident from HS-GC (cfr. Fig. 4.6).
Where monomers have a strong odour or taste monomer residues may be responsible for pronounced odour, e.g. methacrylic acid, ethyl-acrylate or styrene. In particular the latter mono-mer is well known for its odour (odour threshold of 50 ppb). The free styrene monomer levels in polystyrene plastics can be relatively high (300-400 ppm); the quantities found in food prod-ucts due to migration are usually in the low ppb range [71]. Tice [5] has given examples of food tainting due to free styrene monomer (GC-MS analysis). Residual styrene in PS containers for milk packaging has been quantified by HS-GC-MS. Trace amounts of acetaldehyde (with a very
low odour threshold: 20 to 40 µg/L in water) can form during processing of PET due to the de-composition of chain ends. Using GC-O cyclic acetals and ethers were identified as odour bod-ies in PU foams [72]. PU odour has been related to the catalysts, surfactants, antioxidants, polyols and isocyanates used in its manufacture. Also a hydrolysis conversion product of the plasticiser dioctylphthalate, 2-ethylhexanoic acid, may be responsible for undesirable odour of PUs. Good agreement between HS-GC, HS-EN and human sensory panel tests in outgassing and odour in-tensity measurements of ABS has been men-tioned [73] (cfr. Chp. 4.3).
Incorporation of fillers can lead to consider-able odour generation in compounds, although fillers are generally odourless. The reason for this effect is interaction of active sites and/or heavy metal traces of the filler with the polymer or the stabilising system. Testing and rating can be done by olfactometry, or inverse gas chroma-tography.
Packaging receiving particular attention in-cludes plastic bottles for water, paperboard/plas-tic multilayer containers, etc. It is well known that (semi)volatile components in packaging
Fig. 4.6 Headspace gas chromatogram of non-irradiated and e-beam irradiated polypropylene yoghurt caps.After Welle et al. [67].

233
materials can migrate into foods stored therein, often imparting off-odours/flavours to the prod-ucts [74]. It is also established that flavours from foods or beverages can be absorbed into polymeric matrices causing flavour loss in the products [75]. The problem of food contamina-tion with packaging-borne migrants has recently been exacerbated by the increased use of poly-mers in microwave cooking applications. The transfer of organoleptically active VOCs from LDPE to packaged foodstuffs is well known. Bigger et al. [53] produced an odour map of 87 LDPE/(1000 ppm erucamide, 1000 ppm SiO
2)
and LDPE/(1000 ppm erucamide, 1000 ppm SiO
2, 500 ppm Irganox 1076) film-grade formu-
lations for food packaging applications by means of DHS-GC-MS and DHS-Tenax-GCO using both sniffing port analysis by a sensory evalua-tion panel (SEP panel) and an odour meter/SnO
2
semiconductor device. Packaging materials have been analysed for off-odours using the DTD technique [76]. DHS-GC-MS with trapping on Tenax has also been used for the study of VOCs in LDPE packaging materials [77]. Quantitative analysis of chloroanisoles in packaging materials has been carried out by means of SIM-MS [78].
Food packaging materials are subject to in-creasingly strict quality requirements. Therefore, packaging materials are being developed with improved organoleptic properties. These prop-erties are generally determined by three types of interaction between packaging material and foodstuff, namely: (i) absorption of components that determine taste and odour of the foodstuff by the packaging material (flavour scalping); (ii) migration of components out of the packaging material into the foodstuff, resulting in deteriora-tion of odour and taste (flavour sorption); and (iii) permeation of components through the packag-ing material from or to the external environment (flavour permeation). For HDPE blow mould-ing and LDPE extrusion coating applications in which food (milk, water, orange juice) is in direct contact with PE the organoleptic properties of the PE types are important. In particular, migration of aldehydes and ketones, which are formed dur-ing processing, play a role. Alcohols, carboxy-lic acids and other components, which are also formed during processing, exhibit much higher threshold values and have less influence. Kolnaar [79] has reported cold multiple extractions of
cryogenically milled HDPE bottles to remove selectively first the additives by diethylether and next PE wax fractions with hexane and heptane. Oxidised compounds, which may influence fla-vour and taste, were only found in the hexane ex-tract, which is a good indicator for the organolep-tic product quality of HDPE. Using GC-MS Yam et al. [80] identified more than 60 volatile com-pounds which were released from HDPE bottles, namely C
� to C
10 n-alkanes, 1-alkenes, aldehydes,
ketones and olefins. The oxygen-containing vola-tile compounds, which cause off-taste problems, are mainly produced during melt processing of the resin. Ho et al. [81] examined the volatiles generated during thermal and mechanical oxida-tion of blow-moulded HDPE bottles.
Hybrid sensory-instrumental analysis systems, such as GC sniffing techniques, have been used, e.g. for the characterisation of flavour changes arising from migration from packaging materi-als into mineral water [82]. Alkane traces coming from PE are a source for unsaturated carbonyl compounds in PE-containing packaging material. Through a combination of selective enrichment, GC-MS analysis and sensory analysis, the pres-ence of 1-heptene-3-one and 2-nonenal could be identified in several PE-containing packaging materials [7]. Storm van Leeuwen et al. [13,83] have examined the organoleptics of extrusion coating LDPE for aseptic liquid packaging ap-plications (cfr. also Chp. 7.3.1.2 of ref. [83a]). Volatile compounds that can migrate out of LDPE are formed during extrusion of the polymer. At high shear and temperatures in the extruder, me-chanical degradation, thermal oxidation and chain scission reactions occur whereby low-MW, oxi-dative degradation products are formed such as acids, alcohols, aldehydes, ketones, alkanes and alkenes [84,85]. In a package containing a polar medium, e.g. water, lemonade or fruit juice, polar low-MW molecules will have a strong tendency to migrate from the packaging material towards this medium. The cause of off-taste in packed water was determined using samples of water in which LDPE film specimens had been incubated (“film samples”) and synthetic water samples [13]. DHS-CT-GC-FID/MS analysis was used to identify and quantify aldehydes and ketones in water samples at a detection limit of 1 ppt; carboxylic acids were determined using precol-umn derivatisation with 2-nitrophenylhydrazine
inSTruMenTal MeThodS in off-odour/off-TaSTe ProbleMS

234 organolePTic ProducT QualiTy
(NPH) and RPLC. According to a taste panel the “plastic-like” off-taste of film samples was simi-lar to that of synthetic water samples containing aldehydes and ketones (1.5 ppb) together with acids (100-200 ppb). Despite the fact that these concentrations are below the threshold levels, in combination an off-taste is produced. On the basis of the results of GC and LC analysis and the taste panel the off-taste concentration region contain-ing aldehydes, ketones and acids could be defined (Fig. 4.7). This off-taste region enables to express organoleptic quality of LDPE packaging material in measurable and reproducible terms by means of GC analysis. This allows faster quality control.
The effects of vitamin E in extrusion coating LDPE formulations were studied by storage of water in aseptic liquid packaging [86]. Formation of low-MW oxidation products of LDPE during processing and ageing was suppressed, as evalu-ated by both a taste panel and Tenax trapping with DHS-GC-FID/MS analysis (LOD, 1 ppt). The presence of vitamin E enhances the quality of film and water.
In a case of failure analysis, the unusual taint of water contained in HDPE spring-water bottles could be ascribed to trace levels of ben-zophenone, originating from a photoinitiator present in the printing ink from the bottle labels [3]. McGorrin et al. [87] have reported identifi-cation of the musty component 4,4,6-trimethyl-1,3-dioxane (C
�H
14O
2) from an off-odour printed
packaging film using SHS-GC-FID, organolep-tic evaluation, GC-MS (EI and CI) and GC-MS/
MS. The compound is an interaction product of 2-methyl-2,4-pentanediol, used as a solvent coat-ing for ink adherence, and formaldehyde (from an unknown source). In another example, the observed “catty” off-odour in cook-in-the-bag ham products was ascribed to the mesityloxide-hydrogen sulphide adduct 4-methyl-4-mercapto-pentan-2-one resulting from a complex sequence of interactions between a residual red printing solvent, components of the packaging materials (diacetone alcohol in polyamide-ethylene iono-mer laminate, identified by HS-GC, GC-sniff-ing, GC-FID and GD-MS) and food ingredients [88,89]. Piringer et al. [8] have reported the iden-tification of off-odours in packaging materials (collection, concentration, separation by GC and identification by MS). 5-Methyl-4-hepten-3-one was identified as the source of off-odour in a printed plastic film; its origin was the reaction of TiO
2 in the dye with MeCOEt formed from a
polyvinylbutyral adhesive by aldol condensation with a basic catalyst. Piringer et al. [7] have also described several case studies of sensory prob-lems caused by food and packaging interac-tions, such as off-odour from styrene-butadiene coatings, off-odour from printing, unsaturated carbonyl compounds, off-odours caused by hal-ogenated phenols and anisols, and methylmer-captopentane as an interaction product between packaging and food. Paraffins in food contact materials that do not contain polyolefin oligo-mers were identified by means of LC-GC-FID and LC-FTIR and quantified by LC-ELSD [90].
Volatiles from an EVA/EVOH laminate were analysed by ToF-SIMS, with phenyl stearate be-ing detected, which was the result of a reaction between stearic acid (lubricant) and phenol (from the cross-linking agent 4,4'-methylene bis(phenyl isocyanate)) [91].
Off-odour from styrene-butadiene coated paper was attributed to 4-phenyl-cyclohexane, as identified by GC-MS [92]. In another off-odour complaint related to methoxy-propanol from printing of a film it was assessed that 5-methyl-4-heptene-3-on had been formed [8].
There are a number of specific tests that auto-motive companies insist that rubber components have to pass. An example of such a test is the VW emission test which involves placing the compo-nent in a cell of given dimensions and heating the cell for a given time at a specified tempera-
Fig. 4.7 Off-taste region in water containing alde-hydes, ketones and acids.After Storm van Leeuwen and Wullms [13].

235
ture. Rather than carry out a detailed analysis of the components liberated from the rubber component, the result is expressed in terms of ppm of total organic compounds as determined by an organic vapour analyser (OVA). Limits are given as to the permissible concentrations allowed. Gaseous emission (VOCs) and conden-sable emissions (fogging) from materials for au-tomotive interiors are routinely determined by TD-GC-MS for quality control purposes [43]. HS-GC-FID is often used for collecting and analysing volatiles evolved from plastics used in car interiors [93,93a]. The emissions are ex-pressed as the total area of all the species peaks obtained and are quantified against a single spe-cies calibration curve. Work has been carried out to determine the additives which contribute most to the overall odour of car products such as car mats and other odour prone products. For this purpose DHS-GC-MS is often used.
Emissions from automotive materials are usu-ally broken down as follows: (i) low to medium volatile compounds, causing fogging; (ii) highly volatile organics (gaseous); (iii) formaldehyde; and (iv) strong odoriphores. Fogging is usually caused by additives such as plasticisers, stabilis-ers and flame retardants, i.e. typically phthalates, dibenzoates, adipates, phosphoric acid esters and alkanes, with low vapour pressure which con-dense on colder parts of the car interior. The two main polymers which contribute to this effect are PVC and PU (flexible foams). In PU foams the volatile compounds have been related to the type of polyol, antioxidant package, type of amine catalyst, type of flame retardant additive and the presence of plasticisers contained in the pigments [94]. An analytical procedure is available [95]. Highly volatile organics are rest monomers, sol-vents, amines (catalysts for polyurethane foams), and low-MW additives. An analytical procedure based on SHS-GC technology (5 h at 120°C) has been described [96]. Formaldehyde emission is determined as water soluble formaldehyde after heating of the sample at 60°C for 3 hrs [97]. Off-odour is evaluated according to VDA-270 [98]. In addition to certain plasticisers and process aids, odours can be associated with cure system breakdown products or additives such as pine tar or reclaim rubber. SERS was used for the analy-sis of low ppb traces of methyl mercaptane at the
surface of vulcanised rubber after contact with the fumigant methyl bromide [99].
Volatile organic compounds from fitted car-pets for office use have recently caused a major problem for indoor air quality (IAQ). Analysis was carried out by collecting air samples on a Tenax tube, followed by thermal desorption to release the trapped organic compounds into a cryogenically precooled PTV for GC-MS analy-sis [100]. As it turns out, the high-boiling com-ponent phenoxypropanol from the water-based adhesive was hydrolysed in service conditions to phenol, which reacts with inorganic bromide (from the latex back of the textile covering) form-ing bromophenol. Emission of this compound was the major cause of the reported air pollution. Due to the use of high-boiling and polar com-pounds, the impact of the problem has thus been shifted from the installation process to the ten-ant of the office. DHS-GC-MS has been used to monitor outgassing of clean-room construction materials [101].
Taste and odour issues related to food packag-ing interactions have been reviewed [102].
4.3 ARTIFICIAL OLFACTION
Principles and Characteristics Although chromatographic techniques enable the sepa-ration and identification of individual VOCs released from polymers, they are incapable of characterising the overall odour due to a par-ticular volatile substance or group of substances. The analytical signals measured do not neces-sarily reflect the odour perceived by a human. Recently, electronic odour sensing or “artificial olfaction” techniques have been developed in an attempt to address this problem. Chemical multi-sensor systems (“electronic noses” or electronic olfactometers) are nowadays a viable tool com-plementing traditional analytical techniques and human sensory evaluation. An electronic nose (e-nose or EN) is defined as an instrument that comprises an array of electronic chemical sen-sors with partial specificity and an appropriate pattern recognition system, capable of recognis-ing simple or complex odours [103]. This defini-tion intentionally restricts the term “electronic nose” to those types of gas array sensors that are
arTificial olfacTion

236 organolePTic ProducT QualiTy
specifically used to sense odour molecules. The concept of an e-nose combined with a pattern recognition technique dates from 1982 [104], and the first commercial instrument was intro-duced to the market in 1993. E-noses are not conventional analytical chemical instruments. While analytical chemistry is generally used to precisely identify and quantify concentrations of chemicals, e-noses are generally used to produce qualitative results indicating presence of a sub-stance or quality of a product.
Electronic noses or volatile sensors can de-tect changes in the nature and concentration of compounds present in a gas in an instrumental approach that mimics the mammalian olfactory systems [105]. The three basic building blocks of an e-nose are shown in Fig. 4.8. E-noses are the integration of multiple gas sensors and artificial intelligence. As the vapour will normally exist as the headspace above a liquid or solid sample, all sensors are usually combined with a headspace-sampling unit. SPME sampling allows better sensitivity (sub-ppm LOD). The system needs to be able to analyse a complex vapour as it ex-ists without affecting it in any way. Analysing a complex vapour cannot be achieved by using discrete sensors. Analysis with discrete sensors requires the exact composition to be known. A discrete sensor system would be analogous to GC-MS analysis. The sensors to be used must be non-selective, i.e. they must respond to many different individual and complex compounds. In the e-nose the aroma is analysed as a complex vapour using an array of sensors. The system generally gives comparative rather than quan-titative or qualitative information and therefore is ideally suited for quick QA/QC control. The exact composition of the vapour is not the result. Among the components of the e-nose, the chemi-cal interactive material plays a fundamental role in defining the sensitivity of the instrument and,
finally, the range of possible applications. The requirement for the sensors in an e-nose is that they have a partial sensitivity, i.e. that they can respond broadly to a range or class of gases rather than to a specific one. This is the opposite of the ideal gas sensor, which should respond to one gas only, e.g., methane, and provide a unique output (for example ISE, GC). Most e-noses are different implementations of the same working principle. For odour source analysis the sensor signals serve as input to feature extraction using statistical pattern recognition methods, multi-component analysis, cluster analysis and artifi-cial neural networks with reduction to learned data and comparison to a database. Electronic noses equipped with appropriate data evaluation software allow establishing various correlations in terms of emissions:(i) Fingerprinting (“equal” or “different”) to ver-
ify constant quality of supply.(ii) Comparison to (acceptable) standards.(iii) Cluster analysis to discriminate incoming
goods.(iv) Analysis of unknown samples (comparison
with data set).The human and artificial olfactory approach-
es are compared in Fig. 4.9. The human nose, the best instrument for odour measurement (and always available), is equipped with far more sensors (some 20x106 reception cells) than ar-tificial arrays (up to 32 sensing elements). An e-nose can be exploited commercially provided adequate steps are taken [106]: (i) a gas analysis of the molecules associated with the odour of interest with the key molecules being identified by the human nose; (ii) a choice of non-specific sensors capable of responding electrically to the key molecules; (iii) removal of interferants (e.g. water vapour); (iv) compensation of electri-cal data for systematic variations (temperature changes, humidity, sensor drift); (v) an adequate
Fig. 4.8 Electronic nose block design

237
training set; and (vi) powerful pattern recognition algorithms capable of discriminating and char-acterising smells with a high success rate (e.g. artificial neural or fuzzy techniques). Aimed at mimicking the human olfactory system, the e-nose is an analyser which can recognise, clas-sify and quantify gaseous emissions and odours. Although an objective aroma profile is obtained within minutes, the e-nose detects both odor-ous and non-odorous compounds and in this sense should not be thought of as an electronic equivalent to the human nose. However, a care-ful choice of the sensors used in the e-nose may enable the instrument to be tuned to respond to aroma molecules in a manner similar to the human nose. Each sensor possesses individual odour characteristics while at the same time be-ing sensitive to a broad spectrum of gases. Due to their non-specificity, a small number of sen-sors can be used to monitor vapours from a large number of compounds.
A large variety of sensors and transducer prin-ciples is available nowadays [107]. In order to mimic human sense common e-noses employ metal oxide (MOX) semiconductor gas sensors [104], quartz crystal microbalance (QMB) arrays with sorption films deposited on the electrodes [108], piezoelectric sensors, surface acoustic wave devices (SAW) [109], electrochemical cells, opto-electronic sensors [110,111], organic conducting polymers (OCP) [112] or hybrid sen-sor systems which comprise different sensor principles [113], e.g. QMB and MOX modules [114]. The main differences concern the choice of the kind of sensors which are mostly either mass transducers (such as QMB and SAW) or chemoresistors (metal oxides or conducting pol-ymers). The particular choice of sensors depends on the individual application. Table 4.6 lists the main characteristics of e-noses.
In metal oxide semiconductor arrays the response depends on changes in conductivity
Fig. 4.9 Human and artificial olfaction
Main types of commercial gas array sensors used in e-noses
Array type No. of sensing channels Array type No. of sensing channels
Sintered metal-oxide
chemoresistors
Lipid layers
piezoelectric/SAW
Phthalocyanine
chemoresistors
6, 8, 12, 18
6, 8
5
Organic polymers on
chemoresistors
Electrochemical
Pd-gate MOSFET
Optical FET camera
12, 20
2-18
10
324 pixels
arTificial olfacTion

238 organolePTic ProducT QualiTy
of each element when a volatile species is ad-sorbed in the sensor surface. The response of the most commonly used sensor is based on a two-part electrochemical reaction. In the first step chemisorption of oxygen onto the surface results in ionisation by electron transfer from the semiconductor to the oxygen molecule. The second step involves sorption of the analyte onto the semiconductor and subsequent reaction of the analyte and ionised oxygen on the sur-face. Metal oxide sensors have a very good sen-sitivity (ppm-ppb level) for a very broad range of chemical compounds. Only the use of arrays leads to an induced selectivity. Devices can be selected from a range of more than 40 differ-ent elements. A metal oxide e-nose is usually equipped with a number (e.g. 18) of different sensors. Among a related series of pure chemi-cals, the intensity of the signal for each sensor is highly correlated to the vapour pressure of the analyte. The reactivity of the analyte with a given sensor affects the response of the sensor to the analyte. Figure 4.10 shows an example of two analytes responding to an eight-element MOX semiconductor sensor array composed of 1. ZnO/SnO
2; 2. Pd/ZnO/SnO
2; 3. SnO
2; 4. Pd/
SnO2; 5. Pd/WO
3/SnO
2; 6. WO
3/SnO
2; 7. TiO
2/
SnO2; 8. Pd/TiO
2/SnO
2. Multivariate statistical
techniques can be used to identify sensors hav-ing particularly high affinities for certain classes
of chemicals. Miller et al. [115] have reported a study on the fundamental response and dis-criminative power of MOX sensors exposed to pure chemical samples. Literature reports the advantages of the MOX sensors [116] in com-parison with polymer sensors [117]. Despite a somewhat smaller detection range, MOX sen-sors are less sensitive to humidity variations. In addition, they are more rubust, with a lifetime up to 3 years, and are much cheaper to replace. However, they lack time-resolution.
The quartz microbalance chemosensory (QMB or QCM) system consists of combined headspace and chemosensory technology [73]. Several sensor elements are integrated on a com-mon quartz substrate. These sensors are coated with different gas-sensitive materials that react differently to the gases and vapours to be ana-lysed. The adsorption of volatiles on the gas sen-sitive coatings of a sensor element results in a frequency change or sensor signal of the oscil-lator. The sensor elements of a quartz microbal-ance can thus detect a change of mass accurately via resonance frequency shifts. QCM gas sensors have stable responses and a simple fabrication process can easily produce sensors with a variety of characteristics. Plasma-organic-film coated QCM sensors are suited for odorant detection at 500-800 ppb concentrations [119]. Conducting polymers (CPs) based on (hetero)aromatic com-pounds, such as polypyrrole, polyaniline or poly-thiophene, are sensitive to many odorants and a reversible change in electrical conductance is observed [120]. Several characteristics of these materials make them attractive for use as odour sensors. There are few problems due to poison-ing, rapid reversibility, use at room temperature, rapid response absorption/desorption within seconds to most volatile chemicals, allowance for time resolution, and a long sensor lifetime (several years). On the other hand, competition for binding on the surface causes poor sensitiv-ity to odour molecules at high humidity levels [112]. Understanding of the electrical conduc-tion mechanisms and the physico-chemical in-teractions between the volatile chemical and the conducting polymer is still restricted.
An opto-electronic nose is based on varia-tion of spectral absorbance, induced by chemical adsorption by volatile organic compounds [110]. The optimal features of metalloporphyrins make
Fig. 4.10 Response patterns of acetone and methanol from an eight-element integrated metal oxide semi-conductor array. See text for elements of the array.After Carey [118].

239
these molecules particularly appealing for opti-cal sensing purposes.
Sensor array systems differ in the number of sensing channels (arrays of 6 to 18 sensors), pixels (in optical FET cameras) or mass values. It has been pointed out [103] that it is attractive to consider using mixed arrays comprising dif-ferent types of sensors such as metal oxides, conducting polymers, surface acoustic wave devices and MOSFETs in a single array, or the alternative approach of using multidimensional measurements from the same sensor (e.g. con-ductivity, mass increments, transient responses and multifrequency measurements).
Recently, mass spectrometers have surfaced as sensor arrays for e-noses and as competitors to the “traditional” multi-sensor systems [121]. Such MS sensors are essentially HS-MS sys-tems: the sensing principle is based on direct injection of a complex sample headspace into a mass spectrometer, creating a mass spectrometric pattern of the unresolved gaseous mixture. The instrument works on the basis where for the pur-pose of data analysis each individual (m/z) ratio is treated as the equivalent of a sensor response from the conventional electronic noses. This means that there are potentially several hundred sensors. By selecting a set of particular fragment ions the sensor array used for sensor analysis is defined. The size and type of the optimum “sen-sor array”, i.e. the optimum set of fragment ions (and the corresponding scan-time/ion), can be tailored towards the particular application. The sensor output of a measurement, a reduced mass spectrometric pattern, is used to create a data-base of known, characterised reference samples - employing principal components analysis or an artificial neural network. Patterns of unknown samples are compared to those of the reference samples. Once an array is defined for a definite application, results obtained with different types of MS-instruments (but equal ionisation mode) are directly comparable. In case further quantita-tive or qualitative analysis is needed, the system can be used as a fully operational HS-GC-MS.
It cannot be taken for granted that an odour can actually be measured or analysed. The re-sponse of EN is not species-specific, as a sin-gle chemical will give a graded response over several individual elements. A strong response to a volatile does not necessarily imply that
the volatile will have a strong odour response. Consequently, the use of “noses” requires careful calibration against human response using formal sensory analysis techniques.
Method development involves the following considerations: (i) sampling mode; (ii) purging and equilibration time for sensor head and sam-ple vessel; (iii) temperature for development of headspace volatiles; (iv) corroborative data need-ed to characterise the samples; and (v) transfer-ability from R&D laboratory to production shop floor for QC. It is important in the analysis to include only those sensors that are contributing useful information. Removal of non-discriminat-ing sensors leads to better signal-to-noise ratio. Factors affecting reproducibility are tempera-ture, humidity, concentration of odoriphores in the headspace, and any carryover of analytes from one measurement to the next. Changing headspace concentration will affect the sensor response characteristics. The state of knowledge on method development with the e-nose is simi-lar to that of GC some 30 years ago. There are problems as to the best choice of sensors for par-ticular tasks. Stoll [1] has argued that the quest for an “ideal” odour sensor system is futile. The quality and suitability of a sensor system must be evaluated in the context of a specific applica-tion, e.g. rubber smell. Evaluation of the e-nose should then concentrate on five issues:• Instrument stability under standard working
conditions.• Repeatability of the responses from the sensors.• Medium and long-term reproducibility of the
odour assessment.• Discriminative power of the model over pro-
duction batches.• Relevance of the sensor response to the hu-
man olfactory perception.For the product life cycle the stability and va-
lidity of the database needs also to be secured. Some important experimental issues relate to in-terference from fluctuations in temperature and the adverse influence of humidity. Transferability of results is an important issue when different sensor principles and technologies are used. The key criteria for transferability of EN to be suc-cessful are: (i) interchanging ability of the sen-sors; (ii) sensor-to-sensor reproducibility; (iii) sample-to-sample reproducibility; (iv) repro-ducibility over time; and (v) system-to-system
arTificial olfacTion

240 organolePTic ProducT QualiTy
reproducibility. Sensors can be used to monitor a process, but variations in a process necessitate recalibration/optimisation of sensors.
It is quite essential to understand the sensory characteristics for the design of a sensor array for target odorants. Nakamoto et al. [108] have used computational chemistry for the prediction of QCM gas sensor responses. Enhancement of both sensitivity and selectivity of organic vapour sen-sors is the key factor for further breakthroughs.
Table 4.7 lists the main characteristics of e-noses. Advantages of non-specific chemical sensor arrays are the provision for rapid odour analysis (total analysis time ca. 20 min), poten-tially at low cost. Samples can quickly be run with operators that are lower skilled than those necessary to run HS-GC. They allow discrimina-
tion among samples based on their volatile com-pounds contents, but only within their operating range of concentration. As long-term monitoring devices, e-noses assess total odour objectively by predicting human sensory response from physi-cal measurements. The electronic nose has the potential to minimise the total reliance on panel tests in routine evaluation and enables to support the oleochemical business by a systematic odour control of raw material or finished products. In addition, EN is a valuable tool in the shelf-life study of these products. Using multivariate or neural network software e-noses can detect changes in volatile patterns, which can poten-tially be related to changes occurring on storage. Many applications in product quality control and process or environmental monitoring can be en-visaged. However, as shown in Table 4.7, there are quite a few conceptual and practical limita-tions to application. All commercialised sys-tems are designed to be broadly non-specific or semi-specific. Electronic noses are not diagnos-tic, are much less selective than the human nose and also less sensitive for most of the chemi-cal compounds; e-noses show partial selectiv-ity only. The e-nose can never fully substitute a panel. At present there is still little fundamental knowledge to explain their response characteris-tics. E-noses require training (method develop-ment) and are limited in quantification of odour intensity. Problems are related to reproducibility and ruggedness. Sensitivity decreases with time. Sensor arrays (rather than mass spectroscopy) as electronic noses often show unsatisfactory per-formance [122]. The e-nose can only be used under carefully controlled conditions. Practical limitations for objective quality control comprise sensor drift, adverse affection by atmospheric conditions (p
H2O, T), no system-to-system match-
ing, etc. For successful analysis of polymers with chemical sensor systems moisture manage-ment is important [123]. Moreover, e-noses are not capable of identifying the chemicals respon-sible for the odour of a multicomponent sample. Consequently, the currently commercially avail-able instruments are not a total solution for many emission problems and do not even solve very specific industrial chemicals odour problems (not being specific gas sensors).
Neither the GC nor the EN sensor technol-ogy is capable of indicating which of the sam-
Main characteristics of multi-arrayelectronic sensors
Rapid and objective assessment, low costalternative to VOC analysisEvaluation of volatile fractionRemoves potential risks for human olfactorysystemAt-line measurement of product consistency(QA, QC) by low-skilled operators
Limited operating rangeNon- or semi-specific (classification rather thanidentification)Not diagnosticLow to partial selectivityLess sensitive than human and dog’s nosesRestricted fundamental knowledgeMethod development required (need for trainingset)Calibration against human response requiredNo quantitative sensor-odour relationshipQuestionable (medium and long-term)reproducibility and ruggedness (sensor drift)Carefully controlled conditions neededLimited service lifeNo mature technologyPoor transferabilityLimited applicability

241
ple components is relevant to the odour. Since odours are not related to relative peak sizes of different components, certain compounds may exhibit very strong odours even if their responses are small. No information can be deduced from concentration data unless the odour-concentra-tion relationship is known for all the components measured. The use of EN as a GC detector has been advanced for the purpose of determining quantitative sensor-odour relationships [124]. GC-EN must be seen as an aid in EN develop-ment rather than a replacement of GC-O. The in-terested reader is referred to specialised texts and reviews [103,125-127] for further consultation.
Applications E-noses (and e-tongues) are primarily used for qualitative sensory applica-tions, which include the determination of the ori-gin and quality of raw materials, consistency of finished products, and taint-free products. Other applications of the technologies include shelf-life measurements and the evaluation of any in-teractions between packaging and the product. Semiquantitative applications include sensory score correlation and the measurement of the con-centration of flavours or fragrances within a food or cosmetic product. The following examples il-lustrate typical applications of the techniques.
Sensory analysis techniques are particularly appropriate for any consumer products that rely on sensory response for their appeal (e.g. personal care, food and beverage products) but have wider significance. Apart from the cosmet-ics (perfume) and aroma industries other fields of applications of e-noses are environmental and chemical (measuring paper odours, solvents from paint or plastics materials and surfactants in household products), and can be found in the polymer industry (assessing the organoleptic quality of polymer formulations, penetrability of aroma through packaging). In the chemical in-dustry, the use of sensory systems is being driven by the statutory need to ensure quality. Areas of application are quality control of raw and man-ufactured goods, usually as part of a quality as-surance programme such as ISO 9000 or Total Quality Management. Sensory analysis can be used to classify products into grades of differ-ent qualities. It can also reduce the risk of con-sumers receiving tainted foods, particularly from
chemical contaminants that have taste thresholds well below ppt level. At these levels, the human senses can be considerably more sensitive than sophisticated instrumental methods. Conditions for the use of e-noses as QC tools are: (i) sensi-tivity; (ii) long-term stability and reproducibil-ity; and (iii) control on the influence of humidity and temperature on the sensor signals. Different moisture contents of polymer samples influence the headspace composition of the samples and change the sensor discrimination. HDPE and PET can be analysed directly in the presence of unknown moisture contents after a calibration; PA requires a sample treatment prior to analysis [123]. The multi-sensor systems can also be used to take measurements in the environment (e.g. to detect harmful substances). A trend is appar-ent towards combined sensory and instrumental methods. For example, simultaneous time-inten-sity and mass spectrometry systems are used to measure volatile (flavour/odour) release.
Industrial applications include detection of off-odours related to synthetic polymers and polymer outgassing [23]. Various e-nose devices have been used to assess the odour level in PE formulations [53,128]. Thirty LDPE pellets from the same manufacturer have been analysed by a sensory panel, GC analysis and e-nose technol-ogy (3 min volatile headspace sampling, 6 dif-ferent sensors for polar, apolar, aminated and sulphur compounds, aldehydes and compounds emitted during cooking) [129]. Statistical analy-sis such as cluster analysis, PCA and discrimi-nant analysis were used to determine the groups within the samples, to obtain the olfactory ter-ritory of a sample series and to study product evolution during the process. Classical PCA dis-criminated the samples by odour intensity.
Due to their simplicity, rapidity and objectiv-ity, e-noses have started to be extensively used by industrial packaging companies. Knowledge of the range of odoriphores derived from packag-ing-grade polymers and an understanding of the phenomenon of odour is important with regard to: (i) determining the suitability of polymeric materials for the containment of sensitive pro-duce; and (ii) the development of advanced tech-niques that measure and control odour. Without needing any prior fractionation, e-noses can de-termine the fingerprint of a complex volatile or dissolved compound mixture by an array of semi-
arTificial olfacTion

242 organolePTic ProducT QualiTy
specific sensors coupled to a pattern recognition system. E-noses are a complementary tool to GC or to sensory panels to assess extremely rapidly (less than 60 sec) the quality of various types of packaging films or the kind of contamination. Although SEP assessment is still regarded as the most important technique for the analysis of odoriphores that originate from PE, a combined approach using a variety of analytical techniques is recommended in order to acquire full under-standing of the nature of the VOCs. It has been reported that a 12-element conducting polymer sensor array is useful in assessing taint in HDPE used for food packaging applications [130].
Bazzo et al. [131] have optimised a MOX sensor array (consisting initially of 18 sensors) for QC packaging in a plant environment. Good discrimination was obtained for (four) different qualities of HDPE from several manufacturers. With headspace generation parameters set at 20 min at 80°C, and an injection volume of 2500 µL for a 2 g sample, an optimisation process was used to validate the important instrumental pa-rameters, which comprised:(i) discrimination of different qualities for sev-
eral manufacturers;(ii) validation of discrimination over several pro-
duction batches;(iii) optimisation of sensor set to obtain the most
discriminating sensors;(iv) use of dynamic cleaning to ensure good sam-
ple throughput for quick routine analysis;(v) choice of chemical standards (heptanoic acid,
heptadecane and capric acid); and(vi) demonstration of transferability of one data-
base over several sensor sets, MOX systems and autosamplers.
The different odour levels of HDPE were used to build a PLS model to predict odour level. High correlation (0.99) was obtained between a sen-sory panel and EN analysis using PLS. The de-velopment of a turnkey EN instrument (with 6 selected sensors) has been shown for both quali-tative and quantitative prediction for HDPE. Electronic nose technologies can thus provide sensory panel and/or analytical chemical exper-tise to be transferred to the production shop floor for routine analysis. E-noses are not only used for control of product and package quality but also the solve package/product interaction prob-lems. PE manufacturing of drinking water bot-
tles is now routinely controlled by EN analysis [132], including screen caps.
Modern industrial requirements comprise the olfactory stability cq. conformity of a raw ma-terial or product. Emission problems for multi-component materials are usually complex with low detection levels (often ppt). Industrial smell or odour problems may be solved at various lev-els (short time vs. long term), namely by:(i) changes in raw materials supply or process(ing)
parameters (e.g. extruder temperature);(ii) harmonisation of raw materials; and(iii) analytics: identification of the odorant.For comparison of materials verification of smell test conditions is crucial. In smell design no masking agents are allowed.
With an average of 182 kg of plastics in an av-erage vehicle (US, 2002) [133] the automotive industry is an important consumer. There are a number of – car manufacturer specific – tests that automotive companies insist that plastics com-ponents manufactured by suppliers have to pass, essentially all based on total emission, cfr. Chp. 4.2. In the VW emissions test no detailed analysis of the components liberated is attempted. In other cases alternative odour tests are being applied to incoming materials (ranging from the human sen-sory method to DHS-TD-GC-MS, HS-FID/5 h at 120°C, or the use of sealed jars, in water), often simulating worst case conditions. The matter is complicated by the fact that for comparison of materials a constant time between production and analysis is needed. Just-in-time delivery of raw materials used in modern manufacturing processes allows little time in reaching olfactory conformity of the finished products by mere outgassing. Use of e-noses for QC of automotive supplies benefits from extensive testing and optimisation to set in-ternational standards and worldwide test methods. Subsequent rejection of off-spec deliveries then leads to the need for identification of the origin of the emission problem, either the raw material supply or processing. Also in this stage the use of e-noses is called for. Figure 4.11 strongly advo-cates the benefits of interdisciplinary method co-development.
Bullert [134] has used a hybrid modular sen-sor system composed of 8 QMB and 8 semicon-ductor (SnO
2) sensors for the detection of off-
odours of automotive parts of various polymers (PP, PPO/PS, EPDM, PA, PP/PE, SMA, PVC).

243
QMB sensors are generally more sensitive to higher-molecular-weight compounds, and SnO
2
sensors to small, oxidisable components [135]. Sassmannshausen [136] has reported multi-variate data analysis of off-odours of incom-ing high UV resistant ABS grades using a CP sensor. Also a HS-QMB chemosensory system has been used for the analysis of ABS polymers [73] and three methods of polymerisation were compared: bulk polymerisation, emulsion and
emulsion plus additives. The volatile compo-nents of the different ABS polymers interacted with the different coatings of six sensors, result-ing in characteristic signal patterns (Fig. 4.12). The signal patterns formed classes related to the polymerisation method. The results with the HS-QMB chemosensory system were obtained more rapidly than by the more time consuming HS-GC analysis sensory panel tests. Table 4.8 shows satisfactory correlation between the three evalu-ation techniques.
Olfactory testing of cars was once left to the user. The high degree of customer complaints concerning aliphatic amines and phenolic bond-ed materials first, and “rubber-like” smell more recently, has increased the awareness of car manufacturers to emission problems. For a per-fect finished product, perfect raw materials and perfect process manufacturing parameters are needed. Gas emissions inside cars, caused by the release of VOCs from the interior trim materi-als, such as leather or plastics, contribute greatly to the internal air pollution. Existing methods of analysing such emissions are a DIN standard 75-201 fogging test [137] and tests for total VOCs (TVOC) using GC-FID and GC-MS. However, these give inconsistent readings, are time-con-suming and in the DIN test only one material at
Fig. 4.11 Quality triangle
Fig. 4.12 QMB signal patterns for ABS polymers.Courtesy of Perkin Elmer.
arTificial olfacTion

244 organolePTic ProducT QualiTy
a time can be measured. These methods are also rather expensive, require skilled personnel and are thus not suited for process monitoring or on-line product control. There is a need to develop methods for characterising mixtures of VOCs in materials and indoor air. Kalman et al. [138] have classified complex gas emissions from automo-tive leather (known for its particularly high gas emission) using a hybrid e-nose composed of a gas sensor array of 10 MOSFETs with gates of thin Pt, Ir and Pd of different thicknesses and combinations, and 5 semiconducting MOXs. An e-nose has also been developed for the detec-tion and measurement of odours in PUR foams (MultiSampler-PU). The emission quality of rub-bers is targeted next for e-noses.
E-noses have also been applied to evaluate clay-coated newsback paperboard with distinc-tive aromas; control of relative humidity was important [139]. A sensory panel and e-nose evaluated samples of laminates from different processes. E-noses (MOX type) were also em-ployed to distinguish latices used as paper whit-eners and to investigate the impact of inks on paper [140].
Sadik et al. [124] have used GC-EN to relate sensor structures and activities for low vapour odorants, including polyaromatic hydrocarbons, industrial solvents and polychlorinated phenols. Results agree with FID with errors in the 0.5-3.0
% range. An example was reported of the detec-tion of tainted corks using HS-MS technology, as an alternative to GC-MS [141].
The examples reported are in line with the trend that e-noses are not expected to replace but to reduce recourse to odour panels. Since they cannot identify compounds, they are of restricted use in many odour problems. They are expected to have a great potential for process and environ-mental monitoring in the chemical industry [23].
BIBLIOGRAPHY
Sensory perception
R. Marsali (ed.), Flavor, Fragrance and Odor Analy-sis, M. Dekker, New York, NY (2002).
G.A. Burdock (ed.), Fenaroli’s Handbook of Flavour Ingredients, CRC Press, Boca Raton, FL (2001).
C.J. Mussinan and M.J. Morello (eds.), Flavor Analy-sis: Developments in Isolation and Characteri-zation, American Chemical Society, Washing-ton, DC (1998).
M.J. Saxby (ed.), Food Taints and Off-Flavours, Blackie A&P, London (1996).
P. Ackermann, M. Jägerstad and T. Ohlsson (eds.), Foods and Packaging Materials - Chemical In-teractions, The Royal Society of Chemistry, Cambridge (1995).
Outgassing and odour intensitya
Polymer HS-GC(relative area counts)
HS-QMB(average sensor signals)
Olfactometry(odour units)
- Sample C- Sample K
- Sample A- Sample D
- Sample F- Sample G
5.34.8
15.015.6
28.527.8
4740
5353
6664
32
5056
12095
a Sensor signals not normalised.
After ref. [73].
–

245
C.-T. Ho and C.H. Manley (eds.), Flavor Measure-ment, M. Dekker, New York, NY (1993).
Sensory analysis
T.C. Pearce, S.S. Schiffman, H. Troy Nagle and J.W. Gardner (eds.), Handbook of Machine Olfaction, J. Wiley & Sons, Chichester (2002).
B.R. Eggins, Chemical Sensors and Biosensors, J. Wi-ley & Sons, Chichester (2002).
W.J. Hurst (ed.), Electronic Noses & Sensor Array Based Systems, Technomic Publ. Co., Lancaster, PA (1999).
J.W. Gardner and P.N. Bartlett, Electronic Noses: Principles and Applications, Oxford University Press, Oxford (1999).
J.W. Gardner, An Introduction to Electronic Nose Technology, Neotronics Scientific Ltd., Stansted Mountfitchet, Essex, UK (1996).
J. Janata, Principles of Chemical Sensors, Plenum Press, New York, NY (1989).
REFERENCES
1. D. Stoll, in Electronic Noses & Sensor Array Based Systems (W.J. Hurst, ed.), Technomic Publ. Co., Lancaster, PA (1999), pp. 145-53.
2. H. Domininghaus, Die Kunststoffe und ihre Eigen-schaften, VDI-Gesellschaft, Düsseldorf (2004).
3. J. Scheirs, Compositional and Failure Analysis of Polymers. A Practical Approach, J. Wiley & Sons, Chichester (2000).
4. N. Ergenc and R.V. Todesco, Proceedings Add-Con World 2000, Basel (2000).
5. P. Tice, in Food Taints and Off-Odours (M.J. Saxby, ed.), Blackie A&P, London (1996), pp. 226-63.
6. M.J. Saxby (ed.), Food Taints and Off-Flavours, Blackie A&P, London (1996).
7. O.-G. Piringer and M. Rüter, in Plastics Packag-ing Materials for Food (O.-G. Piringer and A.L. Baner, eds.), Wiley-VCH, Weinheim (2000), Chp. 13.
8. J. Koszinowski and O.-G. Piringer, J. Plast. Film Shtg. 2, 40-50 (1986).
9. S. Nitz, in Workshop on Geruchsbewertung und -Minderung von Kunststoffen (A.K. Bledzki, ed.), Kassel University, Kassel (1999).
9a. DIN 10955, Sensorische Prüfung – Prüfung von Packstoffen und Packmitteln für Lebensmittel (2004-6).
10. M. Aurela, SM&T Project G6RD-CT-2001-00514: Calibration of Sensory Testing of Food Contact Materials – Paper and Board (Calibsen-sory) (2001).
11. D. Kilcast, in Food Taints and Off-Flavours (M.J. Saxby, ed.), Blackie A&P, London (1996), pp 1-40.
12. H. Maarse and H.W. Grosch, in Food Taints and Off-Flavours (M.J. Saxby, ed.), Blackie A&P, London (1996), pp. 72-106.
13. M.N.G. Storm van Leeuwen and G. Wullms, Proceedings Polymers, Laminations & Coatings Conference, TAPPI Press, Atlanta, GA (1998), pp. 229-36.
14. A. Maltby and M. Read, Proceedings Polyole-fins 2002, Houston, TX (2002).
15. J. Malík and I. Bachert, Proceedings AddCon World 2000, Basel (2000), P5.
16. R.-L. Heiniö, T. Sipiläinen-Malm and R. Ahvenai-nen, Packag. Technol. Sci. 6, 129-37 (1993).
17. R.R. Tamm, Proceedings Polymers, Lamina-tions & Coatings Conference, TAPPI Press, At-lanta, GA (1998), pp. 1067-71.
18. J. Ewender, A. Lindner-Steinert, M. Rüter and O.-G. Piringer, in Foods and Packaging Mate-rials-Chemical Interactions (P. Ackermann, M. Jägerstadt and T. Ohlsson, eds.), The Royal So-ciety of Chemistry, Cambridge (1995).
19. A. Giboreau and A. Bardot, Caoutch. Plast. 77 (789), 43-6 (2000).
20. J.-E. Noreux and S. Jeannin, Proceedings SPE ANTEC 2002, San Francisco, CA (2002), pp. 3682-6.
21. G. Buchbauer, L. Jirovetz, M. Wasicky and A. Nikiforov, J. Pulp Paper Sci. 21 (11), J398-400 (1995).
22. S.C.Hodgson, R.J. Casey, S.W. Bigger and J. Scheirs, Polym. Plast. Technol. Engng. 39 (5), 845-71 (2000).
23. F.J. Huby, in Electronic Noses & Sensor Ar-ray Based Systems (J.W. Hurst, ed.), Technomic Publ. Co., Lancaster, PA (1999), pp. 249-62.
24. R.A. Wilks and S.G. Gilbert, Food Technol. 23, 47 (1969).
25. S.L. Likens and G.B. Nickerson, Proc. Am. Soc. Brew. Chem. 5-13 (1964).
26. T.G. Hartman, J. Lech, E. Fukuda and R.T. Rosen, Mass Spec. Source 14, 18 (1991).
27. L. Soderhjelm and S. Eskelinen, Appita 38 (3), 205-209 (1985).
28. D.M. Wyatt, J. Plast. Film Shtg. 2, 144-52 (1986).
29. C. Rojas De Gante and B. Pascat, Packag. Tech-nol. Sci . 3, 97-115 (1990).
30. R. Mindrup and R.E. Shirley, Today’s Chemist at Work, 30-3 (July 2000).
31. Q. Xiang, S. Mitra, S. Dey and M. Xanthos, Pro-ceedings SPE ANTEC 2000, Orlando, FL (2000), pp. 2168-72.
32. M.G. Kontominas and E. Voudouris, Chim. Chron. New Series 11, 215-23 (1982).
bibliograPhy

246 organolePTic ProducT QualiTy
33. D.J. Pilborough, Packag. News (Austr.), 28-9 (Nov. 1987).
34. T.E. Acree, J. Barnard and D.G. Cunningham, in Analysis of Volatiles (P. Schreier, ed.), De Gru-yter, New York, NY (1984), pp. 251-67.
35. F. Ullrich and W. Grosch, Z. Lebensm.-Unters. Forsch. 184, 277-82 (1987).
36. S. Allan, P. Dawes, A. Hibberd and B. Pfeffer, Abstracts 7th Intl. Symposium on Hyphenated Techniques in Chromatography and Hyphenat-ed Chromatographic Analyzers (HTC-7), Bruges (2002), Paper P3.
37. P. Pollien, L.B. Fay, M. Baumgartner and A. Chaintreau, Anal. Chem. 71, 5391-7 (1999).
38. L.P.H. Linssen, J.L.G.M. Janssens, J.P. Roozen and M.A. Posthumus, Food Chem. 46, 367 (1993).
39. S. Shang-Zhi and G. Stanley, J. Chromatogr. 267, 183-9 (1983).
40. M.G.J. Beets, Structure-Activity Relationships in Human Chemoreception, Applied Science Pub-lishers, London (1978).
41. ASTM D 4526-96, Determination of Volatiles in Polymers by Static Headspace Gas Chromatog-raphy, American Society for Testing and Materi-als, Philadelphia, PA (1997), Vol. 8.03.
42. Ford Laboratory Test Method FLTM BO 131-01 (1997), Determination and Assessment of Odour from Resin-Bonded Headlining or Related Ma-terials/Parts, Ford Automotive Safety and Engi-neering Standards Office (DVM-0014-MA).
43. Daimler Benz, Arbeitsvorschrift zur Bestimmung von gasförmigen und kondensierbaren Emissio-nen aus Fahrzeuginnen-ausstattungsmaterialien mit Thermodesorption, Prüfanweisung PB VWT 709 (1997).
44. A.Ph. van Harreveld, VDI Berichte 1373, 19 (1998).
45. T.G. Hartman, J. Lech, K. Karmas, J. Salinas, R.T. Rosen and C.-T. Ho, in Flavour Meas-urement (C.-T. Ho and C.H. Manley, eds.), M. Dekker, New York, NY (1993), pp. 37-60.
46. M.E. Krzymien, Intl. J. Environm. Anal. Chem. 36, 193 (1989).
47. J.A.J. Jansen and W.E. Haas, Anal. Chim. Acta 196, 69 (1987).
48. C.R. Chuang, Soc. Plast. Eng. J., 246 (1984). 49. N.J. Fales, L.C. Stover and J.D. Lamm, Polym.
Plast. Technol. Engng. 21, 111 (1983). 50. J.P.H. Linssen, J.L.G.M. Janssens, J.P. Roozen
and M. Posthumus, J. Plast. Film Shtg. 7, 294 (1991).
51. S.C. Hodgson, M.J. O’Connor, R.J. Casey and S.W. Bigger, J. Agric. Food Chem. 46, 1397 (1998).
52. R. Peled and H. Mannheim. Mod. Packaging 50, 45 (1977).
53. S.W. Bigger, M.J. O’Connor, J. Scheirs, J.L.G.M. Janssens, J.P.H. Linssen and A. Legger-Huys-man, Adv. Chem. Ser. 249 (Polymer Durability), 249-68 (1996).
54. A. Bravo, J.H. Hotchkiss and T.E. Acree, J. Ag-ric. Food Chem. 40, 1881-5 (1992).
55. R.C. Nielson, J. Liq. Chromatogr. 14, 503-19 (1991).
56. A. Bravo and J.H. Hotchkiss, J. Appl. Polym. Sci. 47, 1741 (1993).
57. J.D. Culter, J. Plast. Film Shtg. 8 (3), 208 (1992).
58. A. Hoff and S. Jacobsson, J. Appl. Polym. Sci. 26, 3409 (1981).
59. T.E. Acree, J. Barnard and D.G. Cunningham, Food Chem. 14, 273-86 (1984).
60. M.J.O’Connor, S.W. Bigger, J. Scheirs, J.L.G.M. Janssens, J.P.H. Linssen and A. Legger-Huysman, ACS Polym. Chem., Polym. Prepr. 34, 247 (1993).
61. K.T. Villberg and A.K. Veijanen, Tappi J. 81 (8), 165-70 (1998).
62. K.T. Villberg and A.K. Veijanen, Anal. Chem. 73 (5), 971-7 (2001).
63. K. Azuma, T. Tanaka, H. Tsunoda, T. Hirata and T. Ishitani, Agric. Biol. Chem. J. 47 (4), 855-60 (1983).
64. Y.C. Ho, S.S. Young and K.L. Yam, J. Vinyl Ad-dit. Technol. 4 (2), 139-50 (1998).
65. K.T. Villberg, A.K. Veijanen, I. Gustafsson and K. Wickstrom, J. Chromatogr. A791 (1/2), 213-9 (1997).
66. P. Rebeyrolle-Bernard and P. Etiévant, J. Appl. Polym. Sci. 49, 1159-64 (1993).
67. F. Welle, A. Mauer and R. Franz, Radiat. Phys. Chem. 63, 841-4 (2002).
68. J.J. Killoran, Radiat. Res. Rev. 3, 369-88 (1972). 69. D. Marque, A. Feigenbaum, D. Dainelli and A.-M.
Riquet, Food Addit. Contam. 15, 831-41 (1998). 70. F. Welle, G. Haack and R. Franz, Dtsch. Lebensm.-
Rdsch. 96, 423-30 (2000). 70a. N.H. Stoffers, J.P.H. Linssen, R. Franz and F.
Welle, Radiat. Phys. Chem. 71, 203-6 (2004). 71. J. Gilbert and J.R. Startin, J. Food Sci. Agr. 34,
647-52 (1983). 72. S.H. Harris, P.E. Kreter and C.W. Polley, J. Cel-
lular Plast. 24, 486 (1988). �3 . Perkin Elmer Application Note ‘Sensor Sys-
tems’, Perkin Elmer, Norwalk, CT (1998). 74. H. Kim-Kang, Crit. Rev. Food Sci. Nutr. 29, 255-
71 (1990). 75. O.Y. Kwapong and J.H. Hotchkiss, J. Food Sci.
52, 761-3 (1987). 76. J. Manura, Mass Spec. Source 12 (1), 22-7
(1991). 77. S.C. Hodgson, R.J. Casey, J.D. Orbell and S.W.
Bigger, J. Chem. Educ. 77 (12), 1631-3 (2000).

247
78. F.B. Whitfield, K.J. Shaw and T.H.L. Nguyen, J. Sci. Food Agr. 37, 85-96 (1986).
79. H. Kolnaar, unpubl. results (1997). 80. K.L. Yam, Y.C. Ho, S.S. Young and P.F. Zam-
betti, Polym. Plast. Technol. Engng. 35, 727 (1996).
81. Y.C. Ho, K.L. Yam, S.S. Young and F.P. Zambet-ti, J. Plast. Film Shtg. 10, 194 (1994).
82. J.P.H. Linssen and J.P. Roozen, in Food Pack-aging and Preservation (M. Mathlouthi, ed.), Blackie A&P, Glasgow (1994).
83. M.N.G. Storm van Leeuwen and G. Wullms, Proceedings Sixth European Polymers, Lami-nations & Coatings Symposium, Copenhagen (1999), pp. 199-207.
83a. J.C.J. Bart, Additives in Polymers. Industrial Analysis and Applications. J. Wiley & Sons, Chichester (2005).
84. A. Bravo and J.H. Hotchkiss, Appl. Polym. Sci. 47, 1741 (1993).
85. S.P. Kochar, in Food Taints and Off-Flavors (M.J. Saxby, ed.), Blackie A&P, London (1996), Chp. 6.
86. M.N.G. Storm van Leeuwen, E.W. Kuyk and G. Wullms, J. Plast. Film Shtg. 14, 24-39 (1998).
87. R.J. McGorrin, T.R. Pofahl and W.R. Croasmun, Anal. Chem. 59, 1109-12A (1982).
88. R. Franz, S. Kluge, A. Lindner and O.-G. Piring-er, Packag. Technol. Sci. 3, 89-95 (1990).
89. R. Franz, Packag. Technol. Sci. 6, 91-102 (1993). 90. J. Simal-Gandara, M. Sarria-Vidal and R. Rijk,
J. AOAC Intl. 83 (2), 311-9 (2000). 91. E.W. Grotheer and C.H. Smith, Proceedings
SPE ANTEC ’83, Chicago, IL (1983), p. 421. 92. J. Koszinowski, H. Müller and O.-G. Piringer,
Coating 13, 310-14 (1980). 93. H. Schmidt and H. Lüssmann-Geiger, Kunst-
stoffe 82, 685-8 (1992). 93a. F.O.W. Loock, Ph. D. Thesis, University of Braun-
schweig (1995). 94. R.A. Hill, Proceedings 34th SPI Annual Techni-
cal and Marketing Conference, SPI, New Orle-ans, LA (1992), p. 459.
95. Normenblatt DIN 75201, Bestimmung des Fog-gingverhaltes von Werkstoffen der Kraftfahrzeug-Innenausstattung, Beuth, Berlin (1992).
96. Audi, VDA-Empfehlung 277, Nichtmetallische Werkstoffe der Kfz-Innenausstattung, Bestimm-ung der Emissionen organischer Verbindungen, Verband der Automobilindustrie e.V., Frankfurt (Jan. 1995).
97. VDA-Empfehlung 275, Formteile für den Fahrzeuginnenraum, Bestimmung der Formal-dehydabgabe, Messverfahren nach der modifi-zierten Flaschen-Methode, Verband der Auto-mobilindustrie e.V., Frankfurt (July 1994).
98. VDA-Empfehlung 270, Bestimmung des Ge-ruchsverhaltens von Werkstoffen der Kraftfahr-zeug-Innenausstattung, Verband der Automobil-industrie e.V., Frankfurt (Oct. 1992).
99. W. Hill, B. Wehling and D. Klockow, Appl. Spec-trosc. 53 (5), 547-50 (1999).
100. R.F. Augustin, H.-G. Bittner, H. Klingenberger and B. Wiesend, Gerstel Solutions Worldwide EI, 12-15 (2000).
101. K. Takeda, A. Mochizuki, T. Nonaka, I. Matsumo-to and T. Fujimoti, J. IEST 44 (1), 28-32 (2001).
102. J.D. Culter, in Proceedings Foodplas 92 (Plas-tics Institute of America, Fairfield, NJ), Orlando, FL (1992).
103. J.W. Gardner and P.N. Bartlett, Electronic Nos-es: Principles and Applications, Oxford Univer-sity Press, Oxford (1999).
104. K.C. Persaud and G.H. Dodd, Nature 299, 352-5 (1982).
105. J.W. Gardner and P.N. Bartlett (eds.), Sensors and Sensory Systems for an Electronic Nose, Kluwer Academic Publishers, Dordrecht (1992).
106. J.W. Gardner and W.E. Gardner, Insight 39 (12), 865-9 (1997).
107. T.C. Pearce, J.W. Gardner and W. Göpel, in Sen-sors Update (W. Göpel, J. Hesse and H. Baltes, eds.), Wiley-VCH, Weinheim (1998), Vol. 3, pp. 61-130.
108. T. Nakamoto and T. Morizumi, in Electron-ic Noses & Sensor Array Based Systems (W.J. Hurst, ed.), Technomic Publ. Co., Lancaster, PA (1999), pp. 123-30.
109. Y.-M. Yang, P.-Y. Yang, X.-R. Wang, L.-X. Cai and J. Liu, Huaxue Chuanganqi 17 (4), 282-4 (1997).
110. C. Di Natale, D. Salimbeni, A. Macagnano, R. Paolesse and A. D’Amico, in Electronic Noses & Sensor Array Based Systems (W.J. Hurst, ed.), Technomic Publ. Co., Lancaster, PA (1999), pp. 205-10.
111. T.A. Dickinson, J. White, J.S. Kauer and D.R. Walt, Nature 382, 697-700 (1996).
112. K.C. Persaud, R.A. Bailey, A.M. Pisanelli, H.-G. Byun, D.-H. Lee and J.S.Payne, in Electron-ic Noses & Sensor Array Based Systems (W.J. Hurst, ed.), Technomic Publ. Co., Lancaster, PA (1999), pp. 318-28.
113. H. Ulmer, J. Mitrovics, G. Noetzel, U. Weimar and W. Göpel, Sens. Actuators B43, 24 (1997).
114. T. Hermle, U. Weimar, J. Mitrovics, W. Rosen-stiel, and W. Göpel, in Electronic Noses & Sensor Array Based Systems (W.J. Hurst, ed.), Technom-ic Publ. Co., Lancaster, PA (1999), pp. 97-102.
115. R.E. Schaak, D.B. Dahlberg and K.B. Miller, in Electronic Noses & Sensor Array Based Systems (W.J. Hurst, ed.), Technomic Publ. Co., Lancas-ter, PA (1999), pp. 14-26.
referenceS

248 organolePTic ProducT QualiTy
116. P.N. Bartlett and J.W. Gardner, in Sensors and Sensory Systems for an Electronic Nose (J.W. Gardner and P.N. Bartlett, eds.), Kluwer Aca-demic Publishers, Dordrecht (1992), p. 31.
117. J.W. Gardner and P.N. Bartlett, Sens. Actuators A51, 1 (1982).
118. W.P. Carey, Trends Anal. Chem. 13, 210-18 (1994).
119. N. Kasai, I. Sugimoto and M. Nakamura, Abstr. 7th Chemical Sensors, Intl. Mtg., International Ac-ademic Publishers, Beijing (1998), pp. 160-2.
120. K.C. Persaud and P. Pelosi, in Sensors and Sen-sory Systems for an Electronic Nose (J.W. Gard-ner and P.N. Bartlett, eds.), Kluwer Academic Publishers, Dordrecht (1992), p. 237-56.
121. S. Nitz, B. Dittmann, H. Parlar and G.Horner, in Electronic Noses & Sensor Array Based Systems (W.J. Hurst, ed.), Technomic Publ. Co., Lancas-ter, PA (1999), pp. 185-97.
122. N.W. Armstrong, Today’s Chemist at Work 8 (10), 9 (1999).
123. F. Welle, A. Mauer, E.M. Keil and M. Slama, Sens. Actuators B69, 372-8 (2000).
124. M. Masila, M. Breimer and O.A. Sadik, in Elec-tronic Noses & Sensor Array Based Systems (W.J. Hurst, ed.), Technomic Publ. Co., Lancas-ter, PA (1999), pp. 27-42.
125. W.J. Hurst (ed.), Electronic Noses & Sensor Ar-ray Based Systems, Technomic Publ. Co., Lan-caster, PA (1999).
126. J.W. Gardner and P.N. Bartlett, Sens. Actuators B18 (1-3), 211-20 (1994).
127. D. Hodgins, Food Sci. Technol. 79, 331-71 (1997). 128. S.C. Hodgson, G. Trout, M.J. O’Connor and
S.W. Bigger, Abstracts 37th Intl. Symposium on Macromolecules, Gold Coast (1998), p. 428.
129. Alpha M.O.S. S.A., Application Note No. 3, Tou-louse (n.d.).
130. B. Hanrahan, S.C. Hodgson and G. Trout, in Electronic and Aroma Sensing Conference, Wer-ribee, Australia (1997).
131. S. Bazzo, F. Loubet, S. Labreche and T.T. Tan, in Electronic Noses & Sensor Array Based Systems (W.J. Hurst, ed.), Technomic Publ. Co., Lancas-ter, PA (1999), pp. 225-33.
132. T. Tsung Tan, V.O. Schmitt, Q. Lucas and S. Isz, LabPlus Intl., 16-19 (2001).
133. J. Margolis, Automotive Plastics Global Markets to 2010, Margolis Polymers, Keansburg, NJ (2003).
134. J. Bullert, in Workshop on Geruchsbewertung und -Minderung von Kunststoffen (A.K. Bledz-ki, ed.), Kassel University, Kassel (1999).
135. J. Mitrovics, U. Weimar, H. Ukmer, G. Noetzel and W. Göpel, Proceedings of Sensors ’97, Nürn-berg (1997).
136. J. Sassmannshausen, Proceedings Symposium Kunststofftechnik Automobilbau, VDI-Gesell-schaft, Düsseldorf, (1998), pp. 247-65.
137. DIN 75-201, Determination of the Windscreen Fogging Characteristics of Trim Materials in Motor Vehicles Applicable to SAE Recommend-ed Practice Test Procedure to Determine the Fogging Characteristics of Interior Automotive Materials, SAE J. 1756 (Dec. 1994).
138. E.L. Kalman, A. Löfvendahl, F. Winquist and I. Lundström, Anal. Chim. Acta 403, 31-8 (2000).
139. J.D. Culter, Tappi J. 82 (6), 194-200 (1999). 140. Alpha M.O.S. S.A., Application Note No. 1,
Toulouse (n.d.). 141. V. Shiers, M. Adechy and A. Squibb, in Elec-
tronic Noses & Sensor Array Based Systems (W.J. Hurst, ed.), Technomic Publ. Co., Lancas-ter, PA (1999), pp. 289-95.