Embed Size (px)
Citation preview

Abdul Ghafur Memorial Lecture 2018
The Uncomfortable Truth Recent Economic Growth Performance
of Bangladesh
by Debapriya Bhattacharya, PhD
Distinguished Fellow Centre for Policy Dialogue (CPD) <[email protected]>
Organised by
4 November 2018

ii D. Bhattacharya: The Uncomfortable Truth
Published by
Bangladesh Institute of Development Studies
E-17, Agargaon, Sher-e-Bangla Nagar
G.P.O. Box No. 3854, Dhaka - 1207, Bangladesh
Phone: 9143441-8
Fax: 880-2-8141722
E-mail: [email protected]
Website: www.bids.org.bd
Copyright Debapriya Bhattacharya, November 2018
This document has been set in Cambria
Cover and design concept by Avra Bhattacharjee, CPD.
Printed in Al-Helal Enterprise, 4 Sobhanbag, Mirpur Road, Dhaka-1207.

D. Bhattacharya: The Uncomfortable Truth iii
Dr Abdul Ghafur (1935–2002)
Dr Abdul Ghafur is no more with us. He passed away in Dhaka on 27
February 2002 in his sixty-seventh year. Dr Ghafur was born on 25 March
1935 in Barisal. He obtained an M.A. in Economics from the University of
Dhaka in 1961 and a Ph.D. from the University of Iowa, U.S.A. in 1973.
Dr Ghafur joined PIDE as a Staff Economist in 1963. He became a Research
Director at BIDS in 1984 and served in this position till his retirement in
1995. As a prominent member of its research staff, he had a long and close
association with the Institute. He holds us in debt for the many contributions
he made to further the interests of BIDS.
Dr Ghafur was the president of the Bangladesh Economic Association during
1979–81; a member of the Industrial Wage and Productivity Commission in
1981/82; a fellow of Equity, Diversity, and Inclusion (EDI) and directed EDI
sponsored BIDS training programme for a number of years. Dr Ghafur
published a number of articles in the area of informal trade, public
expenditure policies, food policy and project impact evaluation. He was one
of the very few economists in Bangladesh, thoroughly conversant with both
neo-classical and Marxian economics.
Throughout his professional career, Dr Ghafur was well-known for deep
social commitments and radical social ideas. He was associated with
progressive social and civic movements since his student days as activist
and, later, along with other titans of the Bangladesh economics profession,
emerged as an influential advocate of the rights of the most disadvantaged
social and ethnic groups in our society. A passionate social thinker dedicated
to the advancements of the downtrodden people, he raised his voice in
various professional and social forums in the course of the last three decades
in their struggle for human rights and social justice.
In his death, the profession has lost an eminent economist and the people —
a champion of their cause. We join the nation in mourning this profound loss
to our profession.
iv D. Bhattacharya: The Uncomfortable Truth
List of Publications
Ghafur, A., Roy, D. K., Mohammad, Y., Raihan, A., Saha, S. C., & Roy, R. K. (1996). Socio-economic impact of fourth flood control and drainage project. (Working paper new series no. 18). Dhaka: Bangladesh Institute of Development Studies (BIDS). Ghafur, A., Roy, D. K., & Mohammad, Y. (1995). Fourth flood control and drainage project: An evaluation. Dhaka: Bangladesh Institute of Development Studies (BIDS). Ghafur, A. (1995). The barind integrated area development project: an evaluation. Dhaka: BIDS. Ghafur, A. (1995). Financial Sector Reform: An Overview. Experiences with Economic Reform: A Review of Bangladesh’s Development 1995, 87-100. Dhaka: Centre for Policy Dialogue (CPD) & University Press Limited (UPL). Ghafur, A., Chowdhury, O. H., Roy, D. K., & Center on Integrated Rural Development for Asia and the Pacific. & International Development Research Centre (Canada). (1994). Public expenditure and poverty alleviation in Bangladesh. Dhaka: Centre on Integrated Rural Development for Asia and the Pacific. Ghafur, A., Islam, M., Faiz, N. (1991). Illegal international trade in Bangladesh: Impact on the domestic economy (phase-II): Draft report. Dhaka: Bangladesh Institute of Development Studies (BIDS). Ghafur, A., Islam, M., Faiz, N. (1990). Illegal international trade in Bangladesh: impact on the domestic economy (phase-I): Final report. Dhaka: Bangladesh Institute of Development Studies (BIDS). Ghafur, A. (1987). Financing of public sector development expenditure: The case of Bangladesh. Dhaka: BIDS. Ghafur, A. (1987). Amader swadhinata sangram (Our liberation struggle). Dhaka: Islamic Foundation Bangladesh. Ghafur, A. (1973). Dynamic differential tax incidence: theory and applications. Iowa: Iowa University, Graduate College.

D. Bhattacharya: The Uncomfortable Truth v
Contents
1. Remembering Ghafur Bhai 1
2. Revisiting Bangladesh’s Recent Growth Performance ........................... 3
3. The Nature of Recent Economic Growth ................................................... 12
4. In Search of a Conclusion ............................................................................... 29
References ............................................................................................................... 34

vi D. Bhattacharya: The Uncomfortable Truth
List of tables
Table 1: Ranking of Bangladesh According to GDP/GNI and Per 3
Capita GDP/GNI
Table 2: Countries Surpassed by Bangladesh in Terms of GDP Per 4
Capita
Table 3: Projected Ranking Changes by 2030 Compared to 2018 5
Table 4: Average Growth Rates (1991–2017): GDP/GNI, GDP/GNI 6
Per Capita and GDP/GNI Growth Rates
Table 5: Changing Configuration of Source of GDP Growth (in 8
percentage point)
Table 6: Changes in Sector-wise GDP Share (%) 9
Table 7: Poverty Rate (%) in Bangladesh by Residence 10
Table 8: GDP Growth and Poverty Reduction (in percentage point) 11
Trends in Bangladesh
Table 9: Percentage Share of Consumption at Household Level (%), 13
and Gini Coefficient by Residence
Table 10: Per Capita GNI and Income Gini Index 14
Table 11: Percentage Share of Income at Household Level (%), and 15
Gini Coefficient by Residence
Table 12: Average Household Real Income Per Month (adjusted to 16
2015-16 CPI)
Table 13: Percentage Share of Wealth at Household Level (%), and 17
Gini Coefficient by Residence
Table 14: Employment by Broad Economic Sectors 18
Table 15: Distribution of Youth Unemployment by Education Level (% 20
of total unemployed youth)
Table 16: Under- Five Mortality Rate and Neonatal Mortality Rate 22
(deaths per 1,000 live births) by Wealth Status
Table 17: Prevalence of Stunting and Wasting among Children Under 24
Five Years of Age by Wealth Status
Table 18: Enrolment of Children Aged 6-10 and Aged 11-15 Years 25
by Residence and Poverty Status, 2016
Table 19: Poverty Rate (%) in Bangladesh by Division 27

D. Bhattacharya: The Uncomfortable Truth vii
List of figures
Figure 1: Per Capita GDP and Per Capita GNI 7
Figure 2: Change in Real General Wage Rate Index (WRI) (%) 21
Figure 3: Latin American Countries: Initial Income Inequality and 30
Reduction Level (2000 to 2010)
Figure 4: Voice and Accountability Index of Bangladesh (Estimate 32
and Ranking)
Acknowledgement
The author is grateful to Mr Suman Biswas, former Research Associate, CPD
and Mr Syed Muhtasim Fuad, Programme Associate, CPD for data support.
Research assistance was provided by Ms Ismum Nawar, Programme
Associate, CPD.

viii D. Bhattacharya: The Uncomfortable Truth

1. Remembering Ghafur Bhai
It is a privilege and a joy for me to join all of you here today to celebrate the
life and works of late Dr Abdul Ghafur. Dr Ghafur was a talented economist;
he sought to put his expertise to the service of the marginalised and working
people of Bangladesh. In 1971, he actively organised the overseas movement
in favour of the Liberation War.
Dr Ghafur was a mentor, a comrade and a friend. He always extended his
uninhibited support and cooperation to his junior colleagues. Dr Ghafur was
a generous, caring and likeable person who earnestly walked the talk. I am
humbled by BIDS’s thoughtful decision to invite me to deliver the third
lecture (2018) in memory of Dr Ghafur.
I came to know Dr Ghafur or rather Ghafur Bhai in 1984 on my return from
abroad and at the beginning of my association with BIDS. I fondly remember
the late afternoons of the second half of 1980s when we were deeply
engaged in trying to develop an economic manifesto for the toiling people of
Bangladesh. In the later part of the 1980s, we worked together to imbue the
anti-autocracy agenda with livelihood concerns of the working class. He used
to provide guidance on how to embed pro-poor economic issues in political
declarations and manifestos – a task that we are obliged to pursue till date
as an expression of our respect to Ghafur Bhai.
Indeed, a large part of my interactions with Ghafur Bhai was to take place at
the meeting of the Economists’ Group of the Communist Party of Bangladesh.
We used to look up to him for leadership and advice as he had an exceptional

2 D. Bhattacharya: The Uncomfortable Truth
quality of interpreting practical policy issues from the socio-economic class
approach.
Dr Ghafur was a professional leader. I have had the privilege of closely
working with him when he was the President of the Bangladesh Economic
Association (BEA). He put in efforts to mobilise the researchers, academics
and executives to service social goals through their respective vocations.
Indeed, it was due to Ghafur Bhai’s inspiration, that I went on to serve BEA
as its General Secretary for three consecutive terms.
Dr Ghafur was a sincere well-wisher of the Centre for Policy Dialogue (CPD).
He was part of the initial set of authors when CPD in 1995 launched its
flagship programme titled “Independent Review of Bangladesh’s
Development” (IRBD). Over the last two decades and more, CPD did carry
forward that legacy with distinction.
Dr Ghafur was essentially a macro-economist with wide ranging interest. My
first encounter with his scholarship was through his works on public
expenditure and taxation. Ghafur Bhai led the pioneering research in
Bangladesh on informal cross-border trade. In later years, he worked on
flood-related issues. Even a cursory look at his works will make evident his
grasp over conceptual issues and the clarity with which he applied them in
empirical analysis. However, his volume of published works do not do justice
either to his talent or to his expertise.
At the end of the day, Ghafur Bhai was a pro-people thought leader, if I may
say, a public intellectual. While choosing my today’s lecture theme, I tried to
anticipate what would have concerned him at this juncture of Bangladesh’s

D. Bhattacharya: The Uncomfortable Truth 3
economic development. I can very well imagine Ghafur Bhai saying –
“Economic growth rate is pretty good, but how equitably the benefits are
being distributed?” Thus, as a way to pay homage to Dr Ghafur, I decided to
talk about the nature of the recent growth performance of our country.
2. Revisiting Bangladesh’s Recent Growth Performance
Global Perspective
It is by now well recognised that the Bangladesh economy has achieved
spectacular economic growth in the recent past. Indeed, the country can now
boast of a USD 275 billion worth of domestic economy (2017–18). The
robust economic growth rate has remarkably advanced the country in global
ranking—both in terms of size of the economy and per capita income (see
Table 1).
Table 1: Ranking of Bangladesh According to GDP/GNI and Per Capita
GDP/GNI
Source: Based on World Development Indicators (World Bank, n.d.-a: accessed on 21/10/2018).
BD Ranking
by
2000 2005 2010 2015 2016 2017 Closest Countries (2017)
Above Below
GDP in
current USD
49
(199)
56
(204)
59
(203)
46
(200)
44
(195)
43
(188)
Chile (41);
Finland (42)
Egypt (44);
Vietnam (45)
Per capita
GDP in
current USD
164
(199)
176
(204)
178
(203)
165
(200)
158
(195)
150
(188)
Ghana (148);
Pakistan
(149)
Zambia (151);
Kenya (152)
GNI in
current USD
46
(189)
54
(194)
55
(193)
44
(191)
44
(189)
42
(185)
Ireland (40);
Chile (41)
Finland (43),
Egypt (44)
GNI per
capita, Atlas
Method
(current
USD)
148
(184)
160
(192)
166
(191)
158
(189)
153
(188)
147
(184)
Cote d'Ivoire
(145); Ghana
(146)
Kenya (148);
Congo (149)

4 D. Bhattacharya: The Uncomfortable Truth
In terms of GDP size, the country got elevated from 49th position (among 199
countries) in 2000 to 43rd position (among 188 countries) in 2017. From the
vantage point of GNI size, the country moved up by four positions during the
comparable period. In terms of GDP per capita income measure,
Bangladesh’s progress had been no less discernible. The country progressed
by 14 ranks (from 164th place to 150th) between 2000 and 2017 as its per
capita GDP increased.
The list of countries that were overtaken by Bangladesh between 2000 and
2017– based on per capita GDP measure – is quite interesting (see Table 2).
The number of such countries was nine including Cambodia, Cameroon,
Haiti, Kenya, Laos, Mali, Myanmar, Uzbekistan and Zimbabwe. Laos;
however, resurpassed Bangladesh in 2006.
Table 2: Countries Surpassed by Bangladesh in Terms of GDP Per Capita
2000-05 2006-2010 2010-15 2015-2017
Haiti, Zimbabwe
and Laos (Laos
resurpassed
Bangladesh in
2006)
Mali Cambodia and
Myanmar
Cameroon, Kenya
and Uzbekistan
Source: Based on World Development Indicators (World Bank, n.d.-a: accessed on 21/10/2018).
Bangladesh’s economic growth performance has earned wide-ranging global
accolade. One may recall the reports of the Goldman Sachs (O’Neill, Wilson,
Purushothaman and Stupnytska, 2005) that included the country in the
group of Next-11. The Citigroup (Buiter, Rahbari, and Kupciuniene, 2011)
later made the country part of 11 Global Growth Generators (G3).
D. Bhattacharya: The Uncomfortable Truth 5
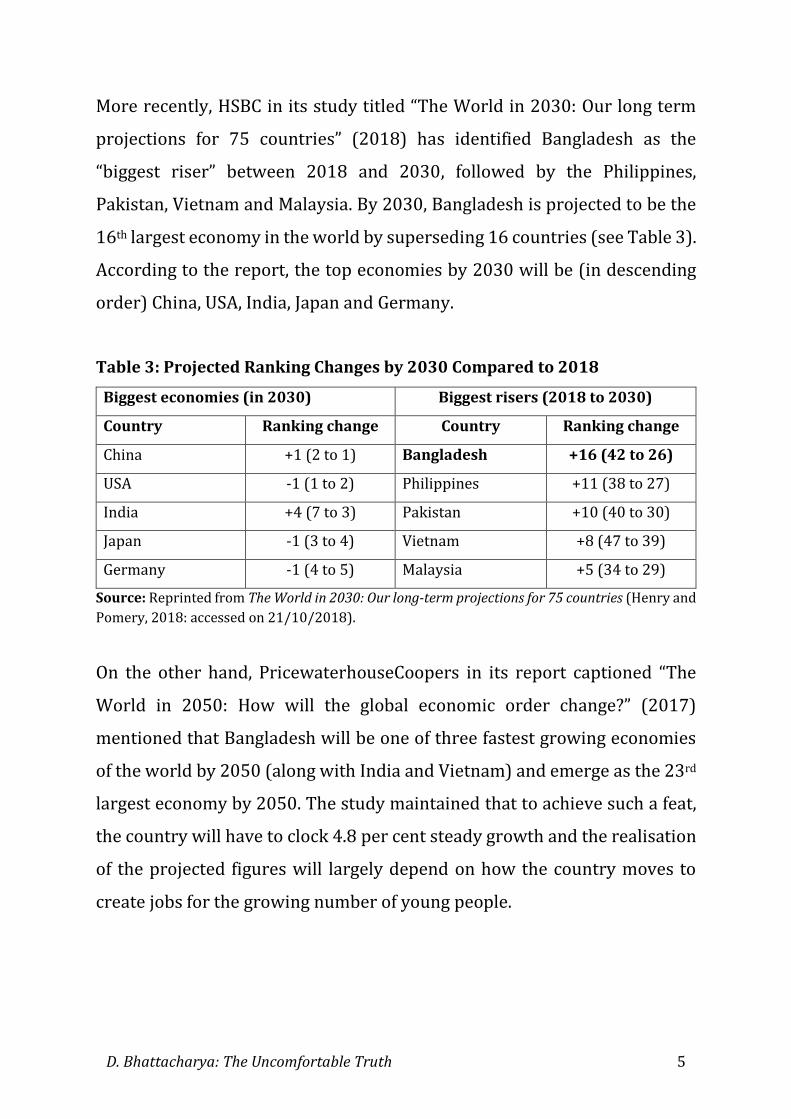
More recently, HSBC in its study titled “The World in 2030: Our long term
projections for 75 countries” (2018) has identified Bangladesh as the
“biggest riser” between 2018 and 2030, followed by the Philippines,
Pakistan, Vietnam and Malaysia. By 2030, Bangladesh is projected to be the
16th largest economy in the world by superseding 16 countries (see Table 3).
According to the report, the top economies by 2030 will be (in descending
order) China, USA, India, Japan and Germany.
Table 3: Projected Ranking Changes by 2030 Compared to 2018
Biggest economies (in 2030) Biggest risers (2018 to 2030)
Country Ranking change Country Ranking change
China +1 (2 to 1) Bangladesh +16 (42 to 26)
USA -1 (1 to 2) Philippines +11 (38 to 27)
India +4 (7 to 3) Pakistan +10 (40 to 30)
Japan -1 (3 to 4) Vietnam +8 (47 to 39)
Germany -1 (4 to 5) Malaysia +5 (34 to 29)
Source: Reprinted from The World in 2030: Our long-term projections for 75 countries (Henry and
Pomery, 2018: accessed on 21/10/2018).
On the other hand, PricewaterhouseCoopers in its report captioned “The
World in 2050: How will the global economic order change?” (2017)
mentioned that Bangladesh will be one of three fastest growing economies
of the world by 2050 (along with India and Vietnam) and emerge as the 23rd
largest economy by 2050. The study maintained that to achieve such a feat,
the country will have to clock 4.8 per cent steady growth and the realisation
of the projected figures will largely depend on how the country moves to
create jobs for the growing number of young people.

6 D. Bhattacharya: The Uncomfortable Truth
Growth Trends
The enthusiastic narratives regarding Bangladesh’s growth prospect,
emanating from global sources, are essentially based on statistics produced
by the national authorities, particularly by the Bangladesh Bureau of
Statistics (BBS). We can derive from the official data that during the last two
and a half decade (starting from 1990), Bangladesh has sequentially
enhanced its average growth rate of GDP and GNI every five years (see Table
4). Consequently, the observed trend got reflected in per capita GDP and per
capita GNI growth performance. As a result, per capita GDP and per capita
GNI experienced an almost five-fold increase between 1990 and 2017 (from
USD 298 to USD 1517 and from USD 310 to USD 1470 respectively).
Table 4: Average Growth Rates (1991–2017): GDP/GNI, GDP/GNI Per Capita
and GDP/GNI Growth Rates
1991-
95
1996-
00
2001-
05
2006-
10
2011-
15
2016-
17
GDP growth rate
(%)
4.53 4.83 5.09 6.07 6.32 7.20
GNI growth rate
(%)
4.71 4.84 5.34 6.79 6.00 6.14
Per capita GDP
growth rate (%)
1.55 5.12 3.67 9.44 9.89 11.94
Per capita GNI
growth rate (%)
1.27 4.97 4.85 8.06 8.84 11.15
GDP per capita
(USD)
294 394 436 618 988 1,438
GNI per capita
(USD)
320 394 464 656 1,016 1,400
Source: Based on World Development Indicators (World Bank, n.d.-a: accessed on 21/10/2018).

D. Bhattacharya: The Uncomfortable Truth 7
Double Transition
A direct upshot of this had been relocation of the country from low income
country to (low) middle income category where the cut off line (in 2014) was
a per capita GNI of USD 1045 (as per Atlas method) (see Figure 1).
Bangladesh crossed the lower middle income threshold in July 2015 based
on the GNI per capita of 2014.
The demonstrated growth performance also allowed Bangladesh (2018) to
recently fulfill the three eligibility criteria for graduation from the least
developed countries (LDC) group. The threshold figure for one of the three
criteria, had been per capita GNI of USD 1,230 (at the 2018 triennial review),
which Bangladesh crossed in 2016. If the Bangladesh economy does not
suffer any hiccups in the coming years, then the country will finally come out
of the LDC group in 2024.
Figure 1: Per Capita GDP and Per Capita GNI
Source: Based on World Development Indicators (World Bank, n.d.-a: accessed on 21/10/2018).
42
0
43
0
42
0
45
0
49
0
53
0
56
0
59
0
64
0
71
0
78
0 87
0
94
0
1,0
10
1,0
70
1,1
90
1,3
30
1,4
70
40
6
40
3
40
1
43
3
46
1
48
4
49
4
54
1
61
6
68
1
75
8
83
6
85
6 95
2
1,0
85
1,2
10
1,3
59
1,5
17
200
400
600
800
1,000
1,200
1,400
1,600
20
00
20
01
20
02
20
03
20
04
20
05
20
06
20
07
20
08
20
09
20
10
20
11
20
12
20
13
20
14
20
15
20
16
20
17
Cu
rren
t U
SD
GNI per capita (Atlas method, USD) GDP per capita (USD)
LMIC threshold crossed
LDC threshold crossed

8 D. Bhattacharya: The Uncomfortable Truth
Sources of Growth
It would be interesting to explore what had been the sources of such
spectacular growth of the Bangladesh economy in the recent decades. It
transpires that over the period (1990–2018) incremental contribution of
agriculture has come down gradually with annual variations (see Table 5).
Table 5: Changing Configuration of Source of GDP Growth (in percentage
point)
Indicator FY90 FY95 FY00 FY05 FY10 FY15 FY16 FY17 FY18
Agriculture 0.64 0.78 1.79 0.49 1.07 0.53 0.43 0.44 0.59
Agriculture and
forestry
0.31 0.41 1.29 0.31 0.91 0.30 0.21 0.22 0.37
Industries 0.92 1.63 1.52 2.20 1.77 2.74 3.24 3.10 3.75
Manufacturing 0.78 0.93 0.71 1.27 1.08 1.93 2.26 2.21 2.80
Services 1.59 1.89 2.58 3.00 2.89 3.00 3.21 3.41 3.24
Wholesale and
retail trade
0.56 0.57 0.93 0.95 0.78 0.86 0.88 0.99 1.00
GDP growth
(%)
3.34 4.62 5.94 5.96 5.57 6.55 7.11 7.28 7.86
Source: Based on BBS (n.d. a), BBS (n.d. b) and Bangladesh Bank (2018).
In contrast, the role of industries and services have become more prominent
over time in terms of incremental contribution to GDP. Within these two
broad sectors, manufacturing and wholesale/retail trade have played an
increasingly stronger role in producing higher GDP growth.
Understandably, such changing configuration of sources of economic growth
had multifarious impacts on the Bangladesh economy, including in areas
such as employment and income generation, structural change and
competitiveness of the economy.

D. Bhattacharya: The Uncomfortable Truth 9
Structural Change
In view of the above, one would be tempted to ask whether the economy has
undergone any structural change during the last high growth period.
Between 1990–91 and 2017–18, the greatest increase in share of GDP was
expressed by manufacturing (from 12.2% to 21.9%) and largest decrease
was in the agriculture sector (from 28.7% to 13.7%) (see Table 6). Indeed,
Bangladesh is one of the rare developing countries that has avoided “pre-
mature deindustrialisation”—a phenomena currently afflicting many
African economies (Rodrik, 2015). Nonetheless, Bangladesh’s economy
continues to remain a service-sector dominated economy with the sector
accounting for more than half of the GDP. The single most important sub-
sector of the services continues to be wholesale and retail trade –
commanding more than a quarter of it.
Table 6: Changes in Sector-wise GDP Share (%)
Indicator FY90 FY95 FY00 FY05 FY10 FY15 FY16 FY17 FY18
Agriculture 28.71 25.01 24.61 21.36 17.54 15.35 14.73 14.14 13.66
Agriculture and
forestry
24.46 20.00 18.75 16.57 13.99 11.82 11.23 10.67 10.24
Industries 20.21 23.35 24.73 27.15 25.56 29.19 30.28 31.11 32.32
Manufacturing 12.18 14.56 14.82 15.83 16.42 19.34 20.17 20.86 21.93
Services 48.33 47.77 46.87 47.41 52.33 51.41 51.00 50.72 50.02
Wholesale and
retail trade
11.83 12.39 12.8 16.54 13.38 13.51 13.43 13.44 13.39
Total 100 100 100 100 100 100 100 100 100
Source: Based on BBS (n.d. a), BBS (n.d. b) and Bangladesh Bank (2018).
Yet, these inter-sectoral changes do not signify “structural transformation”
is happening in Bangladesh economy at a fast pace. As structural

10 D. Bhattacharya: The Uncomfortable Truth
transformation essentially entails relocation of labour and capital from
sectors with low productivity to high productivity, a recent study at CPD has
shown that during 1990–2015, the Bangladesh economy has experienced
“less growth in between sector productivity” (Moazzem and Arno, 2018).
Moreover, poor performance in export diversification, among others, is also
portrayed as a sign of lack of structural transformation.
Poverty Reduction
Robust economic growth did contribute to noticeable improvement in
poverty situation in Bangladesh during the recent decades. According to
successive HIES of the BBS, the share of population living under the upper
poverty line more than halved between 2000 (48.9%) and 2016 (24.3%)
(see Table 7). In terms of the lower poverty line, the corresponding figures
were more remarkable – the share of people living in extreme poverty
became almost one-third (34.3% in 2000 to 12.9% in 2016). It needs to be
mentioned that the decline in the share of poor under the upper poverty line
was more in the rural area in comparison to its urban counterpart, whereas
the opposite was true in case of lower poverty line. It appears that the share
Table 7: Poverty Rate (%) in Bangladesh by Residence
Year Upper Poverty Line Lower Poverty Line
National Rural Urban National Rural Urban
2000 48.9 52.3 35.2 34.3 37.9 20.0
2005 40.0 43.8 28.4 25.1 28.6 14.6
2010 31.5 35.2 21.3 17.6 21.1 7.7
2016 24.3 26.4 18.9 12.9 14.9 7.6
Source: Based on BBS, 2001a; BBS, 2006; BBS, 2011a and BBS, 2017a.
D. Bhattacharya: The Uncomfortable Truth 11
of poor are still higher in the rural areas (under both measures), but the
reduction of “hard core” rural poor had been faster (see Table 7).
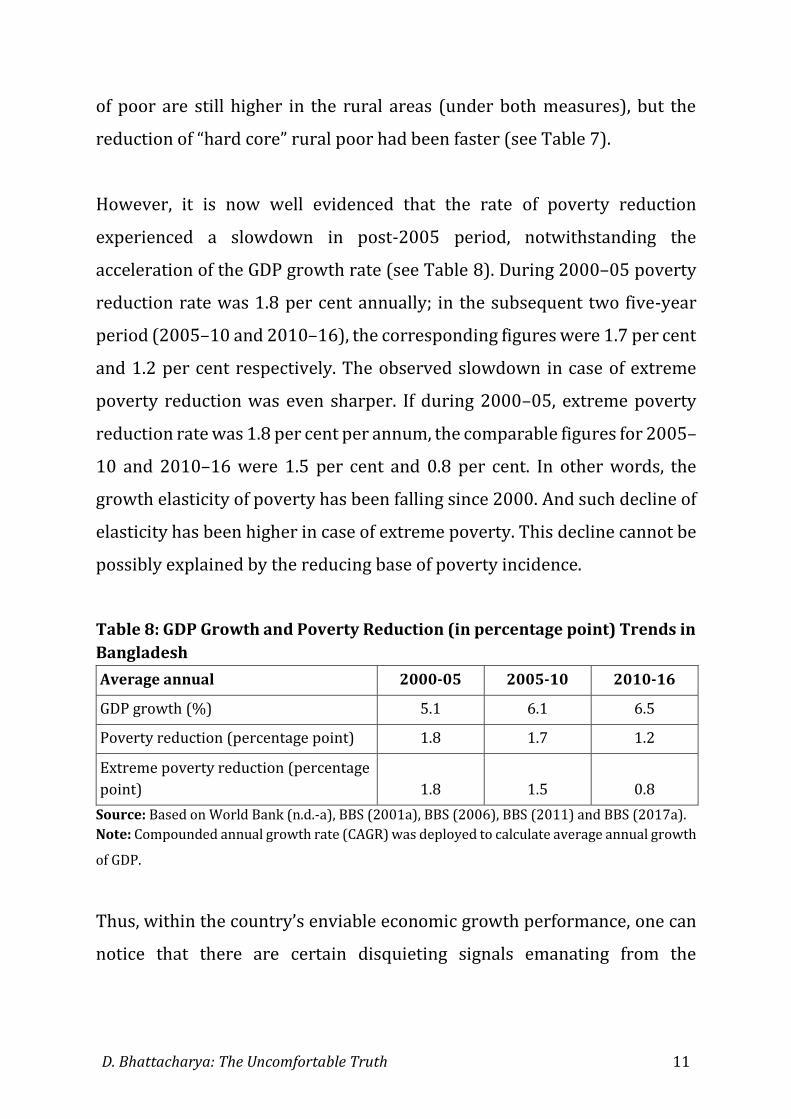
However, it is now well evidenced that the rate of poverty reduction
experienced a slowdown in post-2005 period, notwithstanding the
acceleration of the GDP growth rate (see Table 8). During 2000–05 poverty
reduction rate was 1.8 per cent annually; in the subsequent two five-year
period (2005–10 and 2010–16), the corresponding figures were 1.7 per cent
and 1.2 per cent respectively. The observed slowdown in case of extreme
poverty reduction was even sharper. If during 2000–05, extreme poverty
reduction rate was 1.8 per cent per annum, the comparable figures for 2005–
10 and 2010–16 were 1.5 per cent and 0.8 per cent. In other words, the
growth elasticity of poverty has been falling since 2000. And such decline of
elasticity has been higher in case of extreme poverty. This decline cannot be
possibly explained by the reducing base of poverty incidence.
Table 8: GDP Growth and Poverty Reduction (in percentage point) Trends in
Bangladesh
Average annual 2000-05 2005-10 2010-16
GDP growth (%) 5.1 6.1 6.5
Poverty reduction (percentage point) 1.8 1.7 1.2
Extreme poverty reduction (percentage
point) 1.8 1.5 0.8
Source: Based on World Bank (n.d.-a), BBS (2001a), BBS (2006), BBS (2011) and BBS (2017a).
Note: Compounded annual growth rate (CAGR) was deployed to calculate average annual growth
of GDP.
Thus, within the country’s enviable economic growth performance, one can
notice that there are certain disquieting signals emanating from the

12 D. Bhattacharya: The Uncomfortable Truth
economy. I would like to reflect on these signals in the next part of the
lecture.
3. The Nature of Recent Economic Growth
While Bangladesh is being applauded by the global community for its
remarkable economic growth performance, the country has been lately
singled out for its inability to achieve inclusive growth. In its recently
published report on “The Commitment to Reducing Inequality Index 2018”,
Oxfam has put Bangladesh among the 10 worst performing countries as per
its CRI index. Bangladesh was ranked 148th among 157 countries based on
three criteria (i) spending in health, education and social protection, (ii)
progressivity of tax policy and (iii) labour rights and minimum wages.
No less alarming was the findings of the “World Ultra Wealth Report 2018”.
According to this report, Bangladesh was on the top 10 fastest growing Ultra
High Net Worth (UHNW) countries during the period 2012-2017. In other
words, individual with a net worth of US$ 30 million or more has grown
fastest in Bangladesh during the last five years in comparison to among other
countries in the world!
Regrettably, such a global reading of the nature of economic development in
Bangladesh is adequately corroborated by data and information obtained
from official sources of the country.
D. Bhattacharya: The Uncomfortable Truth 13
3.1 Consumption, Income and Assets
Data obtained from successive HIESs including the latest one having the
reference year 2016 indeed project a number of unsettling developments
underpinning the otherwise strong growth performance. The following
paragraphs seek to highlight a select set of such developments in the
Bangladesh economy. In doing so, we focus on the recent six years period
(2010-2016).
Consumption
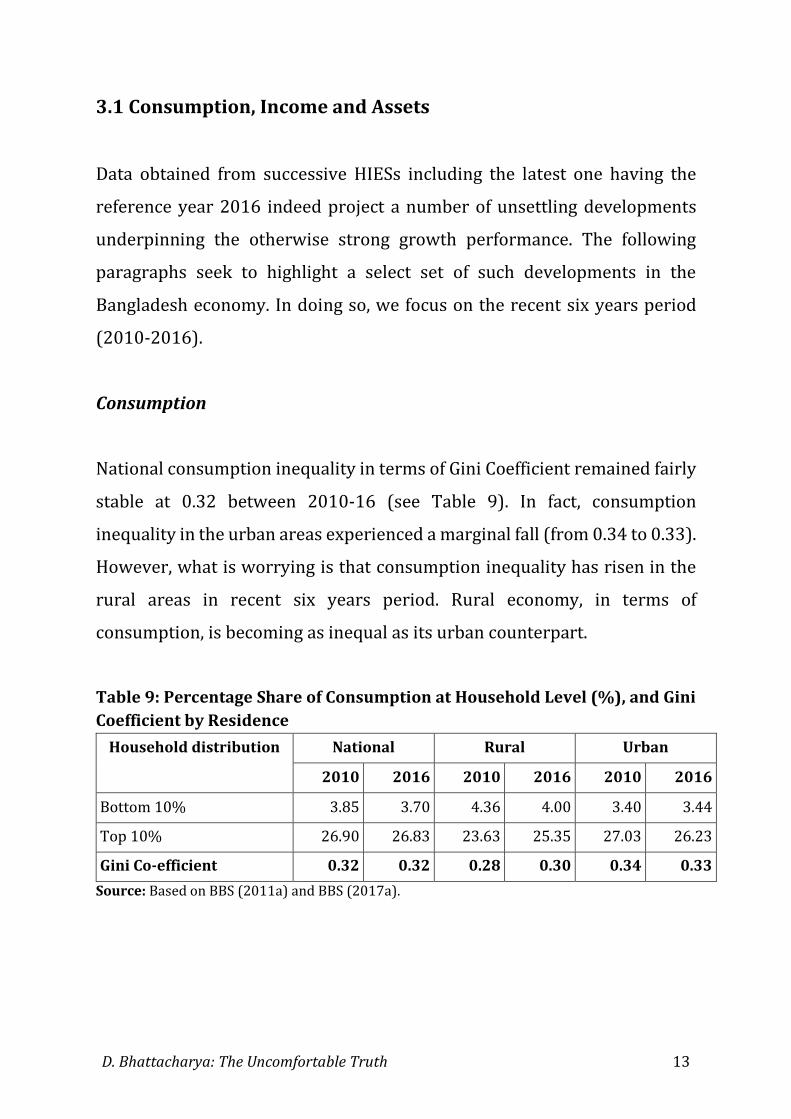
National consumption inequality in terms of Gini Coefficient remained fairly
stable at 0.32 between 2010-16 (see Table 9). In fact, consumption
inequality in the urban areas experienced a marginal fall (from 0.34 to 0.33).
However, what is worrying is that consumption inequality has risen in the
rural areas in recent six years period. Rural economy, in terms of
consumption, is becoming as inequal as its urban counterpart.
Table 9: Percentage Share of Consumption at Household Level (%), and Gini
Coefficient by Residence
Household distribution National Rural Urban
2010 2016 2010 2016 2010 2016
Bottom 10% 3.85 3.70 4.36 4.00 3.40 3.44
Top 10% 26.90 26.83 23.63 25.35 27.03 26.23
Gini Co-efficient 0.32 0.32 0.28 0.30 0.34 0.33
Source: Based on BBS (2011a) and BBS (2017a).

14 D. Bhattacharya: The Uncomfortable Truth
Income
The HIES data show that income inequality in terms of Gini Coefficient has
increased along with increase in per capita national income (see Table 10).
Between 2010 and 2016, income inequality increased from 0.46 to 0.48. It is
to be noted that level of income inequality is higher than consumption
inequality in Bangladesh (0.48 and 0.32 respectively).
Table 10: Per Capita GNI and Income Gini Index
Year Per capita GNI (In current US $) Income Gini-Coefficient
2005 530 0.47
2010 780 0.46
2016 1,330 0.48
Source: Based on World Bank (n.d.-a), BBS (2006), BBS (2011a) and BBS (2017a).
A disaggregated look at the income distribution profile of households reveals
an alarming trend of income concentration (see Table 11). The acute
marginalisation of the bottom 5 per cent of households (in terms of income
level) between 2010 and 2016 is quite striking. This strata has lost out in
both urban and rural areas. The poorest 5 per cent population of Bangladesh
in 5 years (2010-16) lost out 2/3 of their share and now commands only a
minuscule 0.23 per cent of total income. Indeed, if one moves up the income
scale, we observe that not only the poorest section of the society, even the
lower middle class has experienced erosion of its income share. For example,
income share of bottom 40 per cent of the population went down as well
between 2010 and 2016 with the rural area experiencing such erosion more
than the urban area. On the other hand, the top 10 per cent, together with
the top 5 per cent households, enhanced their share of income between 2010
and 2016. And such increase in income concentration had been much higher
in the urban areas. The perceptible rise in income inequality in Bangladesh
D. Bhattacharya: The Uncomfortable Truth 15
is also captured by the increase in Palma Ratio (ratio of top 10 per cent to
bottom 40 per cent).
More surprisingly, a review of decile distribution of average household
nominal income per month expose that the bottom 5 per cent as well as the
bottom 10 per cent households experienced fall in nominal income between
2010 and 2016. This pattern remains true for both rural and urban areas.
Table 11: Percentage Share of Income at Household Level (%), and Gini
Coefficient by Residence
Household
distribution
National Rural Urban
2005 2010 2016 2005 2010 2016 2005 2010 2016
Bottom 5% 0.77 0.78 0.23 0.88 0.88 0.25 0.67 0.76 0.27
Bottom 10% 2.00 2.00 1.01 2.25 2.23 1.06 1.80 1.98 1.16
Bottom 40% 14.36 14.32 13.01 15.84 15.68 13.86 13.30 14.03 13.32
Top 10% 37.64 35.84 38.16 33.92 33.89 34.84 41.08 34.77 41.44
Top 5% 26.93 24.61 27.89 23.03 22.93 24.25 30.37 23.39 32.12
Gini Co-efficient 0.47 0.46 0.48 0.43 0.43 0.45 0.50 0.45 0.50
Palma Ratio 2.62 2.50 2.93 2.14 2.16 2.51 3.09 2.48 3.11
Source: Based on BBS (2006), BBS (2011a) and BBS (2017a).
In fact, decile distribution of average household real income per month
(adjusted to 2015-16 CPI) reveals that none of the income strata, other than
top 5 per cent households, has experienced increase in real income between
2010 and 2016 (see Table 12). While this pattern remains true for all income
groups in rural areas, in the urban area households belonging to richest 10
per cent registered real income growth between 2010 and 2016 (from 1791
BDT to 733 BDT and from 2296 BDT to 1610 BDT respectively). This
possibly bring out that the current nature of economic growth is favouring
the urban rich and rural very rich.

Table 12: Average Household Real Income Per Month (adjusted to 2015-16 CPI)
HH Distribution National Rural Urban
2010 2016 % Change 2010 2016 % Change 2010 2016 % Change
Lower 5% 2,650 733 -72.3 2,466 668 -72.9 3,839 1,219 -68.3
Decile-1 3,397 1,610 -52.6 3,125 1,415 -54.7 5,000 2,618 -47.7
Decile-2 5,469 4,512 -17.5 4,946 4,006 -19.0 7,804 6,747 -13.5
Decile-3 6,964 6,442 -7.5 6,291 5,782 -8.1 9,975 9,432 -5.4
Decile-4 8,493 8,180 -3.7 7,608 7,304 -4.0 12,652 11,260 -11.0
Decile-5 10,209 9,934 -2.7 9,009 8,853 -1.7 15,935 13,336 -16.3
Decile-6 12,434 11,975 -3.7 10,719 10,616 -1.0 19,294 16,179 -16.1
Decile-7 15,389 14,542 -5.5 13,045 12,605 -3.4 23,486 18,842 -19.8
Decile-8 19,534 17,747 -9.1 16,113 15,730 -2.4 29,977 23,671 -21.0
Decile-9 27,076 23,662 -12.6 21,774 20,684 -5.0 40,609 30,034 -26.0
Decile-10 60,878 60,846 -0.1 47,485 46,522 -2.0 87,809 93,509 6.5
Top 5% 83,605 88,941 6.4 64,256 64,762 0.8 118,139 144,958 22.7
Source: Based on BBS (2011a) and BBS (2017a).

D. Bhattacharya: The Uncomfortable Truth 17
Assets
The HIES for 2016 is yet to release data on household level assets situation.
However, one can observe that asset concentration between 2005 and 2010
went up nationally with Gini Coefficient going up from 0.72 to 0.74 (see
Table 13). At a disaggregate level, the bottom 5 per cent households
demonstrates loss in asset share, whereas the top 5 per cent show noticeable
rise in the same. Between rural and urban areas, it appears, while the rural
poorest of the poor (bottom 10 per cent) more or less could hold on to their
low asset base, asset distribution in the urban areas became exceptionally
skewed. Taking note of the consumption and income inequality trends, one
can very well anticipate that the asset concentration has gone up further by
2016.
Table 13: Percentage Share of Wealth at Household Level (%), and Gini
Coefficient by Residence
Household
distribution
National Rural Urban
2005 2010 2005 2010 2005 2010
Bottom 5% 0.06 0.04 0.01 0.08 0.02 0.02
Bottom 10% 0.28 0.55 0.08 0.21 0.42 0.08
Top 10% 61.47 49.33 66.32 63.63 49.26 67.39
Top 5% 47.99 51.32 35.24 35.75 51.67 53.64
Gini Coefficient 0.72 0.74 0.63 0.62 0.78 0.79
Source: Based on unit level data from BBS (2006) and BBS (2011a).
The foregoing discussion suggests that Bangladesh economy – in terms of
consumption, income and assets – has become more unequal during the
recent decade, particularly between 2010-2016. Asset inequality increasing
at a faster pace than income inequality and income inequality increasing at
a faster pace than consumption inequality. These trends of growing
18 D. Bhattacharya: The Uncomfortable Truth
inequality have been largely driven by higher concentration of income in the
10 per cent of the population and greater concentration of assets in the top
5 per cent of the same. While the urban inequality is still higher than the
rural inequality, latter is gradually closing up with the former.
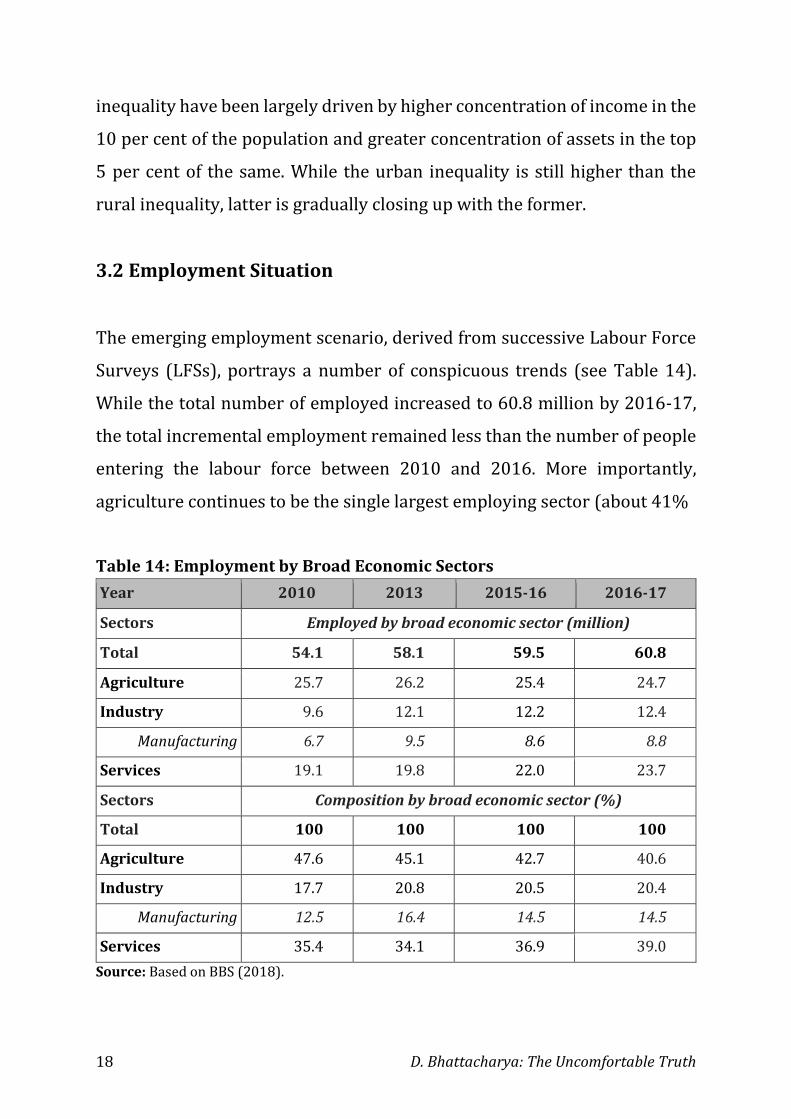
3.2 Employment Situation
The emerging employment scenario, derived from successive Labour Force
Surveys (LFSs), portrays a number of conspicuous trends (see Table 14).
While the total number of employed increased to 60.8 million by 2016-17,
the total incremental employment remained less than the number of people
entering the labour force between 2010 and 2016. More importantly,
agriculture continues to be the single largest employing sector (about 41%
Table 14: Employment by Broad Economic Sectors
Year 2010 2013 2015-16 2016-17
Sectors Employed by broad economic sector (million)
Total 54.1 58.1 59.5 60.8
Agriculture 25.7 26.2 25.4 24.7
Industry 9.6 12.1 12.2 12.4
Manufacturing 6.7 9.5 8.6 8.8
Services 19.1 19.8 22.0 23.7
Sectors Composition by broad economic sector (%)
Total 100 100 100 100
Agriculture 47.6 45.1 42.7 40.6
Industry 17.7 20.8 20.5 20.4
Manufacturing 12.5 16.4 14.5 14.5
Services 35.4 34.1 36.9 39.0
Source: Based on BBS (2018).

D. Bhattacharya: The Uncomfortable Truth 19
of total employed population in 2016), notwithstanding its diminishing
share in GDP (less than 15% in 2016). Further, manufacturing sector
demonstrates a rather stagnating, if not declining employment situation. If
in 2013, manufacturing sector hosted 9.5 million jobs, in 2016-17 the
corresponding figure was 8.8 million. Manufacturing’s share in total
employment also experienced a decline from 16.4 per cent (2013) to 14.5
per cent (2016-17). This finding comes as a surprise in the backdrop of
increasing share of manufacturing in the GDP. In fact, one observes, that the
service sector is emerging as the foremost important sector for employment
generation – both in absolute and relative terms.
As one can suspect that a large part of these incremental jobs are located in
the informal sector where wages are low (often based on self-exploitation
driven self-employment) and working conditions are poor. The major
reason underwriting these patterns in the labour market relate to falling
employment elasticities in the manufacturing sector (-0.28 and -0.93
between 2013 to 2015-16 and 2015-16 to 2016-17 respectively), while
increase of the same in the service sector (0.58 and 1.20 between 2013 to
2015-16 and 2015-16 to 2016-17 respectively). Within the service sector,
majority of the additional jobs are created in the wholesale and retail trade
– pointing to informalisation of job market.
Youth Unemployment
The unemployment situation among the youth projects a perverse picture.
In 2016-17, about 10.6 per cent of the youth labour force (between 15 and
29 years) was unemployed. Indeed, the comparable figure in 2010 was 7.4
per cent. Not only upward trend in youth unemployment has been observed

20 D. Bhattacharya: The Uncomfortable Truth
between 2010 and 2016-17, such rate was significantly higher than the
national average unemployment figure.
More paradoxical is the fact that youth unemployment rate increases along
with the education level (see Table 15). In 2016-17 more than one-third of
the youth labour force with tertiary education (34.3%) remained
unemployed, whereas in 2010 the matching figure was less than 3 per cent!
In case of women, such rate was as high as 42.5 per cent. One wonders
whether this is a supply-side phenomenon (i.e. low quality of education
making the youth unemployable) or a demand-side phenomenon (i.e. where
the nature of economic growth creates less jobs for educated youth).
Table 15: Distribution of Youth Unemployment by Education Level (% of
total unemployed youth)
Year 2010 2013 2015-16 2016-17
No education – total 15.7 12.8 6.7 4.8
No education – male 13.4 5.1 6.1 2.3
No education – female 18.8 7.7 7.4 10.0
Primary – total 21.4 17.2 8.7 5.3
Primary – male 22.2 9.0 6.4 3.7
Primary – female 20.3 8.2 13.4 9.3
Secondary – total 49.0 34.7 10.7 8.7
Secondary – male 51.4 20.2 7.8 6.7
Secondary – female 47.4 14.5 17.6 11.7
Higher secondary – total 10.4 25.6 6.0 27.0
Higher secondary – male 10.3 12.4 6.1 22.7
Higher secondary – female 10.5 13.3 5.8 35.1
Tertiary – total 2.8 9.7 12.1 34.3
Tertiary – male 2.8 5.2 10.8 30.1
Tertiary – female 2.9 4.5 15.0 42.5
Total 7.4 8.1 8.7 10.6
Source: Based on BBS (2011b), BBS (2015), BBS (2017b) and BBS (2018).

D. Bhattacharya: The Uncomfortable Truth 21
Wages
The annual change (base 1969-70) in the general wage rate followed an
upward moving fluctuating trend (see Figure 2) till mid-2000. However,
since the introduction of the new base year (2010-11), the trend has
flattened out between 2011-12 and 2017-18. Between 2011-12 and 2014-
15, one observes decline of real wage rate index across sectors, while in the
last three years (2015-16, 2016-17 and 2017-18) one can notices a
stagnating trend.
Figure 2: Change in Real General Wage Rate Index (WRI) (%)
Source: Based on BBS (2017c).
Analysis of average real monthly income/wage (adjusted for 2016-17 CPI)
depicts that between 2013 to 2015-16, the largest drop was in the urban
areas (-6.8%), where women experienced much more loss of income (-
11.0%) than their male counterparts (-5.4%). However, between 2015-16
and 2017-18, negative change in real monthly income was more in the rural
areas. One may suggest that this has to do with declining profitability of the
crop sector.
0
2
4
6
8
10
12
14
16
18
20
Base: 1969-70 Base: 2010-11

22 D. Bhattacharya: The Uncomfortable Truth
3.3 Health Outcomes
Bangladesh is often appreciated for its success in attaining relatively high
human development outcomes, particularly in the areas of health and
education. However, a disaggregated look at the concerned indicators by
income or wealth status reveals the wide variations that remain concealed
within the national averages.
Among health related indicators, let us consider under-five mortality rate
and neo-natal mortality rate as well as prevalence of stunting and wasting
among children under five years. The tables presented in this section are
based on the latest sets of Bangladesh Demographic Health Survey (BDHS).
Under five mortality rate (deaths per 1000 live births) between 2011 and
2014 has declined nationally – from 53 to 46 (see Table 16). In fact, this
Table 16: Under- Five Mortality Rate and Neonatal Mortality Rate (deaths
per 1,000 live births) by Wealth Status
Indicator Value Year Wealth Status Mean
Absolute
deviation Lowest Second Middle Fourth Highest Total
Under
five
mortality
rate
Original
Value
2011 64 64 49 48 37 53 –
2014 53 63 47 37 30 46 –
Absolute
deviation
2011 11.0 11.0 4.0 5.0 16.0 – 9.4
2014 7.0 17.0 1.0 9.0 16.0 – 10.0
Neonatal
mortality
rate
Original
Value
2011 34 38 32 33 23 32 –
2014 35 35 34 23 14 28 –
Absolute
deviation
2011 2.0 6.0 0.0 1.0 9.0 – 3.6
2014 7.0 7.0 6.0 5.0 14.0 – 7.8
Source: Based on National Institute of Population Research and Training (NIPORT), Mitra and
Associates, and ICF International (2013) and National Institute of Population Research and
Training (NIPORT), Mitra and Associates, and ICF International (2016).

D. Bhattacharya: The Uncomfortable Truth 23
decline may be observed in all five wealth status group. However, the mean
absolute deviation of mortality rates by wealth status of household from
national averages have increased overtime (from 9.4 to 10.0). This implies
that households in Bangladesh, irrespective of their wealth status has
experienced improvement in child mortality rate, but the relatively well-off
families are improving at a faster rate – enhancing health-related inequality.
Similar trend may be observed in case of neonatal mortality (deaths per
1000 live births) (see Table 16). The national average declined during 2011-
14, from 32 to 28. However, there was a sharper rise (in comparison to under
five mortality rate) in mean absolute deviation of mortality rates by wealth
status of household from national average (from 3.6 to 7.8). In other words,
poorer families are losing relatively more new born children than the
wealthier families as the country moves forward.
One of the possible reasons of this differentiated health outcomes
concerning under five and neo-natal mortality rates by wealth status relates
to proportion of births attended by skilled health personnel. Here again, we
observe that the population of births attended by skilled health personnel
has increased nationally during 2011-14 (from 28.6% to 37.6%).
Nonetheless, population of births attended by skilled health personnel is
around five time higher among richest population (70.2%, 2014) than that
of among poorest population (14.9%, 2014). What is more disturbing is that
mean absolute deviation of the indicator from the national average has
increased over time.
In case of stunting among children under 5 years, between 2011 and 2014,
the national average did decline from 41.3 per cent to 36.1 per cent (see

24 D. Bhattacharya: The Uncomfortable Truth
Table 17). However, prevalence of stunting remains more 2.5 times higher
among the poorest 20 per cent of the population in comparison to the richest
20 per cent. More alarmingly the mean absolute deviation has increased
(from 7.6 to 8.2) between 2011 and 2014 disfavouring the poorer section of
the population.
Table 17: Prevalence of Stunting and Wasting among Children Under Five
Years of Age by Wealth Status
Indicator Value Year Wealth Status Mean
Absolute
deviation Lowest Second Middle Fourth Highest Total
Stunting Original
Value
2011 53.7 45.4 40.7 35.9 25.7 41.3 –
2014 49.2 42.2 35.9 31.0 19.4 36.1 –
Absolute
deviation
2011 12.4 4.1 0.6 5.4 15.6 – 7.6
2014 13.1 6.1 0.2 5.1 16.7 – 8.2
Wasting Original
Value
2011 17.5 16.2 17.7 13.6 12.1 15.6 –
2014 17.1 16.5 12.8 13.1 11.7 14.3 –
Absolute
deviation
2011 1.9 0.6 2.1 2.0 3.5 – 2.0
2014 2.8 2.2 1.5 1.2 2.6 – 2.1
Source: Based on National Institute of Population Research and Training (NIPORT), Mitra and
Associates, and ICF International (2013) and National Institute of Population Research and
Training (NIPORT), Mitra and Associates, and ICF International (2016).
Regarding wasting, we observe almost the same above mentioned trends,
although the differences among the richer and poorer sections are much less
in this instance (see Table 17).
3.4 Educational Attainment
Disparity in educational attainments becomes evident from early childhood
in Bangladesh. The Multiple Indicator Cluster Survey (MICS) 2012-13

D. Bhattacharya: The Uncomfortable Truth 25
reveals that percentage of children of age between 36-59 months attending
an organised childhood education varies across wealth status. For example,
if the concerned share is 11.7 per cent for the “poorest” strata, the
corresponding figure for the “richest” is 17.5 per cent.
Table 18: Enrolment of Children Aged 6-10 and Aged 11-15 Years by
Residence and Poverty Status, 2016
Year 2010 2016
Indicator Poverty
status
National Rural Urban National Rural Urban
Enrolment
of
children
aged 6-10
years
Original
Value
Poor 78.3 78.5 77.5 89.9 90.6 86.4
Non poor 89.0 87.9 91.7 94.3 94.7 92.9
National 84.8 83.8 87.9 93.5 93.9 92.2
Deviation
from
national
value
Poor 6.4 5.3 10.3 3.6 3.3 5.8
Non poor 4.3 4.1 3.8 0.8 0.8 0.7
Enrolment
of
children
aged 11-
15 years
Original
Value
Poor 70.2 72.3 60.8 74.8 76.4 66.7
Non poor 85.5 85.3 86.2 85.8 87.0 82.3
National 77.8 77.9 77.5 84.3 85.4 81.0
Deviation
from
national
value
Poor 7.6 5.7 16.7 9.5 9.4 14.3
Non poor 7.7 7.3 8.7 1.5 1.6 1.3
Source: Based on BBS (2011a) and BBS (2017b)
Similar differences may be also observed in case of enrolment of children
aged 6-10 years by residence and poverty status (see Table 18). School
enrolment of children (6-10 years) was higher among non-poor households
(94.3%, 2016) compared to the poor households (89.9, 2016). Incidentally,
divergence of enrolment rate (6-10 years) between poor and non-poor is
wider in the urban areas than in the rural. Thankfully, deviation of primary

26 D. Bhattacharya: The Uncomfortable Truth
school enrolment by poverty status from the national average slightly
decreased since 2010.
In case of enrollment of children aged 11-15 years, we observe that situation
of the urban poor households is the worst. In fact, mean deviation of this
indicator for children of the poor families nationally has increased between
2010 and 2016.
3.5 Regional Balance
Fruits of economic growth are not only being unevenly distributed among
different socio-economic groups, but also across different parts of
Bangladesh. Notwithstanding being a relatively small and compact country,
the issue of “East-West divide” of economic geography is being discussed
among the concerned quarters for sometime. Recent data (2016) from HIES
once again validates this claim of persisting regional imbalance in
development outcomes. For example, both general poverty rate and extreme
poverty rate are systematically lower in Dhaka, Sylhet and Chittagong (see
Table 19) in comparison to the same for Barisal, Khulna, Mymensingh,
Rajshahi and Rangpur. However, what is most disturbing is the fact, while all
over the country the poverty rates have declined between 2010 and 2016,
Rangpur experienced increase in both general poverty rate and extreme
poverty rates. The thought that comes to mind is: are we witnessing the re-
emergence of Monga?

D. Bhattacharya: The Uncomfortable Truth 27
Table 19: Poverty Rate (%) in Bangladesh by Division
Division Poverty Rate Extreme Poverty Rate
2010 2016 Rate of
Decline
2010 2016 Rate of
Decline
Barisal 39.4 26.5 12.9 26.7 14.5 12.2
Chittagong 26.2 18.4 7.8 13.1 8.7 4.4
Dhaka 30.5 16.0 14.5 15.6 7.2 8.4
Khulna 32.1 27.5 4.6 15.4 12.4 3
Mymensingh - 32.8 - - 17.6 -
Rajshahi 29.8 28.9 0.9 16.8 14.2 2.6
Rangpur 46.2 47.2 -1 27.7 30.5 -2.8
Sylhet 28.1 16.2 11.9 20.7 11.5 9.2
National 31.5 24.3 7.2 17.6 12.9 4.7
Source: Based on BBS (2011a) and BBS (2017a).
This apprehension is strengthened, among others, by comparative review of
administrative Division-wise figures on unemployment rate. Between 2010
and 2016, unemployment rate by Division declined, in Chittagong (5.9% to
3.5%), Dhaka (5.6% to 3.4%) and Sylhet (6.2% to 3.6); whereas it increased
in Barisal (4.6% to 5.4%), Khulna (3.5% to 4.1%) and Rajshahi (2.4% to
4.6%).
The Uncomfortable Truth
Thus, the “uncomfortable truth” of the recent development experience of our
country is very simple. The benefits of our recent economic growth had been
very unevenly distributed. This increasing disparity has accelerated in the
recent past according to the data for the period 2010-16. Manifestations of
this trend of disparity may be observed not only in case of consumption,
income and asset ownership, but also in the areas of employment, human
28 D. Bhattacharya: The Uncomfortable Truth
asset and regional development. In broad terms, it has favoured the richest
section of rural population and richer section of the urban population.
Indeed, the growing middle class of the country could not enhance its share
in the expanding economy.
Based on the foregoing analysis, it may be derived that youth
unemployment, informal sector jobs, wages for women, child mortality rates
of the poor households, school enrollment of the urban poor, and poverty-
stricken Rangpur region are some of the underbellies of our recent
development experience.
Indeed, CPD in its recent reports produced under the “Independent Review of
Bangladesh’s Development (IRBD)” programme has repeatedly highlighted
the dire picture of income inequality and wealth concentration. In its first
reading of the state of the economy for the fiscal year 2017-18, it has
mentioned that “while the importance of higher economic growth cannot be
undermined, the emphasis should be more on how to distribute the benefits
of growth across regions and marginalised communities” (CPD, 2018).
It is often said, a rising tide lifts all boats; but it can be also added that some
boats may not reach the harbor. Such a situation obviously begs the question
– why is this happening, while the stated public policy objective is “no one is
to be left behind”. In conclusion of the lecture, I would like to offer a couple
of observations in this regard – in my effort to consolidate the
understanding.

D. Bhattacharya: The Uncomfortable Truth 29
4. In Search of a Conclusion
In the recent past there has been a plethora of scholarly contributions
dealing with growth-inequality nexus. A significant part of it deals with
issues related to inequality among countries (Alvaredo, Chancel, Piketty et.
al., 2018; Schwab, 2018; WEF, 2017). There is an overwhelming agreement
that income convergence is taking place among countries in the midst of
rising Southern economies and persistent threat of secular stagnation in the
OECD countries (Milanovic, 2016; UNDESA, 2015).
There is also a general consensus that income inequality is increasing within
most of the countries including the developed ones. In this connection,
policymakers often fatalistically fall back on the much celebrated Kuznets
Curve; conveniently ignoring the recent exceptions, particularly in Latin
America. Some would, however, contend that this is “not a big deal”
(Vandemoortele, 2018).
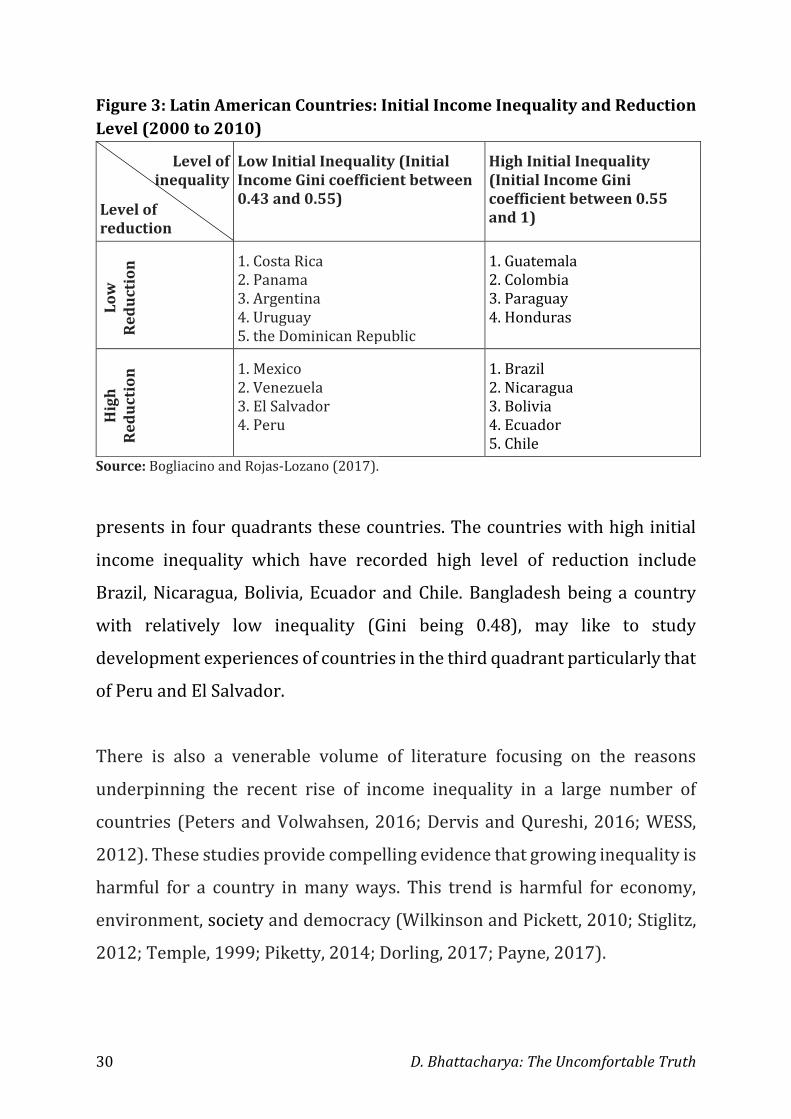
In Latin America, since 2000, we have observed countries with both high
level (with Gini above 0.55) and low level (with Gini between 0.43 and 0.55)
of inequalities have experienced different levels of reduction. Figure 3
30 D. Bhattacharya: The Uncomfortable Truth
Figure 3: Latin American Countries: Initial Income Inequality and Reduction
Level (2000 to 2010)
Level of inequality
Level of reduction
Low Initial Inequality (Initial Income Gini coefficient between 0.43 and 0.55)
High Initial Inequality (Initial Income Gini coefficient between 0.55 and 1)
Lo
w
Re
du
ctio
n 1. Costa Rica
2. Panama 3. Argentina 4. Uruguay 5. the Dominican Republic
1. Guatemala 2. Colombia 3. Paraguay 4. Honduras
Hig
h
Re
du
ctio
n 1. Mexico
2. Venezuela 3. El Salvador 4. Peru
1. Brazil 2. Nicaragua 3. Bolivia 4. Ecuador 5. Chile
Source: Bogliacino and Rojas-Lozano (2017).
presents in four quadrants these countries. The countries with high initial
income inequality which have recorded high level of reduction include
Brazil, Nicaragua, Bolivia, Ecuador and Chile. Bangladesh being a country
with relatively low inequality (Gini being 0.48), may like to study
development experiences of countries in the third quadrant particularly that
of Peru and El Salvador.
There is also a venerable volume of literature focusing on the reasons
underpinning the recent rise of income inequality in a large number of
countries (Peters and Volwahsen, 2016; Dervis and Qureshi, 2016; WESS,
2012). These studies provide compelling evidence that growing inequality is
harmful for a country in many ways. This trend is harmful for economy,
environment, society and democracy (Wilkinson and Pickett, 2010; Stiglitz,
2012; Temple, 1999; Piketty, 2014; Dorling, 2017; Payne, 2017).

D. Bhattacharya: The Uncomfortable Truth 31
Without venturing into this evolving global discourse on the reasons behind
rising inequality within countries and their implications, let me highlight
three features of the Bangladesh scenario.
One of the critical reasons defining Bangladesh’s current nature of economic
growth relates to prevailing investment behavior of the private sector. As we
know, private sector investment as a share of GDP is stagnating around 23
per cent in the recent years. Does it mean that there is no investible
resources available? It is maintained that money siphoned out of the capital
market only during the bubble-burst of 2010-11 amounted to the tune of
USD 2,750 million (BDT 20,000 crores) (Byron and Rahman, 2011, based on
Report of the Khondaker Ibrahim Khaled Committee). Total amount of non-
performing loans reached a staggering number (as of June 2018) of USD
10,764 million (BDT 89,340 crores) which is about 4 per cent of GDP
(Bangladesh Bank, 2017; Uddin, 2018). Another 4 per cent of GDP (estimated
to be about USD 11,000 million in 2018) or more is illicitly flowing out of the
country annually. If all these resources got invested in the country in proper
ways, then we could have had a radically different gainful employment and
inequality situation.
The second issue concerns the nature of structural change we are witnessing
within Bangladesh economy. As has been mentioned earlier, the
manufacturing sector has been gradually increasing its share in the GDP. but
without corresponding rise is employment. However, the incremental share
of this manufacturing sector growth had taken place in its large and medium
scale component. While the large and medium scale industries enhanced its
share in GDP from 13.12 per cent in 2010 to 18.31 per cent in 2018, the
corresponding shares of the small scale industries were 3.30 per cent and

32 D. Bhattacharya: The Uncomfortable Truth
3.63 per cent. Inability to strengthen and expand the small scale industries
did have debilitating effects on the labour market situations.
On the other hand, the large and medium scale industries have increasingly
embraced improved technologies in their production processes so as to
enhance productivity and remain competitive in the (global) market. The
offshoot of this was decrease in employment elasticities of such investments,
implying less wage-based employment in the formal sector.
One is also tempted to raise a third aspect concerning the nature of
distribution of the benefits of recent economic growth of the country.
Evidence presented earlier suggest the aggravating skewed structure of
income distribution. The recent period is characterised by lack of political
competition in the country. A number of global reports have indicated
weakening of “voice” and oversight institutions in the country during this
period. World Bank’s Voice and Accountability Index for Bangladesh shows
a steep fall since 2010 (see Figure 4). One wonders whether enfeebling of
Figure 4: Voice and Accountability Index of Bangladesh (Estimate and
Ranking)
Source: Based on World Bank (n.d.-b)
-0.8
-0.7
-0.6
-0.5
-0.4
-0.3
-0.2
-0.1
0
0
10
20
30
40
50
60
Est
imat
e
Ran
k
Rank Estimate
D. Bhattacharya: The Uncomfortable Truth 33
the accountability mechanism has led to undermining economic governance
and, consequently, marginalisation of the disenfranchised stakeholders in
the distribution of benefits of development.
Today’s lecture was more a diagnostic one; it was not a prescriptive one
looking for new political settlements. However, if Dr Ghafur was around
today, he possibly would have said; “the first step in solving a problem is
recognising there is one”.
Thank you for your attention.

34 D. Bhattacharya: The Uncomfortable Truth
References
Alvaredo, F., Chancel, L., Piketty, T., Saez, E., and Zucman, G. (Eds.). (2018). World
Inequality Report 2018. Cambridge: Belknap Press of Harvard University
Press.
Bangladesh Bank (2017). Annual Report 2016-2017. Dhaka: Bangladesh Bank.
Retrieved from https://www.bb.org.bd/pub/annual/anreport/ar1617/
full_2016_2017.pdf
Bangladesh Bank. (2018). Monthly Economic Trends (Time Series data since 1972).
Dhaka: Bangladesh Bank. Retrieved from: https://www.bb.org.bd/pub/
monthly/econtrds/statisticaltable.xlsx
BBS. (2001a). Preliminary Report on Household Income and Expenditure Survey
2000. Dhaka: Bangladesh Bureau of Statistics (BBS).
BBS. (2001b). Labour Force Survey (LFS) 1999-2000. Dhaka: Bangladesh Bureau of
Statistics (BBS), Ministry of Planning, Government of Bangladesh.
BBS. (2006). Preliminary Report on Household Income and Expenditure Survey
2005. Dhaka: Bangladesh Bureau of Statistics (BBS).
BBS. (2007). Labour Force Survey (LFS) 2005-06. Dhaka: Bangladesh Bureau of
Statistics (BBS), Ministry of Planning, Government of Bangladesh.
BBS. (2011a). Preliminary Report on Household Income and Expenditure Survey
2010. Dhaka: Bangladesh Bureau of Statistics (BBS).
BBS. (2011b). Labour Force Survey (LFS) 2009-10. Dhaka: Bangladesh Bureau of
Statistics (BBS), Ministry of Planning, Government of Bangladesh.
BBS and UNICEF. (2014). Bangladesh-Multiple Indicator Cluster Survey 2012-2013.
Dhaka: Bangladesh Bureau of Statistics (BBS), Statistics and Informatics
Division, ministry of Planning, Government of the People’s Republic of
Bangladesh and United Nations International Children’s Emergency Fund
(UNICEF).
BBS. (2015). Labour Force Survey (LFS) Bangladesh 2013. Dhaka: Bangladesh
Bureau of Statistics (BBS), Ministry of Planning, Government of Bangladesh.

D. Bhattacharya: The Uncomfortable Truth 35
BBS. (2017a). Preliminary Report on Household Income and Expenditure Survey
2016. Dhaka: Bangladesh Bureau of Statistics (BBS).
BBS. (2017b). Quarterly Labour Force Survey (QLFS) 2015-16. Dhaka: Bangladesh
Bureau of Statistics (BBS), Ministry of Planning, Government of Bangladesh.
BBS. (2017c). Consumer Price Index (CPI), Inflation Rate and Wage Rate Index (WRI)
in Bangladesh. Dhaka: Bangladesh Bureau of Statistics (BBS), Ministry of
Planning, Government of Bangladesh.
BBS. (2018). Labour Force Survey (LFS) 2016-17. Dhaka: Bangladesh Bureau of
Statistics (BBS), Ministry of Planning, Government of Bangladesh.
BBS. (n.d.-a). Gross Domestic Product of Bangladesh at Constant Prices, 2014-
15 to 2017-18. Dhaka: Bangladesh Bureau of Statistics (BBS), Ministry of
Planning, Government of Bangladesh. Retrieved from: http://bbs.portal.
gov.bd/sites/default/files/files/bbs.portal.gov.bd/page/057b0f3b_a9e8_4
fde_b3a6_6daec3853586/F2_GDP_2017_18.pdf
BBS. (n.d.-b). Gross Domestic Product of Bangladesh at Constant Prices, 2010-
11 to 2014-15. Dhaka: Bangladesh Bureau of Statistics (BBS), Ministry of
Planning, Government of Bangladesh. Retrieved from:
http://203.112.218.65:8008/WebTestApplication/userfiles/Image/GDP/
GDP_2014-15_Final.pdf
Buiter, W., Rahbari, E. and Kupciuniene, D. (2011). The Global Growth Generators.
Global Economics View Global Growth Generators: Moving beyond ‘Emerging
Markets’ and ‘BRIC’, 21 February 2011, 62-73. New York: Citi Investment
Research and Analysis, Citigroup Global Markets Inc. Retrieved from:
https://www.eri.mn/download/smkncohc.
Byron, R. K. and Rahman, M. F. (2011, April 8). Tk 20,000cr swindled. The Daily
Star. Retrieved from https://www.thedailystar.net/news-detail-180918
CPD. (2018). Bangladesh Economy in FY2017-18. Interim Review of Macroeconomic
Performance. Dhaka: Centre for Policy Dialogue (CPD). Retrieved November
1, 2018, from https://cpd.org.bd/wp-content/uploads/2018/06/
Bangladesh-Economy-in-FY2017-18-Interim-Review-of-Macroeconomic-
Performance.pdf.
36 D. Bhattacharya: The Uncomfortable Truth
Dervis, K. and Qureshi, Z. (2016). Income Distribution within Countries: Rising
Inequality. Washington, D.C.: Global Economy and Development at
Brookings.
Dorling, D. (2017). The Equality Effect: Improving Life for Everyone. Oxford: New
Internationalist Publications Ltd.
Hawksworth, J., Clarry, R. and Audino, H. (2017). The World in 2050: The Long
View-How will the global economic order change by 2050? London:
PricewaterhouseCoopers (pwc).
Henry, J. and Pomery, J. (2018). The World in 2030: Our long term projection for 75
countries. London: HSBC Bank plc, Economics Global.
Kar, D. and Spanjers, J. (2015). Illicit Financial Flows from Developing Countries:
2003-2013. Washington, D.C: Global Financial Integrity. Retrieved from
https://www.gfintegrity.org/wp-content/uploads/2015/12/IFF-
Update_2015-Final-1.pdf
Lawson, M. and Martin, M. (2018). The Commitment to Reducing Inequality Index
2018: A global ranking of governments based on what they are doing to tackle
the gap between rich and poor. Cowley, Oxford: Development Finance
International and Oxfam Report.
Milanovic, B. (2016). Global Inequality. Cambridge: Harvard University Press.
Moazzem, K., and Arno, A. (2018). ‘Business as Usual’ Trend of Structural
Transformation: Can this Ensure Graduation with Momentum? (Policy Brief
No. 3). Dhaka: Centre for Policy Dialogue (CPD).
National Institute of Population Research and Training (NIPORT), Mitra and
Associates, and ICF International. (2013). Bangladesh Demographic and
Health Survey 2011. Dhaka, Bangladesh and Calverton, Maryland, USA:
NIPORT, Mitra and Associates, and ICF International.
National Institute of Population Research and Training (NIPORT), Mitra and
Associates, and ICF International. (2016). Bangladesh Demographic and
Health Survey 2014. Dhaka, Bangladesh, and Rockville, Maryland, USA:
NIPORT, Mitra and Associates, and ICF International.
O’Neill, J., Wilson, D., Purushothaman, R. and Stupnytska, A. (2005). How Solid are
the BRICs? (Global Economics Paper No: 134). New York: Goldman Sachs
Global Economics Group.
D. Bhattacharya: The Uncomfortable Truth 37
Payne, K. (2017). The Broken Ladder: How Inequality Affects the Way We Think,
Live, and Die. New York: Viking.
Peters, H. and Volwahsen, M. (2016). Rising Income Inequality: do not draw the
obvious conclusions. Germany: Deutsche Bank Research.
Piketty, T. (2014). Capital in the Twenty-First Century. Cambridge: Harvard
university Press.
Rodrik, D. (2015). Premature Deindustrialization. New Jersey: School of Social
Science, Institute for Advanced Study.
Schwab, K. (2018). The Global Competitiveness Report 2017-2018. Cologny: World
Economic Forum.
SDG Tracker: Bangladesh's Development Mirror. Dhaka: General Economics
Division, Planning Commission, Ministry of Planning, and a2i Programme,
Prime Minister’s Office, Government of Bangladesh. Retrieved from:
http://www.sdg.gov.bd/
Stiglitz, J. (2012). The Price of Inequality. London: Allen Lane.
Temple, J. (1999). The New Growth Evidence. Journal of Economic Literature 37
(1): 112–156.
Uddin, A. K. M. Z. (2018, September 11). Banks' toxic loans rise 20pc in six months.
The Daily Star. Retrieved from https://www.thedailystar.net/business/news/
bangladesh-bank-default-loans-rise-20pc-in-6-months-1632280
UNDESA. (2015). Income Convergence or Persistent Inequalities among Countries.
(Development Issues No. 5). United Nations Department of Economic and
Social Affairs (UNDESA)
Vandemoortele, J. (2018). From simple-minded MDGs to muddle-headed SDGs.
Development Studies Research. Retrieved from: https://
www.tandfonline.com/doi/full/10.1080/21665095.2018.1479647
WEF. (2017). The Global risks Report 2017. Geneva: World Economic Forum (WEF).
WESS. (2012). Inequality on the rise? An assessment of current available data on
income inequality, at global, international and national levels. (Background
document for the WESS 2013). New York: The World Economic and Social
Survey (WESS).
White, V., Imberg, M., Chesterfield, W. and Shaban, M. (2018). World Ultra Wealth
Report 2018. New York: WEALTH-X.

38 D. Bhattacharya: The Uncomfortable Truth
Wilkinson, R., and Pickett, K. (2010). The Spirit Level: Why Equality is Better for
Everyone. London: Penguin Books.
World Bank. (n.d.-a). World Development Indicators. Washington, D.C.: The World
Bank.
Accessed from: http://datatopics.worldbank.org/world-development-indicators/
World Bank. (n.d.-b). Worldwide Governance Indicators. Washington DC: World
Bank. Accessed from: http://info.worldbank.org/governance/wgi/#home
![BPL LIST-KOLKATA MUNICIPAL CORPORATION …ABDUL BORHAN ABDUL KADIR ABDUL MALEK ABDUL SOBAN ABDUL SOBHAN ABDUL AHAN KHAN ABDUL AJIJ ABDUL AJIJ] ABDUL GAFFAR MONDAL ABDUL HAMID KHAN](https://img.dokumen.tips/doc/110x75/5e6b7102b1682455b35c1d59/bpl-list-kolkata-municipal-corporation-abdul-borhan-abdul-kadir-abdul-malek-abdul.jpg)