Embed Size (px)
Citation preview

1
Organisational innovativeness:
The role of strategic orientation and environmental scanning
By
Jennifer Murray
A Research Paper
Submitted in Partial Fulfilment
of the Requirements for the
Master of Business (Research)
School of Management
Queensland University of Technology
2012

2
School of Management
Queensland University of Technology
Author: Murray, Jennifer
Title: Organisational innovativeness: The role of strategic
orientation and environmental scanning
Degree: Master of Business (Research)
Research Advisers: Dr Bernd Irmer and Dr Judy Matthews
Month/Year: October 2012
Number of pages: 186
Style Manual Used: American Psychological Association, 6th
edition
3
Abstract
This study examined the effects of strategic orientation and environmental
scanning on a firm’s propensity to innovate (organisational innovativeness).
Previous research has mostly proposed descriptive and theoretical relationships
between strategic orientation, environmental scanning and organisational innovation
adoption (Beal, 2000; Jennings & Lumpkin, 1992; Raymond, Julien, &
Ramangalahy, 2001). However, strategic orientation and environmental scanning, as
distinct constructs, have not been empirically examined directly before in relation to
organisational innovativeness. Furthermore the directionality of the relationship
between strategic orientation and environmental scanning on organisational
innovation adoption is still unclear (Hagen, Haile, & Maghrabi, 2003). For example,
does scanning the environment result in certain types of organisational strategies,
and these strategies in turn influence levels of organisational innovativeness? Or do
certain types of strategic orientations pre-determine the levels of environmental
scanning, and then this environmental scanning influences an organisation’s
propensity to innovate? Therefore, this study using a more nuanced measure of
strategic orientation; the Venkatraman’s (1989) STROBE framework of analysis,
defensiveness, futurity, proactiveness, aggressiveness and riskiness, examined the
directional effects of strategy and environmental scanning on organisational
innovativeness
Specifically, two competing models of directionality between strategic
orientation and environmental scanning in relation to organisational innovativeness
were proposed. Model 1 (Behavioural View) proposed that certain strategic
orientation dimensions affect levels of environmental scanning, which in turn
influences organisational innovativeness. In contrast, Model 2 (Open Systems view)

4
proposed that environmental scanning affects the emphasis on certain strategic
orientation dimensions, which in turn influences organisational innovativeness. Data
was collected from 117 industrial firms and path analyses were used to test the two
competing models. The results supported both models, suggesting a bi-directional
relationship, as both models had adequate fit indices and significant paths with the
data. However, overall Model 2 – the Open Systems Model had the stronger fit
indices and stronger indirect effect compared to Model 1 – the Behavioural Model,
suggesting that overall environmental scanning does not exert a strong direct effect
on innovativeness but has more of a stronger indirect effect through the analysis and
proactiveness strategic orientation dimensions. In sum, the thesis results suggest
that firms’ that emphasise environmental scanning – that is continually seeking
information from the environment about customers, markets, industry and new
technology - are more likely to emphasise strategic orientations such as
proactiveness – being innovative - and also analysis – being analytical and
comprehensive in decision making - and both these strategic orientations in turn
greatly influence these firms’ propensity to innovate. Discussion is given to these
findings and implications are drawn for organisations and future research.

5
Statement of Original Authorship
The work contained in this thesis has not been previously submitted to meet
requirements for an award at this or any other higher education institution. To the
best of my knowledge and belief, the thesis contains no material previously
published or written by another person except where due reference is made.
Signature: ____________________________________
Date: ____________________________________

6
Acknowledgements
Firstly, I would like to acknowledge that this thesis research was funded and
supported by an Australian Research Council (ARC) Linkage grant - (LP0455129:
Organisational Innovation Adoption: The effect of external, technology diffusion
agencies) and Industry partners – QMI Solutions and Concentric. Secondly, I would
personally like to thank Dr Kerrie Unsworth for taking me on as a research student
for her Organisational Innovation Project and also for her wisdom, and supportive
guidance throughout the initial and middle stages of my research thesis. I would
also like to thank Dr Madeleine Brabant and Dr Sukie Sawang for their friendship,
collaboration and support whilst working on the innovation project together. Finally,
I would also like to thank Dr Bernd Irmer and Dr Judy Matthews for their wisdom,
patience, guidance, perseverance and support in seeing me through the latter stages
of this research thesis.

7
Publications resulting from the ARC Linkage Grant (LP0455129)
Sawang, S., & Unsworth, K. L. (2011). Why Adopt Now? Multiple Case Studies and
Survey Studies Comparing Small, Medium and Large Firms. Technovation,
31(10–11), 554-559. doi: 10.1016/j.technovation.2011.06.002
Sawang, S., & Unsworth, K. L. (2011). A Model of Organizational Innovation
Implementation Effectiveness in Small to Medium Firms. International
Journal of Innovation Management, 15(05), 989-1011. doi:
doi:10.1142/S1363919611003398
Unsworth, K. L., Sawang, S., Murray, J., & Sorbello, T. M. (2009). Developing an
Integrative Model for Understanding Innovation Adoption. Paper presented
at the Proceedings of the 2009 Academy of Management Annual Meeting -
Green Management Matters. http://eprints.qut.edu.au/27803/
Unsworth, K., Sawang, S., Murray, J., Norman, P., & Sorbello, T. (2012).
Understanding Innovation Adoption: Effects of Orientation, Pressure and
Control on Adoption Intentions International Journal of Innovation
Management (IJIM), 16(1), 1-35. doi: 10.1142/S1363919611003593

8
Table of Contents
Chapter 1 - Introduction ............................................................................................. 12
What is Organisational Innovativeness? .............................................................. 18
Types of innovations. ................................................................................... 19
Adoption vs. implementation. ...................................................................... 20
Why is it important to study Organisational Innovativeness? .............................. 22
Review of Organisational Innovation Research ................................................... 24
Individual factors. ........................................................................................ 24
External factors. ........................................................................................... 25
Organisational factors. ................................................................................. 26
Integrative and multi-level frameworks/models. ......................................... 27
Strategic Orientation ............................................................................................. 30
Strategic orientation and organisational innovativeness research. .............. 31
Strategic Orientation of Business Enterprises (STROBE) framework. ....... 37
Environmental Scanning ...................................................................................... 40
Environmental scanning and strategic orientation research. ........................ 41
Hypotheses ........................................................................................................... 48
Proactiveness................................................................................................ 48
Analysis........................................................................................................ 51
Futurity. ........................................................................................................ 54
Riskiness. ..................................................................................................... 56
Aggressiveness. ............................................................................................ 59
Defensiveness. ............................................................................................. 60
Summary. ..................................................................................................... 62
Conceptual Framework of Competing Models .................................................... 62

9
Behavioural conceptual framework. ............................................................ 63
Open Systems conceptual framework. ......................................................... 66
Chapter 2 - Method .................................................................................................... 68
Innovation Study .................................................................................................. 68
Sample .................................................................................................................. 69
Participants. .................................................................................................. 71
Survey Measures .................................................................................................. 73
Environmental Scanning. ............................................................................. 74
Strategic Orientation. ................................................................................... 74
Aggressiveness. ............................................................................................ 75
Defensiveness. ............................................................................................. 75
Analysis........................................................................................................ 75
Futurity. ........................................................................................................ 75
Proactiveness................................................................................................ 75
Riskiness. ..................................................................................................... 76
Organisational Innovativeness. .................................................................... 76
Control variables: Size. ................................................................................ 79
Chapter 3 - Results ..................................................................................................... 81
Data Analysis Overview ....................................................................................... 81
Data Screening ..................................................................................................... 81
Univariate outliers. ....................................................................................... 81
Multivariate outliers. .................................................................................... 81
Missing data analysis. .................................................................................. 81
Psychometric Inspection of Measurement Scales ................................................ 82
Categorical variables. ................................................................................... 83

10
Continuous variables. ................................................................................... 83
Summary of measurement inspection. ......................................................... 86
Testing of Two Competing Models using Path Analysis ..................................... 88
Models overview. ......................................................................................... 88
Path analysis................................................................................................. 89
Step 1 - Testing for full and/or partial mediation effects within each model.91
Step 2 - Comparison of the two final revised hypothesised models. ......... 116
Summary of results ............................................................................................. 121
Chapter 4 - Discussion ............................................................................................. 122
Two Theoretical Models .................................................................................... 122
Model 1 - Behavioural. .............................................................................. 122
Model 2 - Open Systems model. ................................................................ 127
Comparison of competing models. ............................................................ 131
Theoretical Contributions ................................................................................... 132
Overall........................................................................................................ 132
Strategic Orientation of Business Enterprises (STROBE)......................... 133
Environmental scanning............................................................................. 135
Interaction between STROBE and environmental scanning. .................... 136
Practical Implications ......................................................................................... 136
Limitations and future research .......................................................................... 139
Limitations. ................................................................................................ 139
Future Research. ....................................................................................... 141
Conclusion .......................................................................................................... 143
References ................................................................................................................ 145
Appendix A – Information sheet, instructions and survey provided to participants 168

11
List of Tables
Table 1 Organisational characteristics of the Sample ................................................ 72
Table 2 Frequency of innovation types adopted in the sample .................................. 79
Table 3 Number and percentage of missing cases for each variable ......................... 82
Table 4 Recode of Size .............................................................................................. 83
Table 5 Factor loadings based on a principle components analysis with Varimax
rotation for the STROBE dimensions (N = 117) ....................................................... 85
Table 6 Means, standard deviations and inter-correlations among all variables. ...... 87
Table 7 Model 1 fit indices and standardised path coefficients ................................. 99
Table 8 Standardised total, direct and indirect effects and 95% confidence levels for
final Model 1 ............................................................................................................ 101
Table 9 Model 2 - Open Systems model fit indices and standardised path coefficients111
Table 10 Standardised total, direct and indirect effects and 95% confidence levels
for final Model 2 - Open Systems model ................................................................. 113
Table 11 Overall fits of Models 1 – Behavioural Model and Model 2 - Open Systems
model ........................................................................................................................ 117
Table 12 Relative strength of each path specified by the respective models ........... 120
Table of Figures
Figure 1. Conceptual Model 1 – Behavioural Model ................................................. 64
Figure 2. Conceptual Model 2 - Open Systems model .............................................. 66
Figure 3 Fully mediated Model 1 - Behavioural Model ............................................ 93
Figure 4 Final Model 1- Behavioural Model ............................................................. 95
Figure 5 Fully mediated Model 2 - Open Systems Model ....................................... 105
Figure 6 Final Model 2 - Open Systems Model ....................................................... 109

12
Chapter 1 - Introduction
Organisational innovativeness is a critical way for organisations to remain
competitive and gain advantage over their rivals especially in a world of increasing
globalisation, rapidly changing technology and increasing customer demands for
quality services and products (Damanpour & Schneider, 2009; Damanpour, Walker,
& Avellaneda, 2009; Walker, 2008). Adopting both internally generated and/or
externally acquired innovations – also termed as “organisational innovativeness” –
can help dramatically improve organisational adaption, performance and
competitiveness (Greve & Taylor, 2000; Taylor & McAdam, 2004). Organisational
innovativeness is the propensity for organisations to adopt innovations to continually
improve the effectiveness and competitiveness of their firm (Damanpour, 1991;
Walker, 2008). Organisational innovation is defined as anything “new” that the
organisation decides to adopt, which they have never implemented before, such as
new work practices, technology, administrative systems, products and/or services
(Damanpour, 1991; Damanpour & Schneider, 2006, 2009; Damanpour, et al., 2009).
Numerous studies have been devoted to identifying the factors that facilitate
organisational innovativeness including organisational properties (e.g., strategy, size,
structure, slack resources: (Crossan & Apaydin, 2010; Damanpour, 1991, 1996;
Damanpour & Schneider, 2006; Walker, 2008), decision-making processes/stages
(King, 1992), environmental factors (e.g., customer and supplier pressure, turbulent
environments: (Frambach, Barkema, Nooteboom, & Wedel, 1998; Walker, 2008),
individual characteristics (e.g. management attitudes, risk propensity and self-
efficacy towards innovation: (Damanpour & Schneider, 2006; Tabak & Barr, 1996);

13
employee characteristics – individual learning (Pedler & Aspinall, 1996),
competence (Johannessan, 1997; Dunphy et al., 1995), and skill base and readiness
(Bates & Flynn, 1995; Snyder-Halpern, 2001) and perceived innovation
characteristics (e.g., relative advantage etc.: Wolfe, 1994; Frambach and
Schillewaert, 2002).
However, the continual search and investigation into the multitude of
different factors and their contingency factors that affect organisational
innovativeness is becoming even more overwhelming and complicated as the
innovation determinant categories continue to expand (Crossan & Apaydin, 2010;
Damanpour, 1996; Walker, 2008). Researchers have recommended that
organisational innovativeness research look towards more generic factors that
exemplify a combination of innovation attributes and other contingency factors so
that more parsimonious models can be developed (Crossan & Apaydin, 2010;
Damanpour, 1996; Walker, 2008). Moreover, these generic factors should be within
management control (Damanpour, 1996). Two management constructs which are
generic and encompass a number of innovation determinants characteristics are
strategic orientation and environmental scanning.
The next section introduces the strategic orientation and environmental
scanning constructs and then outlines why organisational innovativeness is important
to examine and also defines in more detail what organisational innovativeness is.
After this the organisational innovativeness, strategic orientation, and environmental
scanning research is reviewed and the hypotheses of the study are proposed.
Strategic orientation, espouses an organisation’s key principles, functionality
and competitive main focus, and has been found to influence the levels of
14
innovations an organisation adopts (Aragón-Sánchez & Sánchez-Marín, 2005;
Baines, Kay, Adesola, & Higson, 2005; Yi, Nan, & Youhe, 2010). Strategic
orientation provides the motivation and direction to the organisation on how it needs
to act in relation to innovation. However, the majority of strategy and innovation
studies reduce strategic orientation to a categorical variable or typology.
Organisations are then categorised into one of typologies, such as a Defender or a
Prospector, and the differences between the two typologies are examined. For
example, research using the Miles and Snow’s (1978), typology framework has
found that prospector firms have higher levels of product innovation adoption than
defender firms (Shortell & Zajac, 1990). Likewise, research using Porter’s (1980)
typology framework has also found the differentiator strategic typology to also have
higher levels of product innovation adoption compared to cost leadership strategic
typology firms (Frambach, Prabhu, & Verhallen, 2003). The main limitation of
these strategic typology approaches is that specific nuances within the strategic
typologies and their specific affects on innovativeness may be missed, thus limiting
generalisability of findings (Speed, 1993). For example, the prospector or
differentiator strategic typology could be a combination of both high riskiness and
analysis strategic orientation dimensions. The riskiness strategic orientation
dimension being an affinity of venturing into the unknown or committing significant
resources to uncertain projects while the analysis strategic orientation dimension
refers to consistently collecting information from different sources, analysing them
and formulating management implications (Talke, 2007). Thus, it may be that the
high riskiness dimension mostly affects the level of innovativeness in a firm and not
the analysis dimension.

15
Furthermore, some studies have found that firms do not usually form neatly
into strategic typologies and are much more complex in reality (Dess & Davis, 1984;
Miller & Friesen, 1986). Finally, empirical research on strategic typologies and
innovation has shown mixed results in relation to the predicted relationships. For
instance, Zahra and Covin (1993) found cost leadership firms (which are similar to
defenders) to be related to both product and process innovations, while it has been
proposed in theory that cost leadership firms would only be related to process
innovations (Damanpour, 1996). Therefore, it is more advantageous to examine a
firm’s strategic orientation along one or more continua in relation to organisational
innovativeness compared to a typology as this enables more nuanced information to
be analysed (Fombrun & Ginsberg, 1990).
This thesis will use Venkatraman’s (1989) multi-dimensional Strategic
Orientation of Business Enterprises (STROBE) framework to examine more closely
strategic orientation’s influence on organisational innovativeness (Akman & Yilmaz,
2008; Allred, Boal, & Holstein, 2005; Bergeron, Raymond, & Rivard, 2004; Chan,
Huff, Barclay, & Copeland, 1997; Morgan & Strong, 2003; Sabherwal & Chan,
2001; Venkatraman, 1989). The STROBE framework incorporates a much broader
view of strategic orientation compared to other strategic constructs, such as the Miles
and Snow (1978) and Porter (1980) ones – incorporating both competitive and major
decision-making dimensions within the organisation, whilst still remaining a
parsimonious construct (Venkatraman, 1989). The STROBE framework proposes
that there are six common strategic orientation dimensions across organisations:
analysis, futurity, defensiveness, aggressiveness, proactiveness, and riskiness
(Venkatraman, 1989).

16
In addition, this thesis will also look at how another organisational
innovation determinant – environmental scanning – interacts with the STROBE
framework to influence organisational innovativeness. Environmental scanning
occurs when management regularly scans for external information on customers,
competitors, technology and markets (Abebe, Angriawan, & Tran, 2010; Davis,
Miles, & McDowell, 2008; McEwen, 2008). Regular environmental scanning is
important for organisational innovation as it helps organisations identify
opportunities and threats early on and helps build organisational knowledge and
allows time for the organisation to prepare and respond effectively to the
environment with innovation (Aguilar, 1967). Consequently, research has found that
firms that environmentally scan on a regular basis are more likely to be more
innovative and outperform firms that do not scan regularly (Dollinger, 1984;
Newgren, Rasher, & LaRoe, 1984; Subramanian, Fernandes, & Harper, 1993;
Subramanian, Kumar, & Yauger, 1994).
The relationship between environmental scanning and strategic orientation
has been examined before but the majority of this research has tended to use strategic
typologies (Hagen, et al., 2003; Kumar, Subramanian, & Strandholm, 2001;
Subramanian, et al., 1993). For instance, research has found that prospector strategic
type firms are more likely to have more advanced scanning systems than defender
strategic type firms, which tend to use more ad hoc scanning systems (Subramanian,
et al., 1993). In addition, to further complicate matters there are two schools of
thought on how environmental scanning and strategic orientation relate to each other
(Davis, et al., 2008). Theorists that view organisations as Open Systems, which
respond and value external information, argue that it is the environmental scanning

17
that influences the emphasis on certain strategic orientations which then leads to
increased organisational innovation (Abebe, et al., 2010; Beal, 2000; Lefebvre,
Mason, & Lefebvre, 1997; Mintzberg, 1990). Conversely, proponents of the
Behavioural approach argue that it is the strategic orientation that determines the
frequency and type of environmental scanning which leads to increased
organisational innovativeness (Hagen, et al., 2003; Jennings & Lumpkin, 1992;
Raymond, Julien, & Ramangalahy, 2001). It is more than likely that a reciprocal
relationship exists between the two factors – that is environmental scanning
influences strategic orientation and vice versa - (Davis, et al., 2008), but this has not
yet been empirically tested in the literature, particularly in relation to organisational
innovativeness.
This thesis using more nuanced multi-dimensional measures of strategic
orientation, the STROBE framework, will extend previous research by investigating
the potential presence of a bi-directional relationship between environmental
scanning and strategic orientation in relation to organisational innovativeness. I
propose and test two competing path models that outline two different directional
relationships between environmental scanning, strategic orientation, and
organisational innovativeness. Model 1 – Behavioural Model - proposes that
environmental scanning mediates the relationship between strategic orientation and
organisational innovativeness. Model 2 - Open Systems model proposes that
strategic orientation mediates the relationship between environmental scanning and
organisational innovativeness. I then compare these two models to investigate the
directionality of the relationship between the environmental scanning and strategic
orientation constructs and the relative strength of these relationships in relation to

18
organisational innovativeness. The advantages of investigating the directional
relationship between environmental scanning and strategic orientation and the
relative strengths of these relationships are that it will give more clarity or insight
into how these factors in conjunction influence organisational innovativeness.
In this chapter, first I define organisational innovativeness and then second,
outline why organisational innovativeness is important for organisations and
academic research to investigate. Third, I review research on the previous research
on the individual, organisational and external antecedents found correlated to
organisational innovation. I then review the research on strategic orientation and
environmental scanning. Finally I propose two competing theoretical frameworks
that outline the two different ways that strategic orientation and environmental
scanning may interact to influence organisational innovativeness.
What is Organisational Innovativeness?
Organisational innovativeness is a firm’s propensity to innovate – that is the
propensity to adopt a number of different types of innovations into the organisation
(Damanpour, 1991). Innovation in organisations is generally defined as any “new
internally generated or externally purchased device, system, policy, program,
process, product or service that is adopted by the organisation” (Damanpour, 1991,
p.556). Innovations can range simply from changing current work processes to
introducing new machinery or products into an organisation (Damanpour, 1991;
Rogers, 1995). Organisational innovativeness involves the organisation’s propensity
to try something new that has not been utilised before in the organisation to improve
effectiveness and competitiveness.

19
Types of innovations.
Organisational innovativeness is viewed as encompassing a number of
different types of innovation, such as product, service, process, administrative,
technological and organisational innovations. The aim of this thesis research is to
identify strategic and scanning determinants that can be applied across the adoption
of a number of different types of innovations. Therefore for the purposes of this
thesis the definitions of different organisational innovation types are based on the
Oslo manual’s (OECD, 2005) three broad categories of innovation: (1)
product/service innovation; (2) process innovation; and (3) organisational
innovation.
Product/service innovations are defined as new products or services that are
produced for customers/consumers, and are aimed to increase market share and
profitability (Damanpour, 1991; Damanpour & Gopalakrishnan, 2001; Meeus &
Edquist, 2006). Example of product innovations are innovative door designs and/or
electrical circuits while service innovations are new ways for customers to engage
with or receive service from an organisation.
In contrast, process innovations have an internal focus and aim to increase
efficiency and effectiveness of internal organisational processes (Boer & During,
2001). The new processes can be associated with the “technological” area
(technological process innovations) or “administrative” area (administrative process
innovations) of the organisation. Technological process innovations relate to the
core work activity of the organisation, such as the production system or service
operation for producing its products or rendering its services to the clients (Nystrom,

20
Ramamurthy, & Wilson, 2002). For example, new plant or machinery, new
manufacturing of product-based technology, new work processes or work design
systems (e.g., TQM and/or information technology - for more service type
organisations). The drivers of these innovations are efficiency gains primarily
reduction in delivery times, increase in operational flexibility, and lowering of
production costs (Boer & During, 2001). In contrast, administrative process
innovations relate to the work activities that support the functioning of the
organisation, such as structure, administrative and HR processes. Therefore an
administrative process innovation refers to a new work process and/or hard
technology that are adopted to improve the organisation’s support mechanisms.
Examples of administrative process innovations include new administrative systems
(e.g., communication systems, inventory systems) and HR innovations (e.g.,
appraisal, reward systems, training) (Totterdell, Leach, Birdi, Clegg & Wall, 2002).
Finally, organisational innovations are organisational-wide innovations, such
as restructuring, expansion, merger, or relocation (Totterdell et al., 2002)
Please see page 78 for the exact list of innovation types utilised in this thesis
study.
Adoption vs. implementation.
This thesis research also focused only on the decision to introduce or adopt
innovations into the organisation and not the implementation or complete adoption
of the innovations. Thus, the innovation did not have to be successfully introduced

21
or implemented into the organisation, only adopted. This distinction was made
based on Wolfe’s (1994) recommendations that innovation stages , such as adoption
and implementation, be clearly defined in regards to innovation research to allow
better clarity of determinants for each stage of the process.
The following four definitions were provided to survey respondents at the
beginning of the Innovation survey to clarify these innovation concepts and stages.
Innovation was defined as a technology or practice that an organization is using for
the first time, regardless of whether other organizations have previously used the
technology or practice. Innovation adoption was defined as an organization’s
decision to install an innovation into the organization. Adoption is defined a decision
point, a plan, or a purchase. Implementation was defined as the stage following
adoption: the transition period during which organizational members ideally become
increasingly skillful, consistent, and committed in their use of an innovation.
Introduction of an innovation was defined as including both the adoption and the
implementation of an innovation. Furthermore, when survey respondents were asked
to indicate the types of innovations they had adopted over the past 3 years (if any)
they were reminded that these innovations did not have to be successful to be
counted (see page 75 of this thesis for a list of the innovations). The three year time
period was chosen to ensure that innovations were fresh within respondents’ minds,
recent, and contemporary (Totterdell et al., 2002).

22
Why is it important to study Organisational Innovativeness?
Innovation is identified as an important factor for enhancing economic and
employment growth in Australia and assisting Australian businesses to compete in a
global marketplace (Commonwealth of Australia, 2001, 2009; Innovation Australia,
2009-10). With the increase in globalisation and competition from overseas, there is
a pressing need for Australian businesses to remain ahead of the competition
(Bessant, Francis, Meredith, Kaplinsky, & Brown, 2001; Mellor & Gupta, 2002;
Sheather, 2002). Furthermore, past research has shown that Australia tends to buy
and spend more than it produces and sells to overseas nations (Sheather, 2002).
Without an increase in productivity and sales, Australia’s ability to pay off national
debt will soon become increasingly untenable (Gelber, 1998). Innovation is seen as
the essential mechanism for increasing current productivity rates and fighting
competition in a global marketplace (Damanpour, et al., 2009; Greve & Taylor,
2000; Jansen, Van Den Bosch, & Volberda, 2006; Sheather, 2002). This includes
developing new products, using new technologies, and integrating innovative
processes to improve efficiency and effectiveness. Baldwin and Lin (2002) reported
numerous benefits of organisational innovation, such as increased productivity,
improved flexibility, higher quality products, and reduction of production costs
(Beaumont & Schroder, 1997; Rishel & Burns, 1997; Small, 1998). For example,
Mo (2009) reported a case study of a small furniture company that achieved a 30%
increase in productivity after implementing a new scheduling system that assisted
implementation of lean manufacturing.
23
The importance of innovation for Australia’s economic future is reflected in
the recent federal government’s 2009 “Powering Ideas: An innovation agenda for the
21st century” policy document (Commonwealth of Australia, 2009), which outlines
polices and initiatives designed to assist businesses with increasing their innovative
activity. The document argues that “there is much more to innovation than
laboratory R&D” but also “to improvements to the way we organise, manage,
operate and market things” (page 3). David Miles (2011), the Chairman of the
Innovation Australia board, also reinforced the message that innovation is essential
to Australia’s prosperity. He stated that “In the bid to capture global markets and
grow, Australian business needs to adopt best practice both in technology and
management with a focus on high value added product and services” (Chairman of
Innovation Australia David Miles, 2011).
However, the recent Australian Bureau of Statistics (ABS) Innovation in
Australian Businesses 2008-2009 report reveals a 5% decline in business innovative
activity (i.e. those that undertook any innovative activity) from 45% in 2007-08 to
40% in 2008-09 (Australian Bureau of Statistics, 2006-07, 2008-09). The ABS
define “innovative activity” as businesses which introduced any new or significantly
improved goods or services, operational processes, organisational/managerial
processes and marketing methods in the past financial year. In addition, the
proportion of all businesses which introduced at least one type of innovation also
dropped 4 percentage points from 39% in 2007-08 to 35% in 2008-09 (Australian
Bureau of Statistics, 2006-07, 2008-09). Moreover, the manufacturing industry has
also recorded a decrease in innovative activity from 50% in the 2006-07 ABS
Innovation report to 42% in the 2008-09 report (Australian Bureau of Statistics,

24
2006-07, 2008-09). This recent drop in innovative activity suggests that there is still
an increasing need to investigate and understand further how organisational factors
help sustain and grow innovative activity in Australian firms.
The next section reviews organisational innovation adoption and innovativeness
research.
Review of Organisational Innovation Research
Due to the importance of innovation in organisations, a plethora of research has
been devoted to understanding how different factors and processes relate to the
adoption of innovations in organisations (for e.g., organisational, individual, and
environmental characteristics; (Crossan & Apaydin, 2010; Damanpour, 1991, 1996;
Damanpour & Wischnevsky, 2006; Taylor & McAdam, 2004).
The next section reviews the organisational innovation adoption and
innovativeness research and gives examples of the types of individual, external, and
organisational antecedents that have been examined in relation to organisational
innovation variables.
Individual factors.
A number of individual factors have been found correlated with
organisational innovation adoption in firms. These include managerial
characteristics, such as attitude to technology and change process (O'Connor &
Zammuto, 1995), leadership (Manz, Bastien, Hostager, & Shapiro, 1989), formal
education (Schoenecker, Daellenbach, & McCarthy, 1995), risk propensity and self-

25
efficacy (Tabak & Barr, 1996), and favourable attitudes towards innovation
(Damanpour & Schneider, 2006, 2009). Similarly, employee characteristics have
also been found related to higher levels of innovation adoption in firms including
individual learning (Jensen, Johnson, Lorenz, & Lundvall, 2007; Pedler &
Aspinwall, 1996), competence (Dunphy, Herbig, & Palumbo, 1995; Johannessen,
Olsen, & Olaisen, 1997), and skill base and readiness (Bates & Flynn, 1995; Snyder-
Halpern, 2001).
External factors.
External factors, such as global and industry factors, to the organisation have
received less attention in the literature but have been found to correlate with
innovation adoption in organisations. Global factors include customer demand,
market uncertainty, supplier pressure/external pressure, organisational
competitiveness, technology dynamism, demographic dynamism, and regulatory
restrictiveness (Boeker & Huo, 1998; Iacovou, Benbasat, & Dexter, 1995; Kessler &
Chakrabarti, 1996; Tzokas & Saren, 1997). Industry factors include vertical
boundaries/supply chain, competitiveness of industry, and information exchange
across firms (Boeker & Huo, 1998; Bouty, 2000; Mehrtens, Cragg, & Mills, 2001).
Recently, Walker (2008) examined the impact of environmental characteristics, such
as service need, diversity of need, increase in population, and turbulent external
political climates on English public service innovation adoption. The author found
that out of all the environmental factors they examined only service need
significantly predicted of innovation adoption in the public service organisations.
26
Organisational factors.
Organisational factors are the most extensively researched in the
organisational innovation adoption literature (Damanpour, 1991). Generally, the
structural and functional characteristics of organisations have been the main focus of
organisational innovativeness research in the past few decades (Cyert & March,
1963; Damanpour, 1991; Dewar & Dutton, 1986; Kimberly & Evanisko, 1981;
Stock, Greis, & Fischer, 1996). Some suggest, however, that to focus only on the
structural aspects of organisations presents a simplistic view of innovativeness and
that there are probably more influential underlying management mechanisms within
the organisation which impact innovativeness, such as strategy (Tornatzky &
Fleischer, 1990).
Nevertheless, size and structure have been found to be the most consistent
influence on organisational innovativeness. Studies have found that the larger the
organisations, the more likely they are to adopt innovations (Damanpour, 1996).
This is because larger organisations are argued to have more slack and resources to
adopt innovations. Structural complexity has also been found to influence
innovation adoption. The more complex an organisation is structured the more
likely it is to be innovative (Damanpour, 1996).
Other studies tend to look at number of different organisational factors and
examine how they correlate to organisational innovativeness. For example,
Damanpour (1991) conducted a meta-analysis of the relationships between
innovation adoption and 13 potential organisational determinants. The author found
that technical knowledge resources, specialisation, external communication,

27
functional differentiation, managerial attitude toward change, administrative
intensity, internal communication, professionalism, centralisation and slack
resources all influenced the number of innovations an organisation adopted over a
certain time period.
Integrative and multi-level frameworks/models.
Moreover, multi-level models have also been proposed and/or examined to
investigate how the cross-levels of individual, organisational and external factors
together influence organisational innovativeness (Crossan & Apaydin, 2010;
Damanpour & Schneider, 2006; Walker, 2008). However, the majority of these
models have only examined the relative contribution of each variable on
organisational innovativeness, not how they interact with each other. Kimberely and
Evanisko (1981) examined the combined contributions of individual, organisational
and contextual variables on hospitals adoption of administrative and technical
innovations. They found that individual, organisational, and contextual variables
were much better predictors of the adoption of technological innovations than of
administrative ones. Only size was found to be the common predictor of both types
of administrative and technical adoptions.
Meyer and Goes (1988) looked at the influence of contextual attributes
(environments, organisations, and leaders), attributes of innovations (risk, skill,
observability), and innovation-decision attributes (equipment compatibility with staff
specialisation) on the assimilation of 300 innovations among a setting of 25
hospitals. They found that innovation attributes, such as observability, level of risk,
and skill level, were the best predictors of innovation assimilation.
28
Similarly, Damanpour and Scheneider (2006) recently looked at the effect of 14
multi-level factors on organisational innovation adoption in 1200 US public service
organisations - urbanisation, community wealth, population growth, unemployment
rate, complexity, size, economic health, unions, external communication, manager -
age, gender, education, tenure in position, and tenure in management. The authors
used regression analysis to look at how each factor contributed to organisational
innovation adoption. The authors found that while each dimension accounts for
unique variance in the adoption decision of innovation, organisational characteristics
and top managers’ attitudes toward innovation had the strongest influence compared
to environmental and top managers’ demographic characteristics.
However, even though these models incorporated different level variables they
only examined the relative contributions of each level to organisational innovation.
They did not examine the cross-level effects between the different levels of
variables. For instance, it is likely that the perceived risk level of an innovation
could also be influenced by the propensity of the CEO to take risks. This kind of
analysis was not examined in the above studies. In addition, little focus was given to
the role of strategic orientation in these models. Meyer and Goes (1988)
incorporated a single measure of aggressive marketing strategy within the contextual
part of their model, but this did not explain fully how general strategic orientation
affects innovativeness. In fact there seems to be no integrative model outlining how
a comprehensive general strategic orientation construct directly and indirectly
influences organisational innovativeness in the literature.
Other researchers have theoretically proposed multi-factor models of
organisational innovativeness, but have not empirically examined them (Crossan &
29
Apaydin, 2010; Frambach & Schillewaert, 2002; Taylor & McAdam, 2004). For
example, Taylor and McAdam (2004), Frambach and Schillewaert (2002) and
Crossan and Apaydin (2010) proposed different multi-dimensional frameworks,
based on reviews and/or meta-analyses of the literature, which were basically lists of
different types of factors, such as leadership, mission goals and strategy structure and
systems, business processes etc. that have been found in the past to empirically relate
to organisational innovation. However, there was very little synthesis of these factors
into more generic constructs and/or acknowledgement of any possible interactions
between them. A recent exception to this rule is a recently published innovation
adoption article by Unsworth, Sawang, Murray, Norman, and Sorbello (2012) where
the authors developed and tested a theoretically-based integrative framework of key
proximal factors (orientation, pressure, and control) that helped explain the effects of
more general factors (organisation’s strategy, structure and environment) on
intentions to adopt an innovation a year later.
However, the continual search and investigation into the multitude of different
factors and their contingency factors that affect organisational innovativeness is
becoming even more overwhelming and complicated as the innovation determinant
categories continue to expand (Crossan & Apaydin, 2010; Damanpour, 1996;
Walker, 2008). Researchers have recommended that organisational innovativeness
research look towards more generic factors that exemplify a combination of
innovation attributes and other contingency factors so that more parsimonious
models can be developed (Crossan & Apaydin, 2010; Damanpour, 1996; Walker,
2008). Moreover, these generic factors should be within management control
(Damanpour, 1996). Two management constructs which are generic and encompass

30
a number of innovation determinants characteristics are strategic orientation and
environmental scanning.
The next section reviews the strategic orientation and environmental scanning
literature and proposes two competing models on how they both influence
organisational innovativeness.
Strategic Orientation
Strategic orientation is the competitive actions or the overall orientation that an
organisation exhibits in the marketplace (Miles & Snow, 1978; Peng, Tan, & Tong,
2004; Spanos, Zaralis, & Lioukas, 2004; Venkatraman, 1989; Zheng, Yang, &
McLean, 2010). Given strategic orientation is usually at the heart of most
organisational decision-making it is not surprising that strategic orientation has been
linked to innovation adoption in the past. Firms that have been characterised as
having more proactive, risk taking and aggressive strategic orientations are more
likely adopt new products than firms characterised with conservative and defensive
type strategic orientations (Han, Kim, & Srivastava, 1998; Hurley & Hult, 1998;
Salavou, Baltas, & Lioukas, 2004; Srinivasan, Lilien, & Rangaswamy, 2002).
However, the majority of the research in this area uses strategic typologies (i.e.,
(Miles & Snow, 1978; Porter, 1980), which reduce the construct to a single
categorical variable and as a consequence only allows for inter group comparison
and descriptive analysis. In contrast, this thesis will use a more nuanced
measurement of strategic orientation, such as the Venkatraman’s (1989) comparative
six dimensions of strategic orientation: aggressiveness, analysis, defensiveness,
futurity, proactiveness, and riskiness. This multi-dimensional measurement allows

31
for a more complex analysis of the strategic orientation construct in relation to
environmental scanning and organisational innovativeness.
Strategic orientation and organisational innovativeness research.
A review of the literature reveals different conceptualisations of the strategic
orientation construct when researchers examine organisational innovation. One
approach is to utilise generic strategic typologies (Frambach, et al., 2003; Miller &
Friesen, 1982), while the other approach is to use specific and sometimes narrow
strategic orientation aspects (Han, et al., 1998; Srinivasan, et al., 2002). In addition,
the majority of the research only looks at the direct effects of strategic orientation on
innovation.
The strategic typology framework generally categorises organisations into a
singular strategic type. For example, Miller and Friesen (1982) categorised firms
into either conservative or entrepreneurial strategic types and argued that they
innovate differently in regards to product innovations. Entrepreneurial firms
naturally innovate in regards to product innovations; while conservative firms are
pushed into developing new products, usually by customer demand (Miller &
Friesen, 1982). Two well-known typology theories relating to strategy and
innovation are Miles and Snow (1978) and Porter (1980). Miles and Snow (1978)
propose that there are four strategic types that exist among organisations:
prospectors, analysers, defenders and reactors. These types differ on a wide range of
structural and strategic variables and degree of innovative activity. Prospectors are
proposed to operate in volatile environments, focus on the development of new
products and respond rapidly to new market opportunities. In contrast, defenders,

32
tend to operate in stable environments, focus on efficiency of operations, serve a
narrow market segment and tend to do little new product development. Analysers
focus on both product innovation and efficiency and are called the “middle of the
road” strategy. Reactors do not follow any consistent strategy and are deemed to be
the least effective of the four types (Hambrick, 1983). Similarly, Porter (1980)
proposes there are three types of competitive strategy that a firm may choose to
follow – cost leadership, differentiator or focus. A firm that follows a differentiation
strategy is more likely to be involved with new product activity than a firm that
follows a cost-leadership strategy. The main premise of the Miles and Snow (1978)
and Porter (1980) theories are that firms adopt product innovations for competitive
advantage (prospectors and differentiators) while other firms (defenders and cost
leadership firms) feel more comfortable solely focusing on efficiency and protecting
their current market domain.
The strength of the typologies is that they do measure a holistic construct of
strategic orientation in the organisation. However, a major limitation is that they do
not identify the underlying dimensions of the business strategy typology that
influence organisational innovativeness. They tend to only examine the differences
between groups and tend to ignore differences that may occur within groups (Speed,
1993). For instance, there may be more specific strategic mechanisms within the
conservative strategic type, such as risk aversion or analytical strategic dimensions,
which are influencing levels of organisational innovativeness, compared to other
conservative dimensions, such as defensiveness. Further not all firms fall neatly into
strategic types (Dess & Davis, 1984; Miller & Friesen, 1986), thus prompting the

33
suggestion that firm’s strategies may be better distinguished along one or more
continua (Fombrun & Ginsberg, 1990).
Moreover, empirical research on strategic typologies and innovation has
shown mixed results. There is evidence to support the proposition that Porter’s
(1980) differentiator firms and Miles and Snow’s (1978) Prospectors are more
product and service innovative than other categories in their respective typologies.
For example, Frambach et al. (2003) found that firms which were characterised as
having differentiation strategies were more likely to have significantly higher levels
of new product development compared to other firms that followed cost leadership
strategies. Shortell and Zajac (1990) utilising both self-typing and archival data
found that prospector hospitals were more likely to have the highest level of
diversified services and high technology services compared to analysers and
defenders. However, the empirical results for the proposed innovation activity
related to cost leadership and defender firms are not as straight forward. For
example, Zahra and Covin (1993) found that firms with cost leadership strategies
were significantly more likely to be related to both process and product innovation in
a sample of 103 manufacturing based firms1 when it was proposed that cost
leadership would only be related to process innovations. In addition, Shortell and
Zajac (1990) in their longitudinal study of the hospital industry (574 hospitals) found
that between the two data collections, all the hospitals studied increased their
diversification of services, but the greatest increase of services was for hospitals
following the defender strategic type. This suggests that most firms have the
potential to innovate and probably contain a mixture of different strategic
1 Please note that the other two Porter strategic types of differentiator or focus were not measured in
the Zahra & Covin (1993) study.

34
orientations at differing levels of strength to help them adapt to the environment.
Therefore, it is important to understand how a mix of different generic strategic
orientations influences organisational innovativeness.
In contrast to typologies, other researchers have utilised very narrow and
idiosyncratic aspects of the strategic orientation construct to look at its relationship
to organisational innovation (e.g., Han, et al., 1998; Hurley & Hult, 1998; Salavou,
et al., 2004; Srinivasan, et al., 2002). For example, Srinivasan, Lilien, and
Rangaswamy (2002) developed a business strategy construct called technological
opportunism, which describes firms that strategically look for and respond to new
technology. The authors then surveyed a cross industry sample of 183 executives
across six different industry groups to investigate the influence of technological
opportunism on the rate of radical technology adoption (particularly e-business). E-
business according to the author’s definition, ranged from simply using e-mail to
communicate within the organisation to developing entirely new business models
(Srinivasan, et al., 2002). The authors found that firms that demonstrated high levels
of technological opportunism strategy also indicated higher adoption levels of e-
business.
A limitation of this study is that the construct of strategic orientation,
technological opportunism, is one dimensional and directly relates to a strategy of
adopting radical technologies. For instance one of the items of the strategy self-
report measure is “We actively seek intelligence on technological changes in the
environment that are likely to affect our business”. Therefore it is not surprising that
the strategy construct is directly related to the adoption of radical technologies,

35
which is also a self-report measure with items such as “We have implemented e-
business in all of our business processes”.
Meanwhile, Salavou et al. (2004) conceptualised strategic orientation as the
three components of market, learning and technological orientations and examined
the effect of these components on general product innovativeness across 150 Greek
SMEs. Market orientation was defined as the extent to which a firm understands and
responds to customer needs, while learning orientation was defined as the extent to
which the firm emphasises and supports continual learning of its employees.
Technological orientation was viewed as the firm’s tendency to keep up to date with
the latest technologies and new product development. The results suggested that
firms with both market and learning orientations tended to be more innovative,
showing higher rates of product innovation than other companies. However, no
support was found for technological orientation influencing product innovation rates.
Again like the previous study the strategic orientation construct was very narrow and
specific. Whilst it is good to identify how specific business strategies influence
innovativeness, it does not shed any light onto how the general strategic orientation
of a firm influences innovativeness. Not all firms are market, learning and
technologically oriented, but may still be innovative due to other components of their
general strategic orientation.
In another study, the clarity of the firm’s strategic orientation and its
inclusion of technology plans were used to examine the effect of business strategy on
innovativeness. Souitaris (2001) in an exploratory study of 105 Greek
manufacturing SMEs, measured the degree to which business strategy was defined,
communicated to employees, incorporated new technology plans, and included short
term vs. long term planning. Souitaris (2001) found that only the inclusion of
36
technology plans in the business strategy positively influenced the number of
incremental and radical innovations adopted by an organisation over a 3-year period.
However the results of this study should be treated with caution as it was an
exploratory study and only used one-item measures for the constructs.
Finally, other innovation researchers have conceptualised strategic
orientation as market orientation (Han, et al., 1998; Hurley & Hult, 1998). Market
orientation is defined in the marketing literature as an organisation’s disposition to
deliver superior value to its customers continuously. Han et al. (1998) found in a
survey sample of 134 banks that market orientation facilitated organisation's
innovativeness (measured as both technical and administrative innovativeness). In
turn, organisational innovativeness positively influenced the organisation’s business
performance.
Overall, whilst strategic typologies and specific strategic orientations have
been examined in relation to the adoption of specific innovations, there has been
little examination of how a firm’s general strategic orientation, utilising multiple
generic dimensions, influences organisational innovativeness. Furthermore, the
majority of the above studies have only looked at the main effects of strategic
orientation on innovation. For instance, Srinivasan et al. (2002) looked at the direct
effect of technological opportunism on radical technology adoption rates while
Salavou et al. (2004) examined the direct effect of market orientation on product
innovation adoption rates. This results in a limited understanding of how strategic
orientation influences organisational innovation.
Therefore, an integrative theoretical framework needs to be developed to
outline how a multidimensional strategic orientation construct influences
organisational innovativeness and which can be applied in multiple settings. A

37
theoretical model would create a deeper level of understanding, promote integration
of research findings, and allow a framework for further research. This framework
will be presented in the next section.
The rest of this chapter is organised as follows. First, I discuss two types of
conceptual frameworks linking a firm’s strategic orientation to the nature and extent
of their environmental scanning and extent of organisational innovativeness. Next I
draw on these frameworks to formulate hypotheses relevant to the objectives of the
study.
Strategic Orientation of Business Enterprises (STROBE)
framework.
This thesis utilised Venkatraman’s (1989) multi-dimensional view of
strategic orientation, Strategic Orientation of Business Enterprises (STROBE)
framework (Bergeron, et al., 2004; Chan, et al., 1997; Morgan & Strong, 2003;
Sabherwal & Chan, 2001; Tan & Tan, 2005; Venkatraman, 1989). The STROBE
framework incorporates a much broader view of strategic orientation by including
both competitive and major decision-making postures in the framework. The
STROBE framework proposes that there are six common dimensions to strategic
orientation: analysis, futurity, defensiveness, aggressiveness, proactiveness, and
riskiness (Venkatraman, 1989). The STROBE framework has four main benefits
over the typologies. First, it increases the predictive power of the research as it
enables the identification of specific strategic dimensions that affect organisational
outcomes (Lukas, Tan, & Hult, 2001). Second, it allows comparison between
organisations on the varying dimensions and how the strength of the dimensions

38
affects organisational outcomes (Speed, 1993; Vijande, Perez, Gonzalez, &
Casielles, 2005). Third, it captures the complexity of the firm’s strategic orientation
- not many firms fit neatly into one strategic type as identified by Miller and Friesen
(1986). Fourth, it encompasses a much more comprehensive measurable distinct
view of strategic orientation than the firm simply being typed as a defender or
prospector. The STROBE includes both strategic decision-making and planning
capabilities, such as riskiness, analysis and futurity and also competitive postures
such as defensiveness, proactiveness, and aggressiveness (Venkatraman, 1989).
The STROBE framework has been found to be a predictor of a number of
organisational outcome variables, such as performance (Morgan & Strong, 2003),
information systems alignment (Sabherwal & Chan, 2001) and market orientation
(Morgan & Strong, 1998; Vijande, et al., 2005). Recently, Talke (2007) looked at a
firms’ strategic posture (using the STROBE framework) towards particular business
areas, such as the market and technology and new product performance in a sample
of 113 technical innovation projects from various industrial firms. The author found
that a pronounced analytical, proactive and aggressive, yet risk-averse strategic
posture towards market and technology was positively related to new product
performance.
Akman and Yilmaz (2008) examined the STROBE framework’s relationship
to organisational innovative capability in a sample of 156 Turkish software firms.
Innovative capability was conceptualised in this study as the support mechanisms
that occur within the organisation that facilitate innovation, such as having an
innovative organisational culture, sharing knowledge and co-ordinating knowledge
rapidly, employee encouragement, and understanding the capability of external

39
environment. The authors found that proactiveness, analysis, and futurity were all
positively related to innovative capability, while the other three dimensions of
aggressiveness, defensiveness, and riskiness were not. Proactiveness, also had the
strongest effect on innovative capability with a regression standardised beta value of
.391 compared to analysis (.192) and futurity (.117). A limitation of the Akman and
Yilmaz (2008) study is that the innovative capability measure was a perceptual self-
report Likert measure based on the organisation’s perceived innovative capability
and not on the actual number of different type of innovations the firm has actually
adopted over a period of time. Therefore it is still unknown if the STROBE strategic
orientation dimensions are actually linked to more organisational-wide innovation
adoptions over time.
The STROBE framework has not been empirically investigated in relation to
environmental scanning and organisational innovativeness. As previously stated it is
important to determine the factors that influence overall organisational
innovativeness due to the benefits innovation adoption brings to firms. The first aim
of this study is to empirically examine how the STROBE strategic orientation
dimensions of analysis, futurity, defensiveness, proactiveness, riskiness, and
aggressiveness influence overall organisational innovativeness. The STROBE
strategic orientation dimensions are further defined on pages 48 to 62 of this thesis.
The next section reviews the environmental scanning and strategic
orientation research (Hagen, et al., 2003; Hambrick, 1982; Jennings & Lumpkin,
1992; Miller, 1988; Raymond, Julien, et al., 2001; Subramanian, et al., 1993).

40
Environmental Scanning
Environmental scanning involves an organisation regularly scanning the
environment for information on customers, competitors, industry, and markets
(Davis, Marino, Aaron, & Tolbert, 2011; Jain, Sinha, Vitharana, & Mayer, 2011;
Xue, Shaheen, & Schubert, 2010). Environmental scanning potentially acts as a
feedback mechanism to the organisation on how it’s performing with customers, the
markets, within industry and against other competitors and can also help build
organisational knowledge and learning (Choo, 2001).
Firms also increasingly rely on external knowledge to aid innovation
adoption within the organisation. Walker (2008) found that English local authorities
who scanned more for information on their competitors, such as other local
authorities, were more likely to adopt performance management innovations
compared to other local authorities that did not scan. Nystrom et al. (2002) also
found that externally oriented hospitals (those that drove to continually understand
and respond to customer needs) were more likely to adopt imaging technology
innovations. Moreover, Ngamkroeckjoti and Speece (2008) found environmental
scanning to be positively correlated to improved new product performance in their
sample of 124 Thai firms. Finally, Miller and Friesen (1982) found, in their study of
52 diverse Canadian firms, that conservative firms who environmentally scanned
more for customer, competitor, industry, technology and industry information, were
more likely to adopt product innovations compared to other conservative firms
which did not scan regularly. Therefore on the basis of previous research it is
expected that environmental scanning would have a positive relationship with
organisational innovativeness.

41
Hypothesis 1: Environmental Scanning will be positively associated to
organisational innovativeness.
However, does merely scanning the environment lead directly to innovation
adoption or is somehow the firm’s strategic orientation also involved? The
relationship between environmental scanning, strategic orientation and
organisational innovativeness is still not very clear cut in the literature. According to
some researchers it is the strategic orientation that has been formulated after
environmental scanning was performed that influences innovation adoption
(Mintzberg, 1990). In contrast, other researchers’ propose it is the strategic
orientation of the firm that directs the frequency and intensity of environmental
scanning which in turn influences the firm’s innovation adoption levels (Hagen, et
al., 2003; Jennings & Lumpkin, 1992). The next section reviews the environmental
scanning and strategic orientation research and after this the remaining hypotheses of
the thesis are outlined.
Environmental scanning and strategic orientation research.
There are different viewpoints in the literature in regards to the directionality
of the strategic orientation and environmental scanning relationship (Beal, 2000;
Jennings & Lumpkin, 1992; Raymond, Julien, et al., 2001). Some scholars view
environmental scanning as the vital ingredient for strategic orientation formulation
(Lefebvre, et al., 1997) – whilst other scholars view strategic orientation as the factor
which influences the amount and type of environmental scanning that occurs
(Jennings & Lumpkin, 1992). Researchers in this field also tend to mostly use the
Porter (1980) or Miles and Snow (1978) strategic typologies when examining the

42
relationship between strategic orientation and environmental scanning (e.g. Jennings
& Lumpkin, 1992; Miller, 1989; Subramanian, Fernades & Harper, 1993; Lefbrve et
al., 1997; Beal, 2000; Hambrick, 1982).
First, some environmental scanning and strategy researchers are interested in
how environmental scanning influences strategic orientation and ultimately
organisational outcomes, such as innovation (Abebe, et al., 2010; Davis, et al., 2008;
McEwen, 2008; Miller, 1989). This view is mostly informed by the open systems,
design school and cultural theorists, who propose that organisations operate as open
systems that depend on environmental scanning for the formulation of strategic
orientation to adapt and prosper in a competitive environment (Mintzberg, 1990;
Yasai-Ardekani & Nystrom, 1996). Researchers of this viewpoint are interested in
how organisations scan the environment and use this information to develop
strategies that help the organisations to survive or prosper (Hagen, et al., 2003;
Hambrick, 1982; Miller, 1989).
For instance, early research by Hambrick (1982) empirically examined in a
cross-sectional descriptive study whether a relationship existed between
environmental scanning and strategy using Miles and Snow’s (1978) strategic
typology framework. Comparing the mean levels of environmental scanning across
the prospector and defender samples Hambrick (1982) did not find any significant
mean differences between them. Thus suggesting there was no relationship between
strategic type and level of environmental scanning. However, the sample size for
each strategic type sample was only approximately 30 organisations each. In
addition, the results could be due to the strategic typology not being sensitive or
43
discriminatory enough to pick up any subtle relationships between strategic
orientation and environmental scanning.
Moreover, Miller (1989) also examined the relationship between firms’
external information processing components and Porter’s (1980) generic strategies of
cost leadership, focus and differentiation. Miller (1989) in a cross-sectional study of
98 firms and using regression analyses found Porter’s differentiation strategy was
significantly related to firms’ information processing components while cost
leadership and focus strategic oriented firms were not. Miller (1989) concluded that
innovative differentiated strategic type firms relied more on information processing
and assertive strategy to build their strategy compared to the other strategic types.
However, please note that in the Miller (1989) study the environmental scanning
measure was consumed within a larger information processing construct and was not
used as a construct in its own right in the analysis.
Similarly, Tyler, Bettenhausen and Daft (1989) also attempted to examine
how environmental scanning builds strategic orientation in a small sample of 28
firms again using Porter’s (1980) strategic typologies of cost leadership and
differentiation. They came to the tentative conclusion that executives of the 28 firms
used more rich information sources in formulating differentiation strategies than in
formulating low-cost strategies (Tyler, Bettenhausen, & Daft, 1989). However, these
findings should be interpreted with caution due to the small sample size and the fact
that only two items were used to measure Porter’s (1980) generic strategies (Beal,
2000).
In a deviation from early design school researchers, Lefevbre et al. (1997)
used the STROBE framework to investigate the impact of environmental scanning
44
on strategy and technology policy. The authors found a significant relationship
between the level of environmental scanning, the STROBE dimensions and
technology policy using multiple regression analysis in their cross-sectional study of
86 Metal Industry CEOs from the metal industry. The authors concluded that a
strong futuristic strategic orientation mediated the relationship between
environmental scanning and technology policy. In otherwords, firms that frequently
and broadly scanned the environment were more likely to find information that led to
them develop a futurity strategic orientation, which in turn led to the development of
technology policy.
More recent research on the “Open Systems” environmental scanning and
strategy viewpoint has focused more on specific strategy types, such as market and
efficiency orientations (Davis et al., 2008) or the influence of Chief Executive
Network ties on the environmental scanning process (Abebe, et al., 2010). For
example, Davis et al (2008) found that broader scope of scanning is positively
related to both increased market-focused and efficiency strategic orientations in a
sample of 194 physical therapy facilities.
In summary the above studies took the Open Systems viewpoint in that
environmental scanning is utilised to help firms formulate strategic orientations to
deal with the environmental changes and challenges, and it is these responses which
make the firm survive and/or be successful (Yasai-Ardekani & Nystrom, 1996).
In contrast, other researchers, taking the Behavioural School perspective,
have examined how strategic orientation itself influences environmental scanning
(Gilbert & Reid, 2009; Jennings & Lumpkin, 1992; Ngamkroeckjoti, Mark, &
Nicholas, 2005; Ngamkroeckjoti & Speece, 2008; Raymond, Julien, et al., 2001) For

45
example, Jennings and Lumpkin (1992) were the first to deviate from the Open
Systems viewpoint of environmental scanning influencing strategy. They examined
the relationship between strategy and focus of environmental scanning in their cross-
sectional study of 44 savings and loans firms using Poster’s generic strategic
typologies of cost leadership and differentiation. Utilising correlational and
MANOVA/MANCOVA analyses they argued that banks with a differentiation
strategy emphasised importance on scanning for opportunities and customer
attitudes, whereas banks with a cost leadership strategy emphasised competitive
threats and tracked policies and tactics of competitors. Jennings and Lumpkin
(1992) concluded that firms with different strategic orientations were more likely to
focus on different environmental scanning aspects – differentiation strategic oriented
firms focused on customer needs and opportunities leading to more innovation while
cost leadership strategic firms focused on threats and competitors. Jennings and
Lumpkin (1992) proposed that different strategic orientations focus more on
different aspects of the environment when scanning because that is what executives
in these firms feel most comfortable doing. This deviated from the Open Systems
viewpoint because it proposed that it was the strategic orientation that influenced
environmental scanning and not vice versa. In other words, firms environmentally
scan to reinforce their strategic orientation and not to adapt to the environment like
the Open Systems proposes. Although it should be noted that Jennings and Lumpkin
(1992) stated that their study did not confirm causality between the two constructs in
the direction that they proposed.
Similarly, Hagen et al. (2003) also found, in their cross-sectional study of 58
CEOs from the banking industry, that firms with a cost leadership strategy were

46
more likely to focus on environmentally scanning for threats, while firms with a
differentiation strategy were more likely to focus on information concerning
opportunities. Kumar et al. (2001) also found that hospitals with a differentiation
strategy emphasised their environmental scanning activities on opportunities, while
hospitals with a cost leadership strategy focused on searching and evaluating
information about threats in their cross-sectional study of 159 Hospital CEOs.
Other researchers have focused more on the influence of strategic orientation
on the intensity and type of scanning systems utilised. Subramanian, Fernandes, and
Harper (1993) in their one-off survey study on 68 manufacturing firms, found that
prospectors used the most advanced scanning systems, followed by analysers and
then defenders. Defender firms were more likely to utilise ad hoc scanning systems
than the other strategic types. Raymond et al. (2001) also found that prospectors
used more intense scanning activities than defenders in their survey study of 324
small sized Canadian manufacturing firms. Subramanian et al. (1993) argued that
the prospector’s strategic orientation makes it imperative for them to keep on top of
the new product knowledge, the opening up of new markets, and actions of
competitors hence the more advanced scanning systems
Recent research of the “behavioural viewpoint” has focused more on how
technology strategy, impacts on the frequency of environmental scanning and
ultimately new product development (Ngamkroeckjoti, et al., 2005; Ngamkroeckjoti
& Speece, 2008). Interestingly Ngamkroeckjoti and Speece (2008) found that
technology strategy did not have much impact on the frequency of environmental
scanning that the firm used.

47
Whilst the majority of the above studies examined the influence of strategic
orientation on the type of environmental scanning that occurred rather than the
frequency they still imply that strategic orientation is the main that factor influences
environmental scanning not vice versa. However, an issue with all the above studies
on environmental scanning and strategic orientation is that even though the studies
provide evidence for a relationship between the two factors they do not provide
evidence for the directionality of this relationship. Thus, even if there is a very
strong association between certain types of strategic orientation and environmental
scanning one cannot assume that only one variable causes the other. For instance,
you could also equally argue based on the empirical evidence that firms that have
sophisticated environmental scanning systems and scan broadly also have the
capacity to demonstrate prospector strategic typologies. Thus environmental
scanning could be influencing strategic orientation or vice versa or there may be a
reciprocal relationship between the two constructs. In addition, most studies, with
the exception of Levefbre et al. (1997), only look at the relationship between strategy
and environmental scanning. They do not include other organisational outcome
variable of innovativeness – therefore it is hard to know how all three factors
empirically relate to each other.
Therefore this thesis attempts to extend current research by using the
STROBE framework to examine the directional relationship between strategic
orientation and environmental scanning in relation to influencing organisational
innovativeness (Hagen, et al., 2003; Lefebvre, et al., 1997). This is important as it
will help to identify the relationship that most directly influences organisational
innovativeness. In otherwords, what is the most influential factor when it comes to
48
increasing innovation? Is it the environmental scanning to strategic orientation
relationship or the strategic orientation to environmental scanning relationship? The
following section outlines hypotheses that propose the relationships between
environmental scanning, organisational innovativeness and the STROBE dimensions
of proactiveness, analysis, futurity, aggressiveness, riskiness and defensiveness.
Then two competing directional models will be proposed to investigate the two types
of relationships that may exist between environmental scanning and strategic
orientation in relation to innovativeness.
Hypotheses
The next section proposes the relationships that the Venkatraman’s (1989)
Strategic Orientation of Business Enterprises (STROBE) framework dimensions will
have with the environmental scanning and organisational innovativeness constructs.
The STROBE framework incorporates a much broader view of strategic orientation
– incorporating both competitive and major decision-making postures into the
framework. The STROBE framework proposes that there are six common
dimensions to strategic orientation: proactiveness, analysis, futurity, riskiness,
aggressiveness and defensiveness (Venkatraman, 1989).
Proactiveness.
The proactiveness strategic orientation focuses on the continuous search for
market opportunities, experimentation with potential responses to changing
environmental trends, seeking new opportunities which may or may not be related to
the present line of operations and the introduction of new products and brands ahead

49
of the competition (Venkatraman, 1989; Miles & Snow, 1978). The proactiveness
strategic orientation dimension follows a proactive pursuit of new products and new
markets (Morgan & Strong, 2003). The proactiveness strategic orientation is similar
to the Prospector (Miles & Snow, 1978) and Differentiator strategic types (Porter,
1980).
A firm that emphasises proactiveness strategic orientation is also expected to
environmentally scan for information on markets, industry, customers, competitors,
and new technology (Talke, 2007). Firms with a proactiveness strategic orientation
need to be continuously on the lookout for new market and innovation opportunities
(Gilbert & Reid, 2009). Also the effectiveness of a proactiveness strategic
orientation depends on their innovations being adopted by the marketplace and their
own organisation, thus they need a thorough understanding of customer needs,
current products available, competitors practices and mood of the marketplace. In
fact firms characterised with prospector strategic orientations have already been
empirically linked to advanced scanning systems (Subramanian, et al., 1993), to scan
widely and intensely (Raymond et al., 2001), and to scan for opportunities rather
than threats (Jennings & Lumpkin, 1992; Miller, 1989). Therefore based on the
above assertions the following hypothesis for the current study is proposed:
Hypothesis 2a: Proactiveness strategic orientation dimension will be
positively associated to environmental scanning.
It is also proposed that there will be a positive relationship between the
proactiveness strategic orientation dimension and organisational innovativeness.

50
Firms that have high levels of proactiveness strategic orientation aim to be the first to
market with new products and employ cutting new technology and ideas within the
organisation (Gatignon & Xuereb, 1997; Slater & Narver, 1993). Forms high on the
proactiveness strategic orientation dimension are more prone to naturally generating
innovative ideas, which do not rely on the formal external input from customers,
competitors, market, industry and existing new technology (Miller & Friesen, 1982).
In addition, successful management of innovation across the organisation requires a
high level of proactive posture in relation to the market, technology, customer needs
and competitor actions (Talke, 2007).
Past research lends support to these propositions. Frambach et al. (2003)
found in a sample of 175 Dutch firms with a differentiator strategic focus had a
positive significant direct influence on a firm’s new product activity in addition to its
indirect effect via customer orientation (focus on overt and latent customer needs).
Also numerous research links the Prospector strategic type firms directly to a wide
range of organisational innovation, such as diversified hospital services and high
technology services, new information technologies, flexible work practices, modern
organisational structures and human resource management, and advanced preventive
natural environmental approaches (Aragon-Correa, 1998; Aragón-Sánchez &
Sánchez-Marín, 2005; Shortell & Zajac, 1990).
Finally, the proactiveness strategic orientation dimension was recently found
positively linked to a firm’s innovative capability in a sample of 158 firms from the
Turkish software industry (Akman & Yilmaz, 2008). Moreover, the proactiveness
strategic orientation dimension was found via regression analyses to be the strongest
predictor of organisational innovative capability when compared to the other

51
STROBE strategic orientation dimensions (Akman & Yilmaz, 2008). Innovative
capability was measured in the study as a 5-point perceptual Likert scale, which
asked respondents to rate their organisations innovative capability in regards to
organisational culture, resources, market orientation, employees, customers,
suppliers, products and processes. Therefore it is proposed in this thesis research
that:
Hypothesis 2b: Proactiveness strategic orientation dimension will be
positively associated to organisational innovativeness.
Analysis.
The analysis strategic orientation dimension refers to the overall problem solving
posture of an organisation and its extent or tendency to search deeper for the roots of
problems and to generate the best possible solution alternatives (Akman & Yilmaz,
2008; Morgan & Strong, 2003; Talke, 2007). It also relates to the
comprehensiveness trait conceptualised and measured as part of the Strategic
Management process by Frederickson (Frederickson, 1984). Analysis strategic
orientation relates to how comprehensively an organisation analyses information in
regards to making decisions or to understand current issues. An analysis strategic
orientation dimension would make good use of management information and control
systems (such electronic record management systems, performance appraisals and
payroll software systems) embedded in the organisation or commission a search for
information not readily available (Morgan & Strong, 2003). Finally, analysis
strategic orientation dimension also refers to a firms knowledge building capacity,

52
information storage and enabling processes for organisational learning to secure
further competitive advantage (Morgan & Strong, 2003; Talke, 2007).
Firms with low analysis strategic orientation dimension would rely on a few
senior managers to make hunches on key decisions based on their intuitions about
the situation. There are no detailed project analyses or methodical consideration of
alternatives. Also, only a relatively small number of factors or opinions are taken
into account when making decisions.
In contrast, firms with high analysis strategic orientation dimensions, decision-
making becomes much more analytical, more multiplex, more integrated. Things are
not decided by the hunches of a few leaders, but by the deliberations and discussions
of several managers and teams. There is an analytical, reflective and participative
approach to decision-making. It is common for task forces and project teams to be
formed to analyse major capital expenditure, innovations or acquisitions. Groups of
experts come together to analyse problems and evaluate different solution
alternatives in a systematic and scientific way. In addition, highly analytical firms
would make use of integrated information capturing systems, such as PERT, capital
budgeting, and action planning techniques (Miller & Friesen, 1984). Thus firms
with high levels of analysis strategic orientation are more likely to devote a large
amount of resources and time allocated to gathering information and researching
organisational functions, decisions or issues (Venkatraman, 1989).
Therefore, one can also expect a positive relationship between analysis strategic
orientation dimension and environmental scanning. Firms high in the analytical
strategic orientation dimension are more likely to gather information from the
environment on customers, markets, competitor actions, industry developments and

53
new technology in an attempt to understand issues, make decisions or build
knowledge. Morgan and Strong (1998) and Vijande et al. (2005) found positive
relationships between the STROBE analysis strategic orientation dimension and the
market orientation of a firm – defined as the extent to which a firm understands and
responds to customer needs. Part of the market orientation process involves the
systematic gathering of information on customers, competitors and other related
areas (Morgan & Strong, 1998). Therefore this study expects a strong positive
relationship between the analysis strategic orientation, environmental scanning and
organisational innovativeness.
It is expected that the analysis strategic orientation will be positively related
to organisational innovativeness. Frambach (1993) argues that the higher the
information absorption capacity of an organisation, which is congruous to high
analytical properties, the more receptive it will be to innovations. In other words the
more an organisation has the analytical processes and structures in place to support
and internally store and share large amounts of information regarding innovation
ideas or opportunities; the more likely they are to adopt innovations. For successful
management of innovation an analytical posture towards market and technology is
imperative (Morgan & Strong, 2003). For instance, it reduces management anxiety in
implementing the innovation and also helps document and make transparent the
processes surrounding the innovation adoption and implementation. Talke (2007)
argued that systematically pursuing analytical activities like collecting information
from different sources and interpreting them to allow application to the organisation
have been found to be critical to firm performance. Recently, Akman and Yilmaz

54
(2008) found the analysis strategic orientation dimension was significantly positively
linked to a firm’s innovative capability in 156 Turkish software forms.
Therefore, based on the previous research, I expect the analysis strategic
orientation to be positively related to both environmental scanning and
organisational innovativeness.
Hypothesis 3a: Analysis strategic orientation dimension will be positively
associated to environmental scanning.
Hypothesis 3b: Analysis strategic orientation dimension will be positively
associated to organisational innovativeness.
Futurity.
The futurity strategic orientation dimensions reflects an organisation’s emphasis
on longer term considerations (effectiveness) compared to short-term applied ones
(efficiency) (Akman & Yilmaz, 2008). Thus, the futurity strategic orientation would
focus on planning for the future, research and development, forecasting sales and
customer preferences, forecasting key indicators of operations and formal tracking of
environmental and significant trends (Venkatraman, 1989). Research has suggested
that firms that exhibit long term planning outperform their competitors that do not
exhibit these traits of futurity (Morgan & Strong, 2003). Due to the increasing
nature of environmental change in competitive, industry, market and customer
influences a long term strategic vision is imperative for organisations these days
(Akman & Yilmaz, 2008; Morgan & Strong, 1998; Morgan & Strong, 2003).

55
Thus, a futurity strategic orientation dimension would require a strong focus on
environmental scanning for external information on customers, competitors, market,
industry and new technology to help build the firm’s long term strategic plans. Past
research supports this proposition. Lefebvre et al. (1997) found the futurity strategic
orientation to be significantly positively related to environmental scanning for
customer, competitor market, industry, and new technology information in their
sample of 84 CEOs from small manufacturing enterprises (SMEs). Morgan and
Strong (1998) and Vijande et al. (2005) also found futurity to be significantly related
to market orientation – which partly involves the systematic gathering and sharing of
information regarding present and potential customers and competitors as well as
other related constituencies. Thus, it is expected in this current study that the futurity
strategic orientation will be significantly positively related to environmental
scanning.
Moreover, this study proposes that the futurity strategic orientation
dimension will also be positively related to organisational innovativeness. Future-
oriented firms are more likely to have access to research evidence that outlines the
long term benefits of innovations. In addition, future-oriented firm are more likely
to be concerned with change (i.e., future desired state) and therefore innovation
(Miller & Friesen, 1982). In addition, future oriented firms are more likely to have
the planning techniques in place to help incorporate innovations into the organisation
long term. Moreover, future-oriented firms are able to argue and show support for
the introduction of innovations into the organisation through their long-term
evidence (via R&D) and planning techniques. Finally, looking forward to the future
may also help organisations identify opportunities for innovation and allow longer

56
lead in and preparation time to also implement them (Morgan & Strong, 2003).
There is some empirical support for a relationship between futurity and
organisational innovation. Lefevbre et al. (1997) found a significant direct
relationship between futurity and technology policy in a sample of 86 metal sector
firms in Canada. Akman and Yilmaz (2008) also found the futurity strategic
orientation dimension to be significantly related to innovative capability, as
measured by a 5-point Likert perceptual scale, in a sample of 156 Turkish software
firms.
Hypothesis 4a: Futurity strategic orientation dimension will be positively
associated to environmental scanning.
Hypothesis 4b: Futurity strategic orientation dimension will be positively
associated to organisational innovativeness.
Riskiness.
Venkatraman (1989) describes the riskiness strategic orientation dimension
as one that “captures the extent of riskiness reflected in various resource allocation
decisions as well as choice of products and markets” (p.949). He further argues that
“while risk-taking has been generally treated as an individual trait (e.g., at the level
of CEO), it is viewed here as an organisational level trait construct, similar to the
view adopted by Miller and Friesen (1984)” (p.949). Thus, firms with high riskiness
strategic orientations may approve operations or new projects that are categorized as
high risk on a blanket approval basis rather than a stage by stage basis. Furthermore
organisations with a high riskiness strategic orientation may support projects where
the expected returns are uncertain, and where operations have generally not followed

57
the tried and true paths (Venkatraman, 1989). Overall, the riskiness strategic
orientation dimension refers more to intuitive organisational decision-making rather
than analytical organisational decision-making (Talke, 2007).
The current thesis research expects that the riskiness strategic orientation
dimension will be not be related to environmental scanning (Morgan & Strong,
2003; Talke, 2007). Riskiness inherently means “taking a chance on something
without overanalysing it”. Thus one expects the riskiness strategic orientation will
be unrelated to extensive scanning for external information about customers,
competitors, markets, industry and new technology (Talke, 2007). Previous research
shows some support this contention. A study of 272 Spanish medium to large
manufacturing firms by Vijande et al. (2005) found that the riskiness strategic
orientation dimension was not significantly related to a firm’s tendency to collect
information on customers’ needs and competitors actions (market orientation). In
other words the riskiness strategic orientation dimension does not rely, by its very
nature, on external information to be enacted. However please note that decision
making on the basis of incomplete information does not imply the required
information necessarily exists, or that the organisation has not sought the necessary
information (Talke, 2007). However it is expected that firms that strongly emphasise
the riskiness strategic orientation dimension are also unlikely to be frequently
environmentally scanning for information as well. Thus, current thesis research
expects that the riskiness strategic orientation dimension will not be related to
regular environmental scanning.
This study does, however, propose a significant positive relationship between
the riskiness strategic orientation dimension and organisational innovativeness.

58
Innovations by their very nature are inherently risky because they are new and have
not been proven before in the organisation (Akman & Yilmaz, 2008; Dess &
Lumpkin, 2005). Previous research suggests a link between organisational risk-
taking and organisation innovation (Nystrom, et al., 2002; Tabak & Barr, 1999). For
instance, Nystrom et al. (2002) found in a sample of 70 hospitals that larger-sized
organisations with high levels of risk orientation were more likely to adopt multiple
medical imaging innovations over time compared to other larger-sized organisations
with low levels of riskiness strategic orientation. In addition, Tabak and Barr (1999)
also found that the risk propensities of managers positively influenced their
intentions to adopt technological innovations in small community hospitals.
In contrast, Akman and Yilmaz (2008) found a positive correlational
relationship between riskiness strategic orientation dimension and innovative
capability in their sample of 156 Turkish software firms. However, when futurity,
analysis and proactiveness were controlled for in a regression analysis, the effect of
riskiness strategic orientation dimension on innovative capability became non-
significant. The authors concluded that organisations that continually analyse the
environment for customer needs and competitor actions and plan for the future
makes them prepared for opportunities and threats, thus negating the need to make
risky decisions in regards to innovations. Nevertheless as this is only one study and
the innovative capability measure was a perceptual self-rating innovation scale (not
actual innovations that have been adopted) more research is needed to further
investigate the effects of riskiness strategic orientation dimension on overall
organisational innovativeness.

59
Thus in sum, based on the above discussion, this thesis research proposes that
the riskiness strategic orientation dimension will be significantly related to
organisational innovativeness.
Hypothesis 5a: Riskiness strategic orientation dimension will be
significantly related to organisational innovativeness.
Aggressiveness.
Venkatraman (1989) defines the aggressiveness strategic orientation as “the
posture adopted by a business in its allocation of resources for improving market
conditions at a relatively faster rate than the competitors in its chosen market”
(p.948). Aggressive tactics include rapid multiplying of the business outlets, cutting
prices of products, setting prices below competition and taking over other
competitive businesses in the shared market (Akman & Yilmaz, 2008; Talke, 2007;
Venkatraman, 1989; Vijande, et al., 2005).
There is mixed evidence to suggest whether or not the aggressiveness
strategic orientation is related to environmental scanning. Morgan and Strong (1998)
found that aggressiveness was weakly negatively related to market orientation,
which is an organisation’s emphasis on current and potential customer needs and
provides services and products to meet these needs. However, Vijande et al. (2005)
found a positive relationship between aggressiveness and market orientation. The
authors argued that a firm’s emphasis on a market orientation – that is pleasing
customers now and into the future – also stimulates the firm’s aggressiveness
strategic orientation – that is willing to improve their market position and to beat
their competition. However, I propose that aggressiveness strategic orientation will

60
not be significantly related to scanning frequently for customer, competitor, market,
industry and new technology information. Firms with strong aggressive strategic
orientations are more likely to focus only on competitor actions so as to know where
to position themselves in the market and to cost-cut short-term.
Furthermore, it is expected that the aggressive strategic orientations
dimension will not be related to organisational innovativeness in terms of developing
new products or acquiring other types of organisational innovations (Akman &
Yilmaz, 2008; Morgan & Strong, 2003). Akman and Yilmaz (2008) found the
aggressiveness strategic orientation dimension not to be significantly related to
innovative capability in a survey study of 156 Turkish software firms. Morgan and
Strong (2003) also proposed that firms which emphasise strong aggressiveness
strategic orientations are more concerned with short-term outcomes such as rapidly
gaining market share through cost cutting and acquiring new businesses rather than
long-term organisational innovativeness. Consequently, the current thesis research
proposes that aggressiveness strategic orientation dimension will not be significantly
related to environmental scanning or organisational innovativeness.
Defensiveness.
The defensiveness strategic dimension is based on the Miles and Snow (1978)
Defender strategic type (Venkatraman, 1989). Basically the defensiveness strategic
orientation dimension is more likely to focus on cost reduction (cost focus),
efficiency seeking methods (efficiency), core technology (core technology) and
preservation of one’s products, markets and technologies (domain defense) rather
than innovation and technology (Conant, Mokwa, & Varadarajan, 1990; Morgan &

61
Strong, 2003; Snow & Hrebiniak, 1980). Defensiveness strategic orientation
dimensions are about protecting their market domain, keeping the status quo and
only innovating if required or forced to (Morgan & Strong, 2003).
The defensiveness strategic orientation dimension is likely to be non-
significantly related to environmentally scanning (Subramanian, et al., 1993). Firms
with defensive strategic orientations are unlikely to be regularly scanning the
environment for information on customer needs, competitor actions, markets, new
technology or new products. For instance, Subramanian et al. (1993) found in a
sample of 68 manufacturing firms, that those firms characterised as defenders had ad
hoc scanning systems in place and the least advanced scanning systems when
compared against prospectors and analysers. Miller (1989) also found a non-
significant relationship between environmental scanning and Porter’s (1980) cost
leadership construct (which is similar to the defensiveness strategic orientation) in a
sample of 98 firms of varied industry backgrounds. Thus, the current study expects a
non-significant relationship between defensiveness and environmental scanning.
The defensiveness strategic orientation dimension also focuses on keeping costs
low and keeping production efficient, thus they are unlikely to continually adopt
innovations across the organisation. Shortell and Zajac (1990) found in a sample of
400 organisations in the hospital industry that firms characterised as Defenders had
the lowest level of innovation in terms of diversified services and low technology
services, compared to firms characterised as prospectors and analysers. Aragón-
Sánchez and Sánchez-Marín (2005) also found in a sample of 1,351 Spanish SMEs
that the relationship between defenders and organisational innovation was low.
Defenders, when compared to prospectors and analysers, made less use of

62
information technologies, were less likely to implement flexible business practices,
were less developed organisationally, and were less concerned about human resource
management. Furthermore, Akman and Yilmaz (2008) found the defensiveness
strategic orientation dimension to not be significantly related to innovative capability
in a sample of 156 Spanish software firms. Thus, in sum it is proposed that the
defensiveness strategic orientation dimension will not be significantly related to
environmental scanning and organisational innovativeness.
Summary.
In summary, it is proposed that the relationships between environmental
scanning, the STROBE dimensions and organisational innovativeness will differ
according to the type of STROBE dimension. Environmental scanning will be
significantly related to proactiveness, analysis, and futurity but not significantly
related to aggressiveness, riskiness, and defensiveness. Moreover, it is proposed that
environmental scanning, proactiveness, analysis, futurity, riskiness will be
significantly related to organisational innovativeness, while defensiveness and
aggressiveness will be not significantly related to organisational innovativeness. The
directionality of these relationships will be tested by using path analysis to assess the
two conceptual models.
Conceptual Framework of Competing Models
Despite there being evidence that there is a relationship between strategic
orientation and environmental scanning, the directionality of this relationship is still

63
unclear (Davis, et al., 2011). To further investigate the directionality of the
relationship this thesis drew on established organisational theories and research
paradigms (Jennings & Lumpkin, 1992; Miller, 1989). The first theoretical paradigm
the Behavioural view considers organisational processes and resources as
consequences of the strategic orientation traits (Frambach, et al., 2003; Mintzberg,
1990; Talke, 2007). This paradigm proposes that once strategic orientation is
determined this in turn influences the level of environmental scanning, which then
leads to increased organisational innovativeness
In contrast the second organisational theoretical paradigm – Open Systems -
views organisations that value external knowledge and are flexible and adaptable to
the environment (Kast & Rosenzweig, 1972; Schneider & Somers, 2006). This
theoretical paradigm suggests that the organisation would utilise environmental
scanning first, which would then inform the choice of strategic orientation and then
organisational innovativeness. Drawing on the two conceptual frameworks
mentioned above and the strategic orientation, and environmental scanning literature,
I developed two competing conceptual frameworks that I will compare and contrast
against each to examine the relative strengths of the directional paths to
organisational innovativeness using path analysis.
Behavioural conceptual framework.
The first conceptual framework follows the behavioural view of strategic
orientation and posits of three main links: (i) the direct link between strategic
orientation and organisational innovativeness, (ii) the influence of strategic

64
orientation on environmental scanning, (iii) the influence of environmental scanning
on organisational innovativeness.
Figure 1. Conceptual Model 1 – Behavioural Model
Conceptual framework for the influence of strategic orientation on environmental
screening and organisational innovativeness
This conceptual framework proposes that strategic orientation influences
organisational innovativeness via the mechanism of environmental scanning. This
model proposes that the choice of strategic orientation influences the levels of
environmental scanning, which in turn influences the levels of organisational
innovativeness. Thus, this model proposes that environmental scanning mediates the
relationship between strategic orientation and organisational innovativeness.
Specifically, it is proposed that:
Hypothesis 6a: Environmental Scanning mediates the effect of proactiveness
strategic orientation dimension on organisational innovativeness.
Hypothesis 6b: Environmental Scanning mediates the effect of analysis
strategic orientation dimension on organisational innovativeness.
Environmental Scanning
Strategic Orientation (STROBE) - Defensiveness - Analysis - Futurity - Proactiveness - Riskiness -Aggressiveness
Organisational
Innovativeness

65
Hypothesis 6c: Environmental Scanning mediates the effect of futurity
strategic orientation dimension on organisational innovativeness.

66
Open Systems conceptual framework.
The second conceptual framework follows the Open Systems viewpoint and
consists of three main links; (i) the influence of environmental scanning on strategic
orientation, (ii) the influence of innovation champion on strategic orientation and the
(iii) the direct influence of strategic orientation on organisational innovativeness.
Figure 2. Conceptual Model 2 - Open Systems model
Conceptual Framework for the influence of environmental screening on strategic
orientation and organisational innovativeness
This conceptual framework proposes that environmental scanning influences
the levels of strategic orientation dimensions, which in turn influences organisational
innovativeness. Thus, this model proposes that strategic orientation mediates the
relationship between environmental scanning and organisational innovativeness.
Specifically, it is proposed that:
Hypothesis 7a: Proactiveness strategic orientation dimension mediates the
effect of environmental scanning on organisational innovativeness.
Environmental
Scanning Organisational
Innovativeness
Strategic Orientation (STROBE) - Defensiveness - Analysis - Futurity - Proactiveness - Riskiness -Aggressiveness

67
Hypothesis 7b: Analysis strategic orientation dimension mediates the effect
of environmental scanning on organisational innovativeness.
Hypothesis 7c: Futurity strategic orientation dimension mediates the effect of
environmental scanning on organisational innovativeness.
In the next chapter I discuss the method employed to test these competing
models and hypotheses. In chapter 3 I present the results of my study. Finally, in
chapter 4 I discuss the implications of the findings, the limitations of my study and
provide recommendations for future research.
Chapter 2 - Method
Innovation Study
The current study was part of a wider ARC Linkage research project
(LP0455129) on organisational innovation. My individual contribution to the project
team involved the development of a unique theoretical model outlining the effects of
strategic orientation and environmental scanning on organisational innovativeness.
In addition, I contributed to project methodological ideas, sourced my own measures
and conducted my own data collection and analysis, under the guidance of the Chief
Investigators (CIs).
The Innovation Project team, however, collaboratively together developed and
administrated the major Innovation Survey, which was mailed out to a number of
different manufacturing organisations across Australia and was addressed to the
Managing Director or equivalent to fill out. The main goal of the Innovation Survey
was to assess the current state of innovative activities in industrial type firms across
Australia – the majority being manufacturing based firms. Included within this
survey were measurement scales that I sourced from the research literature, such as
the STROBE framework and environmental scanning, to measure the variables of
interest for the current thesis research study. Along with the scales I sourced, the
survey also contained standard questions about the organisation (number of
employees (size), age, industry type, revenue), and other innovation related questions
of interest to the other researchers (i.e., innovation implementation). See Appendix
A for a copy of the survey. Participants were also asked if they wanted to participate
in any further research relating to the project. To reward participants for filling the
69
survey out, respondents were sent a benchmarking report that outlined the
company’s innovation levels against the other survey respondents.
Sample
The organisational sample for the Innovation survey was sourced from the
Queensland Manufacturing Institute (QMI) Solutions client data-base. The clients
were Australian based firms who had contacted QMI solutions in the past three years
about purchasing new technologies and work practices, such as enterprise resource
planning, lean product development and re-designing factory layouts, for
implementation into their workplace. Eight hundred and sixty-four (864)
organisational names and addresses were extracted from the QMI client database.
The firms’ names and addresses were checked for accuracy via the internet and/or
phone directories, where possible, before the surveys were mailed out. A survey
package containing a cover letter - outlining information about the innovation
project, a consent form and innovation survey was sent to the Managing Director
and/or equivalent at the nominated addresses. On receipt of the survey package, the
Managing Director and/or other senior management were asked to complete and
return the survey. Due to the nature of QMI Solutions marketing strategy, the
Australian firms were mainly based in Queensland and Victoria.
To increase the response rate a number of mechanisms were utilised. First,
participants were told about incentives (such as benchmarking reports and an
invitation to a workshop on innovation performance measurement) if they completed
and returned the survey. Second, a cover letter from a QMI Solutions Senior
Executive emphasising the importance of the innovation survey was also included
70
with the paper survey. Third, a web based Innovation survey was developed and this
web address was included in the Innovation Survey Cover letter. Fourth, a reminder
letter and follow up paper survey were mailed out 4 week after the initial mailing.
Finally, a follow up telephone survey was also conducted 2 weeks after the
remainder letter was sent out. All of the follow up surveys were targeted at
participants from the original 864 organisational contacts who had not responded.
Therefore due to the sample recruitment method it should be noted that the
sample is limited to manufacturing organisations already seeking information about
innovation, not manufacturing organisations in general.

71
Participants.
Overall, out of the 864 industry contacts, 117 usable surveys were returned or
completed, which resulted in a 14% response rate. This response rate is comparable
to other organisational research response rates of approximately 10% (Blumentritt &
Danis, 2006). For example, Blumentritt and Danis (2006) received 244 usable
survey responses from a mailing of 2,200 surveys to multiple organisations (a
response rate of 11.1%).
The characteristics of the final sample are outlined in Table 1 below. The
majority of organisations in the sample were from a manufacturing background
(57%), contained less than 200 employees (84%), had gross revenue between “0 to
10 million dollars” (55%), and were aged between 11 and 25 years (44%). Based on
comparison with ABS (2005-06) data there is a small underrepresentation of small to
medium sized firms in the current sample, while income and age could not be
directly compared due to non-comparable measurement type and non-reporting of
data. In general, the Australian Bureau of Statistics (2005-06), reports that at the
time of the survey, 99% of Australian manufacturing firms were small to medium
sized firms (1-200 employees) while 1% were larger sized firms (more than 200
employees) based on those businesses that employed staff (ABS, 2005-06). In
addition, the ABS (2005-06) reported a mean (average) total income of 6 million
dollars for those small to large sized manufacturing firms. However, no data on the
average age of manufacturing businesses was reported in the ABS (2005-06)
Australian Industry report.
Furthermore, it was not possible to compare the respondents’ organisational
characteristics with the non-respondents’ characteristics as only the address details of

72
the firms were available from the QMI database mailing list. In addition, information
on the organisational characteristics of the firms contained in the mailing list was
also not publicly available at the time.
Table 1 Organisational characteristics of the Sample
Category Frequency (n)
N = 117
Frequency
(%)
Industry
Manufacturing 67 57%
Automative Industry 9 8%
Design Consultancy 7 6%
Construction 3 3%
Mechanical Engineering 3 3%
Other 25 21%
Missing 3 3%
Size (Employee N)
Less than 20 employees 36 31%
20-50 employees 34 29%
51-100 employees 19 16%
101-200 employees 9 8%
201-500 employees 5 4%
501-1000 employees 4 3%
More than 1000 employees 8 7%
Missing 2 2%
Gross revenue of business
$0-5M 47 40%
$5-10M 17 15%

73
Category Frequency (n)
N = 117
Frequency
(%)
$10-50M 29 25%
$50-200M 9 8%
$200-500M 5 4%
More than $500M 3 3%
Missing 7 6%
Age of business
11 to 25 years 51 44%
26 to 40 years 16 14%
41 to 70 years 15 13%
6 to 10 years 14 12%
Up to 5 years 8 7%
Missing 7 6%
More than 70 years 6 5%
Survey Measures
This section outlines and describes the measurement scales from the Innovation
Survey that were developed and utilised for the current study. The measures were
developed from ones currently available in the literature. The measures were pilot
tested on selected academics from the QUT School of Management and executives
from QMI, who were asked to complete the survey and to provide feedback on
clarity, applicability and contextual relevance of the items. The majority of the
scales asked respondents to indicate their response on a 5-point Likert-type scale
(e.g., 1=Not at all, 5= A great deal). A copy of the full survey is provided in
Appendix A.

74
Environmental Scanning. Environmental scanning is defined as the extent
to which formal scanning devices, such as market and customer research, are used by
the organisation to gather information about the external environment (Miller &
Friesen, 1982). A 4-item measure developed by Miller and Friesen (1982) was used
to measure environmental scanning. Respondents were asked indicate on a 5-point
scale to what extent their organisation used the following environmental scanning
practices. The items were “Routine gathering of opinions from customers”;
“Explicit tracking the policies and tactics of competitors; ‘Forecasting sales,
customer preferences, technology etc,’; ‘Special market research studies’. The
Cronbach Alpha reported for the 4-item scale in the past has been .74 (Miller &
Friesen, 1982).
Strategic Orientation. Strategic Orientation is defined as the actions a
business takes to compete effectively in their chosen industry (Hofer & Schendel,
1978). Venkatraman’s (1989) strategic orientation of business enterprises (STROBE)
was used to measure strategic orientation in the current study. It views strategic
orientation as containing six key dimensions of aggressiveness, analysis,
defensiveness, futurity, proactiveness and riskiness. Each of these dimensions were
measured with 4-item constructs using direct or modified items from Venkatraman’s
(1989) STROBE measure or other sources (Gudmmundson, Hartman, & Tower,
1999; Litwin & Stringer, 1968; Sabherwal & Chan, 2001). Thus, there was a total
24 items for the strategic orientation measure. The preface to all of the items (except
for the riskiness dimension) was ‘Relative to other organisations in your industry, to
what extent does your organisation emphasise’. Respondents indicated their answers
on a 5-point scale from 1 -“Not at all” to 5-“A great deal”.

75
Aggressiveness. The 4 items for this dimension were taken directly from the
Venkatraman’s (1989) STROBE measure. An example item is “Price-cutting to
increase market share”. The internal consistency reliability index reported for this
measure is .68 (Venkatraman, 1989).
Defensiveness. The 4 items for this business strategy dimension were taken
from three sources, although the items were all based on the STROBE construct of
defensiveness (Gudmmundson et al., 1999; Sabherwal & Chan, 2001; Venkatraman,
1989). An example item for this dimension is “Continual improvement of operating
efficiency”. A recent internal consistency reliability index reported for this construct
measure was .72 (Sabherwal & Chan, 2001).
Analysis. Respondents completed four items for this measure. Three items
were taken from a derived STROBE measure (Sabherwal & Chan, 2001) and were
“Being number oriented and analytical in your operations”; “Using detailed, factual
information to support day to day decision making”; “Comprehensive analysis of
business opportunities”. One item was directly taken from the Venkatraman (1989)
STROBE measure and was “Use of planning techniques”.
Futurity. The 4 items for this dimension were taken directly from the
Venkatraman’s (1989) STROBE measure. The items for futurity were ‘Basic
research to provide the organisation with a future competitive edge”; “Long term
considerations when making budget allocations”; Formal tracking of significant
general trends”; “Forecasting key indicators of operations”.
Proactiveness. Four items were utilised to measure this construct. Two items
for this were taken from a derived STROBE measure, “Adopting innovations early”
and Increasing capacity (i.e., preparing to handle a greater volume of business)

76
before competitors do the same” (Sabherwal & Chan, 2001). The other two items
were taken directly from the original Venkatraman (1989) STROBE measure;
“Being the first ones to introduce new products or services to the market” and
“Constantly seeking new opportunities related to the present operations. The internal
consistency reliability index reported for this construct is .71 (Sabherwal & Chan,
2001).
Riskiness. The 4-items for the riskiness orientation measure were taken from
the Litwin and Stringer’s (1968) risk orientation scale. Respondents were asked how
much they agreed with the items on a 5-point scale ranging from 1 – ‘Not at all’ to 5
– ‘A great deal’. The items were “The philosophy of our management is that in the
long run we get ahead playing it slow, safe and sure” (R-reversed scored); “Our
business has been built up by taking calculated risks at the right time”; “Decision
making is here is too cautious for maximum effectiveness” (R-reversed scored);
“Our management is willing to take a chance on a good idea”.
Organisational Innovativeness. Organisational Innovativeness is
conceptualised in this study as the number of different organisational-wide
innovations that an organisation has adopted in the past three years measured using a
self-report multi-dimensional construct developed by Totterdell, Leach, Birdi, Clegg,
and Wall (2002). The Totterdall et al (2002) measure is very similar to the Oslo
manual’s (OECD, 2005) three broad categories of innovation: (1) product/service
innovation; (2) process innovation; and (3) organisational innovation. The current
thesis research is interested in identifying how strategic and scanning determinants
relate to a wide range of different types of innovations hence the broad definition of
innovativeness. Totterdell et al (2002) also chose the three year time period to

77
ensure that innovations were fresh within respondents’ minds, recent, and also
contemporary (Totterdell et al., 2002).
The current innovation researchers also added the following preamble to the
innovation measure to ensure that participants were clear about the innovation
survey definitions:
Innovation as a technology or practice than an organisation is using for the
first time, regardless of whether other organisations have previously used
the technology or practice”
Innovation adoption is an organisation’s decision to install an innovation
within the organisation. Adoption is a decision point, a plan or a
purchase.
Implementation as the stage following adoption: the transition period
during which organisational members ideally become increasingly skilful,
consistent, and committed to their use of an innovation.
Introduction of innovation as including both the adoption and
implementation of an innovation
Respondents were then given a list of categories of standard organisational
wide innovations, based on Totterdell et al’s (2002) innovation measure and also the
Oslo manual (OECD, 1997) innovation classifications and were asked to identify, by
ticking a circle next to the category, which ones they had introduced (and how many)
in the past 3 years. It was also highlighted to respondents that the “innovation did
not need to be successful to be counted” as the current research is interested mostly
in the organisation’s decision point of adopting innovations not the long term use of
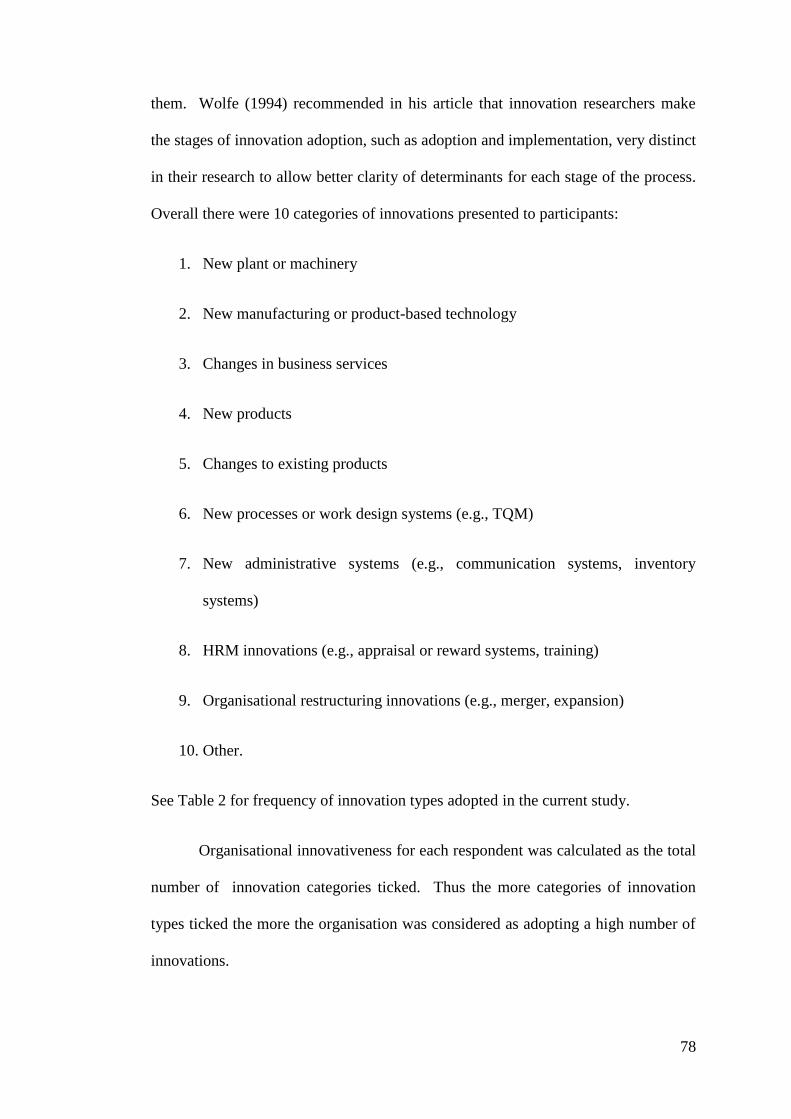
78
them. Wolfe (1994) recommended in his article that innovation researchers make
the stages of innovation adoption, such as adoption and implementation, very distinct
in their research to allow better clarity of determinants for each stage of the process.
Overall there were 10 categories of innovations presented to participants:
1. New plant or machinery
2. New manufacturing or product-based technology
3. Changes in business services
4. New products
5. Changes to existing products
6. New processes or work design systems (e.g., TQM)
7. New administrative systems (e.g., communication systems, inventory
systems)
8. HRM innovations (e.g., appraisal or reward systems, training)
9. Organisational restructuring innovations (e.g., merger, expansion)
10. Other.
See Table 2 for frequency of innovation types adopted in the current study.
Organisational innovativeness for each respondent was calculated as the total
number of innovation categories ticked. Thus the more categories of innovation
types ticked the more the organisation was considered as adopting a high number of
innovations.
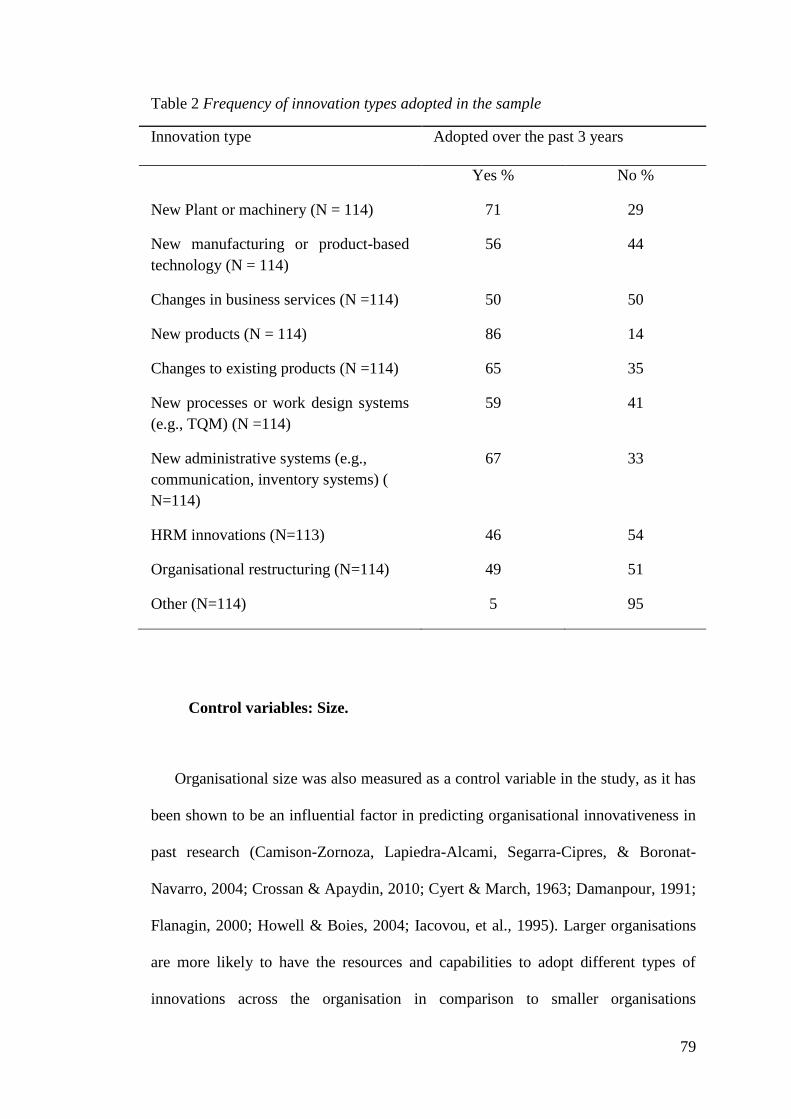
79
Table 2 Frequency of innovation types adopted in the sample
Innovation type Adopted over the past 3 years
Yes % No %
New Plant or machinery (N = 114) 71 29
New manufacturing or product-based
technology (N = 114)
56 44
Changes in business services (N =114) 50 50
New products (N = 114) 86 14
Changes to existing products (N =114) 65 35
New processes or work design systems
(e.g., TQM) (N =114)
59 41
New administrative systems (e.g.,
communication, inventory systems) (
N=114)
67 33
HRM innovations (N=113) 46 54
Organisational restructuring (N=114) 49 51
Other (N=114) 5 95
Control variables: Size.
Organisational size was also measured as a control variable in the study, as it has
been shown to be an influential factor in predicting organisational innovativeness in
past research (Camison-Zornoza, Lapiedra-Alcami, Segarra-Cipres, & Boronat-
Navarro, 2004; Crossan & Apaydin, 2010; Cyert & March, 1963; Damanpour, 1991;
Flanagin, 2000; Howell & Boies, 2004; Iacovou, et al., 1995). Larger organisations
are more likely to have the resources and capabilities to adopt different types of
innovations across the organisation in comparison to smaller organisations

80
(Camison-Zornoza, et al., 2004; Damanpour, 1992). Size was operationalised by the
number of employees in the organisation. Survey respondents were asked to indicate
from 7 categories, ranging from “Less than 20” (1) to “More than 1000” (7), the
number of employees in their organisation.

81
Chapter 3 - Results
Data Analysis Overview
The data was analysed using SPSS and AMOS to tabulate data, and explore
relationships between the variables. The first section reports the preliminary data
inspection and testing of assumptions. The second section reports the mediation
analysis between the strategic dimensions, environmental scanning and
organisational innovativeness used to test the two proposed competing models.
Data Screening
Data screening was conducted through SPSS prior to analysis for data entry
errors, assumptions of multivariate analysis and linearity, and number and type of
missing data.
Univariate outliers. The data was screened for the presence of univariate
outliers. Cases with standardised scores on variables in excess of 3.29 are
considered to be potential outliers (Tabachnick & Fidell, 1996). After conversion of
all item scores into z scores it was found that none exceeded 3.29, therefore no
univariate outliers were detected.
Multivariate outliers. Next the data was screened for multivariate outliers
using Mahalanobis distance for each case (Tabachnick & Fidell, 1996). None of the
Mahalanobis distances computed for each of the 117 cases exceeded the nominated
value of 39.252 from the Chi-square table, suggesting no multivariate outliers.
Missing data analysis. Of the 117 cases, a small percentage of data was
missing at random (See Table 3). As a consequence, the maximum likelihood

82
(ML) method was used to compute and insert missing variables. The maximum
likelihood method is an effective and commonly used technique to replace random
missing variables due to its ability to maximise the likelihood that imputed estimated
values are as close as possible to the observed values (Allison, 2002). SPSS was
used to perform the replacement of missing values via the ML method using the
estimation maximisation imputation function. This new dataset with all the missing
values replaced was then used in the subsequent descriptive and SEM analyses.
Table 3 Number and percentage of missing cases for each variable
Variable N % Missing No. missing
Size 116 0.85 1
Strategic Dimensions
Analysis 117 0 0
Proactiveness 114 2.56 3
Aggressiveness 114 2.56 3
Riskiness 114 2.56 3
Environmental Scanning 113 3.42 4
Organisational Innovativeness 113 3.42 4
Psychometric Inspection of Measurement Scales
In addition to screening the data, it is also important to make sure that the
scale measures are themselves reliable and valid, and comply with the statistical
assumptions underlying multi-variate analysis.

83
Categorical variables.
Control variable – size. For data analysis purposes, size was dummy
coded into (0) for organisations with less than 200 employees and (1) for
organisations with more than 200 employees (See Table 4).
Table 4 Recode of Size
Variable Frequency (n) Frequency (%)
Size
Less than 200 employees (SMEs) (0) 115 86.5
More than 200 employees (Large) (1) 18 13.5
Continuous variables.
The continuous variables of interest in the current analysis were the STROBE
strategic orientations (aggressiveness, defensiveness, analysis, futurity, proactiveness
and riskiness), and environmental scanning. To test the reliability and validity of
these measures two main statistical tests were carried out. First, an Exploratory
Factor Analyses (EFA) was conducted on the six strategic orientation dimension
measures to determine if the proposed items loaded onto their respective factors. An
exploratory factor analysis was conducted instead of a confirmatory factor analysis
as the STROBE measure still requires further investigation for unidimensionality as
the measure has only been used in a handful studies in recent times (Bergeron, et al.,
2004; Morgan & Strong, 2003). Second, the internal reliabilities for all the measures
were calculated using Cronbach’s alpha.

84
Factor structure of the STROBE dimensions. A series of principal
components factor analyses using oblimin rotations were conducted to
determine if the six strategic orientation measures of aggressiveness,
defensiveness, analysis, riskiness, proactiveness, and futurity were separate
dimensions from each other.
Preliminary Exploratory Factor Analysis (EFA). The initial exploratory
factor analysis of the 24 strategic orientation items produced a 7 factor solution,
explaining 67% of the variance. An inspection of the rotated component matrix
revealed that some of the strategic orientation items did not load neatly onto different
factors. A number of items loaded across several factors at once; specifically they
had loadings of greater than .4 on several factors. For instance, items 11 and 12
which represent futurity items, loaded with other analysis strategic items (items 13-
16) onto one factor. On the otherhand, the defensive strategic items (items 1 to 4)
loaded across several factors at once. Based on the instability of the factor solution,
a decision was made to discard some of the strategic orientation items/dimensions
and to conduct a second factor analysis in order to improve the factor structure. A
result of this decision meant that the strategic orientation dimensions of
defensiveness and futurity were discarded because the items they contained were
considered too unstable, in that the items (e.g., futurity items) either loaded across
two different factors or across several factors at once (e.g., defensive items).
Final Exploratory Factor Analysis. The second factor analysis included the
4 analysis items, 2 riskiness items, 4 aggressiveness items and 3 proactiveness items.
This time a 4-factor solution, explaining 69% of the variance was produced. This
factor analysis resulted in a simple structure with the items loading on their theorised
strategic orientation dimensions. See Table 5 for the factor structure and loadings.

85
Table 5 Factor loadings based on a principle components analysis with Varimax
rotation for the STROBE dimensions (N = 117)
Analysis Proactive Aggressive Riskiness
Using detailed, factual
information to support day to
day decision-making
.831
Being number-oriented and
analytical in operations .805
Comprehensive analysis of
business operations or
challenges
.800
Use of planning techniques .792
Adopting innovations early .906
Being the first ones to
introduce new products and/or
services to the market
.866
Constantly seeking new
opportunities related to
present operations
.788
Price cutting to increase
market share .823
Gaining market-share at the
expense of cash flow and
profitability
.781
Setting prices below that of
competition .700
Sacrificing current
profitability to gain market
share
.700
Decision making here is too
cautious for maximum
effectiveness (R)
.825
The philosophy of our m'ment
is that in the long run we get .816

86
Analysis Proactive Aggressive Riskiness
ahead playing it slow, safe
and sure (R)
Note. Factor loadings < .3 are suppressed
Summary of measurement inspection.
Given the instability demonstrated in the factor solution, it was decided to
remove both the futurity and defensiveness dimensions from further analysis in order
to insure the uni-dimensionality of the strategic orientation construct.
Descriptive statistics.
The means, standard deviations (SD), inter-correlations and Cronbach alphas
for all of the study’s measures are depicted in Table 6. The Cronbach alpha’s values
for the variables of aggressiveness, proactiveness, environmental scanning and
analysis ranged from .76 to .85 indicating “acceptable to good” internal reliability
levels (Nunnally, 1978). The riskiness strategic orientation dimension and
organisational innovativeness variables were moderately reliable with Cronbach
alpha values of .63 to .65 respectively (Fitzpatrick, 1993). The majority of the
variables’ skewness and kurtosis values were also within the range of normality,
except for the dummy coded organisational size, which was slightly positively
skewed (Tabachnick & Fidell, 1996). However the psychometric tests that are used
in this thesis, such as correlation and SEM are very robust concerning skewed
variables (Howell, 2009).
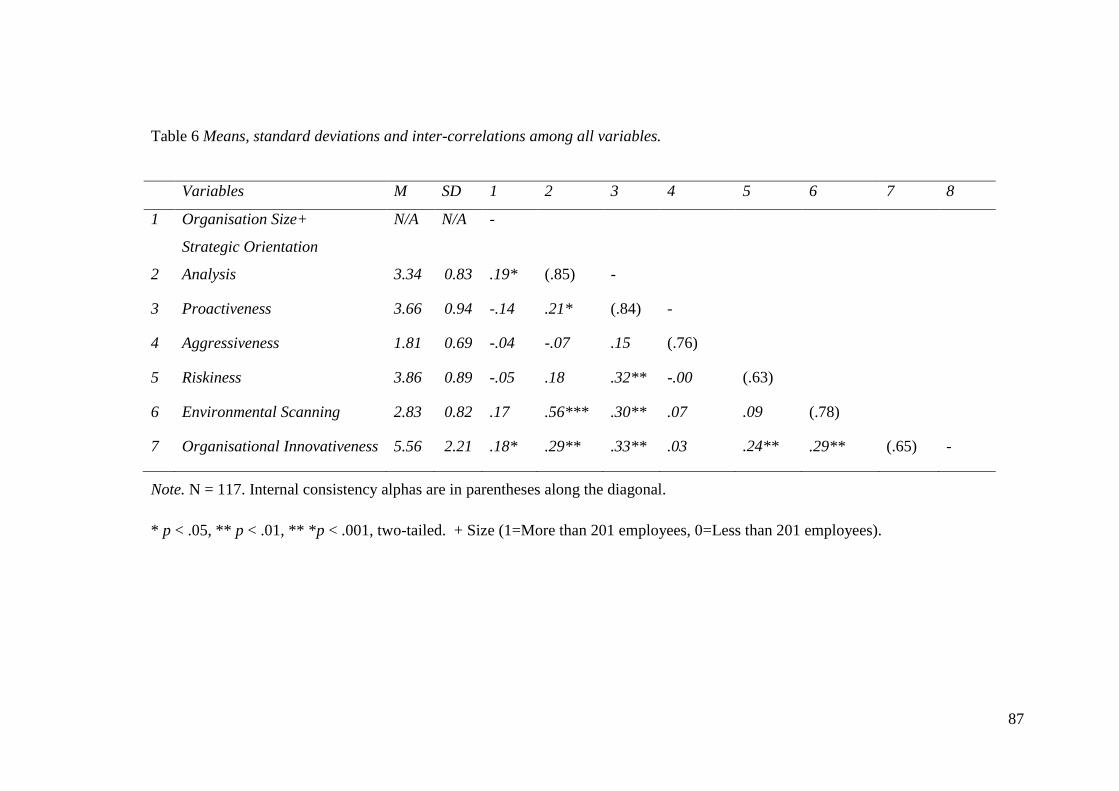
87
Table 6 Means, standard deviations and inter-correlations among all variables.
Note. N = 117. Internal consistency alphas are in parentheses along the diagonal.
* p < .05, ** p < .01, ** *p < .001, two-tailed. + Size (1=More than 201 employees, 0=Less than 201 employees).
Variables M SD 1 2 3 4 5 6 7 8
1 Organisation Size+ N/A N/A -
Strategic Orientation
2 Analysis 3.34 0.83 .19* (.85) -
3 Proactiveness 3.66 0.94 -.14 .21* (.84) -
4 Aggressiveness 1.81 0.69 -.04 -.07 .15 (.76)
5 Riskiness 3.86 0.89 -.05 .18 .32** -.00 (.63)
6 Environmental Scanning 2.83 0.82 .17 .56*** .30** .07 .09 (.78)
7 Organisational Innovativeness 5.56 2.21 .18* .29** .33** .03 .24** .29** (.65) -

88
First, in terms of relationships amongst the strategic orientation dimensions,
the proactiveness strategic orientation dimension was significantly positively related
to both the analysis (r = .21, p < .05) and riskiness (r = .32, p < .01) strategic
orientation dimensions.
Second, environmental scanning was significantly positively correlated to
both the analysis (r = .56, p < .001) and proactiveness (r = .30, p < .01) strategic
orientation dimensions.
Third, organisational innovativeness was significantly positively correlated
with environmental scanning (r = .29, p < .01) and the proactiveness (r = .33, p <
.01), riskiness (r = .24, p < .01), and analysis (r = .30, p < .01) strategic orientation
dimensions.
Finally, in regards to the control variable, size was significantly positively
correlated with both the analysis strategic orientation (r = .19, p < .05) and
organisational innovativeness (r = .18, p < .05).
The next section examines more closely the hypothesised mediated
relationships between analysis, proactiveness, environmental scanning and
organisational innovativeness.
Testing of Two Competing Models using Path Analysis
Models overview.
This study compared and contrasted two competing models that outline
different directions of causality between environmental scanning and strategic

89
orientation and investigate how these two different “directional” paths influence
overall organisational innovativeness. The first model – Model 1 – Behavioural
Model - proposes that strategic orientation influences environmental scanning and
environmental scanning in turn influences organisational innovativeness. The
second model – Model 2 - Open Systems model proposes that environmental
scanning influences the firms’ strategic orientation and strategic orientation in turn
influences the level of organisational innovativeness.
Path analysis.
To test the two competing theoretical models, path analysis, via the Statistical
Software Package of AMOS, was used, as it allows greater flexibility in
measurement design, in terms of examining multiple relationships between one or
more IVs (continuous or discrete) and one or more DVs (continuous or discrete)
(Cheng, 2001; Ullman, 1996). In addition, SEM also offers other benefits, such as
computing the goodness of fit of the model, significance testing of the path
coefficients, and control of measurement error (Hoyle & Smith, 1994). Please note
that due to the small sample size of 117 for the current study, only the path models
were tested in AMOS.
In line with Anderson and Gerbing’s (1988) and Kelloway’s (1995)
recommendations for testing for mediation effects, a fully mediated model and a
partially mediated model were compared for each hypothesised model. After the
mediation effects were tested within each model, the finalised competing structural
Models 1 – Behavioural Mode and 2 - Open Systems model were compared and

90
contrasted using the final overall fit, predictive power and the significance of paths
for each model.
A number of commonly used fit indices were used to assess the adequacy of
models and their fit to the data in the subsequent path analyses. A model can be
considered to have adequate fit if most or all fit indices are acceptable. These fit
indices were the chi-square fit (CMIN), Chi-square/d.f, Tucker-Lewis Index (TLI:
Bentler & Bonett, 1980), Comparative Fit Index (CFI: Bentler, 1990), Goodness-of-
Fit index (GFI: Tanaka & Huba, 1984), and the Root Mean Square Error of
Approximation (RMSEA: Browne & Cudeck, 1993). The chi-square test examines
the differences between the obtained covariance matrix and the predicted covariance
matrix. A significant chi-square indicates that the predicted data are different from
the obtained data and the model should be rejected. The chi-square is a useful
statistic in comparing nested models (James, Mulaik, & Brett, 1982). The sensitivity
of the chi-square statistic to sample size can be reduced by dividing it by the degrees
of freedom (chi-square/d.f). A chi-square/d.f ratio of less than 3 is indicative of
acceptable fit (Kline, 1998). Values for the TLI, CFI and GFI can range from zero to
1.00, with values close to 1.00 indicative of a good fit. Scores higher than .90 are
considered representative of a good-fitting model (Hu & Bentler, 1995; Jaccard &
Wan, 1996; Kline, 1998). In contrast, an RMSEA value of .08 or less is indicative of
adequate fitting model (Dilalla, 2000; Jaccard & Wan, 1996).

91
Step 1 - Testing for full and/or partial mediation effects within each
model.
Model 1 – Behavioural model – strategic orientation to environmental
scanning to organisational innovativeness.
The full mediating Model 1 – Behavioural Model - strategic orientation to
environmental scanning to organisational innovativeness - is depicted in Figure 32.
This model had overall poor fit with the obtained covariance matrix (χ² = 17.21, df =
4, p <.001, TLI = .59, CFI = .84, RMSEA = .17). All the paths were significant in
the predicted direction except for the path between size and proactiveness.
The next step involved examining if partially mediating relationships
improved model fit with the data by including additional paths in the model. First a
path from size to organisational innovativeness was added. Second paths from
analysis and proactiveness to organisational innovativeness were also added. The
partially mediated model had excellent fit with the obtained covariance matrix (χ² =
1.79, df = 1, p>.05, TLI = .90, CFI = .99, RMSEA = .08). The addition of these
paths led to a significant improvement of fit (χ² diff=15.42, p < .005). However, only
the added paths from size to organisational innovativeness and from proactiveness to
organisational innovativeness were significant. Interestingly, the path from
environmental scanning to organisational innovativeness became non-significant
once the direct paths from the other independent variables (size and proactiveness) to
2 Please note that the riskiness strategic orientation dimension was not included in the final full
mediating model as it was not part of the mediation hypotheses and moreover, earlier direct model
path analyses indicated that the path relationship between riskiness and innovativeness became
insignificant after controlling for the analysis and proactiveness strategic orientation dimensions (see
Table 7).

92
organisational innovativeness were added. Even though this model showed an
excellent fit with the data it was felt that a more parsimonious model could be
developed through removing some of the non-significant paths in the model. In
addition, removing some of these non-significant paths could help make the
mediated relationships much clearer. These steps are outlined next.
Final revised Model 1. Given that the partially mediated model fitted the
data better than the original fully mediated theorised model, it was decided to
examine whether a revised model based on the original framework could help
improve its explanatory power and parsimony. I was primarily concerned with
theoretical issue of mediation and therefore interested in model revision that would
provide a clearer understanding of mediation by environmental scanning. The model
revision process is discussed next.

93
Figure 3 Fully mediated Model 1 -
Behavioural Model
Organisational
Innovativeness
Proactiveness
Size
Analysis
Environmental
Scanning

94
First the non-significant path between size and proactiveness was removed.
The non-significant chi-squared difference test after this deletion indicated that the
removal of this path did not significantly impact the model’s degree of overall fit.
Second, it was theorised that there may be direct effects on organisational
innovativeness above and beyond those mediated by the environmental scanning
variable. Thus, the addition of the paths from size to organisational innovativeness
and from proactiveness to organisational innovativeness was included. After the
additional paths were added, the model had adequate overall fit (χ² = 5.85, df = 3,
p>.05, TLI = .88, CFI = .97, RMSEA = .09) and was accepted as the final path
model.
Figure 4 presents this model with standardised path coefficients. All
individual paths were statistically significant in the predicted direction. As shown in
Figure 4 and indicated by the Squared values of the path coefficient (SMR), size and
proactiveness accounted for 11% of the variance in analysis and proactiveness and
analysis accounted for 36% of the variance in environmental scanning. Finally,
environmental scanning and proactiveness accounted for 20% of the variance in
organisational innovativeness.

95
Figure 4 Final Model 1- Behavioural Model
Final revised Model 1. Please note: +p < .10, *p <
.05, ** p < .01, ** *p < .001, two-tailed.
Organisational
Innovativeness SMR =.20
Proactiveness
Size Analysis SMR =.11
Environmental
Scanning SMR =.36
.19*
.22*
.30**
.23* .16+
.52**
*
.19*

96
Summary of direct and mediated relationships. Direct and indirect effects
were examined and tested for significance using the Bootstrap estimation procedure
in AMOS. The total effect of one variable on another is the sum of its direct and
indirect effects. A direct effect is the unmediated effect of one variable on another.
Finally, an indirect effect assesses the impact of one variable on another as that
variable’s influence works through one or more intervening/mediating variables
(Hoyle & Kenny, 1999). Table 8 displays each of the direct and indirect effects and
their associated 95% confidence intervals of the final revised model. Each of the
hypotheses will be discussed in relation to the results presented in both Tables 7 and
8.
Direct relationships.
Hypothesis 1: As predicted, environmental scanning was found to have a
weak significant direct relationship with organisational innovativeness (β = .16, p
<.10), thus hypothesis 1 was supported. See Table 8.
Hypotheses 2a-2b: roactiveness was found to have a significant direct
relationship with environmental scanning (β = .19, p < .01), and organisational
innovativeness (β = .31, p <.01) as predicted. Thus hypotheses 2a and 2b were
supported. See Table 8.
Hypotheses 3a-3b: As shown in Table 8, analysis was significantly directly
related to environmental scanning as hypothesised (β = .52, p < .01) in hypothesis
3b. Analysis was found not to have a significant direct relationship with
organisational innovativeness, thus hypothesis 3a was not supported in this model.

97
This effect was fully indirect (see indirect relationships below). Analysis also was
found to have a significant positive relationship with proactiveness (β = .23, p< .05).
Hypotheses 5a: As shown in Table 7, riskiness was found not to be
significantly related to organisational innovativeness, after controlling for the other
strategic orientation dimensions of analysis and proactiveness (β = .13, p > .10).
Thus hypothesis 5a was not supported.
Control variable: size.
Organisational size was found to have significant direct relationships with
analysis (β = .22, p < .05), and organisational innovativeness (β = .19, p < 05). Size
was not found to be significantly directly related to proactiveness. Size was also not
found to be directly significantly related to environmental scanning. This effect was
indirect (see mediated relationships below). See Table 8.
Mediated relationships (Indirect).
Hypothesis 6a: Proactiveness was found to have a significant indirect effect
(β = .05, p < .05) on organisational innovativeness via environmental scanning as
displayed in Table 8. Thus hypothesis 6a was supported.
Hypothesis 6b: As predicted the indirect effect of analysis on organisational
innovativeness via environmental scanning was found to be significant (β = .08, p <
.05). Thus hypothesis 6b was supported. Please see Table 8.

98
Control variable: size.
As can be seen in Table 8, size was found to exert indirect effects on
environmental scanning via analysis (β = .12, p < .01). Other relationships were also
revealed in Table 8. Analysis was found to mediate the relationship between size
and environmental scanning. Proactiveness was also found to have significant
indirect effects on environmental scanning via analysis (β = .12, p< .05). Analysis
was also found to mediate the relationship between proactiveness and environmental
scanning. Proactiveness was found not to mediate the relationship between size and
organisational innovativeness.
Summary of direct and indirect effects for Model 1
The strategic orientation dimensions of analysis and proactiveness were
found to have small indirect effects on organisational innovativeness via
environmental scanning. However, the proactiveness strategic orientation dimension
was found to have a much stronger direct effect on organisational innovativeness
compared to the indirect one via environmental scanning. This suggests that the
proactiveness strategic orientation is a much stronger direct predictor of
organisational innovativeness compared to its indirect effects via environmental
scanning. However, the analysis strategic orientation effect on organisational
innovativeness was found to be fully mediated by environmental scanning. Finally,
organisational size was also found to have a direct effect on organisational
innovativeness and also an indirect effect via analysis and environmental scanning.
The implications of these findings are discussed more in the discussion chapter.

99
Table 7 Model 1 fit indices and standardised path coefficients
Measures Direct Model Full
(Indirect)
Partial
(Saturated Model)
Final
(Revised)
Fit Indices
Chi-squared 17.97** 17.21*** 1.79 5.85
df 5 4 1 3
Chi-squared/df 3.59 4.30 1.79 1.95
TLI .97 .59 .90 .88
CFI .86 .84 .99 .97
GFI .95 .95 .99 .98
RMSEA .15 .17 .08 .09
Direct Effects on Organisational Innovativeness
Size .20* (.025) .18* (.038) .19* (.021)
Analysis .17+ (.054) .14 (.169)
Proactiveness .28** (.001) .30*** (.000) .31*** (.000)
Riskiness .13 (.111)
Environmental
Scanning
.29** (.001) .09 (.412) .16+ (.073)
Direct Effects on Environmental Scanning
Analysis .52*** (.000) .52*** (.000) .52*** (.000) .52*** (.000)
Proactiveness .19* (.011) .19* (.011) .19* (.011) .19* (.011)
Direct Effects on Proactiveness

100
Measures Direct Model Full
(Indirect)
Partial
(Saturated Model)
Final
(Revised)
Size -.14 (.140) -.14 (.140) -.14 (.140)
Direct Effects on Analysis
Size .23* (.012) .23* (.012) .23* (.012) .22* (.011)
Proactiveness .24** (.008) .24** (.008) .24** (.008) .23** (.008)
Direct Effects on Riskiness
Size -.05 (.624)
Please note: +p < .10, *p < .05, ** p < .01, ** *p < .001, two-tailed. The p values
are in the parenthesis next to the standardised path coefficients.

101
Table 8 Standardised total, direct and indirect effects and 95% confidence levels for final Model 1
Model Pathways Estimated Effect 95% Confidence Intervals
Lower Bounds Upper Bounds
Total Effects
size - analysis .22** (.010) .09 .35
size - proactiveness - - -
size – environmental scanning .12** (.007) .05 .20
size-organisational innovativeness .21** (.009) .08 .33
proactiveness - analysis .23* (.029) .07 .39
proactiveness-environmental scanning .32** (.001) .16 .44
proactiveness-organisational innovatveness .36**(.002) .18 .49
analysis-environmental scanning .52** (.001) .39 .63
analysis-organisational innovativeness .08* (.046) .02 .17
Environmental scanning -innovativeness .16+ (.056) .02 .30

102
Model Pathways Estimated Effect 95% Confidence Intervals
Lower Bounds Upper Bounds
Direct effects
size - analysis .22* (.010) .09 .35
size - proactiveness - - -
size – environmental scanning - - -
size-organisational innovativeness .19* (.012) .07 .32
proactiveness - analysis .23* (.029) .07 .39
proactiveness-environmental scanning .19* (.019) .06 .33
proactiveness-organisational innovativeness .31** (.006) .14 .46
analysis-environmental scanning .52** (.001) .39 .63
analysis-organisational innovativeness - - -
environmental scanning -innovativeness .16+ (.056) .02 .30

103
Model Pathways Estimated Effect 95% Confidence Intervals
Lower Bounds Upper Bounds
Indirect effects
size - analysis -
size - proactiveness -
size – analysis -environmental scanning .12** (.007) .05 .20
size-analysis - environmental scanning -
organisational innovativeness
.02* (.025) .01 .05
proactiveness - analysis - -
proactiveness-analysis - environmental scanning .12* (.027) .04 .22
Proactiveness – environmental scanning -
organisational innovativeness
.05* (.035) .01 .12
analysis-environmental scanning - - -
analysis-environmental scanning -organisational
innovativeness
.08* (.046) .02 .17
Environmental scanning -innovativeness - - -
Please note: +p < .10, *p < .05, ** p < .01, ** *p < .001, two-tailed. Actual p values are in the parenthesis next to the estimated effect

104
Model 2 – Open Systems Model- Size to Environmental Scanning to Strategic
Orientation to Organisational Innovativeness.
The full mediating Model 2 - Open Systems model is depicted in Figure 53. The
model just obtained adequate fit with the obtained covariance matrix due to a small
significant Chi-square and CFI at .90 (χ² = 12.00, df = 4, p>.05, TLI = .75, CFI = .90,
RMSEA = .13). All the paths were significant in the predicted direction except for the path
between proactiveness and analysis.
The partially mediated model had additional paths. First a path from environmental
scanning to organisational innovativeness was added. Second a path from size to
organisational innovativeness was added. The partially mediated model had adequate fit with
the obtained covariance matrix (χ² =6.71, df = 2, p>.05, TLI = .71, CFI = .94, RMSEA =
.14). However, the addition of these paths only led to a marginally significant improvement
of fit (χ² diff=5.29, p < .10) compared to the full mediating model. Only the additional path
from size to organisational innovativeness was significant.
Final Revised Theoretical Model 2. Given that the partially mediated model only
fitted the data marginally better than the fully mediated model, it was decided to further
revise the model based on the original framework to improve its explanatory power and
parsimony. I was interested in model revision that would provide a clearer understanding of
how strategic orientation mediates the relationship between environmental scanning and
organisational innovativeness. The model revision process is discussed next.
3 Please note that the riskiness strategic orientation dimension was not included in the final full mediating model
as it was not part of the mediation hypotheses and moreover, earlier direct model path analyses indicated that the
path relationship between riskiness and innovativeness became insignificant after controlling for the analysis
and proactiveness strategic orientation dimensions (see Table 7).

105
Figure 5 Fully mediated Model 2 - Open
Systems Model
Organisational
Innovativeness
Proactiveness
Size
Analysis
Environmental
Scanning

106
First the non-significant path between proactiveness and analysis was
removed. The non-significant chi-squared difference test after this deletion indicated
that the removal of this path did not significantly impact the model’s degree of
overall fit
Second, new paths were considered for the model. Particularly, it was
theorised that there may be direct effects on organisational innovativeness above and
beyond those mediated by the strategic orientation variables. Thus, I added a path
from size to organisational innovativeness on the theoretical assertion that size
would affect organisational innovativeness above and beyond the strategic
orientation variables. In addition, it was also theorised that size would directly affect
the strategic orientations dimensions above and beyond the indirect effects via
environmental scanning. Therefore one path from size to proactiveness and another
path from size to analysis were added to the model. However, only the path from
size to proactiveness was significant, and therefore only this path was retained in the
final model. After the additional paths were finalised, the model had a very good fit
to the data (χ² = 2.91, df = 3, p>.05, TLI = 1.00, CFI = 1.00, RMSEA = .00) and was
accepted as the final theoretical Model 2. The CFI and RMSEA values of 1 and 0
respectively have been reported for other SEM models in the research literature (Barr
& Glynn, 2004; Bushman, 2005; Cho, Martin, Margrett, MacDonald, & Poon, 2011;
Rangganadhan & Todorov, 2010; Rast & Zimprich, 2009).
Figure 6 presents this model with standardised path coefficients. All
individual paths were statistically significant in the predicted direction. As shown in
the model, environmental scanning accounted for 32% of the variance in the analysis
strategic orientation, and also 15% of the variance in proactiveness. Finally,

107
analysis, proactiveness and size accounted for 18% of the variance in organisational
innovativeness.
Summary of Direct and Mediated Relationships. Direct and indirect effects
were examined and tested for significance using the Bootstrap estimation procedure
in AMOS. The total effect of one variable on another is the sum of its direct and
indirect effects. A direct effect is the unmediated effect of one variable on another.
Finally, an indirect effect assesses the impact of one variable on another as that
variable’s influence works through one or more intervening/mediating variables
(Hoyle & Kenny, 1999). Table 10 displays each of the direct and indirect effects and
their associated 95% confidence intervals. Each of the hypotheses will be discussed
in relation to the results presented in Table 10.
Direct relationships.
Hypothesis 1: Environmental scanning was not found to have a significant
direct relationship with organisational innovativeness. See Table 10. This effect was
fully indirect (see mediated relationships below).
Hypothesis 2a to 2b: As shown in Table 10, proactiveness was found to have
a significant direct relationship with environmental scanning (β = .33, p < .01) and
organisational innovativeness (β = .31, p < .01) as predicted. Thus hypotheses 2 and
3 were supported.
Hypothesis 3a to 3b: Analysis was found to have a direct significant
relationship to organisational innovativeness (β = .19, < .05) and environmental
scanning (β = .56, p < .01), thus hypotheses 4 and 5 were supported (see Table 10).

108
Control variable: Size.
As shown in Table 10, size demonstrated significant negative direct
relationships with proactiveness (β = -.19, p < .05), and a positive significant direct
effect on organisational innovativeness (β = .19, p < .05).
Mediated relationships (Indirect).
Hypotheses 7a to 7b: Environmental scanning was found to have a
significant indirect effect on organisational innovativeness via analysis and
proactiveness (β = .21, p < .01), thus hypotheses 7a and 7b were supported – both
analysis and proactiveness mediate the relationship between environmental scanning
and organisational innovativeness. See Table 10.
Control variable: Size.
As can be seen in Table 10, size was found to exert a significant indirect
effect on proactiveness (β = .06, p < .05) and analysis (β = .10, p < .05) via
environmental scanning. However, size was not found to have a significant indirect
effect on organisational innovativeness via analysis, proactiveness and
environmental scanning.

109
Figure 6 Final Model 2 - Open Systems Model
Please note: +p < .10, *p < .05, ** p < .01, **
*p < .001, two-tailed.
Organisational
Innovativeness SMR =.18
Proactiveness SMR =.15
Size
Analysis SMR =.32
Environmental
Scanning
.17+
.56**
-.19*
.19*
.32**
.19*

110
Summary of Direct and Indirect Relationships.
Environmental scanning was found to have strong indirect effects on
organisational innovativeness via the strategic orientation dimensions of analysis and
proactiveness. However, once the strategic orientation dimensions were controlled
for, the direct effect of environmental scanning on organisational innovativeness was
found to be non-significant, suggesting full mediation. Like Model 1 - Behavioural
Model, in Model 2 – Open Systems model - proactiveness was found to have a
strong direct effect on organisational innovativeness. In addition, size was found to
have direct effects on organisational innovativeness and also indirect effects on
organisational innovativeness via proactiveness. However, the relationship between
size and proactiveness was negative suggesting that the larger the organisation the
less likely it was to be proactive strategically. Proactiveness was also found not to
directly affect the analysis strategic orientation. The implications of these findings
will be explored more in the discussion chapter.

111
Table 9 Model 2 - Open Systems model fit indices and standardised path coefficients
Measures Direct Model Full
(Indirect)
Partial
(Saturated)
Final
(Revised)
Fit Indices
Chi-squared 19.85** 12.00* 6.71* 2.91
df 4 4 2 3
Chi-squared/df 4.96 3.00 3.36 .97
TLI .51 .75 .71 1.00
CFI .80 .90 .94 1.00
GFI .94 .96 .98 .99
RMSEA .19 .13 .14 .00
Direct Effects on Organisational Innovativeness
Size .14 (.129) .18* (.034) .19* (.027)
Environmental
Scanning
.26** (.003) .08 (.416)
Analysis .23** (.009) .14 (.161) .19* (.031)
Proactiveness .28*** (.000) .30*** (.000) .32*** (.000)
Direct Effects on Environmental Scanning
Size .17+ (.062) .17+ (.062) .17+ (.062) .17+ (.062)
Direct Effects on Analysis
Environmental
Scanning
.55*** (.000) .55*** (.000) .55*** (.000) .56*** (.000)

112
Measures Direct Model Full
(Indirect)
Partial
(Saturated)
Final
(Revised)
Proactiveness .04 (.627) .04 (.627) .04 (.627)
Direct Effects on Proactiveness
Environmental
Scanning
.30*** (.000) .30*** (.000) .30*** (.000) .34*** (.000)
Size -.19* (.029)
Please note: +p < .10, *p < .05, ** p < .01, ** *p < .001, two-tailed. The p values
are in the parenthesis next to the standardised path coefficients.

113
Table 10 Standardised total, direct and indirect effects and 95% confidence levels for final Model 2 - Open Systems model
Model Pathways Standardised Estimated
Effect
95% Confidence Intervals
Lower Bounds Upper Bounds
Total Effects
size-environmental scanning .17* (.033) .04 .29
size-proactiveness -.14+ (.063) -.26 -.02
size-analysis .10* (.028) .03 .17
size-organisational innovativeness .16* (.047) .03 .29
environmental scanning-proactiveness .34** (.001) .17 .47
environmental scanning - analysis .56** (.001) .42 .66
environmental scanning -organisational innovativeness .21** (.001) .11 .31
proactiveness-innovativeness .32**(.003) .15 .47
analysis-innovativeness .19* (.015) .05 .32

114
Model Pathways Standardised Estimated
Effect
95% Confidence Intervals
Lower Bounds Upper Bounds
Direct Effects
size-environmental scanning .17* (.033) .04 .29
size-proactiveness -.19* (.033) -.32 -.04
size-analysis - - -
size-organisational innovativeness .19* (.021) .05 .33
environmental scanning-proactiveness .34** (.001) .17 .47
environmental scanning - analysis .57** (.001) .42 .66
environmental scanning -organisational innovativeness - - -
proactiveness-innovativeness .32** (.003) .15 .47
analysis-innovativeness .19* (.015) .05 .32
Indirect Effects
size-environmental scanning- proactiveness .06* (.026) .01 .12
size-environmental scanning - analysis .10* (.028) .03 .17
size-environmental scanning – strategic orientation -.03 (.323) -.09 .02

115
Model Pathways Standardised Estimated
Effect
95% Confidence Intervals
Lower Bounds Upper Bounds
dimensions - organisational innovativeness
environmental scanning-strategic orientation dimensions-
organisational innovativeness
.21** (.001) .11 .31
Please note: +p < .10, *p < .05, ** p < .01, ** *p < .001, two-tailed. Actual p values are in the parenthesis next to the estimated effect.

116
Step 2 - Comparison of the two final revised hypothesised models.
To compare and contrast the two competing theoretical models the overall fit
and the predictive power of each model using the sample covariance matrices were
examined together with the relative strengths of the individual causal paths each
model specified.
Six common model goodness of fit measures were examined: chi-squared,
chi-squared/d.f, TLI, comparative fit index (CFI), Goodness of fit index (GFI), and
Root Mean Square Error of Approximation (RMSEA). As shown in Table 11, the
majority of the indices exceeded their respective common acceptance levels,
suggesting that each model provided a reasonably good fit to the data. However, of
the two models, Model 2 had the better fit to the data as reflected by Model 2’s very
low RMSEA (.00) and high CFI (1.00). The RMSEA and CFI values of 0 and 1
respectively have been reported before in the research literature for SEM models
(Barr & Glynn, 2004; Bushman, 2005; Cho, et al., 2011; Rangganadhan & Todorov,
2010; Rast & Zimprich, 2009).

117
Table 11 Overall fits of Models 1 – Behavioural Model and Model 2 - Open Systems
model
Fit Index Recommended
Value
Final Model 1 -
Behavioural
Final Model 2 – Open
Systems
Chi-square Low n.s value 5.85 2.91
d.f. 3 3
Chi-square/d.f <=3.0 1.95 .97
TLI >=.90 .88 1.00
CFI >=.90 .97 1.00
GFI >=.90 .98 .99
RMSEA <=.08 .09 .00
The exploratory power of each model was also examined using the Squared
values of the path coefficient (SMR) values, which are similar to the R-square values
from a regression analysis. These variance values are depicted in Figures 4 and 6.
The overall results suggest that Models 1 – Behavioural and 2 - Open Systems model
were both similar at predicting organisational innovativeness with variances of 20%
and 18% respectively, which is not surprising considering both have the same
constructs, but different directional paths.
Next the significance of individual direct paths were also examined and
summarised in Figures 4 and 6. Two observations are worth noting. The
proactiveness strategic orientation had strong significant paths to organisational
innovativeness in both models. Size was also significantly directly related to

118
organisational innovativeness in both models. However, analysis was only
significantly related to organisational innovativeness in Model 2 - Open Systems
model, but not in Model 1 – Behavioural Model. In addition, environmental
scanning only had a weak significant direct relationship to organisational
innovativeness in Model 1 – Behavioural Model (at the p<.10 level), and a non-
significant direct relationship to organisational innovativeness in Model 2 - Open
Systems model.
In addition to the direct effects, Bollen (1989) strongly advocates the
importance of also looking at the indirect and total effects when interpreting the
results in the structural equation model. The indirect effects effect assesses the
impact of one variable on another as that variable’s influence works through one or
more intervening/mediating variables (Hoyle & Kenny, 1999). The total effect is the
sum of the direct and indirect effects. Table 12 summarises the relative strengths of
the indirect and total effects as specified by the respective models.
Three results are notable. First, there is support for mediated relationships in
both models. The indirect effects of analysis and proactiveness on organisational
innovativeness via environmental scanning was β = .08, p < .01 and β = .05, p < .01
respectively for Model 1 – Behavioural Model, while for Model 2 - Open Systems
model the indirect effects of environmental scanning on organisational
innovativeness via proactiveness and analysis was β = .21, p < .001. Second, it
seems there were both partial and full mediation effects for Model 1 and full
mediation effects in Model 2. The proactiveness strategic orientation still had direct
effects on organisational innovativeness (β = .31, p < .01) above and beyond any
indirect effect (β = .05, p < .01) via environmental scanning in Model l, indicating

119
partial mediation. However, the analysis strategic orientation did not show any
significant direct effect above and beyond any indirect effect (β = .08, p < .01) via
environmental scanning in Model 1 – Behavioural Model, thus suggesting a full
mediation effect. In contrast, the results for Model 2 - Open Systems model suggest
complete mediation effects only as environmental scanning had no significant direct
effects on organisational innovativeness above and beyond any indirect effects via
strategic orientation (β = .21, p < .001). Finally, a third notable result as show in
Table 12, is that proactiveness exhibited the strongest direct, indirect and total effects
across the two models. In contrast, environmental scanning appeared to have weak
direct effects on organisational innovativeness across the two models and but
exhibited stronger total and indirect effects (via the strategic orientation dimensions)
on organisational innovativeness in Model 2. Thus, it seems the path results show
stronger support for Model 2’s indirect effects compared to Model 1’s.

120
Table 12 Relative strength of each path specified by the respective models
Effect on organisational
innovativeness
Model 1 - Behavioural
Model
Model 2 - Open Systems
model
Direct Effect
Size .19* .19*
Proactiveness .31** .32**
Analysis n.s .19*
Environmental
Scanning
.16+ n.s
Indirect Effect
Size .02* -.03
Proactiveness .05* n/a
Analysis .08* n/a
Environmental
Scanning
n/a .21**
Total Effect
Size .21** .16*
Proactiveness .36** .32**
Analysis .08* .19*
Environmental
Scanning
.16+ .21**
Please note: +p < .10, *p < .05, ** p < .01, ** *p < .001, two-tailed.

121
Summary of results
In conclusion, this section has examined the relationships between strategic
orientation (proactiveness and analysis), environmental scanning and organisational
innovativeness. In particular, it compared two competing models with two different
proposed meditational paths of environmental scanning and strategic orientation in
relation to organisational innovativeness. Overall, the results suggest that Model 2 -
Open Systems model with environmental scanning influencing strategic orientation,
and then strategic orientation influencing organisational innovativeness as the
stronger model of the two due to the stronger fit indices and significant indirect
paths. A discussion of the findings and their implications will be presented in the
next chapter.

122
Chapter 4 - Discussion
This final chapter summarises the major findings and contributions of this
thesis. The discussion is structured into four sections. First, there is a general
discussion of the key findings and a comparison of the two competing models – the
behavioural and the open systems/design school/cultural perspectives of
environmental scanning, strategic orientation and organisational innovativeness.
Second, the theoretical contributions to research in relation the STROBE framework,
environmental scanning and the interaction between the two are discussed. Third,
the practical implications of the findings of the thesis are discussed. Finally, the
chapter concludes with the research limitations and directions for future research.
Two Theoretical Models
Model 1 - Behavioural.
The Model 1 – Behavioural model proposed that organisational processes and
structures are already prescribed within the organisation. Specifically strategic
orientation, after being determined, would influence environmental scanning, and
this in turn would influence organisational innovativeness (Frambach, et al., 2003;
Mintzberg, 1990; Talke, 2007). There was some support for this model (see page 95
for the final model). Environmental scanning was found to mediate the relationships
between the strategic dimensions of proactiveness and analysis and organisational
innovativeness. Environmental scanning was found to partially mediate the
relationship between proactiveness strategic orientation and organisational
innovativeness. The proactiveness strategic orientation still had an effect on
organisational innovativeness above and beyond the mediated effects of

123
environmental scanning. However, environmental scanning was found to fully
mediate the relationship between analysis strategic orientation dimension and
organisational innovativeness.
The next section discusses in more detail the direct and indirect findings of
Model 1 – Behavioural Model.
Direct.
Environmental scanning for customer, competitor, technology and market
information was found to be weakly significantly related to organisational
innovativeness at the p< .10 level in Model 1 – Behavioural Model, thus hypothesis
1 was supported. Therefore there is some evidence that environmental scanning
directly affects organisational innovativeness. The majority of previous studies have
not examined environmental scanning directly in relation to organisational
innovativeness. Lefevbre et al. (1997) looked at environmental scanning in relation
to technology policy via the futurity strategic orientation. However, most studies
have examined specific components of environmental scanning and innovation, such
as the impact of involvement in professional associations on the adoption of
administrative innovations (Damanpour & Schneider, 2006), the impact of customer
orientation on the adoption of imaging technology (Nystrom, et al., 2002) or the
impact of external communication on performance management innovations
(Walker, 2008). Moreover, other studies have examined environmental scanning in
relation to a strategic typology, such as defender, prospector, differentiator and infer
from the typology that the firm is innovative. In other words, organisational
innovativeness is not measured as a separate variable to the strategic orientation
construct (for e.g., Hambrick, 1982; Hagen et al., 2003; Jennings and Lumpkin,

124
1992; Miller, 1989; Subramanian, Fernandes, and Harper, 1993; Raymond et al.,
2001).
Overall, the weak direct relationship of environmental scanning on
organisational innovativeness suggests that some environmental scanning leads
directly to innovation adoption into the organisation. This could be due to a number
of reasons such as the environmental scanning being more targeted when looking for
innovation, so that the organisation has already decided on the type of innovation
they are after. Alternatively, the information collected from the environment gives
senior management confidence and/or motivation to either develop an internal
innovation or adopt an external one. Miller and Friesen (1982) argued that for some
organisations, particularly conservative ones, environmental scanning brings tangible
information to managers’ attention and makes them aware for the need to change.
For instance, gathering information from the environment may make managers
aware of the disadvantages of their own work practices and/or product lines and
motivate them to change (Frishammar & Åke Hörte, 2005). In addition, customers
and competitors could also be potential sources for innovative ideas and practices
(Neely, Filippini, Forza, Vinelli, & Hii, 2001). Therefore, even though a firm may
have already marketed an original idea, to remain innovative they must continually
acquire information from environment to stay on top of changing customer demands,
competitor actions and new technology (Frishammar & Åke Hörte, 2005)
Moreover, in Model 1 – Behavioural Model, the proactiveness strategic
orientation dimension had a strong direct effect on organisational innovativeness,
above and beyond its effects via environmental scanning. This is not surprising
considering the proactiveness strategic orientation dimension is about seeking new
opportunities and the introduction of new products and brands ahead of the

125
competition. Therefore organisations high on the proactiveness strategic orientation
dimension would be more likely to introduce new products and be innovative in
addition to creating new products/services for customers’ direct needs and/or in
reaction to competitors’ current actions. Firms with high levels of the proactiveness
strategic orientation dimension would want to take the lead with innovation and
come up with original ideas for the marketplace.
Indirect.
There was empirical support for indirect effects via environmental scanning
of the proactiveness and analysis strategic orientation dimensions on organisational
innovativeness. These findings give some support to the behavioural proposition
that higher level strategic dimensions influence middle level functional management
activities. Thus the degree to which a firm environmentally scans depends to some
degree upon the strategic orientation dimensions that make up the organisation.
Environmental scanning was found to fully mediate the analysis strategic
orientation dimension and organisational innovativeness relationship. This suggests
that the analysis strategic orientation dimension directly influences the degree of
environmental scanning that is utilised in an organisation, and this in turn influences
organisational innovativeness. The relationship between analysis and environmental
scanning was also strong, suggesting a more proximal relationship between the two
variables. Firms with high levels of analytical strategic orientation were more likely
to environmentally scan and then innovate. The findings for analysis, environmental
scanning and innovativeness are very similar to the positive relationship found
between complexly structured firms and innovation in other studies (Damanpour,
1996). Damanpour (1996) argued that in “complex organisations, coalitions of

126
specialists in differentiated sub-units increase the depth of knowledge base which in
turn increases the development of new ideas”. Highly analytical firms probably
would also be highly complexly structured with coalitions of specialists in
differentiated sub-units to assist with the scanning and analysis of information.
Moreover, it could be proposed that analytical firms are already confident
beforehand to adopt innovations based on the information it has already analysed
and/or its capacity to scan for large amounts of external information on customers,
competitors, markets and new technology.
In contrast, environmental scanning was found to only partially mediate the
relationship between the proactiveness strategic orientation dimension and
organisational innovativeness. This suggests that the proactiveness strategic
orientation dimension, in addition to its direct effects, also environmentally scans for
information on customers, competitors, technology and the marketplace to ensure
that it is responding to changing customer needs and competitor actions. This
supports Subramanian, et al. (1993) study that found prospectors, which the
proactiveness strategic orientation dimension is drawn from, had the most advanced
scanning systems compared to defenders and analysers. The authors rationalised that
prospectors strive to gather superior information from the environment therefore they
require a sophisticated scanning system that is broad in scope and is able to give
them an edge over the competition (Subramanian, et al., 1993). However`, as shown
by the partial mediation effect`, the proactiveness strategic orientation dimension
also still directly influenced organisational innovativeness above and beyond any
indirect effects via environmental scanning. These partial mediation effects are also
similar to Frambach, Prabhu, and Verhallen’s (2003) findings where they found
market orientation (strives to collect customer and competitor information) to
127
partially mediate the relationship between the differentiator strategic typology (firms
that want to produce products that are different to competitors) and new product
activity.
Overall, Model 1 accounted for 18% of variance explained for organisation
innovativeness. This compares favourably to other studies that have used similar
outcomes measures of innovativeness (i.e., asking respondents to indicate the actual
number and type of innovations adopted over a certain time period). For example,
Damanpour and Schneider (2006) found that their environmental, organisational, and
top manager variables accounted for 22% of the variance in their outcome variable
of administrative innovativeness in 1200 US public service organisations. While, the
current student explains a significant percentage of variance, 82% remains explained.
This unexplained proportion could be due to a combination of methodological
factors (e.g., measurement error) and theoretical factors such as certain variables not
being included in the model, for example financial slack resources (Walker, 2008)
and managers’ attitudes toward competition and change (Damanpour & Schneider,
2006)
Model 2 - Open Systems model.
The Open Systems model views organisations as flexible and adaptable to the
environment and values external knowledge (Kast & Rosenzweig, 1972; Schneider
& Somers, 2006). This theoretical paradigm suggests that the organisation would
utilise environmental scanning first, which would then inform the choice of strategic
orientation and then organisational innovativeness. In the Open Systems model,

128
environmental scanning precedes strategic orientation, and in turn the emphasis on
particular strategic orientation dimensions influences the levels of organisational
innovativeness. There was strong support for this model (see page 109 for the final
model). The indirect effect of environmental scanning via the two strategic
orientation dimensions on organisational innovativeness was much stronger for
Model 2 - Open Systems model compared to Model 1 – Behavioural Model. The
next section discusses in more detail the direct and indirect findings of the Open
Systems based Model 2.
Direct.
Only the proactiveness and analysis strategic orientation dimensions had
significant direct effects on organisational innovativeness in Model 2 - Open
Systems model. Environmental scanning did not have a significant direct effect on
organisational innovativeness above and beyond its indirect effects.
The direct effects of proactiveness have already been discussed in the earlier
Model 1 section. Therefore this section will focus more on the positive relationship
found between the analysis strategic orientation dimension and organisational
innovativeness. Frambach (1993) argued that the higher the information absorption
capacity of an organisation the more receptive it would be to innovations. The more
an organisation has the analytical processes and structures in place to analyse and
support the sharing of innovation information the more likely they are to adopt
innovations. Therefore if an organisation has the structures and processes in place to
thoroughly analyse innovation information the more likely they were to adopt them.
The positive relationship findings for analysis and innovativeness also reflect similar
research findings on structural complexity and innovation, where firms that have

129
complex structures and “coalitions of experts” were more likely to be innovative
(Damanpour, 1996; Damanpour & Gopalakrishnan, 1998; Kim, 1980). Damanpour
(1996) stated that in “complex organisations, coalitions of specialists in
differentiated sub-units increase the depth of knowledge base which in turn increases
the development of new ideas”.
Indirect.
There was strong empirical support in Model 2 - Open Systems model for the
indirect effects of environmental scanning via proactiveness and analysis strategic
orientation dimensions on organisational innovativeness. The indirect effect was
found to be much stronger in Model 2 than Model 1, suggesting that environmental
scanning is a better distal predictor of organisational innovativeness compared to a
proximal one. These strong indirect findings highlight the critical role of
environmental scanning as a distal factor in influencing organisational
innovativeness. Organisations need to collect and scan for customers, competitors,
industry, and marketplace information to help motivate and inform them to innovate
across the organisation. Miller and Friesen (1982) found environmental scanning to
be highly correlated with product innovativeness in their sample of 29 conservative
Canadian firms. The authors concluded that “scanning bolsters innovation as it
makes managers aware of the disadvantages of their own products lines and the
superiority of product lines of competitors”. Scanning also points to changing
customer desires and buying patterns, which can also help guide organisations into
adopting innovations (Miller & Friesen, 1982). Similarly, Lefebvre, et al. (1997)
found environmental scanning indirectly affected a firm’s technology policy via the
futurity strategic orientation dimension in their sample of 84 small to medium sized

130
enterprises (SEM). Specifically, there was a full mediation effect of the futurity
strategic orientation dimension on the relationship between environmental scanning
and technology policy. The authors concluded that the presence of a strongly
futuristic strategic orientation was necessary for more intense scanning mechanisms
to translate into a more aggressive technology policy (Lefebvre, et al., 1997). In
otherwords, the systematic use of scanning mechanisms directed at the identification
of opportunities and threats from competitors or from emergent technologies was
crucial for the development of technology policies. However, according to the
Lefebvre et al. (1997) study, to make this technology policy a reality the external
information needs to feed into the firm’s strategic orientation first – particularly the
futurity strategic orientation dimension, which then leads to the development of a
technology policy.
The conclusions that Miller and Friesen (1982) and Levebre et al. (1997)
studies came to is similar to what was found for Model 2 in the current study. In
particular, for the environmental scanning information to become meaningful
requires feeding this information into the proactiveness and analysis strategic
orientation dimensions. Therefore facilitating organisational innovativeness does not
just rely only on identifying opportunities from the environment but also having the
intentions and motivation to adopt innovations (proactiveness strategic orientation
dimension) and the decision making and information processing capabilities to
understand and interpret them (analysis strategic orientation dimension).
Overall, Model 2 accounted for 20% of variance explained for organisation
innovativeness. This compares favourably to other studies that have used similar
outcomes measures of innovativeness (i.e., asking respondents to indicate actual

131
innovations adopted over a certain time period). For example, Damanpour and
Schneider (2006) found that their environmental, organisational, and top manager
variables accounted for 22% of the variance in their outcome variable of
administrative innovativeness in 1200 US public service organisations. While, the
current model explains a significant percentage of variance, 80% remains explained.
This unexplained proportion could be due to a combination of methodological
factors (e.g., measurement error) and theoretical factors, such as certain variables not
being included in the model, for example financial slack resources (Walker, 2008)
and managers’ attitudes toward competition and change (Damanpour & Schneider,
2006)
Comparison of competing models.
Overall the results of the two competing models suggest that there is a
reciprocal relationship between environmental scanning and strategic orientation in
relation to organisational innovativeness as both models had adequate to good fit
indices and significant paths. The strategic orientation dimensions of proactiveness
and analysis acts as stimulators of environmental scanning activities, which in turn
positively influences organisational innovativeness. Alternatively environmental
scanning affects the level of the proactiveness and analysis strategic orientation
dimensions, and these dimensions in turn increase levels of organisational
innovativeness in the firm. However, model 2 the Open Systems model, overall had
the better fit indices and stronger indirect effects, indicating that there is stronger
support for innovativeness occurring when environmental scanning acts as a distal

132
facilitator and works through the strategic orientations dimensions of proactiveness
and analysis.
Theoretical Contributions
Overall.
This thesis has taken the first step to understand better the relationship
between strategic orientation, environmental scanning and organisational
innovativeness. Overall this thesis contributed to the strategic orientation,
environmental scanning and organisational innovativeness literature in a number of
ways. First, this thesis compared two competing models of strategic orientation,
environmental scanning and innovativeness. This thesis did not assume a one-
directional relationship but a bi-directional relationship between the strategic
orientation and environmental scanning constructs. Second, this thesis developed
two theoretical frameworks on how strategic orientation and environmental scanning
may interact to affect organisational innovativeness. This is in turn contrasts with the
majority of organisational innovativeness research, which tends to looks at how
different factors correlate to innovation, but not how they may interact together to
influence it. This thesis provides insights into the complex interaction and reciprocal
interactions between the variables.
Third, the thesis empirically examined the relationship between strategic
orientation, environmental scanning and organisational innovativeness as separate
constructs. Previous research has only examined strategic orientation and
environmental scanning either only together and/or in relation to organisational
performance (Hagen, et al., 2003; Hambrick, 1982; Jain, et al., 2011; Jennings &
133
Jones, 1999; Jogaratnam & Wong, 2009). If organisational innovativeness has been
examined in relation to strategic orientation and environmental scanning, it has only
been implied by the strategic typology and not as a separate distinct empirical
construct (McEwen, 2008; Raymond, Brisoux, & Azami, 2001; Subramanian, et al.,
1993). In this thesis, I utilised distinct constructs of strategic orientation,
environmental scanning and organisational innovativeness variables. How this thesis
extended the literature on the STROBE framework, environmental scanning, and the
interaction of the two, is discussed further in the following sections.
Strategic Orientation of Business Enterprises (STROBE).
The STROBE was examined in relation to environmental scanning and
organisational innovativeness in two different competing models – this had not been
done before in the literature. The findings suggest that the proactiveness,
aggressiveness and analysis strategic orientation dimensions were the most robust
and reliable constructs from the six strategic orientation dimensions. Interestingly
the majority of respondents reported very low mean scores for the aggressiveness
strategic orientation dimension, suggesting that this strategic orientation was not
utilised much in the current sample of Australian based firms. Furthermore the
findings also suggest that the proactiveness and analysis strategic orientation
dimensions are strongly related to organisational innovativeness and environmental
scanning. The proactiveness strategic orientation dimension was the strongest
predictor of organisational innovativeness out of all the predictor variables across the
two theoretical models. This suggests that a strategic orientation that explicitly
states that it is innovative and proactive is more likely to adopt innovations across
the organisation compared to a more passive process strategic orientation, such as

134
the analysis strategic orientation, that simply organises and processes information.
Senior management’s intentions and commitment to organisational innovation as
shown in the strategic orientation is very important for innovation to actually occur
across the organisation. Moreover, the analysis strategic orientation was also
moderately related to organisational innovativeness, suggesting that the formal
processing and storing of external information also helps to lesser extent
organisations to adopt a number of different innovations across the board.
Overall, the significant contribution of using the STROBE dimensions in this
thesis is that it allowed a more nuanced examination of the relationship between
strategic orientation, organisational innovativeness and environmental scanning.
Other studies have utilised strategic typologies (Frambach, et al., 2003),
idiosyncratic measures of strategic orientation (Haaga, 2002; Han, et al., 1998;
Srinivasan, et al., 2002), or more specific entrepreneurial strategic measures (Davis,
et al., 2011). In contrast, the STROBE dimensions allows for a more generic
measure of strategic orientation, which encompasses both decision-making and
planning constructs, such as riskiness, analysis and futurity, and also competitive
postures, such as proactiveness, aggressiveness, and defensiveness (Venkatraman,
1989). A more comprehensive generic measure of strategic orientation, which
utilises dimensions, allows comparisons across organisations and also with each
other (Morgan & Strong, 1998; Morgan & Strong, 2003; Speed, 1993).
135
Environmental scanning.
The findings of thesis also strengthened the evidence for the importance of
environmental scanning in relation to strategic orientation and organisational
innovativeness. The business environment can be extremely volatile with ever
changing regulation, customer tastes, and rapidly changing technology that
organisations need to keep track of and adapt to (Abebe, et al., 2010;
Ngamkroeckjoti & Speece, 2008). Environmental scanning is one way to help keep
track of these changing environmental trends and allow time for the organisation to
formulate plans to adapt to these changes. Model 2 – Open System’s model path
analysis findings suggest that the proactiveness and analysis strategic orientation
dimensions are the mechanisms through which environmental scanning information
is translated into innovation adoption across the organisation. This suggests that the
information gathered from the environment gives strength/motivation to senior
management to follow the proactiveness and analysis strategic orientations and in
turn adopt innovations across the organisation. Therefore, it is important for
organisations to environmentally scan when formulating strategic orientations that
support organisational innovativeness. Organisations require feedback from the
environment to help guide and make them confident in pursuing innovation across
the entire organisation.
There was also a weak direct effect of environmental scanning on
organisational innovativeness in Model 1, the Behavioural Model. This supports the
view to some extent that environmental scanning can also affect organisational
innovativeness more directly albeit at a weaker level. This might be true in cases
where the innovation idea or product sourced from environmental scanning can be

136
directly implemented into the organisation. In particular, as strategic orientation
precedes environmental scanning in Model 1 - behavioural model - it is more likely
that environmental scanning is more targeted towards a particular innovation and
therefore adoption of those innovations are easier to implement.
Interaction between STROBE and environmental scanning.
The finding of this thesis supports past research that strategic orientation and
environmental scanning are intertwined with each other (Davis, et al., 2008; Hagen,
et al., 2003; Hambrick, 1982; Saxby, Parker, Nitse, & Dishman, 2002; Subramanian,
et al., 1993). As Hambrick (1982) indicated, scanning is an important source of
influence on the choice of strategic orientation dimensions an organisation chooses
to follow. In addition, the choice of strategic orientation can also in turn influence
the intensity of environmental scanning activities (Hagen, et al., 2003; Raymond,
Julien, et al., 2001; Subramanian, et al., 1993). In the current study these strategic
orientation dimensions being proactiveness and analysis.
Practical Implications
The findings of this thesis have several implications for practice. First, the
findings highlight the critical role of strategic orientation when influencing
organisational innovativeness. The proactiveness strategic orientation dimension was
a strong predictor of organisational innovativeness across the two models. The
proactiveness strategic orientation is about being proactive and coming up with
innovations before the rest of the marketplace.
137
The proactiveness strategic orientation is also about having strong positive
attitudes towards innovations and explicitly wanting to innovate. This suggests that
organisations need to have positive attitudes towards innovations and to have
formulated an intention to innovate if organisational innovativeness is to be
increased. This mirrors motivational theory where behavioural intentions have been
found to be strong predictors of actual behaviour (Ajzen, 1985; Krueger Jr, Reilly, &
Carsrud, 2000). Therefore there is a need to promote the benefits of innovations to
organisations to help increase positive attitudes and intentions to adopt them. To a
lesser extent the analysis strategic orientation dimension was also related to
organisational innovativeness. This suggests that for firms to be innovative there
also needs to be some planned coordination, storage and analysis of innovation
related information.
Second the findings of this thesis suggest that environmental scanning plays a
critical role in organisational innovativeness in a more distal indirect role via the
strategic orientation dimensions rather than a more direct one. Scanning the
environment for information on customers, competitors, technology and the
marketplace allows the organisation access to tangible information to help them
innovate and respond to the environment via the strategic orientation dimensions of
proactiveness and analysis. Therefore important to examine an organisation’s
environmental scanning mechanisms and how they are the gathering information
from the environment as this impacts on the organisation’s motivation and ability,
via the strategic orientation dimensions, to innovate across the entire organisation.
Third, the findings of the thesis suggest different pathways to organisational
innovativeness. Specifically there is the more proactive and direct way via the
proactiveness strategic orientation dimension and a more reactive passive way via

138
the environmental scanning and analysis strategic orientation dimension avenues.
The implication of these findings for practice is that, while proactive approaches are
important and widespread, they are not the only avenues for increasing
organisational innovation in firms. Thus firms that are unwilling or unable to follow
a proactive approach to innovation may also effectively increase innovation simply
by scanning the environment and integrating this information, via the analysis
strategic orientation dimension, into the organisation.
Fourth, the findings suggested a reciprocal relationship between strategic
orientation and environmental scanning in relation to organisational innovativeness
as both Model 1 – Behavioural Model and 2 - Open Systems model were found to
have a good fit to the data and significant paths. However, overall Model 2 was
found to have the stronger fit indices and paths of the two models, suggesting that
organisational innovativeness is more likely to occur when environmental scanning
precedes strategic orientation. Thus in terms of organisational priority it might be
better to focus on building environmental scanning mechanisms first and then to
focus on strategic orientation when facilitating organisational innovativeness. In
otherwords, for organisational innovativeness to occur the organisation must have a
good understanding of its customers, competitors, technology, industry and markets
before focusing on strategic orientation dimensions that support the resultant
innovative activity.

139
Limitations and future research
Limitations.
This research has made a number of significant contributions to the strategic
orientation, environmental scanning, and organisational innovativeness literature and
practice. However, there are five main limitations to this thesis research, which I
will expand on further below; the generalisability of the findings, exclusion of other
determinant factors, the psychometric properties of the STROBE measure, the
reliance on self-report data, , and the cross sectional as opposed to the longitudinal
design of the study.
The first limitation of this empirical research was that the findings of the study
are restricted to organisations already seeking information about innovation. The
sample for the study was drawn from the Industry Partner QMI’s data-base of clients
who had already contacted them in regards to gaining more information about lean
manufacturing and other manufacturing technologies. Therefore there may be
inherent biases within this sample that may limit the generalisability of these
findings to other manufacturing organisations. For instance, the clients from the
data-base may already be more open to adopting innovations compared to non-QMI
clients.
Second, the models examined in this thesis do not capture all the ways
organisations may use to increase innovation. Due to scoping reasons, the research
analyses did not include data on other variables that may also potentially affect
environmental scanning, strategic orientation and organisational innovativeness.
Such variables include organisational culture, management characteristics, and other

140
types of strategic orientation dimensions. Future research should consider the
inclusion of these variables to assess the impact they have on the other variables in
this study.
Third, some of the STROBE dimension constructs were not psychometrically
sound and/or adequately reliable. The defensiveness and futurity strategic
orientation dimensions loaded across several factors at once and therefore were
discarded from further analysis. In addition, the riskiness strategic orientation
dimension had a borderline acceptable Cronbach alpha of .63, and was retained for
the further analyses although it ended up not meeting the requirements for mediation.
Another limitation of this empirical work was the reliance on self-report data
through the major innovation survey that was delivered to the different
manufacturing/industrial based organisations from the QMI data-base. The
exclusive reliance on self reports raises a number of questions, such as common
method variance, the accuracy of survey respondents’ perceptions, and their
willingness to respond honestly (Donaldson & Grant-Vallone, 2002; Podsakoff,
MacKenzie, Lee, & Podsakoff, 2003; Spector, 1994, 2006). The accuracy and
honesty of responses is of particular concern in relation to the strategic orientation
and the organisational innovativeness measures. Since it is more socially desirable
to be seen as innovative, respondents may have over reported and/or not recollected
accurately the number and types of innovations adopted in the past three years
(Ashford, 1986). In addition, participants may have indicated higher levels on the
strategic orientation dimensions to show themselves in the best light in terms of
being seen as more proactive, analytical, defensive, risky, future-oriented, aggressive
than they realistically were. Future research should supplement self-report measures
with data from alternate sources such as peers, supervisors, subordinates, documents,

141
and critical incidents to gain more objective measures of innovativeness and strategic
orientation (Podsakoff, et al., 2003).
Finally, the research was cross-sectional and not longitudinal in design.
Although rigorous path analysis methodology was used in this research, cross-
sectional data does not enable the determination of causal relations with the same
degree of confidence. Longitudinal analyses, preferably using time lagged design
and drawn over three time periods, would enable much stronger claims to be made
about causality and potential reciprocality of influence among the variables (Singh,
Li Jen, Tan, & Bell, 2007). Clearly, an improvement in the design would be to
conduct the analyses over time, and for the results to be verified and validated in
other research projects.
Overall, despite the above mentioned limitations, this research has achieved
its purpose. It has expanded understanding of the relationships between
environmental scanning, strategic orientation and organisational innovativeness.
This research has also proposed two competing frameworks to help explain
organisational innovativeness, which provides a basis and structure for future
research on the three constructs.
Future Research.
Three main areas for future research emerged from this current research,
namely: more research is required on the STROBE dimensions, such as
defensiveness and futurity which were found to be unreliable measures in the current
study, longitudinal and more in-depth analyses of the strategic orientation,

142
environmental scanning and organisational innovativeness relationship, and the
inclusion of an instrumental variable so that a non-recursive SEM can be tested.
A longitudinal cross-lagged analysis of the strategic orientation, environmental
scanning and organisational innovativeness variables could help further examine the
reciprocal effects of strategic orientation and environmental scanning. This involves
measuring the constructs at Time 1 and then again in Time 2, and then utilising
structural equation modelling to examine the reciprocal effects of variables across
time (for e.g., the effect of environmental scanning at Time 1 on strategic orientation
at Time 2 and vice versa) (Bullock, Harlow, & Mulaik, 1994; Hülsheger, Lang, &
Maier, 2010; Iacobucci, 2010; Netemeyer et al., 2001; Volmer, Niessen, Spurk, Linz,
& Abele, 2011) Longitudinal SEM procedures off a better possibility of initial
evidence for the direction of causation (Bullock, et al., 1994). There are many long-
term studies that have used such approach that provide stronger evidence for a
temporal sequence of constructs in a model.
Another way to test reciprocal relationships is to introduce a third instrumental
variable into the study that affects either strategic orientation or environmental
scanning but not any of the other variables in the system (Wong & Law, 1999). Thus
instead of a one-way arrow (in either direction), replace this with two one-way
arrows in which strategic orientation affects environmental scanning and vice versa.
If such a model is identified, the alternative hypotheses have to do with the relative
size of the two paths between strategic orientation and environmental scanning. For
example, you may find the path environmental scanning to strategic orientation is
significantly larger than the reverse path strategic orientation, which would support
initial ideas. In fact it may be better at times to use the instrumental variable

143
research design when the effects between variables are complex and intertwined and
the exact time lag between them is difficult to identify (Wong & Law, 1999).
Conclusion
In summary, common and understandable frameworks for understanding
organisational innovativeness are imperative to ensure that studies of its antecedents
and consequences are comparable, complementary and easily adaptable to
organisational environments.
This thesis research extended previous research findings by examining the
directional effects between strategic orientation and environmental scanning in
relation to organisational innovativeness. In addition, a more nuanced
comprehensive multi-dimensional generic measure of strategic orientation was
utilised.
To examine the reciprocal relationships, two competing theoretical frameworks
using the STROBE framework were tested through path analysis. Overall, the
results suggest that there is a reciprocal relationship between environmental scanning
and strategic orientation in relation to organisational innovativeness. Specifically,
both the proactiveness and analysis strategic orientation dimensions seem to affect
the frequency of environmental scanning which in turn moderately affects levels of
organisational innovativeness (Model 1 – Behavioural Model). In addition,
environmental scanning also seems to affect the levels of proactiveness and analysis
strategic orientation dimensions and these two strategic orientation dimensions also
affect organisational innovativeness (Model 2- Open Systems model). However, the
latter model had the better fit indices and stronger indirect effects than the

144
behavioural model, suggesting that organisational innovativeness is more likely to
occur via the strategic orientation dimensions of analysis and proactiveness rather
than directly via environmental scanning.
Moreover, the strongest predictor of organisational innovativeness was found to
be the proactiveness strategic orientation dimension, suggesting that an
organisation’s positive intentions and attitudes towards innovation is an important
facilitator of organisational innovativeness. In addition, to a lesser extent, this study
also found that the analysis strategic orientation dimension, a firms’ knowledge
management and analytical techniques, are also important facilitators of
organisational innovativeness.
Finally, several areas for future research emerged from this current research,
namely: more research into the STROBE multi-dimensionality - as two constructs –
defensiveness and futurity did not end up being separate constructs from the other
STROBE dimensions and had to be discarded from further analysis; more
longitudinal studies examining the long term effects of strategic orientation on
environmental scanning frequency and vice versa; use of an instrumental variable if
more cross-sectional studies are used; and finally, more in depth qualitative studies
on how the different STROBE dimensions and environmental scanning activities
translate to organisations and also affect organisational innovativeness.

145
References
Abebe, M., Angriawan, A., & Tran, H. (2010). Chief Executive External Network
Ties and Environmental Scanning Activities: An Empirical Examination.
Strategic Management Review, 4(1), 30-43.
Aguilar, F. J. (1967). Scanning the Business Environment. New York, NY:
Macmillan Co.
Ajzen, I. (1985). From Intentions to Actions: A Theory of Planned Behaviour. In J.
K. J. Beckmann (Ed.), Action Control: From Cognition to Behavior.
Heidelberg: Springer.
Akman, G., & Yilmaz, C. (2008). Innovative Capability, Innovation Strategy and
Market Orientation: An Empirical Analysis in Turkish Software Industry.
International Journal of Innovation Management, 12(1), 69-111.
Allison, P. D. (2002). Missing Data. Thousand Oaks, CA: Sage.
Allred, B. B., Boal, K. B., & Holstein, W. K. (2005). Corporations as Stepfamilies:
A New Metaphor for Explaining the Fate of Merged and Acquired
Companies. Academy of Management Executive, 19(3), 23-37.
Anderson, J. C., & Gerbing, D. W. (1988). Structural Equation Modeling in Practice:
A Review and Recommended Two-Step Approach. Psychological Bulletin,
103(3), 411-423.
Aragon-Correa, J. A. (1998). Strategic Proactivity and Firm Approach to the Natural
Environment. Academy of Management Journal, 41(5), 556-567.
Aragón-Sánchez, A., & Sánchez-Marín, G. (2005). Strategic Orientation,
Management Characteristics, and Performance: A Study of Spanish Smes.
Journal of Small Business Management, 43(3), 287-308.
146
Ashford, S. J. (1986). Feedback-Seeking in Individual Adaptation: A Resource
Perspective. The Academy of Management Journal, 29(3), 465-487.
Australian Bureau of Statistics. (2006-07). Innovation in Australian Business.
Retrieved from
http://www.abs.gov.au/AUSSTATS/[email protected]/DetailsPage/8158.02006-
07?OpenDocument Accessed: 26th June 2011
Australian Bureau of Statistics. (2008-09). Innovation in Australian Business.
Retrieved from
http://www.abs.gov.au/AUSSTATS/[email protected]/DetailsPage/8158.02008-
09?OpenDocument Accessed: 26th June 2011
Australian Bureau of Statistics (ABS). (2005-06). Australian Industry. Cat. No.
8155.0.
Baines, T., Kay, G., Adesola, S., & Higson, M. (2005). Strategic Positioning: An
Integrated Decision Process for Manufactures. International Journal of
Operations & Production Management, 25(2), 180-201.
Baldwin, L., & Lin, Z. (2002). Impediments to Advanced Technology Adoption for
Canadian Manufacturers. Research Policy, 31(1), 1.
Barr, P. S., & Glynn, M. A. (2004). Cultural Variations in Strategic Issue
Interpretation: Relating Cultural Uncertainty Avoidance to Controllability in
Discriminating Threat and Opportunity. Strategic Management Journal,
25(1), 59-67.
Bates, K. A., & Flynn, J. E. (1995). Innovation History and Competitive Advantage:
A Resource-Based View Analysis of a Manufacturing Technology
Innovations. Best Papers Proceedings of the Academy of Management,
Omnipress, Madison, WI.

147
Beal, R. M. (2000). Competing Effectively: Environmental Scanning, Competitive
Strategy, and Organizational Performance in Small Manufacturing Firms.
Journal of Small Business Management, 38(1), 27-47.
Beaumont, N. B., & Schroder, R. M. (1997). Technology, Manufacturing
Performance and Business Performance Amongst Australian Manufacturers.
Technovation, 17(6), 297-307. doi: 10.1016/s0166-4972(97)00011-4
Bentler, P. M. (1990). Comparative Fit Indexes in Structural Models. Psychological
Bulletin, 107(2), 238-246.
Bentler, P. M., & Bonett, D. G. (1980). Significance Tests and Goodness-of-Fit in
the Analysis of Covariance Structures. . Psychological Bulletin, 88(3), 588-
606.
Bergeron, F., Raymond, L., & Rivard, S. (2004). Ideal Patterns of Strategic
Alignment and Business Performance. Information & Management, 41(8),
1003-1020.
Bessant, J., Francis, D., Meredith, S., Kaplinsky, R., & Brown, S. (2001).
Developing Manufacturing Agility in Smes. International Journal of
Technology Management, 22(1-3), 28.
Blumentritt, T., & Danis, W. M. (2006). Business Strategy Types and Innovative
Practices. Journal of Managerial Issues, 18(2), 274-291.
Boeker, W., & Huo, P. Y. (1998). Innovation Adoption by Established Firms:
Unresolved Issues. The Journal of High Technology Management Research,
9(1), 115-130.
Boer, H., & During, W. E. (2001). Innovation, What Innovation? A Comparison
between Product, Process, and Organisational Innovation. International
Journal of Technology Management, 22, 83-107.

148
Bouty, I. (2000). Interpersonal and Interaction Influences on Informal Resource
Exchanges between R&D Researchers across Organizational Boundaries.
Academy of Management Journal, 43(1).
Browne, M. W., & Cudeck, R. (1993). Alternative Ways of Assessing Model Fit. In
K. A. Bollen & J. S. Long (Eds.), Testing Structural Equation Models (pp.
136-162). Newbury Park, CA: Sage Publications.
Bullock, H. E., Harlow, L. L., & Mulaik, S. A. (1994). Causation Issues in Structural
Equation Modeling Research. Structural Equation Modeling: A
Multidisciplinary Journal, 1(3), 253-267. doi: 10.1080/10705519409539977
Bushman, B. J. (2005). Violence and Sex in Television Programs Do Not Sell
Products in Advertisements. Psychological Science, 16(9), 702-708. doi:
10.1111/j.1467-9280.2005.01599.x
Camison-Zornoza, C., Lapiedra-Alcami, R., Segarra-Cipres, M., & Boronat-Navarro,
M. (2004). A Meta-Analysis of Innovation and Organizational Size.
Organization Studies, 25(3), 331-361.
Chairman of Innovation Australia David Miles. (2011). Media Release: Innovation
Key to Productivity Growth for Australia. Retrieved from
http://www.ausindustry.gov.au/InnovationAustralia/Pages/MediaReleases/M
ediaRelease-InnovationKeyToProductivityGrowth.aspx Accessed: 26th June
2011
Chan, Y. E., Huff, S. L., Barclay, D. W., & Copeland, D. G. (1997). Business
Strategic Orientation, Information Systems Strategic Orientation, and
Strategic Alignment. Information Systems Research, 8(2), 125-150.

149
Cheng, E. W. L. (2001). Sem Being More Effective Than Multiple Regression in
Parimonious Model Testing for Management Development Research.
Journal of Management Development, 20(7), 650-667.
Cho, J., Martin, P., Margrett, J., MacDonald, M., & Poon, L. W. (2011). The
Relationship between Physical Health and Psychological Well-Being among
Oldest-Old Adults. Journal Of Aging Research, 2011, 1-8. doi:
10.4061/2011/605041
Choo, C. W. (2001). Environmental Scanning as Information Seeking and
Organizational Learning. Information Research: an international electronic
journal, 7(1), 1-14.
Commonwealth of Australia. (2001). Backing Australia's Ability: An Innovation
Action Plan for the Future. Retrieved from
http://www.dest.gov.au/NR/rdonlyres/B0A19129-FD9E-45FD-99D9-
D4EEC704364C/2688/backing_Aust_ability.pdf Accessed: 26th June 2011
Commonwealth of Australia. (2009). Powering Ideas: An Innovation Agenda for the
21st Century. Retrieved from
http://www.innovation.gov.au/innovation/policy/pages/PoweringIdeas.aspx
Accessed: 26th June 2011
Conant, J. S., Mokwa, M. P., & Varadarajan, P. R. (1990). Strategic Types,
Distinctive Marketing Competencies and Organizational Performance: A
Multiple Measures-Based Study. Strategic Management Journal, 11(5), 365-
383.
Crossan, M. M., & Apaydin, M. (2010). A Multi-Dimensional Framework of
Organizational Innovation: A Systematic Review of the Literature. Journal of
Management Studies, 47(6), 1154-1191.

150
Cyert, R. M., & March, J. G. (1963). A Behavioral Theory of the Firm. Englewood
Cliffs, NJ: Prentice Hall.
Damanpour, F. (1991). Organizational Innovation: A Meta-Analysis of Effects of
'Determinants and Moderators'. Academy of Management Journal, 34(3),
555-590.
Damanpour, F. (1992). Organizational Size and Innovation. Organization Studies,
13(3), 375-402.
Damanpour, F. (1996). Organizational Complexity and Innovation: Developing and
Testing Multile Contingency Models. Management Science, 42(5), 693-717.
Damanpour, F., & Gopalakrishnan, S. (1998). Theories of Organizational Structure
and Innovation Adoption: The Role of Environmental Change. Journal of
Engineering and Technology Management, 15(1), 1-24.
Damanpour, F., & Gopalakrishnan, S. (2001). The Dynamics of the Adoption of
Product and Process Innovations in Organizations. Journal of Management
Studies, 38(1), 45-65.
Damanpour, F., & Schneider, M. (2006). Phases of the Adoption of Innovation in
Organizations: Effects of Environment, Organization and Top Managers.
British Journal of Management, 17(3), 215-236.
Damanpour, F., & Schneider, M. (2009). Characteristics of Innovation and
Innovation Adoption in Public Organizations: Assessing the Role of
Managers. Journal of Public Administration Research & Theory, 19(3), 495-
522.
Damanpour, F., Walker, R. M., & Avellaneda, C. N. (2009). Combinative Effects of
Innovation Types and Organizational Performance: A Longitudinal Study of
Service Organizations. Journal of Management Studies, 46(4), 650-675.

151
Damanpour, F., & Wischnevsky, D. J. (2006). Research on Innovation in
Organizations: Distinguishing Innovation-Generating from Innovation-
Adopting Organizations. Journal of Engineering and Technology
Management, 23(4), 269-291.
Davis, J. A., Marino, L. D., Aaron, J. R., & Tolbert, C. L. (2011). An Examination of
Entrepreneurial Orientation, Environmental Scanning, and Market Strategies
of Nonprofit and for-Profit Nursing Home Administrators. Nonprofit and
Voluntary Sector Quarterly, 40(1), 197-211. doi:
10.1177/0899764009351112
Davis, M. A., Miles, G., & McDowell, W. C. (2008). Environmental Scanning as a
Moderator of Strategy-Performance Relationships: An Empirical Analysis of
Physical Therapy Facilities. Health Serv Manage Res, 21(2), 81-92. doi:
10.1258/hsmr.2007.007021
Dess, G. G., & Davis, P. S. (1984). Porter's (1980) Generic Strategies as
Determinants of Strategic Group Membership and Organizational
Performance. Academy of Management Journal, 27(000003), 467-488.
Dess, G. G., & Lumpkin, G. T. (2005). The Role of Entrepreneurial Orientation in
Stimulating Effective Corporate Entrepreneurship. Academy of Management
Executive, 19(1), 147-156.
Dewar, R. D., & Dutton, J. E. (1986). The Adoption of Radical and Incremental
Innovations: An Empirical Analysis. Management Science, 32(11), 1422-
1433.
Dilalla, L. F. (2000). Structural Equation Modelling: Uses and Issues. In H. E. A.
Tinsley & S. D. Brown (Eds.), Handbook of Applied Multivariate Statistics

152
and Mathematical Modelling (pp. 440-465). San Diego, CA: Academic
Press.
Dollinger, M. J. (1984). Environmental Boundary Spanning and Information
Processing Effects on Organizational Performance. Academy of Management
Journal, 27(2), 351-368.
Donaldson, S. I., & Grant-Vallone, E. J. (2002). Understanding Self-Report Bias in
Organizational Behavior Research. Journal of Business and Psychology,
17(2), 245-260. doi: 10.1023/a:1019637632584
Dunphy, S., Herbig, P. A., & Palumbo, F. A. (1995). Structure and Innovation.
Journal of Strategic Change, 4(3), 137-154.
Fitzpatrick, K. M. (1993). Exposure to Violence and Presence of Depression among
Low-Income, African-American Youth. Journal of Consulting and Clinical
Psychology, 61(3), 528-531. doi: 10.1037/0022-006x.61.3.528
Flanagin, A. J. (2000). Social Pressures on Organizational Website Adoption.
Human Communication Research, 26(4), 618-646.
Fombrun, A., & Ginsberg, C. J. (1990). Shifting Gears:Enabling Change in
Corporate Aggressiveness. Strategic Management Journal, 11, 297-308.
Frambach, R. T. (1993). An Integrated Model of Organizational Adoption and
Diffusion of Innovations. European Journal of Marketing, 27(5), 22-41.
Frambach, R. T., Barkema, H. G., Nooteboom, B., & Wedel, M. (1998). Adoption of
a Service Innovation in the Business Market: An Empirical Test of Supply-
Side Variables. Journal of Business Research, 41(2), 161-174.
Frambach, R. T., Prabhu, J., & Verhallen, T. M. M. (2003). The Influence of
Business Strategy on New Product Activity: The Role of Market Orientation.
International Journal of Research in Marketing, 20(4), 377-397.

153
Frambach, R. T., & Schillewaert, N. (2002). Organizational Innovation Adoption: A
Multi-Level Framework of Determinants and Opportunities for Future
Research. Journal of Business Research, 55(2), 163-176.
Frederickson, J. (1984). The Comprehensiveness of Strategic Decision Process:
Extensions, Observations, and Future Directions. Academy of Management
Journal, 27, 445-466.
Frishammar, J., & Åke Hörte, S. (2005). Managing External Information in
Manufacturing Firms: The Impact on Innovation Performance. Journal of
Product Innovation Management, 22(3), 251-266. doi: 10.1111/j.0737-
6782.2005.00121.x
Gatignon, H., & Xuereb, J. M. (1997). Strategic Orientation of the Firm and New
Product Performance. Journal of Marketing Research 34, 77-90.
Gelber, F. (1998). Tackling the Current Account Deficit. In R.Genoff & R. Green
(Eds.), Manufacturing Prosperity. Sydney: Federation Press.
Gilbert, A. H., Jr., & Reid, R. C. (2009). An Analysis of the Relationships among
Information Scope, Organizational Proactiveness, and Firm Performance.
Academy of Accounting and Financial Studies Journal, 13(4), 1-19.
Greve, H. R., & Taylor, A. (2000). Innovations as Catalysts for Organizational
Change: Shifts in Organizational Cognition and Search. Administrative
Science Quarterly, 45(1), 54-80.
Gudmmundson, D., Hartman, E. A., & Tower, C. B. (1999). Strategic Orientation:
Differences between Family and Non-Family Firms. Family Business
Review, 12(1), 27-39.
Haaga, D. P. (2002). A Study of the Relationship between Organizational Capacity
to Innovate and Market Orientation in a Fast Food Company. Dissertation

154
Abstracts International: Section B: The Sciences & Engineering. Univ
Microfilms International.
Hagen, A., Haile, S., & Maghrabi, A. (2003). The Impact of the Type of Strategy on
Environmental Scanning Activities in the Banking Industry: An International
Perspective. International Journal of Commerce & Management, 13(2), 122-
143.
Hambrick, D. C. (1982). Environmental Scanning and Organizational Strategy.
Strategic Management Journal, 3(2), 159-174.
Hambrick, D. C. (1983). Some Tests of the Effectiveness and Functional Attributes
of Miles and Snow's Strategic Types. Academy of Management Journal,
26(1), 5.
Han, J. K., Kim, N., & Srivastava, R. K. (1998). Market Orientation and
Organizational Performance: Is Innovation a Missing Link? Journal of
Marketing, 62(4), 30-45.
Hofer, C. W., & Schendel, D. E. (1978). Strategy Formulation: Analytical Concepts.
New York: West Publishing Co.
Howell, D. C. (2009). Statistical Methods for Psychology (7th ed.). Belmont:
Thomson/Wadsworth
Howell, J. M., & Boies, K. (2004). Champions of Technological Innovation: The
Influence of Contextual Knowledge, Role Orientation, Idea Generation, and
Idea Promotion on Champion Emergence. Leadership Quarterly, 15(1), 123.
Hoyle, R. H., & Kenny, D. A. (1999). Sample Size, Reliability, and Tests of
Statistical Mediation. In R. H. Hoyle (Ed.), Statistical Strategies for Small
Sample Research (pp. 195-222). Thousand Oaks, CA: Sage.

155
Hoyle, R. H., & Smith, G. T. (1994). Formulating Clinical Research Hypotheses as
Structural Equation Models: A Conceptual Overview. Journal of Consulting
and Clinical Psychology, 62(3), 429-440.
Hu, L. T., & Bentler, P. (1995). Evaluating Model Fit. In R. H. Hoyle (Ed.),
Structural Equation Modelling: Concepts, Issues, and Applications (pp. 76-
99). Thousand Oakes, CA: Sage.
Hülsheger, U. R., Lang, J. W. B., & Maier, G. W. (2010). Emotional Labor, Strain,
and Performance: Testing Reciprocal Relationships in a Longitudinal Panel
Study. Journal of Occupational Health Psychology, 15(4), 505-521. doi:
10.1348/09631790376964722910.1348/0963179037696472292003-08807-
005
Hurley, R. F., & Hult, G. T. M. (1998). Innovation, Market Orientation, and
Organizational Learning: An Integration and Empirical Examination. Journal
of Marketing, 62(3), 42-54.
Iacobucci, D. (2010). Structural Equations Modeling: Fit Indices, Sample Size, and
Advanced Topics. Journal of Consumer Psychology, 20(1), 90-98. doi:
10.1016/j.jcps.2009.09.003
Iacovou, C. L., Benbasat, I., & Dexter, A. S. (1995). Electronic Data Interchange and
Small Organizations: Adoption and Impact of Technology. MIS Quarterly,
19(4), 465-485.
Innovation Australia. (2009-10). Innovation Australia Annual Report 2009/2010:
Innovation Australia Board.
Jaccard, J., & Wan, C. K. (1996). Lisrel Approaches to Interaction Effects in
Multiple Regression. Thousand Oakes, CA: Sage.
156
Jain, H., Sinha, A., Vitharana, P., & Mayer, J. (2011). Managing the Future—Six
Guidelines for Designing Environmental Scanning Systems Service-Oriented
Perspectives in Design Science Research (Vol. 6629, pp. 276-290): Springer
Berlin / Heidelberg.
James, L. R., Mulaik, S. A., & Brett, J. (1982). Causal Analysis: Models,
Assumptions and Data. Beverly Hills, CA: Sage.
Jansen, J. J. P., Van Den Bosch, F. A. J., & Volberda, H. W. (2006). Exploratory
Innovation, Exploitative Innovation, and Performance: Effects of
Organizational Antecedents and Environmental Moderators. Management
Science, 52(11), 1661-1674.
Jennings, D., & Jones, A. (1999). Environmental Scanning in an Emerging Industry.
Strategic Change, 8(3), 153-162.
Jennings, D., & Lumpkin, J. (1992). Insights between Environmental Scanning
Activities and Porter's Generic Strategies: An Empirical Analysis. . Journal
of Management, 18(4), 791-803.
Jensen, M. B., Johnson, B., Lorenz, E., & Lundvall, B. Å. (2007). Forms of
Knowledge and Modes of Innovation. Research Policy, 36(5), 680-693. doi:
10.1016/j.respol.2007.01.006
Jogaratnam, G., & Wong, K. K. F. (2009). Environmental Uncertainty and Scanning
Behavior: An Assessment of Top-Level Hotel Executives. 10(1), 44 - 67.
Johannessen, J. A., Olsen, B., & Olaisen, J. (1997). Organizing for Innovation. Long
Range Planning, 30(1), 96-109.
Kast, F. E., & Rosenzweig, J. E. (1972). General Systems Theory: Applications for
Organization and Management. The Academy of Management Journal, 15(4),
447-465.

157
Kelloway, E. K. (1995). Structural Equation Modelling in Perspective. Journal of
Organizational Behavior, 16(3), 215-224.
Kessler, E. H., & Chakrabarti, A. K. (1996). Innovation Speed: A Conceptual Model
of Context, Antecedents, and Outcomes. Academy of Management. The
Academy of Management Review, 21(4), 1143.
Kim, L. (1980). Organizational Innovation and Structure. Journal of Business
Research, 8, 225-245.
Kimberly, J. R., & Evanisko, M. J. (1981). Organizational Innovation: The Influence
of Individual, Organizational, and Contextual Factors on Hospital Adoption
of Technological and Administrative Innovations. Academy of Management
Journal, 24(4), 689-713.
King, N. (1992). Modelling the Innovation Process: An Empirical Comparison of
Approaches. Journal of Occupational and Organizational Psychology, 65,
89-100.
Kline, R. B. (1998). Principles and Practice of Structural Equation Model. New
York: Guilford Press.
Krueger Jr, N. F., Reilly, M. D., & Carsrud, A. L. (2000). Competing Models of
Entrepreneurial Intentions. Journal of Business Venturing, 15(5-6), 411-432.
doi: 10.1016/s0883-9026(98)00033-0
Kumar, K., Subramanian, R., & Strandholm, K. (2001). Competitive Strategy,
Environmental Scanning and Performance: A Context Specific Analysis of
Their Relationship. International Journal of Commerce & Management,
11(1), 1-33.

158
Lefebvre, L. A., Mason, R., & Lefebvre, E. (1997). The Influence Prism in Smes:
The Power of Ceos' Perceptions on Technology Policy and Its Organizational
Impacts. Management Science, 43(6), 856-878.
Litwin, G., & Stringer, R. (1968). Motivation and Organizational Climate. Boston:
Harvard University Press.
Lukas, B. A., Tan, J. J., & Hult, G. T. M. (2001). Strategic Fit in Transitional
Economies: The Case of China's Electronics Industry. Journal of
Management, 27(4), 409-429.
Manz, C. C., Bastien, D. T., Hostager, T. J., & Shapiro, G. L. (1989). Leadership and
Innovation: A Longitudinal Process View. In A. H. Van de Ven, H. L. Angle
& M. S. Poole (Eds.), Research on the Management of Innovation: The
Minnesota Studies. New York: Harper & Row.
McEwen, T. (2008). Environmental Scanning and Organisational Learning in
Entrepreneurial Ventures. The Entrepreneurial Executive, 13, 1-16.
Meeus, M. T. H., & Edquist, C. (2006). Introduction to Part I: Product and Process
Innovation. In J. Hage & M. Meeus (Eds.), Innovation, Science, and
Institutional Change (pp. 23-37.). Oxford: Oxford University Press.
Mehrtens, J., Cragg, P. B., & Mills, A. (2001). A Model of Internet Adoption by
Smes. Information and Management, 39, 165-176.
Mellor, R., & Gupta, P. (2002). Comparing the Manufacturing Strategies of
Australian Firms with Their European Counterparts. International Journal of
Operations & Production Management, 22(12), 1411-1426.
Meyer, A. D., & Goes, J. B. (1988). Organizational Assimilation of Innovations: A
Multilevel Contextual Analysis. Academy of Management Journal, 31(4),
897-923.

159
Miles, R. E., & Snow, C. C. (1978). Organizational Strategy, Structure, and
Process. New York: McGraw-Hill.
Miller, D. (1988). Relating Porter's Business Strategies to Environment and St.
Academy of Management Journal, 31(2), 280-308.
Miller, D. (1989). Matching Strategies and Strategy Making - Process, Content, and
Performance. Human Relations, 42(3), 241-260.
Miller, D., & Friesen, P. H. (1982). Innovation in Conservative and Entrepreneurial
Firms: Two Models of Strategic Momentum. Strategic Management Journal,
3(1), 1-25.
Miller, D., & Friesen, P. H. (1984). A Longitudinal Study of the Corporate Life
Cycle. Management Science, 30(10), 1161-1184.
Miller, D., & Friesen, P. H. (1986). Porter's (1980) Generic Strategies and
Performance: An Empirical Examination with American Data Part Ii:
Performance Implications. Organization Studies 7(3), 255-261.
Mintzberg, H. (1990). The Design School: Reconsidering the Basic Premises of
Strategic Management. Strategic Management Journal, 11(3), 171-195. doi:
10.1002/smj.4250110302
Mo, J. P. (2009). The Role of Lean in the Application of Information Technology to
Manufacturing. Computers in Industry, 60(4), 266-276.
Morgan, R. E., & Strong, C. A. (1998). Market Orientation and Dimensions of
Strategic Orientation. European Journal of Marketing, 32(11/12), 1051-1073.
Morgan, R. E., & Strong, C. A. (2003). Business Performance and Dimensions of
Strategic Orientation. Journal of Business Research, 56(3), 163-176.
Neely, A., Filippini, R., Forza, C., Vinelli, A., & Hii, J. (2001). A Framework for
Analysing Business Performance, Firm Innovation and Related Contextual

160
Factors: Perceptions of Managers and Policy Makers in Two European
Regions. [DOI: 10.1108/09576060110384307]. Integrated Manufacturing
Systems, 12(2), 114-124.
Netemeyer, R., Bentler, P., Bagozzi, R., Cudeck, R., Cote, J., Lehmann, D., . . .
Ambler, T. (2001). Structural Equations Modeling. Journal of Consumer
Psychology (Lawrence Erlbaum Associates), 10(1/2), 83-100.
Newgren, K. E., Rasher, A. A., & LaRoe, M. E. (1984). An Empirical Investigation
of the Relationship between Environmental Assessment and Corporate
Performance. Paper presented at the 44th Annual Meeting of the Academy of
Management, August 12-15 1984, Washington, DC.
Ngamkroeckjoti, C., Mark, S., & Nicholas, J. D. (2005). Environmental Scanning in
Thai Food Smes: The Impact of Technology Strategy and Technology
Turbulence. British Food Journal, 107(4/5), 285-305.
Ngamkroeckjoti, C., & Speece, M. (2008). Technology Turbulence and
Environmental Scanning in Thai Food New Product Development. Asia
Pacific Journal of Marketing and Logistics, 20(4), 413.
Nunnally, J. C. (1978). Psychometric Theory. New York, NY: McGraw-Hill.
Nystrom, P. C., Ramamurthy, K., & Wilson, A. L. (2002). Organizational Context,
Climate and Innovativeness: Adoption of Imaging Technology. Journal of
Engineering & Technology Management, 19, 221-247.
O'Connor, E. J., & Zammuto, R. F. (1995). From Here to Amt Success: How Will
We Travel? Advances in global high-technology management, 5, 125-147.
OECD Statistical Office of the European Communities Luxembourg. (2005). Oslo
Manual: Guidelines for Collecting and Interpreting Innovation Data (3rd
ed.). Luxembourg: OECD Publishing.
161
Pedler, M., & Aspinwall, K. (1996). Perfect Plc?: The Purpose and Practice of
Organizational Learning. UK: McGraw-Hill.
Peng, M. W., Tan, J., & Tong, T. W. (2004). Ownership Types and Strategic Groups
in an Emerging Economy. The Journal of Management Studies, 41(7), 1105-
1129.
Podsakoff, P. M., MacKenzie, S. B., Lee, J.-Y., & Podsakoff, N. P. (2003). Common
Method Biases in Behavioral Research: A Critical Review of the Literature
and Recommended Remedies. Journal of Applied Psychology, 88(5), 879-
903. doi: 10.1037/0021-9010.88.5.879
Porter, M. (1980). Competitive Strategy. New York: The Free Press.
Rangganadhan, A. R., & Todorov, N. (2010). Personality and Self-Forgiveness: The
Roles of Shame, Guilt, Empathy and Conciliatory Behavior. Journal of
Social and Clinical Psychology, 29(1), 1-22. doi: 10.1521/jscp.2010.29.1.1
Rast, P., & Zimprich, D. (2009). Individual Differences and Reliability of Paired
Associates Learning in Younger and Older Adults. Psychology and Aging,
24(4), 1001-1006. doi: 10.1037/a0016138
Raymond, L., Brisoux, J., & Azami, A. (2001). Marketing Information Systems
Practices in Small Manufacturing Firms: Antecedents and Consequences.
Journal of Computer Information Systems, 41(3), 32-41.
Raymond, L., Julien, P. A., & Ramangalahy, C. (2001). Technological Scanning by
Small Canadian Manufacturers. Journal of Small Business Management,
39(2), 123-138.
Rishel, T. D., & Burns, O. M. (1997). The Impact of Technology on Small
Manufacturing Firms. Journal of Small Business Management, 35, 2-10.
Rogers, E. M. (1995). Diffusion of Innovations (5 ed.). New York: Free Press.
162
Sabherwal, R., & Chan, Y. E. (2001). Alignment between Business and Is Strategies:
A Study of Prospectors, Analyzers, and Defenders. Information Systems
Research, 12(1), 11-33.
Salavou, H., Baltas, G., & Lioukas, S. (2004). Organisational Innovation in Smes:
The Importance of Strategic Orientation and Competitive Structure.
European Journal of Marketing, 38(9/10), 1091-1112.
Saxby, C. L., Parker, K. R., Nitse, P. S., & Dishman, P. L. (2002). Environmental
Scanning and Organizational Culture. Marketing Intelligence & Planning,
20(1), 28-34.
Schneider, M., & Somers, M. (2006). Organizations as Complex Adaptive Systems:
Implications of Complexity Theory for Leadership Research. The Leadership
Quarterly, 17(4), 351-365. doi: 10.1016/j.leaqua.2006.04.006
Schoenecker, T. S., Daellenbach, U. S., & McCarthy, A. M. (1995). Factors
Affecting a Firm's Commitment to Innovation. Academy of Management
Journal, 52-56.
Sheather, G. (2002). Transforming Australian Manufacturing Enterprises for Global
Competitiveness. International Journal of Technology Management, 24(5/6),
514-541.
Shortell, S. M., & Zajac, E. J. (1990). Perceptual and Archival Measures of Miles
and Snow's Strategic Types: A Comprehensive Assessment of Reliability and
Validity. Academy of Management Journal, 33(4), 817-832.
Singh, R., Li Jen, H., Tan, H. L., & Bell, P. A. (2007). Attitudes, Personal
Evaluations, Cognitive Evaluation and Interpersonal Attraction: On the
Direct, Indirect and Reverse-Causal Effects. British Journal of Social
Psychology, 46(1), 19-42.

163
Slater, S. F., & Narver, J. C. (1993). Product-Market Strategy and Performance: An
Analysis of The. European Journal of Marketing, 27(10), 33-51.
Small, M. H. (1998). Objectives for Adopting Advanced Manufacturing Systems:
Promise and Performance. [DOI: 10.1108/02635579810213134]. Industrial
Management & Data Systems, 98(3), 129-137.
Snow, C. C., & Hrebiniak, L. G. (1980). Strategy, Distinctive Competence, and
Organizational Performance. Administrative Science Quarterly, 25(2), 317-
336.
Snyder-Halpern, R. (2001). Indicators of Organizational Readiness for Clinical
Information Technology/Systems Innovation: A Delphi Study. International
Journal of Medical Informatics, 63, 179-204.
Souitaris, V. (2001). Strategic Influences of Technological Innovation in Greece.
British Journal of Management, 12(1), 131-147.
Spanos, Y. E., Zaralis, G., & Lioukas, S. (2004). Strategy and Industry Effects on
Profitability: Evidence from Greece. Strategic Management Journal, 25(2),
139-165.
Spector, P. E. (1994). Using Self-Report Questionnaires in Ob Research: A
Comment on the Use of a Controversial Method. Journal of Organizational
Behavior, 15(5), 385-392. doi: 10.1002/job.4030150503
Spector, P. E. (2006). Method Variance in Organizational Research. Organizational
Research Methods, 9(2), 221-232. doi: 10.1177/1094428105284955
Speed, R. (1993). Maximizing the Potential of Strategic Typologies for Marketing
Strategy Research. Journal of Strategic Marketing, 1(3), 171.

164
Srinivasan, R., Lilien, G. L., & Rangaswamy, A. (2002). Technological
Opportunism and Radical Technology Adoption: An Application to E-
Business. Journal of Marketing, 66(3), 47-60.
Stock, G. N., Greis, N. P., & Fischer, W. A. (1996). Firm Size and Technological
Innovation in the Computer Model Industry. Academy of Management
Proceedings, 383-387.
Subramanian, R., Fernandes, N., & Harper, E. (1993). An Empirical Examination of
the Relationship between Strategy and Scanning. The Mid - Atlantic Journal
of Business, 29(3), 315-330.
Subramanian, R., Kumar, K., & Yauger, C. (1994). The Scanning of Task
Environments in Hospitals: An Empirical Study. Journal of Applied Business
Research (JABR), 10(4), 104-115.
Tabachnick, B. G., & Fidell, L. (1996). Using Multivariate Statistics (3rd ed.). New
York, NY: HarperCollins College Publishers.
Tabak, F., & Barr, S. H. (1996). Adoption of Organizational Innovations: Individual
and Organizational Determinants. Academy of Management Proceedings (pp.
388): Academy of Management.
Tabak, F., & Barr, S. H. (1999). Propensity to Adopt Technological Innovations: The
Impact of Personal Characteristics and Organizational Context. Journal of
Engineering and Technology Management, 16(3-4), 247-270.
Talke, K. (2007). Corporate Mindset of Innovating Firms: Influences on New
Product Performance. Journal of Engineering and Technology Management,
24(1-2), 76-91.

165
Tan, J. J., & Tan, D. (2005). Environment-Strategy Co-Evolution and Co-Alignment:
A Staged Model of Chinese Soes under Transition. Strategic Management
Journal, 26, 141-157.
Tanaka, J. S., & Huba, G. J. (1984). Structures of Psychological Distress: Testing
Confirmatory Hierarchical Models. Journal of Consulting and Clinical
Psychology, 52(4), 719-721.
Taylor, J., & McAdam, R. (2004). Innovation Adoption and Implementation in
Organizations: A Review and Critique. Journal of General Management,
30(1), 17-38.
Tornatzky, L. G., & Fleischer, M. (1990). The Processes of Technological
Innovation. Lexington, Mass.: Lexington Books.
Totterdell, P., Leach, D., Birdi, K., Clegg, C., & Wall, T. (2002). An Investigation of
the Contents and Consequences of Major Organizational Innovations.
International Journal of Innovation Management, 6(4), 343-368.
Tyler, B. B., Bettenhausen, K. L., & Daft, R. L. (1989). The Use of Low and High
Rich Information Sources and Communication Channels in Developing and
Implementing Competitive Business Strategy. Paper presented at the
Proceedings, annual Academy of Management meeting.
Tzokas, N., & Saren, M. (1997). On Strategy, Typologies and the Adoption of
Technological Innovations in Industrial Markets. British Journal of
Management, 8, S91-S105.
Ullman, J. B. (1996). Structural Equation Modeling. In B. G. Tabachnick & L. S.
Fidell (Eds.), Using Multivariate Statistics (3rd ed., pp. 709-819). New York,
NY: HarperCollins College Publishers.

166
Unsworth, K., Sawang, S., Murray, J., Norman, P., & Sorbello, T. (2012).
Understanding Innovation Adoption: Effects of Orientation, Pressure and
Control on Adoption Intentions International Journal of Innovation
Management (IJIM), 16(1), 1-35. doi: 10.1142/S1363919611003593
Venkatraman, N. (1989). Strategic Orientation of Business Enterprises: The
Construct, Dimensionality, and Measurement. Management Science, 35(8),
942-962.
Vijande, M. L. S., Perez, M. J. S., Gonzalez, L. I. A., & Casielles, R. V. C. (2005).
Effects of Market Orientation on Business Strategic Behaviour Journal of
Strategic Marketing, 13, 17-42.
Volmer, J., Niessen, C., Spurk, D., Linz, A., & Abele, A. E. (2011). Reciprocal
Relationships between Leader–Member Exchange (Lmx) and Job
Satisfaction: A Cross-Lagged Analysis. Applied Psychology, 60(4), 522-545.
doi: 10.1111/j.1464-0597.2011.00446.x
Walker, R. M. (2008). An Empirical Evaluation of Innovation Types and
Organizational and Environmental Characteristics: Towards a Configuration
Framework. Journal of Public Administration Research & Theory, 18(4),
591-615.
Wolfe, R. A. (1994). Organizational Innovation: Review, Critique and Suggested
Research Directions. The Journal of Management Studies, 31(3), 405.
Wong, C.-S., & Law, K. S. (1999). Testing Reciprocal Relations by Nonrecursive
Structuralequation Models Using Cross-Sectional Data. Organizational
Research Methods, 2(1), 69-87. doi: 10.1177/109442819921005

167
Xue, Z., Shaheen, M., & Schubert, F. (2010). Environmental Scanning: An
Application of Information Literacy Skills at the Workplace. Journal of
Information Science, 36(6), 719-732.
Yasai-Ardekani, M., & Nystrom, P. C. (1996). Designs for Environmental Scanning
Systems: Tests of a Contingency Theory. Management Science, 42(2), 187-
204.
Yi, L., Nan, Z., & Youhe, S. (2010). Exploratory Innovation, Exploitative
Innovation, and Performance: Influence of Business Strategies and
Environment. Nankai Business Review International, 1(3), 297-316.
Zahra, S. A., & Covin, J. G. (1993). Business Strategy, Technology Policy and Firm
Performance. Strategic Management Journal, 14(6), 451.
Zheng, W., Yang, B., & McLean, G. N. (2010). Linking Organizational Culture,
Structure, Strategy, and Organizational Effectiveness: Mediating Role of
Knowledge Management. Journal of Business Research, 63(7), 763-771.

168
Appendix A – Information sheet, instructions and survey provided to
participants
Enhancing Organisational Performance &
Innovation
Who Are We?
We are researchers from the Work Effectiveness Research Program at Queensland
University of Technology. Our aim is to make the workplace more effective and to promote
the success of Australian organisations.
Why Would You Participate in This Research?
Innovation in organisations is a phenomenon that is being promoted by governments,
technology diffusion agencies, organisational stakeholders, media, and the public. There are
many reasons for promoting innovation in today’s dynamic marketplace, however, the
introduction of innovation is not always successful, nor is it appropriate in all situations.
The aim of this research is to increase the performance of Australian organisations through
understanding the circumstances in which innovation will be most successful and the
implementation processes that will be most effective. The project is funded by an Australian
Research Council Linkage grant (LP0455129), with QMI Solutions and Concentric as
industry partners.
By participating in this research you will:
a) Help to increase our understanding of innovation in Australian organisations
b) Help to formulate policy recommendations regarding innovation adoption and
implementation
c) Receive a benchmarking report that outlines your innovation levels (and
factors affecting innovation adoption) against other Australian organisations
d) Receive a report outlining recommendations that arise from the research
e) Receive an invitation to a workshop on innovation performance measurement,
including free performance measurement software to assist your organisation
in improving innovation effectiveness
For the purpose of this survey, we define:
Innovation as a technology or practice that an organization is using for the first time,
regardless of whether other organizations have previously used the technology or
practice.
Innovation adoption as an organization’s decision to install an innovation with the
organization. Adoption is a decision point, a plan, or a purchase.
Implementation as the stage following adoption: the transition period during which
organizational members ideally become increasingly skillful, consistent, and
committed in their use of an innovation.
Introduction of innovation as including both the adoption and implementation of an
innovation.

169
The information you provide will be treated confidentially.
No-one from outside the QUT research team will have access to a particular organisation’s
responses. The names of individual persons are not required in any of the responses. The
benchmarking and recommendations reports will provide anonymous and/or aggregated
findings, in such a way that specific organisations cannot be identified.
How do I fill in this questionnaire?
Participation in this research is completely voluntary. If you do agree to participate, you can
withdraw from participation at any time during the study without comment or penalty. Your
decision to participate will in no way impact upon your current or future relationship with
QUT or with any external body (e.g., ARC, QMI Solutions, Concentric).
There are three major sections to this questionnaire and it should take approximately half an
hour to complete. The first asks for details about your organization. The second section deals
with innovations introduced into your organization in the last three years – what those
innovations entailed, your relationship with external agencies who deal with innovation in
Australia, and the outcomes of introducing those innovations, and your experiences of and
attitudes towards innovation. The third and final section concerns any dealings you may
have had with external agencies, such as technology diffusion agencies, government
agencies, and universities. .
As you will see there are a number of types of questions. Most ask you to tick one box that
best fits your response, however others ask you to circle the answer that best fits your
response, and a few ask you to write your response down. You will also notice that some of
the questions are very similar; that is, they ask your opinion about the same or similar issues.
This overlap in questions ensures that QUT can maintain the reliability and validity of the
questionnaire.
There are no right or wrong answers to this survey. Please answer as many questions
as you can. The success of the research depends upon your answering these questions
openly, accurately, and as fully as possible.
If you have any questions regarding this questionnaire, please contact: Dr Kerrie Unsworth,
Director, Work Effectiveness Research Program, School of Management, Queensland
University of Technology, [email protected], Phone: 07 3864 5081
Please contact the Research Ethics Officer on 3864 2340 or [email protected] if you
have any concerns or complaints about the ethical conduct of the project. The return of the
completed questionnaire is accepted as an indication of your consent to participate in this
project.
We would like to thank you for taking the time to participate in this
research. Please return the questionnaire in the prepaid envelope
provided.

170
Your Organisation
General
1. Organization Name: _______________________________
2. In what year was your organization
established?____________________________________
3. In which industry does your organization belong?
(Please tick one only)
a. Financial services
b. Automotive industry
c. Construction
d. IT-Technology
e. Electrical industry
f. Manufacturing
g. Service generally
h. Telecommunication
i. Chemical industry
j. Mechanical engineering
k. Pharmaceutical industry
l. Design Consultancy
m. Other (please specify):
_________________
4. How many employees in your organization?
a. Less than 20
b. 20-50
c. 51-100
d. 101-200
e. 201-500
f. 501-1000
g. More than 1000
5. What was the approximate gross revenue of your organisation for 2003-2004?
$0-$5M
$5-$10M
$10-$50M
$50-$200M
$200-$500M
>$500M
None at
all
Low Moderate High Very
high
N/A
6. What is the intensity of competition in your
industry?

171
7. To what extent do you agree with the following statements regarding your
organisation?
Not at
all
Just a
little
To some
extent
Quite
a lot
A great
deal
There are a large number of departments in our organization
with different functions and specialties below the CEO (i.e.,
marketing, accounting, HR)
There are a high number of occupational specialties or job
titles in this organization
Most of the staff in this organization are generalists who take
on a number of different roles at any one time
The organization is highly de-centralized and participatory,
encouraging many organizational members to be involved in
decision making
The organization is highly centralized and decision making is
primarily the responsibility of senior management
For most tasks there are well-developed rules and policies
For most situations, there are manuals that define the course
of action to be taken
Everyone in this organisation has a well-defined and specific
job to do
This organization can’t afford to spend money on anything
but the essentials
Money is readily available to pay for special projects in the
organization
Money is “tight” at this organization
This organization is under intense budget pressure to cut
costs
Recently, financial resources for organization investments
have been cut back
There is generally no scarcity of financial resources for
capital projects
Our organisation is performing well relative to our
competitors
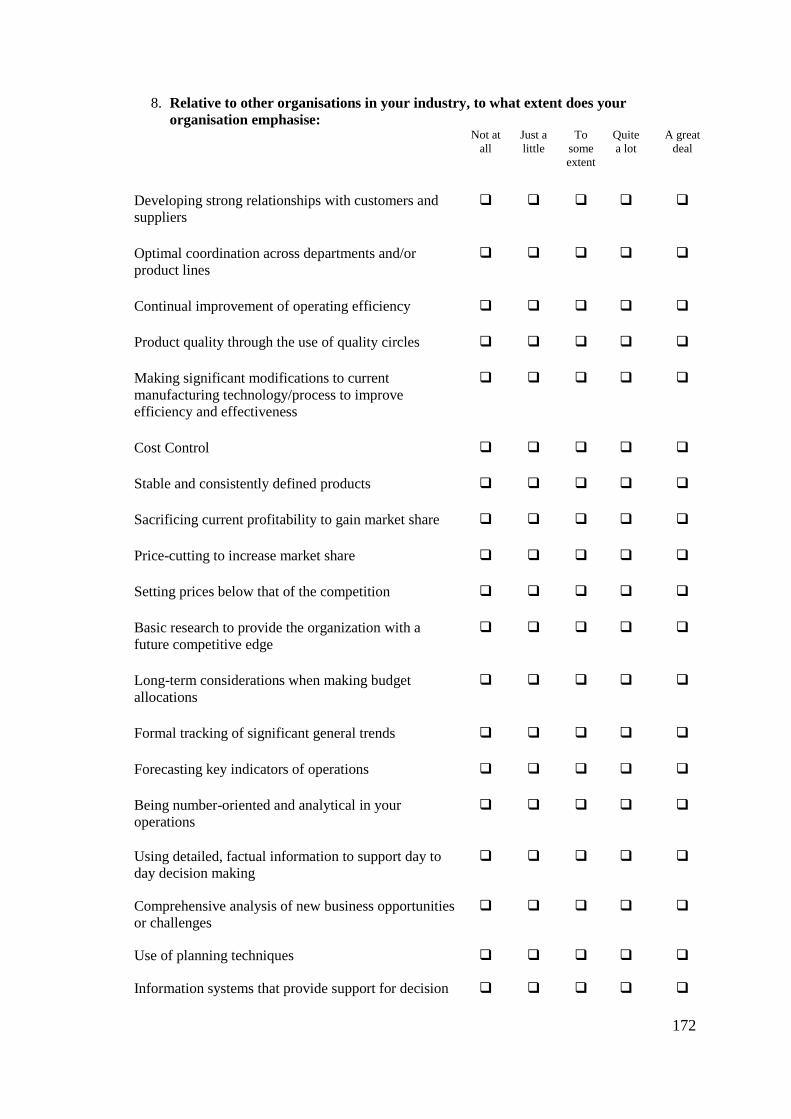
172
8. Relative to other organisations in your industry, to what extent does your
organisation emphasise:
Not at
all
Just a
little
To
some
extent
Quite
a lot
A great
deal
Developing strong relationships with customers and
suppliers
Optimal coordination across departments and/or
product lines
Continual improvement of operating efficiency
Product quality through the use of quality circles
Making significant modifications to current
manufacturing technology/process to improve
efficiency and effectiveness
Cost Control
Stable and consistently defined products
Sacrificing current profitability to gain market share
Price-cutting to increase market share
Setting prices below that of the competition
Basic research to provide the organization with a
future competitive edge
Long-term considerations when making budget
allocations
Formal tracking of significant general trends
Forecasting key indicators of operations
Being number-oriented and analytical in your
operations
Using detailed, factual information to support day to
day decision making
Comprehensive analysis of new business opportunities
or challenges
Use of planning techniques
Information systems that provide support for decision

173
making
Increasing capacity (i.e., prepare to handle a greater
volume of business) before competitors do the same
Being the first ones to introduce new products and/or
services to the
market
Adopting innovations early
Constantly seeking new business opportunities
9. To what extent do you agree with the following statements?
Not at
all
Just a
little
To some
extent
Quite a
lot
A great
deal
The philosophy of our management is that in the
long run we get ahead playing it slow, safe and
sure.
Our business has been built up by taking calculated
risks at the right time.
Decision making here is too cautious for maximum
effectiveness.
Our management is willing to take a chance on a
good idea.
10. To what extent does your organisation use the following practices?
Not at all Just a
little
To some
extent
Quite a
lot
A great
deal
Routine gathering of opinions from
customers
Explicit tracking of the policies and
tactics of competitors
Forecasting sales, customer
preferences, technology, etc.
Special market research studies
11. To what extent do you agree with the following statements regarding your
company’s attitude and behaviour toward aligning organizational
functions/processes (e.g., technology, structure, staff, capabilities) and business
strategy
Not at
all
Just a
little
To some
extent
Quite
a lot
A great
deal
Business strategy and organizational
function/process are equally valued in our
company

174
Links between organizational
functions/processes and business strategy are
clearly formulated and pursued
Investments in new organizational
functions/processes are screened for
consistency with business strategy
Senior Managers have a general understanding
of how products, markets, and organizational
functions/processes interact and manage these
interactions strategically

175
Innovation in Your Organisation
General Questions regarding Innovation
12. The following is a list of categories of common innovations introduced in Australian
manufacturing organizations. Can you please identify which ones (and how many of
each category), if any, you have introduced in the last 3 years?
Remember, these innovations do not need to have been successful to be counted.
Introduced? How
many?
New plant or machinery
New manufacturing or product-based technology
Changes in business services
New products
Changes to existing products
New processes or work design systems (e.g., TQM)
New administrative systems (e.g., communication
systems, inventory systems)
HRM innovations (e.g., appraisal or reward systems,
training)
Organisational restructuring innovations (e.g.,
merger, expansion)
Other:
__________________________________________
13. To what extent were these innovations radically different from what the organization
had or did before?
Not at
all
Just a
little
To some
extent
Quite
a lot
A great
deal
New plant or machinery
New manufacturing or product-based
technology
Changes in business services
New products
Changes to existing products
New processes or work design systems (e.g.,
TQM)
New administrative systems (e.g., inventory
systems)

176
HRM innovations (e.g., appraisal or reward
systems, training)
Organisational restructuring innovations (e.g.,
expansion)
Other:
_____________________________________
14. In general, what effect have the innovations that you introduced in the last three years
had on:
Made much
worse
Made
worse
No
effect
Improved Greatly
Improved
Service to customers?
Productivity?
Performance efficiency and productivity?
Costs/labor?
Greater reliability and consistency in
performance?
Communication within the organisation?
Diversity of products or services?
The organisation’s responsiveness to
customer demands?
The quality of life of the general public?
Health and safety within the
organisation?
Employee involvement?
Customer or client satisfaction?
The financial performance of the
organisation?
Management-employee relations?

177
The quality of the products or services?
The natural environment?
Employee morale?
Trust within the organisation?
The flexibility of the organisation?
15. To what extent do you agree with the following statements regarding your organisation’s
view of innovation?
Not at
all
Just a
little
To some
extent
Quite
a lot
A great
deal
We consider our organisation to be
innovative
We usually wait to make sure an
innovation proves itself successful in other
organisations before adopting it ourselves
Our organization understands the extent to
which innovation affects the day to day
running of our business.
Our organization has a good understanding
of the full range of technological options
for innovation.
Our organization has a good understanding
of the full range of strategic options for
innovation.
Our organization has a good understanding
of why innovation is important for the
business.
Our organization needs to innovate in
order to survive.
We need to introduce innovation in our
organization to stay ahead of the
competition.
The rate of change in the marketplace is
such that we don’t need to be constantly
looking for innovation
They
don’t
Very
slowly
Slowly Quickly Very
quickly

178
16. How quickly do new
technological developments
arise in your environment?
17. Do you have opportunities to exploit innovation? Yes No
None Very
slow
Slow Fast Very
fast
18. What is the rate of innovation adoption in your
industry?
19. Please circle the response that best fits your views on innovation in your organization.
I ________ the idea of introducing innovation into this organization.
dislike -3 -2 -1 0 1 2 3 like
20. Overall, introducing innovation into this organization would be
a bad idea -3 -2 -1 0 1 2 3 a good idea
negative -3 -2 -1 0 1 2 3 positive
worthless -3 -2 -1 0 1 2 3 valuable
harmful -3 -2 -1 0 1 2 3 beneficial
bad -3 -2 -1 0 1 2 3 good
21. Is there an individual or group of individuals in the company who:
Not at
all
Just a
little
To some
extent
Quite a
lot
A great
deal
Express confidence in what innovations
can do
Point out reasons why innovations would
succeed
Enthusiastically promote innovation
advantages
Express strong conviction about
innovations
Keep pushing enthusiastically for
innovations
Show optimism about the success of
innovations

179
Effectiveness of Innovations in your Organization
22. The list below details a number of measures that can be used by organisations to
measure the effectiveness of innovations. Please tick in the first column those that you
perceive to be important in measuring the effectiveness of innovations. Please tick or
write in the second column those that were actually used in your organization in the last
three years.
Performance Measures Important? Actual measurements used in
organisation
Return on investment
Various profit margin measures
Sales and sales growth
Payback and payback period
Cash flow
Customer satisfaction
Customer retention rate
Productivity
Quality of products and /or
services
Lead time
Delivery reliability and /or
speed
Process time
Employee development
Employee knowledge
Other measures: Please
specify?
23. Please circle the number that best describes your organisation’s experiences with
innovation implementation over the past three years.
Hard 1 2 3 4 5 Easy
Many problems 1 2 3 4 5 Few
problems
A very big deal 1 2 3 4 5 No big deal
Employee resistance 1 2 3 4 5 Employee
acceptance
Rough 1 2 3 4 5 Smooth
Stormy 1 2 3 4 5 Calm
Complicated 1 2 3 4 5 Simple
Troublesome 1 2 3 4 5 Trouble free
Not
at all
Just a
little
To
some
extent
Quite
a lot
A great
deal
Employees do not really care whether the
implementations succeeded or failed.
If employees can avoid using the

180
innovations, they do.
When given a choice, employees usually
choose not to use the innovations.
24. When introducing innovations over the last three years, to what extent have you
personally:
Not at
all
Just a
little
To some
extent
Quite a
lot
A great
deal
Led the organization to understand
and implement the changes required
to deliver results from this
innovation?
Promoted the vision about this
innovation?
Become knowledgeable about this
innovation?
Made decisions about introducing
this innovation?
Co-sponsored the integration and
testing of this innovation?
Monitored organization change?
Mobilized key stakeholders’
communication and education?
Ensured that people are prepared for
training?

181
25. To what extent do you agree with the following statements regarding the implementation
of innovation in your organisation?
Not at
all
Just a
little
To some
extent
Quite
a lot
A great
deal
Implementation is generally carefully
planned and costed
Innovation is always part of a long term
strategic plan
Our organization often puts too little time
into planning for implementation
Our organization provides training to
employees before
innovation implementation has taken
place.
Training is often available to employees
during innovation implementation phase.
In our organization, the more employees
know about innovation and its
implementation, the better their chances
are of getting promoted or bonus or raise.
Our organization has provided someone
to help when employees get stuck on a
problem while using an adopted
innovation.
Helpful books and/or manuals are
available when employees have problems
with the innovation.
Most employees have been so busy that
they have very little time to devote to the
implementation of innovation.
Our organization has encouraged
employees to take time off from their
regular work tasks to attend
implementation meetings and training
sessions.
Employees are well informed about the
implementation process.
Employees are well informed about the
strategic reasons behind the

182
implementation of innovations
Not at
all
Just a
little
To some
extent
Quite a
lot
A great
deal
I am confident that innovations would be
successful in this organisation
I expect that any innovations we
introduce would be successful.
We have successfully introduced innovations in the past.
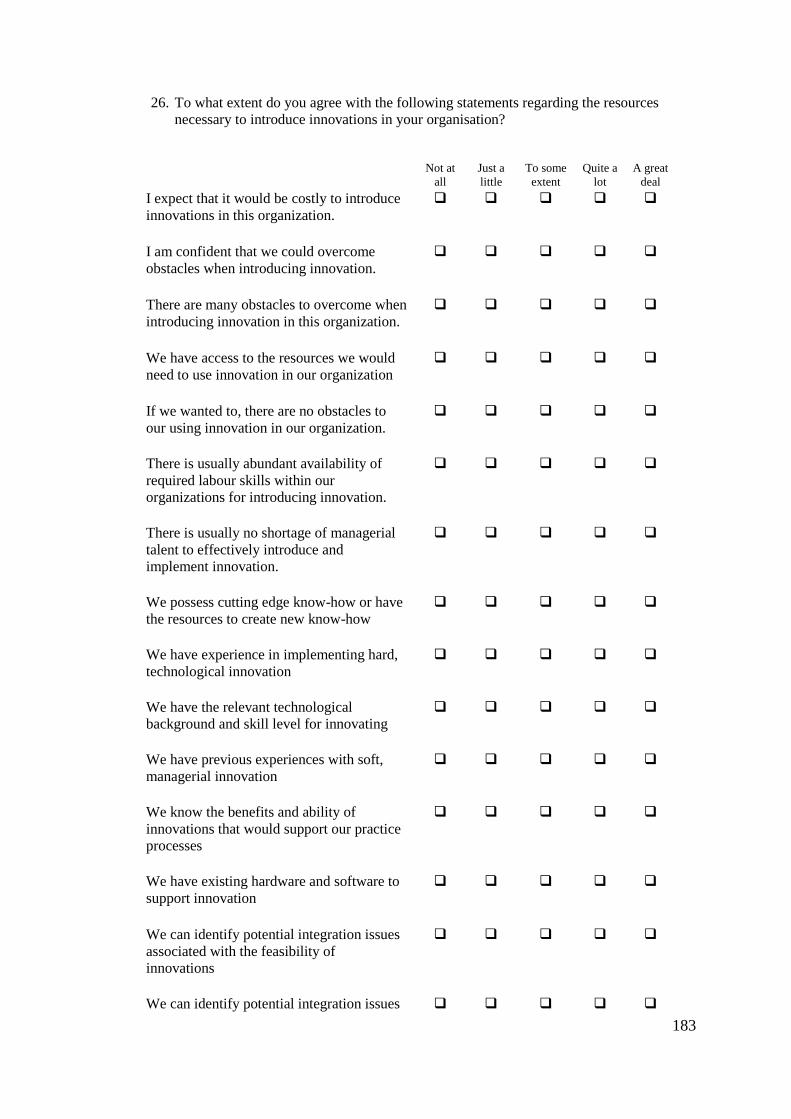
183
26. To what extent do you agree with the following statements regarding the resources
necessary to introduce innovations in your organisation?
Not at
all
Just a
little
To some
extent
Quite a
lot
A great
deal
I expect that it would be costly to introduce
innovations in this organization.
I am confident that we could overcome
obstacles when introducing innovation.
There are many obstacles to overcome when
introducing innovation in this organization.
We have access to the resources we would
need to use innovation in our organization
If we wanted to, there are no obstacles to
our using innovation in our organization.
There is usually abundant availability of
required labour skills within our
organizations for introducing innovation.
There is usually no shortage of managerial
talent to effectively introduce and
implement innovation.
We possess cutting edge know-how or have
the resources to create new know-how
We have experience in implementing hard,
technological innovation
We have the relevant technological
background and skill level for innovating
We have previous experiences with soft,
managerial innovation
We know the benefits and ability of
innovations that would support our practice
processes
We have existing hardware and software to
support innovation
We can identify potential integration issues
associated with the feasibility of
innovations
We can identify potential integration issues

184
associated with the implementation of
innovations
We can identify potential integration issues
associated with the future obsolescence of
innovations.
Innovation, Your Organisation, & External Agencies
This section is concerned with your organization’s use of external agencies in the adoption
and implementation of new products, services and ways of working.
27. To what extent do you believe that the following agencies think you should introduce
innovation into your organization?
Not at
all
Just a
little
To some
extent
Quite a
lot
A great
deal
Your suppliers
Your customers
Your competitors and the industry more
generally
Technology diffusion agencies
Government agencies/departments
Professional associations/networks
28. To what extent do you value the opinions of the following agencies in relation to
introducing innovation in your organization?
Not at
all
Just a
little
To some
extent
Quite a
lot
A great
deal
Your suppliers
Your customers
Your competitors and the industry more
generally
Technology diffusion agencies
Government agencies/departments
Professional associations/networks
29. Have you had contact with technology diffusion agencies? Yes No
If no, please go to Question X.
No
contact
Little
contact
Some
contact
A fairly
large
amount
A very
large
amount
30. What is the amount of contact
you have had with technology
diffusion agencies?

185
31. Who initiated the contact between yourselves and the technology diffusion agencies?
a. you/your organization
b. the technology diffusion agency
c. mutual/both
32. To what extent do the following provide you and/or your organization with awareness of
potentially relevant innovations? To what extent do they provide you and/or your
organization with access to innovation? And, to what extent do they assist you in
implementing innovation?
For each of the above questions, please rate the agencies on the following scale:
1 – Not at all; 2 – Just a little; 3 – To some extent; 4 – Quite a lot; 5 – A great deal
Awareness Access Assistance
Technology consultancy firms
Technology diffusion agencies
Government agencies / departments
Universities or higher education
institutes
You
33. Please indicate your current job title or
position:____________________________________
34. Length of service with the organization: (in years) __________________________
35. Length of service in your current role or position: (in years)
___________________________
36. What is your highest education level?
a. High school
b. Undergraduate
c. Post graduate
d. Certification or Diploma
e. Other(please specify):_____________________________
37. Are you presently considering a specific innovation in your organisation? Yes No
If no, why not?
__________________________________________________________________________
__________________________________________________________________________

186
__________________________________________________________________________
__________________________________________________________________________
38. Would you be interested in participating in future research on innovation in Australian
organisations? Yes No
THANK YOU.
PLEASE RETURN THIS SURVEY IN THE PREPAID ENVELOPE.