Embed Size (px)
Citation preview

4/28/2020
1
Organic Shale Refracs-Can They Be Economically Done at
Current Prices?Robert Barba
Integrated Energy Services IncApril 30th, 2020
Executive Summary• With the current low price environment,
significantly lowering completion costs while maximizing recovery is critical to economic survival
• Refraccing organic shale primary wells presents a unique opportunity to produce more hydrocarbons at less cost and deliver superior returns than new well drilling and completions
• Our study shows the potential to significantly improve field economics through the use of Extreme Limited Entry and mechanical isolation using expandable liners
• Biggest opportunities Pure gas plays of Haynesville, Marcellus
and downdip Eagle Ford Oil window of the Eagle Ford and in the
Southern Midland BasinIntegrated Energy Services Inc
4/28/2020
2
What do refracs and Rodney have in common?• Last two down cycles (2009 and
2015) saw a huge increase in refrac discussion and conferences
• Poor results from the extensive use of diverters rightfully earned refracs very little respect
• From 2017 on mechanical isolation methods were finally accepted, results now very consistent
Integrated Energy Services Inc
“Current Prices” = NYMEX Strip 4/23/20
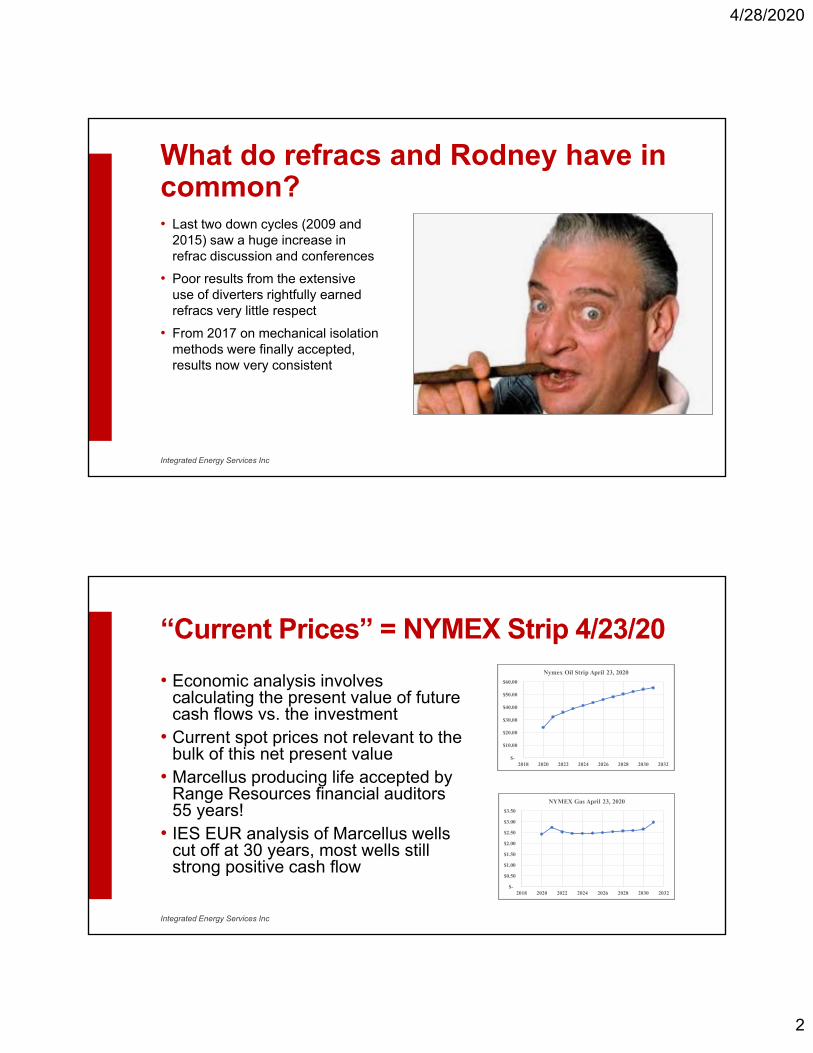
• Economic analysis involves calculating the present value of future cash flows vs. the investment
• Current spot prices not relevant to the bulk of this net present value
• Marcellus producing life accepted by Range Resources financial auditors 55 years!
• IES EUR analysis of Marcellus wells cut off at 30 years, most wells still strong positive cash flow
$-
$10.00
$20.00
$30.00
$40.00
$50.00
$60.00
2018 2020 2022 2024 2026 2028 2030 2032
Nymex Oil Strip April 23, 2020
$-
$10.00
$20.00
$30.00
$40.00
$50.00
$60.00
2018 2020 2022 2024 2026 2028 2030 2032
Nymex Oil Strip April 23, 2020
$-
$0.50
$1.00
$1.50
$2.00
$2.50
$3.00
$3.50
2018 2020 2022 2024 2026 2028 2030 2032
NYMEX Gas April 23, 2020
$-
$0.50
$1.00
$1.50
$2.00
$2.50
$3.00
$3.50
2018 2020 2022 2024 2026 2028 2030 2032
NYMEX Gas April 23, 2020
Integrated Energy Services Inc
4/28/2020
3
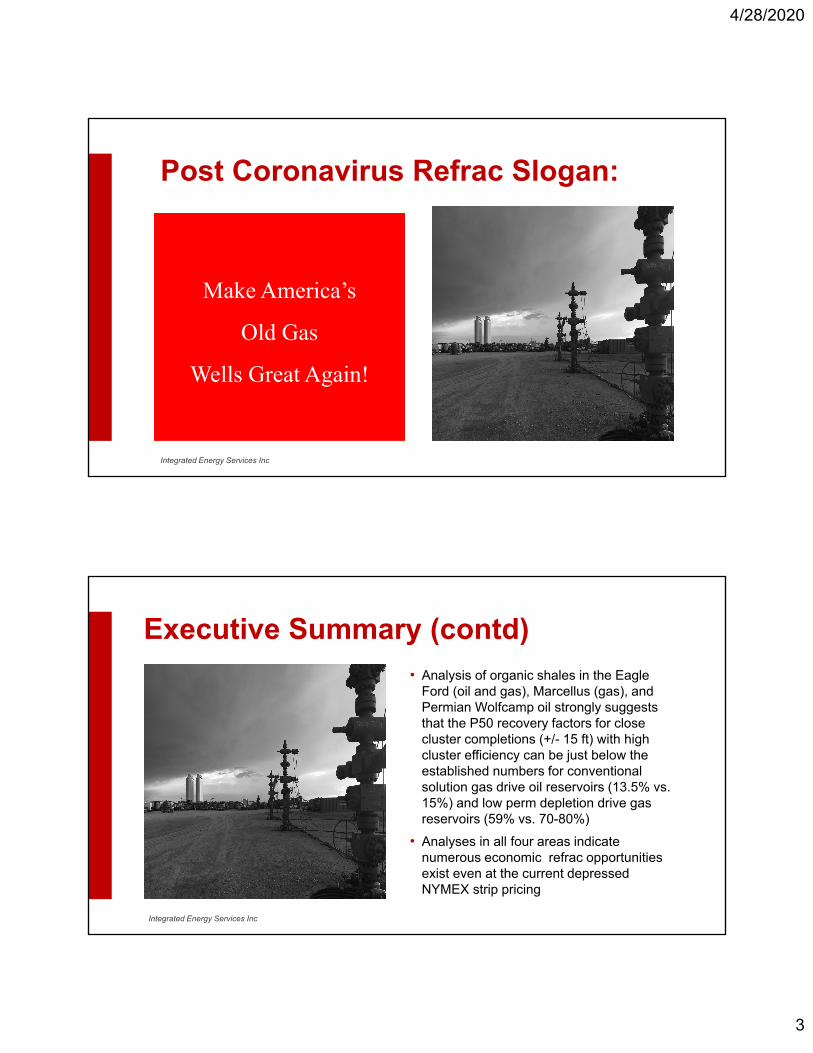
Post Coronavirus Refrac Slogan:
Integrated Energy Services Inc
Make America’s
Old Gas
Wells Great Again!
Executive Summary (contd)• Analysis of organic shales in the Eagle
Ford (oil and gas), Marcellus (gas), and Permian Wolfcamp oil strongly suggests that the P50 recovery factors for close cluster completions (+/- 15 ft) with high cluster efficiency can be just below the established numbers for conventional solution gas drive oil reservoirs (13.5% vs. 15%) and low perm depletion drive gas reservoirs (59% vs. 70-80%)
• Analyses in all four areas indicate numerous economic refrac opportunities exist even at the current depressed NYMEX strip pricing
Integrated Energy Services Inc
4/28/2020
4
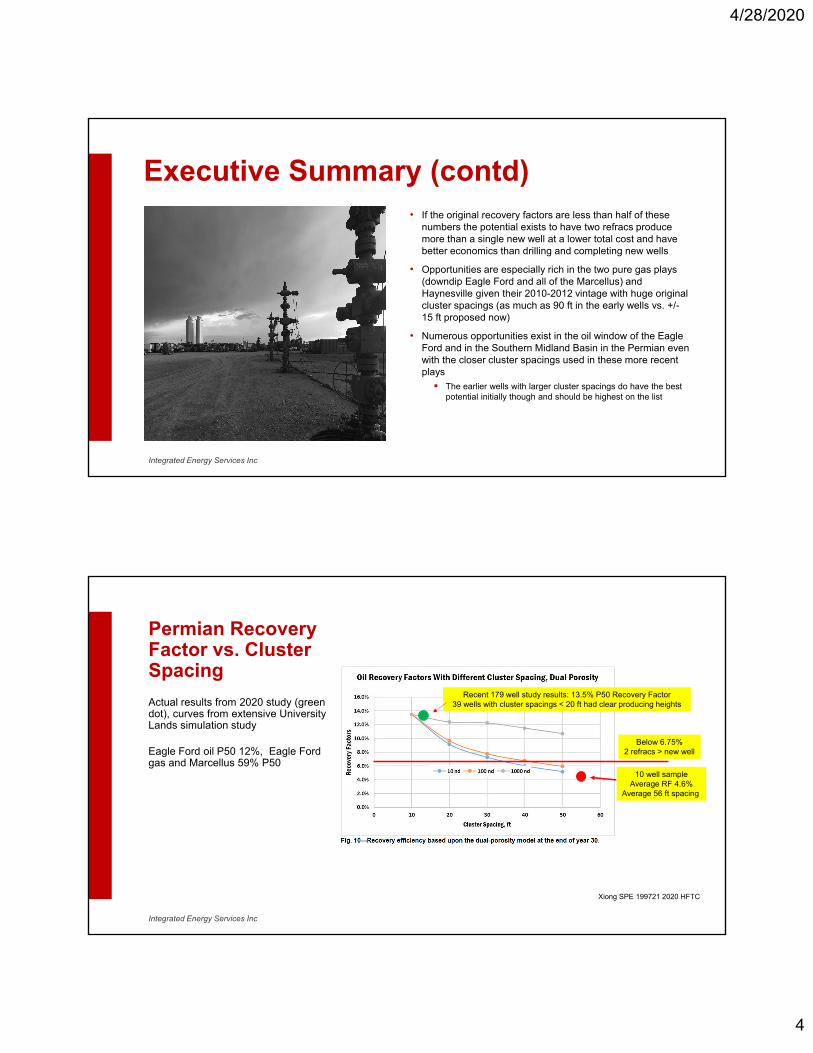
• If the original recovery factors are less than half of these numbers the potential exists to have two refracs produce more than a single new well at a lower total cost and have better economics than drilling and completing new wells
• Opportunities are especially rich in the two pure gas plays (downdip Eagle Ford and all of the Marcellus) and Haynesville given their 2010-2012 vintage with huge original cluster spacings (as much as 90 ft in the early wells vs. +/-15 ft proposed now)
• Numerous opportunities exist in the oil window of the Eagle Ford and in the Southern Midland Basin in the Permian even with the closer cluster spacings used in these more recent plays
The earlier wells with larger cluster spacings do have the best potential initially though and should be highest on the list
Executive Summary (contd)
Integrated Energy Services Inc
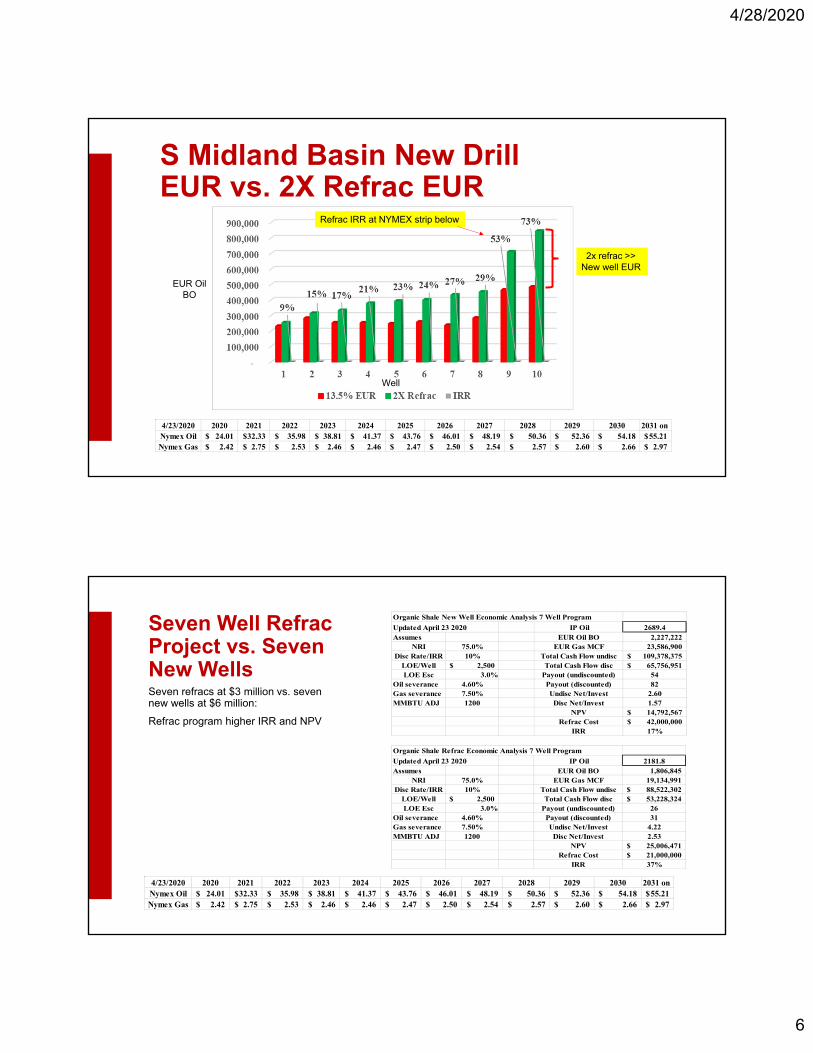
Permian Recovery Factor vs. Cluster Spacing
Actual results from 2020 study (green dot), curves from extensive University Lands simulation study
Eagle Ford oil P50 12%, Eagle Ford gas and Marcellus 59% P50
Xiong SPE 199721 2020 HFTC
Recent 179 well study results: 13.5% P50 Recovery Factor39 wells with cluster spacings < 20 ft had clear producing heights
Below 6.75%2 refracs > new well
10 well sampleAverage RF 4.6%
Average 56 ft spacing
Integrated Energy Services Inc

4/28/2020
5
Size of the Prize-Southern Midland Basin Sample
Over 40 foot spacing wells have the highest probability of having less than a 6.75% recovery factor
Need to also consider OIP within the drained height, must be high enough with a 13.5% post refrac recovery
Integrated Energy Services Inc
Historical Cluster Spacing (2011 Survey)
SPE 144326 (2011)
CHK/STO Marcellus project August 2011: over 450 wells producing with 90 ft cluster spacingPetrohawk 2010 wells in Eagle Ford 90 ft spacing
“Best Practices” now +/- 15 ft
Cluster Clusters Stage AveragePlay Spacing Per Stage Spacing Thickness
Woodford 130 4.2 546 170Barnett 183 3.3 604 350
Fayetteville 120 4.3 516 110Eagle Ford 72 2.8 202 200Haynesville 87 4.5 392 250Marcellus 50 5.2 260 125
Average 107 4.1 420 201
*
*
Integrated Energy Services Inc
4/28/2020
6
S Midland Basin New Drill EUR vs. 2X Refrac EUR
Well
EUR OilBO
Refrac IRR at NYMEX strip below
2x refrac >> New well EUR
4/23/2020 2020 2021 2022 2023 2024 2025 2026 2027 2028 2029 2030 2031 onNymex Oil 24.01$ 32.33$ 35.98$ 38.81$ 41.37$ 43.76$ 46.01$ 48.19$ 50.36$ 52.36$ 54.18$ 55.21$ Nymex Gas 2.42$ 2.75$ 2.53$ 2.46$ 2.46$ 2.47$ 2.50$ 2.54$ 2.57$ 2.60$ 2.66$ 2.97$
Seven Well RefracProject vs. Seven New WellsSeven refracs at $3 million vs. seven new wells at $6 million:
Refrac program higher IRR and NPV
4/23/2020 2020 2021 2022 2023 2024 2025 2026 2027 2028 2029 2030 2031 onNymex Oil 24.01$ 32.33$ 35.98$ 38.81$ 41.37$ 43.76$ 46.01$ 48.19$ 50.36$ 52.36$ 54.18$ 55.21$ Nymex Gas 2.42$ 2.75$ 2.53$ 2.46$ 2.46$ 2.47$ 2.50$ 2.54$ 2.57$ 2.60$ 2.66$ 2.97$
Organic Shale Refrac Economic Analysis 7 Well Program
Updated April 23 2020 IP Oil 2181.8Assumes EUR Oil BO 1,806,845
NRI 75.0% EUR Gas MCF 19,134,991 Disc Rate/IRR 10% Total Cash Flow undisc 88,522,302$
LOE/Well 2,500$ Total Cash Flow disc 53,228,324$ LOE Esc 3.0% Payout (undiscounted) 26
Oil severance 4.60% Payout (discounted) 31Gas severance 7.50% Undisc Net/Invest 4.22MMBTU ADJ 1200 Disc Net/Invest 2.53
NPV 25,006,471$ Refrac Cost 21,000,000$
IRR 37%
Organic Shale New Well Economic Analysis 7 Well Program
Updated April 23 2020 IP Oil 2689.4Assumes EUR Oil BO 2,227,222
NRI 75.0% EUR Gas MCF 23,586,900 Disc Rate/IRR 10% Total Cash Flow undisc 109,378,375$
LOE/Well 2,500$ Total Cash Flow disc 65,756,951$ LOE Esc 3.0% Payout (undiscounted) 54
Oil severance 4.60% Payout (discounted) 82Gas severance 7.50% Undisc Net/Invest 2.60MMBTU ADJ 1200 Disc Net/Invest 1.57
NPV 14,792,567$ Refrac Cost 42,000,000$
IRR 17%

4/28/2020
7
Well Number 10 (Top Candidate) Petrophysical Analysis
prop/ft BBL/ft Clust Spc RF CONT OIP Cum Oil Cum Gas 13.5% RF Refrac EUR Orig EUR965 27.1 78.0 2.3% 3,582,778 61,104 643,543 483,675 422,571 83,037
Top 6730
6821 lateral
Base 6870A quality
78 FT Cluster Spacing
Integrated Energy Services Inc
Well Number 10 (Top Candidate) Economic Analysis
Organic Shale Refrac Economic Analysis Well 10
Updated April 23 2020 IP Oil 510.3 Assumes EUR Oil BO 422,571 4/23/2020 2020 2021 2022 2023 2024 2025 2026 2027 2028 2029 2030 2031 on
NRI 75.0% EUR Gas MCF 4,475,144 Nymex Oil 24.01$ 32.33$ 35.98$ 38.81$ 41.37$ 43.76$ 46.01$ 48.19$ 50.36$ 52.36$ 54.18$ 55.21$ Disc Rate/IRR 73% Total Cash Flow undisc 19,844,616$ Nymex Gas 2.42$ 2.75$ 2.53$ 2.46$ 2.46$ 2.47$ 2.50$ 2.54$ 2.57$ 2.60$ 2.66$ 2.97$
LOE/Well 2,500$ Total Cash Flow disc 4,663,532$ 15-AprLOE Esc 3.0% Payout (undiscounted) 13 15
Oil severance 4.60% Payout (discounted) 240 16Gas severance 7.50% Undisc Net/Invest 6.61 6.0MMBTU ADJ 1200 Disc Net/Invest 1.6 3.7
NPV 0$ 6,832,985$ Refrac Cost 3,000,000$ 3,000,000$
NGLs captured in MMBTU adjustme IRR 73% 68.0% IP GOR NRI NRI NRI NRI WI WI WI WI
2.5 75.0% 75.0% 75.0% 75.0% 100.0% 100.0% 100.0% 100.0% 100.0% Oil Gas Oil Gas Gas Oil Oil Gas 0.046 0.075 Operating Future Cum Disc Future Cum Disc Well Rate Rate Rate Rate Price Price Revenue Revenue Oil Gas Expense Net Cash Cash Flow Net Cash Cash Flow Oil Gas
Month Count BOPD MCFD BOPM MCFM $/MMBTU $BBL Severance Severance Per Well Flow $ $ Flow $ $ Decline DeclineJun-20 1 510 1276 15532 38831 2.42$ 24.01$ 279,684$ 70,612$ 12,865$ 5,296$ 2,500$ 329,634$ 329,634$ 310,839$ 310,839$ 0 1Jul-20 1 418 1264 12723 38486 2.42$ 24.01$ 229,102$ 69,983$ 10,539$ 5,249$ 2,506$ 280,791$ 610,425$ 249,684$ 560,522$ 0.81915 0.9911033Aug-20 1 357 1253 10860 38144 2.42$ 24.01$ 195,555$ 69,362$ 8,996$ 5,202$ 2,513$ 248,207$ 858,632$ 208,124$ 768,647$ 0.85357 0.9911191Sep-20 1 313 1242 9524 37806 2.42$ 24.01$ 171,500$ 68,747$ 7,889$ 5,156$ 2,519$ 224,683$ 1,083,315$ 177,657$ 946,304$ 0.87699 0.9911348
Very low initial recovery factor (2.3%) with high OIP top refrac candidate in S Midland basin study
Integrated Energy Services Inc
4/28/2020
8
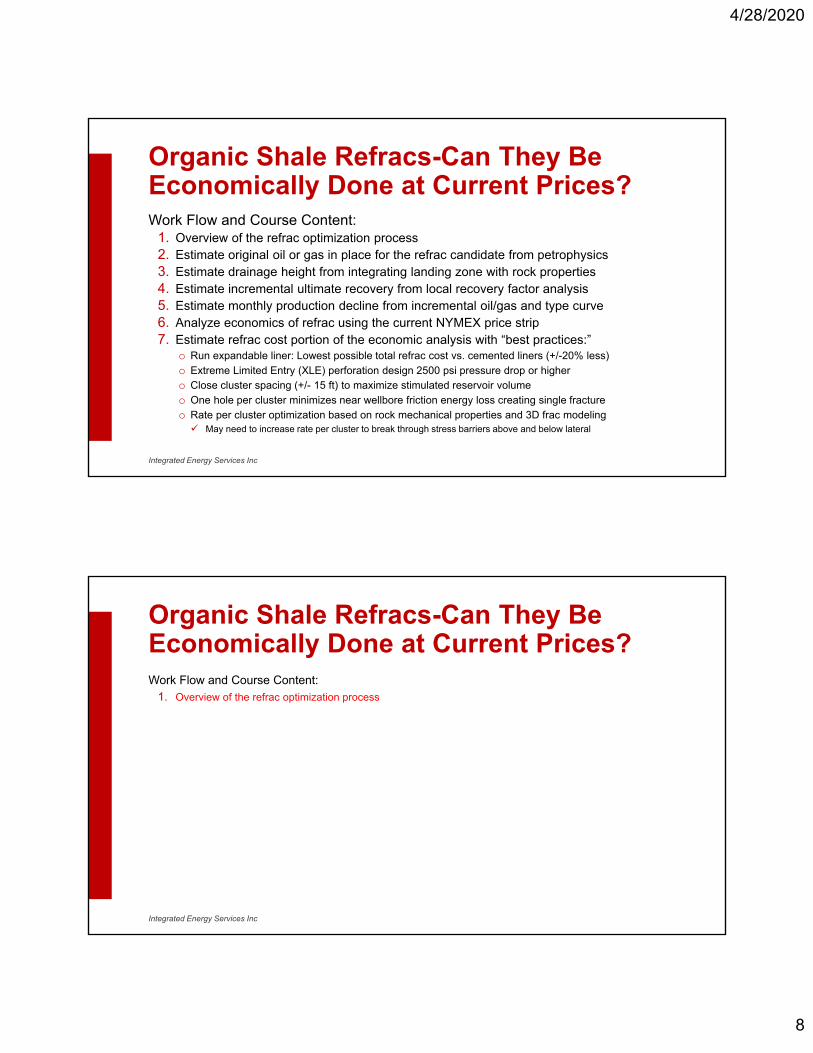
Organic Shale Refracs-Can They Be Economically Done at Current Prices?Work Flow and Course Content:
1. Overview of the refrac optimization process2. Estimate original oil or gas in place for the refrac candidate from petrophysics3. Estimate drainage height from integrating landing zone with rock properties4. Estimate incremental ultimate recovery from local recovery factor analysis5. Estimate monthly production decline from incremental oil/gas and type curve6. Analyze economics of refrac using the current NYMEX price strip 7. Estimate refrac cost portion of the economic analysis with “best practices:”
o Run expandable liner: Lowest possible total refrac cost vs. cemented liners (+/-20% less)
o Extreme Limited Entry (XLE) perforation design 2500 psi pressure drop or highero Close cluster spacing (+/- 15 ft) to maximize stimulated reservoir volume
o One hole per cluster minimizes near wellbore friction energy loss creating single fracture
o Rate per cluster optimization based on rock mechanical properties and 3D frac modeling May need to increase rate per cluster to break through stress barriers above and below lateral
Integrated Energy Services Inc
Organic Shale Refracs-Can They Be Economically Done at Current Prices?Work Flow and Course Content:
1. Overview of the refrac optimization process
Integrated Energy Services Inc

4/28/2020
9
Organic Shale Refrac Main Value Drivers• Access and contact significant volumes of unstimulated rock from
cluster spacings wider than 15 ft and low frac fluid and proppant loadings
• Increase production at the minimum possible cost implementing “best practices” for cluster spacing, proppant loading, and fluid loading, must compete for capital with new well completions
• Enhance and protect production of primary wells while avoiding up to 40% losses in infill well once pad operations resume
• Anything less than a full volume preload (several hundred thousand barrels) or a refrac will result in significant NPV losses
Integrated Energy Services Inc
Refrac Primary Execution Challenges
• Control fracture entry points to stimulate as close to 100% of the new rock and recharge 100% of the depleted intervals Recharge not critical for all wells if no primary-infill issues but restricting
flow into old clusters important for new rock stimulation
• Execute a premium optimized frac at the lowest cost per barrel or MCF possible using “best practices”
• XLE and expandable liners will maximize SRV at the lowest cost Higher pump rates with the larger ID expandable liners can result in
longer stage lengths and fewer stages Once liner is installed the refrac treatment is identical to a new well
completion and conventional plug and perf operations can begino XLE will ensure high cluster efficiency (85-90%) even with longer stages (see
next slide from SM fiber optic study)
Integrated Energy Services Inc
4/28/2020
10
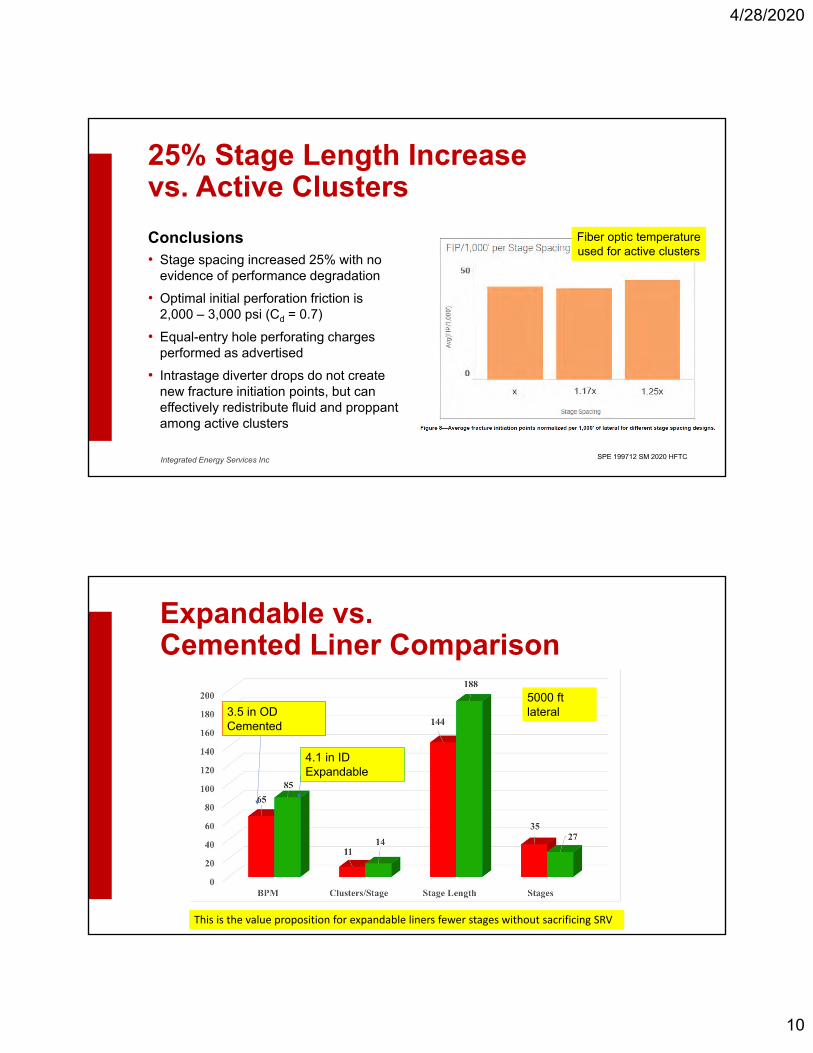
25% Stage Length Increase vs. Active Clusters
Conclusions• Stage spacing increased 25% with no
evidence of performance degradation
• Optimal initial perforation friction is 2,000 – 3,000 psi (Cd = 0.7)
• Equal-entry hole perforating charges performed as advertised
• Intrastage diverter drops do not create new fracture initiation points, but can effectively redistribute fluid and proppant among active clusters
SPE 199712 SM 2020 HFTC
Fiber optic temperatureused for active clusters
Integrated Energy Services Inc
Expandable vs. Cemented Liner Comparison
5000 ft lateral3.5 in OD
Cemented
4.1 in ID Expandable
This is the value proposition for expandable liners fewer stages without sacrificing SRV
4/28/2020
11
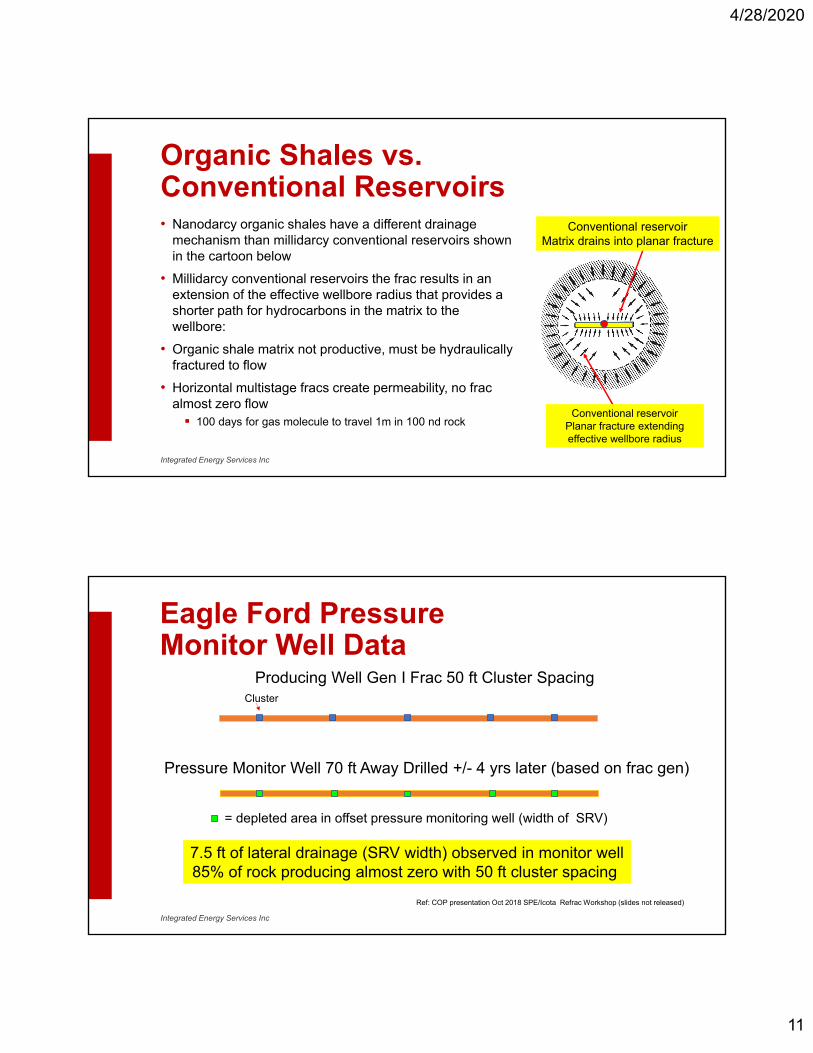
Organic Shales vs. Conventional Reservoirs• Nanodarcy organic shales have a different drainage
mechanism than millidarcy conventional reservoirs shown in the cartoon below
• Millidarcy conventional reservoirs the frac results in an extension of the effective wellbore radius that provides a shorter path for hydrocarbons in the matrix to the wellbore:
• Organic shale matrix not productive, must be hydraulically fractured to flow
• Horizontal multistage fracs create permeability, no frac almost zero flow 100 days for gas molecule to travel 1m in 100 nd rock
Conventional reservoirPlanar fracture extending effective wellbore radius
Conventional reservoirMatrix drains into planar fracture
Integrated Energy Services Inc
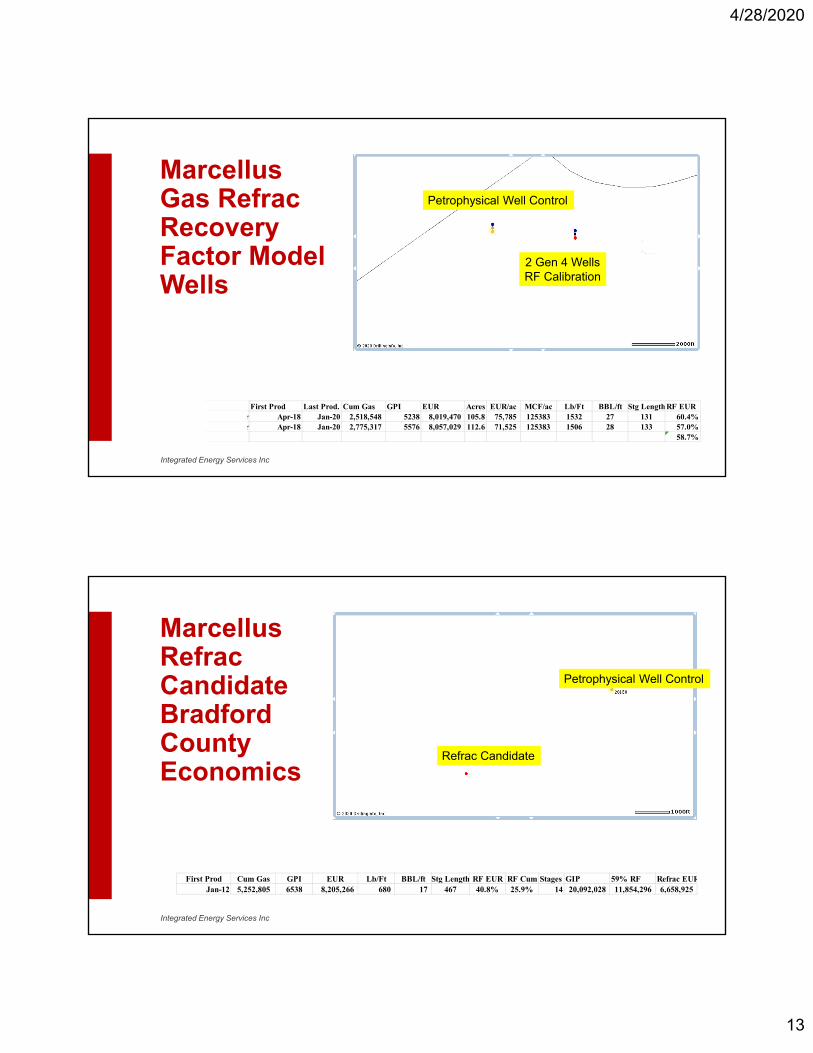
Eagle Ford Pressure Monitor Well Data
Producing Well Gen I Frac 50 ft Cluster Spacing
Pressure Monitor Well 70 ft Away Drilled +/- 4 yrs later (based on frac gen)
7.5 ft of lateral drainage (SRV width) observed in monitor well85% of rock producing almost zero with 50 ft cluster spacing
= depleted area in offset pressure monitoring well (width of SRV)
Cluster
Ref: COP presentation Oct 2018 SPE/Icota Refrac Workshop (slides not released)
Integrated Energy Services Inc

4/28/2020
12
6 Month Cum. Production vs. Cluster Spacing
23
Xiong et al SPE 199721 2020 HFTC
Integrated Energy Services Inc
Marcellus Gen 4 Example Bradford County 58.7% RF
First Prod Last Prod. Cum Gas GPI EUR Acres EUR/ac MCF/ac Lb/Ft BBL/ft Stg Length RF EURr Apr-18 Jan-20 2,518,548 5238 8,019,470 105.8 75,785 125383 1532 27 131 60.4%r Apr-18 Jan-20 2,775,317 5576 8,057,029 112.6 71,525 125383 1506 28 133 57.0%
58.7%
Integrated Energy Services Inc
4/28/2020
13
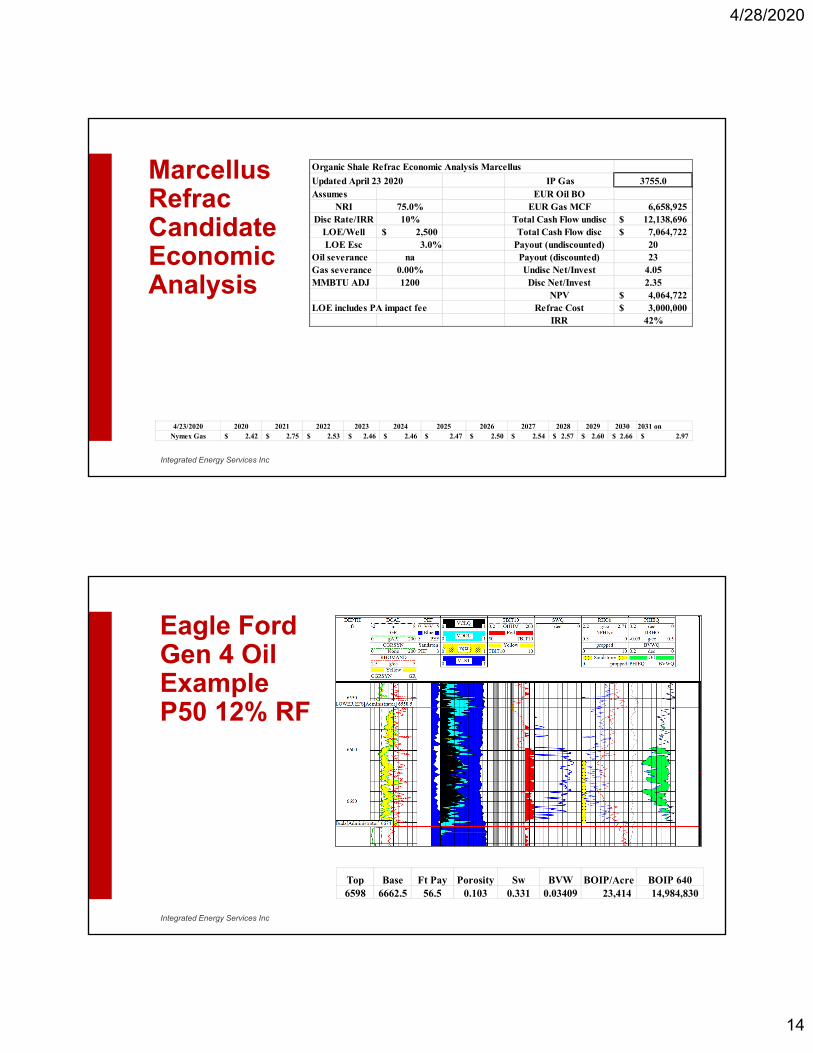
Marcellus Gas RefracRecovery Factor Model Wells
First Prod Last Prod. Cum Gas GPI EUR Acres EUR/ac MCF/ac Lb/Ft BBL/ft Stg LengthRF EURr Apr-18 Jan-20 2,518,548 5238 8,019,470 105.8 75,785 125383 1532 27 131 60.4%r Apr-18 Jan-20 2,775,317 5576 8,057,029 112.6 71,525 125383 1506 28 133 57.0%
58.7%
Petrophysical Well Control
2 Gen 4 WellsRF Calibration
Integrated Energy Services Inc
Marcellus RefracCandidate Bradford County Economics
First Prod Cum Gas GPI EUR Lb/Ft BBL/ft Stg Length RF EUR RF Cum Stages GIP 59% RF Refrac EURJan-12 5,252,805 6538 8,205,266 680 17 467 40.8% 25.9% 14 20,092,028 11,854,296 6,658,925
Refrac Candidate
Petrophysical Well Control
Integrated Energy Services Inc
4/28/2020
14
Marcellus RefracCandidate Economic Analysis
Organic Shale Refrac Economic Analysis Marcellus
Updated April 23 2020 IP Gas 3755.0Assumes EUR Oil BO
NRI 75.0% EUR Gas MCF 6,658,925 Disc Rate/IRR 10% Total Cash Flow undisc 12,138,696$
LOE/Well 2,500$ Total Cash Flow disc 7,064,722$ LOE Esc 3.0% Payout (undiscounted) 20
Oil severance na Payout (discounted) 23Gas severance 0.00% Undisc Net/Invest 4.05MMBTU ADJ 1200 Disc Net/Invest 2.35
NPV 4,064,722$ LOE includes PA impact fee Refrac Cost 3,000,000$
IRR 42%
4/23/2020 2020 2021 2022 2023 2024 2025 2026 2027 2028 2029 2030 2031 onNymex Gas 2.42$ 2.75$ 2.53$ 2.46$ 2.46$ 2.47$ 2.50$ 2.54$ 2.57$ 2.60$ 2.66$ 2.97$
Integrated Energy Services Inc
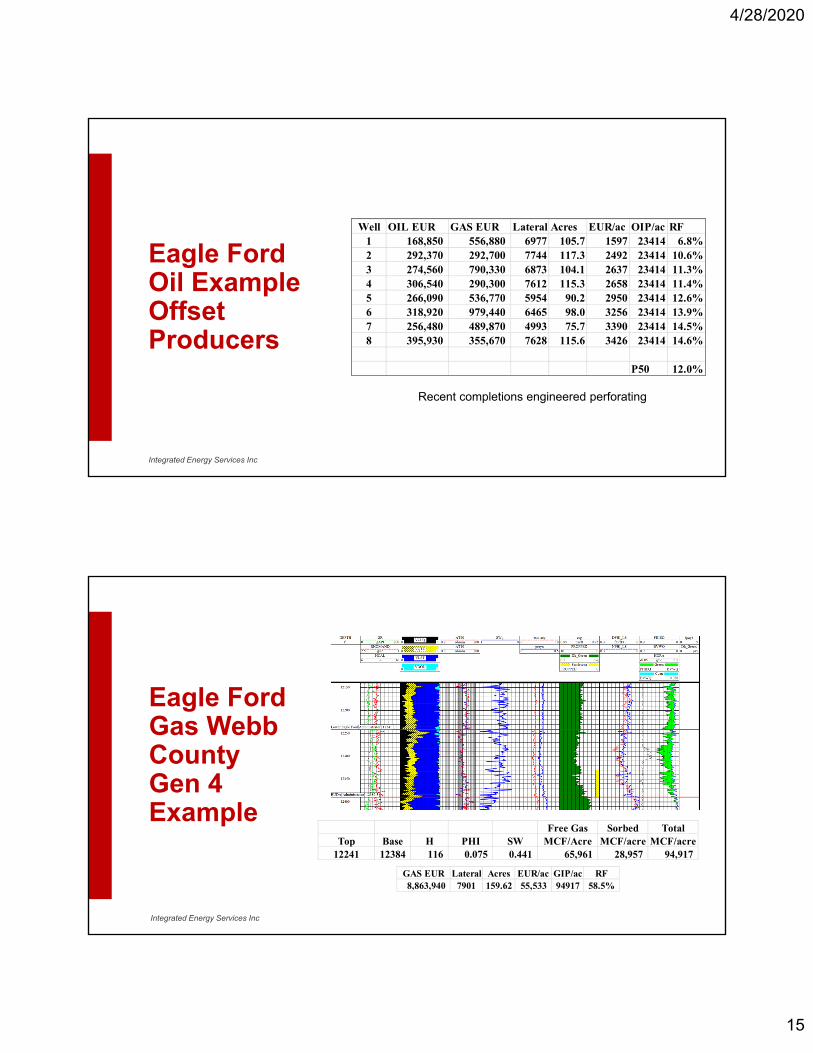
Eagle Ford Gen 4 Oil Example P50 12% RF
Top Base Ft Pay Porosity Sw BVW BOIP/Acre BOIP 6406598 6662.5 56.5 0.103 0.331 0.03409 23,414 14,984,830
Integrated Energy Services Inc
4/28/2020
15
Eagle Ford Oil Example Offset Producers
Well OIL EUR GAS EUR Lateral Acres EUR/ac OIP/ac RF1 168,850 556,880 6977 105.7 1597 23414 6.8%2 292,370 292,700 7744 117.3 2492 23414 10.6%3 274,560 790,330 6873 104.1 2637 23414 11.3%4 306,540 290,300 7612 115.3 2658 23414 11.4%5 266,090 536,770 5954 90.2 2950 23414 12.6%6 318,920 979,440 6465 98.0 3256 23414 13.9%7 256,480 489,870 4993 75.7 3390 23414 14.5%8 395,930 355,670 7628 115.6 3426 23414 14.6%
P50 12.0%
Recent completions engineered perforating
Integrated Energy Services Inc
Eagle Ford Gas Webb County Gen 4 Example
GAS EUR Lateral Acres EUR/ac GIP/ac RF8,863,940 7901 159.62 55,533 94917 58.5%
Free Gas Sorbed TotalTop Base H PHI SW MCF/Acre MCF/acre MCF/acre
12241 12384 116 0.075 0.441 65,961 28,957 94,917
Integrated Energy Services Inc
4/28/2020
16
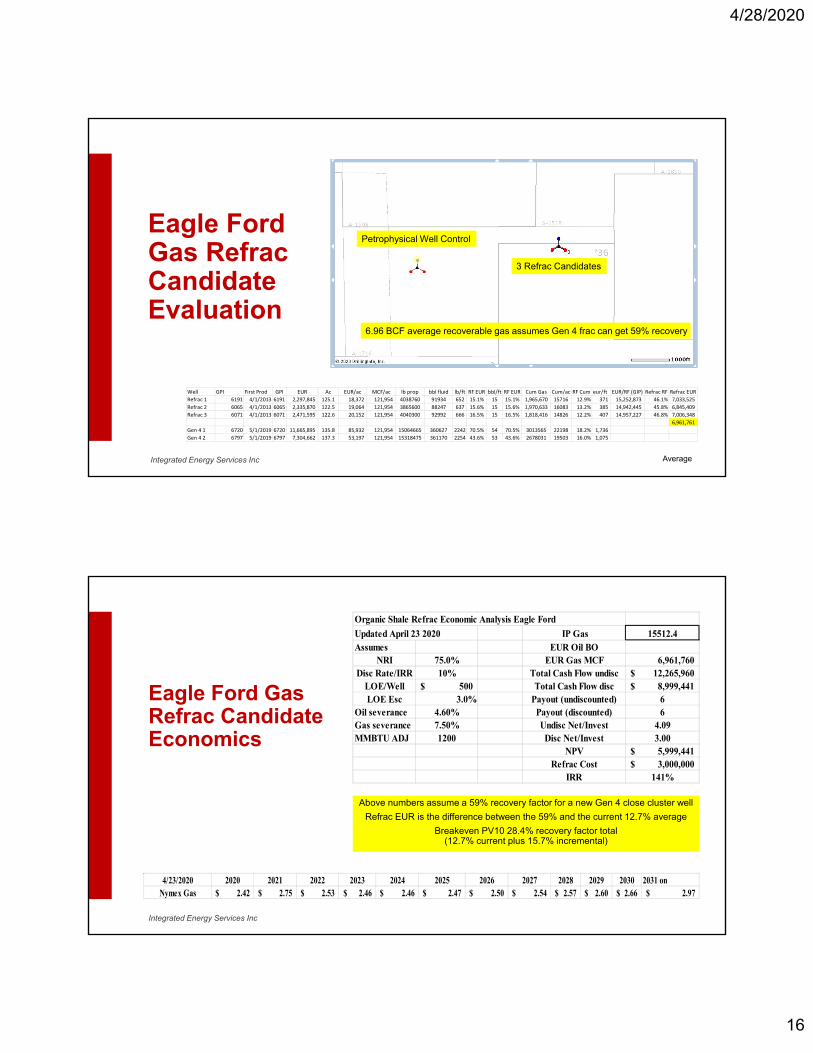
Eagle Ford Gas RefracCandidate Evaluation
Well GPI First Prod GPI EUR Ac EUR/ac MCF/ac lb prop bbl fluid lb/ft RF EUR bbl/ft RF EUR Cum Gas Cum/ac RF Cum eur/ft EUR/RF (GIP) Refrac RF Refrac EUR
Refrac 1 6191 4/1/2013 6191 2,297,845 125.1 18,372 121,954 4038760 91934 652 15.1% 15 15.1% 1,965,670 15716 12.9% 371 15,252,873 46.1% 7,033,525
Refrac 2 6065 4/1/2013 6065 2,335,870 122.5 19,064 121,954 3865600 88247 637 15.6% 15 15.6% 1,970,633 16083 13.2% 385 14,942,445 45.8% 6,845,409
Refrac 3 6071 4/1/2013 6071 2,471,595 122.6 20,152 121,954 4040300 92992 666 16.5% 15 16.5% 1,818,416 14826 12.2% 407 14,957,227 46.8% 7,006,348
6,961,761
Gen 4 1 6720 5/1/2019 6720 11,665,895 135.8 85,932 121,954 15064665 360627 2242 70.5% 54 70.5% 3013565 22198 18.2% 1,736
Gen 4 2 6797 5/1/2019 6797 7,304,662 137.3 53,197 121,954 15318475 361170 2254 43.6% 53 43.6% 2678031 19503 16.0% 1,075
Petrophysical Well Control
3 Refrac Candidates
6.96 BCF average recoverable gas assumes Gen 4 frac can get 59% recovery
AverageIntegrated Energy Services Inc
Eagle Ford Gas Refrac Candidate Economics
Organic Shale Refrac Economic Analysis Eagle Ford
Updated April 23 2020 IP Gas 15512.4Assumes EUR Oil BO
NRI 75.0% EUR Gas MCF 6,961,760 Disc Rate/IRR 10% Total Cash Flow undisc 12,265,960$
LOE/Well 500$ Total Cash Flow disc 8,999,441$ LOE Esc 3.0% Payout (undiscounted) 6
Oil severance 4.60% Payout (discounted) 6Gas severance 7.50% Undisc Net/Invest 4.09MMBTU ADJ 1200 Disc Net/Invest 3.00
NPV 5,999,441$ Refrac Cost 3,000,000$
IRR 141%
Above numbers assume a 59% recovery factor for a new Gen 4 close cluster well
Refrac EUR is the difference between the 59% and the current 12.7% average
Breakeven PV10 28.4% recovery factor total (12.7% current plus 15.7% incremental)
4/23/2020 2020 2021 2022 2023 2024 2025 2026 2027 2028 2029 2030 2031 onNymex Gas 2.42$ 2.75$ 2.53$ 2.46$ 2.46$ 2.47$ 2.50$ 2.54$ 2.57$ 2.60$ 2.66$ 2.97$
Integrated Energy Services Inc

4/28/2020
17
Primary Well?Refrac needed-save
40% of infill well EUR $PV10>> Full Preload
Yes
Recovery FactorAnalysis
No
OIP Economic?Yes
OIP Economic?No
Not a refraccandidate
Refrac options review
Most efficient: ExpandablesLess efficient: Cemented linersRandom results: Diverters
Implement refrac13.3 ft 1 shot/cluster
XLE & PnP Frac Gen 3+
Zipper fracs forInfill wells on pad
Organic ShaleRefrac ProcessFlow Chart
Integrated Energy Services Inc
Horizontal Organic Shale Refracs
• As more infill wells were completed it became apparent that there were issues involved with Fracture Driven Interactions (FDI’s or “frac hits”)
• Initially the focus was on avoiding production losses in the primary wells as infill well FDIs often damaged or killed the primary wells
• As production was established it became apparent that the recovery factors of the initial infill wells were lower than what should be expected from the OIP and offset recovery factors normalized to the frac vintage
• Recent work done by Elliott (2019) suggests that the only viable options for primary well protection are refracs and full volume preloads with water
• The full volume preload requires replacement of a large % of the oil and water produced from where it was produced to restore original pore pressure
Integrated Energy Services Inc
4/28/2020
18
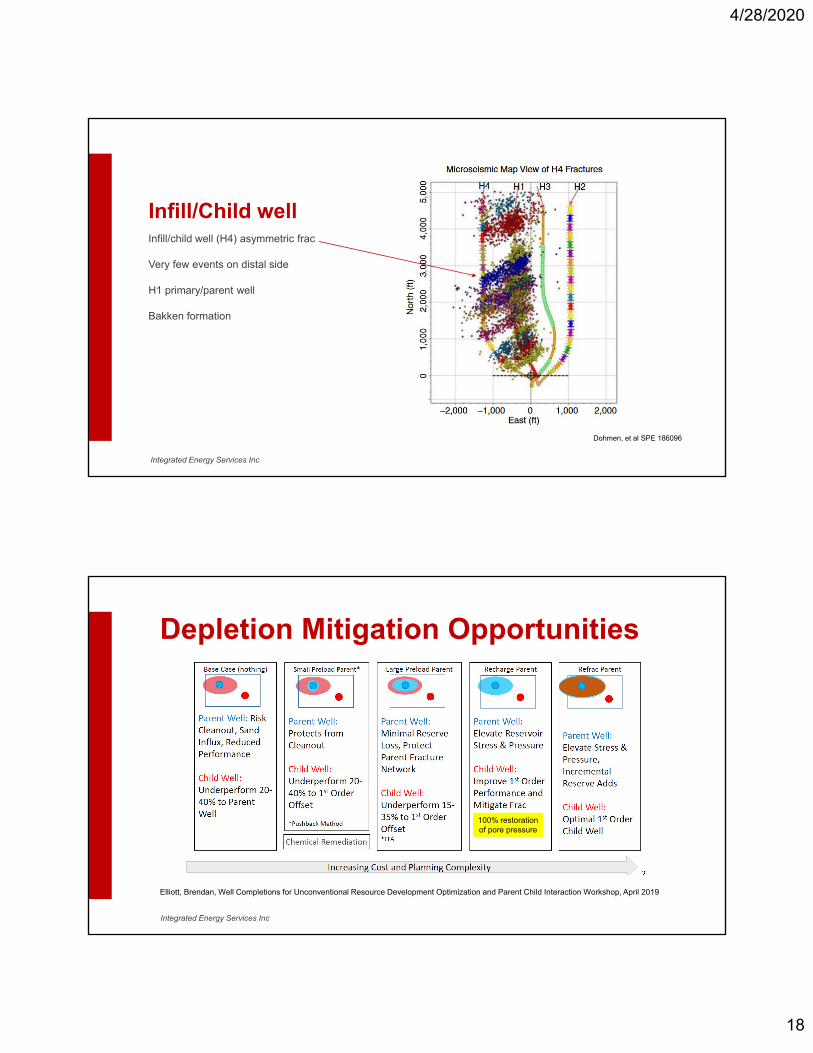
Dohmen, et al SPE 186096
Infill/Child wellInfill/child well (H4) asymmetric frac
Very few events on distal side
H1 primary/parent well
Bakken formation
Integrated Energy Services Inc
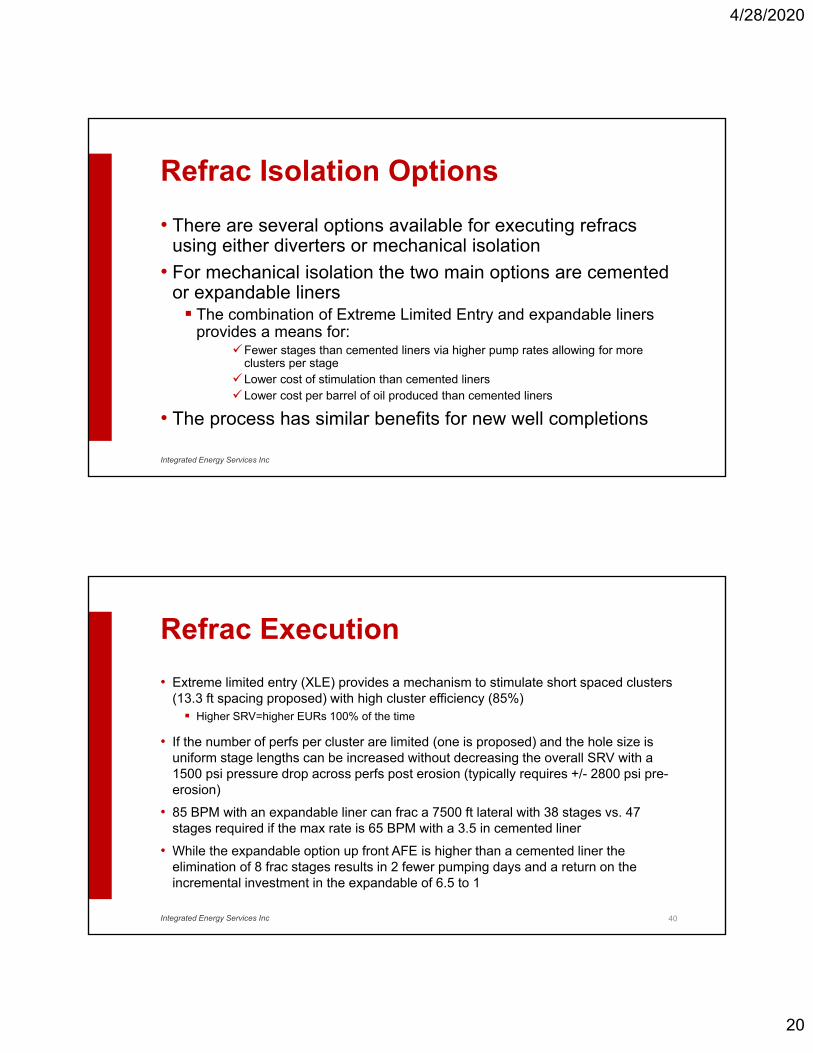
Elliott, Brendan, Well Completions for Unconventional Resource Development Optimization and Parent Child Interaction Workshop, April 2019
Depletion Mitigation Opportunities
100% restorationof pore pressure
Integrated Energy Services Inc

4/28/2020
19
Red = stranded hydrocarbons
Depletion Mitigation Results
Red = stranded hydrocarbons
Integrated Energy Services Inc
Primary Well Refrac Issues
• The refrac treatment needs to recharge the existing clusters to prevent infill well asymmetric fractures
• The treatment should access as much “new rock” as possible to increase primary well production as much as economically possible
• Both mechanisms require complete isolation of the existing perforations to effectively stimulate both the new and existing clusters
• Mechanical isolation is strongly recommended vs. attempting to divert with chemicals, fiber, or ball sealers
• The two viable options for mechanical isolation are expandable liners and cemented casing
Integrated Energy Services Inc
4/28/2020
20
Refrac Isolation Options
• There are several options available for executing refracs using either diverters or mechanical isolation
• For mechanical isolation the two main options are cemented or expandable liners The combination of Extreme Limited Entry and expandable liners
provides a means for:Fewer stages than cemented liners via higher pump rates allowing for more
clusters per stageLower cost of stimulation than cemented linersLower cost per barrel of oil produced than cemented liners
• The process has similar benefits for new well completions
Integrated Energy Services Inc
Refrac Execution
• Extreme limited entry (XLE) provides a mechanism to stimulate short spaced clusters (13.3 ft spacing proposed) with high cluster efficiency (85%) Higher SRV=higher EURs 100% of the time
• If the number of perfs per cluster are limited (one is proposed) and the hole size is uniform stage lengths can be increased without decreasing the overall SRV with a 1500 psi pressure drop across perfs post erosion (typically requires +/- 2800 psi pre-erosion)
• 85 BPM with an expandable liner can frac a 7500 ft lateral with 38 stages vs. 47 stages required if the max rate is 65 BPM with a 3.5 in cemented liner
• While the expandable option up front AFE is higher than a cemented liner the elimination of 8 frac stages results in 2 fewer pumping days and a return on the incremental investment in the expandable of 6.5 to 1
40Integrated Energy Services Inc
4/28/2020
21
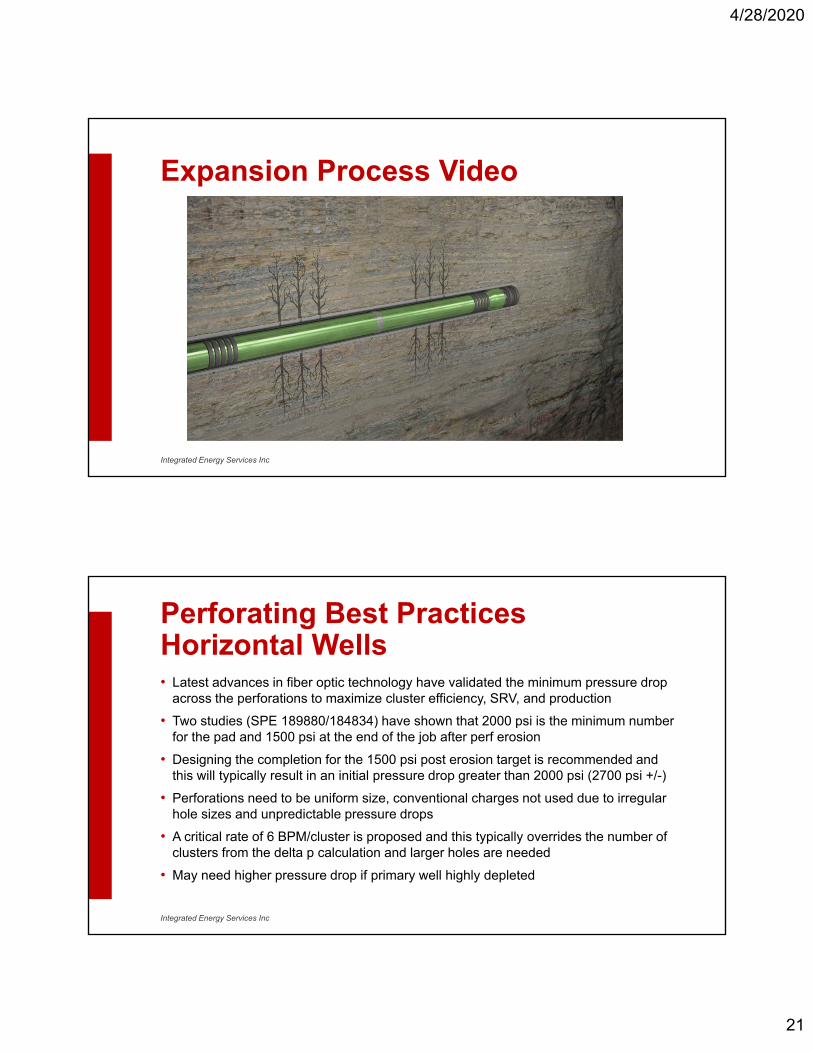
Expansion Process Video
Integrated Energy Services Inc
Perforating Best Practices Horizontal Wells• Latest advances in fiber optic technology have validated the minimum pressure drop
across the perforations to maximize cluster efficiency, SRV, and production
• Two studies (SPE 189880/184834) have shown that 2000 psi is the minimum number for the pad and 1500 psi at the end of the job after perf erosion
• Designing the completion for the 1500 psi post erosion target is recommended and this will typically result in an initial pressure drop greater than 2000 psi (2700 psi +/-)
• Perforations need to be uniform size, conventional charges not used due to irregular hole sizes and unpredictable pressure drops
• A critical rate of 6 BPM/cluster is proposed and this typically overrides the number of clusters from the delta p calculation and larger holes are needed
• May need higher pressure drop if primary well highly depleted
Integrated Energy Services Inc
4/28/2020
22
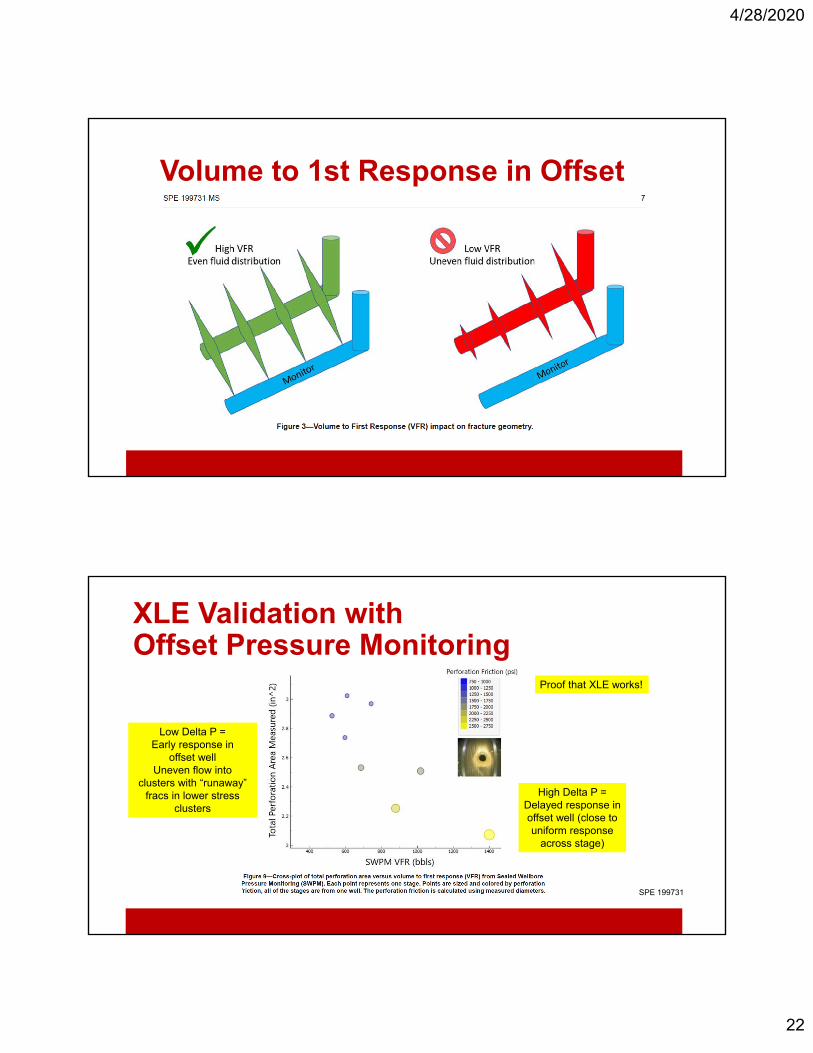
Volume to 1st Response in Offset
XLE Validation with Offset Pressure Monitoring
Low Delta P =Early response in
offset wellUneven flow into
clusters with “runaway”fracs in lower stress
clusters
High Delta P =Delayed response inoffset well (close touniform response
across stage)
SPE 199731
Proof that XLE works!
4/28/2020
23
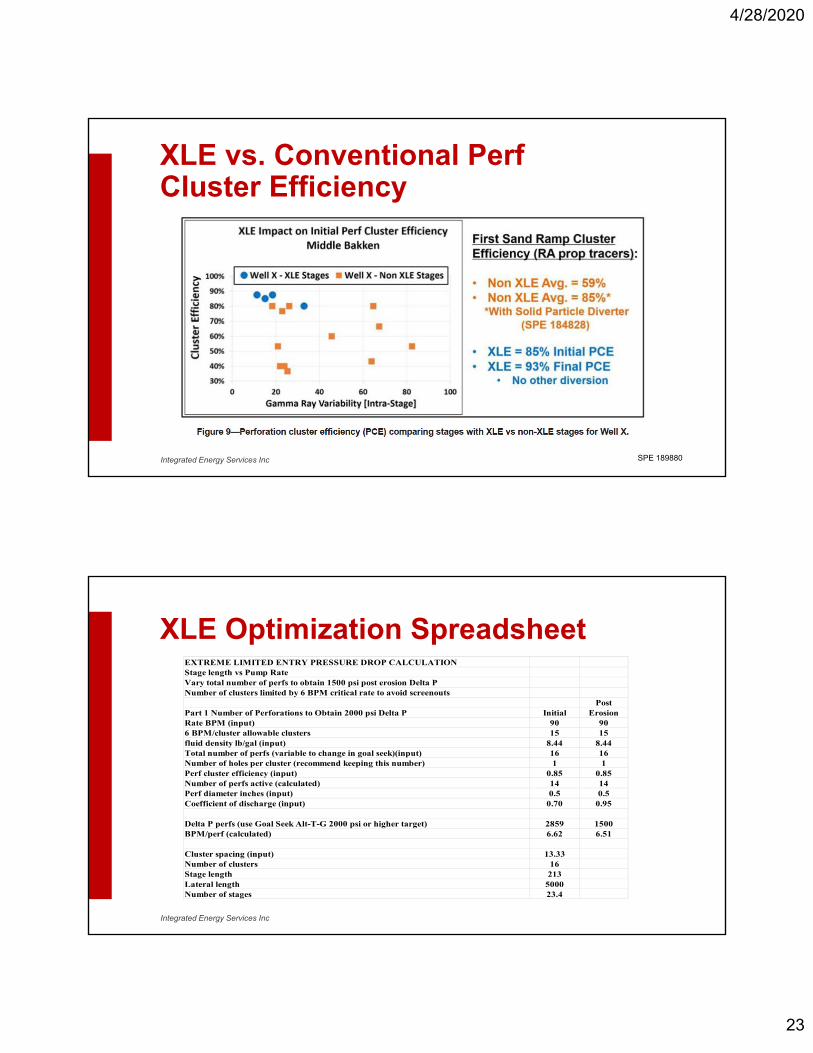
SPE 189880
XLE vs. Conventional Perf Cluster Efficiency
Integrated Energy Services Inc
XLE Optimization SpreadsheetEXTREME LIMITED ENTRY PRESSURE DROP CALCULATIONStage length vs Pump RateVary total number of perfs to obtain 1500 psi post erosion Delta PNumber of clusters limited by 6 BPM critical rate to avoid screenouts
PostPart 1 Number of Perforations to Obtain 2000 psi Delta P Initial ErosionRate BPM (input) 90 906 BPM/cluster allowable clusters 15 15fluid density lb/gal (input) 8.44 8.44Total number of perfs (variable to change in goal seek)(input) 16 16Number of holes per cluster (recommend keeping this number) 1 1Perf cluster efficiency (input) 0.85 0.85Number of perfs active (calculated) 14 14Perf diameter inches (input) 0.5 0.5Coefficient of discharge (input) 0.70 0.95
Delta P perfs (use Goal Seek Alt-T-G 2000 psi or higher target) 2859 1500BPM/perf (calculated) 6.62 6.51
Cluster spacing (input) 13.33Number of clusters 16Stage length 213Lateral length 5000Number of stages 23.4
EXTREME LIMITED ENTRY PRESSURE DROP CALCULATIONStage length vs Pump RateVary total number of perfs to obtain 1500 psi post erosion Delta PNumber of clusters limited by 6 BPM critical rate to avoid screenouts
PostPart 1 Number of Perforations to Obtain 2000 psi Delta P Initial ErosionRate BPM (input) 90 906 BPM/cluster allowable clusters 15 15fluid density lb/gal (input) 8.44 8.44Total number of perfs (variable to change in goal seek)(input) 16 16Number of holes per cluster (recommend keeping this number) 1 1Perf cluster efficiency (input) 0.85 0.85Number of perfs active (calculated) 14 14Perf diameter inches (input) 0.5 0.5Coefficient of discharge (input) 0.70 0.95
Delta P perfs (use Goal Seek Alt-T-G 2000 psi or higher target) 2859 1500BPM/perf (calculated) 6.62 6.51
Cluster spacing (input) 13.33Number of clusters 16Stage length 213Lateral length 5000Number of stages 23.4
Integrated Energy Services Inc
4/28/2020
24
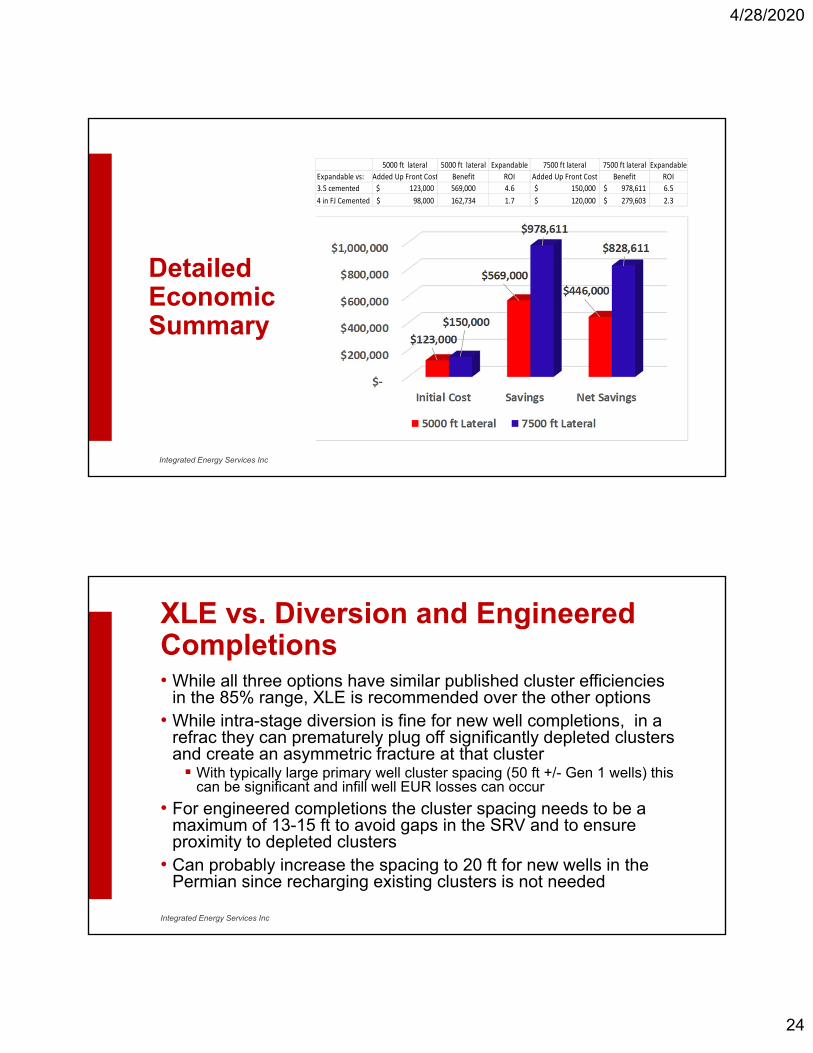
5000 ft lateral 5000 ft lateral Expandable 7500 ft lateral 7500 ft lateral Expandable
Expandable vs: Added Up Front Cost Benefit ROI Added Up Front Cost Benefit ROI
3.5 cemented 123,000$ 569,000 4.6 150,000$ 978,611$ 6.5
4 in FJ Cemented 98,000$ 162,734 1.7 120,000$ 279,603$ 2.3
Detailed Economic Summary
Integrated Energy Services Inc
XLE vs. Diversion and Engineered Completions• While all three options have similar published cluster efficiencies
in the 85% range, XLE is recommended over the other options• While intra-stage diversion is fine for new well completions, in a
refrac they can prematurely plug off significantly depleted clusters and create an asymmetric fracture at that cluster With typically large primary well cluster spacing (50 ft +/- Gen 1 wells) this
can be significant and infill well EUR losses can occur
• For engineered completions the cluster spacing needs to be a maximum of 13-15 ft to avoid gaps in the SRV and to ensure proximity to depleted clusters
• Can probably increase the spacing to 20 ft for new wells in the Permian since recharging existing clusters is not needed
Integrated Energy Services Inc
4/28/2020
25
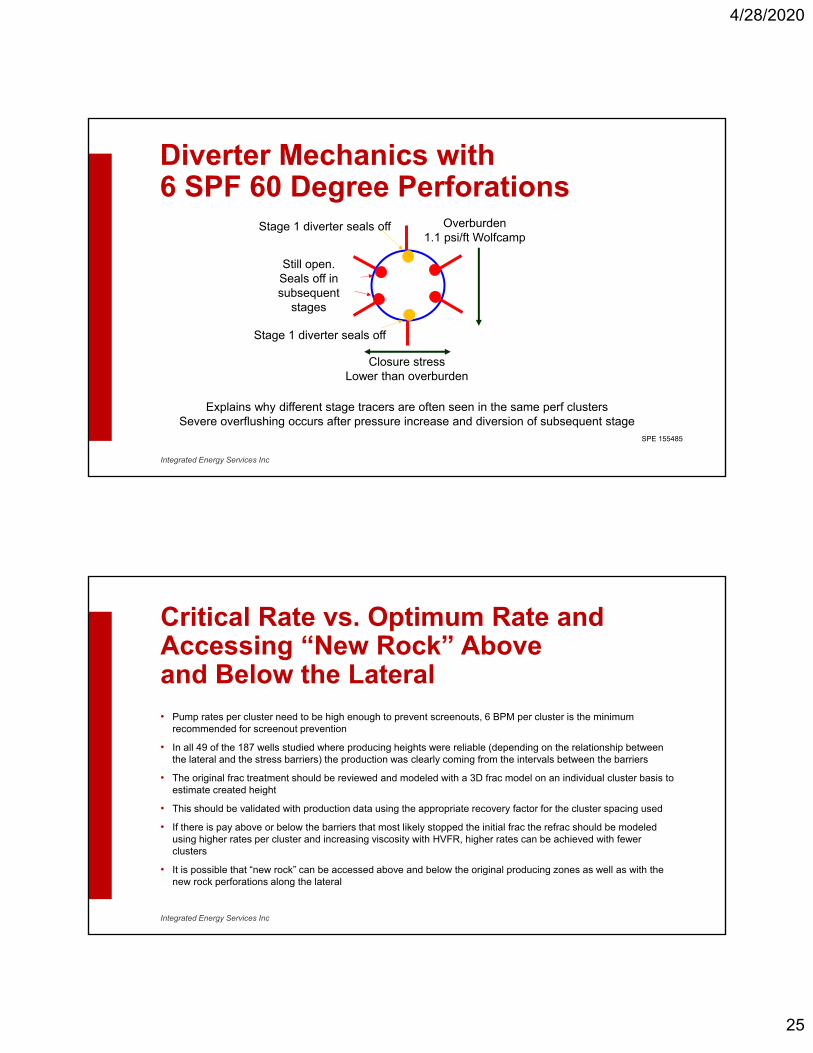
Overburden1.1 psi/ft Wolfcamp
Closure stressLower than overburden
Stage 1 diverter seals off
Still open.Seals off insubsequent
stages
Explains why different stage tracers are often seen in the same perf clustersSevere overflushing occurs after pressure increase and diversion of subsequent stage
Stage 1 diverter seals off
SPE 155485
Diverter Mechanics with 6 SPF 60 Degree Perforations
Integrated Energy Services Inc
Critical Rate vs. Optimum Rate and Accessing “New Rock” Above and Below the Lateral• Pump rates per cluster need to be high enough to prevent screenouts, 6 BPM per cluster is the minimum
recommended for screenout prevention
• In all 49 of the 187 wells studied where producing heights were reliable (depending on the relationship between the lateral and the stress barriers) the production was clearly coming from the intervals between the barriers
• The original frac treatment should be reviewed and modeled with a 3D frac model on an individual cluster basis to estimate created height
• This should be validated with production data using the appropriate recovery factor for the cluster spacing used
• If there is pay above or below the barriers that most likely stopped the initial frac the refrac should be modeled using higher rates per cluster and increasing viscosity with HVFR, higher rates can be achieved with fewer clusters
• It is possible that “new rock” can be accessed above and below the original producing zones as well as with the new rock perforations along the lateral
Integrated Energy Services Inc
4/28/2020
26
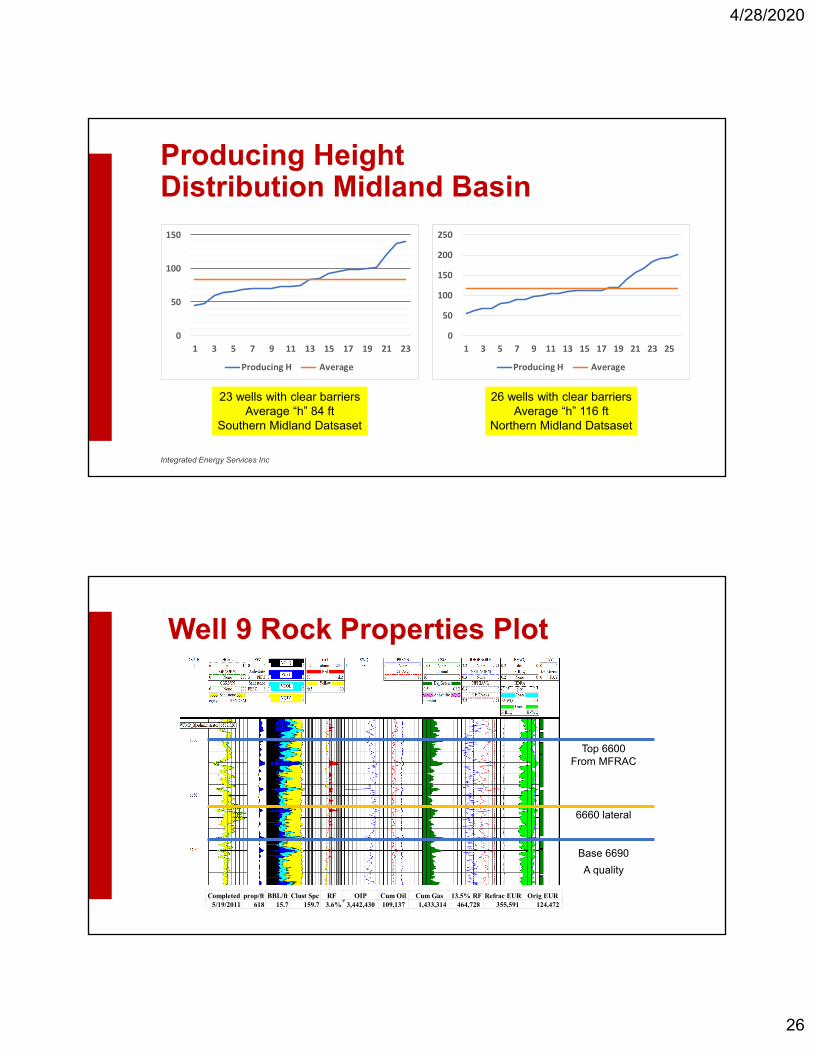
Producing Height Distribution Midland Basin
0
50
100
150
1 3 5 7 9 11 13 15 17 19 21 23
Producing H Average
0
50
100
150
1 3 5 7 9 11 13 15 17 19 21 23
Producing H Average
23 wells with clear barriersAverage “h” 84 ft
Southern Midland Datsaset
0
50
100
150
200
250
1 3 5 7 9 11 13 15 17 19 21 23 25
Producing H Average
0
50
100
150
200
250
1 3 5 7 9 11 13 15 17 19 21 23 25
Producing H Average
26 wells with clear barriersAverage “h” 116 ft
Northern Midland Datsaset
Integrated Energy Services Inc
Well 9 Rock Properties Plot
Top 6600From MFRAC
6660 lateral
Base 6690
A quality
Completed prop/ft BBL/ft Clust Spc RF OIP Cum Oil Cum Gas 13.5% RF Refrac EUR Orig EUR5/19/2011 618 15.7 159.7 3.6% 3,442,430 109,137 1,433,314 464,728 355,591 124,472

4/28/2020
27
Well 9 MFRAC 9 BPM /Cluster 12 cp HVFR
Added 20% to OIP/acre
Bookable Reserves from Refracs• Should be a clear indication that the reserves added were
incremental and not an acceleration of existing production
• Should establish a reasonable certainty that the refrac operation would be successful
• Should generate a large enough number of successful refracs to establish confidence in the process
54
Holroyd, Samantha “Refrac Integration in the Capital Deployment Plan,” Dec 10‐11 2015, Houston Energy Forum.
4/28/2020
28
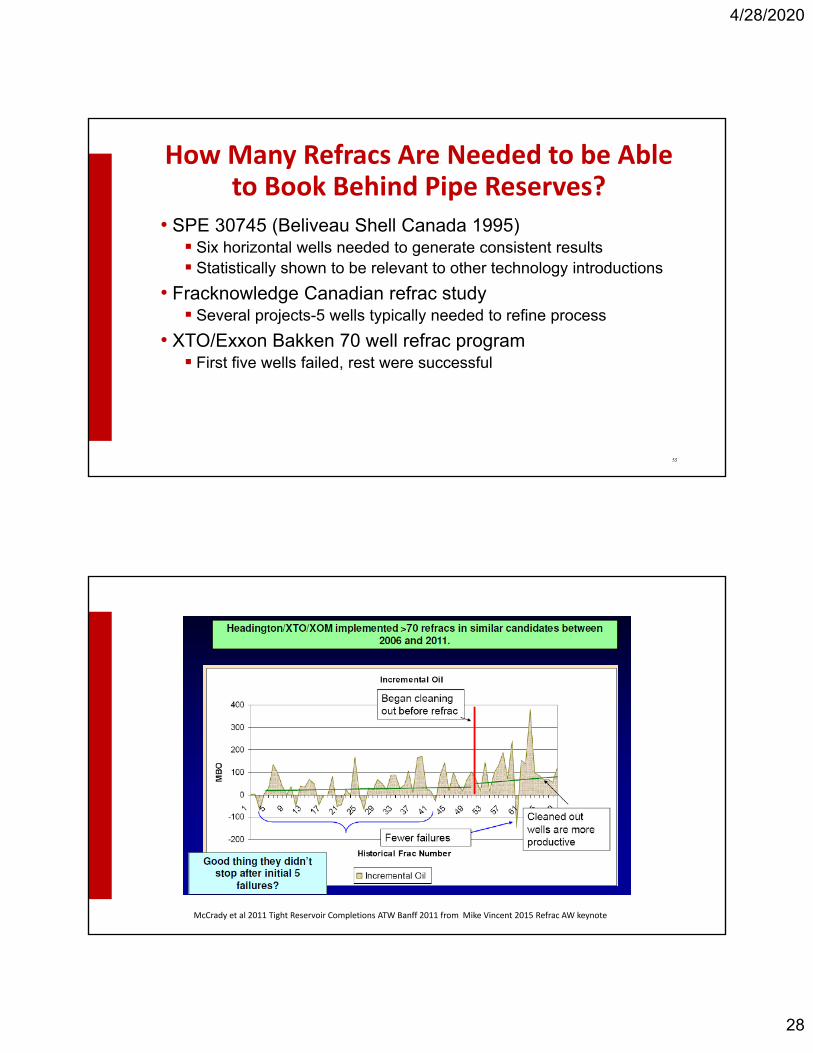
How Many Refracs Are Needed to be Ableto Book Behind Pipe Reserves?
• SPE 30745 (Beliveau Shell Canada 1995) Six horizontal wells needed to generate consistent results Statistically shown to be relevant to other technology introductions
• Fracknowledge Canadian refrac study Several projects-5 wells typically needed to refine process
• XTO/Exxon Bakken 70 well refrac program First five wells failed, rest were successful
55
McCrady et al 2011 Tight Reservoir Completions ATW Banff 2011 from Mike Vincent 2015 Refrac AW keynote
4/28/2020
29
Summary and Conclusions
• Refraccing organic shale primary wells is critical to DSU economics and can presents a unique opportunity to increase production more efficiently than new well completions if current recovery factors are less than half of the optimized completion numbers
• If an infill well frac hits the primary well depleted zone asymmetric fracs = 40% EUR loss in the infill
• “Preload” treatments do not prevent this loss unless a very large percentage of the fluid removed from the reservoir is replaced
• While mechanical isolation with expandable liners, short cluster spacing, and XLE is more expensive on the front end than cemented liners the return on the incremental up front investment ranges from 1.7 to 2.3 vs. 4 inch flush joint cemented and from 4.6 to 6.5 for 3.5 inch cemented liners
Integrated Energy Services Inc
Summary and Conclusions (cont’d.)
• Refrac programs have the potential to produce more hydrocarbons at less cost and be superior to new well drilling and completion programs
• Case in point 7 well refrac program in S Midland Basin on following slide
• IRR and NPV both higher if the refracs cost $3 million each and new wells $6 million
• The potential to book behind pipe reserves with refracspresents a huge opportunity to increase asset value at a relatively low cost per barrel or MCF
Integrated Energy Services Inc

4/28/2020
30
Seven Well RefracProject vs. Seven New Wells
4/23/2020 2020 2021 2022 2023 2024 2025 2026 2027 2028 2029 2030 2031 onNymex Oil 24.01$ 32.33$ 35.98$ 38.81$ 41.37$ 43.76$ 46.01$ 48.19$ 50.36$ 52.36$ 54.18$ 55.21$ Nymex Gas 2.42$ 2.75$ 2.53$ 2.46$ 2.46$ 2.47$ 2.50$ 2.54$ 2.57$ 2.60$ 2.66$ 2.97$
4/23/2020 2020 2021 2022 2023 2024 2025 2026 2027 2028 2029 2030 2031 onNymex Oil 24.01$ 32.33$ 35.98$ 38.81$ 41.37$ 43.76$ 46.01$ 48.19$ 50.36$ 52.36$ 54.18$ 55.21$ Nymex Gas 2.42$ 2.75$ 2.53$ 2.46$ 2.46$ 2.47$ 2.50$ 2.54$ 2.57$ 2.60$ 2.66$ 2.97$
Organic Shale Refrac Economic Analysis 7 Well Program
Updated April 23 2020 IP Oil 2181.8Assumes EUR Oil BO 1,806,845
NRI 75.0% EUR Gas MCF 19,134,991 Disc Rate/IRR 10% Total Cash Flow undisc 88,522,302$
LOE/Well 2,500$ Total Cash Flow disc 53,228,324$ LOE Esc 3.0% Payout (undiscounted) 26
Oil severance 4.60% Payout (discounted) 31Gas severance 7.50% Undisc Net/Invest 4.22MMBTU ADJ 1200 Disc Net/Invest 2.53
NPV 25,006,471$ Refrac Cost 21,000,000$
IRR 37%
Organic Shale New Well Economic Analysis 7 Well Program
Updated April 23 2020 IP Oil 2689.4Assumes EUR Oil BO 2,227,222
NRI 75.0% EUR Gas MCF 23,586,900 Disc Rate/IRR 10% Total Cash Flow undisc 109,378,375$
LOE/Well 2,500$ Total Cash Flow disc 65,756,951$ LOE Esc 3.0% Payout (undiscounted) 54
Oil severance 4.60% Payout (discounted) 82Gas severance 7.50% Undisc Net/Invest 2.60MMBTU ADJ 1200 Disc Net/Invest 1.57
NPV 14,792,567$ Refrac Cost 42,000,000$
IRR 17%
Seven refracs at $3 million vs. seven new wells at $6 million: Refrac program higher IRR and NPV
Refrac optimization requires doing your homework“measure twice cut once” applies