Embed Size (px)
Citation preview

�1
Organic Land Care ProjectSpringfield, MA
Parks & Recreation Department
Prepared by
Chip OsborneMarch 2015
Technical Review

March 4, 2015
Patrick J. Sullivan, Executive DirectorSpringfield Parks & Recreation200 Trafton RoadSpringfield, MA 01108
Dear Pat,
This report is a comprehensive document that explains not only the science behind natural management, but presents a current snapshot of the individual properties.
An in depth analysis of the soil combined with site characteristics has been fundamental in the development of a proposed strategy to begin to move from a conventional management framework to alternative strategies.
After reading and gaining an understanding of the approach, a meeting should be scheduled to discuss and answer questions related to the report. In the meantime, please feel free to contact me with any questions.
Sincerely,
Chip Osborne
�2

�3
Table of Contents
Introduction 4
Section 1: Soil Texture 7 Textural Analysis Reports 10
Section 2: Soil Chemistry 18 Nutrient Analysis Reports 22
Section 3: The Soil Biomass 30 Biological Analysis Reports 32
Section 4: The Transition Period 42
Section 5: Soil Test Analysis 43 Section 6: Site Analysis 46 Site Photographs 49
Section 7: Current Materials & Cultural Practices 58 Specimen Labels 69 Section 8: Fertility & Turfgrass Nutrition 65 An Organic Perspective
Section 9: Recommendations 70 Inputs, Corrective 70 Inputs, Routine Management 72 Projected Costs 74 2015 Proposed Program 75
Section 10: Cultural Practices 79
Section 11: C3 Grasses 83
Section 12: Inputs & Materials 89 Bondi Compost Reports 93 Bondi Compost Analysis 95

Introduction
Report Organization
This report is divided into a number of sections which include a framework for evaluating and managing soil chemistry and microbial activity, elements of and transition to natural-based practices, site analysis, and recommendations. More specifically the report provides a site analysis to document the strengths and weaknesses of the turf areas, photographs of the site, and soil test results that include nutrient, textural, and biological analysis. In doing so, the report documents the existing physical condition of the turf areas and establishes a baseline soil analysis for chemistry, texture, biology, and nutrient availability. Staff at the site provided the information on current and past management and practices, as well as the history of the sites. Goals for the turf areas were discussed and will be incorporated in the recommendations in the report.
Turf Management Orientation
At some point discussion takes place regarding lawn and turf management programs in a variety of different situations. It is understood that for many people there is a growing awareness about the chemical products used to maintain lawns and turf. Many also realize the impact of some of these products on the environment. They are aware that some chemicals, even at low dose exposures, may be harmful to public and children’s health.
Included here is an explanation of the principles and protocols of natural turf management based on detailed soil test data, site assessments and then recommendations for beginning a natural approach to turf management.
It is important first to document the existing physical condition of the turf areas and to establish a baseline soil analysis for chemistry, texture, and nutrient availability. A review is generally prepared with the idea that the property will be incorporated into a natural, organic management program, and all recommendations are made with that in mind. One important difference between an organic program and a conventional one is that organic programs become much more site-specific as opposed to a generalized approach to fertility and weed control. We are addressing what needs to be addressed in an appropriate way. Certainly, product for fertility management and building the soil biomass is important, and our approach is to address the needs of individual properties. That is not to say that we are going to have many different programs on multiple areas or playing fields, but rather that we are addressing any deficiencies or allowing for the inclusion of strategies that will help move a property through the transition process as quickly and efficiently as possible.
�4

When we discuss different management levels, we are referring to the cultural intensity required to maintain an individual turf area to the degree that meets expectations. There is not just one organic program, but rather different programs with different levels of intensity that can be created to meet the needs of an individual site. Recommendations are made based on communicated expectations.
Cultural intensity is the amount of labor and material inputs required to meet those expectations. One fact is a given in either a conventional or natural turf management program; minimal product and labor inputs meet low expectations, while higher levels of inputs meet higher expectations. This is true in any type of program, conventional or natural. Programs are created to address the soil and turfgrass that will meet the expectations for the site.
Transitioning
When a natural management program is being put in place, there is a window of time referred to as the transition period. It is during this time frame when new products are put in place and specific cultural practices are adopted. The most important element of the transition is the attention to the soil, not just texture and chemistry, but the biomass as well. Success is achieved by focusing on the living portion of the soil from the beginning of the natural program. The length of time required for this process is directly related to the intensity of conventional management practices that are currently employed.
The goal of a natural turf management program is to create turf that meets aesthetic site objectives, while eliminating toxic and synthetic chemical inputs that may have adverse impacts on health and the environment. The products and programs are designed to utilize materials and adopt cultural practices that will avoid problems associated with runoff or leaching of nutrients and pest-control products into water bodies and groundwater.
This approach will build a soil environment rich in microbiology that produces strong, healthy turf that is better able to withstand many of the stresses that affect turfgrass. The natural turf system is better able to withstand pressures from heavy usage, insects, weeds, and disease, as well as drought and heat stress, as long as good cultural practices continue to be followed and products are chosen to enhance and continually address the soil biology. While problems can arise in any turf system, they will be easier to alleviate with a soil that is healthy, with the proper microbiology in place.
Turf Program Comparison Conventional turf management programs are generally centered on a synthetic product approach that uses highly water soluble fertilizers and pesticide control products that continually treat symptoms on an annual basis. It is important to acknowledge that in addition to having adverse effects on human health and the environment, pesticides by definition kill, repel, or mitigate a pest. They do not grow grass. Our approach will be to
�5

implement a strategy that proactively solves problems by creating a healthy soil and turfgrass system. Healthy, vigorously growing grass will outcompete most weed pressures, and a healthy soil biomass will assist the prevention of many insect and disease issues.
We are following a Systems Approach to Natural Turf Management that is designed to put a series of preventative steps in place that will solve problems. This approach forms the basis for our recommendations. This Systems Approach is based on three concepts. It involves: 1) Natural product where use is governed by soil testing or site considerations 2) The acknowledgment that the soil biomass plays a critical role in fertility3) Specific and sound horticultural practices.
Ours is a “ feed the soil” approach that centers on natural, organic fertilization, soil amendments, microbial inoculants, compost teas, microbial food sources, and topdressing as needed, or indicated, with high quality, finished compost. It is a program that supports the natural processes that nature has already put in motion. These inputs, along with very specific cultural practices, that include mowing, aeration, irrigation, and over seeding are the basis of the program.
There is a lot that goes into a natural program. It is much more than just a product for product swap. When we see situations where an organic program has been simply the product swap, we usually see situations that have not resulted in satisfying higher levels of expectations.
In a situation where a municipality or other entity subcontracts applications of product or cultural practices, it requires someone internally that possesses the knowledge about organic turf management to perform the initial soils testing and outline a program. That program then is incorporated into an RFP and goes out to bid. What should not happen is letting an individual service provider come in and create a program that seems to make sense to them based on their product choice.
Osborne Organics
As a company, Osborne Organics is neither a service provider nor a product company. Osborne Organics has been part of the process of moving turf and landscapes from conventional management practices to a natural approach in a variety of situations and at different levels for the past twelve years. We have the technical expertise to apply the principles and practices mentioned above in the field. Ours is an approach backed by sound science that responds to the need for a safer and healthier landscape from both the environmental and human health perspective. We also provide educational opportunities in the form of in-depth trainings to both landscape contractors and municipal employees in natural turf methods. As part of our involvement in Springfield, we will be training city staff in all of the basics of natural turf management, as well as conducting a workshop for the community.
�6

Section 1Soil Texture
Soil is the foundation of our landscape. It is much more than just a functional medium to hold turfgrass and other plants upright and in their place. In many cases, conventional programs that are focused on water-soluble fertility and a series of chemical control products, can reduce the impact of the soil to that medium that does little more than physically support the plant. The mineral portion of the soil is comprised of sand, silt, and clay, mixed with varying amounts of organic matter, water, and air. The soil is very much alive. It is home to a microbial community that is made up of organisms both large and small. It is these microbes that give the soil its life. With organic matter on average at 5%, it is a very small portion of the soil. The microbes are supported within this small fraction. Ideal soils are typically described as having the following characteristics: 45% mineral, 25% air, 25% water, and 5% organic matter.
All soil particles, from the microscopic sheets of clay to the largest grains of sand, should be surrounded on all sides by air. When soils have varying degrees of moisture, some amount of water occupies the air space. This air and water portion is referred to as pore space. It is this pore space that allows the soil to function in a healthy way to support both microbial organisms and the roots of turfgrass by ensuring good gas exchange with the atmosphere. It is this gas exchange that releases carbon dioxide from the biomass, and in turn allows oxygen to be incorporated into the soil environment. When we think of soil within this framework, we realize that when we pick up a handful of soil, only one half of it is solid matter, while the other half is some combination of air and water.
The mineral particles in the soil are of varying sizes. They are derived from parent rock material. That material varies in different regions of the country, therefore mineral nutrients and composition vary as well.
At the most basic level, clay is the smallest particle, being microscopic. It has a sticky feel to it when moist, and is largely responsible for influencing the bulk density of the soil. It has a tendency to compact and impede water movement down through the soil profile. In regions of the United States where clay percentages are high, we face particular challenges in growing grass.This is similar to the situation that you experience in Durango. Your soils, as evidenced by the following textural analyses, have reasonably high percentages of clay. Strategies to relieve compaction and loosen the soil as much as possible become critically important.
The next largest particles are silt. Your soils have relatively high percentages of silt. Soil textural classifications actually fall in the silty range on several of your properties. Silt feels much like flour. It is considered to be fine textured and has a very smooth feel to it. Although silt is not as fine as clay, silt can combine with clay and the end result is a soil that is relatively tight.
�7

Grains of sand are the largest mineral particles in the soil. Sands are subdivided into five individual textural classifications; very fine, fine, medium, course, and very course. Although sands are not considered to be a primary source of compaction, there is no question that the finer particles can combine with other fines in the soil and give us a compacted situation.
Topsoil, as the name implies, is the uppermost layer of soil. This surface layer of soil is usually darker than subsoil because of the accumulation of organic matter. In different parts of the United States, we see very different depths of topsoil. It can range from six to eight inches in the Northeast to two feet or more in the Midwest.
Loam, on the other hand, is a textural classification. Loam is a word that is very often misused in our industry. We do not buy loam to work on a project, but rather we purchase topsoil. That topsoil may in fact be a loam, but that depends entirely on the relative percentages of sand, silt, and clay. A loam is technically a soil with between 7% and 27% clay, 28% and 50% silt, and less than 52% sand. The term loam can then be modified to sandy loam, sandy clay loam, clay loam, silty clay loam, or silt loam as the individual soil fractions change. The textural classification for the soils on the pilot sites appears on the following reports.
SandsSands are loose and singled grained (that is, not aggregated together). They feel gritty to the touch and are not sticky. Each individual sand grain is of sufficient size that it can be easily seen and felt. Sands cannot be formed into a cast by squeezing when dry. When moist, sands will form a very weak cast, as if molded by the hand, that crumbles when touched. Soil materials that are classified as sands must contain 85% to 100% sand sized particles, 0 to 15% silt sized particles, and 0 to 10% clay sized particles. The reason that sands are referred to in the plural is that there are several USDA textures within this group. All of these textures fit in the sand portion of the textural triangle, but they differ from each other in their relative portions of the various sizes of sand grains.
SiltSilt is similar to silt loam but contains even less sand and clay. Sand sized particles, if present, are generally so small (either fine or very fine) that they are non-detectable to the fingers. Clay particles are present in such low percentages that little or no stickiness is imparted to the soil when moistened, but instead feels smooth and rather silky. Silt sized particles are somewhat plastic, and can be formed into casts that will bear careful handling.
ClayClay is the finest textured of all of the soil classes. Clay usually forms extremely high clods or lumps when dry and is extremely sticky and plastic when wet. When containing the proper amount of moisture, it can be “ribboned out” to a remarkable degree by
�8

squeezing between the thumb and forefinger, and may be rolled into a long, very thin wire.
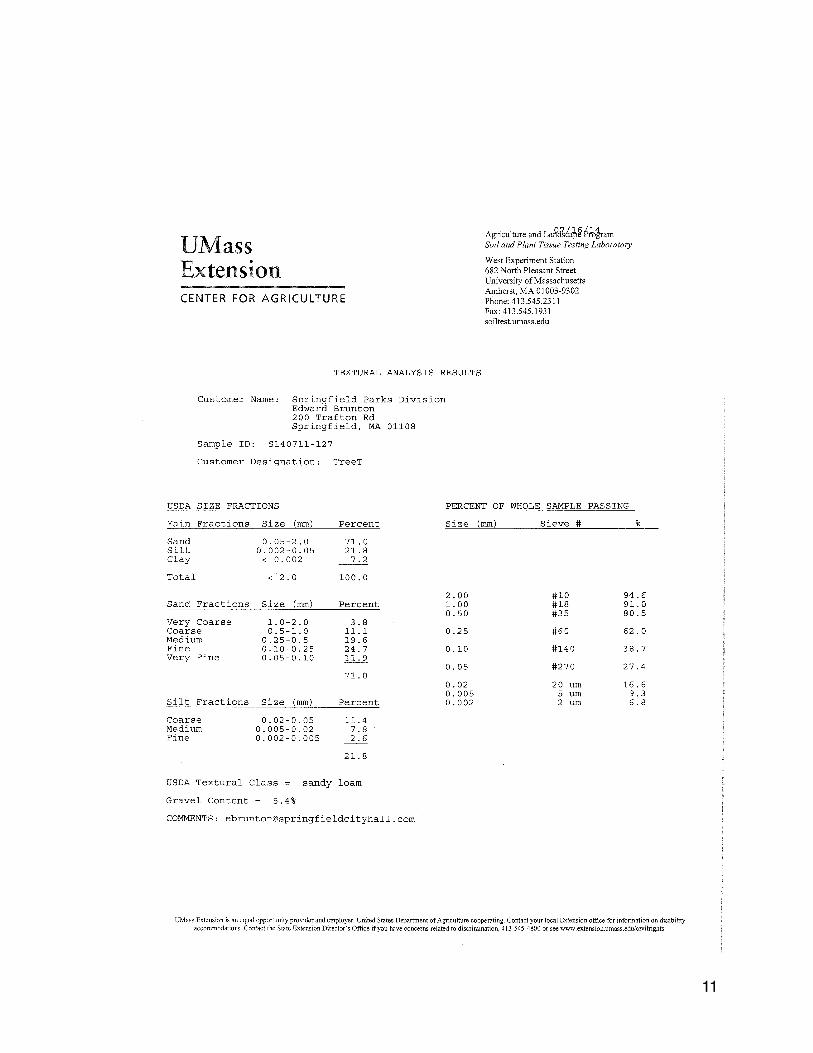
As part of the data collection process, one of the soil tests that we have performed is the Textural Analysis or Particle Size Analysis. Those test results appear on the following pages. You will note that the soils on the sites in Springfield are relatively similar, but there are differences. In some cases the differences are subtle, but nevertheless, it is to our advantage to understand the individual characteristics. In some cases a field or a park may be native soil, while at other times the soil that is used for construction is imported to the site. It is these soils that we try to identify, as they may be significantly different than existing soils. It is in this testing process that the above referenced particle size is determined. The results of that test are then applied to the textural triangle and we get the soil classification. The USDA textural triangle is the tool that we use to determine soil textural classifications. After soil testing determines the relative percentages of sand, silt, and clay, we refer to the triangle and find the percentages on each side and follow the lines to the intersecting point.
� It should be noted here, that soil texture is a given, and we will have very little ability to influence it one way or another. We will be working with soils on-site, as is, and develop a program that best addresses the needs of the grass given the soil conditions.
If we are constructing a turfgrass area from scratch, we have the ability to create an engineered soil by blending sands with native topsoil and an organic amendment to create an ideal soil to support a turfgrass system. In any new construction project, we should always be aware that the establishment of a good soil is critically important.
!
�9

�10
�11

�12

�13

�14
Soil and Plant Tissue Testing LaboratoryWest Experiment Station
682 North Pleasant Street
University of Massachusetts
Amherst, MA 01003
Phone: (413) 545-2311
e-mail: [email protected]
website: soiltest.umass.edu
Prepared For:
413-426-0106
Sample Information:Sample ID: WSEDI
Lab Number: X140805-104
Received: 8/5/2014
Reported: 8/8/2014
Edward BruntonSpringfield Parks Division200 Trafton RdSpringfield, MA 01119
Order Number: 8961
Particle Size Analysis - Comprehensive
USDA Size Fraction Percent of Whole Sample Passing
Main Fractions Size (mm) Percent72.0Sand 0.05-2.0
20.8Silt 0.002-0.05
7.2Clay <0.002
Sand Fractions Size (mm) Percent4.9Very Coarse 1.0-2.0
14.1Coarse 0.5-1.0
27.9Medium 0.25-0.5
18.8Fine 0.10-0.25
6.3Very Fine 0.05-0.10
Silt Fractions Size (mm) Percent11.1Coarse 0.02-0.05
7.7Medium 0.005-0.02
1.9Fine 0.002-0.005
Size (mm) Sieve # Sample PassingWhole Sample % of
2.00 91.9#101.00 87.4#180.50 74.4#350.25 48.8#600.10 31.5#1400.053 25.7#270
0.02 15.520 um0.005 8.45 um0.002 6.62 um
USDA Textural Class:
Gravel Content: (%)
sandy loam
8.1
1 of 1 Lab Number X140805-104Sample ID: WSEDI

�
�15

�16
Soil and Plant Tissue Testing LaboratoryWest Experiment Station
682 North Pleasant Street
University of Massachusetts
Amherst, MA 01003
Phone: (413) 545-2311
e-mail: [email protected]
website: soiltest.umass.edu
Prepared For:
413-426-0106
Sample Information:Sample ID: WSODI
Lab Number: X140805-103
Received: 8/5/2014
Reported: 8/8/2014
Edward BruntonSpringfield Parks Division200 Trafton RdSpringfield, MA 01119
Order Number: 8961
Particle Size Analysis - Comprehensive
USDA Size Fraction Percent of Whole Sample Passing
Main Fractions Size (mm) Percent68.5Sand 0.05-2.0
24.3Silt 0.002-0.05
7.2Clay <0.002
Sand Fractions Size (mm) Percent3.3Very Coarse 1.0-2.0
10.8Coarse 0.5-1.0
23.5Medium 0.25-0.5
21.7Fine 0.10-0.25
9.2Very Fine 0.05-0.10
Silt Fractions Size (mm) Percent12.9Coarse 0.02-0.05
8.4Medium 0.005-0.02
3.0Fine 0.002-0.005
Size (mm) Sieve # Sample PassingWhole Sample % of
2.00 95.9#101.00 92.7#180.50 82.4#350.25 59.9#600.10 39.0#1400.053 30.2#270
0.02 17.820 um0.005 9.85 um0.002 6.92 um
USDA Textural Class:
Gravel Content: (%)
sandy loam
4.1
1 of 1 Lab Number X140805-103Sample ID: WSODI

�17
Soil and Plant Tissue Testing LaboratoryWest Experiment Station
682 North Pleasant Street
University of Massachusetts
Amherst, MA 01003
Phone: (413) 545-2311
e-mail: [email protected]
website: soiltest.umass.edu
Prepared For:
413-426-0106
Sample Information:Sample ID: WSEDN
Lab Number: X140805-105
Received: 8/5/2014
Reported: 8/8/2014
Edward BruntonSpringfield Parks Division200 Trafton RdSpringfield, MA 01119
Order Number: 8961
Particle Size Analysis - Comprehensive
USDA Size Fraction Percent of Whole Sample Passing
Main Fractions Size (mm) Percent76.9Sand 0.05-2.0
17.5Silt 0.002-0.05
5.6Clay <0.002
Sand Fractions Size (mm) Percent4.5Very Coarse 1.0-2.0
14.3Coarse 0.5-1.0
29.9Medium 0.25-0.5
20.6Fine 0.10-0.25
7.6Very Fine 0.05-0.10
Silt Fractions Size (mm) Percent10.5Coarse 0.02-0.05
4.9Medium 0.005-0.02
2.1Fine 0.002-0.005
Size (mm) Sieve # Sample PassingWhole Sample % of
2.00 94.5#101.00 90.3#180.50 76.8#350.25 48.5#600.10 29.0#1400.053 21.8#270
0.02 11.920 um0.005 7.25 um0.002 5.32 um
USDA Textural Class:
Gravel Content: (%)
loamy sand
5.5
1 of 1 Lab Number X140805-105Sample ID: WSEDN

Section 2Soil Chemistry
The second test of the soil is the Nutrient Analysis. It is this soil test that gives us critical information relating to soil chemistry. Soil chemistry involves pH, micro and macro mineral nutrients, organic matter percentage, cation exchange capacity, and nitrate and ammonium nitrogen.
The first and probably most important area of attention is the relative acidity (or alkalinity) of the soil. It is measured as pH. The pH scale runs from 1.0 to 14.0 with 7.0 being neutral. The lower end of the scale is acidic and the higher-end is alkaline. A soil becomes acid when there is a substantial amount of hydrogen ions occupying cation exchange sites. As more hydrogen is attracted and retained on those sites, the soil becomes more acidic. When we use a liming material, we replace the hydrogen with calcium or magnesium and the pH rises. As the hydrogen ions are knocked off of the exchange sites, two hydrogen combine with one oxygen to form water.
Establishing the pH within a desired range for any individual plant material is critically important. Cool season turfgrasses, as a plant specie, prefer the pH to be slightly acidic, generally between 6.2 and 7.0. Establishment of the pH within this range is important to the success of a natural management program. The nutrients that the grass plant uses in the largest amounts are most readily available when the pH is established within this range. The grass plant uses nitrogen in the largest amount, followed by potassium, and then phosphorus. There is less nutrient available to the grass plant. The most important and critical step in a natural program is to adjust the pH within the desired range. Unless pH is close to this range, the grass plant does not get the nutrients it needs with any degree of efficiency. Fertilizer can be repeatedly applied, but will have less than the maximum, desired effect.
Lime is used as the preferred input for raising the pH. The calcium to magnesium ratio, as determined by the nutrient analysis, is considered when determining the type of lime to be used. We have two choices, calcitic or dolomitic lime. The guidelines we follow call for roughly an 8:1 calcium to magnesium ratio. Calcitic lime is higher in calcium and dolomitic lime is higher in magnesium. These materials can be purchased as regular lime or high cal or high mag lime. With the more concentrated products, we use substantially less material. When calcium to magnesium ratios are optimum, dolomitic lime is preferred. If we have less than the optimum ratio, then calcitic lime would be chosen.
The generally accepted practice of lime applications would be to not exceed 50 pounds of material per 1000 ft.² in any one application. If recommendations call for applications greater than that amount, we apply over two growing seasons. Elevation of the pH is not a rapid process, but rather can take up to 100 days for the material to break down and begin to elevate the pH. Soluble calcium products marketed for their ability to make rapid changes in the pH should be avoided.
�18

The establishment of the proper pH by liming is usually an expense occurred in the first years of a natural program. Natural fertilizers do not tend to acidify the soil in the way conventional products do after repeated applications. One of the benefits of natural fertilizers and composts that are used to feed the soil is a natural buffering of the soil and pH becomes stabilized within the desired range.
In some cases, it may be desirable to lower the pH by adding an acidifying agent such as elemental sulfur (flowers of sulfur). This can be done successfully on soils that do not contain large amounts of free lime. Amounts of sulfur needed to lower the pH of a silt loam soil to a 6-inch depth are easily calculated. Sandy soils would require less and clayey soils would require more. Elemental sulfur is converted to sulfuric acid by soil bacteria. Therefore, in order for sulfur to work the following must be satisfied:
• Sulfur must be mixed with the soil to provide contact.• The soil must be moist.• The soil must be aerated (bacteria need oxygen).• The soil must be warm for rapid bacterial growth.• Time is required for the reaction to go to completion.
Do not confuse sulfur as a soil acidifying agent with sulfur as a plant nutrient. Soil test reports generally recommend 10 pounds of sulfur per acre as a plant nutrient. Most fertilizer sources of sulfur are in the sulfate form (SO4-2) which is readily available to plants, e.g., ammonium sulfate, calcium sulfate (gypsum), potassium sulfate, sul-po-mag, magnesium sulfate (epsom salts), etc. Sulfate sulfur is usually contained in mixed fertilizers. This form will not acidify soils. Elemental sulfur (a yellow powder), the form used for soil acidification, is not plant available until it is oxidized by soil bacteria to the sulfate form. This takes time - usually several weeks. Elemental sulfur is sometimes sold as "flowers of sulfur".
Nutrient Management
An approach using primarily synthetic, water soluble fertilizers is directly feeding the grass plant. These products are broken down by soil moisture and are readily available to the plant. Natural, organic fertilizers work in a different way. It is the soil microbiology that breaks down the fertilizer and uses it as a food source. The microbes then make the nutrients available to the grass plant in a plant available forms. It is this feed the soil approach that will be the basis for our recommendations on a nutrient program. In a natural program we do not focus on pounds of nitrogen per 1000 ft.² in quite the same way that we do in a conventional program. A healthy soil where the microbes are nourished with natural fertilizers, has the ability to cycle up to 2 pounds of nitrogen per 1000 ft.² to the grass plant on a monthly basis. This plateau is reached when sustainability is approached, generally three to four years into a complete natural turf management program.This is what we refer to as fertilizing through the biomass. Our focus begins to center on the microbial community as opposed to the fertilizer bag. It is
�19

through the optimization of the biomass that we can effectively manage turfgrass nutrition with natural materials.
All nutrient and cultural recommendations that are made will ultimately affect the microbes. They are a big part of creating and achieving good soil health and quality. This is really the starting point. Once we have addressed the pH of the soil, we then move to addressing the other aspects of soil chemistry. The following aspects are some key considerations of which we need to be aware and are all found in the soil test report.
Organic Matter
Organic matter makes up a relatively small fraction of the soil. A typical agricultural soil has between 1% and 6% organic matter. This percentage varies in all regions of the United States. As previously noted, we work with a number of 5% as an average. On the 8 properties that we tested, the organic matter percentages are as follows: A soil that supports turfgrass should have between 3% and 6% organic matter. as you can see all of the properties have an organic matter percentage within the desired range, and the average falls in line with the guidelines. In some situations, if we have the ability with native soils, we look to increase organic matter to 6%. In your region in Colorado, organic matter percentages can be on the lower side. There are only two properties in this pilot project when this might be part of the program. They are Riverfront/Iris and Needham. It would not be a sustainable approach to think that we should try and elevate these properties to any great degree. If possible, we might attempt to move them up 1% plus or minus. If we were able to move organic matter up 1% over the next three years, that would be a benefit.
Organic matter has a tremendous effect on most soil properties. Think of organic matter as the home for the microbial community. It is the complex interactions within the organic matter portion of the soil that makes the system function. Organic matter is made up of living organisms, fresh residues, and well decomposed residues. These three components of organic matter have been referred to as the living, the dead, and the very dead (Magdoff, University of Vermont). The living portion is comprised of a wide variety of microorganisms, including bacteria, fungi, protozoa, and nematodes among others. Also included are plant roots, earthworms, insects, and larger animals that spend time in the soil. This living portion represents about 15% of total organic matter. The fresh residues, or the dead portion, are comprised of recently deceased microorganisms, insects, earthworms, and compost if applied as a topdress. The dead portion also includes crop or plant residues, in the case of a turfgrass system, grass clippings left on the turf to be decomposed by saphrophytic organisms. Nutrient cycling happens here in the dead portion of organic matter. The very dead part of organic matter is humus. Humus is the end product of decomposition. When the living and the dead portions of organic matter can decompose no further, the final and stable byproduct of that decomposition is referred to as humus. Humus is fully stable and is considered to be a long-term soil resource lasting many hundreds of years. You will
�20

notice as we begin to design programs of inputs to support the turfgrass and the biomass, we frequently use extracts of humus to enhance soil function.
Humus is one of the central components that tie together the inter-related functions of soil chemistry, texture, and biology. As we begin to address and enrich soil organic matter, we are improving the humus content of the soil and all of the interactions that take place. When we get all of these aspects working in harmony, we begin to achieve what is referred to as soil health. Conventional soil science has looked at soil chemistry, texture, and biology separately. The emerging way of looking at the soil is to try to achieve optimum levels in each of these three areas and the result is good soil quality or soil health. Many natural fertilizers are now including humates as part of the blend for the specific purpose of working to create a healthy soil. If not included in a fertilizer blend, humates can be applied separately in granular or liquid form. The liquid programs that we put forth for managing a turfgrass system will generally include humates in the liquid form as part of an ongoing program.
Cation Exchange Capacity (CEC)
CEC is a measure of the nutrient holding capacity of the soil. Some of the clays and the well aged humus portion of organic matter contain negatively charged ions that attract and hold on to plus charged cations (nutrients). Older, well aged organic matter (humus) contains the largest percentage of exchange sites. As we improve organic matter and its humus content, we increase the exchange sites in the soil.
There are different clays that make up the fine, mineral portion of the soil. They are montmorillonite and koalinite clays. They each have different characteristics with regard to possessing the ions to attract nutrients. We can look at different soil samples and see results that seem to contradict other results from the same general property, but most often the variable is that some soils are not native to the site, but rather brought in as a topsoil to supplement existing soil on site.
As we improve the nutrient holding capacity of the soil, whatever we apply tends to be held more strongly in the soil. The primary macronutrients that are held on the exchange sites are calcium, magnesium, potassium, aluminum, ammoniacal nitrogen (NH4+), and hydrogen. An abundance of hydrogen creates an acidic condition in the soil, whereas an abundance of calcium and/or magnesium creates an alkaline soil. We look at ammonium nitrogen as being reserve nitrogen. It can be converted to nitrate little by little by specific bacteria that are present in the soil. A more detailed explanation of nitrogen and its function will be given later.
�21

�22
Soil and Plant Tissue Testing LaboratoryWest Experiment Station
682 North Pleasant Street
University of Massachusetts
Amherst, MA 01003
Phone: (413) 545-2311
e-mail: [email protected]
website: soiltest.umass.edu
Prepared For:
Soil Test Report
413-426-0106
Sample Information:
Area Sampled: 10285 sq ft
Sample ID: Mason
Lab Number: S140711-129
Received: 7/16/2014
Reported: 7/16/2014
Results
Edward BruntonSpringfield Parks Division200 Trafton RdSpringfield, MA 01108
Order Number: 8461
ValueAnalysis Found
OptimumRange
ValueAnalysis Found
OptimumRange
6.2Soil pH (1:1, H2O)Modified Morgan extractable, ppm
Macronutrients7.2 Phosphorus (P) 4-1457 Potassium (K) 100-160
1321 Calcium (Ca) 1000-1500118 Magnesium (Mg) 50-120
2.6 Sulfur (S) >10Micronutrients *
0.3 Boron 0.1-0.58.4 Manganese (Mn) 1.1-6.38.2 Zinc (Zn) 1.0-7.60.2 Copper (Cu) 0.3-0.66.0 Iron (Fe) 2.7-9.431Aluminum (Al) <751.2Lead (Pb) <22
11.8Cation Exch. Capacity, meq/100g4.0Exch. Acidity, meq/100g
Base Saturation, %56 Calcium Base Saturation 50-80
8 Magnesium Base Saturation 10-301 Potassium Base Saturation 2.0-7.0
1.21Scoop Density, g/ccOptional tests
5.5 Soil Organic Matter (LOI), %2 Nitrate-N (NO3-N), ppm
Nutrient Very Low Low Optimum Above Optimum Soil Test Interpretation
Phosphorus (P):Potassium (K):
Magnesium (Mg):Calcium (Ca):
* Micronutrient deficiencies rarely occur in New England soils; therefore, an Optimum Range has never been defined. Values provided represent the normal range found in soils and are for reference only.
1 of 2 Lab Number S140711-129Sample ID: Mason

�23
Soil and Plant Tissue Testing LaboratoryWest Experiment Station
682 North Pleasant Street
University of Massachusetts
Amherst, MA 01003
Phone: (413) 545-2311
e-mail: [email protected]
website: soiltest.umass.edu
Prepared For:
Soil Test Report
413-426-0106
Sample Information:
Area Sampled: 171500 sq ft
Sample ID: Frede
Lab Number: S140711-128
Received: 7/16/2014
Reported: 7/16/2014
Results
Edward BruntonSpringfield Parks Division200 Trafton RdSpringfield, MA 01108
Order Number: 8461
ValueAnalysis Found
OptimumRange
ValueAnalysis Found
OptimumRange
5.7Soil pH (1:1, H2O)Modified Morgan extractable, ppm
Macronutrients1.8 Phosphorus (P) 4-1444 Potassium (K) 100-160
419 Calcium (Ca) 1000-150042 Magnesium (Mg) 50-1203.7 Sulfur (S) >10
Micronutrients *0.2 Boron 0.1-0.54.8 Manganese (Mn) 1.1-6.3
10.8 Zinc (Zn) 1.0-7.60.2 Copper (Cu) 0.3-0.6
11.2 Iron (Fe) 2.7-9.499Aluminum (Al) <751.4Lead (Pb) <22
8.3Cation Exch. Capacity, meq/100g5.7Exch. Acidity, meq/100g
Base Saturation, %25 Calcium Base Saturation 50-80
4 Magnesium Base Saturation 10-301 Potassium Base Saturation 2.0-7.0
1.28Scoop Density, g/ccOptional tests
3.9 Soil Organic Matter (LOI), %2 Nitrate-N (NO3-N), ppm
Nutrient Very Low Low Optimum Above Optimum Soil Test Interpretation
Phosphorus (P):Potassium (K):
Magnesium (Mg):Calcium (Ca):
* Micronutrient deficiencies rarely occur in New England soils; therefore, an Optimum Range has never been defined. Values provided represent the normal range found in soils and are for reference only.
1 of 2 Lab Number S140711-128Sample ID: Frede

�24
Soil and Plant Tissue Testing Laboratory203 Paige Laboratory
161 Holdsworth Way
University of Massachusetts
Amherst, MA 01003
Phone: (413) 545-2311
e-mail: [email protected]
website: soiltest.umass.edu
Prepared For:
Soil Test Report
413-426-0106
Sample Information:
Area Sampled:
Sample ID: Tree T
Lab Number: S141106-107
Received: 11/6/2014
Reported: 11/12/2014
Results
Edward BruntonSpringfield Parks Department200 Trafton RdSpringfield, MA 01108
Order Number: 11019
ValueAnalysis Found
OptimumRange
ValueAnalysis Found
OptimumRange
6.2Soil pH (1:1, H2O)Modified Morgan extractable, ppm
Macronutrients5.5 Phosphorus (P) 4-1461 Potassium (K) 100-160
529 Calcium (Ca) 1000-150057 Magnesium (Mg) 50-1209.1 Sulfur (S) >10
Micronutrients *0.2 Boron (B) 0.1-0.52.5 Manganese (Mn) 1.1-6.31.5 Zinc (Zn) 1.0-7.60.5 Copper (Cu) 0.3-0.6
12.4 Iron (Fe) 2.7-9.453Aluminum (Al) <752.5Lead (Pb) <22
6.9Cation Exch. Capacity, meq/100g3.7Exch. Acidity, meq/100g
Base Saturation, %38 Calcium Base Saturation 50-80
7 Magnesium Base Saturation 10-302 Potassium Base Saturation 2.0-7.0
1.22Scoop Density, g/ccOptional tests
2.7 Soil Organic Matter (LOI), %2 Nitrate-N (NO3-N), ppm
Nutrient Very Low Low Optimum Above Optimum Soil Test Interpretation
Phosphorus (P):Potassium (K):
Magnesium (Mg):Calcium (Ca):
* Micronutrient deficiencies rarely occur in New England soils; therefore, an Optimum Range has never been defined. Values provided represent the normal range found in soils and are for reference only.
1 of 2 Lab Number S141106-107Sample ID: Tree T

�25
Soil and Plant Tissue Testing LaboratoryWest Experiment Station
682 North Pleasant Street
University of Massachusetts
Amherst, MA 01003
Phone: (413) 545-2311
e-mail: [email protected]
website: soiltest.umass.edu
Prepared For:
Soil Test Report
413-426-0106
Sample Information:
Area Sampled: 70000 sq ft
Sample ID: Sween
Lab Number: S140711-130
Received: 7/16/2014
Reported: 7/16/2014
Results
Edward BruntonSpringfield Parks Division200 Trafton RdSpringfield, MA 01108
Order Number: 8461
ValueAnalysis Found
OptimumRange
ValueAnalysis Found
OptimumRange
5.4Soil pH (1:1, H2O)Modified Morgan extractable, ppm
Macronutrients4.8 Phosphorus (P) 4-1463 Potassium (K) 100-160
414 Calcium (Ca) 1000-150050 Magnesium (Mg) 50-1204.0 Sulfur (S) >10
Micronutrients *0.1 Boron 0.1-0.58.9 Manganese (Mn) 1.1-6.3
18.6 Zinc (Zn) 1.0-7.60.3 Copper (Cu) 0.3-0.6
16.2 Iron (Fe) 2.7-9.466Aluminum (Al) <759.1Lead (Pb) <22
10.4Cation Exch. Capacity, meq/100g7.8Exch. Acidity, meq/100g
Base Saturation, %20 Calcium Base Saturation 50-80
4 Magnesium Base Saturation 10-302 Potassium Base Saturation 2.0-7.0
1.26Scoop Density, g/ccOptional tests
3.8 Soil Organic Matter (LOI), %2 Nitrate-N (NO3-N), ppm
Nutrient Very Low Low Optimum Above Optimum Soil Test Interpretation
Phosphorus (P):Potassium (K):
Magnesium (Mg):Calcium (Ca):
* Micronutrient deficiencies rarely occur in New England soils; therefore, an Optimum Range has never been defined. Values provided represent the normal range found in soils and are for reference only.
1 of 2 Lab Number S140711-130Sample ID: Sween

�26
Soil and Plant Tissue Testing LaboratoryWest Experiment Station
682 North Pleasant Street
University of Massachusetts
Amherst, MA 01003
Phone: (413) 545-2311
e-mail: [email protected]
website: soiltest.umass.edu
Prepared For:
Soil Test Report
413-426-0106
Sample Information:
Area Sampled: 750000 sq ft
Sample ID: Fores
Lab Number: S140711-131
Received: 7/16/2014
Reported: 7/16/2014
Results
Edward BruntonSpringfield Parks Division200 Trafton RdSpringfield, MA 01108
Order Number: 8461
ValueAnalysis Found
OptimumRange
ValueAnalysis Found
OptimumRange
5.5Soil pH (1:1, H2O)Modified Morgan extractable, ppm
Macronutrients3.2 Phosphorus (P) 4-1446 Potassium (K) 100-160
468 Calcium (Ca) 1000-150043 Magnesium (Mg) 50-1203.3 Sulfur (S) >10
Micronutrients *0.2 Boron 0.1-0.58.0 Manganese (Mn) 1.1-6.3
16.2 Zinc (Zn) 1.0-7.60.2 Copper (Cu) 0.3-0.6
12.0 Iron (Fe) 2.7-9.488Aluminum (Al) <753.0Lead (Pb) <22
8.9Cation Exch. Capacity, meq/100g6.1Exch. Acidity, meq/100g
Base Saturation, %26 Calcium Base Saturation 50-80
4 Magnesium Base Saturation 10-301 Potassium Base Saturation 2.0-7.0
1.23Scoop Density, g/ccOptional tests
4.0 Soil Organic Matter (LOI), %4 Nitrate-N (NO3-N), ppm
Nutrient Very Low Low Optimum Above Optimum Soil Test Interpretation
Phosphorus (P):Potassium (K):
Magnesium (Mg):Calcium (Ca):
* Micronutrient deficiencies rarely occur in New England soils; therefore, an Optimum Range has never been defined. Values provided represent the normal range found in soils and are for reference only.
1 of 2 Lab Number S140711-131Sample ID: Fores

�27
Soil and Plant Tissue Testing Laboratory203 Paige Laboratory
161 Holdsworth Way
University of Massachusetts
Amherst, MA 01003
Phone: (413) 545-2311
e-mail: [email protected]
website: soiltest.umass.edu
Prepared For:
Soil Test Report
413-426-0106
Sample Information:
Area Sampled:
Sample ID: WSEDI
Lab Number: S141106-108
Received: 11/6/2014
Reported: 11/12/2014
Results
Edward BruntonSpringfield Parks Department200 Trafton RdSpringfield, MA 01108
Order Number: 11019
ValueAnalysis Found
OptimumRange
ValueAnalysis Found
OptimumRange
6.1Soil pH (1:1, H2O)Modified Morgan extractable, ppm
Macronutrients4.9 Phosphorus (P) 4-1466 Potassium (K) 100-160
482 Calcium (Ca) 1000-150047 Magnesium (Mg) 50-1209.8 Sulfur (S) >10
Micronutrients *0.3 Boron (B) 0.1-0.58.3 Manganese (Mn) 1.1-6.32.0 Zinc (Zn) 1.0-7.60.5 Copper (Cu) 0.3-0.6
33.5 Iron (Fe) 2.7-9.468Aluminum (Al) <752.8Lead (Pb) <22
6.8Cation Exch. Capacity, meq/100g3.8Exch. Acidity, meq/100g
Base Saturation, %36 Calcium Base Saturation 50-80
6 Magnesium Base Saturation 10-303 Potassium Base Saturation 2.0-7.0
1.23Scoop Density, g/ccOptional tests
3.4 Soil Organic Matter (LOI), %0 Nitrate-N (NO3-N), ppm
Nutrient Very Low Low Optimum Above Optimum Soil Test Interpretation
Phosphorus (P):Potassium (K):
Magnesium (Mg):Calcium (Ca):
* Micronutrient deficiencies rarely occur in New England soils; therefore, an Optimum Range has never been defined. Values provided represent the normal range found in soils and are for reference only.
1 of 2 Lab Number S141106-108Sample ID: WSEDI

�28
Soil and Plant Tissue Testing Laboratory203 Paige Laboratory
161 Holdsworth Way
University of Massachusetts
Amherst, MA 01003
Phone: (413) 545-2311
e-mail: [email protected]
website: soiltest.umass.edu
Prepared For:
Soil Test Report
413-426-0106
Sample Information:
Area Sampled:
Sample ID: WSEDN
Lab Number: S141106-109
Received: 11/6/2014
Reported: 11/12/2014
Results
Edward BruntonSpringfield Parks Department200 Trafton RdSpringfield, MA 01108
Order Number: 11019
ValueAnalysis Found
OptimumRange
ValueAnalysis Found
OptimumRange
6.0Soil pH (1:1, H2O)Modified Morgan extractable, ppm
Macronutrients3.4 Phosphorus (P) 4-1483 Potassium (K) 100-160
398 Calcium (Ca) 1000-150031 Magnesium (Mg) 50-120
11.0 Sulfur (S) >10Micronutrients *
0.2 Boron (B) 0.1-0.56.7 Manganese (Mn) 1.1-6.31.9 Zinc (Zn) 1.0-7.60.4 Copper (Cu) 0.3-0.6
33.7 Iron (Fe) 2.7-9.4103Aluminum (Al) <75
2.6Lead (Pb) <22
7.4Cation Exch. Capacity, meq/100g4.9Exch. Acidity, meq/100g
Base Saturation, %27 Calcium Base Saturation 50-80
3 Magnesium Base Saturation 10-303 Potassium Base Saturation 2.0-7.0
1.26Scoop Density, g/ccOptional tests
3.5 Soil Organic Matter (LOI), %0 Nitrate-N (NO3-N), ppm
Nutrient Very Low Low Optimum Above Optimum Soil Test Interpretation
Phosphorus (P):Potassium (K):
Magnesium (Mg):Calcium (Ca):
* Micronutrient deficiencies rarely occur in New England soils; therefore, an Optimum Range has never been defined. Values provided represent the normal range found in soils and are for reference only.
1 of 2 Lab Number S141106-109Sample ID: WSEDN

�29
Soil and Plant Tissue Testing LaboratoryWest Experiment Station
682 North Pleasant Street
University of Massachusetts
Amherst, MA 01003
Phone: (413) 545-2311
e-mail: [email protected]
website: soiltest.umass.edu
Prepared For:
Soil Test Report
413-426-0106
Sample Information:
Area Sampled:
Sample ID: WSODI
Lab Number: S140805-103
Received: 8/5/2014
Reported: 8/8/2014
Results
Edward BruntonSpringfield Parks Division200 Trafton RdSpringfield, MA 01119
Order Number: 8970
ValueAnalysis Found
OptimumRange
ValueAnalysis Found
OptimumRange
5.9Soil pH (1:1, H2O)Modified Morgan extractable, ppm
Macronutrients3.8 Phosphorus (P) 4-14
102 Potassium (K) 100-160563 Calcium (Ca) 1000-1500
57 Magnesium (Mg) 50-12015.4 Sulfur (S) >10
Micronutrients *0.4 Boron 0.1-0.5
32.9 Manganese (Mn) 1.1-6.32.3 Zinc (Zn) 1.0-7.60.6 Copper (Cu) 0.3-0.6
67.2 Iron (Fe) 2.7-9.474Aluminum (Al) <754.8Lead (Pb) <22
8.1Cation Exch. Capacity, meq/100g4.6Exch. Acidity, meq/100g
Base Saturation, %35 Calcium Base Saturation 50-80
6 Magnesium Base Saturation 10-303 Potassium Base Saturation 2.0-7.0
1.25Scoop Density, g/ccOptional tests
3.7 Soil Organic Matter (LOI), %2 Nitrate-N (NO3-N), ppm
Nutrient Very Low Low Optimum Above Optimum Soil Test Interpretation
Phosphorus (P):Potassium (K):
Magnesium (Mg):Calcium (Ca):
* Micronutrient deficiencies rarely occur in New England soils; therefore, an Optimum Range has never been defined. Values provided represent the normal range found in soils and are for reference only.
1 of 2 Lab Number S140805-103Sample ID: WSODI

Section 3The Soil Biomass
Any discussion of nutrient management in a natural turf program would be incomplete if the role of the biomass was not addressed. It is really the foundation upon which our nutrient management program is based. In taking a “feed the soil” approach, soil microbes are at the heart of our management strategy. It is the natural, organic fertilizer that is broken down by the microbial life and nutrients are made plant available. Synthetic fertilizers by their nature, and with their high salt content, may compromise the activity of much of this life in the soil under certain conditions. The microbes do not reproduce and function at healthy levels in soils that exhibit high salinity.
One of the soil tests that has been performed on the trial properties is the assay of microbial life. It is a test that gives us a picture of the living portion of the soil. This test gives u information on both the bacterial and fungal communities and how much of each is actively working for us. We also get information on protozoa and nematodes which are higher-level predators. At the most basic level these organisms interact in a predatory relationship. It is a situation where organisms compete for a chance for survival. One organism consumes another and the byproduct is carbon, nitrogen, and other nutrients made available to either the biomass or the grass plant. For example, a single cell bacteria is comprised of individual units of carbon and nitrogen. If that bacteria is consumed by a protozoa, a higher level predator, that protozoa assumes the carbon and nitrogen. It possesses its own carbon and nitrogen, therefore, it does not need that which has been processed from the bacteria. The excess carbon and nitrogen is exuded into the soil environment. The nitrogen is in an inorganic form and readily available to be taken up by the grass plant. The carbon is sequestered in the soil environment as an energy resource for other organisms.
During the transition from a conventional fertility management program to a natural one, it is important to address the role of the microbial community and choose products that science has shown enhance their development and function. The soil environment, specifically the organic matter, is the home for soil microbial life. When we have soils with a given organic matter percentage, we can use strategies to elevate that organic matter percentage to some degree, if need be. As acknowledged, with native soils, it is not likely that we will raise that percentage any great amount. The enhancement of the organic matter percentage improves the function of the microbial community, but increase is limited to what we can do with a sustainable approach. At some point we become content with the percentage that we have and learn to best manage the soil and the biomass to produce the best turf system that we can.
We now look at soil as being an interactive part of building this system. Our management strategies that deal with the growth of the turfgrass ultimately will affect the microbes. For example, a healthy vigorously growing stand of grass will produce carbohydrate exudates that will be introduced to the soil environment by way of the root system and ultimately become a food source for the microbial community.
�30

The existence and survival of a healthy microbial community depends on an aerobic soil of good texture, chemistry, and fertility. This is the reason that we focus on all three components of our soils and work to establish desired ranges. Soil texture will not be altered with inputs from us. It is what it is in each individual region of the country and we learn how to work with it and adapt those soils to best grow our system. We do have the ability to influence soil chemistry and the biomass. It is in these two areas where we focus our attention.
It is the ability of the microbes to make the conversion from natural, organic sources of nitrogen to inorganic nitrogen that allows the natural process of fertility to work. The organic nitrogen from natural fertilization or from the decomposition of organic matter is converted to inorganic ammonium nitrogen (NH4+) by bacteria in the process of mineralization. It is also converted to nitrate nitrogen (NO3-) during the process of nitrification. Nitrate nitrogen has a negative electrical charge and is therefore soluble. It relatively quickly moves to the root zone of the grass plants after it has been released from the bodies of the predator organisms. Ammonium nitrogen, on the other hand has a positive charge and is therefore held on the cation exchange sites and is referred to as reserve nitrogen. As higher-level predators consume the bacteria, the nitrogen is then released in a plant available forms. Higher-level successional plants, like high production turfgrasses, prefer equal amounts of nitrate and ammonium. This concept will be further clarified in the section on fertility.
When we design a fertility program that is based on natural, organic fertilizer inputs, we also include materials that support and maintain a healthy soil and microbial community. We have a wide range of inputs from which to choose depending upon our transitional program that has been put in place.
These soil bioassay tests outline for us the living portion of the soil. By determining the organisms that are in the soil, both active and dormant, we begin to understand what we have working for us and what we can expect in the way of nutrient availability through the biomass. These tests also guide us in our recommendations for inputs to stimulate or improve the biological function of the soil.
�31

�32
Foodweb AnalysisSoil
Report prepared for:Springfield Parks DivisionEdward Brunton 03-010239 | Submission:03-004584200 Trafton rd. Mason SquareSpringfield, MA 01108 USA turf(413) 787-6439 0
Report Sent:Sample#:
Unique ID:Plant:
Invoice Number:[email protected] 7/3/2014Sample Received:
For interpretation of this report please contact:Local Advisor: or regional lab
Consulting fees may apply
Soil Foodweb New [email protected]
Organism Biomass Data
Dry Weight Active Bacterial
(µg/g)
Total Bacterial (µg/g)
Active Fungal (µg/g)
Total Fungal (µg/g)
Hyphal Diameter
(µm)Results
Comments0.930
Too Dry0.450.85
3.84Low
552Excellent
14.1Good
352Excellent
3.5
1025
150300
1025
150300
ResultsComments
148693High
10000
49403High
6171High
0.26Low
8%Low
10000 50100
2030
40%80%
ResultsComments
0.64Low0.81.5
0.04Low
0.007Low
3.67High
250+
0.10.15
0.10.15
0.751.5
ProtozoaNumbers/g
Flagellates Amoebae Ciliates
Total Nematodes
#/g
Percent Mycorrhizal Colonization
Organism Biomass Ratios
Total Fungal to Total Bacterial
Active to Total Fungal
Active to Total Bacterial
Active Fungal to Active Bacterial
Plant Available N Supply (lbs/acre)
Nematodes per Gram of SoilIdentification to genus
Expected Range
Low
High
Expected Range
Low
High
Expected Range
Low
High
0%Low40%80%
ECTOENDO
Bacterial Feeders Prismatolaimus 0.18 Fungal/Root Feeders Filenchus 0.07
17 Clinton St. Center Moriches, NY 11934 USA631-750-1553 | [email protected]
www.soilfoodweb.com 03-010239: Page 1 of 2

�33
Springfield Parks DivisionEdward Brunton 03-010239 | Submission:03-004584200 Trafton rd. Mason SquareSpringfield, MA 01108 USA turf(413) 787-6439 0
Report Sent:Sample#:
Unique ID:Plant:
Invoice Number:[email protected] 7/3/2014Sample Received:
For interpretation of this report please contact:Local Advisor: or regional lab
Consulting fees may apply
Soil Foodweb New [email protected]
Interpretation Comments:Apply routine teas during the growing season to add beneficial nematodes and ensure good nutrient cycling is occuring. There are good levels of bacteria and fungi present, which are balancing currently. Apply 35-40 gal/ac with 1.5 gal/ac each of liquid humic acid and molasses. Aeration should be performed in late summer to help alleviate compaction. Encourage mulching of the grass clippings to help slowly boost organic matter through the growing season.
Soil Type: Sand, low organic matter, Irrigated: Auto, Plant: turf
Active Bacteria: Low bacterial activity. Add soluble bacterial foods.
Total Bacteria: Higher than normal bacterial biomass suggests high bacterial species diversity.
Active Fungi: Good active fungal biomass.
Total Fungi: Excellent total fungal biomass.
Hyphal Diameter: Mostly the more disease suppressive fungi present.
Protozoa: High ciliate numbers indicate anaerobic conditions. Aeration is needed.
Total Nematodes: Low numbers, and limited diversity. Root-feeding nematodes are present. Need to add beneficial nematodes (including predatory nematodes), improve conditions to allow their survival.
Mycorrhizal Col.: Mycorrhizal colonization of roots too low. Add an inoculum of mycorrhizal spores, then provide humic acids to feed mycorrhizal fungi and improve colonization. Reduce any inorganic fertilizer apps.
TF/TB: The soil is too bacterial for the best health of turf. Inoculate beneficial fungi to balance with bacterial biomass, and add fungal foods.
AF/TF: Low activity; need add fungal foods to encourage fungi growth.
AB/TB: Low activity: add bacterial foods.
AF/AB: Soil is bacterial-dominated but becoming more fungal, which is good.
Nitrogen Supply:
Dry Weight: The soil is too dry. This is a result of low organic matter and/or poor soil structure.
17 Clinton St. Center Moriches, NY 11934 USA631-750-1553 | [email protected]
www.soilfoodweb.com 03-010239: Page 2 of 2

�34
Foodweb AnalysisSoil
Report prepared for:Springfield Parks DivisionEdward Brunton 03-010237 | Submission:03-004584200 Trafton rd. Fredrick HarrisSpringfield, MA 01108 USA turf(413) 787-6439 0
Report Sent:Sample#:
Unique ID:Plant:
Invoice Number:[email protected] 7/3/2014Sample Received:
For interpretation of this report please contact:Local Advisor: or regional lab
Consulting fees may apply
Soil Foodweb New [email protected]
Organism Biomass Data
Dry Weight Active Bacterial
(µg/g)
Total Bacterial (µg/g)
Active Fungal (µg/g)
Total Fungal (µg/g)
Hyphal Diameter
(µm)Results
Comments0.840
In Good Range0.450.85
5.51Low
662Excellent
16.6Good
287Good
3.25
1025
150300
1025
150300
ResultsComments
33170High
10000
55104High
43Low
2.28Low
18%Low
10000 50100
2030
40%80%
ResultsComments
0.43Low0.81.5
0.06Low
0.008Low
3.01High
100-150
0.10.15
0.10.15
0.751.5
ProtozoaNumbers/g
Flagellates Amoebae Ciliates
Total Nematodes
#/g
Percent Mycorrhizal Colonization
Organism Biomass Ratios
Total Fungal to Total Bacterial
Active to Total Fungal
Active to Total Bacterial
Active Fungal to Active Bacterial
Plant Available N Supply (lbs/acre)
Nematodes per Gram of SoilIdentification to genus
Expected Range
Low
High
Expected Range
Low
High
Expected Range
Low
High
0%Low40%80%
ECTOENDO
Bacterial Feeders Heterocephalobus 0.26 Plectus 0.15 Prismatolaimus 0.88 Fungal Feeders Discolaimus 0.11 Pungentus 0.18 Thonus 0.07 Fungal/Root Feeders Aphelenchoides Foliar nematode 0.11 Root Feeders Paratylenchus Pin nematode 0.15
17 Clinton St. Center Moriches, NY 11934 USA631-750-1553 | [email protected]
www.soilfoodweb.com 03-010237: Page 1 of 2

�35
Springfield Parks DivisionEdward Brunton 03-010237 | Submission:03-004584200 Trafton rd. Fredrick HarrisSpringfield, MA 01108 USA turf(413) 787-6439 0
Report Sent:Sample#:
Unique ID:Plant:
Invoice Number:[email protected] 7/3/2014Sample Received:
For interpretation of this report please contact:Local Advisor: or regional lab
Consulting fees may apply
Soil Foodweb New [email protected]
Interpretation Comments:the soil has good levels of fungi and bacteria, but the fungal biomass needs to be increased in relation to the bacteria. Apply teas every 5-6 weeks through the growing season at 30-40 gal/ac with 1 gal/ac each of humic acid, kelp and fish hydrolysate.
Soil Type: Sand, low organic matter, Irrigated: Auto, Plant: turf
Active Bacteria: Low bacterial activity. Add soluble bacterial foods.
Total Bacteria: Higher than normal bacterial biomass suggests high bacterial species diversity.
Active Fungi: Good active fungal biomass.
Total Fungi: The fungal biomass is in good range, but needs to be increased in relation to the bacterial biomass.
Hyphal Diameter: Mostly the more disease suppressive fungi present.
Protozoa: Nutrients are being cycled and made available to plants in good rates.
Total Nematodes: Low numbers, but fair diversity. Root-feeding nematodes are present. Need to add beneficial nematodes (including predatory nematodes), improve conditions to allow their survival.
Mycorrhizal Col.: Mycorrhizal colonization of roots too low. Add an inoculum of mycorrhizal spores, then provide humic acids to feed mycorrhizal fungi and improve colonization. Reduce any inorganic fertilizer apps.
TF/TB: The soil is too bacterial for the best health of turf. Inoculate beneficial fungi to balance with bacterial biomass, and add fungal foods.
AF/TF: Good fungal activity for this time of year.
AB/TB: Low activity: add bacterial foods.
AF/AB: Soil is bacterial-dominated but becoming more fungal, which is good.
Nitrogen Supply: Good plant available N supply from predators.
Dry Weight: Good soil moisture content.
17 Clinton St. Center Moriches, NY 11934 USA631-750-1553 | [email protected]
www.soilfoodweb.com 03-010237: Page 2 of 2

�36
Foodweb AnalysisSoil
Report prepared for:Springfield Parks DivisionEdward Brunton 03-010236 | Submission:03-004584200 Trafton rd. TreetopSpringfield, MA 01108 USA turf(413) 787-6439 0
Report Sent:Sample#:
Unique ID:Plant:
Invoice Number:[email protected] 7/3/2014Sample Received:
For interpretation of this report please contact:Local Advisor: or regional lab
Consulting fees may apply
Soil Foodweb New [email protected]
Organism Biomass Data
Dry Weight Active Bacterial
(µg/g)
Total Bacterial (µg/g)
Active Fungal (µg/g)
Total Fungal (µg/g)
Hyphal Diameter
(µm)Results
Comments0.940
Too Dry0.450.85
7.11Low
604Excellent
7.81Low
312Excellent
3.5
1025
150300
1025
150300
ResultsComments
61481High
10000
148136High
49Low
2.19Low
20%Low
10000 50100
2030
40%80%
ResultsComments
0.52Low0.81.5
0.03Low
0.01Low
1.10Good
250+
0.10.15
0.10.15
0.751.5
ProtozoaNumbers/g
Flagellates Amoebae Ciliates
Total Nematodes
#/g
Percent Mycorrhizal Colonization
Organism Biomass Ratios
Total Fungal to Total Bacterial
Active to Total Fungal
Active to Total Bacterial
Active Fungal to Active Bacterial
Plant Available N Supply (lbs/acre)
Nematodes per Gram of SoilIdentification to genus
Expected Range
Low
High
Expected Range
Low
High
Expected Range
Low
High
0%Low40%80%
ECTOENDO
Bacterial Feeders Acrobeloides 0.27 Heterocephalobus 0.36 Panagrolaimus 0.46 Prismatolaimus 0.09 Fungal Feeders Eudorylaimus 0.14 Microdorylaimus 0.14 Pungentus 0.23 Fungal/Root Feeders Aphelenchus 0.18 Tylenchus 0.18
17 Clinton St. Center Moriches, NY 11934 USA631-750-1553 | [email protected]
www.soilfoodweb.com 03-010236: Page 1 of 2

�37
Springfield Parks DivisionEdward Brunton 03-010236 | Submission:03-004584200 Trafton rd. TreetopSpringfield, MA 01108 USA turf(413) 787-6439 0
Report Sent:Sample#:
Unique ID:Plant:
Invoice Number:[email protected] 7/3/2014Sample Received:
For interpretation of this report please contact:Local Advisor: or regional lab
Consulting fees may apply
Soil Foodweb New [email protected]
Interpretation Comments:Apply routine teas during the growing season to add beneficial nematodes and ensure good nutrient cycling is occuring. Apply 35-40 gal/ac with 1.5 gal/ac each of liquid humic acid and fish hydrolysate, which will help boost the fungal biomass in relation to the bacteria.
Aeration should be performed in late summer to help alleviate compaction. Encourage mulching of the grass clippings to help slowly boost organic matter through the growing season. Annual compost topdressing in spring and fall will also help boost organic matter. Higher levels of organic matter will help increase water holding capacity.
Irrigated: Auto, Plant: turf
Active Bacteria: Low bacterial activity. Add soluble bacterial foods.
Total Bacteria: Higher than normal bacterial biomass suggests high bacterial species diversity.
Active Fungi: Low fungal activity. Soluble fungal foods are needed to quickly boost activity.
Total Fungi: Excellent total fungal biomass.
Hyphal Diameter: Mostly the more disease suppressive fungi present.
Protozoa: Nutrients are being cycled and made available to plants in good rates.
Total Nematodes: Low numbers, and limited diversity. Need to add beneficial nematodes (including predatory nematodes), improve conditions to allow their survival.
Mycorrhizal Col.: Mycorrhizal colonization low, but at least present in sufficient amount that the inoculum is present. Provide humic acids to feed mycorrhizal fungi and improve colonization.
TF/TB: The soil is too bacterial for the best health of turf. Inoculate beneficial fungi to balance with bacterial biomass, and add fungal foods.
AF/TF: Low activity; need add fungal foods to encourage fungi growth.
AB/TB: Low activity: add bacterial foods.
AF/AB: Soil is bacterial-dominated but becoming more fungal, which is good.
Nitrogen Supply:
Dry Weight: The soil is too dry. This is a result of low organic matter and/or poor soil structure.
17 Clinton St. Center Moriches, NY 11934 USA631-750-1553 | [email protected]
www.soilfoodweb.com 03-010236: Page 2 of 2

�38
Foodweb AnalysisSoil
Report prepared for:Springfield Parks DivisionEdward Brunton 03-010238 | Submission:03-004584200 Trafton rd. SweeneySpringfield, MA 01108 USA turf(413) 787-6439 0
Report Sent:Sample#:
Unique ID:Plant:
Invoice Number:[email protected] 7/3/2014Sample Received:
For interpretation of this report please contact:Local Advisor: or regional lab
Consulting fees may apply
Soil Foodweb New [email protected]
Organism Biomass Data
Dry Weight Active Bacterial
(µg/g)
Total Bacterial (µg/g)
Active Fungal (µg/g)
Total Fungal (µg/g)
Hyphal Diameter
(µm)Results
Comments0.940
Too Dry0.450.85
7.84Low
562Excellent
37.5Excellent
884Excellent
3.5
1025
150300
1025
150300
ResultsComments
45572High
10000
61500High
614High
4.53Low
13%Low
10000 50100
2030
40%80%
ResultsComments
1.57High0.81.5
0.04Low
0.01Low
4.78High
200+
0.10.15
0.10.15
0.751.5
ProtozoaNumbers/g
Flagellates Amoebae Ciliates
Total Nematodes
#/g
Percent Mycorrhizal Colonization
Organism Biomass Ratios
Total Fungal to Total Bacterial
Active to Total Fungal
Active to Total Bacterial
Active Fungal to Active Bacterial
Plant Available N Supply (lbs/acre)
Nematodes per Gram of SoilIdentification to genus
Expected Range
Low
High
Expected Range
Low
High
Expected Range
Low
High
0%Low40%80%
ECTOENDO
Bacterial Feeders Acrobeloides 0.28 Pelodera 0.38 Plectus 0.47 Prismatolaimus 1.60 Fungal Feeders Eudorylaimus 0.47 Thonus 0.19 Fungal/Root Feeders Aphelenchus 0.19 Filenchus 0.28 Merlinius 0.38
17 Clinton St. Center Moriches, NY 11934 USA631-750-1553 | [email protected]
www.soilfoodweb.com 03-010238: Page 1 of 2

�39
Springfield Parks DivisionEdward Brunton 03-010238 | Submission:03-004584200 Trafton rd. SweeneySpringfield, MA 01108 USA turf(413) 787-6439 0
Report Sent:Sample#:
Unique ID:Plant:
Invoice Number:[email protected] 7/3/2014Sample Received:
For interpretation of this report please contact:Local Advisor: or regional lab
Consulting fees may apply
Soil Foodweb New [email protected]
Interpretation Comments:Apply routine teas during the growing season to add beneficial nematodes and ensure good nutrient cycling is occuring. Apply 35-40 gal/ac with 3/4 gal/ac of liquid humic acid and 1 gal/ac each of fish hydrolysate and molasses. Aeration should be performed in late summer to help alleviate compaction. Encourage mulching of the grass clippings to help slowly boost organic matter through the growing season. Additional organic matter will help improve the moisture holding capacity.
Soil Type: Sand, low organic matter, Irrigated: Auto, Plant: turf
Active Bacteria: Low bacterial activity. Add soluble bacterial foods.
Total Bacteria: Higher than normal bacterial biomass suggests high bacterial species diversity.
Active Fungi: Fungal activity above expected levels; fungal biomass will increase as long as nutrients are available.
Total Fungi: Excellent total fungal biomass.
Hyphal Diameter: Mostly the more disease suppressive fungi present.
Protozoa: High ciliate numbers indicate anaerobic conditions. Aeration may be needed.
Total Nematodes: Low numbers, and limited diversity. Need to add beneficial nematodes (including predatory nematodes), improve conditions to allow their survival.
Mycorrhizal Col.: Mycorrhizal colonization of roots too low. Add an inoculum of mycorrhizal spores, then provide humic acids to feed mycorrhizal fungi and improve colonization. Reduce any inorganic fertilizer apps.
TF/TB: The soil is too fungal for the best health of turf. Need to improve beneficial bacteria to balance fungal biomass.
AF/TF: Good fungal activity for this time of year.
AB/TB: Low activity: add bacterial foods.
AF/AB: Soil is fungal dominated but becoming even more fungal; addition of bacterial foods might be necessary, depending on plant species desired.
Nitrogen Supply: Very good plant available N supply from predators.
Dry Weight: The soil is too dry. This is a result of low organic matter and/or poor soil structure.
17 Clinton St. Center Moriches, NY 11934 USA631-750-1553 | [email protected]
www.soilfoodweb.com 03-010238: Page 2 of 2

�40
Foodweb AnalysisSoil
Report prepared for:Springfield Parks DivisionEdward Brunton 03-010235 | Submission:03-004584200 Trafton rd. Forest parkSpringfield, MA 01108 USA turf(413) 787-6439 0
Report Sent:Sample#:
Unique ID:Plant:
Invoice Number:[email protected] 7/3/2014Sample Received:
For interpretation of this report please contact:Local Advisor: or regional lab
Consulting fees may apply
Soil Foodweb New [email protected]
Organism Biomass Data
Dry Weight Active Bacterial
(µg/g)
Total Bacterial (µg/g)
Active Fungal (µg/g)
Total Fungal (µg/g)
Hyphal Diameter
(µm)Results
Comments0.830
In Good Range0.450.85
28.0Excellent
369Excellent
59.5Excellent
334Excellent
3
1025
150300
1025
150300
ResultsComments
55466High
10000
33388High
2578High
3.55Low
7%Low
10000 50100
2030
40%80%
ResultsComments
0.91Good0.81.5
0.18High
0.08Low
2.13High
100-150
0.10.15
0.10.15
0.751.5
ProtozoaNumbers/g
Flagellates Amoebae Ciliates
Total Nematodes
#/g
Percent Mycorrhizal Colonization
Organism Biomass Ratios
Total Fungal to Total Bacterial
Active to Total Fungal
Active to Total Bacterial
Active Fungal to Active Bacterial
Plant Available N Supply (lbs/acre)
Nematodes per Gram of SoilIdentification to genus
Expected Range
Low
High
Expected Range
Low
High
Expected Range
Low
High
0%Low40%80%
ECTOENDO
Bacterial Feeders Acrobeloides 0.38 Heterocephalobus 0.53 Panagrolaimus 0.30 Plectus 0.15 Prismatolaimus 0.38 Protorhabditis 0.61 Fungal Feeders Aporcelaimium 0.15 Eudorylaimus 0.23 Fungal/Root Feeders Filenchus 0.23
17 Clinton St. Center Moriches, NY 11934 USA631-750-1553 | [email protected]
www.soilfoodweb.com 03-010235: Page 1 of 2

�41
Springfield Parks DivisionEdward Brunton 03-010235 | Submission:03-004584200 Trafton rd. Forest parkSpringfield, MA 01108 USA turf(413) 787-6439 0
Report Sent:Sample#:
Unique ID:Plant:
Invoice Number:[email protected] 7/3/2014Sample Received:
For interpretation of this report please contact:Local Advisor: or regional lab
Consulting fees may apply
Soil Foodweb New [email protected]
Interpretation Comments:Apply routine teas during the growing season to add beneficial nematodes and ensure good nutrient cycling is occuring. Apply 35-40 gal/ac with 1 gal/ac each of liquid humic acid and molasses. Aeration should be performed in late summer to help alleviate compaction. Encourage mulching of the grass clippings to help slowly boost organic matter through the growing season.
Irrigated: Auto, Plant: turf
Active Bacteria: Bacterial activity above expected levels; Bacterial biomass will increase as long as nutrients are available.
Total Bacteria: Higher than normal bacterial biomass suggests high bacterial species diversity.
Active Fungi: Fungal activity above expected levels; fungal biomass will increase as long as nutrients are available.
Total Fungi: Excellent total fungal biomass.
Hyphal Diameter: Good fungal community is present.
Protozoa: High ciliate numbers indicate anaerobic conditions. Aeration may be needed.
Total Nematodes: Low numbers, and limited diversity. Need to add beneficial nematodes (including predatory nematodes), improve conditions to allow their survival.
Mycorrhizal Col.: Mycorrhizal colonization of roots too low. Add an inoculum of mycorrhizal spores, then provide humic acids to feed mycorrhizal fungi and improve colonization. Reduce any inorganic fertilizer apps.
TF/TB: Good fungal to bacterial ratio.
AF/TF: Fungi are growing, an increase in total fungal biomass should result.
AB/TB: Good bacterial activity for this time of year.
AF/AB:
Nitrogen Supply: Very good plant available N supply from predators.
Dry Weight: Good soil moisture content.
17 Clinton St. Center Moriches, NY 11934 USA631-750-1553 | [email protected]
www.soilfoodweb.com 03-010235: Page 2 of 2

Section 4Transition Period
When turf management programs change, there is a period of time we refer to as the transition period. When we move from a conventional program to a natural one, the length of time involved in transition is directly related to the intensity of current and past management practices and the overall turf quality.
During transition it is important to address the soil and the biomass, as well as the cultural practices that support it and the turf itself. The biggest issue is moving the management of fertility from the conventional program to a natural one. After many years of conventional fertility management that has used synthetic, water-soluble fertilizers with high salt levels, the soil microbiology has been bypassed and possibly compromised. We strive to support and restore the soil to good health during this transition period so that the natural processes of fertility will take over and produce healthy turf. During this transition, we do not expect to see a collapse or failure of the turfgrass system. As long as the transition process addresses the whole system, including the soil biomass, natural product, and cultural practices, we expect to see steady improvement.
Any inputs to the system should remain constant for two or three years until we feel comfortable that we are beginning to see the establishment of a healthy organic system. Once we begin to approach some level of sustainability, we then can revisit the product input and determine exactly where we need to be to maintain the functionality of this system.
It is important during transition that we establish a sound management plan that enables us to successfully move forward. The reality in the municipal sector is that there is not always budget money available in the amount desired or needed to implement some turf management programs. In this approach, it is important to address the 4P’s – protocol, procedure, product, and prioritization. It is this concept of prioritization that allows us to create levels of management and then to allocate often scarce financial resources to those areas of properties where the greatest impact will be made. This is critical, especially during the transition, when we need to be the most aggressive with input and cultural practices.
�42

Section 5Soil Test Analysis
Mason Square68.7% sand, 22.9% silt, 8.3% clay 57.3% finesOrganic Matter 5.5% CEC 11.8 meq/100gNitrate 2 ppm very lowpH 6.2 goodPhosphorus 7.2 ppm goodPotassium 57 ppm lowCalcium 1321 ppm goodMagnesium 118 ppm goodBase SaturationCalcium 56% 50% to 80% optimumMagnesium 8% 10% to 30% optimumPotassium 1% 2% to 7% optimumTotal bacterial fraction is excellent, but the active fraction is very lowTotal fungal fraction is excellent, but the active fraction could be improvedFlagellate and amoeba numbers are in the high range indicating a high nutrient cycling potentialCiliate numbers are high indicating compacted, anaerobic soilBeneficial nematodes are lowEndo mycorrhizal colonization is very low at 8% Plant available nitrogen supply through the biomass is high
Frederick Harris66.3% sand, 25.9% silt, 7.9% clay 64.3% finesOrganic Matter 3.9% CEC 8.3 meq/100gNitrate 2 ppm very lowpH 5.7 lowPhosphorus 1.8 ppm very lowPotassium 44 ppm very lowCalcium 419 ppm very lowMagnesium 42 ppm low Base SaturationCalcium 25% 50% to 80% optimumMagnesium 4% 10% to 30% optimumPotassium 1% 2% to 7% optimumTotal bacterial fraction is excellent, but the active fraction is lowTotal fungal fraction is good, but the active fraction could be improvedFlagellate and amoeba numbers are in the high range indicating a high nutrient cycling potentialBeneficial nematodes are lowEndo mycorrhizal colonization is low at 18% Plant available nitrogen supply through the biomass is moderate
�43

Treetop71.0% sand, 21.8% silt, 7.2% clay 65.6% finesOrganic Matter 2.7% CEC 6.9 meq/100gNitrate 2 ppm very lowpH 6.2Phosphorus 5.5 ppm goodPotassium 61 ppm lowCalcium 529 ppm lowMagnesium 57 goodBase SaturationCalcium 38% 50% to 80% optimumMagnesium 7% 10% to 30% optimumPotassium 2% 2% to 7% optimumTotal bacterial fraction is excellent, but the active fraction is lowTotal fungal fraction is excellent, but the active fraction is lowFlagellate and amoeba numbers are in the high range indicating a high nutrient cycling potentialBeneficial nematodes are lowEndo mycorrhizal colonization is low at 20% Plant available nitrogen supply through the biomass is high
Sweeney62.4% sand, 31.6% silt, 6.0% clay 68.5% finesOrganic Matter 3.8% CEC 10.4 meq/100gNitrate 2 ppm very lowpH 5.4 lowPhosphorus 4.8 ppm goodPotassium 63 ppm lowCalcium 414 ppm lowMagnesium 50 goodBase SaturationCalcium 20% 50% to 80% optimumMagnesium 4% 10% to 30% optimumPotassium 2% 2% to 7% optimumTotal bacterial fraction is excellent, but the active fraction is lowTotal fungal fraction is excellent and the active fraction is excellentFlagellate and amoeba numbers are in the high range indicating a high nutrient cycling potentialCiliate numbers are high indicating compacted, anaerobic soilBeneficial nematodes are lowEndo mycorrhizal colonization is very low at 13% Plant available nitrogen supply through the biomass is high
�44

Forest72.7% sand, 21.1% silt, 6.2% clay 46.6% finesOrganic Matter 4.0% CEC 8.9 meq/100gNitrate 4 ppm lowpH 5.5 lowPhosphorus 3.3 ppm lowPotassium 46 ppm very lowCalcium 468 ppm very lowMagnesium 43 ppm very lowBase SaturationCalcium 26% 50% to 80% optimumMagnesium 4% 10% to 30% optimumPotassium 1% 2% to 7% optimumTotal bacterial fraction is excellent and the active fraction is excellentTotal fungal fraction is excellent and the active fraction is excellentFlagellate and amoeba numbers are in the high range indicating a high nutrient cycling potentialCiliate numbers are extremely high indicating compacted, anaerobic soilBeneficial nematodes are lowEndo mycorrhizal colonization is very low at 7%Him Plant available nitrogen supply through the biomass is moderate
Camp Wilder seeded irrigated72.0% sand, 20.8% silt, 7.2% clay 53.1% finesOrganic Matter 3.4% CEC 6.8 meq/100gNitrate 0 ppm very lowpH 6.1 low-fairPhosphorus 4.9 ppm goodPotassium 66 ppm lowCalcium 482 ppm very lowMagnesium 49 ppm lowBase SaturationCalcium 36% 50% to 80% optimumMagnesium 6% 10% to 30% optimumPotassium 3% 2% to 7% optimum
Wilder seeded not irrigated76.9% sand, 17.5% silt, 5.6% clay 51.3% finesOrganic Matter 3.4% CEC 6.8 meq/100gNitrate 0 ppm very lowpH 6.0 low-fairPhosphorus 3.4 ppm low-fairPotassium 83 ppm lowCalcium 398 ppm very lowMagnesium 31 ppm very-low
�45

Base SaturationCalcium 27% 50% to 80% optimumMagnesium 3% 10% to 30% optimumPotassium 3% 2% to 7% optimum
Wilder sodded irrigated68.5% sand, 24.3% silt, 7.2% clay 62.4% finesOrganic Matter 3.4% CEC 6.8 meq/100gNitrate 0 ppm very lowpH 5.9 lowPhosphorus 3.8 ppm low-fairPotassium 102 ppm goodCalcium 563 ppm very lowMagnesium 57 ppm goodBase SaturationCalcium 35% 50% to 80% optimumMagnesium 6% 10% to 30% optimumPotassium 3% 2% to 7% optimum
Section 6Site Analysis
Mason Square10,285 ft.²This is an example of an irrigated terrace in downtown Springfield. Surprisingly, the soil is not too bad. A typical situation like this usually ends up with an inferior topsoil. Other than some minor adjustments, the soil here is good.
As is evidenced by the photographs, turf density here runs from nonexistent to fairly decent. There are some patches of grass that are not in bad shape. There are significant bare spots and and stressed turf areas. There is some weed pressure evident.
Frederick Harris75,000 ft.²This property is scheduled for a redo. The grass area depicted in the photographs will be removed, and the area will be reconstructed. The grass surface will be established by using sod. There is currently no irrigation, but it could be installed.
�46

Treetop110,000 ft.² This playing field was built four years ago. It is used for soccer. The soil used in construction was important to the site. The field has been sodded twice since construction and the second sodding was laid over the first. The second renovation was two years ago. At that time it was over seeded with a mixture of Kentucky bluegrass (70%) and Perennial ryegrass (30%). The field is irrigated on a schedule of 3X weekly.
Overall, the field generally exhibits good turf density. There are some 6 to 10 inch bare spots. There is a very modest crabgrass pressure. The field is generally weed free. There is significant wear in the goalmouths.
Sweeney70,000 ft.²This is a playing field associated with a school. In addition to athletic play the field services the needs of physical education. It is a heavily used field. The soil is extremely compacted. During construction the soil was rolled prior to establishing the turf. It was difficult to penetrate when collecting soil for sampling. A combination of construction techniques and the lack of aeration to relieve the compaction has this field in a situation that needs aggressive reversal. It will be as much about the cultural practices as it will be the product inputs here. This, like the other properties, has been receiving synthetic fertilizers and other soluble materials.
There are significant wear areas throughout the field. The compaction, not just at the goal mouths but overall, has made it difficult for the roots of much of the turf to become strong and established. There are multiple bare areas that range in size from 8 inches to over a foot. The goalmouths are heavily worn. There is an area in the center of the field needs to be brought back up to grade and seeded. Crabgrass is present as well as other broadleaf weeds. The field has a general clumpy appearance overall.
Forest630,000 ft.²This is the largest of the playing fields encompassing baseball, football, and all-purpose use. The grass is generally typical of older field areas. Current turf density for the most part is good. There are large, very defined areas of clover pressure throughout much of this field. The area that is used for football shows wear typical of that type of field. That
Camp Wilder seed irrigatedCamp Wilder seed not irrigated84,000 ft.² total
Camp Wilder sod38,000 ft.²
�47

�48
Mason Square
Mason Square

�49
Mason Square
Mason Square

�50
Frederick Harris
Frederick Harris

�51
Frederick Harris
Frederick Harris

�52
Treetop
Treetop

�53
Treetop
Treetop

�54
Sweeney
Sweeney

�55
Sweeney
Sweeney

�56
Forest
Forest

�57
Forest
Forest

Section 7Current Materials and Cultural Practices
Fertilizer
Fertility-springParks 25-0-5 1 lb N/Schools 20-10-10 1 lb N/Terraces 17-0-5 ¾ lb N
Fertility-summerParks 25-0-5 1 lb N/Terraces 17-0-5 ¾ lb N/
Fertility-fall
Parks 25-0-5 1 lb N/Schools 20-10-10 1 lb N/Terraces 17-0-5 ¾ lb N
Control products
Barricade herbicide, pre-emergenceDimension herbicide, pre-emergenceTruPower 3 herbicide, selective, post-emergenceMerit 2F insecticide, grubs and othersTalstar Pro insecticide, broad spectrum
Aeration 1-2 x annuallyMowing height 2½” to 3”
Specimen labels for materials follows.
�58

�59
18" Web (Front) 18" Web (Back)
28"
Repeat
Non-Print
Areas
Printable
Areas
1/2
" NO
PR
INT
1" NO PRINT
3" NO PRINT
14.5" Finished Front3.5"
Gusset
14.5" Finished Back3.5"
Gusset
LEBANON
NET WEIGHT 50 LBS. (22.7 KG)
For technical assistance or more information about our products visit www.LebanonTurf.com
LEB
AN
ON
FERT
ILIZ
ERLEB
AN
ON
FERTILIZER
CAUTIONFertilizer may cause irritation of eyes, nose, throat, and skin. In case of contact with skin or eyes, flush with plenty of water; for eyes get medical attention.
Use in accordance with recommendations of a qualified individual or institution, such as, but not limited to a certified crop advisor, agronomist, university crop extension publication, or apply according to recommendations in your approved nutrient management plan.
Do not apply near water, storm drains or drainage ditches. Do not apply if heavy rain is expected. Apply this product only to your lawn, and sweep any product that lands on the driveway, sidewalk, or street back on to your lawn.
WARRANTYNOTE To the extent consistent with applicable law, Buyer assumes all responsibility for safety and performance if this product is not used according to the directions.
Application RatesTo feed at the rate of 0.9 lb. Nitrogen (N) per 1,000 sq. ft., apply this product at 4 lbs per 1,000 sq. ft. or 175 lbs. per acre.To feed at the rate of 0.5 lb. Nitrogen (N) per 1,000 sq. ft., apply this product at 2 lbs per 1,000 sq. ft. or 88 lbs. per acre.
Spreader 0.9#/1,000 sq. ft. 0.5#/1,000 sq. ft. Spreader 0.9#/1,000 sq. ft. 0.5#/1,000 sq. ft.LebanonTurf 4¾ 4 Lesco (letter/Numeric) J/21 G/15Andersons AccuPro L H PennMulch HVO L IEarthway Rotary 16 14 ProScape SS L IGandy 27 24 Spyker 4¾ 4Lely 5½ II 4 II Vicon (all models) 25 22These settings were calibrated and field tested. However, age and condition of spreader, speed of operation and evenness of terrain may require slightly different settings for desired coverage.
SUGGESTED SPREADER SETTINGS
25-0-5FERTILIZER
Total Nitrogen (N) 25% 4.5% Ammoniacal Nitrogen 2.6% Water Insoluble Nitrogen* 13.3% Urea Nitrogen 4.6% Other Water Soluble Nitrogen*Soluble Potash (K2O) 5%Sulfur (S) 5.0% 5.0% Combined Sulfur (S)Iron (Fe) 1.0% 0.1% Water Soluble Iron (Fe)
Derived From: Ammonium Sulfate, Methylene Ureas, Urea, Muriate of Potash, Ferric Oxide, Ferrous Sulfate.
*7.2% Slowly available Nitrogen from Methylene Ureas.
Chlorine (Cl) not more than 8.0%
.................................................................
..............................................................................
22-54318F699
GUARANTEED ANALYSIS
..................................................
............................................................
Information regarding the contents and levels of metals in this product is available on the Internet at: http://www.regulatory-info-lebsea.com
NOTICE: This product contains the secondary nutrient iron. Iron may stain concrete surfaces and should not be applied on dry or water dampened concrete and should be removed from these areas promptly by sweeping or blowing. Do not wash off with water.
..............................................................................
800-233-0628 • (717-273-1685)
h/14

�60
TRUPOWER® 3SELECTIVE HERBICIDE
SELECTIVE BROADLEAF WEED CONTROL FOR TURFGRASSES INCLUDING USE ON SOD FARMS. TOCONTROL CLOVER, DANDELION, HENBIT, PLANTAINS,WILD ONION, AND MANY OTHER BROADLEAF WEEDS.
ALSO FOR HIGHWAYS, RIGHTS-OF-WAY AND OTHER SIMILAR NON-CROP AREAS.
CONTAINS 2,4-D MECOPROP-p AND DICAMBAGET THE OPTICAL ADVANTAGE®
ACTIVE INGREDIENTS:Triisopropanolamine Salt of 2,4-Dichlorophenoxyacetic Acid* . . . . . . . . . . . . . . . . . . . . . . . . . . . . . . . . . . . . . . . . . . . . . . 47.77%Dimethylamine Salt of (+)-R-2-(2-Methyl-4-Chlorophenoxy) propionic Acid **‡ . . . . . . . . . . . . . . . . . . . . . . . . . . . . . . . . . 7.74%Dicamba Acid (3,6-Dichloro-o-anisic Acid)*** . . . . . . . . . . . . . . . . . . . . . . . . . . . . . . . . . . . . . . . . . . . . . . . . . . . . . . . . . . . 3.20%
OTHER INGREDIENTS: . . . . . . . . . . . . . . . . . . . . . . . . . . . . . . . . . . . . . . . . . . . . . . . . . . . . . . . . . . . . . . . . . . . . . . . . . . . . . . 41.29%TOTAL: . . . . . . . . . . . . . . . . . . . . . . . . . . . . . . . . . . . . . . . . . . 100.00%
Isomer Specific Method, Equivalent to:*2,4-Dichlorophenoxyacetic Acid . . . . . . . . . . . . . . . . . . . . . . . . . . . . . . . . . . . . . . . . . . . . . . . . . . . . . . . . 25.60%, 2.56 lbs./gal.
**(+)-R-2-(2-Methyl-4-Chlorophenoxy)propionic Acid . . . . . . . . . . . . . . . . . . . . . . . . . . . . . . . . . . . . . . . . . . 6.40%, 0.64 lbs./gal.***3,6-Dichloro-o-anisic Acid . . . . . . . . . . . . . . . . . . . . . . . . . . . . . . . . . . . . . . . . . . . . . . . . . . . . . . . . . . . . . . 3.20%, 0.32 lbs./gal.
‡CONTAINS THE SINGLE ISOMER FORM OF MECOPROP-p
FOR USE BY TURF MAINTENANCE PERSONNEL, LANDSCAPING OR COMMERCIAL APPLICATORS ONLY.
For Chemical Spill, Leak, Fire, or Exposure, Call CHEMTREC (800) 424-9300For Medical Emergencies Only, Call (877) 325-1840
NET CONTENTS 2.5 GALS.
000228-00551.20080421.NotificationNUP-06237
EPA REG. NO. 228-551EPA EST. NO. 228-IL-1
MANUFACTURED BYNUFARM AMERICAS INC.
150 HARVESTER DRIVEBURR RIDGE, IL 60527
KEEP OUT OF REACH OF CHILDRENDANGER - PELIGRO
Si usted no entiende la etiqueta, busque a alguien para que se la explique a usted en detalle.(If you do not understand the label, find someone to explain it to you in detail.)
SEE INSIDE BOOKLET FOR FIRST AID AND ADDITIONAL PRECAUTIONARY STATEMENTS

�61
PULL HERE TO OPEN
3 poundsNet Contents
BA
R C
OD
E #
IS(0
1) 0
07
0294
1 31
305
LAST
DIG
IT IS
CH
ECK
DIG
IT(B
arco
de ty
pe: U
CC
/EA
N 1
28)
HerbicideFor preemergence control of grass and broadleaf weeds in:• Established turfgrasses (excluding golf course putting greens), lawns and sod nurseries• Container, field-grown, and landscape ornamentals• Conifer and hardwood seedling nurseries• Established perennials and wildflower plantings• Non-crop areas, including plantings on managed rights-of-way for transportation systems and utilities (including, roadways, roadsides, railways and equipment yards)• Facilities including substations, tank farms, pumping stations, parking and storage areas, and ungrazed fence rows • Christmas tree farmsActive Ingredient:Prodiamine* . . . . . . . . . . . . . . . . . . . . . . . . . . . . . . . . . . . . . . . . . . 65.0%Other Ingredients: 35.0%Total: 100.0%*CAS No. 29091-21-2
KEEP OUT OF REACHOF CHILDREN.CAUTIONSee additional precautionary statements anddirections for use inside booklet.EPA Reg. No. 100-834 EPA Est. No. 62171-MS-001
SCP 834A-M4E 0909 4012003

�62
5”
4.8125”
0240637703407954E 131205AV1
Net Contents1Gallon
INSECTICIDEFor foliar and systemic insect control in turfgrass (including sod farms), landscape ornamentals, fruit and nut trees and interior plantscapes.ACTIVE INGREDIENT:*Imidacloprid,1-[(6-Chloro-3-pyridinyl)methyl]-N-nitro-2-imidazolidinimin ........................ 21.4%OTHER INGREDIENTS: ......................................... 78.6%TOTAL: 100.0%*Contains 2 pounds of imidacloprid per gallon. SHAKE WELL BEFORE USING.EPA Reg. No. 432-1312STOP - READ THE LABEL BEFORE USE
KEEP OUT OF REACH OF CHILDRENCAUTION
�PARA EL USUARIO: Si usted no lee o entiende inglés, no use este producto hasta que le hayan explicado completamente las
instrucciones que figuran en la etiqueta.(TO THE USER: If you cannot read or understand English, do not use
this product until the label has been fully explained to you.)For MEDICAL And TRANSPORTATION Emergencies ONLY Call 24
Hours A Day 1-800-334-7577For PRODUCT USE Information Call 1-800-331-2867
Merit 2F 1 gal 3407954E 131205AV1 ETL 022714 with crops.qxp:Merit 2F 1 gal 3407954E 131205AV1 ETL 022714 with crops 2/27/14 11:30 AM Page 1

�63
Specimen Label
Provides control of listed annual grasses and broadleaf weeds in established lawns, commercial sod farms, non-cropland and industrial sites, ornamental turf (including golf course fairways, roughs, tee boxes), field-grown nursery ornamentals, and landscape ornamentals. In the state of New York, this product may be used by commercial applicators only at no more than 2 pints (0.5 lb active ingredient) per acre per year. In Nassau and Suffolk counties of New York, do not exceed 1 pint per year of this product (equivalent to 0.25 lb of active ingredient per acre). Active Ingredient dithiopyr: S,S'-dimethyl 2-(difluoromethyl)-4-(2-methylpropyl)- 6-(trifluoromethyl)-3,5-pyridinedicarbothioate ........................... 24% Inert Ingredients ............................................................................. 76% Total............................................................................................... 100% Contains petroleum distillates Contains 240 grams per liter or 2 lb active ingredient per U.S. gallon. Product protected by U.S. Patent No. 4,692,184. Other patents pending EPA Reg. No. 62719-542 Keep Out of Reach of Children
WARNING AVISO Si usted no entiende la etiqueta, busque a alguien para que se la explique a usted en detalle. (If you do not understand the label, find someone to explain it to you in detail.)
Precautionary Statements Hazards to Humans and Domestic Animals
Causes Skin Irritation • Causes Moderate Eye Irritation • Prolonged Or Frequently Repeated Skin Contact May Cause Allergic Reactions In Some Individuals Do not get on skin or on clothing. Avoid contact with eyes. Wear protective clothing and gloves. Wash thoroughly with soap and water after handling and before eating, drinking, chewing gum, or using tobacco. Remove and wash contaminated clothing before reuse. Personal Protective Equipment (PPE): Some materials that are chemical-resistant to this product are listed below. If you want more options, follow the instructions for category B on an EPA chemical-resistance category selection chart. WPS Uses: Applicators and other handlers who handle this product for any use covered by the Worker Protection Standard (40 CFR Part 170) – in general, agricultural plant uses are covered - must wear: • Coveralls over short-sleeved shirt and short pants • Chemical-resistant gloves >14 mils such as barrier laminate or
butyl rubber • Chemical-resistant footwear plus socks WPS Uses: Mixers and loaders must wear: • Coveralls over short-sleeved shirt and short pants • Chemical-resistant gloves >14 mils such as barrier laminate or
butyl rubber • Chemical-resistant footwear plus socks • Chemical-resistant apron Non-WPS Uses: Mixers and loaders who handle this product for any use NOT covered by the Worker Protection Standard (40 CFR Part 170) – in general, agricultural plant uses are covered - must wear: • Chemical-resistant gloves >14 mils such as barrier laminate or
butyl rubber Discard clothing and other absorbent materials that have been drenched or heavily contaminated with the product’s concentrate. Do not reuse them. Follow the manufacturer’s instructions for cleaning/maintaining PPE. If no such instructions for washables, use detergent and hot water. Keep and wash PPE separately from other laundry. Engineering Controls When handlers use closed systems or enclosed cabs in a manner that meets the requirements listed in the Worker Protection Standard (WPS) for agricultural pesticides [40 CFR 170.240(d)(4-6)], the handler PPE requirements may be reduced or modified as specified in the WPS.
User Safety Recommendations Users should: • Wash hands before eating, drinking, chewing gum, using tobacco
or using the toilet. • Remove clothing/PPE immediately if pesticide gets inside. Then
wash thoroughly and put on clean clothing. • Remove PPE immediately after handling this product. Wash the
outside of gloves before removing. As soon as possible, wash thoroughly and change into clean clothing.

�64
Page 1
Net Contents: 1 Gallon
EPA Reg. No. 279-3206 EPA Est. 279-NY-1Active Ingredient: By Wt.
Bifenthrin* ...................................................... 7.9%Other Ingredients: ............................................. 92.1%
100.0%
KEEP OUT OF REACH OF CHILDREN
CAUTION
FMC CorporationAgricultural Products Group1735 Market StreetPhiladelphia PA 19103
04/17/13
PRECAUTIONARY STATEMENTSHazards to Humans (and Domestic Animals)CAUTIONHarmful if swallowed, inhaled or absorbed through skin. Avoid contact withskin, eyes or clothing. Avoid breathing spray mist. Wash thoroughly withsoap and water after handling and before eating, drinking, chewing gum, orusing tobacco. Remove contaminated clothing and wash before reuse.All pesticide handlers (mixers, loaders and applicators) must wear long-sleeved shirt and long pants, socks, shoes and chemical-resistant gloves.After the product is diluted in accordance with label directions for use,and/or when mixing and loading using a closed spray tank transfer system(such as U-Turn®), or an in-line injector system, shirt, pants, socks, shoesand waterproof gloves are sufficient. In addition, all pesticide handlers mustwear a respiratory protection device1 when working in a non-ventilatedspace. All pesticide handlers must wear protective eyewear when working innon-ventilated space.
1Use one of the following NIOSH approved respirator with any R, P orHE filteror a NIOSH approved respirator with an organic vapor (OV) cartridgeor canister with any R, P or HE prefilter.
Follow manufacturerʼs instructions for cleaning/maintaining PPE. If no suchinstructions for washables, use detergent and hot water. Keep and washPPE separately from other laundry.
To control pests indoors and outdoors on resi-dential, institutional, public, commercial, andindustrial buildings, greenhouses, animal con-finement facilities/livestock premises, kennels,food handling establishments, and lawns, orna-mentals, parks, recreational areas and athleticfields.When used as a termiticide, individuals/firmsmust be licensed by the state to apply termiti-cide products. States may have more restrictiverequirements regarding qualifications of per-sons using this product. Consult the pest con-trol regulatory agency of your state prior to useof this product.
Talstar® P Professional Insecticide contains 2/3 pound active ingredientper gallon.*Cis isomers 97% minimum, trans isomers 3% maximum.
For Information Regarding the Use of this Product Call 1-800-321-1FMC (1362).
FIRST AID
HOTLINE NUMBER
NOTE TO PHYSICIAN
If inhaled
If on skin orclothing
If in eyes
If swallowed
• Move person to fresh air.• If person is not breathing, call 911 or an ambulance, then
give artificial respiration, preferably by mouth-to-mouth, ifpossible.
• Call a poison control center or doctor for further treatmentadvice
• Take off contaminated clothing.• Rinse skin immediately with plenty of water for 15-20 minutes.• Call a poison control center or doctor for treatment advice.
• Hold eye open and rinse slowly and gently with water for 15-20minutes.
• Remove contact lenses, if present, after the first 5 minutes, thencontinue rinsing eye.
• Call a poison control center or doctor for treatment advice.
• Call poison control center or doctor immediately for treat-ment advice.
• Have person sip a glass of water if able to swallow.• Do not induce vomiting unless told to do so by the poison
control center or doctor.• Do not give anything by mouth to an unconscious person.
Have the product container or label with you when calling a poison control center or doc-tor, or going for treatment. You may also contact 1-(800)-331-3148 for EmergencyAssistance.
This product is a pyrethroid. If large amounts have been ingested, the stomach and intes-tine should be evacuated. Treatment is symptomatic and supportive. Digestible fats, oils,or alcohol may increase absorption and so should be avoided.
Provides up to 1 month residual control of house fliesKills fleas for up to 3 months
User Safety Recommendations:Users should:• Wash hands before eating, drinking, chewing gum, using tobacco or
using the toilet.• Remove clothing immediately if pesticide gets inside. Then wash
thoroughly and put on clean clothing.• Remove PPE immediately after handling this product. Wash outside
of gloves before removing. As soon as possible, wash thoroughly andchange into clean clothing.

Section 8Fertility and Turfgrass Nutrition, An Organic Perspective
When we address fertility issues, it is important to look at the needs of the grass itself. Of the three major nutrients used by turfgrass, nitrogen is used in the largest amount. It is followed by potassium and then phosphorus. There are other nutrients, of course, but our primary focus is with these three. When we set nutrient budgets, we are basing them on nitrogen to be delivered in one form or another to the turfgrass system. Our nutrient analysis soil tests point out any deficiencies in the other macro nutrients or micronutrients. We then take the opportunity during the initial years of transition to balance soil chemistry with the appropriate amendments.
When a turf area is used, as opposed to just “viewed”, the turf is generally under some stress. Grass plants get damaged and often cannot reproduce at a rapid enough rate to maintain maximum turf density. The recuperative capacity of the grass plant is governed by the genetic capabilities of individual species as well as nutrient availability. For example, Kentucky bluegrass does not wear well under athletic play and is easily damaged, but it repairs itself from that injury more effectively, efficiently, and faster than the other cool season turfgrasses. We need more available nutrient, specifically nitrogen, to sustain this type of turf system as opposed to what we might need for a homeowner’s lawn. It is available nitrogen that directly stimulates growth. That is not to say that we need excessive amounts of nitrogen, but rather nitrogen delivered in an appropriate form and in a manner that will allow the capabilities of the grass to do what we need them to do. We now begin to think in terms of the concept ”less is more”. Introduction of nitrogen to a turfgrass system in organic program can be done at rates as low as .2 lb to .4 lb of actual nitrogen.
We establish nutrient budgets based on nitrogen for individual turf systems. The nutrient budget has a direct relationship to the expectations that we have for that grass. If our expectations are on the lower side, then we can satisfy that system with a lower total annual nitrogen input. If we have high use or high profile playing fields, our expectations are high, and therefore the nutrient budget needs to be set at a higher level so that that system can reproduce and maintain itself in relatively short growing seasons in the northern regions of the country.
One of the basic differences between a natural program and a conventional one is that we do not expect to get all of the nitrogen from natural, organic, granular fertilizer product alone. Nitrogen from that product is certainly important, but it is only a part of a balanced approach. We acknowledge that contributory nitrogen from compost topdressing, liquid fertilizers, compost tea, humic substances, and clippings returned to the system. Some of these products contain actual nitrogen, while others, although they contain no nitrogen, stimulate the soil system to the point that nitrogen availability through the biomass can be improved. When we use product to initially improve soil health, we are building a system that will make nitrogen readily available naturally to the
�65

grass plant in the future. It is this concept that allows us to have a healthy turf at a lower cost three or four years down the road.
In a conventional program, when primarily water-soluble nitrogen is delivered at the customary rate of one pound of nitrogen to 1000 ft.², much of that material does not make a beneficial impact on the grass. This type of fertility product works in such a way that it is readily available upon contact with moisture. The nitrogen begins to become available within 48 hours of application. Maximum nitrogen release occurs in the 7 to 10 day range. By the end of a 4 to 5 week period the nitrogen is no longer available, because it has been either used by the grass plant, or it has moved through the soil profile. This type of fertility can potentially pose negative issues for bodies of water in close proximity to the grass area or to groundwater.
Depending upon a variety of factors, much of this nitrogen can have the ability to move below the root zone and potentially become a problem. University research has produced trials that indicate that almost all of the nitrogen applied in this manner is used by the grass and poses no adverse threat. It is important to remember that in this work, we are generally looking at a relatively perfect turf system that exhibits maximum turf density with little or no voids in the surface area. The fact is that in the real world those perfect conditions do not always exist and a turf system with less than 100% turf density will not process all of the nitrogen in the same way the research plots did. This is especially true when we have regular irrigation or heavy rains after an application. Because all of the nitrogen may not be used by the grass plant from this conventional material, we can have problems. There are different ways that the nitrogen can leave this system including leaching below the root zone, runoff, and volatilization. As this material leeches, it can become a groundwater contaminant as well as runoff into fresh or salt water bodies. In many regions of the country there are restrictions being placed on this type of fertility for the reasons mentioned above.
Natural, organic fertilizers can be either granular or liquid. Granular fertility product Is generally a source of nitrogen that is water insoluble. The liquid fertilizers can be water-soluble, but not in the same sense as synthetic fertilizers. The nitrogen is from protein. Nitrogen is a building block of proteins and amino acids. Along with nitrogen, these fertilizers can deliver enzymes, amino acids, and proteins to the grass plant. With organic fertilizers, the nitrogen reaches its target goal, the grass plant. They are not soluble in the same way as their synthetic counterparts because moisture has very little to do with the actual release of nitrogen to the plant. It is the natural process of mineralization that makes nitrogen available. Nitrogen can be delivered in an organic form, but we must realize that the plant can only process it in the inorganic form. It is this process of mineralization that makes that conversion first to ammonium nitrogen and then secondarily to nitrate nitrogen.
The difference between natural, organic fertilizers and conventional or synthetic fertilizers is simple. Synthetic fertilizer is inorganic. It is manufactured during a chemical process that produces a highly water soluble fertilizer. Anhydrous ammonia is reacted under great pressure and high temperatures. Urea is formed. It takes five ton of
�66

petroleum to produce one ton of urea. It breaks down on contact with soil moisture and is taken up by the grass plant very rapidly. This is why you see a quick green up or burst of growth with these products. There is a way to coat or encapsulate the fertilizer to delay the breakdown. Urea can also be secondarily reacted with formaldehyde to produce a ureaformaldehyde or methylene urea product. This material is synthetic slow release and needs microbial action to break it down. Generally speaking with urea, it is taken up rapidly, works quickly, and then leaves the root zone. There are also synthetic forms of nitrogen fertilizer in the ammonium family. This process is directly feeding the grass plant. Most synthetic fertilizer programs call for numerous applications annually.
Natural, organic fertilizer products work in a completely different way. Nature has put in place a system that makes nutrients available to the grass plant. A good example of this is a mature forest. No one fertilizes a forest, yet plant material grows and is healthy and adequately nourished. Other plant material functions in basically the same way, but because in a turfgrass area it is a closed system, we add fertilizer or other nutrients to meet the needs of the grass in the same way that the fallen leaves meet the needs of the tree. Grass as a horticultural crop needs more nitrogen than nature can provide if we are seeking to achieve higher expectations. Grass can obtain nutrients it needs from soil organic matter, the biomass, and minerals in the soil, but not enough nitrogen can be made available to produce a high quality turf system. If our expectations are on the lower side, then we can be satisfied with nitrogen made available by nature only. Given that we are managing sports fields and public parks with a high set of expectations, it is necessary for us to provide supplemental nitrogen to drive this process.
The nitrogen in natural, organic fertilizers is in the organic form. It is important to remember that plants cannot use organic forms of nitrogen. They can only use it in the inorganic form. The two inorganic forms of nitrogen that are plant available within the soil are ammonium and nitrate. Synthetics work rapidly because laboratory derived nitrogen, in a synthetic form, is designed to mimic what the plant can actually use. Natural fertilizers supply organic nitrogen to the microbes as a food source, and then the microbes break it down and in turn release it to the plant in the inorganic form. It is in the process of mineralization where that organic nitrogen is converted to ammonium nitrogen which can be found in soil solution as well as held on to on the cation exchange sites. Bacteria in the soil then further convert the ammonium to nitrate. The nitrate is soluble, is not attracted to exchange sites, and is immediately in the soil solution. Nitrogen fixing bacteria can then further convert ammonium from the exchange sites to nitrate to meet the needs of the plant. The grass plant prefers its nitrogen in equal parts, nitrate and ammonium.
It is the microbial life in the soil that makes nutrients available to the grass plants in a natural program. If we think back to a basic biology course, we learned that a handful of soil contains billions of mostly beneficial living organisms that nature put in place for the sole purpose of growing plants. It is these organisms that in fact make the nutrients available. This is the foundation for our “feed the soil” approach as outlined in the biomass section.
�67

Nutrients in organic fertilizers can be derived from either plant, animal, or mineral sources. Nitrogen is derived from plants (grains like corn, soy, alfalfa) or animal byproducts (manure, feathers, bones, blood). It is important to note that these nutrients that make up fertilizer products, either synthetic or natural, are not plant food.
These materials are simply catalysts in the process of photosynthesis. When nitrogen is introduced to a turfgrass system the plant responds in multiple ways. One of the responses is a greening of the plant. This greening is the intensification of chlorophyll in the blades. As the grass gets greener, chlorophyll is becoming more dense. During the process of photosynthesis, chlorophyll reacts with energy from the sun in the presence of carbon dioxide and moisture. There are microscopic openings on the underside of the leaf blades called stomates. These stomates open and close at the times of the day when the air is generally the calmest; dawn and dusk. Carbon dioxide enters the grass plant through these openings and a reaction takes place between the carbon dioxide, the sun’s energy, and the chlorophyll. The end result is the production of carbohydrates and sugars. It is these carbohydrates and sugars that are plant food. These materials provide energy for the plant to grow and reproduce. Respiration is the opposite of photosynthesis, or the function that releases this stored energy that facilitates the actual growth of the plant. Our job as turf managers is to maximize the growing conditions of the grass plant that will enable it to photosynthesize at its maximum rate. As photosynthesis improves, more carbohydrate is produced for the plant.
The grass plant uses these carbohydrates for its immediate growth, stores a portion of the carbohydrates in the crown for future growth, and then the balance of the carbohydrates are exuded through the root system into the rhizosphere. These exudates provide nourishment for microbes that colonize and live in this region and help support the turfgrass plant in the soil.
Fertilizer Summary
• Synthetic and natural fertilizers work in completely different ways, but can produce similar results.
• Synthetic can be harsh to the biomass and can be counterproductive to building a healthy microbial soil population.
• Because synthetics work rapidly and organics work more slowly, we must set our expectations appropriately.
• We do have organic liquids that will produce more results in the short term and sustain it for the long term.
• The timing of the applications becomes critical. • With a granular urea we get reaction in 48 hours and then it is done in a month or so• With a granular organic that reaction will take 10 or 12 days and it lasts for 8 to 10
weeks. • The organic liquid will give us the results in about four or five days and then sustain it
for several weeks. • Because the liquids are in a soluble form, the organic nitrogen is more rapidly
processed by the biomass.
�68

With so many different fertilizers and formulations on the market, it can be confusing to determine the difference between the products. As a rule, we can get an idea about the type of fertilizer in the bag from the percentage of nitrogen in the product. The three numbers on the bag represents nitrogen, phosphorus, and potassium in that order. It is stated as a percentage of each nutrient in 100 pounds of fertilizer. The reason that nitrogen is our benchmark is because the nutrient is used in the largest amount by the turfgrass. If the nitrogen number is less than 10, the product is most likely a natural, organic product. If the number is between 11 and 16 it can be a bridge product. Bridge products are those that contain both synthetic and natural sources of nitrogen. Bridge products often contain biosolids (sewerage sludge) because it is relatively inexpensive. One must be aware that there are potential problems with this material. When the nitrogen percentage is greater than 17 or 18 (there are synthetics in the 13-16 range) the product is probably synthetic. There are certainly exceptions to these guidelines. We now have an organic fertilizer, that is a powder to be reconstituted with water, which has a nitrogen analysis of 16%. This is new technology that has broken the protein bond and allows the organic nitrogen to be more readily mineralized.
�69

Section 9Recommendations
Mason Square 10,285 ft.²F. Harris 75,000 ft.²Treetop 110,000 ft.²Sweeney 70,000 ft.²Forest 630,000 ft.²Wilder seed irrigated Wilder seed not irrigated 84,000 ft.² total bothWilder sodded 38,000 ft.²
Product inputsCorrective
Based on the soil test results the following materials are needed at some point during the first year to adjust and balance soil chemistry.
Some lime was applied during the fall of 2014, but because of the generally low pH it needs to be repeated at the properties this year with the exception of Mason Square and TreeTop.
LimeTo address low pHCalcitic lime or High cal lime ( one-fifth of calcitic rate needed)
Spring or fallCalcitic High cal
rate needed amt/lbs # bags amnt/lbs # bagslbs/1000
F. Harris 50 3750 94 750 19Sweeney 50 3500 88 700 10Forest 50 31500 788 6300 158Wilder seed irrWilder seed n irr 25 2050 50 410 10 totalWilder sod 50 1900 38 380 9Total
High Cal lime total cost $2900.00
�70

Sulfate of Potash (SOP) 0-0-52to address potassium deficiency2 lbs SOP delivers 1 lb K2O/1000
Springamt/lbs # bags cost roughly $500.00 total
Mason Square 20 ½ F. Harris 150 3TreeTop 220 5Sweeney 140 3Forest 1260 21Wilder seed irrWilder seed n irr 175 3½ total Wilder sod 75 ½ Total
PhosphorusPhosphorus deficiency at the following properties will be corrected with compost or Renaissance 4-4-4 in the fall.
F. HarrisForestWilder seed n irrWilder sod
It is not critical that these corrective measurements be taken all at once this spring. For best results of the program, they should be done during year one. The timing of the application will be as much a function of budget and labor resources as anything else.
There was some lime put down in the fall of 2014. Based on the low pH readings it is anticipated that this follow-up application will be needed on those same properties. This should be the end of any lime applications and the biomass within the system should take over and hold the pH in the desired range.
The phosphorus should take care of itself on these few properties without a separate targeted application to introduce rock phosphate.
The SOP application to elevate the low and very low potassium levels is important. It is less costly, more efficient, and change happens in the shorter term when we do a separate application to address this rather than try to raise it with fertilizer material over time. Remembering that potassium is directly involved in the stress resistance of grass, this application has some importance attached to it.
�71

Product inputsRoutine soil and fertility managementProposed program
There are two different kinds of applications for fertility management outlined below. The program that I am proposing is a combination of liquid and granular applications. The granular fertilizer addresses nutrients for the grass, particularly nitrogen. The granular organic fertilizers also introduce a valuable source of organic matter, which over time will help elevate OM levels in the soil. The material is water insoluble, which means that the microbial population breaks down the form of organic nitrogen and converts it into the inorganic forms that the plant can use.
The second portion of the fertility program is liquid applications. This will also directly address the needs of the turf grass, but secondarily, and most importantly, will address the needs of the soil. Once the soil chemistry has been balanced by the corrective applications outlined above, the biomass will be able to become strongly established and begin to carry on some of the nutritional delivery from within.
The products in this liquid portion of the program meet the needs of the grass, address the microbial community, and contribute to the establishment of good and permanent soil health. Two products outlined in the liquid program are intended to be used only during the transition. They are materials that contain microbial inoculants to help us build and establish the biomass. The strategy is to introduce them during the first year or two, allow them to take hold and become established by supporting them with food resources, and then taking advantage of their work as they become a permanent part of the system. The application of these materials then drops off and we experience a cost reduction.
Granular fertilizer applicationRenaissance 8-0-1 applied at a rate of ¾ lb N/10009.5 lbs fertilizer/1000 413 lbs/acCost $206.00/ac per applicationmid April and mid to late August
amount/lbs # bags cost
Mason Square 100 2F. Harris 700 14 TreeTop 1050 21Sweeney 650 13Forest 6000 120Wilder seed irr Wilder seed n irr 800 16 total bothWilder sod 350 7Total 193
�72

1 application 23 acres $4738.002 applications $9476.00
Liquid fertilizer application
300 gallon spray tank2 gallons/acre deliveryeach tankful covers 3.4 acres
12-0-0 N (amino acid) dry wt 4 oz/1000 11 lbs/acHumic acid dry wt ½ oz/1000 1.4 lb/acKelp dry wt ⅓ oz/1000 1 lb/acMolasses 1 oz/5000 9 oz/acBeneficial MicroOrganisms dry wt 2 oz/1000 5.5 lbs/acMicorrhizae dry wt ½ oz/1000 1.4 lb/acSea minerals FA dry wt ¾ oz/1000 2 lbs/ac
1 tankful3.4 acre coverage based on 2 gallons finished solution/1000Finished solution with microorganisms
Water 300 gal12-0-0 N 35 lbs $6.40/lb $ 225.00Humic acid 5 lbs $5.00/lb $ 25.00Kelp 3.5 lbs $9.00/lb $ 31.50Molasses 1 qt $5.00 $ 5.00BeneficialMicro 20 lbs $24.00/lb $ 480.00 **Mycorrhizae 5 lbs $20.00/lb $ 100.00 **Sea Minerals 7 lbs $2.80/lb $ 20.00Total $ 886.50 3.4 acres
$ 260.00 1.0 acre
1 application 23 acres @ $260.00/ac $ 5980.00 2 applications 23acres $11960.00
**year 1 and 2 only
�73

1 tankful3.4 acre coverage based on 2 gallons finished solution/1000Finished solution without microorganisms
Water 300 gal12-0-0 N 35 lbs $6.40/lb $ 225.00Humic acid 5 lbs $5.00/lb $ 25.00Kelp 3.5 lbs $9.00/lb $ 31.50Molasses 1 qt $5.00 $ 5.00Sea Minerals 7 lbs $2.80/lb $ 20.00Total $ 306.50 3.4 acres
$ 90.00 1.0 acre
1 application 23 acres @ $90.00/ac $2070.00
The materials in the liquid application will address both the short-term needs of the grass as well as the long-term health and quality of the soil. Materials have been chosen that do both simultaneously. The liquid combinations above have been put together in response to both the nutrient and biological soil tests. Individually the inputs are low dose, but together the cumulative response is significant. I am proposing two applications with microorganisms and one without for year one.
Projected costs fertility total total
Product cost unit cost w/frt needed cost
12-0-0 N $320.00/50 lb $6.40 lb 775 lbs $ 4960.00Humic acid $245.00/55 lb $5.00 lb 100 lbs $ 500.00Kelp $365.00/44 lb $9.00 lb 70 lbs $ 630.00Molasses $20.00/gal $20.00 gal 5 gal $ 120.00Beneficial Micro $450.00/20 lb $22.50 lb 250 lbs $ 5625.00 Mycorrhizae $95.00/3 lb $32.00 lb 63 lbs $ 2016.00Sea Minerals $140.00/ 50 lb $2.80 lb 135 lbs $ 378.008-0-1 $1000.00/pallet $25.00/50 lb 9.75 pal $ 9750.00
Year 1Total cost fertility and soil building 23 acres $23979.00
1 acre $ 1043.00Year 2 projectedTotal cost fertility and soil building 23 $15640.00
1 acre $ 698.00
Year 3 projectedTotal cost fertility and soil building 22.4 acres $12540.00
1 acre $ 560.00
�74

2015 Proposed Program
Fertility
Round 1 mid April Granular fertilizer application¾ lb N 8-0-1 @ 9.4 lbs/ 1000 ft.²
Round 2 late May 12-0-0 N 4 oz/1000 11 lbs/ac½ lb N Humic acid dry wt ½ oz/1000 1.4 lb/ac
Kelp dry wt ⅓ oz/1000 1 lb/acMolasses 1 oz/5000 9 oz/acBeneficial Micro 2 oz/1000 5.5 lbs/acMycorrhizae ½ oz/1000 1.4 lb/acSea minerals FA ¾ oz/1000 2 lbs/ac
Round 3 early July 12-0-0 N 4 oz/1000 11 lbs/ac½ lb N Humic acid dry wt ½ oz/1000 1.4 lb/ac
Kelp dry wt ⅓ oz/1000 1 lb/acMolasses 1 oz/5000 9 oz/acBeneficial Micro 2 oz/1000 5.5 lbs/acMycorrhizae ½ oz/1000 1.4 lb/acSea minerals FA ¾ oz/1000 2 lbs/ac
Round 4 mid-late August Granular fertilizer application¾ lb N 8-0-1 @ 9.4 lbs/ 1000 ft.²
Round 5 late September 12-0-0 N 4 oz/1000 11 lbs/ac½ lb N Humic acid dry wt ½ oz/1000 1.4 lb/ac
Kelp dry wt ⅓ oz/1000 1 lb/acMolasses 1 oz/5000 9 oz/acSea minerals FA ¾ oz/1000 2 lbs/ac
Total N 3 lbs/1000 ft.²
�75

Cost by Property
area acreageMason Square 10,285 ft.² .24F. Harris 75,000 ft.² 1.72 Treetop 110,000 ft.² 2.53Sweeney 70,000 ft.² 1.61Forest 630,000 ft.² 14.46Wilder seed irr Wilder seed not irr 84,000 ft.² total both 1.93Wilder sodded 38,000 ft.² .87
Total area 23 acres
Rounds 1 2 3 4 5 total
Mason Square $ 50 $ 62 $ 62 $ 22 $ 50 $ 246F. Harris $ 355 $ 447 $ 447 $ 155 $ 355 $ 1759Treetop $ 521 $ 658 $ 658 $ 228 $ 521 $ 2586 Sweeney $ 332 $ 419 $ 419 $ 145 $332 $ 1647 Forest $2979 $3758 $3758 $1301 $2979 $14775 ** Wilder seed irr Wilder seed not irr $ 398 $ 502 $ 502 $ 174 $ 398 $ 1974Wilder sodded $ 179 $ 226 $ 226 $ 78 $ 179 $ 888
**Forest has been included at the total acreage. A strategy to reduce cost may be to create 3 areas of management intensity for the property based on use and manage inputs accordingly.
�76

Overseeding
April bare/thin areas Perennial ryegrass 8 lbs/1000 350 lbs/acreJune 15-20 general 70/30 Blue/Rye 6 lbs/1000 275 lbs/acre
Bare and thin square footage to be determined for Perennial ryegrass
70% Kentucky bluegrass 30% Perennial ryegrass 6 lbs/1000
Mason Square 10,285 ft.² 60 lbsF. Harris 75,000 ft.² 450 lbsTreeTop 110,000 ft.² 660 lbsSweeney 70,000 ft.² 420 lbsForest 631,000 ft.² 3780 lbs ** not entire areaWilder seed irr 20,000 ft.² 120 lbsWilder seed not irr 20,000 ft.² 120 lbsWilder sod 38,000 ft.² 225 lbs
5835 lbsWe can discuss this approach and compare to what you have done in the past. This will be a function of budget.
Compost topdressing
Mason Square 10,285 ft.² 5 yd.³ F. Harris 75,000 ft.² 38 yd.³ Sweeney 70,000 ft.² 35 yd.³ Forest 631,000 ft.² heavy wear areas TBDWilder seed irr Wilder seed not irr 84,000 ft.² 42 yd.³ Wilder sod 38,000 ft.² 19 yd.³
The goal will be to use Springfield material. This portion of the program can be implemented at any time during the growing season this year or next year. It is not critical that it be addressed immediately.
Finesse GVH
This is a material that was developed for use when traditional compost is not always possible. It is a granulated vermicompost (worm castings) with a humate additive. It can be applied through a traditional spreader, is used at rates of 10 to 15 lbs/ 1000, and is cost effective.
�77

Program notes and summary
The program and inputs outlined above should be looked at as a suggested starting approach. Implementation will be a function of budget and labor resources.
One of the pieces of information that I do not have is the available budget for the program. The approach in the recent past has been at a basic level with synthetic materials. As outlined earlier in the report, we are now looking at transitioning from those practices into a more sustainable approach which involves some things up front that get reduced over time.
It will be ongoing discussion to determine implementation strategies and time frames. There are certain things that need to be done that carry a greater weight of importance than others. If something does need to be reduced in order to become affordable within the operating budget there are certain areas that can be looked at and others that should not be altered. One of these areas is the cultural practice of aeration.
We can design the best organic program from the input side, but if it is a playing field and we are not supporting the inputs with aggressive aeration, we will not expect to experience the highest level of success. Compaction levels are relative to use. As use increases on a turf surface so does compaction. We try to schedule aeration to relieve this on an ongoing basis, particularly at certain times during the growing season.
LaborIn-house or out-sourced
We will need to have the discussion about the labor portion of the program. One decision will be whether to purchase a sprayer to deliver the liquid or whether to outsource that application. There are advantages to both. If there is an interest in outsourcing, we should look at an IFB for labor only. Springfield would purchase all materials and the contractor would use those materials and provide the labor. This can be a very practical and economical way to handle these types of applications.
�78

As a general guidelines to begin to budget labor resources in-house applications the following generally holds true. An exact price can only be determined by the current pay scale in Springfield. For this exercise we are using a figure of $20.00/hour. This should be considered a rough price in that I have not included payroll taxes and benefits.
Process time/acre wage cost/acre
Aeration 4 hrs $20.00 $80.00Granular fertilization 1 hr $20.00 $20.00Liquid fertilization 4 hrs $20.00 $80.00 incl mixingSeeding, mechanical 4 hrs $20.00 $80.00Seeding, broadcast 1 hr $20.00 $20.00
Section 10Cultural Practices
Irrigation
When we talk about irrigation, it is first important to understand the concept of field capacity. Field capacity is a measure of the amount of moisture that any soil can hold. As previously discussed, the generally accepted composition of the soil is 45% mineral content, 5% organic matter content on average, 25% air and 25% moisture. This means that a handful of soil contains 50% solid matter and 50% air. One half of the airspace is generally occupied by soil moisture.
This airspace is referred to as pore space. Every soil particle, from the microscopic sheets of clay to the largest grains of sand should be surrounded on all sides by pockets of air. This is a function of good soil aggregation as well as our management practices. Not only does the pore space create a loose friable soil environment which allows for good root growth and penetration, it also contributes to the creation of an aerobic soil profile. An aerobic environment is one which contains oxygen. Oxygen is critically important to the growth of the turfgrass as well as to the survival and proliferation of the microbial community. If a soil becomes over watered or waterlogged, or extremely compacted, we will begin to have problems. Airspace is lost, oxygen decreases, and the biomass and turfgrass plants begin to suffer. If either waterlogged soils or compacted soils persist for any amount of time, the grass plant can decline to the point of no return.
Field capacity is determined in the following way. We will make the assumption that a dry soil is 50% airspace. After an irrigation or heavy rain event, all of the pore space fills
�79

with water. Over a period of time, which is a reflection of individual soils and permeability, the water drains from the soil and the root zone. When freestanding water is gone, what remains is a combination of air and moisture. With a soil textural classification of a loam, field capacity is generally at 25%. This means we have one half of the pore space occupied by water. As clay percentages in the soil increase, field capacity increases. As clay percentages decrease and sand increases, field capacity decreases. This is one of the reasons that we have performed the soil textural analysis. Those individual percentages of sand, silt, and clay can guide us to a better understanding of the potential of any individual soil to hold moisture.
The best way to irrigate turfgrass is to provide enough water at each irrigation so that moisture penetrates and does not remain near the surface. Deep thorough irrigations are far more preferable than shallow irrigations. Irrigation schedules are generally changed at different times of the season. During the spring and fall we generally need less moisture than we do during the middle of the summer. During hot summer months frequency can be increased so that the system remains moist and as cool as possible on hot days.
There is also an irrigation method referred to as syringing. This is a process where short duration, shallow irrigation is provided during the high heat times on a summer day for the purpose of cooling the top 2 inches of soil and keeping some moisture readily available. This practice is generally reserved for extreme conditions during the summer when we are trying to maintain steady growth on an athletic field. We are not trying to keep the system overly stimulated with moisture, but rather to keep it actively growing.
Cool season turfgrasses do not possess the genetics to photosynthesize efficiently in hot weather. For a homeowner’s lawn or passive parkland, we can allow the grass to take itself into dormancy as a means of self protection. In this situation, as soon as cooler temperatures return and moisture is made available, the grass returns to its normal green color. In the case of an athletic field, we need this time during the summer months to improve and increase turf density. The spring playing season generally causes wear and tear damage on an athletic field, and it is our job as turf managers to improve that turf density prior to the beginning of the fall playing season. Midsummer becomes critically important as a growing time. It is not to our advantage to allow a sports field to take itself into dormancy at this time of year.
Cultivation
In turfgrass management the cultural practice of cultivation is referred to as aerification or aeration. In many cases this can be a practice that takes a backseat to the product side inputs in a conventional program. The absence of aggressive aeration, may in some cases, try to be offset by increased synthetic product use. Weeds that emerge as a result of compacted soils can be mitigated with the use of herbicides, and fast acting soluble fertilizers can provide a short term stimulus to the grass plant. Neither the fertilizer application nor the herbicide treatment will have any lasting effect as long as
�80

the soil remains compacted. It is this shortcut in turfgrass management that ultimately can cause bigger problems.
Compaction is the biggest enemy of turfgrass. As mentioned previously, all soil particles, both mineral and organic, should be surrounded on all sides by airspace. This pore space is critical in order to keep the soil environment aerobic and to provide a loose, friable medium for the root system of the grass plant to penetrate. Compaction is the result of continued or prolonged downward pressure on the surface of the soil. This can be the result of athletic play, heavy pedestrian pressure, heavy rain, regular irrigation, or mowing and other turf management equipment. As a result of this pressure, particle touches particle as pore space becomes eliminated. With the loss of pore space, we no longer have a situation where each particle has air around it and the soil becomes dense and anaerobic.
Compaction favors weeds and discourages the growth of healthy grass. Turf grass roots, as well as soil microbiology, are entirely dependent upon an aerobic soil environment. Aerobic soils are those soils with a reasonable amount of oxygen available. When soils become overly compacted, gas exchange with the atmosphere is severely reduced. Carbon dioxide cannot leave the soil environment and oxygen can not penetrate the surface of the soil. In cool season turfgrass systems there are certain weeds that we refer to as indicator weeds of compaction. They are broadleaf plantation, pineapple weed, and knotweed,among others. These weeds possess genetics and root systems that allow them to adapt and proliferate in compacted soils. Generally speaking the root systems are short, thick, and clubby. They only need to penetrate and inch or two into the soil. They do not need to have the same aerobic soil environment that grass plants do. They survive very well in anaerobic conditions. Grass plants, on the other hand, possess very different genetics. They have long, fibrous root systems that should penetrate deep into the soil. They will not survive for any length of time in anaerobic soil conditions. Grass is dependent upon oxygen in the root zone.
The textural analysis that we performed as part of our diagnosis gives us some insight into the tendency of the soil to become compacted. Bulk density is a term used as an indicator of soil compaction. It is calculated as the dry weight of the soil divided by its volume. This volume includes the volume of soil particles and the volume of pores among the soil particles. Bulk density is typically expressed as grams per cubic centimeters. Bulk density is dependent on soil texture and the densities of the mineral portion of the soil (sands, silt, and clay) and organic matter particles, as well as their packing arrangement. Generally speaking, a medium textured soil with roughly 50% pore space should have a bulk density of about one half of the density of rock. Loose, porous soils and those that are high in organic matter content have lower bulk density. Sandy soils have relatively high bulk density because total pore space in sands is less than that of silt or clay soils. The finer textured soils, such as silt and clay loams, that have good structure have higher pore space and lower bulk density compared to sandy soils. As aggregation and organic matter content decrease, bulk density will increase. Any practice that improves soil structure decreases bulk density. The result can be
�81

either permanent or temporary. With an athletic field we need to understand that aeration is temporary and needs to be done on a regular basis.
Over seeding
Turf density is a term that describes the number of grass plants growing in one square foot of field area. When a turf system is close to maximum turf density, weeds can begin to be suppressed. Weeds become an issue when turf density is less than optimum. This reflects a situation that exhibits bare spots and thin or worn areas throughout the turf system. Weeds are opportunistic and will move in if grass does not occupy those sites. Regular over seeding, combined with aeration, on an annual basis is the most effective strategy for keeping weed populations down in an organic system. Many broadleaf weeds can be outcompeted by thick, healthy, turf. Minimal turf density is an invitation for crabgrass and other weed pressures. A bare spot the size of a silver dollar can potentially become a crabgrass issue. Weeds are opportunistic and move into areas where grass cannot thrive. On a sports field grass gets damaged regularly by routine use. The damage is the result of athletic play, or in the case of a non-sports area, by heavy use. If we do not take steps to restore turf cover, weeds will become an issue. We need to remember that grass seed alone is not always the answer. It is an aggressive over seeding program, that when combined with aeration, will produce the desired results. If we have a very compacted soil, we can overseed and probably get some germination, but we will never get the development of a secondary root system that will make that grass a permanent part of the system.
Over seeding is a critical part of a successful natural program. Site use and seasonal considerations should always be part of the decision-making process when we overseed. Maintaining genetic diversity of cool season grasses in a sports field is important. For the most part, we try to avoid monocultures of one particular specie. As we broaden the genetic base with different grass species, we are taking a proactive approach to potentially minimizing negative impacts of insect and disease pressures.
We can take advantage of species and cultivars that contain natural endophytes. An endophyte is a naturally occurring beneficial fungal organism that forms a symbiotic relationship with the grass plant. The fungus gives the grass plant alkaloids and other chemicals that give it the capability to resist surface grazing insects. There is also a measure of disease resistance imparted to the grass plant. In turn, the grass plant gives some of its carbohydrates that were produced during the process of photosynthesis to the fungus for its survival. Most newer cultivars of Perennial ryegrass and Fescue contain a natural endophyte infection. Breeding work has also focused on improving that infection. Kentucky bluegrass, at the present time, has no ability to form this relationship.
�82

Section 11C3 Grasses
The cool season grasses are referred to as C3. This means that they begin the process of photosynthesis with a three carbon compound. Warm season grasses on the other hand, begin photosynthesis with a four carbon compound. What this means is that in the cool season regions of the country, the grass plant does not photosynthesize efficiently in hot weather. Photosynthesis was addressed earlier, but as a refresher in this section, the process is as follows. Chlorophyll in the grass blade reacts with energy from the sun in the presence of carbon dioxide and moisture and carbohydrates and sugars are produced with in the grass plant. These carbohydrates and sugars are the plant food that sustains the plant during its period of immediate growth and some is also held in reserve to sustain the plant during periods of hot weather. As temperatures move outside of the plant’s desired range, photosynthesis slows down and eventually stops. This stopping is what we know as summer dormancy. As temperatures increase, and photosynthesis slows, the grass plant is using more carbohydrates than it is producing. We have to be careful at these times. If we over stimulate with nitrogen during this slowdown, we can potentially create a bigger problem.
The ideal temperature range for cool season grasses follows these guidelines. Soil temperature is between 55°F and 65°F and air temperature is 65°F and 75°F. The grass plant slows its growth when temperatures go below or above these desired ranges. As temperatures move below 35°F or above 90°F, active growth becomes minimal.
C3 Turfgrass Timeline
Early to mid springAt this time we begin to see early root activity. As soil temperatures warm root growth becomes evident.
Late springWe begin to see rapid shoot growth and moderate root growth. The genetics of the grass plant are such that during the spring we have greater blade growth than we do growth of the root system. At this time of the year the grass plant is in a period of high carbohydrate use.
SummerAs temperatures increase, shoot growth begins to slow down. Root growth begins to slow down. At this time of the year grass plants are most susceptible to insect and disease damage as well as damage from heavy traffic. The plants cannot rejuvenate themselves efficiently. High heat uses up stored carbohydrates and the plant is not able to efficiently make more. At this point in the season a higher cut and a deep root system is critically important to help the plant get through this stressful period.
�83
Late-summerShoot and root growth resume. This is the best time of the year to seed and repair. In an athletic field situation this may not be the optimum time. We have to move earlier in the season in order to get the grass established in time for fall athletic play. This means that late spring and summer seedings become important. To some degree we are breaking the rules by seeding at these times, but it has to be done. This is also the period of the year when we begin to pre-condition the turf system for the winter. Winter conditioning does not happen in October or November, but rather much earlier in the season.
Early to mid fallShoot growth slows and roots return to active growth. It is during this time in the season when the most aggressive root growth takes place. It is the development of the thick, deep, penetrating root system during the fall that gives the turf system strength as it emerges from dormancy the following spring.
Late fallRoots are still actively growing. As the system is moving towards winter dormancy, it is important that we are careful of any use because we can experience damage to the crown of the plant. This is a problem with late-season athletic play during extreme cold or excessively rainy weather. Under these conditions, the crowns of the grass plants can be damaged, and there is not enough time left in the growing season for those plants to recover. Heavy use on an athletic field when it is excessively wet during late fall can cause damage from which it takes up to a month to recover. Because we are in late season, there is no time for this recovery to take place. The grass plant then goes into winter dormancy in a damaged condition. When temperatures warm during the following spring, the grass has yet to recover from the previous season’s damage and we can now potentially have a problem. It is this repeated pattern, year after year, that can cause the decline in the playing surface.
Turfgrass selection
In a natural program turfgrass selection is critically important. We need to choose the right species for the right application. There are several critical factors that need to be taken into account. They are water, light, temperature, soils and fertility, timing, and management. If we try to establish or grow grass for high use or high traffic areas and these criteria are not met, we will face potential problems. It is important to choose the right turfgrass genetics for an individual application. All grasses are not created equal.
These definitions apply to the following discussion of grasses.Specie genetic groupingCultivar a specific hybrid created by breedingGrass seed mixture a combination of different speciesGrass seed blend a combination of different cultivars of the same specie
�84

The cool season turfgrasses with which we are primarily concerned are:Kentucky bluegrassPerennial ryegrass Tall fescue (specifically Turf Type Tall Fescue)Fine fescue
Kentucky bluegrass Poa pratensis
High quality turf, lawns and sports fieldsMixes well with other grassesSpreads by rhizomesGood tillering capabilityGood turf densityFair wear toleranceGood recuperative capacity, repairs well from injurySlow to germinate and establish, 21 days to germinate; three to four weeks to establishGood cold toleranceModerate heat tolerancePoor shade toleranceCan be susceptible to insects and diseasesThatch former formerPrefers pH of 6.5 to 7.0Moderate to high fertility requiredWater is critical for high quality and performanceNot a low maintenance grassMows wellThe degree of cultural intensity and management required to meet high expectations is substantially more than the other cool season grasses
Perennial ryegrassLolium perene
Used for lawns, sports fields, fairways, and parksGood when mixed with other grasses, rarely used as a stand alone grassBunch type grass that reproduces by tilleringQuick to germinate and establish, 7 to 10 days to germinate and two weeks to establishExcellent wear tolerance, tough and durablePoor recuperative capacitiesCan be sensitive to prolonged ice and snow cover and excessive coldModerate drought tolerancePoor shade toleranceSome insect resistance
�85

Generally use low percentages in initial seedings because this is usually the grass of choice for over seeding at a later datePrefers pH of 6.3 to 7.0Moderate water and fertility required
Tall fescueFestuca arundinacae
Course bladed grassNew breeding has produced TTTF (Turf Type Tall Fescue)Utility turf, sports fields, lawnsBunch type grass that reproduces by tilleringRelatively quick to germinate and establish, 12 to 14 days to germinate; two weeks to establishExcellent wear tolerance, tough and durablePoor recuperative capacityPoor cold toleranceGood heat and drought toleranceSome cultivars have insect resistanceFair to good in the shade, does well in a wide range of environmental conditionsSome disease susceptibility in warm weatherTends to be a clump forming grassGenerally not used as a standalone grass in higher end situations, usually mixed with Kentucky bluegrass which reproduces by rhizomes that knit the system togetherThe old tall fescues are not good for sports fields, TTTF onlyPrefers pH of 6.0 to 7.0Moderate fertility and moistureFine fescueFestuca spp.
Creeping red, Chewing’s, hardSheep fescue not for lawnsUsed for lawns and low use areas, never used for sports turf or high use public areasBunch type grass that reproduces with tillersCreeping red fescue is slightly rhizomatousVery shade tolerant, especially Creeping red fescueDrought tolerantGood choice for dry and shady areasTolerant of low fertilizer and low pH (5.5 to 6.5)Will not perform well in wet soilsIntolerant of wearPoor recuperative capacity
�86

When we choose grass seed for sports turf or public parks, we need to consider all of the factors listed above. Each of these grasses possesses a different genetic base that allows it to perform to meet our expectations. There is no question that Kentucky bluegrass is the cadillac of sports turfgrasses, but we must realize that the degree of cultural intensity required to maintain that system is higher than that of other grasses. It becomes a matter of choosing the right plant for the right place and the right application. Kentucky bluegrass certainly provides a very good playing surface, but it also has its limitations. Because of the long time between seeding and establishment, a reliance on Kentucky bluegrass as the primary over seeding grass can have some drawbacks. There are times of the year when we might consider over seeding with a high percentage of Perennial ryegrass and then switch seed mixtures at other times.
Whenever over seeding can be combined with a topdress application and/or an aeration, both the germination and establishment phases improve. These cultural practices should be combined whenever possible.
In the cool season regions of the country effective seeding windows are as follows:
April Seed to fill bare spots and worn areas from the previous fall before spring weeds move in and begin to get established. Seed germination will not take place until soil temperatures exceed 50°F. Because Kentucky bluegrass takes three weeks to germinate and 3 to 4 weeks to establish, it is not the best choice of seed at this time of year and for this purpose. By the time the Kentucky bluegrass has grown to the point of its first mowing, weeds will generally become established in those thin or bare areas. At this time of year, the best choice for a seed mixture is one that is high in Perennial ryegrass. Based on the descriptions above, we note that ryegrass will germinate and establish much faster than the other grasses. It is to our advantage to get grass growing and filling in the bare spots before weeds begin to grow.
Mid-JuneWith heavy use sports turf, there is a window at this time of the year when we generally have a lower level of activity on the field. This is a time of year when school and youth sports are winding down for the spring season, and there is a short window before summer camps and general summer use begins. On an irrigated field, this is a very valuable over seeding window. At this time, we introduce higher percentages of Kentucky bluegrass. It still would not be to our advantage to seed with a monoculture of Kentucky bluegrass but rather a mixture that would include a small percentage of Perennial ryegrass; around 30%.
Late August - Early SeptemberThe best general over seeding window of the year. Even though athletic play and use is happening, it is still to our advantage to seed at this time of the year. The genetics of the grasses, and turfgrass science, point to late summer and early fall as the best time to seed. Again remember that Kentucky bluegrass will have a seven week window to
�87

establishment, which will put us in mid to late October, depending upon the time of seeding. Seed selection should be made with that in mind.
During any of these over seedings windows, the height of the grass should be in the 2 inch range. We need to get sunlight on the seed for good germination. We are always careful of reducing the height of cut too much in the spring, because we do not want to allow weeds to get a foothold. Keep in mind that spring equals top growth and fall equals root growth. When we reduce the height of cut to 2 inches, give or take, we stimulate the plant to reproduce itself. Growth of the grass blade is referred to as vertical extension, and the reproduction of the grass plant by the production of either tillers or rhizomes, is referred to as horizontal extension. The grass plant depends on a certain surface area of blade to be exposed to the sun for the process of photosynthesis. As blade tissue is removed, the plant then adds tissue mass by horizontal extension. It is this thickening of the turf system that is our ultimate goal. Because we are not using pre-or post emergence herbicides in a natural program, we have to approach this carefully. Keeping the grass at 2 inches for any prolonged period can result in opportunistic weeds moving into the system. It becomes a balance of mowing height to get good germination, good establishment, and ongoing weed suppression.
Mowing
Turfgrass science establishes that the optimum mowing height for cool season grasses is 3 inches. This is the height that the grass can grow stress-free. This is not always possible on playing fields, but certainly can be accommodated in park areas. Ball roll is the technical term that describes height of cut on an athletic surface. Generally speaking, the smaller the ball, the shorter the grass. The degree of cultural intensity required to maintain a turf system to meet expectations dramatically increases as the grass becomes shorter. It costs more money per square foot to maintain a field at 1.5 inches than it does at 2.5 inches.
For general purpose turf we should be looking at mowing heights in the 3 inch range overall. The principle behind this mowing height is that there is more blade surface exposed to the sun and photosynthesis takes place more efficiently and to a greater degree. The cool season grasses are not efficient photosynthesizers as previously discussed. As photosynthesis increases, more carbohydrates are produced and the grass gets stronger and healthier with substantially more food resources and energy reserves. There is also a greater amount of exudates entering the rhizosphere to nourish the biomass. There are very specific beneficial organisms that colonize the root system of the grass plants looking for these exudates. For every inch that we increase mowing height, we get a corresponding increase in carbohydrate production.
�88

Effects of Leaf Area and Photosynthesis CapacityRoberts 1992
Clippings should generally be left on the turf. If the proper practice of removing one third of the blade at each cutting is followed, the fear of an unsightly turf area is not realized. There are a few cutting weeks in the spring when removal might be an option if shoot growth is rapid. In the public sector, there is rarely time and manpower available to bag and remove clippings to a landfill or composting area. Recycling grass clippings is the standard practice in the municipal sector.
Every municipality has its own guidelines on mowing practices and those mowing heights that are preferred. Most municipal turf that is used for non-athletic purposes is cut at 3 inches. When we talk about sports turf, there is a greater variability in the preferred mowing height. Some coaches would like all grass cut to 1.5 inches all of the time, but that is not really practical in the public sector. A 1.5 inch mowing height would require cutting every 72 hours to maintain the one third rule. As a general rule, baseball infields are mown at 2 inches, baseball outfields at 2.5 inches, soccer and football fields at 2.5 inches, and field hockey at 1.75 inches plus or minus.
If we have the ability to allow the blades to grow to 3 inches plus during the high heat of the summer, that is to our advantage. This slightly higher mowing height helps to cool that soil surface, and ultimately the root zone. In some cases this is possible and in others it is not.
Section 12Inputs and Products
Conventional vs Organic from a Regulatory Perspective
Conventional materials used in turfgrass management may or may not be approved or tested by a regulating body. Pesticides, the umbrella term for those control products used in turfgrass management, are regulated by the US Environmental Protection Agency. The EPA registers products as opposed to active ingredients. Any testing that is done on pesticide products as part of the process that brings them to market, is generally done by the chemical manufacturer. The testing is not done by the EPA or
Mowing Height 1” 2” 3”
Relative Change %Photosynthesis
1 240 5,760
�89

independent third-party laboratories. The EPA takes the manufacturer’s data and looks at it within the framework of risk assessment.
The basic premise is that pesticides are poisons and have some degree of harm or danger associated with them. Risk assessment is the framework within which these pesticides are classified. Risk assessment looks at risk versus benefit. The benefit can be economic or aesthetic, depending upon the crop being treated. The risk is the exposure to the human population or the environment. Risk assessment looks at the levels of exposure that appear to be acceptable. In other words, how much exposure can the human population take from a particular product before harm outweighs benefit. The same framework is applied to the environment.
Pesticides, under the model of risk assessment, are looked at for both acute oral or dermal toxicity. This is a basis that looks at the negative effects that high doses of these materials will have on laboratory animals, and then those values are extrapolated to the human population. There is no framework within risk assessment that looks at repeated low dose exposures at this time. Current science and medical research strongly indicates that many of the products that the EPA has found to be minimal risk at high dose have now been found to be high risk at low doses, especially for children. Because a product carries an EPA registration number, there can be no assumption of safety across the board within the human population. In fact, it is a violation of FIFRA ( Federal Insecticide, Fungicide, Rodenticide Act) to say that any EPA registered pesticide is safe when used as directed.
Synthetic fertilizers are not subject to these same regulations. Synthetic fertilizers are not registered by the EPA. There is no governing body that looks at and regulates synthetic fertilizers for their potential negative effects to human health or the environment. The information that we have for synthetic fertilizers comes from the manufacturer or from research at universities around the country. It is important to note that this research is funded by this fertilizer industry. This work is primarily devoted to the efficacy of these products.
Within the organic community, we have products and suppliers that produce material for organic programs. Many of these materials have a certification from OMRI ( Organic Materials Review Institute). This certification means that these materials have passed through a rigorous series of tests to determine that they are natural or organic in origin with little or no synthetic intervention, in most cases.
OMRI was founded in 1997. It provides organic certifiers, growers, manufacturers, and suppliers an independent review of products intended for use in certified organic production, handling, and processing. OMRI is a 501(c)3 nonprofit organization. When companies apply, OMRI reviews their products against the National Organic Standards. Acceptable products are reviewed and listed and appear on the OMRI products list. OMRI also provides subscribers and certifiers guidance on the acceptability of various material inputs in general under the National Organic Program. A company that produces or manufacturers an organic product pays a fee to have OMRI assess and
�90

analyze that product and certify it for use in organic food production. Although OMRI certification is not required for product use in land management, many of us choose to use OMRI product whenever applicable or available.
There is certainly a large amount of legitimate organic product that is used in organic land management that has not yet received OMRI certification. OMRI certification is not necessarily a limitation to product use. As much as possible, product choice on this project will be OMRI approved material.
Any material inputs chosen to meet the needs of turfgrass fertility or the building of healthy soils will be carefully chosen with an overriding concern for public health and safety. As much is possible, all materials will be approved by OMRI (Organic Materials Review Institute). OMRI certification is nationally recognized as the benchmark for organic materials. The National Organic Program (NOP) uses OMRI certification as a criteria for inclusion of materials into certified organic agriculture. There may be some products that have not gone through this product certification, but possess all of the qualities of certified material. Any material chosen that falls into this category will be documented.
�91

�92
Soil and Plant Tissue Testing LaboratoryWest Experiment Station
682 North Pleasant Street
University of Massachusetts
Amherst, MA 01003
Phone: (413) 545-2311
e-mail: [email protected]
website: soiltest.umass.edu
Prepared For:
413-426-0106
Sample Information:Sample ID: Bondi
Lab Number: C140819-103
Received: 8/19/2014
Reported: 9/2/2014
Edward BruntonSpringfield Parks Department200 Trafton RdSpringfield, MA 01119
Order Number: 9569
Compost - Comprehensive
Analysis Weight BasisDry
Weight BasisMoist (as received)
Volume BasisMoist (as received) Results
7.56pH1.21Soluble Salts mmhos/cm
Bulk Density 1621 lbs/cub ydPercent Solids 48.8 % 791 lbs/cub ydMoisture Content 51.2 % 830 lbs/cub ydOrganic Matter 35.5 % 17.3 % 281 lbs/cub ydTotal Nitrogen 0.66 % 0.32 % 5.22 lbs/cub ydOrganic Nitrogen 0.63 % 0.31 % 4.98 lbs/cub ydNitrate Nitrogen 287 mg/kg 140 mg/kgAmmonium Nitrogen 13.1 mg/kg 6.37 mg/kgTotal Carbon 19.2 % 9.35 % 152 lbs/cub ydC:N Ratio 29.1 Phosphorus 0.15 % 0.08 % 1.23 lbs/cub ydPotassium 0.22 % 0.11 % 1.73 lbs/cub ydCalcium 5.85 % 2.85 % 46.3 lbs/cub ydMagnesium 0.26 % 0.13 % 2.09 lbs/cub yd
Optional Testing Dry Weight BasisMicronutrients
47.9Boron mg/Kg155Zinc mg/Kg68.8Copper mg/Kg
4298Iron mg/KgMetals
57.6Lead mg/Kg4.58Nickel mg/Kg13.5Chromium mg/Kg0.61Cadmium mg/Kg
Feedstock:
Age in weeks:
Compost Method:
Material: Finished
Intended Use:
Interpreting your Compost Test Resultshttp://soiltest.umass.edu/fact-sheets/interpreting-your-compost-test-results
1 of 1 Lab Number C140819-103Sample ID: Bondi

�93
Foodweb AnalysisCompost
Report prepared for:Springfield Parks DivisionEdward Brunton 03-010294 | Submission:03-004607200 Trafton rd. BondiSpringfield, MA 01108 USA(413) 787-6439 0
Report Sent:Sample#:
Unique ID:Plant:
Invoice Number:[email protected] 8/12/2014Sample Received:
For interpretation of this report please contact:Local Advisor: or regional lab
Consulting fees may apply
Soil Foodweb New [email protected]
Organism Biomass Data
Dry Weight Active Bacterial
(µg/g)
Total Bacterial (µg/g)
Active Fungal (µg/g)
Total Fungal (µg/g)
Hyphal Diameter
(µm)Results
Comments0.490
In Good Range0.450.85
30.4Excellent
525Good
12.8Low
865Excellent
2.75
1525
1003000
1525
100300
ResultsComments
280825High
10000
116551High
93Good
0.51Low
Not Ordered
10000 50100
2030
ResultsComments
1.65High0.751.5
0.01Good
0.06Good
0.42Low
300+
0.010.1
0.010.1
0.751.5
ProtozoaNumbers/g
Flagellates Amoebae Ciliates
Total Nematodes
#/g
Percent Mycorrhizal Colonization
Organism Biomass Ratios
Total Fungal to Total Bacterial
Active to Total Fungal
Active to Total Bacterial
Active Fungal to Active Bacterial
Plant Available N Supply (lbs/acre)
Nematodes per Gram of SoilIdentification to genus
Expected Range
Low
High
Expected Range
Low
High
Expected Range
Low
High
Not OrderedECTOENDO
Bacterial Feeders Cephalobus 0.06 Prismatolaimus 0.16 Protorhabditis 0.04
17 Clinton St. Center Moriches, NY 11934 USA631-750-1553 | [email protected]
www.soilfoodweb.com 03-010294: Page 1 of 2

�94
Springfield Parks DivisionEdward Brunton 03-010294 | Submission:03-004607200 Trafton rd. BondiSpringfield, MA 01108 USA(413) 787-6439 0
Report Sent:Sample#:
Unique ID:Plant:
Invoice Number:[email protected] 8/12/2014Sample Received:
For interpretation of this report please contact:Local Advisor: or regional lab
Consulting fees may apply
Soil Foodweb New [email protected]
Interpretation Comments:
Compost age: Finished, compost from Yard Waste, for turf plant
Active Bacteria: Bacterial activity above expected levels; bacterial biomass will increase as long as nutrients are available.
Total Bacteria: Aerobic bacterial biomass in normal range for mature compost.
Active Fungi: Fungi may have run out of food or oxygen; add fungal foods, consider turning when oxygen drops too low.
Total Fungi: Fungal biomass above typical range for compost.
Hyphal Diameter: Good balance of disease suppressive and normal soil fungi.
Protozoa: Protozoa present in numbers that will allow nutrients to be cycled and made available to plants in good quantites.
Total Nematodes: Low numbers, low diversity, need to add beneficial nematodes. Nutrient cycling from fungi limited.
Mycorrhizal Col.: Endo: | Ecto:
TF/TB: More fungal biomass than bacterial biomass. Excellent for improving fungal diversity and biomass.
AF/TF: Mature compost, meaning activity below 10%.
AB/TB: Mature compost, bacteria will not compete with plants for nutrients.
AF/AB: Fungal-dominated compost is becoming more bacterial; addition of foods for preferred dominance might speed balance.
Nitrogen Supply: Excellent boost in plant available N from predators.
Dry Weight: Good moisture content.
17 Clinton St. Center Moriches, NY 11934 USA631-750-1553 | [email protected]
www.soilfoodweb.com 03-010294: Page 2 of 2

Bondi compost
The material that we sampled has potential. During one of my site visits I would like to include the composting site.
We tested for both compost chemistry and compost biology. There are several different aspects of the combos we address and acknowledge as described above.
• The organic matter content is within the desired range at 35%.• The carbon and nitrogen ratio of the finished material is too high at 29:1. It should be
12:1 to 20:1• This relates directly to low levels of retained nutrients• There is a concern that the high ratio will rob the soil of nitrogen to further the
decomposition process of the 35% organic matter fraction• There is a relatively low level of retained nutrient in the compost- there will be minimal
nutrient benefit immediately available and a rather small amount available over the next year
• The pH is slightly high, but within the desired range• The bulk density of the finished compost is too high— in other words there is a lot of
moisture. This sample has about 25% more moisture than we would like to see. At this point I don’t know whether there was a lot of rain or if it is the process.
• The material will need to be screened to ⅜” inch to ½”. • of the biological perspective the material is good• The high moisture content, combined with low oxygen levels has limited the active
fungal fraction• The material would need to be turned and or screen two weeks before application• There is an expected nitrogen release through the biomass based on the organisms
present— this is different than the nitrogen in the material as nitrate
Compost
Compost and composting is a complex subject. It is far more than just creating a pile of organic matter and watching it turn into a soil like material. Composting is an exacting science when we want to produce a finished product of high quality. The discussion here is intended to give an overview of product and process, and in no way should be thought of to impart all of the information necessary to fully understand the subject.
Compost is the product of an aerobic process, whereby microorganisms break down and decompose various forms of organic matter. The organic matter is referred to as a feedstock or substrate, and this can be made up from a wide range of materials. The feedstock can be random materials or they can be chosen to meet a particular recipe. When composting is done by recipe, the starting point in choosing material inputs is
�95

generally to follow a 20:1 to 30:1 carbon to nitrogen ratio. The end result of the composting process should ideally give us a material that has a carbon to nitrogen ratio of 12:1 to 20:1.
Microorganisms use the feedstock material as a food source throughout the decomposition process. Composting is a four phased process; mesophyllic, thermophyllic, second mesophyllic, and maturity. During this process, heat rises and then declines. Different organisms populate the compost windrow at each of these four phases. They produce heat, carbon dioxide, water vapor, and humus as a result of their activity. Humus is the highly stable byproduct of the decomposition process. It can make up to 60% of a finished compost. The process also stabilizes nutrients and pH giving us a finished material rich in nutrients and microbial life, a high percentage of humus and organic matter, and close to neutral pH. This becomes an ideal soil amendment and topdress material for established turfgrass.
Composting is done at the municipal level in many areas as well as in the private sector. Composters are generally required in most states to conform to guidelines that deal with health issues, as in the case of E. coli bacteria. Neither the US EPA nor the US Composting Council currently regulate compost, but they do have programs in place that suggest compost testing as part of the process. At the present time there are no national standards that deal with compost quality. One must have a good understanding of the criteria that define compost quality and rely on one’s own assessment. That assessment should include testing whenever possible. Information should be obtained from the supplier to support the quality of the compost. If no testing data can be provided by the supplier, we then take it upon ourselves to perform the necessary testing to determine the quality and safety of the material.
Compost quality can be determined by several criteria. The finished material should have no offensive odor, there should be no recognizable remnants of the original feedstocks, and it should be finished or mature. There should be no heat escaping from the pile when turned. An offensive odor would be one that has a strong smell of ammonia, turpentine, or bark mulch. A fully mature compost, ready to use, should look, smell, and feel like a high quality topsoil. It should be:
• Between 30% and 45% organic matter, • pH of 7.0, • Moisture content between 30% and 50%• Exhibit retained nutrients on a compost chemistry test • Have minimal ash content • Secure a biological assay to determine maturity
Immature compost would be considered to be a product of inferior quality. It can, in fact, be very detrimental to a turf system and can cause turf damage. Once the composting process has begun, it naturally wants to complete itself. Immature compost will pull nitrogen from the soil to try and complete the composting process. This nitrogen depletion in the soil will have an end result of causing a chlorosis, or yellowing, of the
�96

turf. As the nitrogen levels drop, chlorophyll production in the grass plant decreases, resulting in a plant that no longer has the resources necessary to undergo photosynthesis at a satisfactory level. As photosynthesis decreases, carbohydrate production drops off, and the turf weakens.
Application rates are generally in the range of one half to three quarters of a cubic yard to 1000 ft.² of turf area. Older texts talk about rates as high as 1 yd.³ per 1000, but that is on the heavy side and generally not used at the current time. The depth of the topdressed material should be between 1/4 inch and 3/8 inch. If the depth approaches 1/2 inch, it is too heavy for an individual application.
Compost does have a nutrient analysis. It has definite fertility properties. Compost can be mistakenly thought of as being an organic matter supplement and an infusion of soil microorganisms only, but nutrients are definitely introduced into the system. An average nutrient analysis of compost is 1% to 1.5% nitrogen, .5% to 2% phosphorus, and 1% potassium. These nutrients vary in concentration depending upon the source of the feedstocks in the initial compost process. Manures tend to have higher levels than leaves or grass.
Compost as a topdress in a turf system does five things for us.
1. It helps to increase soil organic matter. When we are dealing with low organic matter percentages, topdressing is the preferred practice for addressing the deficiency. This practice in itself gives good results, but when we can combine topdressing with cultivation, the benefit is magnified as the compost is able to fall into the core holes and reach the root zone.
2. When a compost application is combined with over seeding, it enhances germination and establishment. Think of it as creating a seedbed to receive the grass seed, not unlike a seed starting mix one might use to grow a tray of tomato seedlings for transplant.
3. Compost by virtue of its neutral pH has the ability to help buffer the soil and counteract acidic soils without the use of lime.
4. As compost continues to decompose, we experience nutrient release and get good greening of the turf in much the same way we do with a fertilizer application. When compost is used as a topdress, it is important that we adjust fertilizer applications accordingly. We can get a substantial nitrogen and phosphorus influx to the system with a compost, particularly one that is manure-based. Up to 60% of the nutrients in compost can be readily available with the balance mineralized at a future time.
5. A compost application infuses a substantial amount of both active and passive biology. The bacteria are decomposers, mineralizers, and nitrifiers. There are particular fungal organisms in compost that will give the grass what is often referred to as acquired immune resistance. They are beneficial fungal organisms that have
�97

the ability to fight and suppress some fungal pathogens. Ultimately disease issues in turf become much easier to deal with as the fungal community is improved.
Topdressing with sand, or a blend of primarily sand, will not give the same benefits as a high quality compost. The conventional industry uses sand-based materials, but natural programs are based on compost applications. Sand is used at times in our program for very specific purposes but not as a general topdress. Many times we will create a material that is 50% compost and 50% sand and use it as a topdress. The introduction of the sand helps to loosen the compost and make it spread more easily. It also helps to break up heavy clay soils.
Topdressing with compost can be done at any time during the growing season. The most opportune times are mid-June, late August, and mid to late November at the end of the season. The two early applications can coincide with over seeding applications. We do not always dormant seed late in the season because success rates are generally not as high as seeding during the active growing season. After application, the material breaks down as and is assimilated into the turf within a matter of days. We do need a window of opportunity when the field is not being used. We would generally not topdress when the field is actively in play. The reason being the compost might be somewhat sloppy after a rain event or an irrigation.
Compost Tea
Compost tea is a relatively new concept. It should not be looked at as the silver bullet that makes organic programs work. Most of the testing of compost tea and its efficacy has been done in the private sector because there has been no funding at the university level for it to happen up to this point. The conventional industry that typically funds land-grant universities and their turf research has no interest in working with compost tea at this time. It is often criticized because of its variability from batch to batch and the unknowns that some think are associated with it. The fact is that it is a scientific process. The end result is only as good as the compost that is used in the beginning of the process.
It is one tool among many that we have to improve the biological life in the soil. It should not be looked at as a material that supplies fertility, particularly nitrogen. It has been unfairly judge under that framework. Typically when fertilizer materials are applied, the industry looks at how well the results can be seen in the short term. Looking at compost tea within this framework is problematic. It will not produce those kinds of results in the. The following is a general description of the material and the process.
Compost tea is an application that directly addresses the introduction of large numbers of microbes to the soil environment. The benefits are many, especially during transition. At the present time, there are some contractors that can provide this service, but there are not many. We are working within the industry to begin to change that. The most cost-efficient approach to compost tea production is an in-house operation.
�98

Compost tea is one of the inputs on the horizon that will change the way we deal with several of the management aspects of growing high-quality turfgrass in an organic program. This is applicable to back yards, parks, athletic fields, and commercial and institutional properties. It is already being used to some extent, but over the next few years will become one of the foundations of a complete natural program. We now use the application of a compost topdress to address the organic matter content of the soil as well as to introduce beneficial soil biology and a plant available nutrient source. The application of a topdress can be expensive depending on the compost supplier and freight costs. When we have reached our target goal of organic matter percentage, the topdress applications can be reduced or eliminated and compost tea can take their place.
In a turf system we generally do not see the rapid depletion of organic matter in the same way we might expect in other areas of agricultural production. Compost tea, although valuable from the beginning of a natural management program, has greater weight when compost applications are reduced or eliminated. We rely on the compost tea to supply the microorganisms and all of the benefits that come with them. Compost tea does not directly add organic matter to the soil in the way that compost does, but because our organic matter has reached its target level, we meet the needs with increased biology only.
Compost tea is a liquid extract of high-grade compost. More specifically, compost tea is a concentrated solution of microbial life produced by extracting beneficial microbes from either a vermi-compost (worm castings) or a windrowed compost. When we use a compost from outside our immediate geographic region, it is a good practice to take a handful of local soil or compost to add indigenous organisms to the stock. The compost is placed in a finely woven mesh bag and that bag is suspended in a tank of water. The compost tea brewing machine consists of a tank, which can be anywhere from 25 gallons to 1000 gallons and an infused oxygen source. The air containing oxygen is moved through the water causing a gentle agitation. The exact mechanism for agitating the water can be a series of circulating pumps, air pumps and other proprietary technology developed by individual manufacturers. The process is such that this agitation of the water separates the microbes from the physical compost. The compost remains in the bag and the microbes are extracted into the water solution.
The newest technology involves equipment that has the ability to extract the microbes very quickly, usually within a two hour window. We could use the material at this point as an extraction. The same number of organisms that were in the compost are now in the water solution.
The secondary step in the process is actually brewing a compost tea. Once the organisms are extracted into the water solution, we can grow them over a 24 to 48 hour period into extremely large numbers. If that is our goal, we add food sources for these organisms to the water during the initial part of the process. We might add materials like kelp, seaweed, humates, fish hydrolysates, wheat and rice flowers, or straw. These
�99

these inputs act as foods for the organisms and allow them to grow to very large numbers. There are some guidelines that we must follow. If we are using city water, it must be de-chlorinated. The temperature of the water should be in the 65° to 75° range. If water is too hot, it cannot hold enough dissolved oxygen to support the microbes. If the water is too cold the microbes will not grow to any great numbers in a reasonable amount of time. The end product is a direct result of the quality of the compost that begins the process. It is critical that all of this is done in an aerobic environment. Oxygen is critical to sustaining the microbial population. The difference between this material which is known as actively aerated compost tea (AACT) and some of the products that one can buy off the shelf is the diversity of the microbial population in the finished product.
Aside from simply delivering large quantities of active biology to the soil profile, compost tea does considerably more for us.
• It is a source of soil and foliar nutrients delivered in a biologically available form for both plant and microbial update.
• The beneficial microbiology can compete with disease causing organisms and in most times outcompete them, thereby suppressing a pathogen or disease problem before it gets to a point when turf damage occurs.
• The microbes have the ability to degrade and breakdown toxic materials and pesticides.
• They produce essential plant growth hormones. • They can fix nitrogen and mineralized plant available nutrients.• As we introduce compost tea to a turf system, we begin to create a biologically active
soil environment. As the soil continually becomes more alive, we see direct and lasting benefits to the turfgrass.
• When a healthy balanced soil environment, with the proper biology to sustain turfgrass is in place, we see benefits in the nutritional area, whereby the nutritional health and quality of the plant is improved as well as the soil’s ability to retain nitrogen and other nutrients like calcium, potassium, and phosphorus.
• It helps improves and create good soil structure that increases water infiltration, oxygen diffusion, and the water holding capacity of the soil.
As you can see the benefits are many, and when the availability of compost tea becomes more prevalent, it will become one of the tools that can assist a natural turf manager at a relatively low cost. At a rate of roughly 1 gallon per 1000 ft.² or 50 gallons to the acre, it will be a very economical way to take natural turf management to the next level.
When compost tea is applied, we generally add other materials to the spray tank immediately prior to application. Those additional materials can be supplemental minerals such as, nitrogen, humic substances, kelp, seaweeds, and fish fertilizers. All of these materials will provide stimulus to both the soil environment and the grass plant.
�100

Humates
Humates are metal (mineral) salts of humic or fulvic acids. Humus is a highly stable byproduct of organic matter decomposition. Humic acid is the most biologically active component of soil humus. The humus portion of the soil is relatively small. The organic matter percentage generally ranges from 3% to 8% with an optimum level in a turf system in the 5% to 6% range. Humus makes up 65% of the total organic matter component. Humus plays an important role as a component of soil fertility. Its impact is far greater proportionally than the percentage of the soil mass that it makes up. The molecules of humus are not rapidly degraded by microorganisms as many non humus substances are. Humus is in fact, slow to decompose, and when in combination with soil minerals can persist for several hundred years.
With the emergence of conventional, synthetic nitrogen, phosphorus, potassium fertilizers, we (agriculture in general) have lost sight of the natural order of soil management. When it was discovered that the synthetics had the ability to rapidly stimulate plant growth, the turf industry was born and jumped on the bandwagon. The prolonged use of these products, in the absence of properly addressing soil health, can, and has, led to many problems in the area of soil quality.
Humic substances that would be considered to be “fertilizer grade” are obtained from carbon containing mineral deposits in many parts of the world. Here in the United States there are several mines and deposits that contain good agricultural grade humic substances.
Naturally occurring humic substances from low-grade lignites and leonardites (“nature’s soil conditioners”), are superior fertilizer ingredients. A major source of humic substances for fertilizer use is from leonardites. Leonardite is defined as a highly oxidized, low-grade lignite that contains a relatively high concentration of fulvic acids. Humates, suitable for both granular and liquid applications, are readily available and can be purchased from a variety of sources. They can be purchased by themselves or as part of a proprietary blend of materials. The application of these products to a turf system is addressing soil health and quality at its most basic level. Some benefits of humic applications include:
• Builds healthy soil• Increases organic matter which helps to reduce nitrogen loss through leaching• Contains carbon as an energy source for microbes• Improves soil structure, aggregation, water infiltration, aeration, and water holding
capacity• Increases nutrient availability to the grass plant• Facilitates mineral breakdown• Increases microbial activity• Helps with root growth and penetration and maintaining chlorophyll density
�101

Molasses
Molasses has long been known as a bacterial food. It is incorporated in compost teas and liquid fertilizer programs as a means of providing nutrition and stimulation to the bacterial biomass. In cases where we have soils that exhibit high numbers of total bacteria, mostly dormant, the introduction of molasses to the system will wake up these organisms and move them into the active population. It is the active population that is doing the work for us. When we introduce active biology to the soil with an input, we incorporate molasses at the same time so that those organisms have a food source when they are initially introduced to the soil environment
Minerals
In tank mixes of liquid applications, work has been done involving the inclusion of minerals. There is a product that his shown very good results in a wide range of soils in the United States. These minerals derived from seawater. This is not new technology, but work that began in the 1930s. Minerals added to soils, particularly grasses, have been shown to provide very consistent and measured growth response when used with low doses of nitrogen. Interestingly enough, high doses of nitrogen reduce the efficacy of mineral applications. We combine these minerals at very low rates, generally in the range of 2 pounds per acre at each application. When combined with low dose nitrogen applications as part of a broad, comprehensive program designed to manage both the biomass and the turf.
Kelp
Kelp contains over 70 vitamins and minerals, chelating agents and amino acids. Perhaps more important, it's used as an organic fertilizer supplement for its cytokinins and auxins, both natural plant growth hormones. In seaplants, it is the naturally occurring carbohydrates, polysaccharides, organic acids, amino acids, growth hormones, and macro and micro nutrients which play key roles in boosting stress tolerance and survival. These same components contribute to the stress management and survival potential of plants treated with these extracts. Two of the primary benefits of these extracts are to enhance plant growth and improve stress tolerance. They can significantly increase stress tolerance and survival potential of plants under intense or seasonal stress.
Kelp extracts have been shown by independent research to improve plant health in physiological fitness, photosynthesis, chlorophyll content, plant anti-oxidant levels, cell wall strength, stress tolerance, resistance to disease, and drought tolerance. Kelp is most effectively used when combined with other inputs, including an organic nitrogen source.
�102