Embed Size (px)
Citation preview

S1
Electronic Supplementary Information
A Noble Metal Seed-Mediated Approach to General and Mild
Synthesis of Non-noble Metal Nanoparticles Stabilized by A Metal-
Organic Framework for Highly Efficient Catalysis
Yu-Zhen Chen,a,ǂ Linfeng Liang,a,b,ǂ Qihao Yang,a Maochun Hong,b Qiang Xu,c Shu-
Hong Yu,a and Hai-Long Jianga,b,*
aHefei National Laboratory for Physical Sciences at the Microscale, Key Laboratory
of Soft Matter Chemistry, Chinese Academy of Sciences, Collaborative Innovation
Center of Suzhou Nano Science and Technology, Department of Chemistry, University
of Science and Technology of China, Hefei, Anhui 230026, P.R. China
bState Key Laboratory of Structural Chemistry, Fujian Institute of Research on the
Structure of Matter, Chinese Academy of Sciences, Fuzhou, Fujian 350002, P.R.
China
cNational Institute of Advanced Industrial Science and Technology (AIST), Ikeda,
Osaka 563-8577, Japan
Electronic Supplementary Material (ESI) for Materials Horizons.This journal is © The Royal Society of Chemistry 2015

S2
Fig. S1 As a representative, the synthesis progress for Ag-doped Ni/MIL-101 can be
visibly monitored by the obvious color evolution in the solution: (a) The pale green
Ag+Ni2+/MIL-101 aqueous solution before the reduction by NH3BH3; (b) the deep
green aqueous solution obtained at the beginning of the hydrolysis of NH3BH3, in
which only the Ag+ was reduced to Ag NPs as seeds. The generated very few bubbles
are due to the presence of tiny amount of Ag NPs; (c) then the color became darker
and darker gradually within a few minutes during the hydrogen generation and
reduction process, and the bubbles becomes more and bigger, revealing that the
reduction of Ni2+ NPs to Ni NPs covered on the pre-formed Ag seeds, thus to afford
Ag-doped Ni/MIL-101.

S3
Fig. S2 (a, c) HAADF-STEM images and (b, d) the corresponding EDS spectra for
as-synthesized Ag-doped Ni/MIL-101 sample. The point 1 in (a) and 2 in (c) lie in
middle and edge of Ag-doped Ni NPs, respectively. The Cu and Cr signals originate
from Cu grid and MIL-101 support, respectively. The EDS spectra for point 1 and 2
marked for Ag-doped Ni NPs only show the element Ni because the content of Ag is
too low to be detectable.

S4
Fig. S3 TEM image of (a) Ag-doped Ni/MIL-101 (reduced by NH3BH3) with Ag/Ni
molar ratio of 1/200, (b) PVP-stabilized Ni NPs (reduced by NaBH4, inset: HRTEM
image for Ni NP) (c) Ni/MIL-101 (reduced by NaBH4), (d) Ag/MIL-101 (reduced by
NH3BH3), and (e) pure Ag-doped Ni (1/200) NPs without stabilizer. (f) HRTEM
image of pure Ag-doped Ni NP, in which the lattice fringes with 0.206 nm spacing are
assigned to the (111) plane of the face-centered cubic (fcc) Ni. (g) Ni2+/MIL-101 and
(h) PVP-stabilized Ag@Ni core-shell NPs (reduced by NH3BH3) with Ag/Ni molar
ratio of 1/1 (inset: HRTEM image for Ag@Ni NP).

S5
(a)
10 20 30 40 50
Pt-doped Ni/MIL-101
Pt-doped Co/MIL-101
Au-doped Ni/MIL-101Pd-doped Ni/MIL-101Pd-doped Co/MIL-101
Ag-doped Ni/MIL-101as-synthesized MIL-101
simulated MIL-101
T (min)
Inte
nsity
(a. u
.)
(b)
10 20 30 40 50
In
tens
ity (a
. u)
2Theta (degree)
simulated MIL-101 as-synthesized MIL-101
Ag1:2001:1001:501:101:15:1
10:1nAg:nNi
(c)
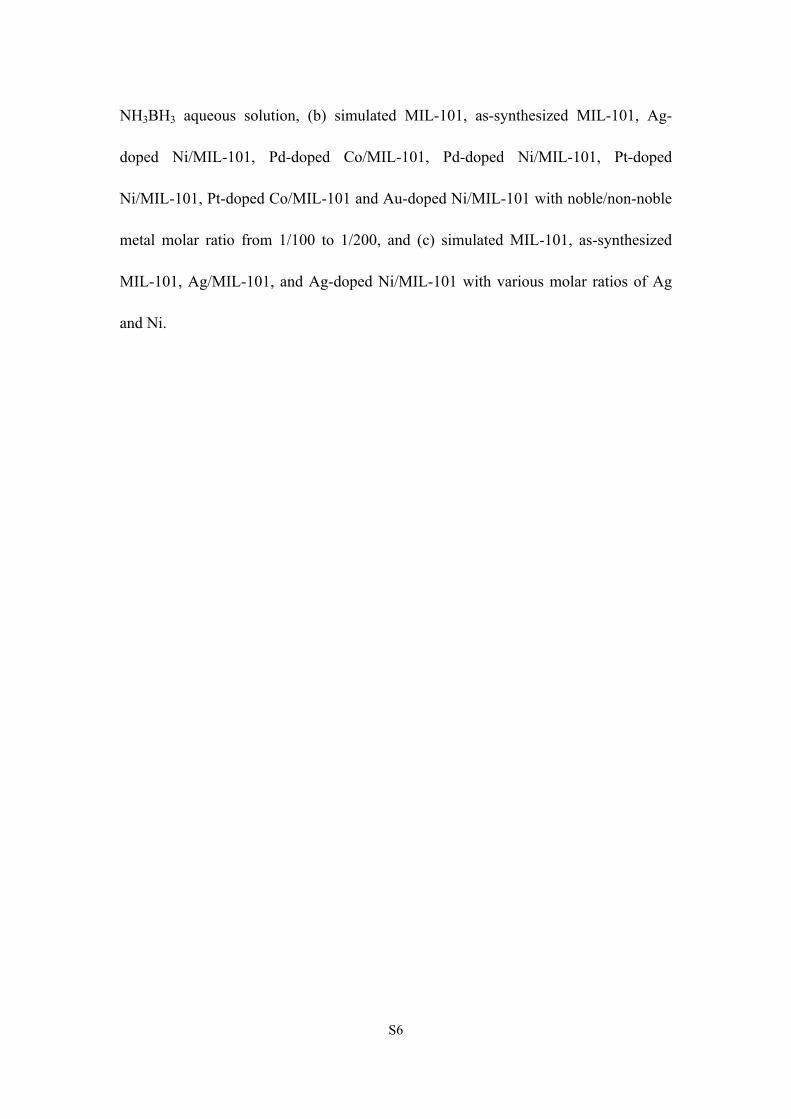
Fig. S4 PXRD patterns of (a) Ag-doped Ni/MIL-101 reduced by 0.6 M NaBH4 or
S6
NH3BH3 aqueous solution, (b) simulated MIL-101, as-synthesized MIL-101, Ag-
doped Ni/MIL-101, Pd-doped Co/MIL-101, Pd-doped Ni/MIL-101, Pt-doped
Ni/MIL-101, Pt-doped Co/MIL-101 and Au-doped Ni/MIL-101 with noble/non-noble
metal molar ratio from 1/100 to 1/200, and (c) simulated MIL-101, as-synthesized
MIL-101, Ag/MIL-101, and Ag-doped Ni/MIL-101 with various molar ratios of Ag
and Ni.
S7
0.0 0.2 0.4 0.6 0.8 1.00
200
400
600
800
1000
1200
Vads
(STP
) (cm
3 /g)
P/P0
MIL-101 Pd-doped Ni/MIL-101 Pd-doped Co/MIL-101 Pt-doped Ni/MIL-101 Pt-doped Co/MIL-101 Au-doped Ni/MIL-101
(a)
(b)
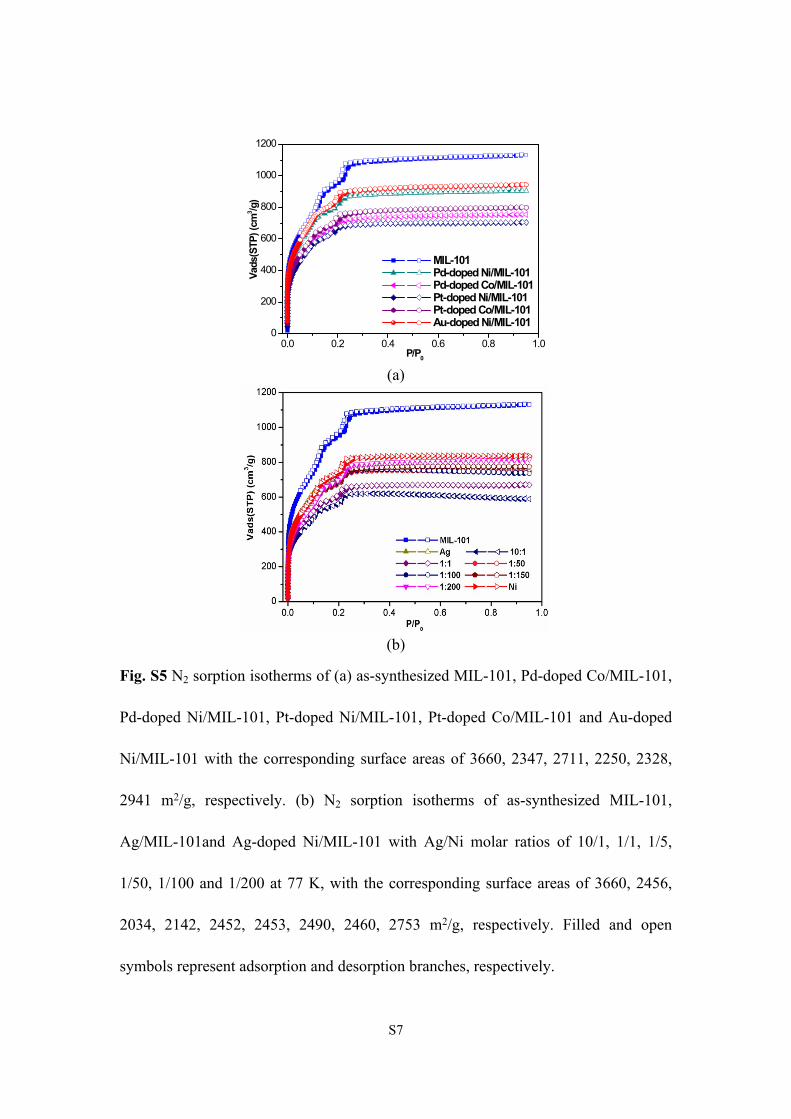
Fig. S5 N2 sorption isotherms of (a) as-synthesized MIL-101, Pd-doped Co/MIL-101,
Pd-doped Ni/MIL-101, Pt-doped Ni/MIL-101, Pt-doped Co/MIL-101 and Au-doped
Ni/MIL-101 with the corresponding surface areas of 3660, 2347, 2711, 2250, 2328,
2941 m2/g, respectively. (b) N2 sorption isotherms of as-synthesized MIL-101,
Ag/MIL-101and Ag-doped Ni/MIL-101 with Ag/Ni molar ratios of 10/1, 1/1, 1/5,
1/50, 1/100 and 1/200 at 77 K, with the corresponding surface areas of 3660, 2456,
2034, 2142, 2452, 2453, 2490, 2460, 2753 m2/g, respectively. Filled and open
symbols represent adsorption and desorption branches, respectively.

S8
Fig. S6 Plots of time vs volume of hydrogen generated from the catalytic hydrolysis
of NH3BH3 over (a) Pd-doped Ni/MIL-101, (b) Pd-doped Co/MIL-101, (c) Pt-doped
Ni/MIL-101, (d) Pt-doped Co/MIL-101, (e) Au-doped Ni/MIL-101 catalysts with
different noble/non-noble metals molar ratios, and (f) Pd-doped Fe/MIL-101 (1:100)
at 25 oC. The Fe species has inferior activity compared to Ni and Co. Therefore, only
catalytic study over Pd-doped Fe/MIL-101 (1:100) was conducted.

S9
Table S1. Catalytic reaction rate constant k and TOF value of Ag-doped Ni/MIL-101
catalysts with different Ag/Ni ratios for hydrolytic dehydrogenation of NH3BH3 (TOF
= k/(V0·nmetal), V0 = 24 L/mol, T= 25 oC).
nAg: nNi(mol:mol)
K(mLH2·min-1)
TOF(molH2·molmetal
-1·min-1)
10:1 7.31 21.2
5:1 8.94 20.3
1:1 7.62 24.8
1:50 10.8 30
1:100 7.21 20
1:150 6.51 18.1
1:200 7.28 20.2

S10
Fig. S7 Plots of TOF value of hydrogen release versus Ag-doped Ni/MIL-101
catalysts with various Ag/(Ag+Ni) molar ratios. Reaction conditions: 0.875 mmol
ammonia borane, 20 mL H2O, (Ag+Ni)/NH3BH3 = 0.017 in molar ratio for all
catalysts.
Fig. S8 Plots of time versus the volume of hydrogen generated from the hydrolysis of
ammonia borane catalyzed by the Ag-doped Ni/MIL-101 catalyst with Ag/Ni atomic
ratio of 1/200 at different temperatures. It can be seen that the lower the reaction
temperature, the longer the initiation period. After the initiation process, a rapid and
almost linear hydrogen evolution can be observed.

S11
Fig. S9 Plots of ln (K) versus 1/T of hydrogen generated from ammonia borane (0.875
mmol, 20 ml) in the presence of Ag-doped Ni/MIL-101 catalyst with Ag/Ni molar
ratio of 1/200 ((Ag+Ni)/NH3BH3 = 0.017 in molar ratio) at 25, 30, 35 and 40 oC and
the calculated activation energy is 25 kJ/mol.
Fig. S10 Plots of time versus the volume of hydrogen generated from the hydrolysis
of ammonia borane over Ag-doped Ni/MIL-101 catalyst with Ag/Ni molar ratio of
1/200 at different concentrations of ammonia borane ([NH3BH3] = 0.875 mmol, T =
25 oC), indicating that the catalytic hydrolysis of ammonia borane is of zero order
with respect to the substrate concentration. It can be seen that the initiation process is
dependent on the NH3BH3 concentration while other reaction conditions are fixed.
The higher NH3BH3 concentration is, the shorter initiation period.

S12
Table S2. Performance comparison of Ag-doped Ni/MIL-101 catalyst with various catalysts.
Catalyst EakJ·mol-1
TOF(molH2·molmetal
-1·min-1) Ref.
Ag-doped Ni/MIL-101 (Ag/Ni molar
ratio = 1/200)25 20.2 This work
PSMA-Ni 38.12 10.1 1zeolite confinedpalladium (0) 56 5.6 2
Ni/SiO2 34 13.2 3
Ag-Ni/C 52 - 4
Ni0.97-Pt0.03 57 - 5VP stabilized
Au@Co core-shell - 13.6 6
CVD-Ni/ZIF-8 - 14.2 7
Ni/γ-Al2O3 - 1.7 8
Pt/Al2O3 21 - 9
Ag@CoNi/graphene 47 - 10

S13
Table S3. Inductively coupled plasma atomic emission spectrometry (ICP-AES)
analysis results for catalysts. The results have confirmed that the actual ratios of
noble/non-noble metals are very close to the nominal values.
nnoble / nnon-noble (mol / mol)Nanoparticles Metal content (%)
Actual value Nominal value
Ag-doped Ni 1.81 1/167 1/200
Pd-doped Ni 1.51 1/210 1/200
Pd-doped Co 1.75 1/144 1/150
Pt-doped Ni 1.43 1/85 1/100
Pt-doped Co 1.73 1/96 1/100
Au-doped Ni 1.63 1/88 1/100
Experimental process for ICP characterization: First, the instrument was preheated for
about 30 min. Second, sample treatment: 10 mg of sample was dissolved in 3 mL
concentrated HNO3 followed by heating to 80 °C to remove organics. The residue
was dissolved with 1 mL HNO3 and some water, and then continuously adding water
to make solution volume to 10 mL (a constant volume). Third, work curve was made
and the metal ions in solution were measured.

S14
10 20 30 40 50
Inte
nsity
(a. u
.)
2Theta (degree)
Ag-doped Ni/MIL-101 after five cycles
as-synthesized MIL-101
simulated MIL-101
as-synthsized Ag-doped Ni/MIL-101
Fig. S11 PXRD patterns for Ag-doped Ni/MIL-101 catalyst with Ag/Ni molar ratio of
1/200 and the catalyst after 5 cycles of NH3BH3 hydrolysis, revealing the well-
retained crystallinity and framework structure of MIL-101, and also the absence of
aggregation of tiny Ag-doped Ni NPs in both catalysts before and after five runs of
recycling experiments.

S15
References
1. Ö. Metin and S. Özkar, Int. J. Hydrogen Energy, 2011, 36, 1424-1432.
2. M. Rakap and S. Özkar, Int. J. Hydrogen Energy, 2010, 35, 1305-1312.
3. Ö. Metin, S. Özkar and S. Sun, Nano Res., 2010, 3, 676-684.
4. F. C. Yao, L. Zhuang, Y. L. Cao, X. P. Ai and H. X. Yang, Int. J. Hydrogen
Energy, 2008, 33, 2462-2467.
5. F. Cheng, H. Ma, Y. Li and J. Chen, Inorg. Chem., 2007, 46, 788-794.
6. J.-M. Yan, X.-B. Zhang, T. Akita, M. Haruta and Q. Xu, J. Am. Chem. Soc., 2010,
132, 5326-5327.
7. P. Z. Li, K. Aranishi and Q. Xu, Chem. Commum., 2012, 48, 3173-3175.
8. M. Chandra and Q. Xu, J. Power Sources, 2006, 156, 190-202.
9. M. Chandra and Q. Xu, J. Power Sources, 2007, 168, 135-142.
10. L. Yang, J. Su, X. Meng, W. Luo and G. Cheng, J. Mater Chem A, 2013, 1,
10016-10023.