Embed Size (px)
Citation preview

U.S. Department of the InteriorU.S. Geological Survey
Organic Contaminants and Trace Elements in Water and Sediment
Sampled in Response to the Deepwater Horizon Oil Spill
Lisa Nowell, Amy Ludtke, David Mueller, and Jonathon Scott

Deepwater Horizon oil spillApril 20 – July 15, 2010
• Macondo-1 well in Gulf of Mexico
• 4.9 million barrels of Macondo-1 (M-1) well oil – Light, sweet Louisiana
crude (<1% S)– Subject to weathering
U.S. Coast Guard

Today’s talk• OWQ study design• Data issues and analysis• Results by contaminant class / medium
– Occurrence: pre-landfall vs. post-landfall– Exceedance of benchmarks: EPA, supplemental
• Comparison to Macondo-1 well oil fingerprinting (Rosenbauer et al. 2010)

Pre-landfall Post-landfallsampling: sampling:
May 7 to July 7, 2010• Assess baseline conditions
prior to oil landfall• 70 Pre sites were sampled,
incl. beaches, barrier islands, coastal wetlands
• 5 States: TX, LA, MS, AL, FL• 1 water, 1 sediment sample
Oct 4 to 14, 2010• US Coast Guard: actionable levels of
oil-related chemicals• 48 Pre sites + 1 new site (Aug 23)
were sampled based on observation of oil, trajectory modeling, oceanography
• 5 States, espec LA, MS, AL• 1 water, 1 sediment sample
D Demcheck, USGSD Demcheck, USGS

Contaminant analysis
Contaminant WATER:Pre
WATER: Post
SEDIMENT: Pre
SEDIMENT: Post
PAH/SVOC NWQL NWQL
Oil & grease TAL-FL TAL-CO
VOC/BTEX NWQL – –
Petrol HC/GRO TAL-FL – –
DRO – – –TEs NWQL USGS SCLNutrients NWQL USGS SCLCarbon USGS OCRL USGS SCL
Contaminant analysis
Contaminant WATER:Pre
WATER: Post
SEDIMENT: Pre
SEDIMENT: Post
PAH/SVOC NWQL TAL-FL NWQL, TAL-VT
TAL-VT
Oil & grease TAL-FL TAL-FL TAL-CO TAL-FL
VOC/BTEX NWQL TAL-FL – –
Petrol HC/GRO TAL-FL TAL-FL – –
DRO – TAL-FL – –TEs NWQL TAL-FL USGS SCL USGS SCLNutrients NWQL TAL-FL USGS SCL USGS SCLCarbon USGS OCRL USGS OCRL USGS SCL USGS SCL

Data issues• Changing target
analyte lists• Multiple laboratories• Variable reporting
levels (RL)• Lots of censored data
(nondetections, <RL)
• Limit comparison to analytes in common
• Use QC data• Censor data at common
RL for some analytes• Use methods applicable
to censored data

Example: systematic differences in RL
• RL was lower for Pre (0.05 mg/L) than Post samples (0.08–0.4 mg/L)• Pre: 60% of samples were mostly detections of 0.05 mg/L or below• Post: 60% were nondetects in range of <0.08 to <0.12 mg/L• Censor (less sensitive method)
Phosphorus as P

Trace elements: Water• Occurrence:
– Data limitations: (i) one sampling period, (ii) high/variable RLs
– Above optimal censoring threshold:• Post > Pre: Ba, Ca, Mg, Mo, K, Na• Pre > Post: Ammonia, P
• Benchmarks:– Human health exceedances (V, Ni): none– Aquatic-life exceedances : 47% of samples
• Minimum of: 29% Pre and 93% Post• Cannot compare statistically because
(i) some TEs with benchmark exceedances were analyzed during only 1 period and (ii) some censored samples had RL > benchmark.

Trace elements: Sediment• Occurrence:
– Strong acid digestion total in sediment matrix– Above optimal censoring threshold: whole sediment
• Post > Pre: Ca, Carbon, Na, Sr• Pre > Post: Pb, Hg
– Fine sediment (<63 µm): these differences disappeared
• Benchmarks:– Look for elements at potentially toxic concentrations that
are also enriched relative to baseline– 16 of 122 samples (i) exceeded upper screening-level
benchmarks AND (ii) were enriched relative to baseline concentrations in the same element:
• Ba (14), V (5), Al (3), Mn (3), As (2), Cr (2), Co (1)
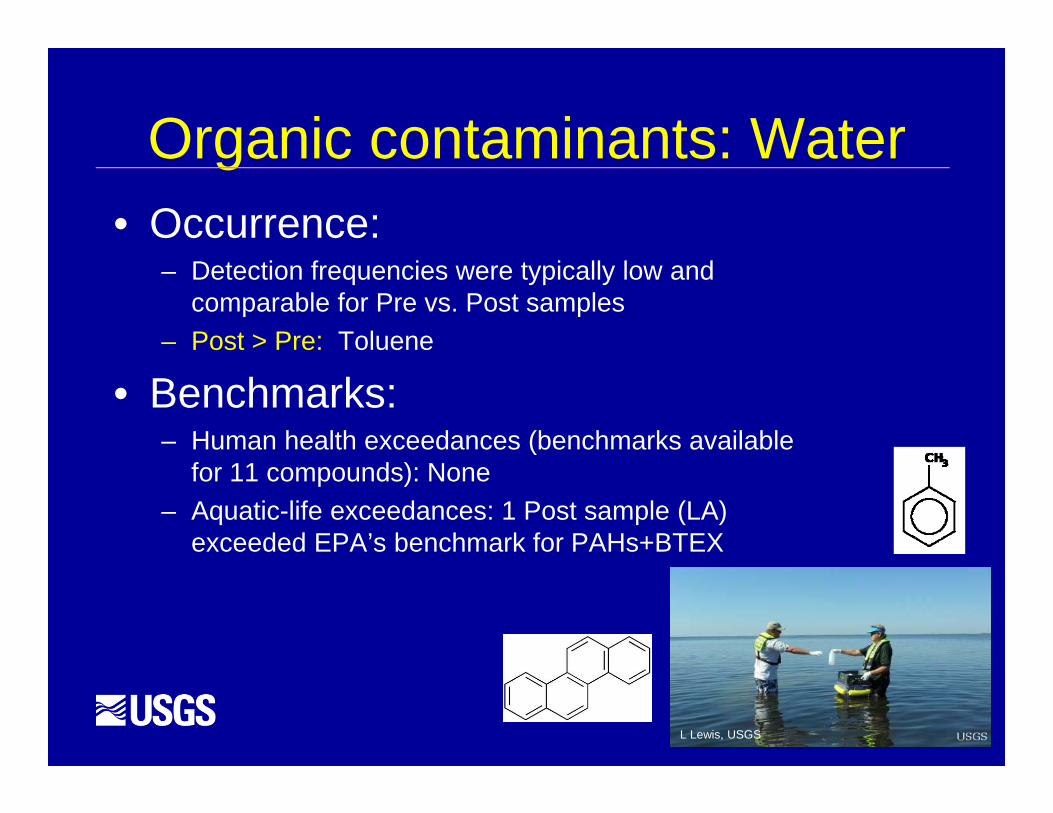
Organic contaminants: Water• Occurrence:
– Detection frequencies were typically low and comparable for Pre vs. Post samples
– Post > Pre: Toluene
• Benchmarks:– Human health exceedances (benchmarks available
for 11 compounds): None– Aquatic-life exceedances: 1 Post sample (LA)
exceeded EPA’s benchmark for PAHs+BTEX
L Lewis, USGS

Organic contaminants: Sediment• Occurrence:
– Most PAHs were detected in both sampling periods (despite low sediment-TOC)
– Post > Pre: 20 PAHs (3 parent, 17 alkyl)– Differences still significant after OC-normalization– Significant differences: usually due to 6–7 sites
• Benchmarks– 1 Pre sample (TX) exceeded EPA’s benchmark for
PAH mixtures – Empirical sediment-quality benchmarks (conc’ns
historically associated with adverse effects in field)• 70% no-effect range, 27% probable effect range• Pre and Post not significantly different
R3
S Stocks

Geochemical oil fingerprinting
Rosenbauer et al. (2010)
Highlights• Trace elements – Water
– Aq-life benchmarks exceeded in ~50% water samples; minimum value (cannot evaluate relation to oil landfall)
• Organic contaminants – Sediment – M-1 oil may contribute to high PAHs at 5 sites
• Post > Pre conc’ns: for 3 PAHs and 17 alkyl-PAHs • Of 7 sites with the highest PAH concentrations, 5 have M-1 oil fingerprint• These 5 sites exceed empirical sediment benchmarks (27% samples),
but not EPA benchmark for PAH mixtures• EPA benchmark for PAH mixtures was exceeded only at 1 Pre-landfall
site (TX)
For more information:• Office of Water Quality:
http://water.usgs.gov/owq/deephorizonoilspill/• Organics/trace elements report :
http://pubs.usgs.gov/of/2011/1271/• Oil fingerprinting reports (Rosenbauer et al.):
http://pubs.usgs.gov/of/2010/1290/http://pubs.usgs.gov/of/2011/1014
Lisa NowellU.S. Geological Survey
Placer Hall, 6000 J StreetSacramento, CA 95819
(916) [email protected]
D Hardesty, USGS