Embed Size (px)
Citation preview
..
•
ORE DRESSING AND CERAlIICS. 163
77<6-16.3_170 R. 383 SA V AGE RIVER MAGNETITE BENEFICIATION BY MAGNETIC SEPARATION
Sample Benefic!ation tests were performed on a bulk sample representing
selected section of diamond drill core from holes numbered 7. 9 and 10 of the Savage River iron ore deposits.
Sections of ore specified were:-
Bore hole No. 7 Bore hole No. 9 Bore hole No. 9 Bore hole No. 10 Bore hole No. 10 Bore hole No. 10 Bore hole No. 10
477' to 782' 178' to 231' 268' to 497' 95' to 114'
124' to 276' 318' to 331' 359' to 438'
The sample was composed from jaw crushed residues from laboratory assay samples. A small number of samples was not available for the make up of the composite. but the weight of these is not significant. and the sample may be regarded as typical of the section of core specified.
A head sample was taken from the composite. and assayed with the following results:-
Iron Sulphur Phosphorus Silicon Alumina Titanium Manganese Vanadium .
Pereent
47.6 5.84 0.12 4.18 2.04 0.42 0.10 0.30
164 ORE DRESSING AND CERAMICS.
Previous Literature
Mines Department Ore Dressing Investigation No. 326, January, 1958.
Mines Department Ore Dressing Investigation No. 334. June. 1958.
Mines Department Ore November, 1959.
Dressing Investigation No. 355-359,
Mines Department Ore June, 196J.
Dressing Investigation No. 369-370,
C.S.I.R.O. Mineragraphic Investigations No. 736, 746 a nd 806.
Investigation
Beneficiation by magnetic separation has been investigated at sizings ranging from minus i -inch to minus 200 mesh. Crushing to minus i-inch was performed in a jaw crusher. Due to t he nature of the preliminary crushing of the samples, i.e., for assay purposes, the sizing of minus i -inch is unduly fine there being only about 14% of minus i-inch plus i-inch material. Controlled stage crushing would result in a coarser product. Minus i-inch, minus I-inch, and minus 18 mesh B.S.S. sizings were obtained by stage roll crushing. Finer sizings were obtained by closed circuit wet ball mill grinding of minus 18 mesh are. These sizings were minus 60, 100 and 200 mesh B.S.S. Sixty mesh and 10:'> mesh grinding circuits were closed by the appropriate screens, and 200 mesh by hydraulic classifier and is therefore nominal only. Sizing analyses of the various size feeds appears later in the report.
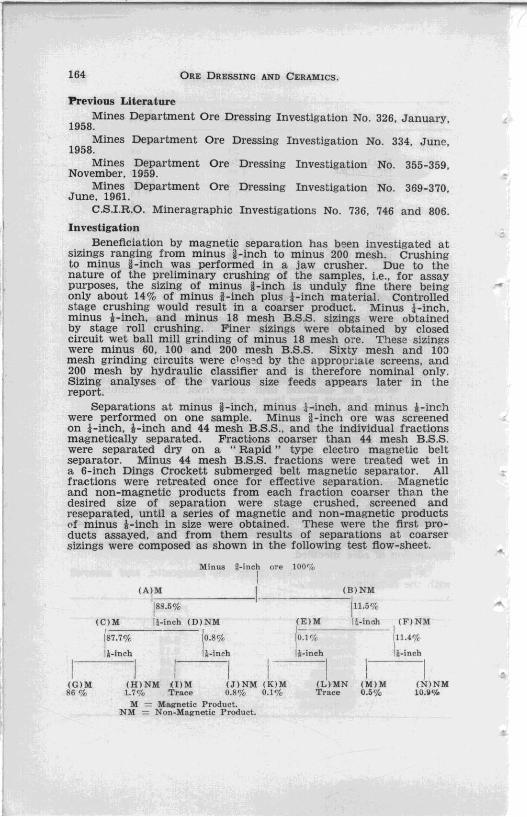
Separations at minus i-inch, minus l- .. inch. and minus i -inch were performed on one sample. Minus i-inch are was screened on i-inch, i-inch and 44 mesh B.S.S., and the individual fractions magnetically separated. Fractions coarser than 44 mesh B.S.S. were separated dry on a "Rapid" type electro magnetic belt separator. Minus 44 mesh B.S.S. fractions were treated wet in a 6-inch Dings Crockett submerged belt magnetic separator. All fractions were retreated once for effective separation. Magnetic and non-magnetic products from each fraction coarser than the desired size of separation were stage crushed, screened and reseparated, until a series of magnetiC and non-magnetic products of minus I-inch in size were obtained. These were the first products assayed, and from them results of separations at coarser sizings were composed as shown in the following test flow-sheet .
(G)M 86 0/0
Minus 3-ineh
i ore 100"/0
(B)NM (A)M I 1=-----· ._----,
(O)M 188.5% I! -inch (D)NM ,
187.7% Ii -inch
(H)NM (I)M 1.7% Traee
1
0.8%
' _inch
I (J)NM (K)M 0.8% 0.1 %
M = Magnetic Product. NM = Non-Magnetie Product.
(E)M
1
0.1 %
/I -inch
j11.5%
11-lnOO (F)NM 1 111.4% 1 Ii-inch
1--1 (M)M (N )N M 0.5 0/0 10.Slo~
•
"
ORE DRESSING AND CERAMICS. 165
Minus 18, 60, 100 and 200 mesh separations were performed on individual samples using the Crockett wet separator; results shown at these sizings are of recleaner concentration.
No responsib1l1ty is accepted for the results shown in this report except in so far as they apply to the sample tested.
All iron determinations reported refer to HCI soluble, and in general represent the iron present as magnetite.
Summary 1. The sample contained 47.6% of iron, 0.12 % of phosphorus,
.. and 5.84% of sulphur.
•
•
2. Weight yields of magnetic concentrate ranged from 88.5 % of minus i-inch size to 67.5% at minus 200 mesh. Iron recoveries were high, the lowest recovery being 96.3 % from separation at minus 200 mesh .
3. Beneficiation at minus i-inch was not appreciably better that at minus i-inch. Figures shown in the test fiow-sheet ind1cate the reason for this, only small amounts of non-magnetic material being released by crushing of i -inch magnetics A. Any gain in quality from this operation is nearly counter balanced by the inclusion of small amounts of low grade magnetic material released by the crushing of I non-magnetics B.
Beneficiation at minus 18 mesh showed a sharp increase in concentrate quality over minus i -inch operations. This trend continues with finer grinding of the feed and is clearly indicated in the following summary of the magnetic concentrates.
Magnetic Products
Percent
c :3 ~ • " • '" ~
'0 ~ . .c ;:; 0: • ~ •• • • c iii ~ " .. '" "' :;: iii :0: ;:: >
I-Inch 88.5 53.4 99.3 4.59 0.09 1.49 '.00 0.10 0.40 0.34 l -inch 87.8 53.8 99.2 4.59 0.09 1.47 2.91 0.10 0.40 0.34 i-inch 86.6 54.6 99.1 4.26 0.08 1.49 2.96 0.10 0.40 0.34
18 m8h 74.9 61.8 97.4 1.63 0.03 1.09 1.78 0.10 0.40 0.35 60 mmh 70.7 66.1 97.0 0.75 0.02 0.91 1.22 0.10 0.40 0.38
100 m"h 68.6 66.7 .... 0.32 0.02 0.91 0.94 0.09 0.31 0.37 200 m .. h &7.' 67.9 96.3 0.33 0.02 0.88 0.80 0.09 0.81 0.37 No Bene-
fi ciation 100.0 47.6 100.0 6.84 M2 2." 4.18 0.10 0.42 0.30
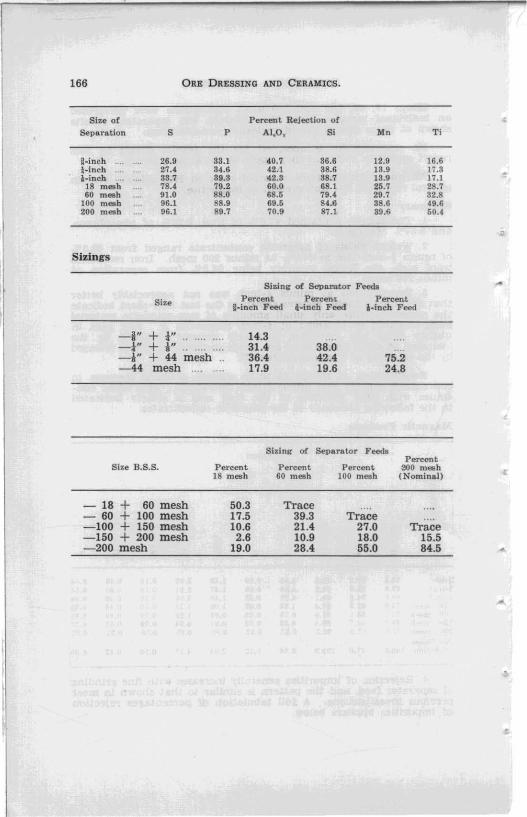
4. Rejection of impurities generally increases with fine grinding of separator feed, and the pattern is similar to that shown in most previous investigations. A full tabulation of percentages rejection of impurities appears below.
166 ORE DRESSING AND CERAMICS.
Size of Percent Rejection of • Separa.tion S P AJ.O. Si Mn Ti
a-inch 26.9 33.1 01 0.7 36.6 12.9 16.6 J.ineh 27.4 34.6 42.1 38.6 13.9 17.S l - in ch 33.7 39.S "'2.3 38.7 13.9 17.1
18 mesh 78.4 79.2 60.0 68.1 25.7 28.7 60 mesh 91.0 88.0 68.6 79.4 29.7 32.8
100 meeh 96.1 88.9 6Ui .... 38.6 49.6 200 mesh 96.1 89.7 70.9 87.1 89,6 50.4
Sizings
SiZ-ine of Separ.ator Fee<t.
Size Pet'cent Percent Percent I -inch Feed i-'inch Feed i-inch Feed
-I" + i" 14.3 -i" + i" 31.4 38.0 -i" + 44 mesh 36.4 42.4 75.2 - 44 mesh 17.9 19.6 24.8
Sidn" 01. Separator F_
Percent Si:r.e B.S.S. Percent Percent Percent 000 mEJIh • 18 mesh 60 mesh 100 mesh (Nominal)
- 18 + 60 mesh 50.3 Trace - 60 + 100 mesh 17.5 39.3 Trace -100 + 150 mesh 10.6 21.4 27.0 Trace - 150 + 200 mesh 2.6 10.9 18.0 15.5 -200 mesh 19.0 28.4 55.0 84.5
•
, •
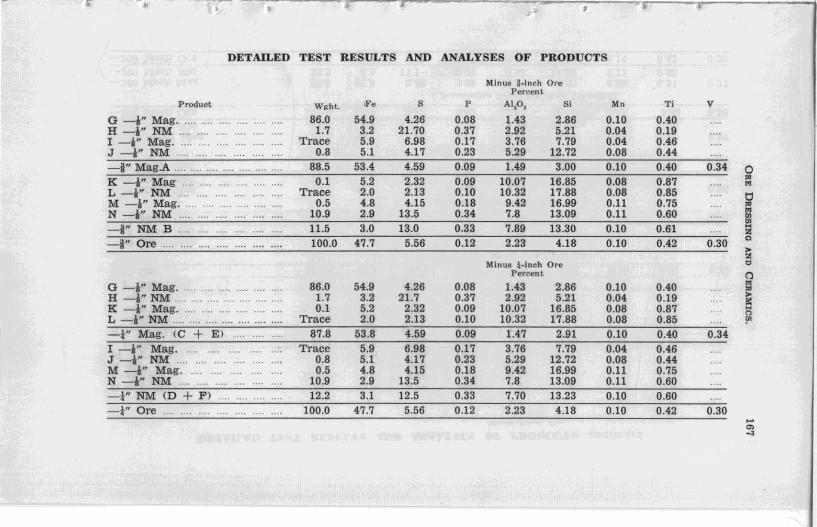
DETAILED TEST RESULTS AND ANALYSES OF PRODUCTS
Minus X-in ch Ore Percent.
P roduct Wght. .'. S P AlsO, Si Mn T i V
G - i " Mag. " 86.0 54.9 4.26 0.08 1.43 2.S6 0.10 0.40 H - i" NM 1.7 3.2 21.70 0.37 2.92 5.21 0.04 0.19
I - ." Mag. Trace 5.9 6.9S 0.17 3.76 7.79 0.04 0.46
J - i" NM O.S 5.1 4.17 0.23 5.29 12.72 0.08 0.44 - I " Mag.A . 88.5 53 .4 4.59 0.09 1.49 3.00 0.10 0.40 0.34 0 K -i" Mag ". 0.1 5.2 2.32 0.09 10.07 16.S5 O.OS 0.87 " .. L -i" NM Trace 2.0 2.13 0.10 10.32 17.88 O.OS 0.85 tj M - -l" Mag . . 0.5 4.S 4.15 0.18 9.42 16.99 0.11 0.75 " N -i" NM 10.9 2.9 13.5 0.34 7.S 13.09 0.11 0.60 ..
g: - i" NM B 11.5 3.0 13.0 0.33 7.89 13.30 0.10 0.61 51 -i" Ore 100.0 47.7 5.56 0.12 2.23 4.18 0.10 0.42 0.30 "
~ Minus t -Inch Ore =
Percent ()
o - i" Mag. 86.0 54.9 4.26 0.08 1.43 2.86 0.10 0.40 .. " H - i"NM 1.7 3.2 21.7 0.37 2.92 5.21 0.04 0.19 >
K - i " Mag . .. 0.1 5.2 2.32 0.09 10.07 16.85 O.OS 0.87 !i " L - i"NM ............................ Trace 2.0 2.13 0.10 10.32 17.8S 0.08 0.S5 !"
-t" Mag. (C + E ) 87.8 53.8 4.59 0.09 1.47 2.91 0.10 0.40 0.34 I -i" Mag. Trace 5.9 6.98 0.17 3.76 7.79 0.04 0.46 J - i" NM 0.8 5.1 4.17 0.23 5.29 12.72 0.08 0.44 M -i" Mag. 0.5 4.8 4.15 0.18 9.42 16.99 0.11 0.75 N -itt NM 10.9 2.9 13.5 0.34 7.8 13.09 0.11 0.60
t " NM <D + F ) 12 .2 3.1 12.5 0.33 7.70 13.23 0.10 0.60 _jo" Ore 100.0 47.7 5.56 0.12 2.23 US 0.10 0.42 0.30
~
0> ->
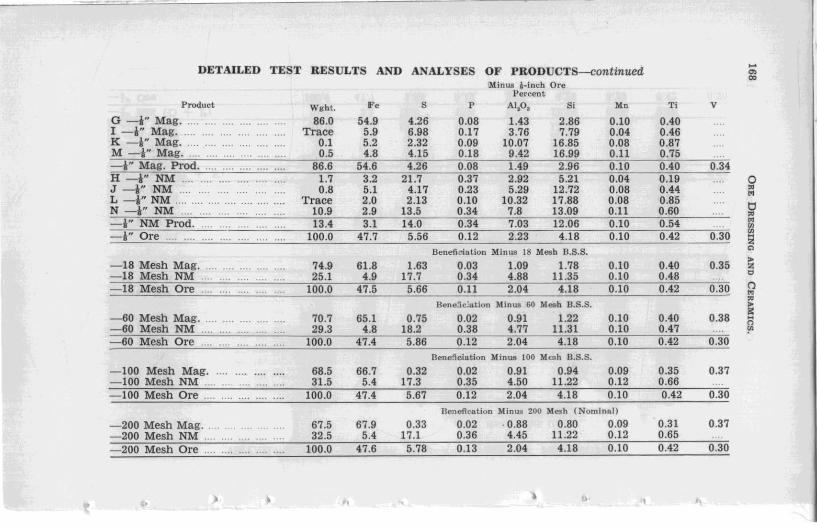
DETAILED TEST RESULTS AND ANALYSES OF PRODUCTS--continued ~
'" co 1.MinUl! i -inch Ore
Percent Produet Wp:ht. Fe 5 P AI,O, 5i Mn Ti V
G -i" Mag . ... 86.0 54.9 4.26 0.08 1.43 2.86 0.10 0.40 I -i" Mag. ,.. Trace 5.9 6.98 0.17 3.76 7.79 0.04 0.46 K -i" Mag. 0.1 5.2 2.32 0.09 10.07 16.85 0.08 0.87 M -i" Mag . . 0.5 4.8 4.15 0.18 9.42 16.99 0.11 0.75
i" Mag. Prod. ,. 86.6 54.6 4.26 0.08 1.49 2.96 0.10 0.40 0.34 H i" NM 1.7 3.2 21.7 0.37 2.92 5.21 0.04 0.19 0 J -in NM 0.8 5.1 4.17 0.23 5.29 12.72 0.08 0.44 ~
~ L -i"NM .............. Trace 2.0 2.13 0.10 10.32 17.88 0.08 0.85
tl N -in NM 10.9 2.9 13.5 0.34 7.8 13.09 0.11 0.60 ~
i" NM Prod. 13.4 3.1 14.0 0.34 7.03 12.06 0.10 0.54 ~
"' i" Ore 100.0 47.7 5.56 0.12 2.23 4.18 0.10 0.42 0.30 "' 51 Benefioiation Minus 18 Mesh B.S.S. "
- 18 Mesh Mag. 74.9 61.8 1.63 0.03 1.09 1.78 0.10 0.40 0.35 > z - 18 Mesh NM 25.1 4.9 17.7 0.34 4.88 11.35 0.10 0.48 =
18 Mesh Ore 100.0 47.5 5.66 0.11 2.04 4.18 0.10 0.42 0.30 (') ~ ~
Bene!'ie:&tion Min WI 60 Mesh B.S.S. ! -60 Mesh Mag. 70.7 65.1 0.75 0.02 0.91 1.22 0.10 0.40 0.38 " -60 Mesh NM 29.3 4.8 18.2 0.38 4.77 11 .31 0.10 0.47 !"
60 Mesh Ore 100.0 47.4 5.86 0.12 2.04 4.18 0.10 0.42 0.30 BeneHciation Minus 100 Malh n.s.s.
- 100 Mesh Mag. 68.5 66.7 0.32 0.02 0.91 0.94 0.09 0.35 0.37 -100 Mesh NM . 31.5 5.4 17.3 0.35 4.50 11.22 0.12 0.66
100 Mesh Ore . 100.0 47.4 5.67 0.12 2.04 4.18 0.10 0.42 0.30 Beneftcation Minus 200 Mesh (Nominal)
-200 Mesh Mag . . 67.5 67.9 0.33 0.02 · 0.88 0.80 0.09 0.31 0.37 - 200 Mesh NM ,.. 32.5 5.4 17.1 0.36 4.45 11.22 0.12 0.65 - 200 Mesh Ore . 100.0 47.6 5.78 0.13 2.04 4.18 0.10 0.42 0.30
) '\ 1 ..
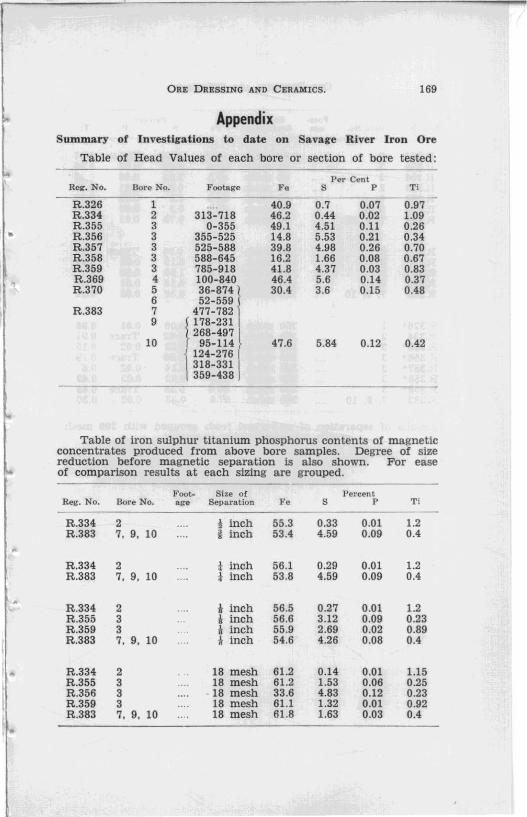
ORE DRESSING AND CERAMICS. 169
Appendix Summary of Investigations to date on Savage River Iron Or.
Table of Head Values of each bore or section of bore tested:
Per Cent Reg. No. Bore No. Footage F. S P Ti
R.326 1 40.9 0.7 0.07 0.97 R.334 2 313-718 46.2 0.44 0.02 1.09 R .355 3 0-355 49.1 4.51 0.11 0.26
• R.356 3 355-525 14.8 5.53 0.21 0.34 R.357 3 525- 588 39.8 4.98 0.26 0.70 R.358 3 588-645 16.2 1.66 0.08 0.67 R.359 3 785-918 41.8 4.37 0.03 0.83 , R.369 4 100-840 46.4 5.6 0.14 0.37
I R.370 5 "-.,, \ 30.4 3.6 0.15 0.48 6 52-559
R.383 7 rom 9 268-497
10 95-114 47.6 5.84 0.12 0.42 124-276 318-331 I 359-438
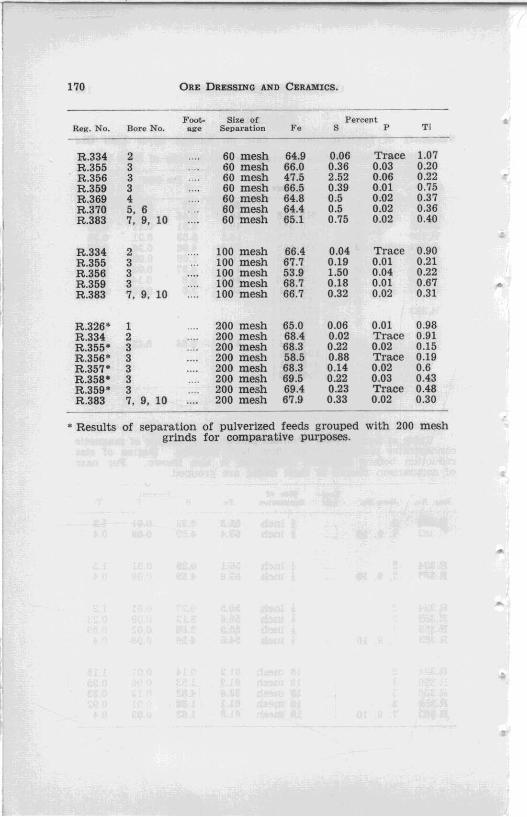
Table of iron sulphur titanium phosphorus contents of magnetic concentrates produced from above bore samples. Degree of size reduction before magnetic separation is also shown. For ease of comparison results at each sizing are grouped.
Foot- Size or Percent Reg. No. I10re No. ••• Separation F. S P T i
R.334 2 i inch 55.3 0.33 0.01 1.2 R.383 7, 9, 10 i inch 53.4 4.59 0.09 0.4
R.334 2 * inch 56.1 0.29 0.01 1.2 R.383 7, 9, 10 i inch 53.8 4.59 0.09 0.4
R.334 2 • inch 56.5 0.27 0.01 1.2 R.355 3 • inch 56.6 3.12 0.09 0.23 R.359 3 1 inch 55.9 2.69 0.02 0.89 R.383 7, 9, 10 * inch 54.6 4.26 0.08 0.4
I . R.334 2 18 mesh 61.2 0.14 0.01 1.15
I R.355 3 18 mesh 61.2 1.53 0.06 0.25 R.356 3 18 mesh 33.6 4.83 0 .12 0.23 R.359 3 18 mesh 61.1 1.32 0.01 0.92
! R.383 7, 9, 10 18 mesh 61.8 1.63 0.03 0.4
170 ORE DRESSING AND CERAMICS.
Foot- Size of Percent • Reg. No. Bore No. a.e Separation Fa S P Ti
R.334 2 60 mesh 64.9 0.06 Trace 1.07 R.355 3 60 mesh 66.0 0.36 0.03 0.20 R.356 3 60 mesh 47.5 2.52 0.06 0.22 R.359 3 60 mesh 66.5 0.39 0.01 0.75 R.369 4 60 mesh 64.8 0.5 0.02 0.37 R.370 5, 6 60 mesh 64.4 0.5 0.02 0.36 R.383 7, 9, 10 60 mesh 65.1 0.75 0.02 0.40
R.334 2 100 mesh 66.4 0.04 Trace 0.90 R.355 3 100 mesh 67.7 0.19 0.01 0.21 R.356 3 100 mesh 53.9 1.50 0.04 0.22 R.359 3 100 mesh 68.7 0.18 0.01 0.67 R.383 7, 9, 10 100 mesh 66.7 0.32 0.02 0.31
R.326' 1 200 mesh 65.0 0.06 0.01 0.98 R.334 2 200 mesh 68.4 0.02 Trace 0.91 R.35S· 3 200 mesh 68.3 0.22 0.02 0.15 R.3S6* 3 200 mesh 58.5 0.88 Trace 0.19 R.357· 3 200 mesh 68.3 0.14 0.02 0.6 R.35S* 3 200 mesh 69.5 0.22 0.03 0.43 R.359' 3 200 mesh 69.4 0.23 Trace 0.48 R.383 7, 9, 10 200 mesh 67.9 0.33 0.02 0.30
• Results of separation of pulverized feeds grouped with 200 mesh grinds for comparative purposes.
&
-