Embed Size (px)
Citation preview

RESEARCH ARTICLE
Orchard layout and plant traits influence fruit
yield more strongly than pollinator behaviour
and density in a dioecious crop
Angela PeaceID1*, David Pattemore2,3, Melissa Broussard2, Dilini Fonseka1,
Nathan Tomer2, Nilsa A. Bosque-Perez4, David Crowder5, Allison K. Shaw6,
Linley Jesson7, Brad G. Howlett8, Mateusz JochymID2, Jing Li9
1 Department of Mathematics and Statistics, Texas Tech University, Lubbock, TX, United States of America,
2 The New Zealand Institute for Plant and Food Research, Hamilton, New Zealand, 3 School of Biological
Sciences, University of Auckland, Auckland, New Zealand, 4 Department of Entomology, Plant Pathology and
Nematology, University of Idaho, Moscow, ID, United States of America, 5 Department of Entomology,
Washington State University, Pullman, WA, United States of America, 6 Department of Ecology, Evolution
and Behavior, University of Minnesota, St. Paul, MN, United States of America, 7 The New Zealand Institute
for Plant and Food Research, Havelock North, New Zealand, 8 The New Zealand Institute for Plant and Food
Research, Lincoln, New Zealand, 9 Department of Mathematics, California State University Northridge,
Northridge, CA, United States of America
Abstract
Mutualistic plant-pollinator interactions are critical for the functioning of both non-managed
and agricultural systems. Mathematical models of plant-pollinator interactions can help
understand key determinants in pollination success. However, most previous models have
not addressed pollinator behavior and plant biology combined. Information generated from
such a model can inform optimal design of crop orchards and effective utilization of man-
aged pollinators like western honey bees (Apis mellifera), and help generate hypotheses
about the effects of management practices and cultivar selection. We expect that the num-
ber of honey bees per flower and male to female flower ratio will influence fruit yield. To test
the relative importance of these effects, both singly and simultaneously, we utilized a delay
differential equation model combined with Latin hypercube sampling for sensitivity analysis.
Empirical data obtained from historical records and collected in kiwifruit (Actinidia chinensis)
orchards in New Zealand were used to parameterize the model. We found that, at realistic
bee densities, the optimal orchard had 65-75% female flowers, and the most benefit was
gained from the first 6-8 bees/1000 flowers, with diminishing returns thereafter. While bee
density significantly impacted fruit production, plant-based parameters-flower density and
male:female flower ratio-were the most influential. The predictive model provides strategies
for improving crop management, such as choosing cultivars which have their peak bloom on
the same day, increasing the number of flowers with approximately 70% female flowers in
the orchard, and placing enough hives to maintain more than 6 bees per 1000 flowers to
optimize yield.
PLOS ONE
PLOS ONE | https://doi.org/10.1371/journal.pone.0231120 October 23, 2020 1 / 21
a1111111111
a1111111111
a1111111111
a1111111111
a1111111111
OPEN ACCESS
Citation: Peace A, Pattemore D, Broussard M,
Fonseka D, Tomer N, Bosque-Perez NA, et al.
(2020) Orchard layout and plant traits influence
fruit yield more strongly than pollinator behaviour
and density in a dioecious crop. PLoS ONE 15(10):
e0231120. https://doi.org/10.1371/journal.
pone.0231120
Editor: Adrian G Dyer, RMIT University,
AUSTRALIA
Received: March 13, 2020
Accepted: October 7, 2020
Published: October 23, 2020
Peer Review History: PLOS recognizes the
benefits of transparency in the peer review
process; therefore, we enable the publication of
all of the content of peer review and author
responses alongside final, published articles. The
editorial history of this article is available here:
https://doi.org/10.1371/journal.pone.0231120
Copyright: © 2020 Peace et al. This is an open
access article distributed under the terms of the
Creative Commons Attribution License, which
permits unrestricted use, distribution, and
reproduction in any medium, provided the original
author and source are credited.
Data Availability Statement: All relevant data are
within the manuscript and its Supporting
Information files.
Introduction
Mutualistic plant-pollinator interactions play a vital role in plant reproduction in both natural
systems and managed (i.e. agricultural) systems. Animal-mediated pollination is important for
87.5% of angiosperms globally [1], and 75% of the most important crop species benefit signifi-
cantly from this service [2], providing greater than US$170 billion in economic value annually
[3]. Functionally dioecious plants are especially reliant on pollination, as pollinators must cross
from one plant to another. Even in well-studied systems, such as kiwifruit (Actinidia chinensis),the complexity of interacting variables limits the ability of researchers to provide clear recom-
mendations to growers, with proposed stocking rates varying from 3-8 colonies per ha [4].
Mathematical modeling of plant-pollinator interactions can help understand key determi-
nants in pollination success [5]. Such approaches could be valuable tools for designing optimal
crop orchard layouts and for the effective use of managed pollinators in agricultural systems.
This may be especially important in dioecious crops that have separate male and female plants
which adds further complexity in conducting empirical field trials when these plants respond
differently to environmental variables.
In spite of this, pollination models have tended to focus on plant biology [6–9] or insect
behavior [10, 11] but few have examined both simultaneously [12, 13]. Including variables
such as flower phenology, the ratio of male to female flowers, pollinator abundance, and flower
handling behavior could assist in the generation of robust models. Combining information
from both pollinators and plants in the same framework more realistically represents field con-
ditions and enables us to directly compare their importance. A significant challenge in devel-
oping good models is sufficient data for parameterization.
We chose kiwifruit as our model dioecious crop system as there are four decades of empiri-
cal data, examining many aspects of both insect behavior and plant biology [14]. Kiwifruit is a
deciduous vine, with male and female flowers borne on separate plants [15]. Neither sex pro-
duces nectar, and the female flowers produce inviable pollen [15], which is high in lipids [16],
to attract pollinators instead. Plants are typically trained onto a pergola system, with male
vines interplanted amongst a larger number of female vines at a 1:3 to 1:8 ratio [4, 17].
Although male cultivars typically have 2-3x more flowers than female cultivars [18], grower
planting and pruning regimes ultimately determine the floral sex ratio in orchards. While kiwi-
fruit have a number of pollinating species in their native range [19–21], most growing regions
rely on honey bees for pollination, representing the vast majority of all flower visitors in the
United States [22], France [23], Australia [24], and New Zealand [25, 26].
We expected that male-female kiwifruit flower ratio and pollinator density will influence
fruit yield, along with various parameters of pollinator behavior. To test the relative impor-
tance of these effects, both singly and simultaneously, we used a system of delay differential
equations (DDEs) combined with Latin hypercube sampling for parameter sensitivity analysis
[27]. The model explicitly tracks pollinators (parameterized here based on data from honey
bees), with varying pollen loads as they preferentially visit male and female flowers, as well as
the current number of open flowers over time. The delays incorporated into this model take
into account the lifespan of open flowers, as male and female flowers open and close through-
out the blooming period.
Materials and methods
Model development
We develop and analyze a mathematical model of pollination dynamics that incorporates key
aspects of both plant biology and insect behaviors. First, we present a sub-model of the
PLOS ONE Modeling plant-pollinator interactions to predict fruit yield
PLOS ONE | https://doi.org/10.1371/journal.pone.0231120 October 23, 2020 2 / 21
Funding: This work was supported by Plant &
Food Research Discovery Science grant DS 14-65.
The funders had no role in study design, data
collection and analysis, decision to publish, or
preparation of the manuscript.
Competing interests: The authors have declared
that no competing interests exist.

flowering dynamics in an orchard, then in the following section, we add the pollinator dynam-
ics. We assume homogeneous conditions across the field for both flower and pollinator densi-
ties. Table 1 describes the model state variables and parameters.
Flowering dynamics. We consider a kiwifruit orchard made up of male and female trees
and model the opening and closing of flowers throughout the bloom. To capture pollination
dynamics, it is important to know how many male and female flowers are open at any given
day. Here, we assume that the total number of flower buds in the field is fixed and the rate they
open follows a normal distribution. Let Bm and Bf denote the total number of male and female
flower buds. Initially all flower buds are closed. Let M and F denote the number of male and
female flowers that have opened. The rates that these flowers open is modeled as
dMdt
¼Bmffiffiffiffiffiffiffiffiffiffiffi2ps2
m
p e�
ðt � tmÞ2
2s2m
ð1aÞ
dFdt¼
Bfffiffiffiffiffiffiffiffiffiffi2ps2
f
q e�
ðt � tf Þ2
2s2f ð1bÞ
Table 1. Description of model state variables and parameters.
Flower dynamics
Variable Meaning
m(t) number of open male flowers at time tf(t) number of open female flowers at time t
Parameter Meaning
Bm number of male buds
Bf number of female buds
tm peak day of male flower opening rate
tf peak day of female flower opening rate
σm spread of male flowering period
σf spread of female flower period
τm life span of male flowering
τf life span of female flowering
Pollinator dynamics
Variable Meaning
Pm1 pollinators with high pollen loads
Pm2 pollinators with medium pollen loads
Pm3 pollinators with low pollen loads
Pf pollinators carrying no pollen
Parameter Meaning
ρ pollinators per 1000 flowers
α search rate
β handling time
δ preference to remain on male flowers
ε preference to remain on female flowers
p1 percent chance to set fruit from single type one visit
p2 percent chance to set fruit from single type two visit
p3 percent chance to set fruit from single type three visit
https://doi.org/10.1371/journal.pone.0231120.t001
PLOS ONE Modeling plant-pollinator interactions to predict fruit yield
PLOS ONE | https://doi.org/10.1371/journal.pone.0231120 October 23, 2020 3 / 21

where tm and tf are the times when the opening rates are highest and σm and σf are the varia-
tions in these rates of opening. We assume that each flower is only open for a fixed amount of
time. Male flowers are open for τm days and female flowers remain open for τf days. While Mand F denote the total number of male and female flowers that have opened, the number of
currently opened flowers changes, as flowers close. Let m and f denote the number of male and
female flowers that are currently open, which can be determined with the following expres-
sions:
mðtÞ ¼
(MðtÞ � Mðt � tmÞ if t > tm
MðtÞ elsewhereð2aÞ
f ðtÞ ¼
( FðtÞ � Fðt � tf Þ if t > tf
FðtÞ elsewhere:ð2bÞ
Example simulated dynamics of open flowers over time are depicted in Fig 1. Here, we
chose and varied some parameter’s values to highlight the role they have in shaping the curve
describing flowering dynamics.
Pollinator dynamics. Pollinator dynamics are modeled with differential equations that
divide the population into subcompartments based on their pollen load. Pollinators can have a
high, medium, or low pollen load (denoted as Pm1, Pm2, and Pm3 respectively) or be carrying
no pollen (denoted at Pf). These states represent a division of empirical data on single-visit
deposition, which often follows an exponential [28] or steeper than exponential decay [29].
We assume that pollinators completely load up on pollen with a visit to a male flower and
deposit some pollen with a visit to a female flower. We assume that male pollen availability is
not limiting in this scenario; to partially compensate for this short-coming of the model we
limit active foraging to four hours per day as captured by the visitation rate, corresponding to
field observations [30]. This four-hour window of pollen-foraging activity limits the total
amount of pollination in a day (built into the visitation rate parameter). Within this window,
pollen availability is typically not a limiting factor in kiwifruit due to male flowers having up to
twice as many pollen grains than female flowers, and the anthers continued to dehisce over
this four-hour period. A diagram depicting the movement of pollinators between the compart-
ments is shown in Fig 2. A pollinator with a high pollen load can move between compartments
Pm1, Pm2, Pm3, and Pf with subsequence visits to female flowers. Regardless of current pollen
loads, whenever a pollinator visits a male flower it completely loads up on pollen and enters
the Pm1 compartment.
The rate that pollinators visit male and female flowers is a crucial part of the model dynam-
ics. We consider a pollinator visitation rate that depends on the search rate (α), the handling
time (β) and the densities of open male (m) and female (f) flowers, as described above in Eq
(2). For pollinator visitation rates, previous work suggests that saturating functions of flower
densities such as Holling type II functional responses are typical of oligolectic consumers that
use only a few plant species and Holling type III responses are typical of generalist consumers
that switch between hosts [6]. While honeybees are generalist, here we use a Holling type II
response because of the mono-culture orchard environment in the model. Following previous
studies [6, 31, 32] we defined the total pollinator visitation rate as:
Total pollinator visitation rate ¼aðf þmÞ
1þ abðf þmÞð3Þ
which has the units of per time. This visitation rate includes visits to both male and female
PLOS ONE Modeling plant-pollinator interactions to predict fruit yield
PLOS ONE | https://doi.org/10.1371/journal.pone.0231120 October 23, 2020 4 / 21
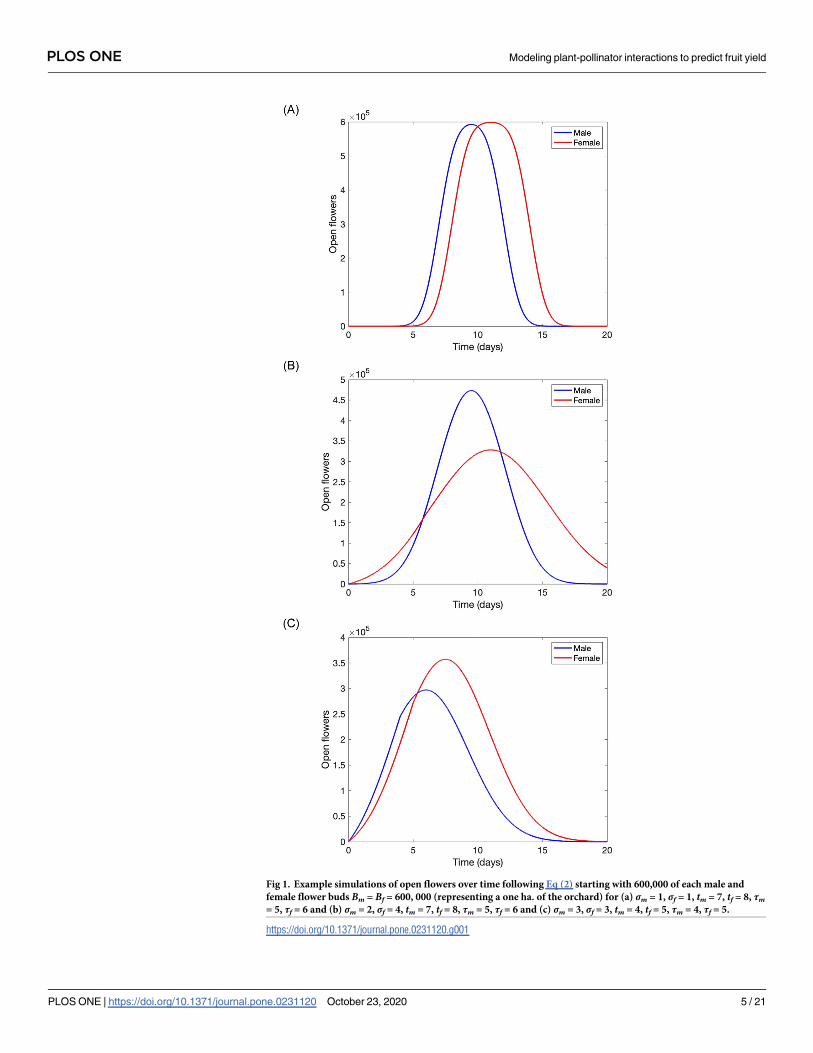
Fig 1. Example simulations of open flowers over time following Eq (2) starting with 600,000 of each male and
female flower buds Bm = Bf = 600, 000 (representing a one ha. of the orchard) for (a) σm = 1, σf = 1, tm = 7, tf = 8, τm= 5, τf = 6 and (b) σm = 2, σf = 4, tm = 7, tf = 8, τm = 5, τf = 6 and (c) σm = 3, σf = 3, tm = 4, tf = 5, τm = 4, τf = 5.
https://doi.org/10.1371/journal.pone.0231120.g001
PLOS ONE Modeling plant-pollinator interactions to predict fruit yield
PLOS ONE | https://doi.org/10.1371/journal.pone.0231120 October 23, 2020 5 / 21

flowers. The movement of pollinators between male and female flowers depends on the pro-
portion of male vs female flowers, as well as pollinator preferences. Previous studies suggest
that honey bees have a preference to visits flowers of the same sex as the one they are currently
on [22, 24, 33, 34]. We define the preference parameter δ such that a pollinator on a male
flower can preferentially choose to next visit another male flower (0 < δ< 1). Similarly, we
define the preference parameter � such that a pollinator on a female flower preferentially next
visits another female flower (0 < � < 1). Pollinators have no preference if δ = � = 1. We used
these preference parameters to define functional forms representing the probability of a polli-
nator to visit each type of flower, following the method used in [35]. These probabilities
depend on the ratio of male to female flowers raised to the power of the preference, such that
the movement of pollinators between flowers can be written as the following expressions:
mf þm
� �d
fraction on male flowers that move to a male flower ð4aÞ
1 �m
f þm
� �d
fraction on male flowers that move to a female flower ð4bÞ
ff þm
� �ε
fraction on female flowers that move to a female flower ð4cÞ
1 �f
f þm
� �ε
fraction on female flowers that move to a male flower ð4dÞ
Fig 3 shows plots of the probabilities of pollinators that will switch the type of flower
they are on verses the proportion of female flowers in the orchard, for various preferences
parameters.
Fig 2. Model flow diagram of pollinator types. Solid lines depict visits to a male flower. Dashed lines depict visits to a female flower.
https://doi.org/10.1371/journal.pone.0231120.g002
PLOS ONE Modeling plant-pollinator interactions to predict fruit yield
PLOS ONE | https://doi.org/10.1371/journal.pone.0231120 October 23, 2020 6 / 21

Fig 3. Movement probabilities for (a) pollinators on male flowers switching to a female flower and (b) pollinators
on female flowers switching to a male flower for strong, weak, and no preferences in paramters δ and �. Values for
strong preferences were used for the analyses in this paper, details are described in the Parameterization section. Note
that a strong preference for remaining on the same type of flower corresponds with a low probability of switching
between flower types.
https://doi.org/10.1371/journal.pone.0231120.g003
PLOS ONE Modeling plant-pollinator interactions to predict fruit yield
PLOS ONE | https://doi.org/10.1371/journal.pone.0231120 October 23, 2020 7 / 21

Full pollinator-flower model. The complete pollinator-flower model are described with
the following system of differential equations:
dPm1
dt¼
aðf þmÞ1þ abðf þmÞ
� �
|fflfflfflfflfflfflfflfflfflfflfflfflfflffl{zfflfflfflfflfflfflfflfflfflfflfflfflfflffl}Total visitation rate
1 �f
f þm
� �ε� �
ðPm2 þ Pm3 þ Pf Þ
|fflfflfflfflfflfflfflfflfflfflfflfflfflfflfflfflfflfflfflfflfflfflfflfflfflfflfflfflfflffl{zfflfflfflfflfflfflfflfflfflfflfflfflfflfflfflfflfflfflfflfflfflfflfflfflfflfflfflfflfflffl}moves from female to male
� 1 �m
f þm
� �d !
Pm1
|fflfflfflfflfflfflfflfflfflfflfflfflfflfflfflfflfflffl{zfflfflfflfflfflfflfflfflfflfflfflfflfflfflfflfflfflffl}moves from male to female
2
6664
3
7775ð5aÞ
dPm2
dt¼
aðf þmÞ1þ abðf þmÞ
� �
|fflfflfflfflfflfflfflfflfflfflfflfflfflffl{zfflfflfflfflfflfflfflfflfflfflfflfflfflffl}Total visitation rate
1 �m
f þm
� �d !
Pm1
|fflfflfflfflfflfflfflfflfflfflfflfflfflfflfflfflfflffl{zfflfflfflfflfflfflfflfflfflfflfflfflfflfflfflfflfflffl}moves from male to female
� 1 �f
f þm
� �ε� �
Pm2
|fflfflfflfflfflfflfflfflfflfflfflfflfflfflfflfflffl{zfflfflfflfflfflfflfflfflfflfflfflfflfflfflfflfflffl}moves from female to male
�f
f þm
� �ε
Pm2
|fflfflfflfflfflfflfflfflfflffl{zfflfflfflfflfflfflfflfflfflffl}moves from female to female
2
6664
3
7775ð5bÞ
dPm3
dt¼
aðf þmÞ1þ abðf þmÞ
� �
|fflfflfflfflfflfflfflfflfflfflfflfflfflffl{zfflfflfflfflfflfflfflfflfflfflfflfflfflffl}Total visitation rate
ff þm
� �ε
Pm2
|fflfflfflfflfflfflfflfflfflffl{zfflfflfflfflfflfflfflfflfflffl}moves from female to female
� 1 �f
f þm
� �ε� �
Pm3
|fflfflfflfflfflfflfflfflfflfflfflfflfflfflfflfflffl{zfflfflfflfflfflfflfflfflfflfflfflfflfflfflfflfflffl}moves from female to male
�f
f þm
� �ε
Pm3
|fflfflfflfflfflfflfflfflfflffl{zfflfflfflfflfflfflfflfflfflffl}moves from female to female
2
6664
3
7775ð5cÞ
dPf
dt¼
aðf þmÞ1þ abðf þmÞ
� �
|fflfflfflfflfflfflfflfflfflfflfflfflfflffl{zfflfflfflfflfflfflfflfflfflfflfflfflfflffl}Total visitation rate
ff þm
� �ε
Pm3
|fflfflfflfflfflfflfflfflfflffl{zfflfflfflfflfflfflfflfflfflffl}moves from female to female
� 1 �f
f þm
� �ε� �
Pf
|fflfflfflfflfflfflfflfflfflfflfflfflfflfflfflffl{zfflfflfflfflfflfflfflfflfflfflfflfflfflfflfflffl}moves from female to male
2
6664
3
7775:ð5dÞ
The incorporation of flowering dynamics given in Eq (2) into the system of differential
equations for the pollinators model (5) results in a system of ordinary differential equations
when t�min{τm, τf}, before any open flowers begin to close, followed by a system of delay dif-
ferential equations with a single delay τ = min{τm, τf} when min{τm, τf}�t�max{τm, τf}, and
then by a system of delay differential equations with two fixed delays, τm and τf. This model
tracks the number of open male and female flowers (m, f) and the number of pollinators of
each type (Pm1, Pm2, Pm3, Pf) as they visit male and female flowers.
Pollination measurement. The total number of visits to female flowers is an important
factor for pollination. Visits to female flowers from the different classes of bees represent dif-
ferent pollen depositions needed to determine success of fruitset.
We define the visits of pollinators to female flowers that result in pollen deposition as either
type one, two, or three, as depicted in Fig 2. We then define fruit set for a day t denoted by P(t)as
PðtÞ ¼ 1 � ð1 � p1Þv1ðtÞ � ð1 � p2Þ
v2ðtÞ � ð1 � p3Þv3ðtÞ ð6Þ
where vn(t) for n = 1, 2, 3 represents the total number of type n visits that each flower has
received at the time of closing (day t), and pn represents the percent chance that a single visit
will fully pollinate a flower to set fruit, for each visit type n. The total predicted yield is the fruit
set for each day multiplied by the number of female flowers closing on that day, summed over
all the days,
The total predicted yield ¼X
t
DFCðtÞ � PðtÞ: ð7Þ
where DFC(t) denotes the daily number of female flowers closing at day t. The total predicted
PLOS ONE Modeling plant-pollinator interactions to predict fruit yield
PLOS ONE | https://doi.org/10.1371/journal.pone.0231120 October 23, 2020 8 / 21

yield proportion over all days is the number of flowers closing on each day multiplied by the
fruit set for that day divided by the total number of female flowers, in our calculation we use
the number of total female flower buds,
The total predicted yield proportion ¼P
tDFCðtÞ � PðtÞBf
: ð8Þ
Parameterization
All model parameters are listed in Table 2. In order to parameterize the visitation rate Eq (3)
we assume the pollinators are active in the field for only 4 hours per day. For the search rate αwe assume a pollinator encounters 2 flowers per min, or 480 visits per day, assuming they for-
age only 4 hours a day. For the handling time β it has been observed that the average time a
pollinator spends on a flower is 16 sec, or 0.0011 days [36]. We use an odds ratio to parameter-
ize the preference parameters, δ and �.
Experimental observations on pollinator behaviors in environments with equal density of
male and female flowers (1:1 ratio, which is typical across planting regimes even when the
ratio of male to female plants differs, due to flower pruning practices) reveal that pollinators
on male flowers have a 0.957 probability of remaining on male flowers and those on female
flowers have a 0.951 probability remaining on female flowers [14, 24, 34]. This information
was used to help parameterize the preference parameters. Following the experimental condi-
tions, we assume an equal density of male and female flowers and take δ = ln(0.957)/ln(0.5)
and � = ln(0.951)/ln(0.5). It is important to note, that while these preference parameters are
constant, the probability of switching from flower types depends on these preferences, as well
as the open number of male and female flowers, see Eq 4 and Fig 3.
Once flowers begin to open, the peak day for flower openings occurs between days 2 and 9
[24, 37, 38] and we assume tm = 6 and tf = 6 days. Flowers remain open for 3–7 days [30] and
we assume base values of 5 for τm and 4 for τf. Observed pollinator densities range from 0.2 –
20 per 1000 flowers [30], and we assume a baseline value of ρ = 6 pollinators. We assume the
Table 2. Model parameters, base values and ranges used in simulations.
Parameter Meaning Units Base value Range References
α search rate 1/(day×flower) 480 120—3600 [14]
β handling time days 0.0011 0.00013– 0.0094 [22, 23, 36, 39]
δ preference to remain on male flowers – 0.0634 0–1 [14, 22, 24, 33, 34]
ε preference to remain on female flowers – 0.0725 0 –1 [14, 22]
Bm number of male buds flower 600000 300000–900000 [18, 37]
Bf number of female buds flower 600000 300000–900000 [37]
tm peak day of male flower opening rate day 6 2—9 [24, 37, 38, 40]
tf peak day of female flower opening rate day 6 2—9 [24, 37, 38, 40]
σm spread of male flowering period 2.5 0.5–5.5 [24, 37, 38]
σf spread of female flower period 2 1–4 [24, 37, 38]
τm life span of male flowering day 4 3–5 [30]
τf life span of female flower day 5 3–7 [34, 41, 42]
ρ pollinators per 1000 flowers pollinators/flower 6 1—20 [18, 30]
p1 percent chance to set fruit from single type one visit 0.66 0.25– 0.75 [14]
p2 percent chance to set fruit from single type two visit 0.55 0.1– 0.65 [14]
p3 percent chance to set fruit from single type three visit 0.22 0– 0.5 [14]
https://doi.org/10.1371/journal.pone.0231120.t002
PLOS ONE Modeling plant-pollinator interactions to predict fruit yield
PLOS ONE | https://doi.org/10.1371/journal.pone.0231120 October 23, 2020 9 / 21

percent chance that a single type one visit (transitions a pollinator from group Pm1 to group
Pm2) will fully pollinate a flower to set fruit is p1 = 66%. A single type two visit (transitions
from Pm2 to Pm3) will fully pollinate a flower with assumed p2 = 55% and a single type three
visit (transitions from Pm3 to Pf) will fully pollinate a flower with assumed p2 = 22% [14]. For
the total number of flowers we assume the number of flower buds follows Bm = Bf = 600, 000
per ha.
Model simulations
All simulations were conducted using Matlab’s differential equations solvers ode45 and dde23
with initial conditions such that 0% of pollinators were Pm1, Pm2, and Pm3, and 100% of polli-
nators were Pf at time t = 0 for an orchard of sample size of 1 ha. Parameter values for the
total number of flower buds Bm (male) and Bf (female) along with the number of pollinators
per 1000 female flowers ρ are used to determine the total number of pollinators for each
simulation.
Base simulations testing model behaviors. Model simulations for the set of baseline val-
ues given in Table 2 are shown in Fig 4. Pollinators of type Pm1 and Pf fluctuate during the
blooming period while the number of pollinators of types Pm2 and Pm3 remain low (Fig 4a).
The accumulated number of visits to female flowers at the time of closing is almost identical
across visit types (Fig 4e), and is driven by the number of open female and male flowers, since
the number of pollinators is fixed. Our model output measure (total predicted yield) is shown
in Fig 4f. As expected, type one visits have the highest fruit set rate while type three visits have
the lowest fruit set rate, even though the total number of these visits are similar (Fig 4f). The
results in Fig 4(f) multiplied by the daily number of female flowers closing yields the daily pre-
dicted yield. Then the summation of this yield returns the main output for our model; the total
predicted yield (see Eq (7)). Under these baselines values total predicted yield is 545,120 fruit /
ha with a predicted fruitset of 90%. This is on the high end of reported fruit set in “Hayward”
orchards (c.f. 80% in Gonzales et al. 1998 [43]), but matches the experience of the authors in
field trials where fruit set is measured before harvest and thus is a higher figure than fruit set
calculated for yield (Pattemore D pers. obs., Broussard M pers. obs.). Accordingly, the fruit
number per hectare is higher than the 200,000—300,000 often reported in the literature [44–
46], but again is within the range of possible outcomes.
Simulations exploring model outputs. We varied key model input parameters and inves-
tigated model predictions with numerical simulations and sensitivity analysis. Model parame-
ters are presented in Table 2. A major model output measure is the predicted yield, which is
defined as the number of female flowers per ha that became fully pollinated fruit. A second
important model output is the percentage of female flowers that became fully pollinated fruit,
defined here as the fruit set. We used numerical simulations to explore variations in flowering
dynamics including the percentage of buds that are female and shifts in the duration of time
when male and female flowers are both opened (by varying the peak date in male flower open-
ing rate). We also explored variations in pollinators dynamics including bee densities, prefer-
ence parameters and pollinator handling time.
Parameter sensitivity analysis. In order to better assess the predictions of our model we
investigate the uncertainty of the estimated parameter values using Latin Hypercube Sampling
(LHS) with the statistical Partial Rank Correlation Coefficient (PRCC) technique, which pro-
vides a global parameter sensitivity analysis. LHS is a stratified Monte Carlo sampling method
without replacement giving a global and unbiased selection of parameter values [27]. The
PRCC technique is used to assess the importance of each parameter for a given output mea-
sure. It is appropriate when the parameters have a nonlinear and monotonic relationship with
PLOS ONE Modeling plant-pollinator interactions to predict fruit yield
PLOS ONE | https://doi.org/10.1371/journal.pone.0231120 October 23, 2020 10 / 21

Fig 4. Model simulations presenting (a) number of pollinators during the bloom period, (b) accumulated number of transitional visits of
different types, (c) number of open male and female flower during the bloom period, (d) daily number of transitional visits of different
types, (e) daily number of transitional visits of different types per female flower at the time of closing, (f) predicted number of fully
pollinated fruit for each type visit and all visits for female flowers at the time of closing. All parameter values are base values in Table 2 with
initial conditions that pollinators haven’t collected any pollen yet (i.e., Pm1 = Pm2 = Pm3 = 0 and Pf = ρ�Bf/1000).
https://doi.org/10.1371/journal.pone.0231120.g004
PLOS ONE Modeling plant-pollinator interactions to predict fruit yield
PLOS ONE | https://doi.org/10.1371/journal.pone.0231120 October 23, 2020 11 / 21

the output measures. Using a model orchard of 1 ha we used LHS to sample the parameters
listed in Table 2 and used PRCC to investigate the output measure of the total predicted fully
pollinated fruit per hectare (yield). Following Marino et al. 2008 [27] we performed a z-test on
the resulting PRCC values and verified that, in general, higher magnitude PRCC values corre-
spond with a stronger influence on the output measure. Most of the parameters had nonlinear
and monotonic relationships to the total predicted yield. Additional investigation on parame-
ter values that were nonmonotonic was done by truncating the parameter space to monotonic
regions, details are presented in the appendix.
Results
To investigate the role of key plant parameters we varied the ratio of male to female flowers in
the orchard by fixing the total number of flowers and varying the percentage of flowers that
are female, all other parameters were set to their base values shown in Table 2. Increasing the
fraction of flowers that are female (versus male) per hectare first increases the total predicted
yield (fruit per hectare), peaking near 0.66, and then decreasing rapidly as female flowers make
up the majority of the orchard (Fig 5). When the fraction of female flowers per hectare is low,
nearly all female flowers produce fruit: predicted fruitset reaches above 97%. However, the
total yield (fruit produced) is low due to the low quantity of female flower buds. On the other
hand, when most flowers are female, predicted fruitset decreases to 20% along with an associ-
ated decline in yield. This is due to the fact that while the quantity of female flowers is high,
the quantity of male flowers is low and the chances of successful pollination decreases
Fig 5. Total predicted yield (fruit per ha) as a function of the percentage of buds that are female. The total number
of buds was kept constant at 1.2 million/ha and the fraction of female flowers varied. Other parameters are baseline
values in Table 2. The fruitset (percentage of open female flowers that achieved full pollination) is listed under each
data point.
https://doi.org/10.1371/journal.pone.0231120.g005
PLOS ONE Modeling plant-pollinator interactions to predict fruit yield
PLOS ONE | https://doi.org/10.1371/journal.pone.0231120 October 23, 2020 12 / 21

substantially. The model predicts a maximum fruit yield when female flowers make up two
thirds of the field with a fruitset (percent of open flowers that achieved successful pollination)
of 78.3%.
Other key plant parameters influence the timing of when male and female flowers are open
and receptive. Pruning and the use of chemical bioregulators are typically used to control the
onset and duration of flowering by growers [47]. Over a longer time frame, cultivar selection
can be used to ensure adequate overlap of male and female flowering across a range of environ-
mental conditions. The model assumes the rate that flowers open follow normal distributions
with key parameters specifying the peak day of flower openings for both the male (tm) and
female (tf) distributions. Varying the peak day that male and female flowers open influences
the duration of time with both types of flowers open simultaneously as well as the number of
flowers open during these times (Fig 6a). In particular, differences between tm and tf shifts
these distributions and affects the overlapping time when both flower types are open. In Fig 6
we hold tf = 6 days constant and vary the peak day of male flowers opening from tm = 3–9
days. Predicted yield is maximized (with associated fruit set rates above 91%) when both flower
types open concurrently with the same peak opening day (Fig 6b). While shifting the peaks a
day apart does not have a huge influence on the predicted yield, a shift of two or three days has
significant consequences.
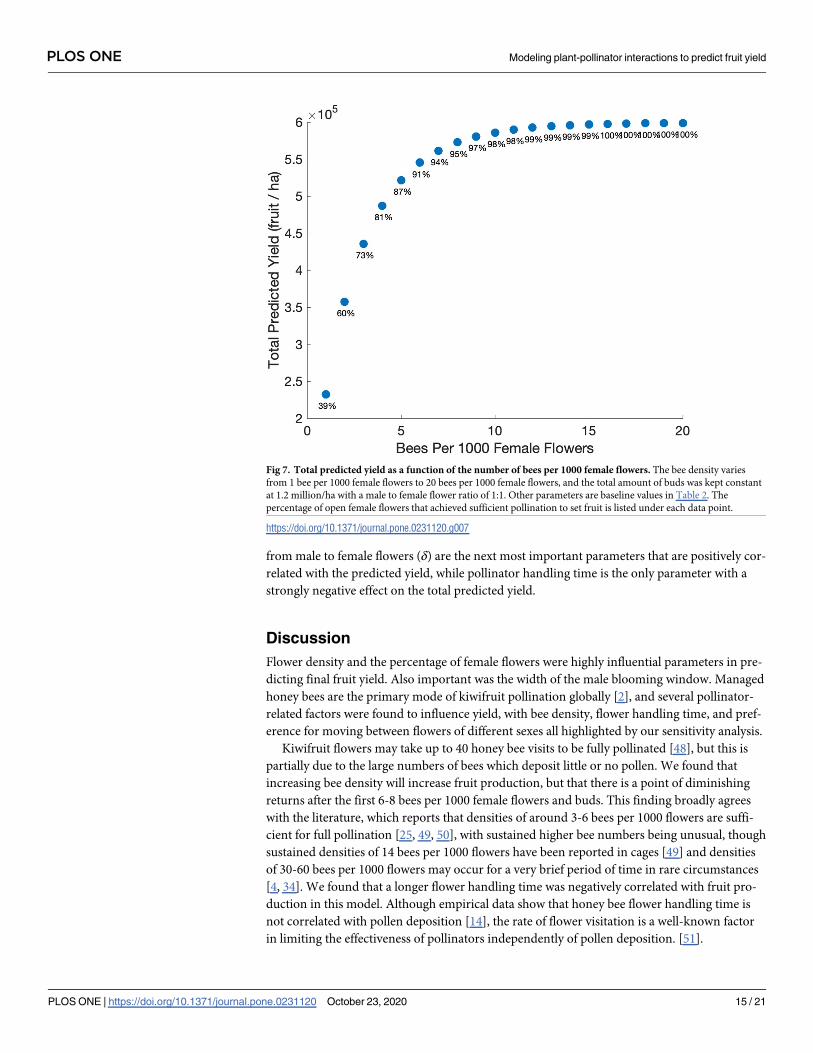
To investigate the role of key pollinator parameters, we varied pollinator density based on
data on observed honey bee densities. The total predicted yield increases rapidly as the number
of bees increases from one to six bees per 1000 female flowers (Fig 7). Here fruit set also
increases from 39% with only one bee per 1000 female flowers to over 90% with six bees per
1000 female flowers. While continuing to increase the number of bees does increase fruit set
rate and the total predicted yield, the increase slows down substantially above six bees per 1000
female flowers.
Pollinator behavior parameters also play important roles in the model. The model includes
preference parameters for pollinators to remain on the type of flower they are visiting, based
again on data from honey bee observations. For the baseline values, a pollinator on a male
flower preferentially chooses to visit a male flower next (δ), likewise a pollinator on a female
flower preferentially chooses to visit a female flower next (�). Total predicted yield increases as
the pollinators increasingly prefer to switch between male and female flowers in sequential vis-
its (Fig 8a). The yield increases substantially when preference for switching is very small and
saturates quickly after. The drastic increase in yield begins to plateau close to the baseline
parameter values for the preferences, � and δ (dashed lines in Fig 8a). It is important to note
that Fig 8a explores variations in preference parameters for a constant male to female flower
ratio. The actual probabilities of moving between types of flowers is described in Eq (4) and
variations in preference parameters are depicted in Fig 3 across different orchard conditions.
Another relevant pollinator behavior is the speed of foraging. Our model includes two
parameters for this: the handling time and search rate. Our analyses indicate that of these two,
the handling time is the most influential; the total predicted yield decreases quickly as the polli-
nators’ handling time increases (Fig 8b). When the handling time increases from 10 sec to 60
sec, fruit set rates decrease from 100% to 50%.
The modeling framework enables us to vary key plant and pollinator parameters simulta-
neously. For a given percentage of female flower buds that make up the orchard, predicted
yield increases as the number of bees per 1000 female flowers increases (Fig 9). When the
female flower buds percentage is high (between 50% and 90%), maintenance of bee densities
over 6 bees per 1000 female flowers will lead to better pollination and therefore ensure a high
predicted yield.
PLOS ONE Modeling plant-pollinator interactions to predict fruit yield
PLOS ONE | https://doi.org/10.1371/journal.pone.0231120 October 23, 2020 13 / 21

Parameter sensitivity analysis shows that the percentage of female flowers, the total number
of buds, and the bee density have the most significant effect on the total predicted yield (Fig
10) with a positive correlation. Bee density, the pollinators’ preference to switch from female
to male flowers (�), the male flowering period (σm), and the pollinator’s preference to switch
Fig 6. Open male (colored) and female (black) flowers (a) and total predicted yield (b) for varying peak day of
male flower opening from day 3 to day 9. The total amount of buds was kept constant at 1.2 million/ha with a male to
female flower ratio of 1:1 and 6 bees per 1000 female flowers. Other parameters are baseline values in Table 2. The
percentage of open female flowers that achieved sufficient pollination to set fruit is listed under each data point.
https://doi.org/10.1371/journal.pone.0231120.g006
PLOS ONE Modeling plant-pollinator interactions to predict fruit yield
PLOS ONE | https://doi.org/10.1371/journal.pone.0231120 October 23, 2020 14 / 21
from male to female flowers (δ) are the next most important parameters that are positively cor-
related with the predicted yield, while pollinator handling time is the only parameter with a
strongly negative effect on the total predicted yield.
Discussion
Flower density and the percentage of female flowers were highly influential parameters in pre-
dicting final fruit yield. Also important was the width of the male blooming window. Managed
honey bees are the primary mode of kiwifruit pollination globally [2], and several pollinator-
related factors were found to influence yield, with bee density, flower handling time, and pref-
erence for moving between flowers of different sexes all highlighted by our sensitivity analysis.
Kiwifruit flowers may take up to 40 honey bee visits to be fully pollinated [48], but this is
partially due to the large numbers of bees which deposit little or no pollen. We found that
increasing bee density will increase fruit production, but that there is a point of diminishing
returns after the first 6-8 bees per 1000 female flowers and buds. This finding broadly agrees
with the literature, which reports that densities of around 3-6 bees per 1000 flowers are suffi-
cient for full pollination [25, 49, 50], with sustained higher bee numbers being unusual, though
sustained densities of 14 bees per 1000 flowers have been reported in cages [49] and densities
of 30-60 bees per 1000 flowers may occur for a very brief period of time in rare circumstances
[4, 34]. We found that a longer flower handling time was negatively correlated with fruit pro-
duction in this model. Although empirical data show that honey bee flower handling time is
not correlated with pollen deposition [14], the rate of flower visitation is a well-known factor
in limiting the effectiveness of pollinators independently of pollen deposition. [51].
Fig 7. Total predicted yield as a function of the number of bees per 1000 female flowers. The bee density varies
from 1 bee per 1000 female flowers to 20 bees per 1000 female flowers, and the total amount of buds was kept constant
at 1.2 million/ha with a male to female flower ratio of 1:1. Other parameters are baseline values in Table 2. The
percentage of open female flowers that achieved sufficient pollination to set fruit is listed under each data point.
https://doi.org/10.1371/journal.pone.0231120.g007
PLOS ONE Modeling plant-pollinator interactions to predict fruit yield
PLOS ONE | https://doi.org/10.1371/journal.pone.0231120 October 23, 2020 15 / 21
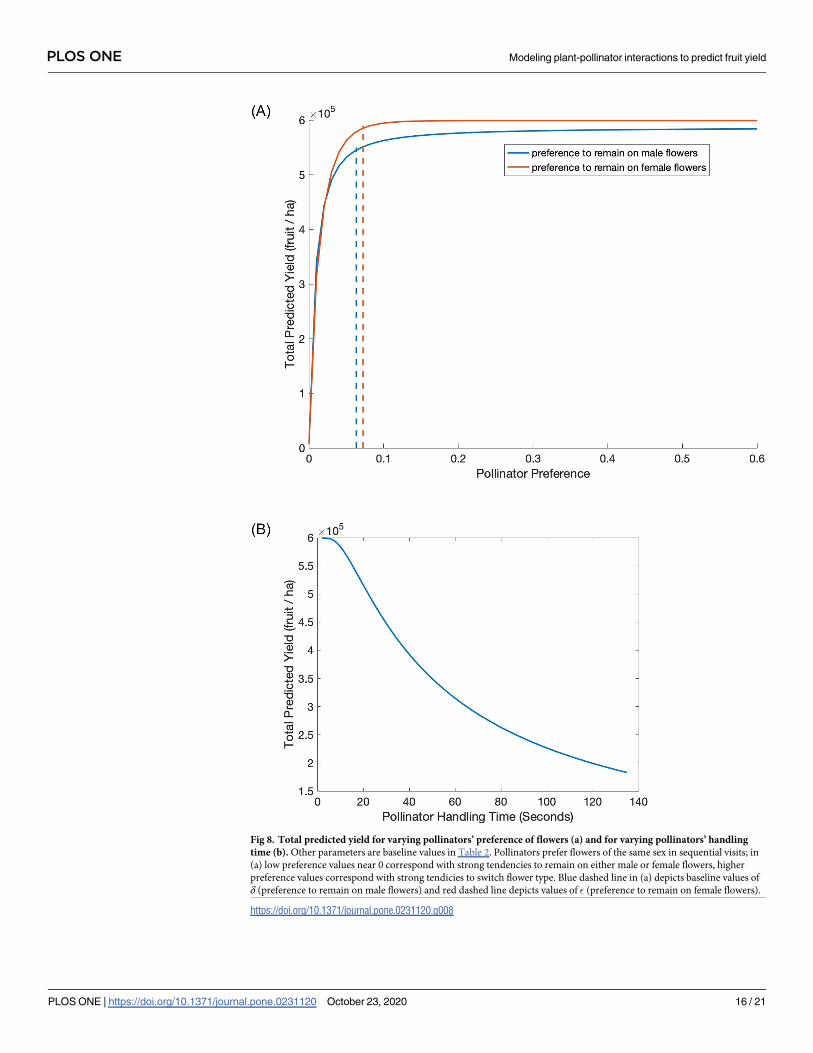
Fig 8. Total predicted yield for varying pollinators’ preference of flowers (a) and for varying pollinators’ handling
time (b). Other parameters are baseline values in Table 2. Pollinators prefer flowers of the same sex in sequential visits; in
(a) low preference values near 0 correspond with strong tendencies to remain on either male or female flowers, higher
preference values correspond with strong tendicies to switch flower type. Blue dashed line in (a) depicts baseline values of
δ (preference to remain on male flowers) and red dashed line depicts values of � (preference to remain on female flowers).
https://doi.org/10.1371/journal.pone.0231120.g008
PLOS ONE Modeling plant-pollinator interactions to predict fruit yield
PLOS ONE | https://doi.org/10.1371/journal.pone.0231120 October 23, 2020 16 / 21

Preference factors are less well-known, but highlighted here. Honey bees are able to differ-
entiate between male and female kiwifruit flowers without landing on them [34], and they
must travel from a male flower to a female flower to deposit viable pollen. This chance of
switching can potentially be affected by other pollinators in the field [52], as well as the attrac-
tiveness of the male and female cultivars. Increasing the chance of switching between plant
sexes may be a critical factor for kiwifruit pollination, as the baseline values in our model are
right on the edge of a steep decline—if less switching happens than currently reported in the
literature (as indicated by the base parameter values), there could be very significant, negative
impacts on pollination.
When examining the interaction of bee density and the proportion of female flowers, we
found that, at typical bee densities (< 12 bees per 1000 flowers), the optimum proportion of
Fig 9. Total predicted yield for varying the proportion of female flower buds and the number of bees per 1000 female flowers. The total amount of buds was
kept constant at 1.2 million/ha. Other parameters are baseline values in Table 2.
https://doi.org/10.1371/journal.pone.0231120.g009
PLOS ONE Modeling plant-pollinator interactions to predict fruit yield
PLOS ONE | https://doi.org/10.1371/journal.pone.0231120 October 23, 2020 17 / 21

female flowers was 65-75% of total flowers, representing a ‘sweet spot’ between having more
possibilities for fruit development and risk from insufficient movement of bees between the
two flower sexes. Current orchard plantings have an approximately 50:50 ratio between male
and female flowers [4], highlighting an opportunity to increase yield by changing pruning
practices to increase the proportion of female flowers-an easily achievable intervention com-
pared with changing pollinator behavior.
Our model takes advantage of over 30 years of field-based data in New Zealand and other
parts of the world and provides a way to quantitatively assess how different plant- and insect-
related factors interact and their importance for final fruit set. Our results suggest that choos-
ing cultivars which have their peak bloom on the same day, planting and pruning to achieve
approximately 70% female flowers in the orchard, having as many flowers as the vine can sup-
port to full fruit size, and placing enough hives to maintain more than 6 bees per 1000 flowers
will optimize yield. There is the potential for future work to improve the predictive power of
this model by accounting for multiple pollinators and spatial scale and pattern.
Supporting information
S1 Appendix. Many of the parameters have monotonic relationships with the output mea-
sure (S1a Fig) and the PRCC statistics for those are reliable. However, we note that parame-
ters σm, σf, tm, tf and the proportion of female flower buds in the field exhibit nonmonotic
behaviors. Therefore, we conducted additional LHE sampling by truncating the ranges of
these parameters to monotonic regions. S1b and S1c Fig depict the monotonicity of the
Fig 10. Sensitivity analysis of the delay differential equation model using partial rank correlation coefficient (PRCC) values for each parameter in the Latin
hypercube sampling. PRCC values marked as ns are not significant (P� 0.05). Flower traits are in orange and pollinator traits are in blue.
https://doi.org/10.1371/journal.pone.0231120.g010
PLOS ONE Modeling plant-pollinator interactions to predict fruit yield
PLOS ONE | https://doi.org/10.1371/journal.pone.0231120 October 23, 2020 18 / 21

truncated parameter space. The resulting PRCC results for the entire parameter space as well
as the truncated parameter spaces are compared in S2 Fig. Parameters for the total number of
buds, percentage of female buds, bee density, and handling time are consistently identified as
important parameters in all cases. We note that in the truncated case we split the percentage of
female flower buds into the cases of 5–76% and 76–96%. In the first half this parameter shows
a highly influential positive relationship with predicted yield (large positive PRCC value) and
in the second half the parameter is inversely related to the predicted yield. This is as expected
as saturating the field with only female buds will eventually cause a decrease in yield. These
dynamics are observed in the monotonicity plots as well.
(PDF)
S1 Available code. Matlab code for our model was provided as an online supplemental file
and is available to download.
(M)
Acknowledgments
We would like to thank Mark Goodwin for his assistance in obtaining data for model parame-
terization, and Ruth Williams and Warrick Nelson for their feedback on the manuscript.
Author Contributions
Conceptualization: Angela Peace, David Pattemore, Melissa Broussard, Dilini Fonseka,
Nathan Tomer, Nilsa A. Bosque-Perez, David Crowder, Allison K. Shaw, Linley Jesson,
Brad G. Howlett, Mateusz Jochym, Jing Li.
Formal analysis: Angela Peace, Melissa Broussard, Dilini Fonseka, Nathan Tomer, Mateusz
Jochym, Jing Li.
Supervision: David Pattemore.
Writing – original draft: Angela Peace, David Pattemore, Melissa Broussard, Dilini Fonseka,
Nathan Tomer, Nilsa A. Bosque-Perez, David Crowder, Allison K. Shaw, Linley Jesson,
Brad G. Howlett, Mateusz Jochym, Jing Li.
Writing – review & editing: Angela Peace, David Pattemore, Melissa Broussard, Dilini Fon-
seka, Nathan Tomer, Nilsa A. Bosque-Perez, David Crowder, Allison K. Shaw, Linley Jes-
son, Brad G. Howlett, Mateusz Jochym, Jing Li.
References1. Ollerton J, Winfree R, Tarrant S. How many flowering plants are pollinated by animals? Oikos. 2011;
120(3):321–326. https://doi.org/10.1111/j.1600-0706.2010.18644.x
2. Klein AM, Vaissiere BE, Cane JH, Steffan-Dewenter I, Cunningham SA, Kremen C, et al. Importance of
pollinators in changing landscapes for world crops. Proceedings of the Royal Society B: Biological Sci-
ences. 2007; 274(1608):303–313. https://doi.org/10.1098/rspb.2006.3721 PMID: 17164193
3. Gallai N, Salles JM, Settele J, Vaissière BE. Economic valuation of the vulnerability of world agriculture
confronted with pollinator decline. Ecological economics. 2009; 68(3):810–821. https://doi.org/10.1016/
j.ecolecon.2008.06.014
4. Goodwin M. Pollination of Crops in Australia and New Zealand. Ruakura, New Zealand: Rural Indus-
tries Research and Development Corporation; 2012.
5. Ramos-Jiliberto R, de Espanes PM, Franco-Cisterna M, Petanidou T, Vazquez DP. Phenology deter-
mines the robustness of plant–pollinator networks. Scientific reports. 2018; 8(1):14873. https://doi.org/
10.1038/s41598-018-33265-6 PMID: 30291278
PLOS ONE Modeling plant-pollinator interactions to predict fruit yield
PLOS ONE | https://doi.org/10.1371/journal.pone.0231120 October 23, 2020 19 / 21

6. Geber MA, Moeller DA. Pollinator responses to plant communities and implications for reproductive
character evolution. Ecology and evolution of flowers. 2006; p. 102–119.
7. Walklate P, Hunt J, Higson H, Sweet J. A model of pollen–mediated gene flow for oilseed rape. Pro-
ceedings of the Royal Society of London Series B: Biological Sciences. 2004; 271(1538):441–449.
https://doi.org/10.1098/rspb.2003.2578 PMID: 15129952
8. Lescourret F, Habib R, Genard M, Agostini D, Chadoeuf J. Pollination and fruit growth models for study-
ing the management of kiwifruit orchards. I. Models description. Agricultural Systems. 1998; 56(1):67–
89. https://doi.org/10.1016/S0308-521X(97)00043-7
9. Lescourret F, Genard M, Habib R, Pailly O. Pollination and fruit growth models for studying the manage-
ment of kiwifruit orchards. II. Models behaviour. Agricultural systems. 1998; 56(1):91–123. https://doi.
org/10.1016/S0308-521X(97)00043-7
10. Henry M, Frochen M, Maillet-Mezeray J, Breyne E, Allier F, Odoux JF, et al. Spatial autocorrelation in
honeybee foraging activity reveals optimal focus scale for predicting agro-environmental scheme effi-
ciency. Ecological modelling. 2012; 225:103–114. https://doi.org/10.1016/j.ecolmodel.2011.11.015
11. Lonsdorf E, Kremen C, Ricketts T, Winfree R, Williams N, Greenleaf S. Modelling pollination services
across agricultural landscapes. Annals of botany. 2009; 103(9):1589–1600. https://doi.org/10.1093/
aob/mcp069 PMID: 19324897
12. Bajcz AW, Hiebeler D, Drummond FA. Grid-Set-Match, an agent-based simulation model, predicts fruit
set for the lowbush blueberry (Vaccinium angustifolium) agroecosystem. Ecological modelling. 2017;
361:80–94. https://doi.org/10.1016/j.ecolmodel.2017.07.026
13. Dumont Y, Soulie JC, Michel F. Modeling oil palm pollinator dynamics using deterministic and agent-
based approaches. Applications on fruit set estimates. Some preliminary results. Mathematical Meth-
ods in the Applied Sciences. 2018; 41(18):8545–8564. https://doi.org/10.1002/mma.4858
14. Broussard MA, Jochym M, Tomer N, Jesson L, Shaw AK, Crowder DW, et al. Using agent-based mod-
els to predict pollen deposition in a dioecious crop. Under review. 2020.
15. Schmid R, et al. Reproductive anatomy of Actinidia chinensis (Actinidiaceae). 1978.
16. Manning R. Fatty acids in pollen: a review of their importance for honey bees. Bee world. 2001; 82
(2):60–75. https://doi.org/10.1080/0005772X.2001.11099504
17. Goodwin R, Houten AT, Perry J. Effect of staminate kiwifruit vine distribution and flower number on kiwi-
fruit pollination. New Zealand Journal of Crop and Horticultural Science. 1999; 27:63–67. https://doi.
org/10.1080/01140671.1999.9514081
18. Testolin R. Male density and arrangement in kiwifruit orchards. Scientia Horticulturae. 1991; 48:41–52.
https://doi.org/10.1016/0304-4238(91)90151-N
19. Steven D. The Chinese bee hunt continues in the mountains. New Zealand kiwifruit. 1988;October
1988:12–13.
20. Steven D. Chinese pollinators identified. New Zealand Kiwifruit. 1988; 15.
21. Yang L, Wu Y. Preliminary study of kiwifruit pollinating bees in China. Apiculture of China. 1990;(1):2–4.
22. McKay SA. Pollination and other factors affecting fruit-set and size of kiwifruit [MS]; 1978.
23. Vaissière BE, Rodet G, Cousin M, Botella L, Torre Grossa JP. Pollination Effectiveness of Honey Bees
(Hymenoptera: Apidae) in a Kiwifruit Orchard. Journal of Economic Entomology. 1996; 89(2):453–461.
https://doi.org/10.1093/jee/89.2.453
24. Howpage D. Pollination biology of kiwifruit: influence of honey bees, Apis mellifera L, pollen parents and
pistil structure [phdthesis]; 1999.
25. Clinch PG. Kiwifruit pollination by honey bees 1. Tauranga observations, 1978–81. New Zealand Jour-
nal of Experimental Agriculture. 1984; 12(1):29–38. https://doi.org/10.1080/03015521.1984.10427785
26. Howlett BG, Read SFJ, Jesson LK, Benoist A, Evans LE, Pattemore DE. Diurnal insect visitation pat-
terns to ‘Hayward’ kiwifruit flowers in New Zealand. New Zealand Plant Protection. 2017; 70:52–57.
https://doi.org/10.30843/nzpp.2017.70.27
27. Marino S, Hogue IB, Ray CJ, Kirschner DE. A methodology for performing global uncertainty and sensi-
tivity analysis in systems biology. Journal of theoretical biology. 2008; 254(1):178–196. https://doi.org/
10.1016/j.jtbi.2008.04.011 PMID: 18572196
28. Pomeroy N, Fisher RM. Pollination of kiwifruit (Actinidia deliciosa) by bumble bees (Bombus terrestris):
effects of bee density and patterns of flower visitation. New Zealand Entomologist. 2002; 25(1):41–49.
https://doi.org/10.1080/00779962.2002.9722093
29. Thomson J. When is it mutualism? (An American Society of Naturalists Presidential Address). The
American Naturalist. 2003; 162(S4):S1–S9. https://doi.org/10.1086/378683 PMID: 14583853
30. Goodwin RM. Ecology of honey bee (Apis mellifera L.) pollination of kiwifruit (Actinida deliciosa (A.
Chev.)). ResearchSpace@ Auckland; 1987.
PLOS ONE Modeling plant-pollinator interactions to predict fruit yield
PLOS ONE | https://doi.org/10.1371/journal.pone.0231120 October 23, 2020 20 / 21

31. Soberon JM, Del Rio CM. The dynamics of a plant-pollinator interaction. Journal of Theoretical Biology.
1981; 91(2):363–378. https://doi.org/10.1016/0022-5193(81)90238-1
32. Jang SJ. Dynamics of herbivore-plant-pollinator models. Journal of mathematical biology. 2002; 44
(2):129–149. https://doi.org/10.1007/s002850100117 PMID: 11942529
33. Jay D, Jay C. Observations of honeybees on Chinese gooseberries (‘kiwifruit’) in New Zealand. Bee
world. 1984; 65(4):155–166. https://doi.org/10.1080/0005772X.1984.11098804
34. Goodwin R, Steven D. Behaviour of honey bees visiting kiwifruit flowers. New Zealand Journal of Crop
and Horticultural Science. 1993; 21(1):17–24. https://doi.org/10.1080/01140671.1993.9513741
35. Shaw AK, Peace A, Power AG, Bosque-Perez NA. Vector population growth and condition-dependent
movement drive the spread of plant pathogens. Ecology. 2017; 98(8):2145–2157. PMID: 28555726
36. Goodwin RM, McBrydie HM, Taylor MA. Wind and honey bee pollination of kiwifruit (Actinidia chinensis
‘HORT16A’). New Zealand Journal of Botany. 2013; 51(3):229–240. https://doi.org/10.1080/0028825X.
2013.806934
37. Brundell D. Flower development of the Chinese gooseberry (Actinidia chinensis Planch.) II. Develop-
ment of the flower bud. New Zealand journal of botany. 1975; 13(3):485–496. https://doi.org/10.1080/
0028825X.1975.10430338
38. Gonzalez M, Coque M, Herrero M. Pollinator selection in kiwifruit (Actinidia deliciosa). Journal of Horti-
cultural Science. 1994; 69(4):697–702. https://doi.org/10.1080/14620316.1994.11516502
39. Macfarlane RP, Ferguson AM. The 1980 to 1982 kiwifruit survey of pollination. DSIR; 1983.
40. Costa G, Testolin R, Vizzotto G. Kiwifruit pollination: an unbiased estimate of wind and bee contribution.
New Zealand Journal of Crop and Horticultural Science. 1993; 21(2):189–195. https://doi.org/10.1080/
01140671.1993.9513767
41. Hopping ME. Floral biology, pollination and fruit set. In: Floral biology, pollination and fruit set. Bennetts
Book Centre Ltd, Massey University; 1990. p. 71–96.
42. Gonzalez MV, Coque M, Herrero M. Stigmatic receptivity limits the effective pollination period in kiwi-
fruit. Journal of the American Society for Horticultural Science. 1995; 120:199–202. https://doi.org/10.
21273/JASHS.120.2.199
43. Gonzalez M, Coque M, Herrero M. Influence of pollination systems on fruit set and fruit quality in kiwifruit
(Actinidia deliciosa). Annals of applied biology. 1998; 132(2):349–355. https://doi.org/10.1111/j.1744-
7348.1998.tb05210.x
44. Testolin R. Kiwifruit yield efficiency, plant density, and bud number per surface unit. Journal of the Amer-
ican Society for Horticultural Science. 1990; 115(5):704–707. https://doi.org/10.21273/JASHS.115.5.
704
45. Cangi R, Atalay D, et al. Effects of different bud loading levels on the yield, leaf and fruit characteristics
of Hayward kiwifruit. Hort Sci(Prague). 2006; 33(1):23–28. https://doi.org/10.17221/3736-HORTSCI
46. Woodward TJ, Clearwater MJ. Spatial variation in ‘Hayward’ kiwifruit fruit size and orchard yield within a
growing region across seasons. New Zealand Journal of Crop and Horticultural Science. 2012; 40
(3):187–199. https://doi.org/10.1080/01140671.2011.639377
47. Costa G, Spinelli F, Soto A, Nardozza S, Asteggiano L, Vittone G. Use of plant bioregulators in kiwifruit
production. In: VII International Symposium on Kiwifruit 913; 2010. p. 337–344.
48. Goodwin RM, Haine H. How many bee visits to fully pollinate kiwifruit. New Zealand Kiwifruit Journal.
1995;.
49. Palmer-Jones T, Clinch PG, Briscoe DA. Effect of honey bee saturation on the pollination of Chinese
gooseberries variety ‘Hayward’. New Zealand Journal of Experimental Agriculture. 1976; 4:255–256.
https://doi.org/10.1080/03015521.1976.10425879
50. Goodwin RM. Biology of honeybee (Apis mellifera L.) pollination of kiwifruit (Actinidia deliciosa (A.
Chev.)) [PhD]; 1987.
51. King C, Ballantyne G, Willmer PG. Why flower visitation is a poor proxy for pollination: measuring sin-
gle-visit pollen deposition, with implications for pollination networks and conservation. Methods in Ecol-
ogy and Evolution. 2013; 4(9):811–818.
52. Greenleaf SS, Kremen C. Wild bees enhance honey bees’ pollination of hybrid sunflower. Proceedings
of the National Academy of Sciences. 2006; 103(37):13890–13895. https://doi.org/10.1073/pnas.
0600929103
PLOS ONE Modeling plant-pollinator interactions to predict fruit yield
PLOS ONE | https://doi.org/10.1371/journal.pone.0231120 October 23, 2020 21 / 21


![Response of barley quality traits, yield and antioxidant ...ijpp.gau.ac.ir/article_3712_7df9f80c2354a43f47c8258e36837c19.pdf · Cv. Giza 132, (six rows)] grown under surplus- and](https://img.dokumen.tips/doc/110x75/5fce70b7196c1f178372b9ce/response-of-barley-quality-traits-yield-and-antioxidant-ijppgauacirarticle37127df9f80c2354.jpg)