Embed Size (px)
Citation preview

ELSEVIER Marine Micropaleontology 33 (1998) 273-297
Orbital signatures in a Late Miocene dinoflagellate record from Crete (Greece)
A. Santarelli a,c,* , H. Brinkhuis a, F.J. Hilgen b, L.J. Lourens b, G.J.M. Versteegh d, H. Visscher a
a Laboratory of Palaeobotany and Palynology, Utrecht University, Budapestlaan 4, 3584 CD Utrecht, The Netherlands b Department of Geology, Institute of Earth Sciences, Budapestlaan 4, 3584 CD Utrecht, The Netherlands
c Centro di Palinologia dell’lJniversitb di Urbino, Istituto di Geologia, Localitri Cmcicchia, 61029 Urbino, Italy d Netherlands Institute of Sea Research, PO. Box 59, 1790 AB Den Burg, Texel, The Netherlands
Received 23 March 1997; accepted 1 October 1997
Abstract
A high-resolution palynological study of the cyclically bedded Faneromeni section (upper Tortonian-lower Messinian) on Crete (Greece) is presented. This study aims to recognize orbitally-driven variations in the palynological record and to validate the age model based on the astronomical calibration of the sedimentary cycles. Four palynology-based environmental proxies were utilised using interpretations of fossil dinoflagellate associations based on modem ecological characteristics. Cross-spectral analysis between the proxy records and astronomical target curve, the 65”N summer insolation, yielded in most cases significant spectral power and coherence in the precession and/or obliquity frequency bands. Precession-controlled variations in the proxy records are related to lithology and indicate that maxima in continental input and minima in sea surface salinity coincide with sapropel formation. The influence of obliquity is most clearly reflected in the index of continental versus marine palynomorphs (S-D). The absence of a distinct time lag relative to obliquity indicates that the 41-kyr component in continental input is controlled by oscillations in regional Mediterranean climate rather than by glacial cyclicity. Phase relations in the different astronomical frequency bands of the spectrum, as compared with the Mediterranean Pliocene, essentially confirm the validity of the Miocene astronomical time scale. Finally, a major non-cyclic change in the palynological assemblage at 6.68 Ma indicates enhanced salinity and decreased river discharge. This shift coincides with a significant drop in sedimentation rate informally termed the “Early Messinian Sediment starvation Event”. 0 1998 Elsevier Science B.V. All rights reserved.
Keywords: dinoflagellate cysts; Late Miocene; Mediterranean; Milankovitch theory; sapropels
1. Introduction
A relatively new method to construct geological time scales involves the calibration of sedimentary cycles to computed time series of the quasi-peri- odic variations of the Earth’s orbit (Hilgen, 1991a,b;
* Corresponding author.
Lourens et al., 1996). In the Mediterranean, astro- nomically calibrated time scales provided a solid basis for unravelling relationships between orbital forcing and climatic proxy records in the Plio-Pleis- tocene (Lourens et al., 1992, 1996; Versteegh, 1994). Similar sedimentary cycles to those observed in the Mediterranean Pliocene and Pleistocene have been reported from Middle and Upper Miocene
0377-8398/98/$19.00 0 1998 Elsevier Science B.V. All rights reserved. PII SO377-8398(97)00042-X
214 A. Santarelli et al. /Marine Micropaleontology 33 (1998) 273-297
sections on Crete and Sicily. A high resolution magnetostratigraphy and (integrated) biostratigraphy allowed the sections (and their cycles) on Crete and Sicily to be correlated in detail (Krijgsman et al., 1994, 1995) and eventually resulted in an extension of the astronomical time scale into the Miocene (Hilgen et al., 1995). The accuracy of this new time scale still awaits confirmation, because the Messinian evaporites hamper a straightforward downward extension of the astronomical calibra- tion of sedimentary cycles from the Mediterranean Pliocene.
By comparing palynological proxies with astro- nomical target curves, Versteegh (1994) demon- strated that the palynological associations are sen- sitive recorders of climatic change in the Mediter- ranean Pliocene and, hence, that they can be used to test and, if necessary, improve an astronomically derived age assessment. In this paper, we use es- sentially the same approach as Versteegh to study the Upper Miocene Faneromeni section on Crete, where the influence of astronomical forcing is well expressed in the sedimentary cycle patterns used to construct the time scale (Hilgen et al., 1995). In this way we attempt to interpret the nature of periodic paleoenvironmental changes in the Mediterranean Upper Miocene and to validate the astronomical age model, by comparing phase relations in the pre- cession and obliquity frequency bands with those observed in the Mediterranean Pliocene.
2. Material and methods
2.1. The Faneromeni section
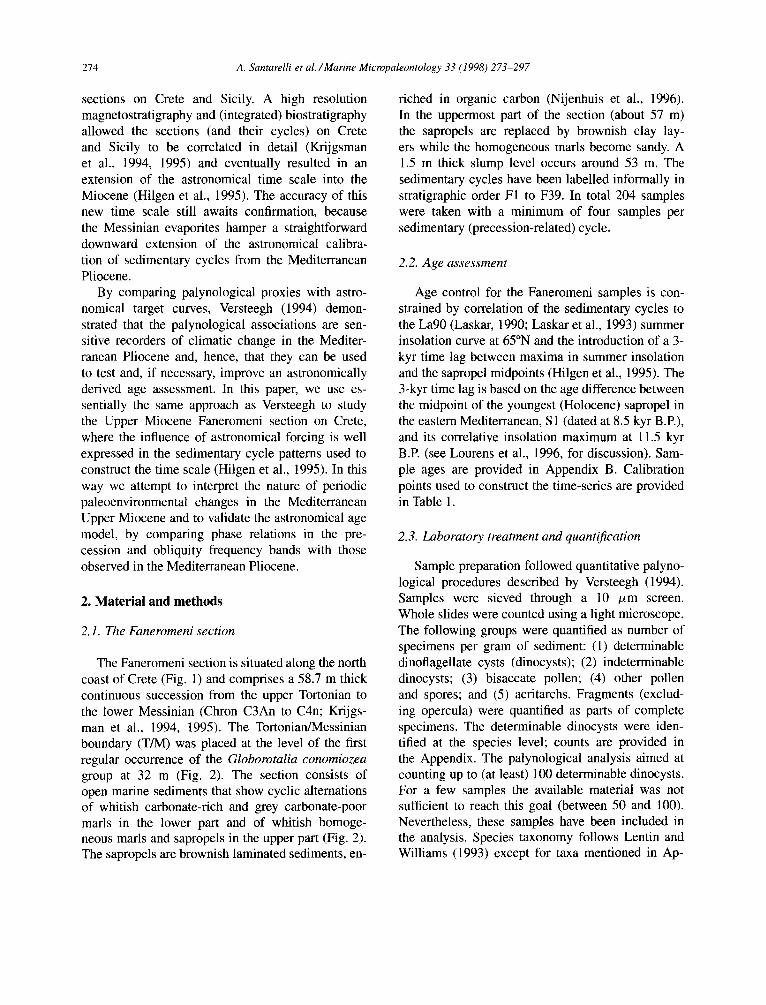
The Faneromeni section is situated along the north coast of Crete (Fig. 1) and comprises a 58.7 m thick continuous succession from the upper Tortonian to the lower Messinian (Chron C3An to C4n; Krijgs- man et al., 1994, 1995). The Tortonian/Messinian boundary (T/M) was placed at the level of the first regular occurrence of the Globorotalia conomiozea group at 32 m (Fig. 2). The section consists of open marine sediments that show cyclic alternations of whitish carbonate-rich and grey carbonate-poor marls in the lower part and of whitish homoge- neous marls and sapropels in the upper part (Fig. 2). The sapropels are brownish laminated sediments, en-
riched in organic carbon (Nijenhuis et al., 1996). In the uppermost part of the section (about 57 m) the sapropels are replaced by brownish clay lay- ers while the homogeneous marls become sandy. A 1.5 m thick slump level occurs around 53 m. The sedimentary cycles have been labelled informally in stratigraphic order Fl to F39. In total 204 samples were taken with a minimum of four samples per sedimentary (precession-related) cycle.
2.2. Age assessment
Age control for the Faneromeni samples is con- strained by correlation of the sedimentary cycles to the La90 (Laskar, 1990; Laskar et al., 1993) summer insolation curve at 65”N and the introduction of a 3- kyr time lag between maxima in summer insolation and the sapropel midpoints (Hilgen et al., 1995). The 3-kyr time lag is based on the age difference between the midpoint of the youngest (Holocene) sapropel in the eastern Mediterranean, S 1 (dated at 8.5 kyr B.P.), and its correlative insolation maximum at 11.5 kyr BP (see Lourens et al., 1996, for discussion). Sam- ple ages are provided in Appendix B. Calibration points used to construct the time-series are provided in Table 1.
2.3. Laboratory treatment and quantification
Sample preparation followed quantitative palyno- logical procedures described by Versteegh (1994). Samples were sieved through a 10 pm screen. Whole slides were counted using a light microscope. The following groups were quantified as number of specimens per gram of sediment: (1) determinable dinoflagellate cysts (dinocysts); (2) indeterminable dinocysts; (3) bisaccate pollen; (4) other pollen and spores; and (5) acritarchs. Fragments (exclud- ing opercula) were quantified as parts of complete specimens. The determinable dinocysts were iden- tified at the species level; counts are provided in the Appendix. The palynological analysis aimed at counting up to (at least) 100 determinable dinocysts. For a few samples the available material was not sufficient to reach this goal (between 50 and 100). Nevertheless, these samples have been included in the analysis. Species taxonomy follows Lentin and Williams (1993) except for taxa mentioned in Ap-
A. Santarelli et al. /Marine Micmpaleontology 33 (1998) 273-297 215
36’
35
i-
>
I
4 N
1 SEA OF CRETE
Kklion
0 30km
MEDlTERRANEAN SEA
I
24’ I
25’ I
26’
Fig. 1. Location of the Faneromeni section.
pendix A. Slides are stored in the collection of the Laboratory of Palaeobotany and Palynology, Utrecht University, The Netherlands.
2.4. Palynological indices
In order to simplify the highly complex distri- bution pattern of Pliocene taxa in the Mediter- ranean, Versteegh (1994) introduced six palyno- logical indices as (paleo)environmental indicators: Sporomorphs versus Dinocysts (S-D), Warm wa- ter versus Cold water dinocysts (W-C), Inner Ner- itic versus Oceanic dinocysts (IN-O), Outer Neritic versus Oceanic dinocysts (ON-O), Peridinioid ver- sus Gonyaulacoid dinocysts (P-G) and a ‘Olog of Reworked dinocysts per gram (after e.g. Wall et al., 1977; Harland, 1983; Brinkhuis, 1994). For the present study, however, only two of Versteegh’s in- dices could be used in data processing, due to the extremely low relative abundance of Oceanic, Peri- dinioid and Reworked dinocysts:
Sporomorph-Dinocyst index:
S-D = nS/n(D + S)
where II = number of specimens counted, S = pollen and spores + bisaccate pollen, and D = determinable dinocysts + undeterminable dinocysts + acritarchs. Since pollen are land derived and most dinocysts marine, this index provides an estimate of the relative contribution of land derived material in the marine depositional environment.
Warm water-Cold water dinocyst index:
w-c = nW/n(W + C)
where n = number of specimens counted, dinocysts indicative for warm waters, and
w= c=
dinocysts indicative for cold waters. The extant species Selenopemphix nephroides and Spiniferites mirabilis are used as warm water indicators whereas Nematosphaeropsis lemniscata and the ex- tinct species Habibacysta tectata are applied as their cold water counterparts (see Wall et al., 1977; Dale,
276 A. Santarelli et al. /Marine Micropaleontology 33 (1998) 273-297
o3m .3 o- _ ^ -
mfpqt -7 o3_. -.- A. LL__L._ 1 . . -_ -
amduronrwr 3 ,3 .-- .- -_ _. .A .- - ^.A... - - - - -
%Jsard ‘3 :3, ._ .1.1L.__u* .- _.A_. .-- --^.- .-.. o*qoq ‘H o- __- -- . ._A. ___. -- -_- - -. _
--4 _y.I..l.lAbA**.- L. ._ _ -_ _..Y. _
* ‘0 o- . _ _ *. _ .- --__- - -
0
s ur?wTp,aaLs~ ‘0
P 0 i

A. Santarelli et al. /Marine Micropaleontology 33 (1998) 273-297 211
Table 1 Calibration points used to construct the time-series for the Faneromeni section
Age (Ma)
Cycle Depth
(m)
6.654 6.675 6.696 6.749 6.768 6.789 6.807 6.844 6.866 6.884 6.917 6.938 6.960 6.982 7.005 7.032 7.052 7.015 7.097 7.123 7.146 7.167
1.242 7.263 7.280 7.311 7.338 7.361 7.386 7.408 7.43 1 7.453 7.478 7.5 7.523 7.545 7.567 7.594
F39 57.81 F38 57.5 F37 57.13 F36 56.425 F35 55.525 F34 54.55 F33 52.53 F32 51.335 F31 50.27 F30 49.495 F29 48.07 F28 41.02 F27 45.82 F26 44.745 F25 43.4 F24 42.085 F23 40.855 F22 39.59 F21 38.33 F20 36.875 F19 35.605 F18 34.395 F17 31.775 F16 30.24 F15 28.705 F14 27.33 F13 25.05 F12 23.625 Fll 21.95 FlO 20.325 F9 1 X.725 F8 17.125 F7 15.525 F6 13.6 F5 11.75 F4 9.7 F3 1.275 F2 4.65 Fl 2.45
Cycles coding and ages (in Ma) after Hilgen et al. (1995); depths (in meters) above the base of the Faneromeni section.
1985; Head et al., 1989; Edwards et al., 1991; Matthiessen, 1991; Versteegh, 1994). This index is applied as an indicator for changes in Sea Surface Temperature (SST).
where n = number of specimens counted, IN1 = inner neritic species related to highly saline waters, and IN2 = inner neritic species related to low salinity waters. Specimens of Homotryblium tenuispinosum, Tuberculodinium vancampoae and Operculodinium israelianum are characteristic of highly saline wa- ters whereas Lingulodinium machaerophorum, Leje- unecysta fallax, Capillicysta fusca, Selenopemphix nephroides, Selenopemphix armageddonensis, Se- lenopemphix brevispinosa, Multispinula quanta and Peridinioids spp. may be considered indicative of re- duced salinity (see Wall et al., 1977; Harland, 1983; Lewis, 1988; Brinkhuis, 1994). This index is applied as an inner neritic salinity proxy. Table 2 summarizes the established indices and their ecological signifi- cance.
2.5. Statistical methods
Two new indices are introduced, since the Standard student t-test (Rohlf and Sokal, 1981) Faneromeni palynological associations consist is applied to determine which indices show a sig-
mainly of inner neritic (hyper and hypo-saline) and outer neritic dinocysts (see Appendix):
Inner Neritic-Outer Neritic dinocyst index:
IN-ON = nIN/n(IN + ON)
where n = number of specimens counted, IN = all inner neritic taxa, and ON = all outer neritic taxa. All Achomosphaera and Spiniferites species are grouped as outer neritic species, while the species Lingulodinium machaerophorum, Operculo- dinium israelianum, Tectatodinium pellitum, Tuber- culodinium vancampoae, Lejeunecysta fallax, Capil- licystafusca, Selenopemphix nephroides, Selenopem- phix armageddonensis, Selenopemphix brevispinosa, Multispinula quanta and Peridinioids spp. are used as inner neritic indicators (see Wall et al., 1977; Harland, 1983; Lewis, 1988; McMinn, 1990; Ver- steegh, 1994). The extinct species Homotryblium tenuispinosum is considered to be characteristic of (hyper-saline) inner neritic environments (Brinkhuis, 1994). This index is used as a proxy for the contri- bution of the inner neritic transport/influence into the outer neritic environment.
Inner Neritic hyper-saline-inner neritic hypo- saline dinocyst index:
INl-IN2 = n(INl)/n(INl + IN2)
278 A. Santarelli et al. /Marine Micropaleontology 33 (1998) 273-297
Table 2 Overview of four palynological indices
Index Meaning Formula Proxy for
S-D Sporomorphs versus Dinocysts nS/n(S + D) continental influence W-C Warm water versus Cold water dinocysts nW/n(W + C) sea surface temperature IN-ON Inner Neritic versus Outer Neritic dinocysts nIN/n(IN + ON) inner neritic influence IN 1 -IN2 Inner Neritic hyper-saline versus hypo-saline dinocysts nINl/n(INl + IN2) sea surface salinity
S-D index = nS/n(S + D), where n = number of specimens counted, S = pollen and spores (including bisaccate pollen), D = determinable dinocysts + indeterminable dinocysts + acritarchs. W-C = nW/n(W + C) where n = number of specimens counted, W = dinocysts indicative for warm waters, C = dinocysts indicative for cold waters. The extant species Selenopemphix nephroides and Spinzferites mirabilis are used as warm water indicators whereas Nematosphaeropsis lemniscata and the extinct species Habibacysta tectata are applied as their cold water counterparts. IN-ON index = n(IN)/n(IN + ON) where n = number of specimens counted, IN = all inner neritic taxa, ON = all outer neritic taxa. All Achomosphaera and Spiniferites species are grouped as outer neritic species, while the species Lingulodinium machaerophorum, Operculodinium israelianum, Homotryblium tenuispinosum, Tectatodinium pellitum, Tuberculodinium vancampoae, Lejeunecysta fallax, Capillicysta fusca, Selenopemphix nephroides, Selenopemphix armageddonensis, Selenopemphix brevispinosa, Multispinula quanta and Peridinioids spp. are used as inner neritic indicators. INl-IN2 index = nINl/n(INl + IN2) where n = number of specimens counted, IN1 = inner neritic species related to highly saline waters, IN2 = inner neritic species related to low saline waters. Specimens of Homotryblium tenuispinosum, Tuberculodinium vancampoae and Operculodinium israelianum are characteristic of highly saline waters whereas Lingulodinium machaerophorum, Lejeunecysta fallax, Capillicysta fusca, Selenopemphix nephroides, Selenopemphix annageddonensis, Selenopemphix brevispinosa, Multispinula quanta and Peridinioids spp. may be considered indicative of reduced salinity.
nificant relationship (with t = 0.95) with lithol- ogy. Cross spectral comparison is made between the palynological indices and the astronomical target curve, the summer insolation time series at 65”N lat- itude (La90; see Laskar, 1990; Laskar et al., 1993). Spectral estimates are based on a Parzen smoothing window with 119 lags and an interpolated time in- terval of 2 kyr, resulting in a band-width of 0.0078. Band-pass filtering is used to extract 23- and 41-kyr components from the palynological indices for visual comparison with the La90 precession and obliquity time series. In this case the time series analysis is based on the CLEAN programme (e.g. Jenkins and Watts, 1968; Roberts et al., 1987).
3. Results
3.1. Palynological distribution patterns and t-test
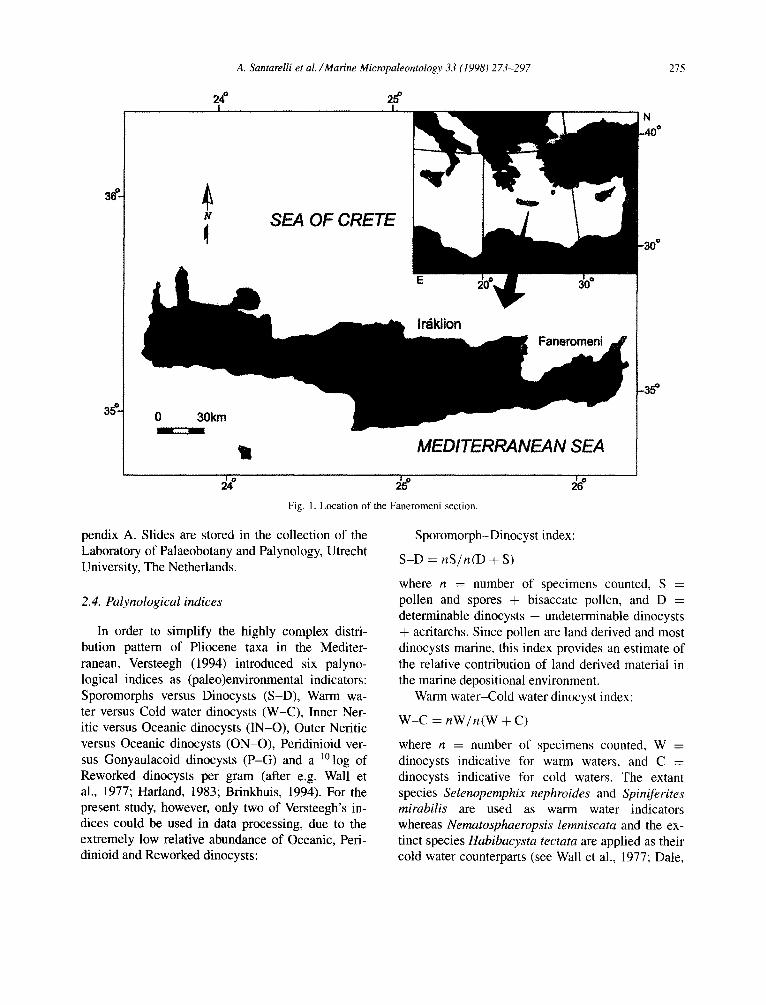
For the entire Faneromeni section the high rela- tive percentages of Spiniferites and Achomosphaera species indicate an outer neritic depositional environ- ment (Fig. 2). Strong inner neritic influence is shown by the relative percentages of Operculodinium is- raelianum, Lingulodinium machaerophorum and Ho- motryblium tenuispinosum (Fig. 2). In addition, some
oceanic water influence is indicated by the presence of Zmpagidinium species (see e.g. Wall et al., 1977; Harland, 1983; Turon, 1984; Versteegh, 1994).
Most species show short-term recurrent varia- tions in abundance of varying magnitudes. Long- term non-recurrent changes are shown by the upward increase in abundances of Bitectatodinium? serra- turn, Achomosphaera andalousiensis, Homotryblium tenuispinosum, Cyclopsiella granosa, Lejeunecysta fallax, Selenopemphix nephroides and Selenopem- phix armageddonensis, the upward decrease in abun- dances of Impagidinium patulum, Pyxidinopsis tu- berculata, Nematosphaeropsis lemniscata and Ne- matosphaeropsis lativittatus, the first and last lo- cal appearances of Fibrocysta? fusiforma and In- vertocysta tabulata, the first local appearance of Lejeunecysta fallax, the last local occurrences of Spiniferites pseudofurcatus and Multispinula quanta.
Comparison between Figs. 2 and 3 reveals two major shifts in the palynological associations. The first one occurs at depth 34.4 m (sample fa96, age 7.166 Ma), 3 m above the Tortonian/Messinian boundary and coincides with the occurrence of the first sapropel in the section (sedimentary cycle F18). This change is marked by a strong increase in the amplitude of the high frequency variations in the S-

Fane
rom
eni
60.
55
50
45
40.
35
Jo-
25
20.
15.
lo- 5-
O-
F39
I L.
,.,.~
FlB
,..,..
. .:.
. .:.
.::
;. _;
::
ll!
!EE
3 ‘7
. ,
.:+:.:
.
::.:.:
., 1
.~.‘
.‘I.
::::. .:m
;
Spe
cies
di
vers
ity
S-D
0 5
10
15
20
25
0 0.
5 1
w-c
0
0.5
1
IN-O
N IN
1 -I
N2
0 0.
5 1
Fig.
3.
Com
paris
on
betw
een
the
litho
logy
an
d fo
ur
paly
nolo
gica
l in
dice
s an
d di
nocy
st sp
ecie
s di
vers
ity.
S-D
re
pres
ents
th
e in
dex
betw
een
the
num
ber
of p
olle
n an
d sp
ores
an
d th
e nu
mbe
r of
din
ofla
gella
te
cysts
pl
us
polle
n an
d sp
ores
pl
us
acrit
arch
s. W
-C
repr
esen
ts
the
inde
x of
war
n-w
ater
ve
rsus
co
ol-
and
war
m-w
ater
di
nofla
gella
tes
spec
ies.
IN-O
N
is
the
inde
x be
twee
n in
ner
nerit
ic
and
oute
r ne
ritic
pl
us
inne
r ne
ritic
di
nofla
gella
tes
spec
ies.
M-I
N2
is t
he i
ndex
be
twee
n in
ner
nerit
ic
hype
r-sa
line
vers
us
inne
r-ne
ritic
hy
po-s
alin
e an
d hv
uer-
salin
e di
nocv
sts
(see
tex
t fo
r m
ore)
.
280
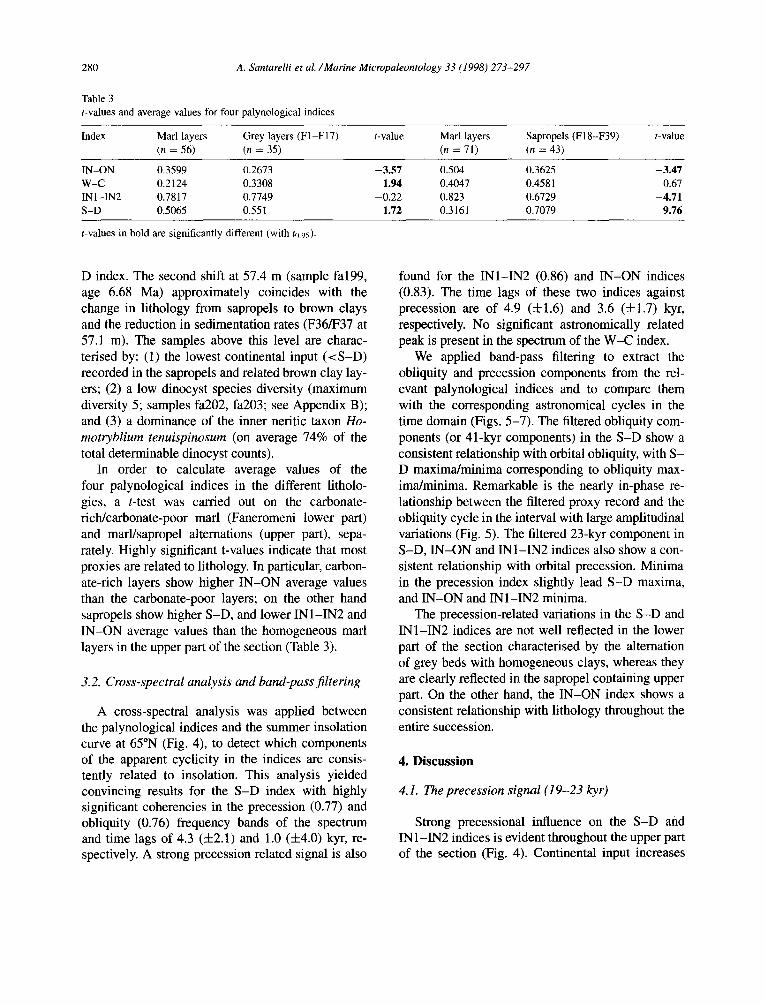
Table 3
A. Santarelli et al. /Marine Micropaleontology 33 (1998) 273-297
t-values and average values for four palynological indices
Index Marl layers Grey layers (Fl-F17) (n = 56) (n = 35)
f-value Marl layers (n = 71)
Sapropels (F18-F39) (n = 43)
t-value
IN-ON 0.3599 0.2673 -3.57 0.504 0.3625 -3.47 w-c 0.2124 0.3308 1.94 0.4047 0.458 1 0.67 INl-IN2 0.7817 0.7749 -0.22 0.823 0.6729 -4.71 S-D 0.5065 0.551 1.72 0.3161 0.7079 9.76
t-values in bold are significantly different (with t,~.~s).
D index. The second shift at 57.4 m (sample fa199, age 6.68 Ma) approximately coincides with the change in lithology from sapropels to brown clays and the reduction in sedimentation rates (F36/F37 at 57.1 m). The samples above this level are charac- terised by: (1) the lowest continental input (<S-D) recorded in the sapropels and related brown clay lay- ers; (2) a low dinocyst species diversity (maximum diversity 5; samples fa202, fa203; see Appendix B); and (3) a dominance of the inner neritic taxon Ho- motryblium tenuispinosum (on average 74% of the total determinable dinocyst counts).
In order to calculate average values of the four palynological indices in the different litholo- gies, a t-test was carried out on the carbonate- rich/carbonate-poor marl (Faneromeni lower part) and marl/sapropel alternations (upper part), sepa- rately. Highly significant t-values indicate that most proxies are related to lithology. In particular, carbon- ate-rich layers show higher IN-ON average values than the carbonate-poor layers; on the other hand sapropels show higher S-D, and lower INl-IN2 and IN-ON average values than the homogeneous marl layers in the upper part of the section (Table 3).
3.2. Cross-spectral analysis and band-pass jiltering
A cross-spectral analysis was applied between the palynological indices and the summer insolation curve at 65”N (Fig. 4), to detect which components of the apparent cyclicity in the indices are consis- tently related to insolation. This analysis yielded convincing results for the S-D index with highly significant coherencies in the precession (0.77) and obliquity (0.76) frequency bands of the spectrum and time lags of 4.3 (f2.1) and 1.0 (f4.0) kyr, re- spectively. A strong precession related signal is also
found for the INl-IN2 (0.86) and IN-ON indices (0.83). The time lags of these two indices against precession are of 4.9 (f 1.6) and 3.6 (f 1.7) kyr, respectively. No significant astronomically related peak is present in the spectrum of the W-C index.
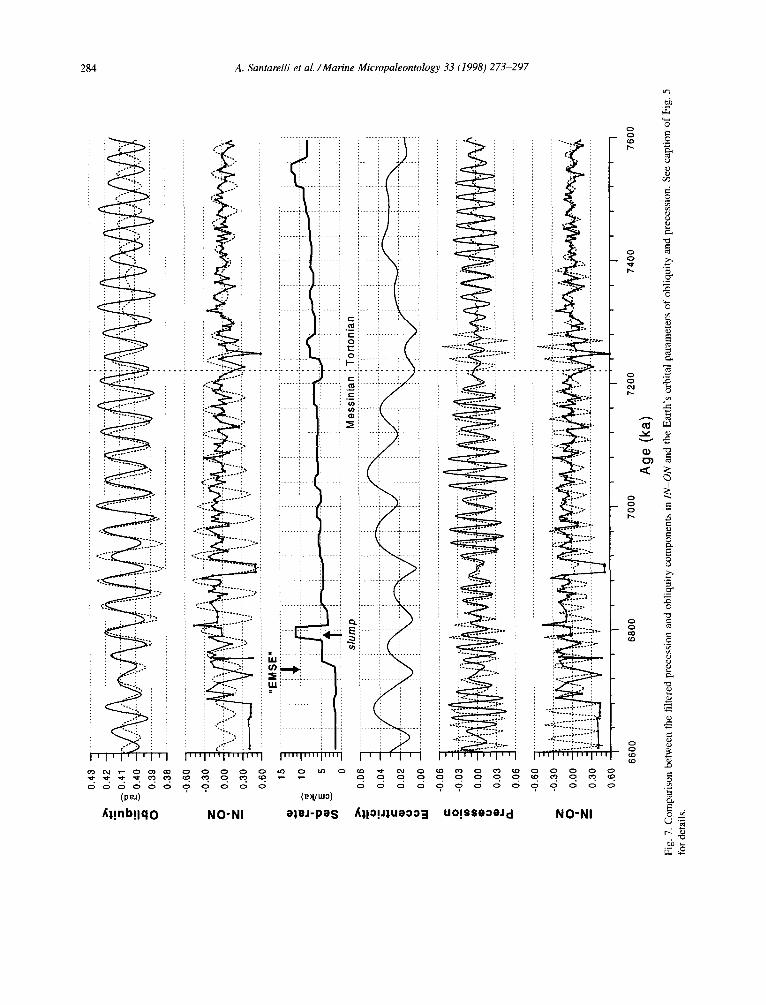
We applied band-pass filtering to extract the obliquity and precession components from the rel- evant palynological indices and to compare them with the corresponding astronomical cycles in the time domain (Figs. 5-7). The filtered obliquity com- ponents (or 41-kyr components) in the S-D show a consistent relationship with orbital obliquity, with S- D maxima/minima corresponding to obliquity max- ima/minima. Remarkable is the nearly in-phase re- lationship between the filtered proxy record and the obliquity cycle in the interval with large amplitudinal variations (Fig. 5). The filtered 23-kyr component in S-D, IN-ON and INl-IN2 indices also show a con- sistent relationship with orbital precession. Minima in the precession index slightly lead S-D maxima, and IN-ON and IN 1 -IN2 minima.
The precession-related variations in the S-D and INl-IN2 indices are not well reflected in the lower part of the section characterised by the alternation of grey beds with homogeneous clays, whereas they are clearly reflected in the sapropel containing upper part. On the other hand, the IN-ON index shows a consistent relationship with lithology throughout the entire succession.
4. Discussion
4.1. The precession signal (19-23 kyr)
Strong precessional influence on the S-D and INl-IN2 indices is evident throughout the upper part of the section (Fig. 4). Continental input increases

Bw
: 0.
0078
S-
D -
.n
1 ook
yr
4lky
r 23
kyr
19ky
r
Freq
uenc
y/ky
r
w-c
t OO
kyr
41 k
yr
23ky
r 1 S
kyr
IN1 -
IN2
IN-O
N
1 OOk
yr
41 k
yr
PS
kyr
ISky
r
: ,.,
.. (
1 OO
kvr
41 kv
r 23
kyr 1
9kyr
::,
:: /.
:.;
. . :.
. . . i. . . . .
. . . . .
Fig.
4.
Cro
ss-s
pect
ral
anal
ysis
betw
een
four
pa
lyno
logi
cal
indi
ces
(ful
l lin
e)
and
the
La90
(L
aska
r, 19
90;
Lask
ar
et a
l.,
1993
) su
mm
er
inso
latio
n tim
eser
ies
at 6
5”N
(d
otte
d lin
e).
Spec
tral
estim
ates
ar
e ba
sed
on
a Pa
rzen
sm
ooth
ing
win
dow
w
ith
119
lags
an
d an
in
terp
olat
ed
time
inte
rval
of
2
kyr,
resu
lting
in
a b
and-
wid
th
of
0.00
78.
Spec
tral
dens
ities
ar
e no
rmal
ized
an
d pl
otte
d on
a
linea
r sc
ale.
C
oher
ency
sp
ectra
ar
e pl
otte
d on
a
hype
rbol
ic
arct
ange
nt
scal
e an
d pr
ovid
ed
with
a
5%
signi
fican
ce
leve
l (o
r no
n-ze
ro
cohe
renc
e 95
%
Gpn
ifica
nce
leve
ls.
To c
onst
ruct
th
e pa
leoc
limat
ic
tim
e se
ries
. w
e us
ed a
3-k
vr
time
laa
betw
een
sum
mer
in
sola
tion
max
ima
and
sam
opel
(a
nd
arev
be
d)
min
ima.

0.43
S C 0.42
g ;; 0.41
" 6
0.40
; 0.39
0.36
0.50
0.25
4 0.00
v)
-0.25
-0.50
Sl
C 0.06
.u
S 0.04
E 0.02
z IL!
0.00
-0.06
c .o
-0.03
2 t 0.00
t 0.03
P 0.06
0.50
0.25
? 0.00
w -0.25
-0.50
“EM
SE”
slum
p Messinian
j Tortonian
6600
6600
7000
7200
7400
7600
Age
W
Fig.
5.
Com
paris
on
betw
een
the
filte
red
23-
and
41.k
yr
com
pone
nts
in t
he S
-D
inde
x an
d th
e Ea
rth’s
or
bita
l pa
ram
eter
s of
obl
iqui
ty
and
prec
essi
on
(Las
kar,
1990
; La
skar
et
al.,
19
93).
The
time
serie
s an
alys
is w
as
carr
ied
out
with
th
e C
LEA
N-P
rogr
amm
e [R
ober
ts
et a
l.,
1987
, an
d re
fere
nces
th
erei
n].
We
clea
ned
the
raw
sp
ectra
us
ing
a ga
in
leve
l of
0.6
an
d 10
0 ite
ratio
n st
eps.
The
filte
red
inte
rval
in
clud
es
all
freq
uenc
ies
with
pe
riods
be
twee
n 45
and
37
kyr
fo
r th
e ob
liqui
ty-r
elat
ed
com
pone
nts
and
betw
een
25
and
15 k
yr
for
the
prec
essi
on-r
elat
ed
com
pone
nts.
Firs
t an
d fo
urth
co
lum
n:
orig
inal
(s
olid
lin
e)
and
filte
red
(dot
ted
line)
cu
rves
fo
r th
e pr
eces
sion
an
d ob
liqui
ty-r
elat
ed
S-D
co
mpo
nent
s. Se
cond
an
d fif
th
colu
mn:
co
mpa
rison
be
twee
n th
e fil
tere
d co
mpo
nent
s (d
otte
d lin
e)
and
the
prec
essi
on
and
obliq
uity
(s
olid
lin
e)
curv
es.
Third
co
lum
n:
sedi
men
tatio
n ra
tes
afte
r H
ilgen
et
al.
(199
5),
acco
rdin
g to
thi
s str
atig
raph
ic
fram
ewor
k th
e st
udie
d in
terv
al
cove
rs
the
time
perio
d fro
m
7.59
5 to
6.5
91
Ma
with
an
ave
rage
se
dim
enta
tion
rate
of
6 c
m/k
yr.
‘EM
SE’
stan
ds
for
Early
M
essi
nian
Se
dim
ent
star
vatio
n Ev
ent.

A. Santarelli et al. /Marine Micropaleontology 33 (1998) 273-297 283
lJO!SSSOSJd
,......: : : : : : : :......: : : : : : : :......: : : :......: : : : : : : :......: : : : : : : :__~...: : : : : : : :......: :
S$SJ-pas /i&!CJ!J$llS333 UO!SSS3SJd ZNI- CNI
284 A. Santarelli et al. /Marine Micropaleontology 33 (1998) 273-297
: : ::
: --: . ..i--
‘_..i
g
-,_, : _.. : : :.._.:* : ,_...’
. .._.. k-lzi ,,; ‘X
i---
I . . .
: .
:
: . . _
. . .
i -
~ (
I
:__
:..
:._
:
.: :..
: :..
:..
:
i-
i- i

A. Santarelli et al. /Marine Micropaleontology 33 (1998) 273-297 285
(>S-D) and salinity decreases (<INl-IN2), at times of sapropel formation (see Table 3 and Figs. 5-7). The introduction of a 3-kyr time lag between max- imum summer insolation and sapropel midpoints in the age model can be held primarily responsible for the observed -4-5-kyr time lag between precession and the palynological indices. The increase in S-D and the decrease in INl-IN2 in the sapropels are consistent with the Mediterranean Pliocene record (Versteegh, 1994). The combination of a salinity de- crease and increased continental input can readily be explained by a (regional) precession driven in- crease in river discharge (run-off) due to changes in precipitation. This scenario was originally proposed for the formation of Upper Pleistocene sapropels in the Mediterranean. In particular, it was based on planktonic foraminifer surface water 6 ‘*O excursions to lighter values (Vergnaud-Grazzini et al., 1977; Thunell and Williams, 1989). Subsequent micropa- leontological investigations (planktic foraminifers, dinoflagellate cysts) in similar sapropel bearing se- quences of Plio-Pleistocene age (e.g., Rohling and Hilgen, 1991; Lourens et al., 1992; Versteegh, 1994) confirmed this interpretation.
The lower part of the Faneromeni section, on the other hand, shows a different palynological signa- ture. This signature coincides with the main change in lithology (Fig. 3). Both average salinity (INl- IN2) and continental input (S-D) show no significant difference between the carbonate-rich and carbonate- poor marly alternations (Table 3). This suggests that a clear run-off induced signal is lacking at times of precession minima in this part of the section. This absence may be explained by weaker climatic forc- ing at times of 4OO-kyr eccentricity minima. Clearly, the first sapropel coincides with a strong increase in the amplitude of precession and insolation connected with the modulation of precession by the 400-kyr eccentricity cycle (see Hilgen et al., 1995). Thus, the absence of a distinctive run-off signal in the older cycles F17 to F13 (or even FlO) can be explained by a weaker astronomical (and thus climatic) forcing at times of the 400-kyr eccentricity minimum around 7.2-7.3 Ma (see Fig. 5). Similarly, the absence of a run-off induced signal in the oldest cycles Fl to F9 can be explained by the modulating effect of an even longer term eccentricity cycle with a periodicity of f2.4 Myr (Lourens and Hilgen, 1997). In this par-
titular time interval, this cycle results in the lack of a distinct modulation of precession by the lOO-kyr eccentricity cycle and in relatively constant and low amplitude variations in precession (see Hilgen et al., 1995). Close visual inspection, however, reveals that a run-off induced signal (as indicated by the S-D index) is present in some of the more pronounced (grey) carbonate-poor layers in the lower part of the section (e.g. F2, F4 and F6). Apparently, this relationship is not found in the interval directly pre- ceding the first sapropel, resulting in average values for the palynological indices that are not significantly different for the grey and the whitish marls.
In contrast, the IN-ON index shows a consis- tent relationship with lithology throughout the entire succession, with minimum values in the grey layers and sapropels (Table 3 and Fig. 6). At first sight, the relative decrease of inner neritic species in these layers seems to be inconsistent with enhanced con- tinental run-off as indicated by the S-D maxima and INl-IN2 minima (Table 3). The IN-ON in- dex is primarily controlled by 0. isruelianum versus Spiniferites and Achomosphaera species. At present an increase in the Spiniferites and Achomosphaera group is difficult to explain, since a large number of these outer neritic species have unknown pale- oecological affinities. A decrease in the species 0. isruelianum, however, is in agreement with the run- off model, because it represents a hyper-saline and not a hypo-saline inner-neritic indicator.
4.2. The obliquity signal
The influence of the obliquity cycle is most clearly expressed in the S-D index. A similarly strong obliquity signal was also found in the Pliocene S-D record from the Mediterranean (Versteegh, 1994). During the mid-Pliocene, an increase in global ice volume is associated with obliquity-con- trolled glacial cycles. This onset of major northern hemisphere glaciations is clearly reflected in the 6180 record and quantitative planktic foraminiferal and palynological records from the Mediterranean (Lourens et al., 1992, 1996; Versteegh, 1994). The obliquity-controlled glacial cycles are reflected by high amplitude variations in S’80 and sea sur- face temperature (W-C and planktonic foraminiferal SST) which lag obliquity by 5 to 8 kyr (Versteegh,
286 A. Santarelli et al. /Marine Micropaleontology 33 (1998) 273-291
1994; Lourens et al., 1996). The strong obliquity signal in the S-D record, however, shows no lag with respect to obliquity (Versteegh, 1994). It should be noted, however, that Versteegh did not include a (3kyr) time lag in his astronomical age model, but tuned S-D maxima directly to insolation maxima. If we add the inferred 3-kyr time lag between in- solation maxima and sapropel midpoints in his age model then this would immediately affect the out- come of the cross-spectral analyses and result in a 3-kyr time lag between the precession and obliq- uity components in the insolation time series and the corresponding frequency components in the S-D record. However, irrespective of the use of the 3-kyr time lag, the obliquity lag for the S-D record re- mains significantly shorter than the lags found for the 6i8O and W-C records because these lags will increase as well. The (near) absence of an obliq- uity lag indicates that the 41-kyr component in the S-D record is not related to glacio-eustatically con- trolled sea level fluctuations but reflect changes in regional Mediterranean climate, which follow in di- rect thermal response to variations in insolation. Furthermore, the similarity in the time lag found for the precession and obliquity related variations in the S-D record suggests an identical forcing mechanism, namely precipitation induced changes in run-off (Versteegh, 1994).
Also in the Faneromeni section, the 41-kyr com- ponent in S-D is approximately in phase with obliq- uity, indicating that it should be interpreted in the same way as in the Pliocene. The lack of a clear obliquity signal in the W-C record also indicates that obliquity-controlled glacial cycles did not play a sig- nificant role in the Mediterranean during the studied time interval. In contrast, the high-resolution records from the SalJ drill core (northwestern Morocco; see Hodell et al., 1994) show a stepwise increase in al80 starting at around 7.17 Ma with superimposed high- frequency variations that are interpreted to reflect obliquity controlled glacial cyclicity. The absence of a distinct glacial controlled signal in the W-C record may be explained, however, by the less prominent character of the early Messinian glacial cycles, as compared with the Pliocene ones.
The good to excellent coherencies found between the astronomically related variations in the S-D record and the corresponding orbital parameters es-
sentially confirm the validity of the astronomical time scale. The calculated near-zero time lag be- tween obliquity and the 41-kyr component of the S-D record, however, is slightly less than the 3-kyr time lag we included in our age model and which was found for the precession component in S-D. This difference can be explained by a more direct climatic response to obliquity than to precession, by a small uncertainty in the astronomical solution (see Lourens et al., 1996) or by a combination of both.
4.3. Non-cyclic variations
The highly fluctuating but, on the longer term, relatively stable palynological pattern of the late Tortonian-early Messinian is interrupted twice, at 7.166 and at 6.68 Ma. The older shift coincides with the main change in lithology at 34 m (towards sapropels), the change to higher S-D values and the increasing influence of obliquity (Figs. 3 and 5). In Section 4.1 it has been argued that this shift may be the expression of longer-term eccentricity cycles with periodicity of -400 kyr and -2.4 Myr. But a detailed micropaleontological study of the much longer Metochia section on the Greek island of Gavdos reveals an irreversible change in benthic foraminifer communities that occur exactly at the same time (Seidenkrantz, pers. commun.) and which is interpreted to reflect an increase in bottom wa- ter salinity, more than 1 Myr before deposition of the Messinian evaporites in the Mediterranean. As a consequence these changes may be related to a (rather abrupt) change in basin configuration, which may also affect the surface water circulation and thus the palynological pattern in the Faneromeni section.
The younger floral break at 6.68 Ma coincides with the marked change in lithology from sapropels to brownish clay layers (and from marly to more calcareous sediments). This change in lithology is accompanied by a conspicuous decrease in sedimen- tation rate. The floral break is characterised by a permanent reduction in the S-D index and dinoflag- ellate cyst species diversity (see Appendix B) and the beginning of the dominance of Homotryblium tenuispinosum. Previous studies have shown that the transition from marly to more calcareous sediments occurred synchronously in a number of Cretan sec- tions and that it correlates with the replacement of
A. Santarelli et al. /Marine Micropaleontology 33 (1998) 273-297 281
sapropels by diatomites in the Metochia section on Gavdos. The marked transition and associated reduc- tion in sedimentation rate on Crete is here termed the “Early Messinian Sediment starvation Event” (EMSE) based on an inferred decrease in the ter- rigenous supply. At Faneromeni, the low percentages of pollen and spores above the transition can easily be explained by reduced continental input via river run-off. This explanation is consistent with the ear- lier interpretation of EMSE as a sediment starvation event.
On southern Crete, the abrupt transition from marls to carbonates is marked by an angular un- conformity (J. ten Veen, pers. commun.), thereby suggesting a tectonic control of the EMSE, whereas the younger limestones onlap over basement (Meu- lenkamp and Hilgen, 1986). This onlap may provide an alternative explanation for the reduction in ter- rigenous supply and, hence, sedimentation rate. The benthic foraminiferal fauna on Gavdos may indi- cate an increase in bottom water salinities at this time (Seidenkrantz, pers. commun.). This increase can be related to a deterioration of the Atlantic- Mediterranean connection as a consequence of tec- tonics (see above) or of a global sea level fall. The latter is indicated by the correlation of the EMSE with an important sea level fall at 6.3 Ma - with a corrected age of 6.68 Ma according to our time scale - in the Haq et al. (1987) global sea level chart. At Faneromeni, the dominance of Homotryblium tenuispinosum may reflect a concomitant increase in sea surface salinity. Paleohabitat studies of Homotry- blium indicate that this genus flourishes in hyper- saline lagoonal environments (Brinkhuis, 1994).
On a Mediterranean scale, the EMSE coincides approximately with the base of the Tripoli diatomite formation on Sicily and with the transition from the lower to the upper Abad marls in the Sorbas Basin in southeastern Spain (Sierro, pers. commun.). Both these transitions have been related to an increase in surface water salinity. Whatever its exact cause, it is becoming evident that the EMSE represents an event of at least Mediterranean wide importance.
5. Conclusions
High-frequency variations in palynology-based environmental proxy records of the Tortonian/
Messinian boundary section at Faneromeni (Crete, Greece) clearly reveal the influence of the Earth’s orbital cycles of precession and obliquity.
- Precession-controlled variations are related to lithology and indicate maximum continental input and minimum sea surface salinity at times of sapro- pel formation.
- The influence of obliquity is most clearly re- flected in the index of continental versus marine palynomorphs (S-D). The absence of a distinct time lag relative to obliquity indicates that the 41-kyr component in continental input is controlled by os- cillations in regional Mediterranean climate rather than by glacial cyclicity.
- The phase relations for the S-D index with precession and obliquity are essentially the same as in the Mediterranean Pliocene thereby confirming the validity of the astronomical time scale.
- A major non-cyclic change in the palynological assemblage at 6.68 Ma indicates enhanced salinity and decreased river discharge. This shift coincides with a significant drop in sedimentation rate infor- mally termed the “Early Messinian Sediment starva- tion Event”.
Acknowledgements
We are grateful to J. van Tongeren for preparing the samples and to M. Del Prete for assistance in counting. Thanks are due to W.J. Zachariasse, G. Williams and L. Edwards for critical reading of the manuscript. This study was funded by the EC spon- sored MIOMAR project. This is Miomar publication no. 7; Netherlands Research School of Sedimentary Geology publication no. 970152; Centro di Palinolo- gia publication no. 2.
Appendix A. Taxonomic appendix
A listing of taxa recognised, with full citations, is given in Appendix B. These notes cover taxa not cited in Lentin and Williams (1993). Taxa are listed alphabetically by genera. Key taxa are depicted in Santarelli (1997).
Acanthaulax sp. Remark: this is a species of Acanthaulax characterised by a
distinctly rugulate periphragm. The endophragm is smooth. The periphragm gives rise to numerous short simple spines, which are usually cap&ate, and to low parasutural ridges also covered with spines. The spines are generally proximally connected, resulting
288 A. Santarelli et al. /Marine Micropaleontology 33 (1998) 273-297
in a rugulate structure on the periphragm. On some specimens distinctive rows of more massive processes or coni around the archaeopyle margin have been observed. The archaeopyle is precingular and formed by the loss of paraplate 3”. The opercu- lum is free. The parasutural ridges delineate a gonyaulacacean tabulation characteristic for the genus. Size: body 58 x 70 pm, spines 4 pm.
Dalella sp. Remark: this is a large bowl shaped species of Dalella. The
endophragm is smooth, the periphragm is inflated, incomplete and bears parasutural septa. These reflect 4 apical, 6 precingular, l-6 paracingular and possibly l-2 postcingular paraplates. The archaeopyle is precingular and most probably formed by the loss of plate 3”. The operculum is free. The small endocyst is smooth and shows no tabulation, except for the precingular archaeopyle. Size: periphragm 97 x 96 Km, endophragm 31 x 32 pm.
Operculodinium sp. Remark: an ellipsoidal species of Opemulodinium charac-
terised by short solid processes, with tips being acuminate to capitate. The processes are regularly distributed and show no apparent paratabulation. Endo- and periphragm are closely ap- pressed. The periphragm is microgranulate. The archaeopyle is formed by the loss of paraplate 3”. The operculum is free. Size: body 35 x 32 grn, processes 7 pm.
Spiniferites sp. Remark: this species of Spiniferites is characterised by a very
thin endophragm and a thick spongy periphragm. The body is elongate up to twice as long as wide. Processes are hollow and fibrous. Size: body 47 x 19 pm, processes 13 pm.
Pyxidinopsis tuberculata, Versteegh and Zevenboom, 1995.
Edwardsiella sexispinosum, Versteegh and Zevenboom, 1995.
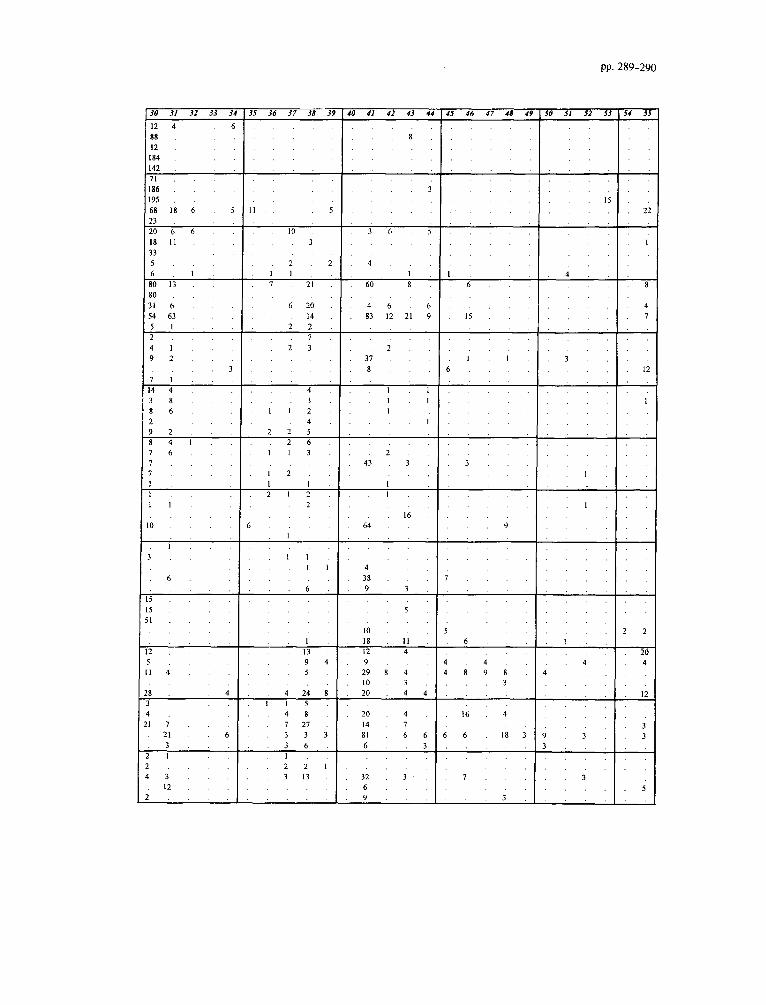
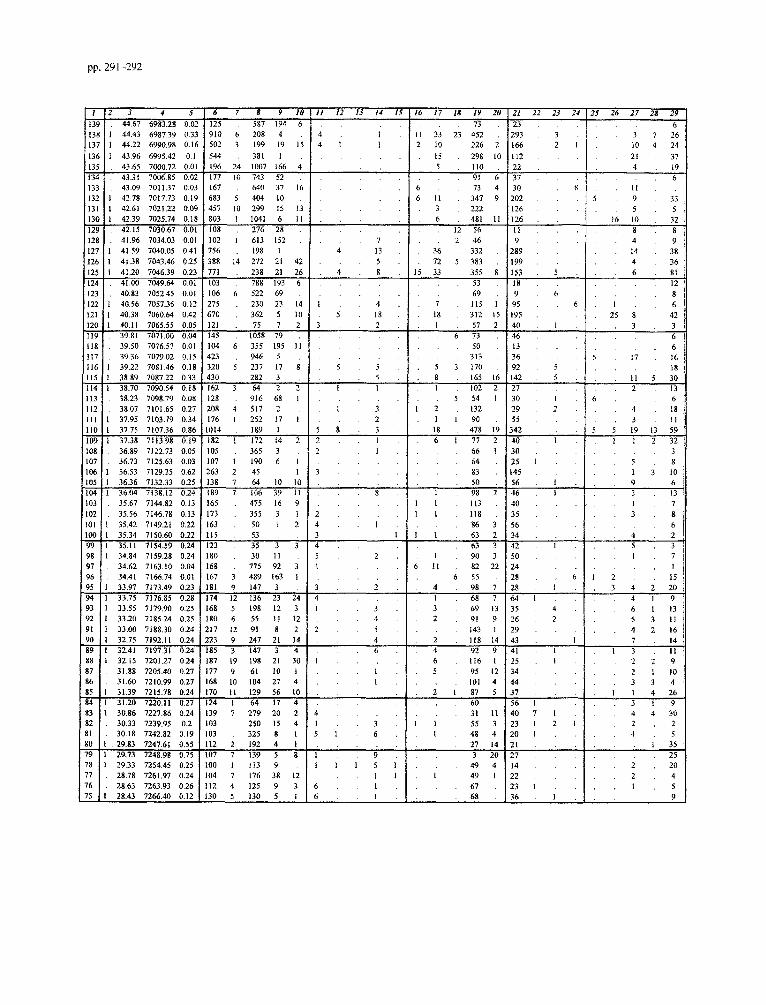
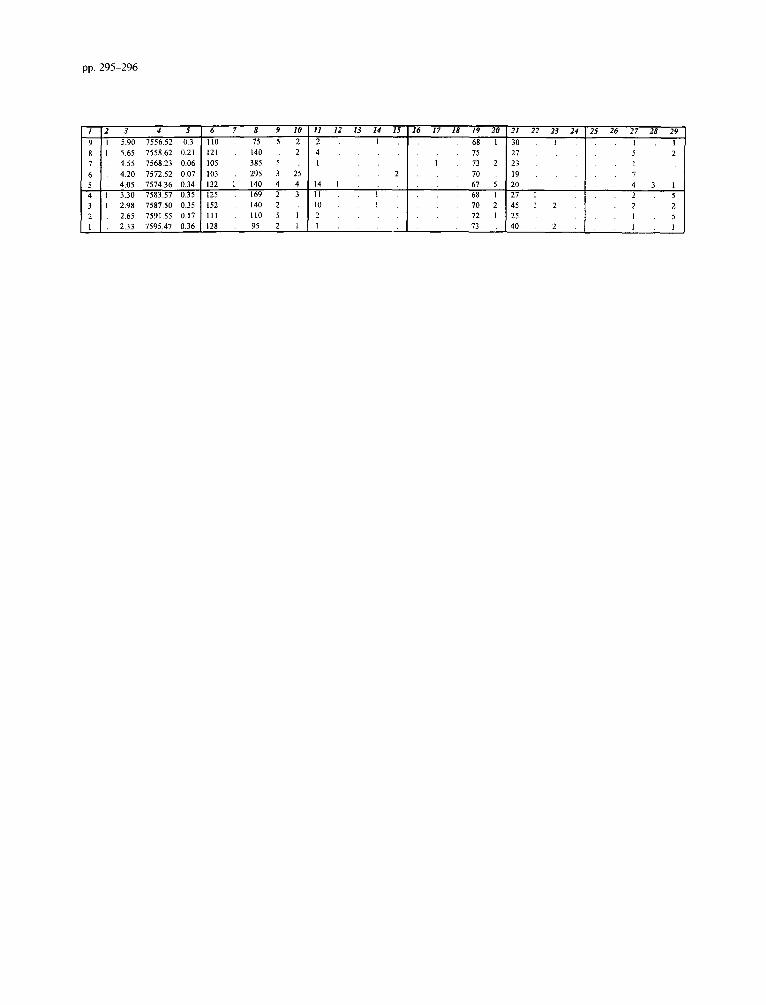
Appendix B. Unprocessed data for the Faneromeni section
Impagidinium spp. includes all Impagidinium specimens not included in other Impagidinium taxa. SpinzferiteslAchomo- sphaera spp. groups all Spiniferites and Achomosphaera speci- mens not included in other Spmferites and Achomosphaera taxa. The Gonyaulacoid spp. includes all the Gonyaulacoids not in- cluded in other Gonyaulacoid taxa. The Peridinioid spp. group adds all the unidentified cysts which are related to the Peridini- acean Family and not included in other Peridiniacean taxa.
1 Samples 2 Lithology (0 = sapropels/carbonates, 1 = marls) 3 Depth(m) 4 Age (ka) 5 Weight of sediment processed (grams) 6 Determinable dinoflagellate cysts 7 Indet. dinoflagellate cysts 8 Bisaccates
9 Pollen/Spores 10 Acritarchs 11 Impagidinium patulum (Wall, 1967) Stover and Evitt, 1978 12 Zmpagidinium aculeatum (Wall, 1967) Jan du Ch&ne et al.,
1986 13 Fibrocysta? fusiforma Edwards, 1984 14 Impagidinium spp. 15 Spiniferites pseudofurcatus (Klumpp, 1953) Sarjeant, 1970 16 Spinzferites sp. 17 Spiniferites mirabilis (Rossignol, 1964) Sarjeant, 1970 18 Achomosphaera andalousiensis Jan du Chene, 1977 19 SpinzfetiteslAchomosphaera spp. 20 Operculodinium janduchenei Head et al., 1989 21 Operculodinium israelianum (Rossignol, 1962) Wall, 1967 22 Opemulodinium sp. 23 Pyxidinopsis tuberculata Versteegh and Zevenboom, 1995 24 Tectatodinium psilatum Wall et al., 1973 25 Acanthaulax sp. 26 Hystrichokolpoma rigaudiae Deflandre and Cookson, 1955 27 Hystrichokolpoma denticulatum Matsuoka, 1974 28 Pentadinium laticinctum Gerlach, 1961 29 Lingulodinium machaerophorum (Deflandre and Cookson,
1955) Wall, 1967 30 Homotryblium tenuispinosum Davey and Williams, 1966 31 Nematosphaeropsis lemniscata Bujak, 1984 32 Nematosphaeropsis lativittatus Wrenn, 1988 33 lnvertocysta tabulata Edwards, 1984 34 Amiculosphaera umbracula Harland, 1979 35 Dalella sp. 36 Hystrichosphaeropsis obscura Habib, 1972 37 Reticulatosphaera actinocoronata (Benedek, 1972) Bujak
and Matsuoka, 1978 38 Melitasphaeridium choanophorum (Deflandre and Cookson,
1955) Harland and Hill, 1979 39 Tectatodinium pellitum Wall, 1967 40 Edwardsiella sexispinosum Versteegh and Zevenboom, 1995 41 Bitectatodinium? serratum (Head et al., 1989) Lentin and
Williams, 1993 42 Habibacysta tectata Head et al., 1989 43 Cyclopsiella granosa (Matsuoka, 1983) Head et al., 1992 44 Tubetculodinium (Rossignol, 1962) Wall, 1967 vancampoae 45 Gonyaulacoids spp. 46 Lejeunecysta fallax (Morgenroth, 1966) Artzner and
Dorhofer, 1978 47 Capillicysta fusca Matsuoka et al., 1987 48 Selenopemphix nephroides Benedek, 1972 49 Selenopemphix armageddonensis De Verteuil and Norris,
1992 50 Multispinula quanta Bradford, 1975 5 1 Selenopemphix brevispinosa Head et al., 1989 52 Peridinioids spp. 53 Reworking 54 Dapsilidinium pseudocolligerum (Stover, 1977) Bujak et al.,
1980 55 Spiniferites membranaceous (Rossignol, 1964) Satjeant, 1970

A. Santnrelli et al. /Murine Micropnleomolo~y 33 (1998) 273-297
T 201 206
205
203
202 ZTl
200 199
198
197
iz
195
194
193
192
-iE
191
189
188
187
iiz
183
182
I81
180
iiF 178
177
176
175 iz
173
172
171
170 iG
168
167
166 165 iiz
163
162
161 I60
i3ii
158
157 156
155 iz-
153
152
151 150
i?T
148 147
146
145 iii
143 142
41 40 -
2 3 4 5
I 58.74 6591.00 l.lf
I 58.51 6606.58 1.74
I 58.43 6612.00 1.13
57.80 6656.03 0.71
I 57.73 6659.42 0.55 I 57.64 6665.52 1.17
57 50 6675.00 0.64 I 57.40 6680.68 I.17
I 57.26 6688.62 0.44
57.13 6696.00 0.52
I 57 06 6701.26 0.32
I 56.88 6714.79 0.34
I 56.72 6726.82 0.55
56.54 6740.35 0.04
56.40 6749.53 0.04
1 56.22 6753.33 0.25
1 56.16 6754.59 0.92
1 56.11 6755.65 0.52
I 55.88 6760.51 0.25
55.66 6765.15 0.08
I 55.06 6778.02 0.26
I 54.83 6782.97 0.25
54.53 6789.18 0.01
I 54.33 6790.96 0.09
I 52.94 6803.35 0.09
I 52.82 6804.42 0.33
I 52.71 6805.40 0.11
52.59 6806.47 0.12
52.50 6807.93 0.06
I 52.33 6813.19 0.33 I 52.05 6821.86 0.11
I 51.76 6830.84 0.21
51.30 6844.72 0.01 5 1.20 6846.79 0.03
1 50.89 6853.19 0.25
1 50.76 6855.88 0.43
1 50.61 6858.98 0.07
50.40 6863.31 0.09
50.23 6866.93 0.02 I 50.03 6871.57 0.14
I 49.90 6874.59 0.23
I 49.76 6877.85 0.04
49.60 6881.56 0.03
49.50 6883.88 0.01
46.89
49.30
6940.38
6888.52
0.02
0.08
I
I
49.07
46.72
6893.84
6943.50
0.86 I
0.48
48.65 6903.57 0.8
I 48.53 6906.35 1.23 48.15 6915.15 0.02
I’ 4797 47.73 6919.00 6923.80 0.02 0.47
I 47.52 6928.00 0.25
I 47.34 6931.60 0.07
47.14 6935.60 0.01
1 46.53 6946.98 0.25 1 46.34 6950.47 0.25
I 46.16 6953.77 0.06 46.02 6956.33 0.03
45.60 6964.50 0.04 45.38 6969.00 0.3
45.19 6972.89 0.25
44.99 6976.99 0.13 44.82 6980.47 0.02
6 7 8 9 IO
96 4 19
172 25 4 5 46 I1
220 I 1 I
171 4 I 3 78 14
194 14 4
218 4 21
1011 II 650 17
200
972 12 413 63 38
339 1 I65 5
60 3 2 I9 I5
105 715 150
108 I 987 516 6
1080 I3 446 203 54
184 8 9 I
1171 5 217
I252 1898 503 138
109 160 2 1
326 25 4 I 386 100 3
103 325 170 13
208 391 167
167 II0 2
370 75 4 2 252 105 7 1
380 375 5 I
II6 425 8 2
374 160 3 2
474 65 4
421 85 3
104 613 ISI 6
101 305 3 I 236 I 70 2 2
371 25 I
127 215 3 3
239 937 117 211 661 217
184 265 8
203 180 5 2
I25 85 3
104 753 42
I21 490 255 6 144 6 1330 43
41 10
42 26
74 8 3 133 619 96
105 I 1587 694 766 8 417 4
248 4 293 I6 12
$61 7 353 30 21
102 287 21 2
525 231
380 8
8
II6 I3
?28 I2 402 20
197 40 I 2
570 I5 1254 70 33
I99 3 387 9
158 475 IO 1 !95
34 75 2 1
i96 405 39 I5
!42 12 289 22 I2 105 307 II
II I2 I3 14 IS
24
I7 7
5 8
6
I I
2
9
6 6
8
I
I 1
I
I 1
4
3
2
2
I
L
6 2
I
I 3 :
I I
4
5
2
4 5 4
5
1
4 4
6 !I
6
3
I6 17 Id 19 20 1 21 22 23 24
1 203 I 135 41 6
139 3 136 I 80 1 65
I 193 5 Ii20
I 138 7 65
I 220 130
I 79 I
203 130
1 258 1 I75
I 233 145
6 32
I 62 21
122 1 95 2
I 201 I144
I2 21 143 190
30 10 173 117
3 3 54 13
79 8 492 I224
.2 268 I 1210
.4 246 197
6 32 6 480 3 286
25 26 27 28 29
39
1 I 2
5 4 IO
2 5 IO
I 5 15
IO
pp. 289-290
88
12
142
71
186
195
68186 !
23
20 6 6
18 II
33
5 6 1
80 Ii
80
31 6 54 63
7 I I4 4
I
;
6
I5
I5
51
IS 36 37 38 3 40 41 42 43 44
8
3
4 6 6
x3 I2 21 9
L
37
8
I I
I I I
I
2
43 3
I I
64
I6
4
38
9 ; :
5
IO
IX II I2 4
9 29 8 4
IO 3 20 4 4
20 4
I4 7
Xl 6 6
32 3 6
45 46 47 48 4j
I
I I
6
3 :
9
7
5 6
4 4 4 R 9 8
3
16 4
5 6 IX 3
7
3
I5
4
3
I
I
I
4
1
? 3 3
3
pp. 29 l-292
640 37 16 404 IO
355 195 I1
104 I 36.M 7138.12 0.24 189 7 106 39 II 8 I 98 2 103 35.67 7144.82 0.13 165 475 I6 9 I I 113 I02 35.56 7146.78 0.13 173 355 3 I2 I I 118 IO1 1 35.42 7149.21 0.22 163 50 I 2 4 I 86 3 100 l 35.34 7150.60 0.22 115 53 3 1 I I 63 2 99 I 35.11 7154.59 0.24 123 35 3 3 4 63 3 98 I 34.84 7159.28 0.24 180 30 II 5 ..2,
; l I 90 3
97 34.62 7163.10 0.04 I68 775 92 6 It 82 22 96 34.41 7166.74 0.01 167 ; 489 163 I . ..6 5s 95 I 33.97 7173.49 0.23 181 9 147 3 3. 2 4 98 7 94 I 33.75 7176.85 0.28 174 I2 136 23 24 4 t .68 7 93 I 33.55 7179.90 0.25 168 5 L98 l2 3 1 3 3 69 13 92 I 33.20 7185.24 0.25 180 6 55 II 12 4 2 91 9 91 l 33.00 7188.30 0.24 217 I2 91 8 2 2 I ., 143 i 90 I 32.75 7192.11 0.24 223 9 247 21 14 4, .2. 11x I4 89 t 32.41 7197.31 0.24 185 3 147 3 4 6 4 92 9 88 l 32.15 7201.27 0.24 187 19 198 21 30 t 6 II6 I 87 31.88 7205.40 0.27 I77 9 61 10 I ..I 5. 95 I2 86 31.60 7210.99 0.27 168 IO 104 27 4 I 101 4 85 t 31.39 7215.78 0.24 170 II 129 56 IO ; ; 87 5 84 I 31.20 7220.11 0.27 124 I 64 I7 4 60 83 I 30.86 7227.86 0.24 I39 7 279 20 2 4 31 1; 82 30.33 7239.9s 0.2 I03 250 I5 4 I ; ; ; : 55 3 81
; 30.18 7242.82 0.19 103 325 8 I S I 6 I 48 4
80 29.83 7247.6t 0.55 It2 2 192 4 I 27 14 79 t 29.73 7248.98 0.75 107 7 139 5 8 1 9 3 20 78 I 29.33 7254.45 0.25 100 I 113 9 II I5 1 49 4 77 28.78 7261.97 0.24 104 7 176 38 I?. I I I .49 1 76 28.63 7263.93 0.26 It2 4 I25 9 3 6 : : t .67 75 1 2843 726640 012 I30 5 110 5 I 6 1 AR
’ I12 #22 j 2a::; 37 .I. 6 30 8 II 202 5 9 33 126 5 .5 I26 16 IO 32 II. 8 8 9 4 9
289 I4 3s 199 4 .36 153 5 6 8l la, I2 9 6 . 8 95. 6 .I 6 I95 25 ; : 42 40 .I 3 3 46 . 6 13 6 36 ; : I; : 16 92 5 I8 142 5 : : Ii s 30 27 2 13 30 I .6 : 29 2 4
6 : I8
40 .I. I 7 35. 3 8 56 .I.. 6 34. 4 : 2 42. I 5 3 so .I 7 24 t 28 6 ; ; is 28 I' 3 4 ; 20 64.. 4 I9 35 4 6 I I3 26 2 5 3 II 29 4 2 16 43 I : : 7 .t4 41 I I 3 II 25 .I 2 2 9 34 2 I 10 44. . ..3 3 4 37 I I4 26 56 I .I. 3 t 9

A. Snntarelli et nl. /Marine Micwpnleontology 33 (1998) 273-297
30 31 32 33 34 I35 36 37 38 39 40 41 42 43 44 145 46 47 48 49 SO 51 5.2 53 54 52
6 6 5 6
5 I 2 6 IO 3 9 3 I 4 ;
6 3 ; ; : 5 12 a I i ; I 2 I
II 7 16 5 6 6
5 ...‘.. 4 4 4 5
5
9 : : 1 26 5
5 4 8 : : 9 : :
14 IO 14 4 d
Ii IS 16 36 6 i : : : : 7
10 15 5 5 I7 10 15 5 1..,. 6.. 6 27
7 5 I
II 5 7 2 : : :
9 4 4 5 :
; I : : 21 5 4 : i : : : 4
9
9 4
18 5 21 34 ., ., 25
II 4 5 5 i 6 2
6 9 16 6 I ! : :. :
3.:::;::23 .5.............
I 1 I I 3 2 6 8
14 : 5 16
6 6 6 1 II
i 10 5
28 5
3 , ; 3 I i 2
1 I 1 5 6 ;
; : 1 1. I
6
7 1 i 1 I
2 I’ I 4 : : 1 1 I I I
7 s I3 6 3 5
23 ,..... 42.1 ..I. 1 ; : : I
I I
I 2 5 2 1 . . ...9 I ...l....,.t._._,
1 2 13
11 5 1
2
2 ,, 5 ., ; I 2 1 2
1 3 . 2
I : : : : 2 ; : : : : : : : : : 2 : I5 2 I I 1 5 5 6
2 5 20 15 1. I 10
2 1 6 I
2 I ; 1 : 6 .5 : ,, ., ., 3 4 4 6 4
9 4 I 9 4
1 3 2 1 8 1 2 I
3 2 7 4
1 3 i i : : 10
1 I
6 4 1 3 6 1 2 I
.3 I 3 9 I
5 I 2
I I : I 1 I
2
1 2
? ; 2 2
I 3 I 2 3 3
I I
1.3::: .._ ::::...:.,:::,:
1
3 4 1 3
3 4 2 2 I
2 5 I ; I i 9 I
I 6 . . I
6 2

pp. 293-294
I 4
5
; 7
3 7
‘2 I j2 8 I jl II 1 2
1 2 2 3 ; : :
;
pp. 295-296
I2 3 4 5 4 7 8 9 10 II I2 13 14 I5 16 17 I8 19 20 21 22 23 24 25 26 27 28 29
9 I 5.90 7556 52 0.3 110 7s 5 2 2 l 68 I 30 I 1 I
8 I 5.65 1558.62 0.21 121 140 2 4 75 .27 5 2
7 4.55 1568.23 0.06 105 385 5 1 I 73 2 23 I
6 4.20 7572.52 007 103 295 3 25 2 70 19 1
5 4.05 1514.36 034 132 1 140 4 4 14 I 67 5 20 4 3 I 4 I 3.30 7583.57 0.35 125 169 2 3 11 I 68 I 27 I 2 5
3 I 2.98 7587.50 0.35 152 140 2 IO I 70 2 45 I 2 2 2
2 2.65 7591 55 0.17 Ill 110 5 I 2 72 I 25 I 5
I 2.33 7595.47 0.36 128 95 2 1 I 73 40 2 I I

A. Snntarelli et 01. /Marine Micropnleontology 33 (1998) 273-297
A. Santa&i et al. /Marine Micropaleontology 33 (1998) 273-297 297
References
Brinkhuis, H., 1994. Late Eocene to Early Oligocene dinoflag- ellate cysts from the Priabonian type-area (Northeast Italy): biostratigraphy and paleoenvironmental interpretation. Palaeo- geogr., Palaeoclimatol., Palaeoecol. 107, 121-163.
Dale, B., 1985. Dinoflagellate cyst analysis of Upper Quatemary sediments in core GIK 15530-4 from the Skagetmk. Nor. Geol. Tidsskr. 65 (l-2), 97-l 02.
Edwards, L.E., Mudie, P.J., De Vernal, A., 1991. Pliocene paleo- climatic reconstruction using dinoflagellate cysts: comparison of methods. Quat. Sci. Rev. 10, 259-274.
Haq, B.U., Hardenbol, J., Vail, P.R., 1987. Chronology of fluctu- ating sea level since the Triassic. Science 235, 1136-l 167.
Harland, R., 1983. Distribution maps of Recent dinoflagellate cysts in bottom sediments from the North Atlantic and adja- cent seas. Palaeontology 26 (2), 321-387.
Head, M.J., Norris, G., Mudie, PJ., 1989. Palynology and dinocyst stratigraphy of the Miocene in ODP Leg 105 Hole 645E, Baffin Bay. Proc. ODP, Sci. Results 105, 467-514.
Hilgen, F.J., 1991a. Astronomical calibration of Gauss to Matuyama sapropels in the Mediterranean and implication for the Geomagnetic Polarity Time Scale. Earth Planet. Sci. Lett. 104, 226-244.
Hilgen, F.J., 1991b. Extension of the astronomically calibrated (polarity) time scale to the Miocene/Pliocene boundary. Earth Planet. Sci. Lett. 107, 349-368.
Hilgen, F.J., Krijgsman, W., Langereis, C.G., Lourens, L.J., Santarelli, A., Zachariasse, W.J., 1995. Extending the astro- nomical (polarity) time scale into the Miocene. Earth Planet. Sci. Lett. 136, 495-5 10.
Hodell, D.A., Benson, R.H., Kent, D.V., Boersma, A., Rakic-El Bied, K., 1994. Magnetostratigraphic, biostratigraphic and sta- ble isotope stratigraphy of an Upper Miocene drill core from the SalJ Briqueterie (northwestern Marocco): A high-resolu- tion chronology for the Messinian stage. Paleoceanography 9 (6). 835-855.
Jenkins, G.M., Watts, D.G., 1968. Spectral Analysis and its Implications. Holden Day, San Francisco, CA, 525 pp.
Krijgsman, W., Hilgen, F.J., Langereis, C.G., Zachariasse, W.J., 1994. The age of the Tortonian/Messinian boundary. Earth Planet. Sci. Lett. 121, 533-547.
Krijgsman, W., Hilgen, F.J., Langereis, C.G., Santarelli, A., Zachariasse, W.J., 1995. Late Miocene magnetostratigraphy, biostratigraphy and cyclostratigraphy in the Mediterranean, Earth Planet. Sci. Lett. 136, 475-494.
Laskar, J., 1990. The chaotic motion of the solar system: a numerical estimate of the size of the chaotic zones. Icarus 88, 266-29 1,
Laskar, J., Joutel, F., Boudin, F., 1993. Orbital, precessional, and insolation quantities for the Earth from -20 Myr to +lO Myr. Astron. Astrophys. 270, 522-533.
Lentin, J.K., Williams, G.L., 1993. Fossil dinoflagellates: Index to genera and species. AASP Contrib. Ser. 25, l-856.
Lewis, J., 1988. Cysts and sediments: Gonyaular polyedra (Lin- gulodinium machaerophorum). J. Mar. Biol. Assoc. U.K. 68, 701-714.
Lourens, L.J., Hilgen, F.J., 1997. Long-periodic variations in
the Earth’s obliquity and their relation to third-order eustatic cycles and late Neogene glaciations. Quat. Int. 40, 43-52.
Lourens, L.J., Hilgen, F.J., Gudjonsson, L., Zachariasse, W.J., 1992. Late Pliocene to early Pleistocene astronomically forced sea surface productivity and temperature variations in the Mediterranean. Mar. Micropaleontol. 19, 49-78.
Lourens, L.J., Antonarakou, A., Hilgen, F.J., Van Hoof, A.A.M., Vergnaud-Grazzini, C., Zachariasse, W.J., 1996. Evaluation of the Plio-Pleistocene astronomical timescale. Paleoceanography 11,391-413.
Matthiessen, J., 199 1. Dinoflagellaten-Zysten im Spatquart& des Europlischen Nordmeeres: Palokologie und Pallo-Ozeanogra- phie. Geomar Rep. 7, l-104.
McMinn, A., 1990. Recent dinoflagellate cyst distribution in eastern Australia. Rev. Palaeobot. Palynol. 65. 305-310.
Meulenkamp, J.E., Hilgen, EJ., 1986. Event stratigraphy, basin evolution and tectonics of the Hellenic and Calabro-Sicilian arcs. In: Wezel, EC. (Ed.), The Origin of Arcs. Dev. Geotec- ton. 2 1, 327-350.
Nijenhuis, IA., Schenau, S.J., Van Der Weijden, C.H., Hilgen, F.J., Lourens, L.J., Zachariasse, W.J., 1996. On the ori- gin of upper Miocene sapropelites: A case study from the Faneromeni section, Crete (Greece). Palaeoceanography 11 (5) 633-645.
Roberts, D.H., LJhar, J., Dreher, L.W., 1987. Time series analysis with CLEAN. I. Derivation of a spectrum. Astron. J. 93 (4), 968-989.
Rohlf, F.J., Sokal, R.R., 1981. Statistical Tables. Freeman, New York, NY, 219 pp.
Rohling, E.J., Hilgen, F.J., 1991. The eastern Merditeranean cli- mate at times of sapropel formation; a review. Geol. Mijnbouw 70,253-264.
Santarelli, A., 1997. Dinoflagellate cysts and astronomical forc- ing in the Mediterranean Upper Miocene. Ph.D. Thesis, Utrecht Univ., ISBN nr. 90-393-1812-3, 142 pp.
Thunell, R.C., Williams, D.F., 1989. Glacial-Holocene salinity changes in the Mediterranean sea: Hydrographic and deposi- tional effects. Nature 338, 493-496.
Turon, J.L., 1984. Le palynoplancton dans l’environment actuel de 1' Atlantique nord-oriental. Ivolution climatique et hy- drologique depuis le dernier maximum glaciaire. Mem. Inst. Geol. Bassin Aquitaine 17, 1-313.
Vergnaud-Grazzini, C., Ryan, W.B.F., Cita, M.B., 1977. Stable isotope fractionation, climatic change and episodic stagnation in the eastern Mediterranean during the Late Quaternary. Mar. Micropaleontol. 2, 353-370.
Versteegh, G.J.M., 1994. Recognition of cyclic and non-cyclic environmental changes in the Mediterranean Pliocene: A paly- nological approach. Mar. Micropaleontol. 23, 147- 183.
Versteegh, G.J.M., Zevenboom, D., 1995. New genera and species of dinoflagellate cysts from the Mediterranean Neo- gene. Rev. Palaeobot. Palynol. 85, 213-229.
Wall, D., Dale, B., Lohmann, G.P., Smith, W.K., 1977. The environmental and climatic distribution of dinoflagellate cysts in Modern marine sediments from regions in the North and South Atlantic Oceans and adjacent seas. Mar. Micropaleontol. 2, 121-200.