Embed Size (px)
Citation preview

1
Orbital-Selective High-Temperature Cooper Pairing Developed in the Two-Dimensional
Limit
Chaofei Liu1, Andreas Kreisel2, Shan Zhong1, Yu Li1, Brian M. Andersen3, P. J. Hirschfeld4, Jian Wang1,5,6*
1International Center for Quantum Materials, School of Physics, Peking University, Beijing 100871, China
2Institut für Theoretische Physik, Universität Leipzig, D-04103 Leipzig, Germany
3Niels Bohr Institute, University of Copenhagen, Jagtvej 128, DK-2200 Copenhagen, Denmark
4Department of Physics, University of Florida, Gainesville, Florida 32611, USA
5CAS Center for Excellence in Topological Quantum Computation, University of Chinese Academy of Sciences, Beijing
100190, China 6Beijing Academy of Quantum Information Sciences, Beijing 100193, China
*Corresponding author. E-mail: [email protected] (J.W.).
The orbital multiplicity in multiband superconductors yields orbital differentiation in normal-state properties, and can
lead to orbital-selective spin-fluctuation Cooper pairing. This phenomenon has become increasingly pivotal in clarifying
the pairing ‘enigma’ particularly for multiband high-temperature superconductors. In one-unit-cell (1-UC) FeSe/SrTiO3,
the thinnest and highest-Tc member of iron-based superconductors, the standard electron–hole Fermi pocket nesting
scenario is apparently not applicable since the Γ-centered hole pockets are absent, so the actual pairing mechanism is the
subject of intense debate. Here, by measuring high-resolution Bogoliubov quasiparticle interference, we report
observations of highly anisotropic magnetic Cooper pairing in 1-UC FeSe. From a theoretical point of view, it is important
to incorporate effects of electronic correlations within a spin-fluctuation pairing calculation, where the dxy orbital
becomes coherence-suppressed. The resulting pairing gap is compatible with the experimental findings, which suggests
that high-Tc Cooper pairing with orbital selectivity applies to 1-UC FeSe. Our findings imply the general existence of
orbital selectivity in iron-based superconductors and the universal importance of electron correlations in high-Tc
superconductors.
One-Sentence Summary: Spin-fluctuations-mediated anisotropic Cooper pairing at 2D limit is probed
preferentially driven by dxz/dyz orbitals.
INTRODUCTION
With a parent Mott-insulating phase, strongly correlated cuprates display low-energy physics dominated by the single
Cu-𝑑𝑥2−𝑦2 orbital. In comparison, iron-based superconductors with moderate correlations possess orbital multiplicity,
offering a new opportunity to host rich physics. Within the multiorbital Hubbard model, predominantly depending on
Hund’s rule coupling JH over interorbital Coulomb repulsion U (1), the so-called ‘Hund’s metal’ state can emerge (2).
Essentially, the Hund’s metal is a special metallic state ‘fingerprinted’ with orbital differentiation due to a suppression
of interorbital charge fluctuations (3-5). This orbital-decoupling effect switches the multiband system from collective to
mutually independent, individual orbital behavior. In consequence, the physics strongly depends on the individual
filling and electronic structures of each orbital separately (6). For the Fe atom, the statistically different fillings for five
3d orbitals occupied by six electrons correspond to different degrees of proximity to the half-filling Mott insulator (6, 7),
consistent with the moderately correlated, bad-metallic nature of multiband superconductors. Naturally, Cooper pairing
can also be orbital-selective and accordingly anisotropic (8), where electrons of specific orbital(s) primarily bind to
form the Cooper pairs in certain momentum directions.
Among the family of iron-based superconductors, the 11 iron chalcogenides are relatively strongly correlated (2, 9),
compared to the 111, 122, and 1111 systems. Therefore, FeSe provides a desirable platform for studying
orbital-selective Cooper pairing. Previously, the experimental discovery of orbitally selective pairing was limited to
bulk FeSe (10), with its counterpart in the two-dimensional (2D) limit, i.e., one-unit-cell (1-UC) FeSe (11, 12), scarcely
explored. In particular, for 1-UC FeSe film on SrTiO3(001), although the significantly high Tc of 55–65 K has
encouraged extensive investigations (13), the central pairing issues are still under debate (14-17). Due to the absence of
hole pockets at the Brillouin-zone (BZ) center, the generally accepted s±-wave pairing structure based on electron–hole
Fermi nesting is conceptually inapplicable. Alternative pairing conjectures were proposed theoretically, mainly

2
including s++-, incipient s±-, extended s±-, and nodeless d-wave (9, 15). A consensual pairing understanding is still
lacking, in part due to the experimental challenge of accurately distinguishing different types of bosonic modes (e.g.,
spin fluctuations vs. phonon) for mediating the coherent Cooper pairs. Revealing orbital-selective pairing would be
crucial to clarifying the widely debated pairing mechanism for 1-UC FeSe. However, whether orbital-selective Cooper
pairing can survive in FeSe in the 2D limit is not clear. There are several considerations: i) In the Hund’s metal states of
iron selenides, the localized dxy orbital is more correlated than the itinerant dxz/dyz orbitals (18-21); however, in 1-UC
FeSe, the forbidding of dxz/dyz interlayer hoppings between adjacent Fe–Se layers tends to localize the dxz/dyz orbitals
more, suppressing their orbital differentiation with dxy regarding correlation strength. ii) Orbital selectivity decreases
with electron concentration for Fe 3d orbitals (6), and thus might be expected to be weak in heavily electron-doped
1-UC FeSe. iii) A finite nematic order serves to stabilize the selective Mottness (22); hence, the absence of nematicity
in 1-UC FeSe may also diminish orbital selectivity.
RESULTS AND DISCUSSIONS
Superconducting gap anisotropy
FIG. 1. SC gap anisotropy in crystalline 1-UC FeSe/SrTiO3. (a,b) Topographic images of 1-UC FeSe/SrTiO3. Size: (a) 500×500
nm2, (b) 12×12 nm
2; set point: (a) V = 1 V, I = 500 pA, (b) V = 0.9 V, I = 500 pA. (c) Temperature dependence of the
normalized experimental tunneling spectra (open symbols) (vertically offset for clarity), which are fitted by anisotropic
Dynes function (solid curves) within the bosonic-coupling-uninfluenced bias window ~[−25,25] mV. All the spectra shown
throughout are taken at defect-free regions to avoid the influence of defect-induced bound states. Set point: V = 0.04 V, I =
2500 pA; modulation: Vmod = 0.5 mV (by default). (d) Examples of SC gaps Δ(θ) (solid line) on unhybridized electron pocket
used for the Dynes fittings (4.3 K) in (c). Here, θ is defined relative to kx (anticlockwise, +θ) in the folded BZ, which is along
the gap-minimum direction (24). Δ1,2, Δ(θ) maxima (Δ1 < Δ2). Δ(θ) obtained by BZ folding (dashed line) is shown for
comparison. (e) BCS fittings (solid curves) to the temperature-dependent Δ1,2(T) (open symbols) obtained from the Dynes
fittings in (c). For Dynes and BCS fitting details, see Supplementary Section II.
Here, by spectroscopic-imaging scanning tunneling microscopy (STM) (4.3 K unless specified), we detected in 1-UC
FeSe a highly anisotropic magnetic Cooper pairing preferentially driven by dxz/dyz orbitals. The 1-UC FeSe film was
epitaxially grown on Nb:SrTiO3(001) following the well-developed recipe (23). Topographic imaging reveals in situ the
high crystalline quality at both mesoscopic and microscopic scales [Figs. 1(a) and 1(b); for more STM characterizations,
see Supplementary Section I]. With increasing temperature T, the tunneling spectrum (dI/dV vs. V) is thermally smeared
as expected, showing multigap-type coherence peaks broadened progressively [Fig. 1(c)]. Within the
bosonic-coupling-unmodified bias region [−25,25] mV, the T-dependent spectra were fitted by Dynes function
(Supplementary Section II). Strikingly, the anisotropic Dynes formula shows reasonable fittings with appropriate
3
pairing strength Δ1,2 (Δ1 < Δ2) and thermal broadening Γ [Fig. 1(c)]. The involved angular-dependent Δ(θ) are shown in
Fig. 1(d) for the 4.3-K spectrum, exhibiting alternating gap maximum and minimum as observed in high-resolution
angle-resolved photoemission spectroscopy (ARPES) experiments (24). As for the Dynes fittings without incorporating
the anisotropic superconducting (SC) gaps, the multigap-type spectra of 1-UC FeSe evidently cannot be fitted by the
isotropic Dynes formula that only gives single pair of coherence peaks. For two summed Dynes functions with different
weights, while part of the tunneling spectra can be fitted, the parameters, especially Δ1,2 and Γ1,2, are physically
unreasonable for all five measured sets of temperature-dependent spectra (Supplementary Section II). Moreover, the
obtained Δ1,2(T) from anisotropic Dynes fittings can be fitted by the Bardeen–Cooper–Schrieffer (BCS) gap equation
[Fig. 1(e)], giving moderate transition temperatures Tc1,2 (~50 K) compared with those (~60–65 K) empirically
extrapolated from zero-bias differential conductance at different temperatures (Supplementary Section III). As already
mentioned, the form of the gap used to obtain the anisotropic fits is as shown in Fig. 1(d). Therefore, the ‘successful’
fittings to the tunneling spectra selectively by ARPES-consistent anisotropic Dynes function indirectly show the
signature of SC-gap anisotropy by an in situ tunneling-spectroscopic technique.
High-resolution imaging of anisotropic quasiparticle interference
The electronic structures of a material can be reflected in the energy-dependent Bogoliubov quasiparticle-interference
(BQPI) patterns. For 1-UC FeSe, quasiparticle scattering consists of intra- and inter-pocket components, q1, q2 and q3 [q,
momentum (k) transfer] [Fig. 2(c)], which are symmetry-equivalent (25) since only differing by a reciprocal lattice
vector, and are here defined in the folded BZ for the 2-Fe unit cell [e.g., see Fig. 4(a); adopted throughout unless
otherwise specified]. Furthermore, due to tunneling-matrix-element effects, the scattering intensities of q1, q2 and q3
decrease successively (25). The symmetry equivalence and intensity difference of q1–q3 motivate us to mainly focus on
the highest-intensity q1 scattering in the following. In general, the resolution of BQPI patterns can be controlled by the
atomic configurations of STM tips. Typically, lower-spatial-resolution tips are more sensitive to long-wavelength
modulations, corresponding to low-q scatterings (10, 26). To image the structure of q1 scattering with relatively higher
resolution, we thus intentionally decorated the tip until a high resolution for low-q scatterings is achieved, at the
expense of high-q resolution (Supplementary Section V).
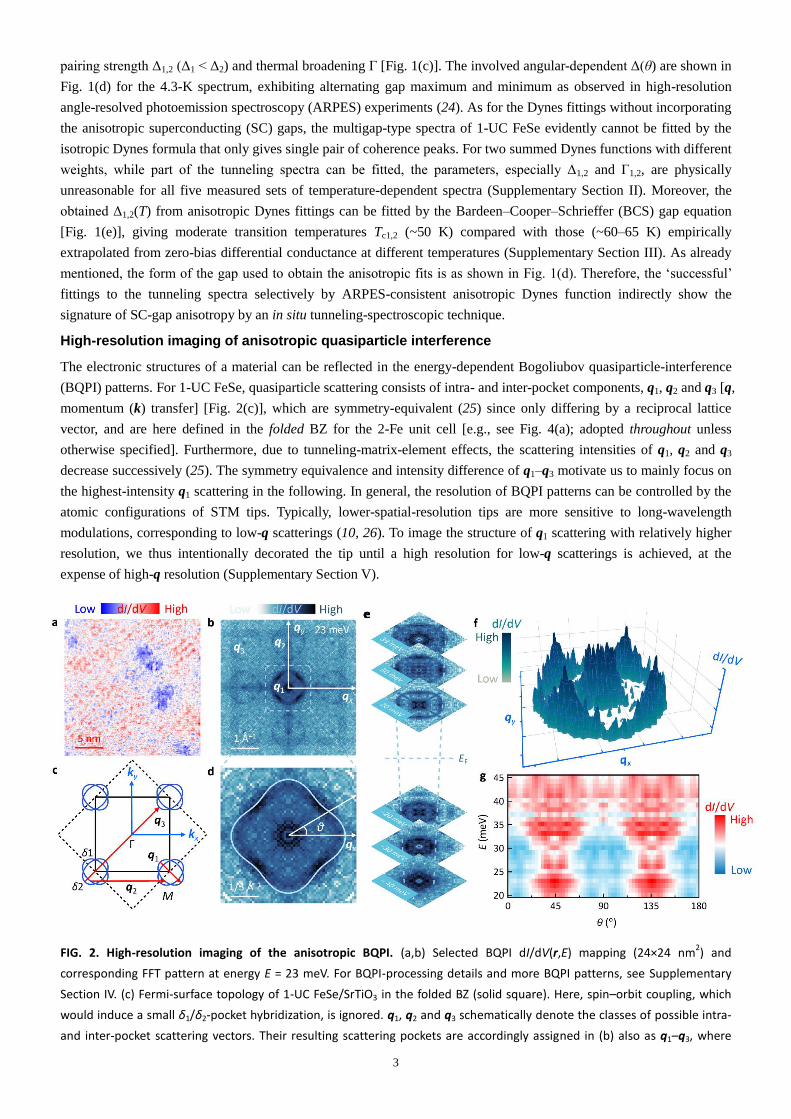
FIG. 2. High-resolution imaging of the anisotropic BQPI. (a,b) Selected BQPI dI/dV(r,E) mapping (24×24 nm2) and
corresponding FFT pattern at energy E = 23 meV. For BQPI-processing details and more BQPI patterns, see Supplementary
Section IV. (c) Fermi-surface topology of 1-UC FeSe/SrTiO3 in the folded BZ (solid square). Here, spin–orbit coupling, which
would induce a small δ1/δ2-pocket hybridization, is ignored. q1, q2 and q3 schematically denote the classes of possible intra-
and inter-pocket scattering vectors. Their resulting scattering pockets are accordingly assigned in (b) also as q1–q3, where

4
qx/qy are defined based on q–k space correspondence. (d,f) 2D and 3D plots of the zoom-in view of q1 pocket in (b). The
closed line in (d) [𝑞 = 0.576 + 0.0654 cos 4𝜃 (Å−1
)] sketches the profile of q1 pocket. To guarantee the angular-definition
consistency with Fig. 1(d), θ here is defined relative to the qx (anticlockwise, +θ). (e) Stacked FFT-BQPI q1 patterns at typical
E across the Fermi energy EF. (g) θ-dependent FFT-dI/dV(θ,E) along the q1-pocket profile as depicted in (d) at different E.
In the fast-Fourier-transformed (FFT) BQPI patterns for obtained dI/dV(r,E) mappings at positive energies E [e.g.,
Figs. 2(a) and 2(b)], the q1 scattering pockets are selectively high-resolved. This is in contrast to previous reports (27),
where the q1 pockets are smeared out by the low-q scatterings caused by spatially random defects. As the energy
decreases across the Fermi level EF, the size of q1 pocket shrinks accordingly [Fig. 2(e)], confirming the electron-type
nature of the weakly hybridized Fermi pockets δ1/δ2 at M points [Fig. 2(c)]. 2D and 3D plots of the zoom-in views for
q1 pocket, e.g., at E = 23 meV [Figs. 2(d) and 2(f)], intuitively present the fine structures with significant anisotropy.
More quantitatively, as shown in Fig. 2(g), angular-dependent FFT-dI/dV(θ,E) [θ consistently defined in Figs. 1(d) and
2(d)] was extracted along the profile of the q1 pocket as approximately described by 𝑞 = 0.576 + 0.0654 cos 4𝜃 (Å−1
)
[Fig. 2(d)] at different E, signifying the anisotropy directly visualized in FFT-BQPI images. (Notice that the BQPI data
reported in Ref. (16) for 1-UC FeSe exhibit similar signatures of q1-pocket anisotropy. Yet the analyses therein mostly
focus on the energy dependence of azimuthally integrated BQPI intensity of q1–q3. In contrast, as discussed in detail
below, our BQPI analyses are instead mainly concentrated on q1 dispersions E(q1,θ) and related self-energy effect in
different angles benefiting from our highly resolved q1 pattens.) In addition, the periodic changes of FFT-dI/dV(θ,E)
preferentially scale with Δavg.(θ) = [Δ(θ)+Δ(θ+90°)]/2 [Δ(θ) as defined in Fig. 1(d)], both showing peaks at θ =
45°+90°×N (N = 0, 1, 2, 3). [In view of the hybridization of δ1/δ2 pockets and the lack of separate δ1/δ2 resolution in
BQPI, Δ(θ) on crossed ellipse-like δ1/δ2 pockets behaves as the averaging result Δavg.(θ) of Δ(θ) and Δ(θ+90°) on
unhybridized electron pockets (28). Despite the C2-symmetric Δ(θ) and Δ(θ+90°) on unhybridized pocket, the averaged
Δ(θ), Δavg.(θ), is C4-symmetric as the BQPI pattern.]
Anisotropic self-energy effect
In the microscopic theory of superconductivity, electrons bind to form Cooper pairs via the exchange of virtual bosons
[Fig. 3(a)]. In view of the detected pairing anisotropy, clarifying the nature of the pairing interaction, i.e., electron–
boson coupling, is of immediate interest. In strong-coupling Eliashberg theory for incorporating the electron–boson
coupling, the noninteracting electronic dispersion ε(k) and single-particle density-of-states (DOS) spectrum N(E)
originally described by mean-field theory are modified. These modifications typically result in additional ‘kinks’ and
‘humps’ in ε(k) and N(E), respectively, e.g., at EΣ = Δ2+Ω (Ω, boson energy) for a multiband superconductor [Figs. 3(c)
and 3(d)]. Previously, the renormalized kink and hump anomalies have been intensively investigated as the signatures
of pairing-related electron–boson coupling, especially in high-temperature cuprate superconductors (26). In the
interacting Green’s function theory, the many-body effect likewise is encapsulated in the complex self-energy Σ(k,E)
[Fig. 3(b)] for the corresponding noninteracting state |𝒌,𝐸⟩. In detail, the real part ReΣ(k,E) describes the deviation
from bare band dispersion ε(k), and the imaginary part ImΣ(k,E) describes the energy broadening by finite lifetime (29).
Naturally, the singularity in energy-dependent Σ(k,E) at EΣ = Δ+Ω yields the bosonic kink (or hump) in the electronic
spectrum.
For iron-based superconductors, the proposals regarding specific exchanged bosons for mediating Cooper pairing
have been controversial, including suggestions of antiferromagnetic spin fluctuations (AFSF) with peaked spin
susceptibility (30), and d-orbital fluctuations induced by electron–phonon interaction (31). As discussed in the
following, the differentiation of these distinct types of electron–boson coupling is encoded in the self-energy effects
with different characteristics (32). For 1-UC FeSe, the phonon suggested to participate in enhancing pairing potential is
the optical branch with flat dispersion [upper inset of Fig. 3(c)], rather than the highly dispersive acoustic branch (33).
By contrast, within proposed extended s±- and nodeless d-wave pairings, the related Q ≈ <2π,0> AFSF are strongly
momentum-dependent [lower inset of Fig. 3(c)]. Here, <2π,0> denotes the (2π,0)-equivalent vectors [(±2π,0) and
(0,±2π)] in unit of 1/a0 (a0, lattice constant) in the folded BZ (i.e. <π,π> in unfolded BZ). The self-energy Σ(k,E), which
can describe the electron–boson coupling, accordingly shows the momentum structures highly dependent on the
concrete type of involved bosons (32). To be specific, for a multiband system coupled to AFSF sharply peaked at

5
momenta ~<2π,0>, the kinematic constraints 𝐸𝒌𝑗
= 𝐸𝒌−𝑸𝑖 − Ω (i,j, band indexes) require the electron–AFSF coupling,
i.e., the self-energy effect, be accordingly momentum-dependent (anisotropic), reminiscent of the above-observed
anisotropic pairing. Similarly, a multiband system coupled to a dispersionless phonon is expected to exhibit
momentum-independent (isotropic) self-energy. The anisotropic band renormalization due to the self-energy by AFSF
coupling is evidently in sharp contrast to the isotropic behavior by phononic coupling, providing a highly promising
approach in differentiating AFSF and phonon modes.
FIG. 3. Anisotropic self-energy effect in experiments. (a,b) Cartoon of the boson-mediated Cooper pair and diagram of the
lowest-order self-energy induced by electron–boson coupling. (c,d) Electronic dispersion E(k) and quasiparticle-DOS
spectrum N(E) (reproduced from ref. (23)) both modified by electron–boson coupling, resulting in a kink and a hump
(arrows), respectively, at Δ2+Ω for the multi-band superconductivity. The insets in (c) are the schematics of the momentum
distributions of isotropic phonon and anisotropic AFSF in BZ, showing the flat and highly dispersive momentum structures,
respectively. (e) FFT-dI/dV(qx,qy,E) for the q1 pocket plotted in E–q space. The kinks (arrows) in q1 dispersions (dotted lines)
are highlighted along (0,−0.5)2π/a0 [=(0,−π)] and (0.5,0.5)2π/a0 [=(π,π)] directions. (f) Illustrating the θ definition in
FFT-BQPI q1 pattern. (g) Lineplots of FFT-dI/dV(q,E) at different E (𝐸 ∈ [20,45] meV) (vertically offset for clarity) for θ = 45°
(azimuthally averaged over θ±5°), exemplifying the extraction method of the dispersion E(q) for q1 pocket. The red lines are
the Gaussian fittings with linearly tilted background, whose peak positions (red symbols) give the q of FFT-dI/dV(q,E)-linecut
maxima at different E. (h) Extracted E(q) along representative directions (horizontally offset for clarity). The spectral weights

6
Δσb.k. of E(q) modifications (arrows) with respect to the noninteracting backgrounds (solid lines) are shown as hatched areas,
which can be used to approximately quantify the real part of self-energy ReΣ(EΣ ~37 meV). (i,k) Typical normalized tunneling
spectrum for 1-UC FeSe, where the bosonic hump is highlighted in shadow. (j) Measured Δσb.k. (solid symbols) as a function
of θ, overlaid by the eye-guiding line for clarity of the anisotropy.
Experimentally, the self-energy effect can be detected by ARPES by measuring the spectral function A(k,E), yet only
for the occupied states below EF. However, in previous experiment (23), the bosonic mode was found coupling more
strongly to electron-like states above EF for 1-UC FeSe (23). Therefore, for the study of self-energy in 1-UC FeSe,
STM-based BQPI is preferred because of the capability of accessing the unoccupied states above EF. Figure 3(e) plots
the complete representation of measured FFT-BQPI dI/dV(q,E) in E–q space for the empty states, with (0,−π) and (π,π)
directions highlighted. Preliminarily, in this E–q presentation, the ‘exposed’ dispersions E(q) (dotted lines) for the q1
pocket are seemingly not equivalent in different directions [e.g., (0,−π) vs. (π,π)]. [Given the relation q1=2(k±G’),
where G’=<π,π>, E(q) for q1 carries conceptually the information of electronic dispersion E(k).] Inspired by the
contrasting self-energy effects for different bosonic modes, we then extracted the angular-dependent E(q) from the
linecuts of FFT-BQPI patterns at different energies [Figs. 3(f)–3(h)], which is commonly believed highly challenging
for STM technique. The positive slope of obtained E(q) [Fig. 3(h)] agrees quantitatively with the aforementioned
electron-type nature of the M-centered Fermi pockets [Fig. 2(e)]. More intriguingly, E(q), particularly for θ=0° and 11°,
shows band-renormalized kinks at EΣ ~37 meV, coinciding in energy with the bosonic hump detected in dI/dV (i.e.,
DOS) spectrum [Figs. 3(i) and 3(k)] (23). Strictly speaking, the inelastic tunneling can be additionally considered to
give rise to the bosonic hump (34), which is typically ascribed to spin or nematic fluctuations in specific iron-based
superconductors (e.g. LiFeAs) (35, 36). In spite of these facts, the kink–hump correspondence at a common energy
scale implies the true existence of the reconstructions in E(q) with a bosonic-coupling origin.
In the pure two-band scenario, the bosonic kink is selectively resolved at Δ2+Ω (band #2) instead of Δ1+Ω (band #1)
(23). For E(q) extracted from the FFT-BQPI data without direct band resolution, the evident kink feature [Fig. 3(h)] is
thus actually induced in band #2. To quantify the self-energy effect, we integrated approximately as ReΣ(EΣ ~37 meV)
the shadowed spectral weight Δσb.k. of the bosonic kink deviating from the noninteracting background [Fig. 3(h)] (for
θ=22° and 45°, the relatively weak bosonic kinks can be accordingly assigned at EΣ ~37 meV in view of the
pronounced kink anomalies clearly identifiable for θ=0° and 11°; for alternative ReΣ definition, see Supplementary
Section VI.A). Δσb.k.(θ) extracted at different directions is plotted in Fig. 3(j). Remarkably, Δσb.k. is highly anisotropic
with fluctuating amplitude of an intrinsic nature (Supplementary Section VI.B). In particular, Δσb.k.(θ) peaks at θ =
90°×N, consistent with the peaked positions of inter-pocket pair scatterings Q ≈ <2π,0> for AFSF in extended s±- and
nodeless d-wave pairings for 1-UC FeSe. Based on the above-introduced different self-energy effects induced by AFSF
and a phonon mode, the striking anisotropy in Δσb.k.(θ) directly points to an AFSF-coupling explanation of the bosonic
kink, leaving the phonon mechanism likely irrelevant. All above results combined together highlight an anisotropic
pairing possibly mediated by ~<2π,0> AFSF coupling (Supplementary Section VI.C) (37).
Orbital-selective Cooper pairing
As summarized in Fig. 4(b), the major findings in our study consist of the two-gap properties of the spectra with
distinct Δ1,2(T) leading to anisotropic gaps Δ(θ) contributed by the Cooper pairing via Q ≈ <2π,0> AFSF. These AFSF
nest the weakly hybridized and sign-reversed electron pockets at adjacent M points, although Q is not a perfect
Fermi-nesting vector. Especially, the concluded ~<2π,0> AFSF from anisotropic self-energy can preliminarily exclude
s++- and incipient s±-wave, constraining the dominated pairing scenario with a high possibility as extended s±- or
nodeless d-wave. Besides our self-energy analysis based on the higher-energy BQPI data, other methods focusing on
the lower-energy BQPI results can alternatively address the pairing state. A common strategy for analyzing these BQPI
data near EF can be deducing the momentum structure of SC gaps, and then comparing with calculations under different
pairing scenarios (10).
Yet, the exact physical nature of the SC-gap anisotropy remains unclarified. In 1-UC FeSe, electron correlations are
predominately dependent on Hund’s coupling JH (38), and the orbital-selective physics would be dominant in principle.

7
Correspondingly, the Cooper pairing is expected to be orbital-selective, where, based on Δ(𝒌) = ∑ Δ𝑖𝑖 (𝒌)𝑊𝑖(𝒌)
[𝑊𝑖(𝒌), weight of orbital i], electrons of dominant weight primarily participate to form the Cooper pairs. The SC gaps
are thus expected to be highly anisotropic because of the orbital anisotropy, with magnitude following the weight of
specific orbital(s) over the (unhybridized) Fermi pocket (8).
FIG. 4. Orbital-selective Cooper pairing. (a) Schematic of the FeSe lattice. The solid square denotes the 2-Fe unit cell that
corresponds to the folded BZ. (b) Summary of the measured SC-gap structure in the folded BZ. The sign of the gap function
is encoded by different colors (exemplified within nodeless d-wave). (c) Cartoons of the Fe 3d orbitals. (d) Weight
distributions of the Fe 3d orbitals over the Fermi surface from our tight-binding parametrization (30). (e) Relevant pairing
channels as derived from spin-fluctuation pairing mechanism. Γxy,xy (Γxz,yz), intra-dxy-orbital (inter-orbital, dxz↔dyz)
pair-scattering strength. (f) Theoretical Δ(θ) on unhybridized electron pocket δ1, obtained based on the spin-fluctuation (SF)
approach including orbital-dependent quasiparticle weights ( √𝑍𝑥𝑦 =0.4273, √𝑍𝑥𝑧 = √𝑍𝑦𝑧 =0.9826) (30, 42). The
ARPES-measured (24) and Dynes-fitting Δ(θ) are plotted for direct comparison. (g) θ dependences of Δavg.(θ), Δσb.k.(θ), and
orbital weights (o.w.) of dxy and dxz+dyz on outer hybridized pockets. Δ(θ) is plotted as Δavg.(θ) here given the lack of separate
δ1/δ2 resolution in folded BZ for BQPI-measured Δσb.k.(θ). The angle positions corresponding to <2π,0> are highlighted by
the purple solid lines in the middle and bottom panels.
To determine whether the SC-gap anisotropy is orbital-driven, we present the orbital weights from a tight-binding
model for the five Fe 3d orbitals [Fig. 4(c)] over the Fermi surface [Fig. 4(d); see Supplementary Section VII for details]
(30). The Se 4p orbitals are neglected because of their negligible DOS near EF, which is several orders of magnitude
lower than that of Fe 3d orbitals (39). A more quantitative theoretical approach using Wannier functions for the surface
layer reveals that, tails of the Wannier functions originating from Se surface atoms dominate the real space imaging
(40). For the analysis of the BQPI at small wave vectors q, the modulations at length scales of the unit cell or smaller,
such as the intra-unit-cell shapes and features of the Wannier states in which tunnelling occurs, do not play a role. The
pairing structure can be understood in terms of orbital-dependent pairing interactions Γa,b such that the intra-orbital,
inter-pocket pairing interaction Γxy,xy via the weight-dominated dxy channel naturally drives the gap maxima at the
pocket ‘convex ends’ [θ=135°, 315°; Fig. 4(e)]. Additionally, for the pocket ‘flat’ parts (θ=45°, 225°), the inter-orbital
(dxz↔dyz), inter-pocket interaction Γxz,yz drives a sign-changing pairing gap [Fig. 4(e)]. In order to explain two pairs of
coherence peaks [as seen in the tunneling spectra, Fig. 1(c)], two maxima of the order parameter are needed, which can

8
be achieved with the mentioned pairing interactions being comparable in strength. In a simple approach within
modified spin-fluctuation pairing, the second gap maximum, i.e. Δ1 at θ=45°/225°, is obtained from selectively
suppressing the coherence of the dxy orbital, while leaving the dxz and dyz more coherent and degenerate. This can be
parametrized via orbital-dependent quasiparticle weights Za, i.e. √𝑍𝑥𝑦<√𝑍𝑥𝑧= √𝑍𝑦𝑧 (Supplementary Section VII) (30).
To summarize, the coherence of dxy orbital is selectively suppressed for relatively ‘strengthening’ the inter-orbital
(dxz↔dyz) pairing, such that the weak inter-orbital interaction can still drive a second gap maximum. Meanwhile, the dxy
coherence should not be over-suppressed to ensure the intra-orbital (dxy↔dxy) pairing remains sufficient for preserving
the first gap maximum at θ=135°/315°. As shown in Fig. 4(f), the gap structures with two maxima as detected by
spectroscopic techniques are well theoretically reproduced when evaluated on the unhybridized Fermi pockets, directly
demonstrating the dxz+dyz-orbital selectivity for Cooper pairing (for detailed discussions, see Supplementary Section
VIII).
The concluded orbital-selective pairing and the anisotropic-Δσb.k.(θ)-implied AFSF [Fig. 3(j)] are mutually consistent.
Δσb.k.(θ)-described AFSF are derived from the local, instantaneous Coulomb repulsions, which are normally larger for
intraorbital pairing (41). The orbital-dependent Coulomb repulsions result in the orbital-selective pairing interactions
(i.e., AFSF) peaked at Q ≈ <2π,0> for 1-UC FeSe, and then the orbital-selective pairing. Such orbital sensitivity is a
unique feature of AFSF pairing, appearing exclusive from the retarded, attractive, and orbitally undifferentiated
phononic pairing (41). The observed orbital-selective pairing is thus intrinsic to the AFSF for multiorbital
superconductivity, and is inversely further substantiated by the detected electron–AFSF coupling identified as the
bosonic-kink origin.
Figure 4(g) summarizes the angular dependences of Δavg.(θ), Δσb.k.(θ), and orbital-weight distribution of dxy and
dxz+dyz orbitals from our tight-binding model over outer hybridized pockets. Comparison of Δavg.(θ) and Δσb.k.(θ) reveals
that they are out-of-phase with a 45° phase shift. Note that according to the above quasiparticle-weight-dressed
spin-fluctuation theory, the dxz/dyz orbitals are more coherent (√𝑍𝑥𝑧/𝑦𝑧 > √𝑍𝑥𝑦). Evidently, the 90°×N-peaked Δσb.k.(θ)
corresponding to the Q ≈ <2π,0> AFSF coupling is contributed by dxz/dyz orbitals. For the dxz/dyz components with
higher coherence, the bosonic coupling is then expected to be stronger, in agreement with the measured self-energy
effect Δσb.k.(θ) showing maxima where the dxz/dyz orbital content is largest.
DISCUSSION AND PERSPECTIVES
Microscopically, the orbital-selective Cooper pairing originates from the orbital-selective correlations via renormalized
quasiparticle weights of different orbitals. Similar to other iron chalcogenides (bulk FeSe (18), AxFe2−ySe2 (19), and
Fe1+ySexTe1−x (20)), in 1-UC FeSe, while the weakly correlated dxz/dyz orbitals remain itinerant, the dxy orbital is strongly
localized by strong correlations (21). The degree of electron correlations is reflected in quasiparticle weight Z, which,
with increasing correlations, decreases from unity in noninteracting systems to zero in Mott insulators (5). Accordingly,
for 1-UC FeSe, compared with the strongly correlated dxy orbital, the less correlated dxz/dyz orbitals show considerably
larger quasiparticle weight as we adopted in the dressed spin-fluctuation theory. In the scattering process of a Cooper
pair within the AFSF scenario, the scattering strength is cooperatively determined by a) the quasiparticle coherence of
initial and final states, and b) the spin susceptibility χ(q) (30, 42). In consequence, compared with the small-Z dxy orbital,
the large-Z dxz/dyz orbitals prevail with significantly lager quasiparticle coherence and spin susceptibility. Therefore, in
1-UC FeSe, the orbital-selective Cooper pairing emerges by suppressing the pair scatterings involving the less coherent
dxy orbitals. Within this picture, the observation that the AFSF dominate at Q ≈ <2π,0> may naturally arise from the
orbitally resolved spin susceptibility of the more coherent dxz/dyz orbitals. The spin susceptibility of the less coherent dxy
orbital is in such picture highly suppressed via renormalization by the relatively small quasiparticle weight, making
negligible contribution to the detected AFSF.
Our results for the angle dependence of pairing strength support the picture of 1-UC FeSe as a high-Tc
superconductor with orbital-selective pairing (10) in the 2D limit despite quantum fluctuations. We presented an
analysis of self-energy deduced from our BQPI data that independently confirm the conclusion. The influence of
speculated pseudogap behavior at 60–70 K (43) on selective pairing is negligible at 4.3 K, where 1-UC FeSe/SrTiO3 is

9
in deeply Cooper-paired SC regime. Given that FeSe is the building block of iron chalocogenides, the verification of
selective pairing in 1-UC FeSe likely indicates its general existence in extensive multiorbital iron-based
superconductors, regardless of the SC spectra being different (‘U’-shaped vs. ‘V’-shaped). The details of SC order
parameter (yielding fully gapped or nodal/quasinodal structure) depend on whether the Fermi pockets intersect with the
nodal lines of the gap function. Hence, for multiorbital SC systems with distinct Fermi-surface topology (e.g. 1-UC
FeSe vs. bulk FeSe), the SC-spectrum lineshapes can be very different even if the underlying pairing mechanism are
identical (i.e. both mediated with spin fluctuations, and showing orbital-selective character).
Most fundamentally, the orbital-selective correlations derived from Hund’s metallic state are expected to dominate
such orbitally selective superconductivity. This suggests even when multiorbitals are involved, only specific orbital(s)
is essentially responsible for the pairing as in single-orbital-dominated cuprates. Our finding thus implies the doped
‘parent’ Mott insulator scenario for driving superconductivity is generally applicable for both copper- and iron-based
superconductors. The revealed universal importance of electron correlations in these two main categories of high-Tc
superconductors can be of basic significance for a unified formulism of high-Tc SC mechanism.
Atomically manipulating different degrees of freedom and separately revealing their roles in determining various
electronic properties are at the heart of modern quantum technologies and future functional quantum-device
applications. The discovered orbital-selective pairing uncovers the physical mechanism for how orbital degree of
freedom ‘shapes’ the high-Tc superconductivity microscopically. Explorations by taking into account additional
electronic degrees of freedom (charge, orbital, spin, valley) may lead via analogous mechanisms to previously
unexpected emergent phenomena. 1-UC FeSe with dxz/dyz orbitals primarily responsible for pairing, in contrast to bulk
FeSe dominated by dyz orbital instead (10), points to a method for orbital control via tailoring thickness. By further
revealing the correspondence between orbitals and more electronic properties, the orbital manipulation with atomic
precision may be stimulated for future studies with prospects for detecting orbit-related quantum effects and
developing functional orbitronics.
SUPPLEMENTARY MATERIALS
SI. STM Characterizations of 1-UC FeSe/SrTiO3
SII. Dynes-Function Fittings
SIII. Empirical Tc Extrapolations
SIV. BQPI Data
SV. Atomically Decorated Tips with Different q Sensitivity
SVI. Further Discussions Related to Measured Self-Energy Effect
SVII. Calculated Spectral-Weight Distribution of Fe 3d Orbitals and SC-Gap Structures
SVIII. Detailed Discussions About Orbital-Selective Pairing Dominated by dxz+dyz Orbitals
Figures S1–S10
Tables S1–S2
References (44)–(58)
REFERENCES AND NOTES
1. K. Haule, G. Kotliar, Coherence–incoherence crossover in the normal state of iron oxypnictides and importance of Hund's
rule coupling. New J. Phys. 11, 025021 (2009).
2. Z. P. Yin, K. Haule, G. Kotliar, Kinetic frustration and the nature of the magnetic and paramagnetic states in iron pnictides
and iron chalcogenides. Nat. Mater. 10, 932-935 (2011).
3. L. de' Medici, S. R. Hassan, M. Capone, X. Dai, Orbital-selective Mott transition out of band degeneracy lifting. Phys. Rev.
Lett. 102, 126401 (2009).
4. L. de’ Medici, Hund’s coupling and its key role in tuning multiorbital correlations. Phys. Rev. B 83, 205112 (2011).
5. L. Fanfarillo, E. Bascones, Electronic correlations in Hund metals. Phys. Rev. B 92, 075136 (2015).
6. L. de' Medici, G. Giovannetti, M. Capone, Selective Mott physics as a key to iron superconductors. Phys. Rev. Lett. 112,
177001 (2014).
10
7. T. Misawa, K. Nakamura, M. Imada, Ab initio evidence for strong correlation associated with Mott proximity in iron-based
superconductors. Phys. Rev. Lett. 108, 177007 (2012).
8. R. Yu, J.-X. Zhu, Q. Si, Orbital-selective superconductivity, gap anisotropy, and spin resonance excitations in a multiorbital
t-J1-J2 model for iron pnictides. Phys. Rev. B 89, 024509 (2014).
9. A. Kreisel, P. J. Hirschfeld, B. M. Andersen, On the Remarkable Superconductivity of FeSe and Its Close Cousins. Symmetry
12, 1402 (2020).
10. P. O. Sprau et al., Discovery of orbital-selective Cooper pairing in FeSe. Science 357, 75–80 (2017).
11. Q.-Y. Wang et al., Interface-Induced High-Temperature Superconductivity in Single Unit-Cell FeSe Films on SrTiO3. Chin.
Phys. Lett. 29, 037402 (2012).
12. W.-H. Zhang et al., Direct Observation of High-Temperature Superconductivity in One-Unit-Cell FeSe Films. Chin. Phys.
Lett. 31, 017401 (2014).
13. Z. Wang, C. Liu, Y. Liu, J. Wang, High-temperature superconductivity in one-unit-cell FeSe films. J. Phys.: Condens. Matter
29, 153001 (2017).
14. D. Huang, J. E. Hoffman, Monolayer FeSe on SrTiO3. Annu. Rev. Condens. Matter Phys. 8, 311-336 (2017).
15. C. Liu, J. Wang, Heterostructural one-unit-cell FeSe/SrTiO3: from high-temperature superconductivity to topological
states. 2D Mater. 7, 022006 (2020).
16. Q. Fan et al., Plain s-wave superconductivity in single-layer FeSe on SrTiO3 probed by scanning tunnelling microscopy.
Nat. Phys. 11, 946-952 (2015).
17. H. Zhang, Z. Ge, M. Weinert, L. Li, Sign changing pairing in single layer FeSe/SrTiO3 revealed by nonmagnetic impurity
bound states. Commun. Phys. 3, 1-8 (2020).
18. J. Maletz et al., Unusual band renormalization in the simplest iron-based superconductorFeSe1−x. Phys. Rev. B 89, 220506
(2014).
19. M. Yi et al., Observation of temperature-induced crossover to an orbital-selective Mott phase in A(x)Fe(2-y)Se2 (A=K, Rb)
superconductors. Phys. Rev. Lett. 110, 067003 (2013).
20. Z. K. Liu et al., Experimental observation of incoherent-coherent crossover and orbital-dependent band renormalization
in iron chalcogenide superconductors. Phys. Rev. B 92, 235138 (2015).
21. M. Yi et al., Observation of universal strong orbital-dependent correlation effects in iron chalcogenides. Nat. Commun. 6,
7777 (2015).
22. R. Yu, J. X. Zhu, Q. Si, Orbital Selectivity Enhanced by Nematic Order in FeSe. Phys. Rev. Lett. 121, 227003 (2018).
23. C. Liu et al., Detection of bosonic mode as a signature of magnetic excitation in one-unit-cell FeSe on SrTiO3. Nano Lett.
19, 3464−3472 (2019).
24. Y. Zhang et al., Superconducting Gap Anisotropy in Monolayer FeSe Thin Film. Phys. Rev. Lett. 117, 117001 (2016).
25. Z. Du et al., Sign reversal of the order parameter in (Li1−xFex)OHFe1−yZnySe. Nat. Phys. 14, 134-139 (2018).
26. Ø . Fischer, M. Kugler, I. Maggio-Aprile, C. Berthod, C. Renner, Scanning tunneling spectroscopy of high-temperature
superconductors. Rev. Mod. Phys. 79, 353-419 (2007).
27. D. Huang et al., Revealing the Empty-State Electronic Structure of Single-Unit-CellFeSe/SrTiO3. Phys. Rev. Lett. 115,
017002 (2015).
28. Z. Du et al., Scrutinizing the double superconducting gaps and strong coupling pairing in (Li1-xFex)OHFeSe. Nat. Commun.
7, 10565 (2016).
29. T. Valla, A. V. Fedorov, P. D. Johnson, S. L. Hulbert, Many-Body Effects in Angle-Resolved Photoemission: Quasiparticle
Energy and Lifetime of a Mo(110) Surface State. Phys. Rev. Lett. 83, 2085 (1999).
30. A. Kreisel et al., Orbital selective pairing and gap structures of iron-based superconductors. Phys. Rev. B 95, 174504
(2017).
31. H. Kontani, S. Onari, Orbital-fluctuation-mediated superconductivity in iron pnictides: analysis of the five-orbital
Hubbard-Holstein model. Phys. Rev. Lett. 104, 157001 (2010).
32.M. P. Allan et al., Identifying the 'fingerprint' of antiferromagnetic spin fluctuations in iron pnictide superconductors. Nat.
Phys. 11, 177-182 (2014).
33. J. J. Lee et al., Interfacial mode coupling as the origin of the enhancement of Tc in FeSe films on SrTiO3. Nature 515,
11
245-248 (2014).
34. P. Hlobil, J. Jandke, W. Wulfhekel, J. Schmalian, Tracing the Electronic Pairing Glue in Unconventional Superconductors via
Inelastic Scanning Tunneling Spectroscopy. Phys. Rev. Lett. 118, 167001 (2017).
35. S. Chi et al., Scanning Tunneling Spectroscopy of Superconducting LiFeAs Single Crystals: Evidence for Two Nodeless
Energy Gaps and Coupling to a Bosonic Mode. Phys. Rev. Lett. 109, 087002 (2012).
36. Z. Sun et al., Spectroscopic evidence of nematic fluctuations in LiFeAs. Phys. Rev. B 100, 024506 (2019).
37. D.-H. Lee, Routes to High-Temperature Superconductivity: A Lesson from FeSe/SrTiO3. Annu. Rev. Condens. Matter Phys.
9, 261-282 (2018).
38. S. Mandal, P. Zhang, S. Ismail-Beigi, K. Haule, How Correlated is the FeSe/SrTiO3 System? Phys. Rev. Lett. 119, 067004
(2017).
39. B. Li, Z. W. Xing, G. Q. Huang, D. Y. Xing, Electron-phonon coupling enhanced by the FeSe/SrTiO3 interface. Appl. Phys.
Lett. 115, 193907 (2014).
40. A. Kreisel et al., Towards a quantitative description of tunneling conductance of superconductors: Application to LiFeAs.
Phys. Rev. B 94, 224518 (2016).
41. A. Chubukov, Pairing Mechanism in Fe-Based Superconductors. Annu. Rev. Condens. Matter Phys. 3, 57-92 (2012).
42. A. Kreisel, B. M. Andersen, P. J. Hirschfeld, Itinerant approach to magnetic neutron scattering of FeSe: Effect of orbital
selectivity. Phys. Rev B 98, 214518 (2018).
43. B. D. Faeth et al., Incoherent Cooper Pairing and Pseudogap Behavior in Single-Layer FeSe/SrTiO3. Phys. Rev. X 11,
021054 (2021).
44. C. L. Song et al., Imaging the Electron-Boson Coupling in Superconducting FeSe Films Using a Scanning Tunneling
Microscope. Phys. Rev. Lett. 112, 057002 (2014).
45. R. C. Dynes, V. Narayanamurti, J. P. Garno, Direct Measurement of Quasiparticle-Lifetime Broadening in a Strong-Coupled
Superconductor. Phys. Rev. Lett. 41, 1509-1512 (1978).
46. R. C. Dynes, J. P. Garno, G. B. Hertel, T. P. Orlando, Tunneling Study of Superconductivity near the Metal-Insulator
Transition. Phys. Rev. Lett. 53, 2437-2440 (1984).
47. J. Bardeen, L. N. Cooper, J. R. Schrieffer, Theory of Superconductivity. Phys. Rev. 108, 1175-1204 (1957).
48. M. J. Lawler et al., Intra-unit-cell electronic nematicity of the high-Tc copper-oxide pseudogap states. Nature 466,
347-351 (2010).
49. M. P. Allan et al., Anisotropic Energy Gaps of Iron-Based Superconductivity from Intraband Quasiparticle Interference in
LiFeAs. Science 336, 563 (2012).
50. M. Greger, M. Kollar, D. Vollhardt, Emergence of a common energy scale close to the orbital-selective Mott transition.
Phys. Rev. Lett. 110, 046403 (2013).
51. Z. Wang et al., Quasiparticle interference and strong electron–mode coupling in the quasi-one-dimensional bands of
Sr2RuO4. Nat. Phys. 13, 799-805 (2017).
52. C. Liu et al., Spectroscopic Imaging of Quasiparticle Bound States Induced by Strong Nonmagnetic Scatterings in
One-Unit-Cell FeSe/SrTiO3. Phys. Rev. Lett. 123, 036801 (2019).
53. Z. F. Wang et al., Topological edge states in a high-temperature superconductor FeSe/SrTiO3(001) film. Nat. Mater. 15,
968-973 (2016).
54. Y. Zhou et al., Antiferromagnetic Order in Epitaxial FeSe Films on SrTiO3. Phys. Rev. Lett. 120, 097001 (2018).
55. Q. Song et al., Evidence of cooperative effect on the enhanced superconducting transition temperature at the
FeSe/SrTiO3 interface. Nat. Commun. 10, 758 (2019).
56. S. Tan et al., Interface-induced superconductivity and strain-dependent spin density waves in FeSe/SrTiO3 thin films. Nat.
Mater. 12, 634-640 (2013).
57. D. Liu et al., Electronic origin of high-temperature superconductivity in single-layer FeSe superconductor. Nat. Commun.
3, 931 (2012).
58. Y. Li et al., Orbital Selective Spin Excitations and their Impact on Superconductivity of LiFe1−xCoxAs. Phys. Rev. Lett. 116,
247001 (2016).

12
Acknowledgements: The authors acknowledge fruitful discussions with Xiaoqiang Liu, and code assistances from Shusen Ye.
Funding: This work was financially supported by National Natural Science Foundation of China (No.11888101, and No.
11774008), National Key R&D Program of China (No. 2018YFA0305604 and No. 2017YFA0303302), Beijing Natural Science
Foundation (No. Z180010), and Strategic Priority Research Program of Chinese Academy of Sciences (No. XDB28000000). B.
M. A. acknowledges support from the Independent Research Fund Denmark (No. 8021-00047B). P. J. H. was supported by
the U.S. Department of Energy (No. DE-FG02-05ER46236). Author contributions: J.W. conceived and instructed the research.
C.L. prepared the samples and carried out the STM experiments. A.K., B.M.A., and P.J.H. provided the theoretical
calculations. C.L., A.K., S.Z., and Y.L. analyzed the data. C.L. wrote the manuscript with major revisions from J.W., A.K., B.M.A.,
and P.J.H. Competing interests: The authors declare that they have no competing interests. Data and materials availability:
All data needed to evaluate the conclusions in the paper are present in the paper and/or the Supplementary Materials.
Additional data related to this paper may be requested from the authors.

13
Supplementary Materials for
Orbital-Selective High-Temperature Cooper Pairing Developed in the Two-Dimensional
Limit
Chaofei Liu, Andreas Kreisel, Shan Zhong, Yu Li, Brian M. Andersen, P. J. Hirschfeld, Jian Wang
The PDF file includes:
I. STM Characterizations of 1-UC FeSe/SrTiO3
II. Dynes-Function Fittings
III. Empirical Tc Extrapolations
IV. BQPI Data
V. Atomically Decorated Tips with Different q Sensitivity
VI. Further Discussions Related to Measured Self-Energy Effect
VII. Calculated Spectral-Weight Distribution of Fe 3d Orbitals and SC-Gap Structures
VIII. Detailed Discussions About Orbital-Selective Pairing Dominated by dxz+dyz Orbitals
Figures S1–S10
Tables S1–S2
Reference (44)–(58)
SUPPLEMENTARY TEXT
I. STM Characterizations of 1-UC FeSe/SrTiO3
FIG. S1. Topographic images of 1-UC FeSe at different scales, showing (a,c) atomically flat terraces and (b,d) grain
boundaries, respectively, demonstrating the high crystalline quality across different spatial scales. Size: a,c, 500×500 nm2, b,
50×50 nm2, d, 70×70 nm
2; set point: a,c, V = 1 V, I = 500 pA, b, V = 0.4 V, I = 500 pA, d, V = 0.5 V, I = 500 pA.

14
II. Dynes-Function Fittings
A. Fitting Formulas
Five sets (#1–#5) of temperature-dependent tunneling spectra were acquired. To avoid SC-gap fluctuations over
extended spatial regions due to inhomogeneity, each set of spectra at different temperatures were taken at a
well-controlled, fixed point within an uncertainty of ~1 nm. The spectra were normalized separately by their respective
polynomial backgrounds, which are obtained by the well-established cubic-polynomial fittings to the spectra for bias |V|
≥ 30 mV (23, 44). The normalized (by default) temperature-dependent tunneling spectra were fitted by the Dynes
function (45, 46)
d𝐼
d𝑉= 𝑁(𝐸F) ∫ d𝐸 [−
∂𝑓(𝐸+e𝑉)
∂e𝑉] Re [
|𝐸−𝑖Γ|
√(𝐸−𝑖Γ)2−Δ2]
∞
−∞,
where
−∂𝑓(𝐸+e𝑉)
∂e𝑉=
1
𝑘B𝑇cosh−2 𝐸+𝑒𝑉
2𝑘B𝑇.
Here, N(EF) is the DOS at EF, f is the Fermi function, Γ is the spectral broadening, and kB is the Boltzmann constant.
For anisotropic fittings, the Dynes function is alternatively written as
d𝐼
d𝑉=
1
2π𝑁(𝐸F) ∫ d𝐸 ∫ d𝜃 [−
∂𝑓(𝐸+𝑉)
∂e𝑉]
2π
0Re [
|𝐸−𝑖Γ|
√(𝐸−𝑖Γ)2−Δ2(𝜃)]
∞
−∞.
As reported by high-resolution ARPES, ∆(θ) on unhybridized electron pocket for 1-UC FeSe shows two different
maxima Δ1,2 at θ = 45°+180°×N and 135°+180°×N [N = 0, 1; θ defined in Fig. 1(d)] (24). Either cos2θ- or cos4θ-type
SC-gap function evidently cannot capture the ARPES-measured gap distribution. To incorporate the C2-symmetric gap
∆(θ) distribution meanwhile with two gap maxima, the SC-gap anisotropy is introduced by setting
Δ(𝜃) = Δmax [1 − 𝑝𝛼 (1 − cos [4 (𝜃 −𝜋
4)]) − 𝑝𝛽 (1 − cos [2 (𝜃 −
𝜋
4)])].
The degree of anisotropy is tuned by 𝑝𝛼,𝛽. Two summed cos4θ-type ∆(θ) functions with different weights can also be
used for fitting the multigap-type SC spectra as previously adopted in (Li1−xFex)OHFeSe (28). However, i) the summed
cos4θ-type function would involve more fitting parameters, as compared with the single-cos4θ case; ii) for 1-UC FeSe,
the C4-symmetric cos4θ-type function with only one-valued maxima is inconsistent with the ARPES-measured gap
structure.
Experimentally, 1-UC FeSe shows BCS ratios 2Δ1,2/kBTc of 4.7 and 7.5 for Δ1 and Δ2, respectively (23), both
considerably larger than 3.53 predicted for the weakly coupled BCS superconductor. Influenced by the strong-coupling
nature, the tunneling spectrum for 1-UC FeSe is reconstructed by the electron–boson coupling. Accordingly, an
additional ‘dip–hump’ structure is typically induced outside the SC coherence peak (23), well beyond the description by
Dynes function within the mean-field BCS framework. Therefore, for all Dynes fittings, we selected the
bosonic-coupling-unmodified region [−25,25] mV as the fitting window.
The extracted Δ1(T) and Δ2(T) from the Dynes fittings were fitted by the BCS gap function (47)
Δ(𝑇) = Δ0tanh (π
2√
𝑇c
𝑇− 1).
B. Anisotropic Dynes Fittings
The five sets of tunneling spectra at different temperatures were at first tentatively fitted by the isotropic Dynes
function (results not shown). Evidently, the multigap-type tunneling spectra of 1-UC FeSe cannot be fitted by the
isotropic Dynes formula, which only shows single pair of coherence peaks. By adopting two summed Dynes functions
with different weights, we found that, while several sets can be constrainedly fitted, the remaining sets show coherence
peaks fail to be reproduced by the Dynes formula. At a quantitative level, for all sets of spectra, the obtained SC gaps
Δ1,2 (~8.8/~13±0.5 meV), e.g., at 4.3 K, from fittings are strikingly lower than those (~11±0.5/~17±2 meV) directly

15
determined by locating the coherence-peak positions, essentially due to the unreasonably high spectral broadening Γ1,2.
TABLE. S1. Dynes-fitting parameters [Δ1,2(T) and Γ(T)] for the spectra in Fig. 1(c), exemplifying reasonable Δ1,2(T) with
suppressed Γ(T). Here, Δ1,2 denote Δ(θ) maxima at θ = 135° and 45°, respectively (also for Fig. S2 and Table S2).
T (K) Δ1 (meV) Δ2 (meV) Γ (meV)
4.3 9.2 15.8 2.14
7 9.2 15.4 1.94
10 9.5 15.2 2.39
15 9.4 15.7 2.26
20 9.1 15.4 2.23
25 8.7 15.5 1.78
30 9.1 15.2 2.27
35 8.1 13.5 3.09
40 6.9 11.5 4.22
45 4.1 6.9 4.83
FIG. S2. (a,c,e,g) Anisotropic Dynes fittings (solid curves) to the other four different sets (#1–#4) of temperature-dependent
normalized spectra (open symbols) (vertically offset for clarity). (b,d,f,h) BCS fittings (solid curves) to Δ1(T) and Δ2(T) (open
symbols) obtained from the Dynes fittings in (a,c,e,g).
The failure of isotropic Dynes fittings motivates the alternative anisotropic-Dynes approach incorporating the
SC-gap anisotropy. The anisotropic Dynes-fitting results are shown in Figs. S2 and 1(c), and Tables S1 and S2. As
exemplified in Fig. 1(c) for set #5, the anisotropic fittings well capture the experimental lineshapes, including the
coherence peaks. Especially, the yielded Δ1,2 here are comparable with the coherence-peak energies due to low Γ1,2

16
(Table S1). These desired anisotropic fittings likewise with reasonable parameters are reproducible for all the other four
sets of spectra (#1–#4; Fig. S2 and Table S2). Within the anisotropic-fitting framework, the two pairs of coherence
peaks in the tunneling spectra originate from the two different gap maxima [∆1,2; see, e.g., Fig. 1(d)] on the individual
unhybridized electron pocket (24). Furthermore, 2Δ1,2/kBTc1,2 calculated from the anisotropic-fitting parameters are ~5
and ~8 for Δ1 and Δ2 (Table S2), respectively, signifying the definitive strong-coupling nature aforementioned for 1-UC
FeSe.
TABLE. S2. Dynes and BCS fitting parameters [𝑝𝛼,𝛽(4.3 K), Δ1,2(0 K) and Tc1,2] for the spectra in Figs. S2 and 1(c).
pα p
β Δ1 (meV) Tc1 (K)
2Δ1
𝑘B𝑇c1
Δ2 (meV) Tc2 (K) 2Δ2
𝑘B𝑇c2
#1 0.151 0.228 10.5 50.7 4.8 18.0 50.6 8.3
#2 0.184 0.179 10.5 49.6 4.9 18.0 49.3 8.5
#3 0.125 0.179 10.4 47.1 5.1 15.9 47.9 7.7
#4 0.100 0.194 9.7 48.0 4.7 16.3 47.8 7.9
#5 0.075 0.208 9.6 50.4 4.4 16.2 50.3 7.5
III. Empirical Tc Extrapolations
Besides the BCS fitting to Δ1,2(T) [e.g., Fig. 1(e)], empirically, Tc can be also determined by extrapolating the
temperature-dependent zero-bias conductance (ZBC) for the temperature region near Tc. From the five sets of measured
normalized spectra, ZBC(T) were extracted, and linearly extrapolated towards ZBC = 1 separately, where T = Tc (Fig.
S3). The extrapolations yield Tc appearing ~10–15 K higher than those by the BCS fittings (Table S4).
Pseudogap exists in the region where Cooper pairs preform, but without long-range coherence. In experiments, the
concrete signal for the existence of pseudogap states is normally concluded from the difference between Tctransport
and Tg,
specifying that the pseudogap exists in a temperature region of [Tctransport
,Tg]. (Here, Tg denotes the gap-closing
temperature.) Given the increasing curvature of ZBC(T) at higher temperatures, the linear extrapolation only works
well near Tc and otherwise tends to overestimate Tc. For example, for set #1 in Fig. S3(a), the linearly extrapolated Tc
even exceeds 100 K. TcBCS
and TcZBC
are unlike Tctransport
and Tg. (TcBCS
and TcZBC
denote Tc obtained by extrapolations
from BCS fits and temperature-dependent ZBC, respectively.) Thus, the difference between TcBCS
and TcZBC
may just
arise from the different errors in BCS fittings for unconventional superconductors and ZBC extrapolations from
low-temperature results.
FIG. S3. Temperature-dependent ZBC (solid symbols) extracted from the five sets of normalized experimental spectra.
Empirically linear-extrapolated Tc at ZBC = 1 are indicated.
IV. BQPI Data
17
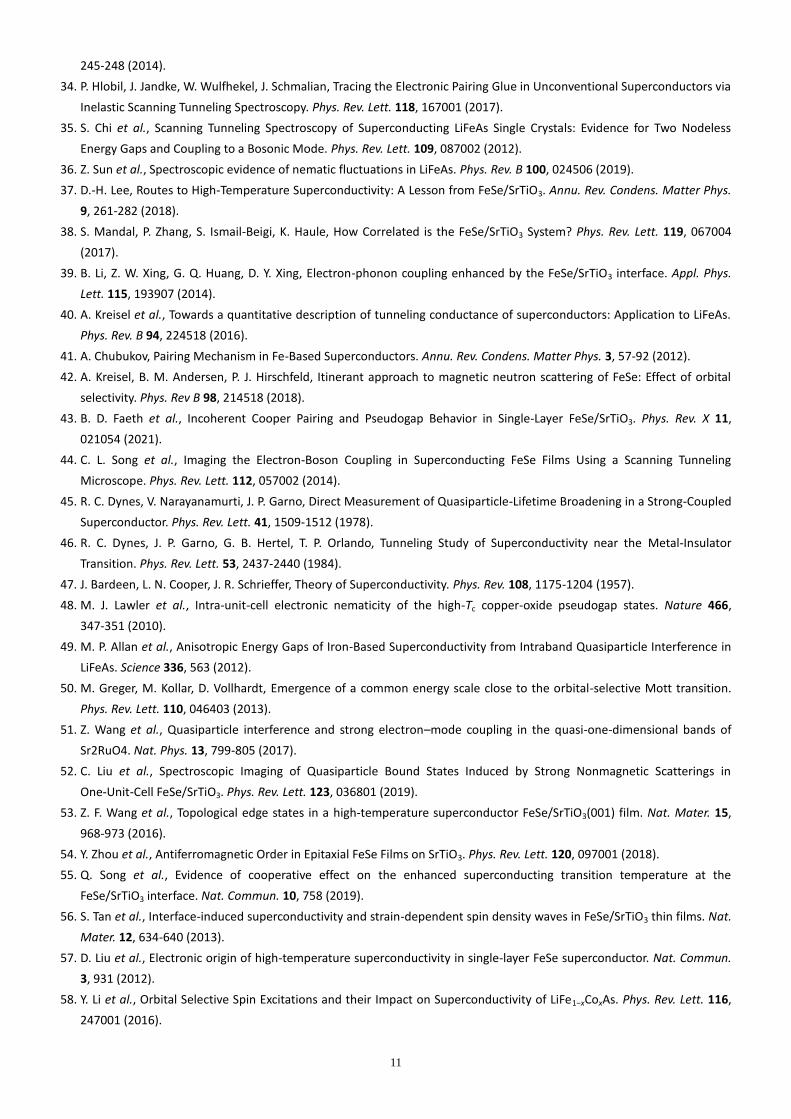
A. Drift Correction by Lawler–Fujita Algorithm
The thermal effect and piezoelectric hysteresis in STM experiments inevitably induce tip drift and, thus, local, spatially
evolving distortions during the spectroscopic imaging. To raise the signal-to-noise ratio in the dI/dV(r,E) mappings and
accordingly improve the quality of related FFT-BQPI patterns, the distortions inferred from the topographic images
were corrected in the simultaneously acquired dI/dV(r,E) mappings by Lawler–Fujita algorithm (48). As exemplified in
Fig. S4, a typical topographic image and the corresponding FFT pattern before and after applying the Lawler–Fujita
drift-correction algorithm are presented for comparison. Compared with the original FFT image [Fig. S4(c)], the
drift-corrected FFT pattern [Fig. S4(d)]] shows that the pixels of the Bragg point are moderately reduced. In the limit of
perfectly registered lattice without drift, the Bragg point is expected to be ideally peaked in intensity and only consists
of a single pixel. The reduced Bragg pixel by the algorithm here suggests the improved topographic quality by largely
excluding the extrinsic drift influence.
FIG. S4. Topographic image and corresponding FFT pattern (a,c) before and (b,d) after the drift correction. The insets in (c)
and (d) are the zoom-in views of the Bragg points (arrows). (a,b) 28×28 nm2; set point: V = 0.1 V, I = 500 pA.
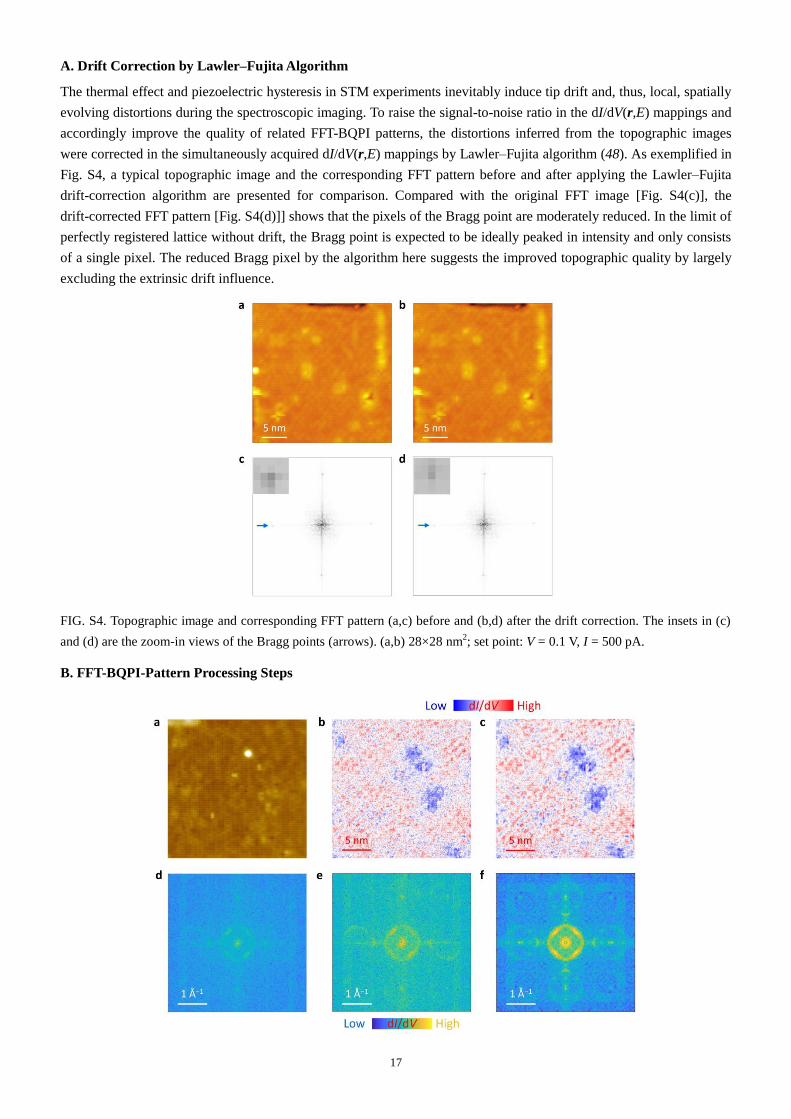
B. FFT-BQPI-Pattern Processing Steps

18
FIG. S5. Exemplifying the FFT-BQPI-pattern processing procedure. (a) Topographic image (24×24 nm2; set point: V = 0.04 V,
I = 2500 pA). (b,c) Simultaneously acquired BQPI dI/dV(r,E) mapping at 23 meV (b) before and (c) after drift correction
[adapted as Fig. 2(a)]. (d) Raw FFT pattern of the dI/dV(r,E) mapping in (c). (e) Gaussian-filtered FFT pattern. (f)
Gaussian-filtered and symmetrized FFT pattern [adapted as Fig. 2(b)].
Mainly three steps were successively used to optimize the signal-to-noise ratio in our FFT-BQPI patterns (e.g., Fig. S5).
i) First, the BQPI dI/dV(r,E) mappings were drift-corrected by the Lawler–Fujita algorithm [Fig. S5(c)] (48). ii) Second,
for clarity of interested scattering features, the high-intensity origins q = (0,0) of the FFT-BQPI patterns were
suppressed by the Gaussian function with kernel at q = (0,0) [Fig. S5(e)]: FFT-BQPIGausian =
FFT-BQPInon-Gaussian[1−Gaussian(q = (0,0), σ)] (49). The central peaks at q = (0,0) essentially stem from the randomly
scattering defects and the long-range variations of the surface. The Gaussian filtering of these origin peaks in
FFT-BQPI patterns does not affect the scattering signals of interest. iii) Third, the FFT-BQPI patterns were four-fold
symmetrized [Fig. S5(f)] given the C4 symmetry of the Fermi surface.
C. Selected BQPI Patterns
19
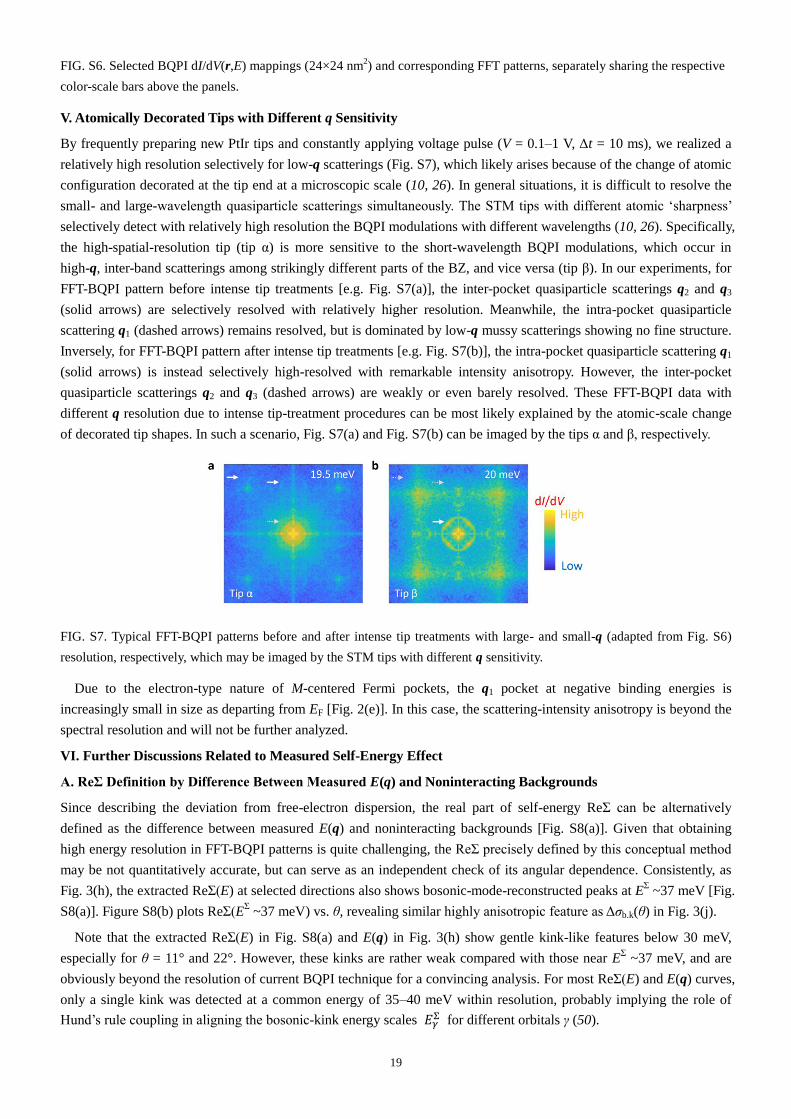
FIG. S6. Selected BQPI dI/dV(r,E) mappings (24×24 nm2) and corresponding FFT patterns, separately sharing the respective
color-scale bars above the panels.
V. Atomically Decorated Tips with Different q Sensitivity
By frequently preparing new PtIr tips and constantly applying voltage pulse (V = 0.1–1 V, Δt = 10 ms), we realized a
relatively high resolution selectively for low-q scatterings (Fig. S7), which likely arises because of the change of atomic
configuration decorated at the tip end at a microscopic scale (10, 26). In general situations, it is difficult to resolve the
small- and large-wavelength quasiparticle scatterings simultaneously. The STM tips with different atomic ‘sharpness’
selectively detect with relatively high resolution the BQPI modulations with different wavelengths (10, 26). Specifically,
the high-spatial-resolution tip (tip α) is more sensitive to the short-wavelength BQPI modulations, which occur in
high-q, inter-band scatterings among strikingly different parts of the BZ, and vice versa (tip β). In our experiments, for
FFT-BQPI pattern before intense tip treatments [e.g. Fig. S7(a)], the inter-pocket quasiparticle scatterings q2 and q3
(solid arrows) are selectively resolved with relatively higher resolution. Meanwhile, the intra-pocket quasiparticle
scattering q1 (dashed arrows) remains resolved, but is dominated by low-q mussy scatterings showing no fine structure.
Inversely, for FFT-BQPI pattern after intense tip treatments [e.g. Fig. S7(b)], the intra-pocket quasiparticle scattering q1
(solid arrows) is instead selectively high-resolved with remarkable intensity anisotropy. However, the inter-pocket
quasiparticle scatterings q2 and q3 (dashed arrows) are weakly or even barely resolved. These FFT-BQPI data with
different q resolution due to intense tip-treatment procedures can be most likely explained by the atomic-scale change
of decorated tip shapes. In such a scenario, Fig. S7(a) and Fig. S7(b) can be imaged by the tips α and β, respectively.
FIG. S7. Typical FFT-BQPI patterns before and after intense tip treatments with large- and small-q (adapted from Fig. S6)
resolution, respectively, which may be imaged by the STM tips with different q sensitivity.
Due to the electron-type nature of M-centered Fermi pockets, the q1 pocket at negative binding energies is
increasingly small in size as departing from EF [Fig. 2(e)]. In this case, the scattering-intensity anisotropy is beyond the
spectral resolution and will not be further analyzed.
VI. Further Discussions Related to Measured Self-Energy Effect
A. ReΣ Definition by Difference Between Measured E(q) and Noninteracting Backgrounds
Since describing the deviation from free-electron dispersion, the real part of self-energy ReΣ can be alternatively
defined as the difference between measured E(q) and noninteracting backgrounds [Fig. S8(a)]. Given that obtaining
high energy resolution in FFT-BQPI patterns is quite challenging, the ReΣ precisely defined by this conceptual method
may be not quantitatively accurate, but can serve as an independent check of its angular dependence. Consistently, as
Fig. 3(h), the extracted ReΣ(E) at selected directions also shows bosonic-mode-reconstructed peaks at EΣ ~37 meV [Fig.
S8(a)]. Figure S8(b) plots ReΣ(EΣ ~37 meV) vs. θ, revealing similar highly anisotropic feature as Δσb.k(θ) in Fig. 3(j).
Note that the extracted ReΣ(E) in Fig. S8(a) and E(q) in Fig. 3(h) show gentle kink-like features below 30 meV,
especially for θ = 11° and 22°. However, these kinks are rather weak compared with those near EΣ ~37 meV, and are
obviously beyond the resolution of current BQPI technique for a convincing analysis. For most ReΣ(E) and E(q) curves,
only a single kink was detected at a common energy of 35–40 meV within resolution, probably implying the role of
Hund’s rule coupling in aligning the bosonic-kink energy scales 𝐸𝛾Σ for different orbitals γ (50).

20
FIG. S8. (a) ReΣ(E) along representative directions (horizontally offset for clarity), which was determined from the departure
of measured E(q) from the noninteracting backgrounds [Fig. 3(h)]. The arrows highlight ReΣ maxima at EΣ ~37 meV. (b)
Measured ReΣ(37 meV) as a function of θ.
B. Intrinsicity of Fluctuations in Δσb.k.(θ)
Based on the following considerations, the measured angular-dependent self-energy effect Δσb.k.(θ) [Fig. 3(j)] is
unlikely attributable to the fluctuating errors in experiments. i) The dispersion kinks used for extracting Δσb.k.(θ)
coincide in energy scale with the spectral hump reconstructed by electron–boson interaction [Fig. 3(h) vs. Fig. 3(i)] (23);
such energy consistency suggests an intrinsic bosonic-coupling origin of the detected kink features. ii) The Δσb.k.(θ)
peaks at θ = 0°, 90°, 180°, and 270°, corresponding to the directions of inter-pocket nesting vectors Q ≈ <2π,0> for
AFSF within extended s±- and nodeless d-wave pairing scenarios (Fig. S9). For decisive estimation on Δσb.k.(θ)
fluctuations, repeating our experiments is recommended in future studies by using even higher-resolution BQPI, e.g., at
a base temperature far below 1 K by a 3He or a dilution refrigerator. Further combined with the elaborate STM tip, the
highly challenging self-energy effects with band-resolution (51) may be realized, which would put substantial
constraints for quantitative theoretical study of the Cooper-pairing mechanism.
FIG. S9. Fermi-surface topologies of 1-UC FeSe/SrTiO3 in the folded BZs (solid lines) for (a) extended s±- and (b) nodeless
d-wave pairings. Q ≈ <2π,0> schematically denotes the inter-pocket pair-scattering vectors.
C. Electron–AFSF Coupling in Cooperative-Pairing Picture

21
The electron–AFSF coupling concluded responsible for the anisotropic self-energy reconciles previous observations of
gap minima at intersections of hybridized ellipse-like electron pockets (24), magnetic-excitation-like bosonic mode (23),
and sign reversal manifested by nonmagnetic-scattering-induced bound states (52) in 1-UC FeSe. Theoretically, the
heavily electron-doped 1-UC FeSe with checkerboard (likely) antiferromagnetism (53, 54) can be described by
Anderson-lattice model for localized spins coexisting with itinerant electrons (37), despite the debate over concrete
AFM spin order (collinear-, block-checkerboard-, pair-checkerboard-, and checkerboard-type, etc.). In one popular
scenario, Cooper pairing arises predominantly from exchange of spin fluctuations, but can be assisted by interfacial
forward scattering phonons, leading to a high critical temperature of ~ 60 K (13). According to this ‘cooperative pairing’
picture, the detected AFSF coupling originates from the electronic-pairing channel intrinsic to heavily electron-doped
FeSe. The absence of phonon signal in STM experiments can be interpreted by the following facts. i) The interpocket
AFSF pair scatterings dominate over the intrapocket phononic pair scatterings (37, 55). ii) STM is a local,
surface-sensitive technique, incapable of capturing the interface phononic coupling beneath the FeSe film.
VII. Calculated Spectral-Weight Distribution of Fe 3d Orbitals and SC-Gap Structures
The electronic-structure calculation for 1-UC FeSe is based on a tight-binding model for bulk FeSe (at high
temperatures) (for details, see Ref. (30)). The 1-Fe unit cell that corresponds to the unfolded BZ was adopted. Since the
strong electron doping of 1-UC FeSe by SrTiO3 substrate suppresses the spin-density-wave order (56), we started with
a paramagnetic DFT band structure of the usual type. Several modifications were taken into account for bulk FeSe to
‘simulate’ 1-UC FeSe: i) all out-of-plane hoppings were ignored to guarantee a strictly 2D character; ii) orbital order
was neglected since it is never observed in 1-UC FeSe; iii) FeSe system should be electron-doped. By DFT calculations,
SrTiO3 was previously shown only serving to electron-dope the free-standing FeSe film (53). We thus considered the
substrate effect on the band structures of 1-UC FeSe by shifting EF to match the size of Fermi pockets as measured in
ARPES (24). Furthermore, the BZ folding was considered within the (quasi-) nodeless d-wave pairing scenario.
For the gap-structure calculation, the standard spin-fluctuation pairing theory was used, but with modified
FIG. S10. (a) Fermi surface of our model describing 1-UC FeSe color-encoded with orbital character before BZ folding. (b–d)
Calculated gap symmetry function g(k) [proportional to the gap below Tc, g(k) ∝ Δ(k)] over the Fermi surface (b,c) before
and (d) after BZ folding. The red and blue colors represent the different signs of order parameter. Light gray (black) axes
define the coordinate axes in the unfolded (folded) BZ.
quasiparticle weights Z for different orbitals, where the coherence of dxy orbital is selectively suppressed
(√𝑍𝑥𝑦=0.4273, √𝑍𝑥𝑧=0.9826, √𝑍𝑦𝑧=0.9826). Technically, such orbital selectivity is incorporated by adopting that: i)

22
𝑐𝑙†(𝒌) create quasiparticles with weight √𝑍𝑙 in orbital l, 𝑐𝑙
†(𝒌) ⟶ √𝑍𝑙𝑐𝑙†(𝒌); ii) the calculation of spin susceptibility
includes the renormalized Green’s function, 𝐺𝑙𝑙′(𝒌, 𝜔𝑛) ⟶ √𝑍𝑙√𝑍𝑙′𝐺𝑙𝑙′(𝒌, 𝜔𝑛) (for details, see Ref. (30)).
Consistent with ARPES experiments (57), the calculated Fermi-surface topology consists of only M-centered
electron pockets (Fig. S10). More accurately, the ellipse-like fine structures of the electron pockets were also well
reproduced. The obtained Fe 3d orbital-weight distributions and gap structures over the Fermi surface are shown in
detail in Fig. S10.
VIII. Detailed Discussions About Orbital-Selective Pairing Dominated by dxz+dyz Orbitals
In the normal state of iron chalcogenides, the dxz/dyz orbitals are degenerate at M points. Even after transition into the
SC state, the dxz/dyz degeneracy remains preserved under the protection of robust C4 symmetry, despite an M-centered
gap between electron and hole bands influenced by the orbital-dependent band renormalization and dxz/dxy band
hybridization (21). Accordingly, the absence of nematic orbital order in SC 1-UC FeSe requires the quasiparticle
weights for dxz and dyz orbitals be degenerate. These less correlated and degenerate dxz/dyz orbitals both correspond to
much higher quasiparticle weights, i.e., higher quasiparticle coherence than dxy. In contrast, the more correlated dxy
orbital possesses narrow electronic bandwidth besides lower quasiparticle coherence. The shrinked electronic
bandwidth results in narrow spin-excitation spectra and, thus, weak effective magnetic exchange coupling (58), which
is unbeneficial for superconductivity within the AFSF-pairing scenario. Thereby, the dxz/dyz orbitals are physically
reasonable in cooperating for Cooper pairing.
The dxz/dyz-selective pairing is also reconciled within the electron-hopping picture regarding nematic order. By BQPI,
bulk FeSe crystals were demonstrated that the Cooper pairing is selectively driven by dyz orbital (10). With the
low-energy physics dominated by dyz orbital, the electron hopping is preferred along y direction over x direction. Such
highly anisotropic hopping agrees with the nematicity in FeSe. Inversely, in 1-UC FeSe, the dxz/dyz-selective pairing
implies the electron hoppings show no direction preference, consistent with the absence of nematic phase therein.


![Observation of a Novel Orbital Selective Mott Transition in Ca Sr … · Observation of a Novel Orbital Selective Mott Transition in Ca1:8Sr0:2RuO4 ... [12], clearly indicate good](https://img.dokumen.tips/doc/110x75/5e85ee7b69e5064f85287aa7/observation-of-a-novel-orbital-selective-mott-transition-in-ca-sr-observation-of.jpg)