Embed Size (px)
Citation preview

i
Orbcomm View ver. 2.0User's Manual
byMichael R. Owen, Ph.D.
Northern Lights SoftwareAssociates
P.O. Box 321Canton, NY 13617
Tel & FAX: (315) 379-0161www.nlsa.com
ii
Orbcomm ViewUser’s Manual
Table of Contents
Introduction.......................................................................................................................................... 1• Features........................................................................................................................................... 1• System requirements ........................................................................................................................ 1• Installing Orbcomm View................................................................................................................. 1
Orbcomm View’s Views ..................................................................................................................... 2• Text................................................................................................................................................. 2• Maps ............................................................................................................................................... 2
♦ Rectangular ............................................................................................................................... 2♦ View from Space ....................................................................................................................... 3♦ Radar ........................................................................................................................................ 4♦ Sky Temperature ....................................................................................................................... 4
Setup• General ............................................................................................................................................ 5• View Style ....................................................................................................................................... 6• Time................................................................................................................................................ 6• Satellites .......................................................................................................................................... 7• Groups........................................................................................................................................... 10• Observers ...................................................................................................................................... 12
OV's ToolBar ..................................................................................................................................... 13
Views• Configuring Current View.............................................................................................................. 14• Configuring Views ......................................................................................................................... 15• Experimental mode......................................................................................................................... 17• Map Configuration......................................................................................................................... 18
♦ Rectangular Map ..................................................................................................................... 18♦ View from Space ..................................................................................................................... 20♦ Radar Map .............................................................................................................................. 21♦ Sky Noise ................................................................................................................................ 22♦ Horizon Table.......................................................................................................................... 23
Utilities• Satellite pass times......................................................................................................................... 23• Detailed pass information............................................................................................................... 24• Two-satellite mutual visibility ........................................................................................................ 25• Eclipses ......................................................................................................................................... 26• Quick visibility check..................................................................................................................... 27
Frequently Asked Questions............................................................................................................. 28
Getting Help ....................................................................................................................................... 28

iii
Northern Lights Software Associates License Agreement
Orbcomm View (the SOFTWARE, including images and data included into or with the program) is owned by Northern Lights SoftwareAssociates (NLSA) and is protected by United States copyright laws and international treaty provisions. Therefore, you must treat theSOFTWARE like any other copyrighted material (e.g. a book or musical recording) except that you may either (a) make one copy of theSOFTWARE for backup or archival purposes, or (b) transfer the SOFTWARE to a single hard disk provided you keep the original solelyfor backup or archival purposes. Any other reproduction or distribution of this program without written permission from Northern LightsSoftware Associates is prohibited.
Limited WarrantyNorthern Lights Software Associates warrants that the SOFTWARE will perform substantially in accordance with authorized writtenclaims for a period of thirty (30) days from the date of receipt. NLSA's entire liability and your exclusive remedy shall be, at NLSA'soption, (a) return of the price paid, or (b) repair or replacement of the SOFTWARE.
No Other WarrantiesTo the maximum extent permitted by applicable law, Northern Lights Software Associates disclaims all other warranties, either expressedor implied, but not limited to, implied warranties of merchantability and fitness for a particular purpose, with regard to the SOFTWARE.
U.S. Government Restricted RightsThe SOFTWARE and documentation are provided with RESTRICTED RIGHTS. Use, duplication, or disclosure by the Government issubject to restrictions as set forth in subparagraph (c)(ii) of the Rights in Technical Data and Computer Software clause at DFARS252.227-7013 or subparagraphs (c)(1) and (2) of the Commercial Computer Software-Restricted Rights at 48 CFR 52.227-19, asapplicable. Manufacturer is Northern Lights Software Associates/P.O. Box 321/Canton, NY 13617.
If you acquired this product in the United States, this Agreement is governed by the laws of the State of New York.
Orbcomm View Copyright
Entire contents copyright 1997, 1998 by Northern Lights Software Associates.
Orbcomm View and its accompanying programs and files are protected by copyright 1997, 1998 Northern Lights Software Associates. Noportion of these programs or files may be sold, given away, reproduced, or otherwise distributed without written permission from NorthernLights Software Associates. Licensees have the non-exclusive right to use these programs and files but you do not own them; title to theprograms and files is retained by Northern Lights Software Associates.
1997,1998 Northern Lights Software AssociatesAll Rights Reserved


1
IntroductionOrbcomm View (“OV”) is an innovative map-basedsatellite tracking program. It features realistic 256-color maps and an unlimited numbers of satellites,observers, and views.
Orbcomm View is available in two forms: 16- and 32-bit. The 16-bit version of OV runs under Microsoft
Windows 3.1 and later (including Windows ‘95)whereas OV32 requires Microsoft Windows ‘95 orWindows NT.
Features:• Visually stunning maps, projections, styles, and
sizes
• Unlimited numbers of satellites, observers, andviews simultaneously
• Tracks all artificial satellites, Moon, Sun, planets,and celestial noise sources
• Fast, accurate, and clear satellite positions
• Floating/docking toolbar for easy access to commonfunctions
• Context-sensitive online help
• Multi-level configuration setup screens
• Text listings to screen, printer, or disk file
• Priority tracking of groups of satellites
• Two-satellite mutual visibility, including 1- and 2-observer 2-satellite mutual windows
• Satellite eclipse predictions
• 2,000-city database included
In this manual, references to “OV” apply to bothvarieties of the program (16- and 32-bit); “OV32”refers to specific features found only in the 32-bitversion.
System requirements:
• 33 MHz 80386 (or better) processor, Pentium
preferred for OV32
• Math coprocessor required
• Orbcomm View 16 (16-bit): Microsoft Windows3.1x (or Windows '95)
• Orbcomm View 32: Microsoft Windows '95 orWindows NT
• Video: 256 colors or more; 800x600, 16-bit colorpreferred
• At least 10 MB hard disk drive storage
Installing Orbcomm View
From diskette:
• Insert the Orbcomm View Disk #1 into thefloppy disk drive of your computer.
• If you are using Windows 3.1x, click on File(top left in Program Manager)
• If you are using Windows 95, click on theStart button (lower left corner of theWindows desktop).
• Click on Run.
• In the file name box, type A:Setup.EXE.
• Follow the directions in the Orbcomm ViewSetup.
From the Orbcomm Network:• Click on Network Neighborhood
• Click on OCC, then Volume 2
• Click on OV
• Double-click OV_16.EXE or OV_32.EXE
• This begins installation process on yourcomputer

2
Orbcomm View’s ViewsOrbcomm View displays satellite trackinginformation in “Views.” A View consists of a map,columnar text data, or both together. One or moreViews may be visible simultaneously. Each View iscompletely independent of the others; differentViews may contain different satellites, observers,and time/date. A View may include a map, textdata, or both at once. OV may have as many Viewsactive as you desire.
In normal use, two or three Views is usuallysufficient, but there is no inherent limit to thenumber of Views that may be open simultaneously.Each View can track an unlimited number ofsatellites and observers. Satellite positions aredisplayed on maps and numerical data are displayedin columnar format as shown below.
Views are created by double-clicking anywhere onthe OV “desktop,” by choosing Views/Create newView from the main menu, or by clicking on the
New View button on the toolbar.
Text
The text portion of Views displays each satellite’scurrent position as well as a summary of the nextpass.
The layout of the text display is dependent on thenumber of observers currently active in the View. Thetext displays the greatest amount of information if oneobserver is specified. Two observers’ data aresummarized in a format similar to that of one observerbut with fewer lines of data for each observer. Ifmore than two observers are included in the View’slist then each satellite’s current position is listed foreach observer.
Maps
Orbcomm View contains four major map types withmany user-modifiable attributes in each map:
• Rectangular (modified Miller projection)• View from Space (Orthographic projection)• Radar (upper hemisphere projection)• Sky Noise (rectilinear RA/Dec projection)
The Rectangular map (above) covers most of theEarth; only the poles are omitted. It is convenient forshowing the positions of several satellites and theirfootprints at once. The rectangular map can be set todisplay any longitude at the center. Individualcontinents can be “zoomed in” for greater detail. Onthe standard 800*600 display, the single-continentrectangular map displays a resolution of about 12 kmper pixel. Land and water are accurately shaded toillustrate elevation and depth, respectively.
Satellitefootprint
Satelliteground track
Orbcomm View’s Views may contain text, map, or both. This View shows a Rectangular-style map.

3
The View from Space map shows a realisticperspective of the Earth from a position out in space.The land surface is rendered to show topography andthe oceans are shaded to indicate water depth. Theposition is centered over one of the continents. Youmay change the center continent in one of two ways:
• Left-mouse click directly on the continent that youwant to turn to;
• In the Map Configuration screen (accessed fromthe Configure Maps button on the ToolBar or
the View's pop-up, activated by clicking the rightmouse button).
In addition, you can easily change the apparentdistance from which the Earth is viewed by clickingthe left mouse button out in space, away from theEarth's image.
Clicking on the View from Space map near a satellitewill display a pop-up information window about thatsatellite.
Satellite’s “footprint,” thearea of the Earth visible to
the satellite at this moment.
Change the continent at thecenter of the map by mouse-clicking on a new continent.
Real-time text data concerningthe satellite. You can show asmany columns of data as there
are satellites in the View(see Individual View
Configuration/Text columns).
The View from Space presents the Earth in a 3-dimensional perspective.You may configure the map to show ground tracks, orbits, and satellite footprints.
Pop-up information about asatellite is available by clicking
on its name in any map.
4
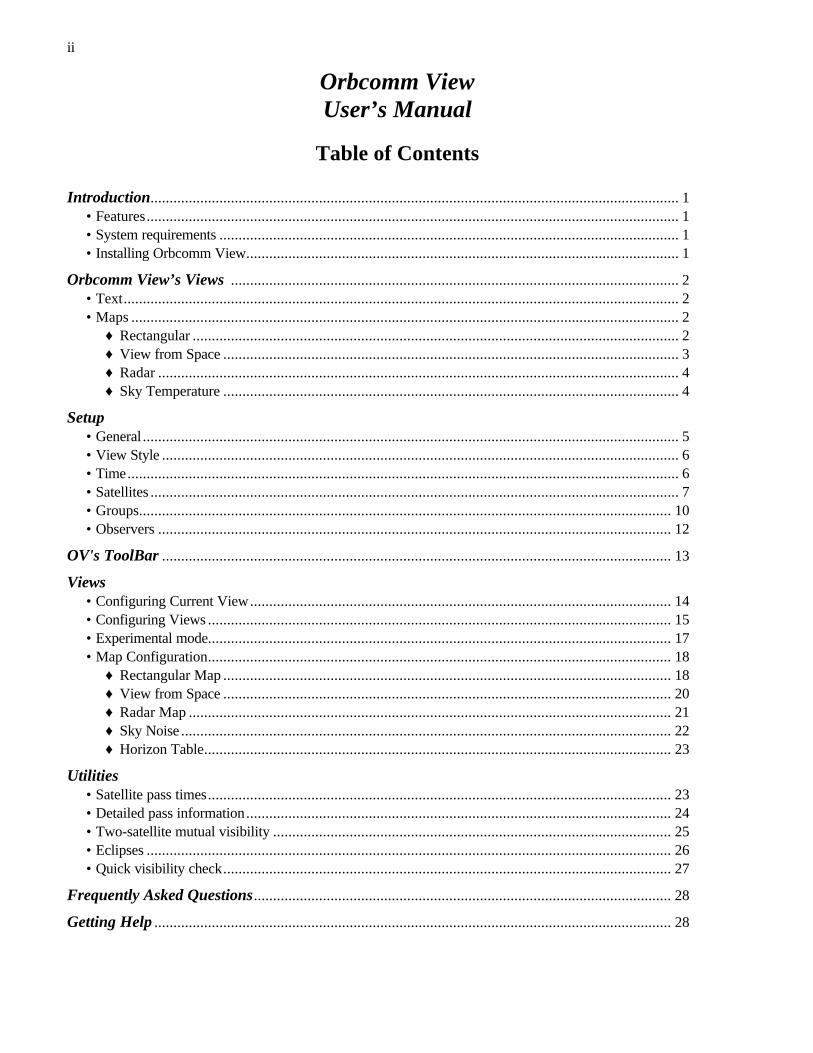
The Radar Map, a Northern LightsSoftware innovation, displays a viewof the sky with the observer at thecenter, similar to a radar station.North is at the top of the map, east tothe right, etc., like a compass. Theouter perimeter of the Radar Maprepresents the observer's horizon andthe center of the Radar Map isdirectly overhead. As a satellitebecomes visible, it appears on themap's perimeter and passes inside thecircle. The higher the satellite gets inthe sky, the closer to the center of themap it appears.
Like all maps, the Radar Map isconfigured in the Map Configurationscreen. Upcoming passes can bedisplayed as arcs across the map.The rise-point of a pass is shown as alarger circle and the set-point is asmaller circle; this permitsvisualization of the direction that thepass will travel across the sky.
The Sky Temperature Map portraysthe sky's "equivalent noisetemperature." Thermal noise,generated by billions of stars in the universe, is moreconcentrated in some parts of the sky than others.Contour lines on the Sky Temperature map are similarto contour lines on a topographic map; they showareas of higher or lower amounts of sky noise.
This information is useful in situations where desiredsignals from space are extremely weak. If the sourceof the signals (for example, a failing artificial satellite)is "in front of" noisy areas, then the signals are muchmore difficult to detect.
The axes of the Sky Temperature map arefamiliar to astronomers but perhaps not tosatellite users. The vertical axis isDeclination, which is the angle between theitem of interest and the celestial equator(the imaginary extension of the Earth'sequator into space). The horizontal axis isin Right Ascension. This represents theangle (measured in hours = 15° ) betweenthe item of interest and 0° longitude atGreenwich, England.
OV’s Radar map shows a full view of the Observer’s sky.Overhead is in the center of the Radar map.
Orbcomm View includes Sky Temperature maps derived fromIEEE measurements at three frequencies: 50, 137, and 400 MHz.

5
Setup/GeneralThe General setup screen provides access to settingsthat concern all of the OV program. These settingswill affect the overall OV screen display as well asperformance. All selections are retained from sessionto session.
Tracking Algorithm: Select between G3RUH’s Plan-13 and SGP4/SDP4 tracking algorithms. The G3RUHalgorithm by James Miller at Cambridge University isa simplified version of SGP4 which is very fast andsufficiently accurate for most applications.SGP4/SDP4 uses the two-part (near-Earth and deep-space) model presented in SpaceTrack Report #3 andre-coded by Lt. Col.. T.S. Kelso, Ph.D. of the U.S.Air Force. SGP4/SDP4 employs general perturbationtheory to provide highly accurate prediction of orbitalpositions. SGP4/SDP4 is more time-consuming andshould be used if high accuracy is needed.SGP4/SDP4 is also useful if Keplerian elements areold because it more accurately accounts for long-termeffects of small gravitational and drag forces.SGP4/SDP4 is the default algorithm for OV.
Distance units: select between English, metric, ornautical units. These units will be used throughoutOrbcomm View. Default is metric.
Maps: 8-bit maps have 256 colors and most laptopusers should select this option. 24-bit maps havemillions of colors and appear best on high-qualitymonitors.
View style: (see p. 6) Free-floating Views may beplaced anywhere on the Windows desktop. A thinMain Menu bar for OV will remain, providing accessto control functions. This option permits fastswitching of focus between OV and other programsbut it may result in a cluttered screen.
“Contained within main OV form” means that allViews are confined to the OV screen, which may beminimized if desired. This option generally results inthe most pleasing screen display if OV is the onlyprogram being run. This is the default for OV.
Show hints in setups controls whether small pop-uphints appear when the mouse rests on a button or othercontrol for more than two seconds. These hints are
Fast but lessaccurate
Most accurate, OV'sdefault algorithm.
This choice affectsall distancesdisplayed in
Orbcomm View
Select whether youwant separate,
independent Views orall OV's Views
contained inside themain OV form.
Check this box toshow pop-up hintsfor OV’s controls
How far below thehorizon must the
Sun be for the skyto be considered
“dark?” (default=0)
Check this box tocorrect positionsfor atmospheric
refraction
How often shouldOV update satellite
positions?
Pre-position themouse cursor overOK button in most
setup screens
This choice affectsall maps displayedin Orbcomm View
Use Setup/General for items that apply throughout Orbcomm View.

6
useful when you are first learning to use OV but youmay want to turn them off after you are familiar withthe program. "On" is the OV default.
Include refraction correction instructs OV whetherto correct satellite elevation angles for the effects ofatmospheric refraction. This effect is always small,becoming entirely insignificant above about 5°elevation. There is a slight speed penalty for includingrefraction correction.
Update interval controls how often OV updates itson-screen display. A small value results in fasterupdates but may consume more computer CPU timethat desired. A value of 150, which results in 4-6updates/second on a Pentium-120 MHz, is areasonable compromise between speed and CPUloading, and is the OV default. Use a larger number ifother programs appear to run sluggishly.
Views/View StyleOrbcomm View can operate inone of two modes:
Free-Floating Views (right):all Views are free to be locatedanywhere on the windowsdesktop. They may overlapother Windows applications andother application can "showthrough" between OV's Views.With free-floating Views, theOV Main menu is unobtrusive(but it can also be hidden underother programs' windows).
Contained Views (left): All OVViews are contained inside themain OV screen. If a View ismoved beyond the edge of themain OV screen, it is trimmed.Space between Views is soliddesktop color. With containedViews, the Main Menu is alwaysat the top and easy to find.

7
Setup/TimeThis selection provides access to your computer’sdate/time clock. Every computer has an internal clockthat keeps track of the date and time. This clock is thebasis for all of OV’s satellite predictions so it must beset accurately. It is wise to check the clock at least ona regular basis to make sure that it remains accurate;some computer clocks drift many seconds per day.
The Current Settings display shows the current dateand time as reported by the computer to the Windowsoperating system. To change the displayed values,first click on the Stop button to prevent continuedupdates. Then enter new values in the appropriateboxes. If you want to reset the computer’s clock tothe new values, press the Set Computer Clock button.To reset the Current Settings display to the computerclock (after making changes but before setting thecomputer clock), click on the Reset button.
The Local vs. UTC box tells OV how to interpret thetime and date that it retrieves from Windows. Checkthe appropriate boxes to tell OV whether yourcomputer clock is set to local time or UTC, andwhether you wish OV's display to be in local time orUTC.
If “Local” is selected for either the computer clock orOV’s display, a “Local time offset from UTC” valuemust be entered in the lower box. This valuerepresents the number of hours difference betweenyour local time and UTC. If your local time is behindUTC, then the offset is negative.
NOTE: The offset value is negative for WesternHemisphere stations. For example, U.S. EasternStandard Time requires an offset of -5.
Setup/SatellitesThe Setup/Satellites display consists of two “pages,”Keplerian Elements and Groups. These will bedescribed separately although they share a commonMain Database.
Keplerian Elements are numbers that describe theposition and velocity of a satellite at a single instant intime. “Keps,” as they are sometimes called, are
generated by ground-based radar ranging stationsoperated by governments and the military. Keplerianelements are used in satellite-tracking calculations topredict the position of a satellite at some time in thefuture. OV combines Keplerian Elements and thecurrent time/date from the computer to determine thesatellite’s current position. OV then uses theobserver’s location to compute the satellite's azimuth,
This it the time towhich the computer’s
clock is set.
This it the time that youwant OV to display.
Click here to resetthe computer’s
clock to the timeshown. This
change cannot beundone.
Click here to reset thetime in the boxes to thecurrent computer time.
Click here to stopupdating the time
shown in the boxes.
Number of hoursdifference betweenUTC and your local
time. NOTE : WesternHemisphere values are
negative.Add 30 minutes for this
time zone
Correct timekeeping is essential for accurate satellite predictions.Make sure that Orbcomm View is correctly configured for your system.

8
elevation, and other values from that spot on theEarth’s surface.
Keplerian elements may be acquired from a number ofsources. Current Keplerian elements are provided atmany sources including Orbcomm's web sitehttp://www.orbcomm.com.
How often do you need to acquire Keplerianelements? The answer depends on your requirementsand your ground-station characteristics. For almostall applications, updating Keplerian elements once amonth is entirely sufficient. Users of the OrbcommLow Earth Orbiting (LEO) satellites who need veryaccurate positions might need to update every twoweeks whereas higher-altitude satellites’ elements areusable for several months.
The Setup/Satellites/Keplerian Elements page in OVprovides the means to update Keplerian elementssmoothly and easily. The large list on the right of thescreen contains all of the satellites in OV’s database.There is no practical limit to the size of this databasebut a large number of satellites requires longer time toload and process.
The Keplerian Elements page contains edit boxes onthe left side of the Setup/Satellites page. These boxesprovide the option of manually changing individualKeplerian Elements. Select the satellite whoseelements are to be edited by clicking on the satellite’sname in the main database list. Be cautions whenmanually editing these values because some valuesmay cause the satellite to “crash” or its calculations tomake OV unstable.
Click on a satellite name to select it.Then you may view or edit itsKeplerian elements manually.
Derived shows informationderived from the currently-
selected satellite’s Keplerianelements.
Click Update to update Keplerianelements from a computer disk file.
Clean updates Keplerian elementsand removes all non-matching
satellites from the main database.
Find locates asatellite in the
database
Setup/Satellites is the place to update Keplerian Elements

9
aaTip: Each satellite’s Catalog Number is uniqueand is used to identify the satellite internallywithin OV. If the Catalog Number is changed,the satellite will be treated as a new satellite andadded to the OV database.
The button displays a pop-up box
containing values calculated from the selectedsatellite’s Keplerian Elements. Period is the timerequired for one complete orbit. Apogee height is themaximum altitude that the satellites achieves andperigee height is the minimum altitude.
The button provides instructions about
adding a satellite. It doesn't actually do anything.
To update the satellite database, click on the
button. A pop-up dialog box will
prompt you for the name of the computer filecontaining new elements. This file must be in the“NASA 2-line” format. Header text, which oftenaccompanies files downloaded from the Internet, isignored. OV reads the new file and updates theKeplerian elements for all satellites in its database thatmatch entries in the new file. For example, if OVcontains entries for fictitious satellite A, B, and C butthe new file only contains elements for A and B, thenC’s elements will remain unchanged. On the otherhand, if the new file contains elements for additionalsatellites, then they are automatically added to OV’sdatabase. In the preceding example, if the newKeplerian element data file contained entries for A, B,and D, then OV’s database would add Dautomatically. This may be useful if you have accessto a variety of elements in small files but it may lead
to an accumulation of unneeded satellites after sometime.
Use the button to make OV’s database
exactly match the contents of a particular Keplerianelement file. In this operation, all non-matchingsatellites are removed from OV’s database. After aClean operation, OV’s database will contain onlythose satellites in the new file and no others.
Note: The Sun, Moon, planets, and celestial noisesources do not require Keplerian elements. They areincluded in the “Naturals” group and cannot be editedor removed from OV’s database.
If you wish to add one or two new satellites from aNASA 2-line format file, you may use the
button. It will prompt you for the file
name, read the file, and add the satellites to OV’sdatabase.
The button removes selected satellites
from the database. If the database is later Updatedfrom a file that contains the removed satellites, theywill be added back to the database.
The button helps to locate a satellite in
the database. Enter its name and the database list willmove to it, displaying its Keplerian elements in theedit region to the left of the list.
scans through the satellites in the main
database and highlights all satellites that are currentlyabove the observer’s horizon.

10
Setup/GroupsOV’s Groups are user-defined associations ofsatellites. They are provided as a convenience foraccessing similar satellites together. For example,each plane of Orbcomm satellites might be placedin a Group. You may have as many Groups asdesired and each group may contain an unlimitednumber of satellites. For the sake of practicality,however, we recommend that groups contain fewerthan 25 or 30 satellites.
The Groups page ofSetup/Satellitescreates and editsGroups. Groupsare collections ofsatellites that aredefined by the user.They have no direct connection with any View butare merely a convenient way to “grab” similarsatellites at one time. Clicking on a name in theGroups box will display the members of the Groupin the box below.
Groups are created with the Add button. Thegroup is named and at first it contains no satellites.Select the satellites of interest with the mouse anddrag them to the Group members box. Entries inthe Group members box may be deleted orrearranged with the mouse as well.
To delete satellites from a Group, select thesatellite name with the mouse and then click theDelete button. You may rearrange the members of aGroup by dragging their names with the mouse.
Colors opens a dialog box where you may set thecolors associated with groups. If a particularsatellite is included in more than one Group, thesatellite's color will be set by the Group mostrecently edited.
Groups are collections ofsatellites that have
something in common.You create and edit yourgroups in Setup/Groups
These are the satellite"members" of the
selected group
You may haveas many groups
as you wish
Select satellites bycertain criteria basedon orbital elements(for advanced users)
Set the colors thatOV uses to
illustrate satellitesand their footprints
Boxes show the colorcurrently associated withthe Group. A check mark
shows that color isactually being used.
OV includes existing and planned Orbcomm constellation,weather satellites, and other groups

11
opens the
Satellite Selector shown above.This feature permits advancedusers to sort through OV's entiresatellites database and extractsatellites meeting certain criteria.For example, a particularapplication may require selectionof all satellites with, say, certaineccentricity or mean motion. Usethe tabs across the bottom of thepage to choose which rule tomodify (Eccentricity, Inclination,Period...). For each rule, selectwhether you want Any value to beall right or if the value must fallBetween, More than, or Lessthan the limits that you set in theedit boxes.
To effectively ignore the value ofany quantity, select ANY as therule. For example, choosing ANYinclination means that ANY isignored in selection wheninclination is evaluated.
Finally, in the Relations box,select whether you want all therules to be met simultaneously(AND) or whether meeting anyrule (OR) will be satisfactory. Forexample, saying "EccentricityGreater than 0.01 AND Inclination Greater than 50°"means that a satellite must meet both criteria, whereasOR means that if it meets either the Eccentricity ORthe Inclination criterion, the pass will be selected.
aaTip : If OR is used as the Relations operator, thensetting any rule to ANY will mean that all satellitesin the list will qualify for selection.
It may require some experimentation to learn to usethe Satellite Selection facility. After you have becomefamiliar with it, you may want to use it to selectsatellites for a Group.
Pressing the New Group button will cause theselected satellites to become a new group, as if youhad dragged each satellite from the master databaselist manually.
Summary ofselection rules
Set selectionrules and limits
here
Choose betweenAND & OR for relations
between limits
Create a new Groupfrom the satellites
selected here
Start the selectionbased on currentrules & limits.
Select whichrule to modify
These satellitesfit the rules
OV’s Satellite Selector is used to build groupsbased on their orbital characteristics.

12
Setup/ObserversThe Setup/Observers screen presents OV’s databaseof observer locations. OV’s observer database ismaintained in two parts: the Main Database whichcontains thousands of cities and a short Observers listof observers that are user-selected. The short list isshown on the left of the Setup/Observers screen.
The shorter Observers List is used in configuringViews instead of presenting the entire MasterDatabase. For example, in the Individual ViewConfiguration screen, only the contents of theObservers List (and NOT the Main DataBase) arepresented. Therefore it is necessary to set up theObservers List to contain all locations that you mightwant to use in Views.
Customize the Observers List to suit your needs.Observers may be taken from the Main Database oryou may manually enter latitude/longitude data in theedit space in the lower left of the screen. Add ordelete Observers to/from the Observers list by drag-and-drop. Search for locations in the Main databaseby using the Find First and Find Next speed buttons(with the flashlight icons).
To enter new locations that are not already containedin the Master Database, mouse-click on individuallines in the editing region (lower left) and enter theappropriate values. When the entry is complete, pressthe Add to Observer List button to place the newlocation in the Observers Box or Add to GES List toenter it in the GES list. Entries in the Main Databasecannot be edited.
Build your personalized “short list”of Observers by dragging locationsfrom the Main Database of 2,000
cities to the Observers List
To add an unlisted Observer, enter data in theEdit Location box, then click on Add toObservers List to save the new location
Edit the latitude & longitude oflocations by dragging them tothe Edit Location box. After
making changes, click on Add toObservers List to save.
The Orbcomm GES list is a listof GES locations, separate from
the main location database.
Use Setup/Observers to build your personalized “short list” of observer locations.Each View’s observers are set in the Individual View Configuration Screen
by selecting from the “short list.”

13
OV’s ToolBarThe ToolBar provides fast access to the mostcommonly-used functions in Orbcomm View.Clicking on ToolBar buttons avoids several steps ofmenus. The ToolBar floats freely on the screen, butits functions are tied to whichever OV View hasfocus. Determine which View has focus by notingthe color of its title bar. Change focus by simplyclicking on the View.
The function of each button is shown on the pictureabove. The ToolBar may be dragged anywhere onthe screen by using the hand-shaped button.Configure the ToolBar to suit your tastes inSetup/ToolBar or by right-clicking the mouse on theToolBar itself.
Time Jump is a means to quickly adjust the
internal time of an OV View. Time may beadvanced forward or backward by a particularnumber of minutes. In addition, time may bechanged to the same mean anomaly position in anyorbit number, or simply to the next or previous orbitfrom the present one. Finally, time can be changedto the next or previous AOS or LOS of the satellite
Link Time links the time of two or more Views.
To activate Link Time, click on the Link Timebutton. The View with focus (a darker title bar atthe top) will become the Master time, and all other
Views will follow the Master. Changing the MasterView's time will automatically change the time onthe other Views. Clicking the Time Link buttonagain releases the Views.
To change which View is the Master, turn LinkTime off. Then click on the View that you want tobecome the Master, giving it focus. Then activatethe Link Time facility again by clicking on thebutton.
aaTip: If you drag the ToolBar against the side ofthe screen, it re-shapes itself into a verticalorientation; dragging it against the top or bottomof the screen arranges the buttons horizontally.
Orbcomm View's Time Jump facility permits rapidexcursions to future or past times, orbits, etc. Changes inOrbit or AOS/LOS refer to the first satellite in the View's
satellite list.
Go to Orbit, Previous or Next Orbit, AOS, orLOS refer to the first satellite in the View's
satellite list.
Text-onlydisplay
MoveToolBar
Rectangularmap
View fromSpace map
Radarmap
Sky noisemap
ChangeView's size
ConfigureView's map
Zip modeon/off
ConfigureView
Launch anew View
Quick visibilitycheck
Link times ofseveral Views
Zip modepause
TimeJump
OV's floating ToolBar provides access to the most frequently-used functions.

14
Views/Configure Current ViewOne of Orbcomm View’s main strengths is its abilityto independently configure each View. A View is asingle “window” which may include a map, tabulartext tracking data, or both. Every View is entirelyindependent from the others, no matter how manyViews are open simultaneously. Views may havedifferent satellites, observers, maps, and eventimekeeping.
The Individual View Configuration screen isshown below. It is divided into three main regions:Satellite selection on the left, Observer selection onthe right, and the View’s current configuration inthe middle.
You may select satellites from the Satellites list
1 . Drag satellite names from this list to the
Current Configuration, Satellites list box 2.
Satellites may be added, removed, or rearrangedwithin the Current Configuration Satellites list; theirorder in the list determines their order of appearancein the tabular text display in the View. The firstsatellite in the list will be the left-most satellites inthe tabular text display. Entire Groups may bemoved at once by dragging the Group name from the
Groups list 5.
Groups are customized inSetup/Groups or by right-
clicking here
Save differentconfigurations and recall
them for quick access
Select the View’smap and textdisplay here.
Choose the Observersthat will be used in
the View by dragginglocations.
Number of columns oftext data to display.
Choose the satellitesthat will be tracked inthe View by dragging
their names.
21
34
5
6
7
Enter value forelevation mask.
8
The Individual View Configuration screen is the main focus for making each View appear the wayyou want it to. This screen is the place to select the satellites and observers that the View will
track, as well as the basic maps and text that will be displayed.
aaTip: Enter the Individual View Configurationscreen by:
• Right-clicking the mouse on the View that youwish to configure, causing the pop-up menu toappear;
• or selecting Views/Configure Current Viewfrom the Main Menu;
• or pressing the Configure View button on
the ToolBar.

15
The Current Configuration, Observers list 3
displays the observer(s) for which satellite positioninformation will be calculated. A “short list” of
observers is provided for quick access 4 . You
may select observers from this list and drag them tothe Current Configuration region.
What controls which satellites appear in theSatellite List? The satellites included in the selected
Group 5 are displayed in the Satellites list.
Clicking on different groups changes the list ofsatellites displayed. Two groups have special status:the “Complete” group includes every satellite inOV’s database and the “Naturals” group includesthe Sun, Moon, planets, celestial noise sources, andcold sky regions. The remaining groups may bemodified by the user in the Setup/Groups selectionfrom the Main Menu or by right-clicking here on theGroups Box.
The general appearance of the View is controlled by
the Map Display and Text Display boxes 6 .
Select what type of map you wish (or no map for anall-text display) on the left and what sort of textdisplay on the right. Each View must contain amap, text, or both.
How does one configure maps? Maps may beconfigured by right-clicking within the Maps box
6 or by pressing the Configure Maps
button on the ToolBar. This will display a multi-page screen that permits control of many aspects ofappearance for all of OV’s maps. This screen isdescribed in detail below (p. 38).
The number of columns of text (1-12 columns) iscontrolled by the Columns Visible entry; large mapsmay not fit on the screen with several columns oftext. If more satellites are being tracked than can fitin the number of columns that have been entered, ascroll bar is presented in the view to slide the displayhorizontally.
Satellite Script orders satellites displayed in the textdisplay according to their AOS times. Pressing the
Configure Script button opens a screen for
generating, displaying, and editing the satellitescript. Its functions are described on page 23, underSatellite Pass Times.
Advanced users may wish to store and recall certainconfigurations. You may record Viewconfigurations by using the Configurations drop-
down box 7 . After establishing an acceptable
configuration, press the button. You willbe queried for a name for the configuration that willlater be presented in the drop-down box. Otherbuttons permit you to update an existingconfiguration, delete a configuration, or rename it.All stored configurations are available for use inother Views. The various combinations of satellitesmaking up the Orbcomm constellation are pre-configured.
8
Some installations require use of an
elevation mask. This raises the user's effectivehorizon by a specified number of degrees. Forexample, setting the mask to 4° means that allfootprints and AOS/LOS calculations are adjustedupwards by 4°. A satellite is not considered "abovethe horizon" until it has attained an elevation of 4°.Separate elevation masks are maintained for eachView as well as each Utility. To remove anelevation mask, set its value to 0.
Configuring ViewsThe appearance of Orbcomm View is determined bythe Views that you have launched. Views areconfigured separately from one another. Changesmade to one View do not affect others.
Initial configuration of Views may be challenging atfirst, but it quickly becomes easy once you arefamiliar with the View pop-up menu. To bring upthe View pop-up menu and configure a View,position the mouse over the View and press the rightmouse button.For detailed configuration, such as choosingsatellites and observers, select Configure View fromthe pop-up. Alternatively, you may press the
Configure View button on the ToolBar. This willdisplay the Individual View Configuration screen.Page 19 explains the Individual View Configurationscreen.

16
View’s Clock (below) sets the time and date for theView. This time can be the same as for the overallOrbcomm View program or it can be entirelydifferent. By default, View time is the same as OV’stime. To set the View’s time to a different value,click the Stop button and enter the desired values inthe spin boxes. To set the View’s time to OV’stime, click Reset.
Zip mode is a fast-forward time stepping that isuseful for viewing satellitemovement in the future.Set the time step for Zipmode in the appropriatebox. To zip backwards intime, set the time step to anegative number.
Text Display determines whetherthe View's text is displayed(onecolumn of text data for eachsatellite, placed to the right of themap), Script tracking(automatically changing as each
satellite in the Script becomes visible), or no text atall.
Map Style set the kind of map that will be displayedin the View's map section. The map may beRectangular, View from Space, Radar, SkyTemperature, or no map.
Map Size: Orbcomm View accommodates severalscreen resolutions. Views may be sized to fit thescreen that you have. Small is appropriate for640x480 pixel screens, medium for the default800x600, and large for 1024x768.
Note: The Set Date and Time for View screen (shown here) is not theplace to set OV's time or, typically, the computer clock. To setOV's overall time, use Setup/Time from the Main Menu.
Open this pop-upmenu by right-
clicking anywhere ona View

17
Experimental mode is a tool for examining theorbits. Using the Experimental Mode, orbits can beadjusted in real time and the effect on an orbit can beseen immediately.. For example, what would theorbit of the Russian “Mir” space station look like ifits inclination was 10° higher and its eccentricitywas 0.1 instead?
Experimental Mode is entered via the View pop-upmenu described on the previous page. The satelliteused in this mode is the first satellite on the View’ssatellite list. Buttons at the bottom of theExperimental Mode screen allow you to retrievedifferent satellites or to save the results of changesmade in this screen.
The Derived button enables examination of severalvalues such as apogee and perigee altitude, period,etc. A more visual approach is to configure theparent View to display the View from Space with anorbit displayed. Then, as changes are made inKeplerian elements, the orbit’s shape changesimmediately.
The key to a satellite’s identity is its catalognumber. Changes made to the satellite’s catalognumber will permanently change its identity andprevent OV from updating its Keplerian elementsfrom an external file.
Entries in the Element set and epoch orbit # fieldshave no effect on a satellite's orbit calculations.
Experimental Mode permits "what-if"analysis of individual satellite orbits

18
Map ConfigurationOrbcomm View includes over 100 maps of variousprojections, sizes, and areas of coverage. Further-more, you have almost complete control of theinformation displayed in the maps so that theyalways display the data that you need withoutclutter.
Map Configuration is available in five pages in thesame "notebook;" click on the bottom tabs to changepages. The Rectangular and View from Space mapsshare several options and their setup screens appearsimilar.
Rectangular Map Configuration
The Rectangular map is familiar to most people. Itshows the entire Earth "unrolled" so that it is visibleat a glance. OV's Rectangular map is based on amodified Miller projection that shows the majorcontinents with relatively little distortion; the northand south poles cannot be shown adequately on anyrectangular map.
The Map area box permits selection of the map thatwill be displayed. World means that the map willdisplay the entire world whereas the variouscontinent names allow zoom-in views of eachcontinent. The individual continent maps provideresolution of approximately 10 km/pixel atmaximum size.
Ground display controls dynamic features added tothe base map. The "normal" footprint of a satelliterepresents the area of visibility of a satellite; that is,the area of the Earth that is visible from the satelliteat any particular moment. The normal footprint isdrawn around the satellite's sub-satellite point (thepoint on the Earth directly underneath the satellite)."NASA" style footprint, on the other hand, is drawnaround the observer. This is the format used byNASA when showing the Shuttle in orbit. Eachground station has a "fence" drawn around it thatrepresents its horizon for the Shuttle. As thespacecraft crosses the "fence," it simultaneouslyrises above the horizon for the observer. The radius
Select the area that themap will display
“Normal” footprintis centered on the
satellite
“NASA” footprint iscentered on the
observer
Set the middle ofthe rectangular map
Enter 0 (zero) to turnground tracks off
Horizon table showsobstructions in the“NASA” footprint
Show footprint withcontours of equalelevation angle
Configureelevationcontours
Don't erasefootprints between
time steps
Orbcomm View's Map Configuration notebook contains separate pages for each type of map.This is the page for the Rectangular map

19
of the NASA-style footprint changes with the heightof a satellite above the ground.
Filling footprints refers to the light shading that OVcan add to the footprint to make it more easilyvisible. OV provides the option of displaying filledfootprints for only the first satellite on the View'ssatellite list, for all satellites in the list, or none ofthem.
Elevation contours may optionally be drawn withina footprint. Elevation contours are concentric linesthat show elevation angles of the satellite above the
horizon. Pressing the elevation contours but-
ton displays a set-up screen for selecting parametersfor the contours to be drawn.
Ground tracks are lines that trace the movement ofthe satellite over the Earth's surface. Ground tracksare useful ways to visualize future positions of thesatellite. OV permits you to display ground tracksfor only the first satellite in the View's satellite list,for all satellites, or none [enter 0 (zero) in the spinbox]. In addition, the spin box allows setting thenumber of orbits' worth of ground track to be drawn.
OV permits setting the central longitude of theRectangular world map by entering the value in thespin box. Alternatively, OV can automaticallycenter the map over the first observer in the View'sObservers list by checking Auto-Center map.
aaTip: You may access the Map Configuration"notebook" by several routes:
• Right-mouse click on a View and select MapStyle, then Configure Maps;
• Click on the Configure Maps button on
the ToolBar
• Open the Individual View Configuration screenand right-click on the Maps box (remember thatright-clicking on things lets you configure them)

20
View From Space Map Configuration
The View from Space map presents the Earth asseen from outer space in a three-dimensionalperspective. It is based on the Orthographic mapprojection.
Options for the View from Space are displayed inthe Map Configuration screen (next page). Themap may be centered over any of the majorcontinents by selecting them in the Map Area box.The Dynamic selection causes OV to change thecenter of the map automatically, in accordance withthe movement of the first satellite in the View’ssatellite list. As the satellite moves around theEarth, the viewer's perspective changesautomatically.
The Ground Display box controls information onthe surface of the map. Normal footprint is acircular area drawn on the map and centered on thesatellite's sub-satellite point. This footprint moveswith the satellite and represents the area of the Earththat the satellite can “see.” High-altitude satelliteshave large footprints whereas low altitude satelliteshave small ones.
Select the area of theworld for map center
Orbit Display showsthe satellite’s orbit
in space
Viewer’sdistance from
the Earth
Orbcomm View's View from Space map configuration page.
Footprint elevation contours are easilyconfigured in this screen
aaTip: You can change the View from Spacemap's center continent by left-clicking ondesired continent.
21
NASA footprint is centered on the first observer andrepresents the horizon for the first satellite on thelist. In other words, when the sub-satellite point (thespot on the Earth immediately underneath thesatellite in space) of first satellite on the list crossesthe NASA footprint perimeter, the satellite has justrisen above the observer’s horizon. This is thedisplay used by NASA for each of its trackingstations. If the observer’s horizon is obstructed insome directions and the Horizon table (see below)has been filled out, it will be useful to check the Usehorizon table box so that the NASA footprintportrays the actual horizon of the observer.
Fill first sat’s footprint and Fill additionalfootprints control whether the footprints are lightlycolored to make them more easily visible. Numberof Ground Tracks tells OV how many orbits to plotas lines on the Earth’s surface. The lines representthe paths of the sub-satellite point; a ground trackhelps to show where a satellite willbe traveling in the future. Set thisvalue to 0 (zero) to turn groundtracks off entirely.
Show sub-satellite point controls whether the mapshows the spot on the Earth where the satellite isdirectly overhead. Usually, this is OFF if the OrbitDisplay is ON because it is confusing to see both thesatellite in space and its sub-satellite point.
The Orbit Display box contains setting that controlplots of satellite orbits in space (as opposed to on-the-ground). You can set the number of orbits ofeach satellite to show by entering a number in thespin box. In order to show the orbits of somesatellites, it is necessary to “step back” from theearth to get a useful perspective. The Zoom levelspin box controls the viewer’s apparent distancefrom the Earth. Large zoom levels make the Earthappear smaller and permit plotting of high-altitudesatellite orbits. Finally, you may select whether toshow the satellite’s position in its orbit as well aswhether to label it.
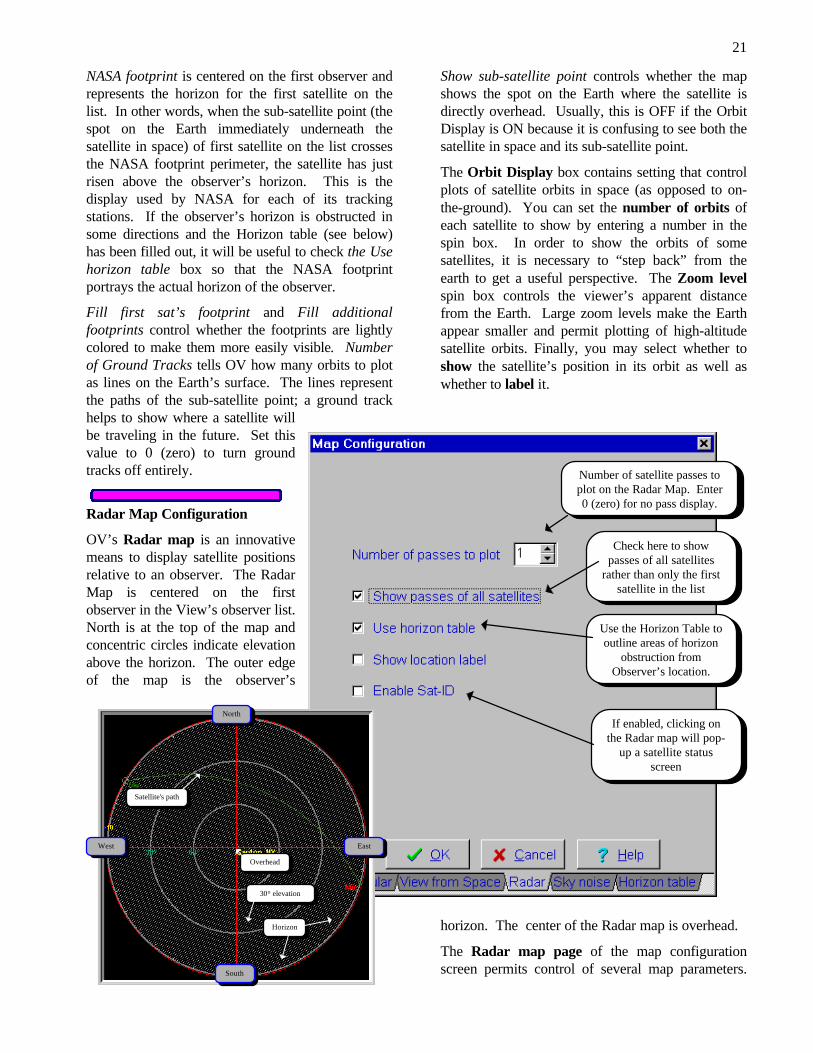
Radar Map Configuration
OV’s Radar map is an innovativemeans to display satellite positionsrelative to an observer. The RadarMap is centered on the firstobserver in the View’s observer list.North is at the top of the map andconcentric circles indicate elevationabove the horizon. The outer edgeof the map is the observer’s
horizon. The center of the Radar map is overhead.
The Radar map page of the map configurationscreen permits control of several map parameters.
Number of satellite passes toplot on the Radar Map. Enter0 (zero) for no pass display.
Check here to showpasses of all satellites
rather than only the firstsatellite in the list
Use the Horizon Table tooutline areas of horizon
obstruction fromObserver’s location.
If enabled, clicking onthe Radar map will pop-
up a satellite statusscreen
North
West East
South
Satellite's path
Overhead
30° elevation
Horizon

22
The number of passes to plot affects how manypaths to display across the Radar map. It is oftenuseful to plot the next pass or two to visualize wherein your sky the satellite will be, how high it willultimately rise, etc. Set this spin box to 0 (zero) toturn off pass plotting. By selecting Show passes ofall satellites you can control whether OV only plots
passes of the first satellite on the View’s satellite listor all of the satellites in the list. If the observer’shorizon is obstructed in some directions and theHorizon table (see below) has been filled out, youshould check the Use horizon table box so that theradar map perimeter portrays the actual horizon ofthe observer.
Sky Noise Map Configuration
The sky is not entirely quiet at VHF andUHF frequencies. Some regionsgenerate noise that can mask weak radiosignals. The Sky Noise map is usefulfor determining when the satellite willbe located in front of noisy areas of sky.
The Sky Noise maps are drawn in aformat that may not be familiar to someusers. The vertical axis is Declination,which is measured above (north) andbelow (south) of the equatorial plane.The equatorial plane is a projection ofthe Earth's equator out into space. Thehorizontal axis of the Sky Temperaturemap is presented in Right Ascension.R.A. is measured in hours (1 hour =15°) with 0 hours being along a north-south line at Greenwich, England.Lines on the Sky Temperature map are"contours" generally similar to contourson a topographic map. Each contourconnects points of equal noise
temperature.Map Frequency sets which map is drawnon the screen. Maps have been prepared bythe IEEE for 50 MHz, 136 MHz, and 400MHz.
Show Horizon plots a curve on the mapthat represents the current horizon at theobserver's location. Show satellite pathdisplays a curve showing the path of thesatellite against the sky. Show Sun plotsthe sun's position on the map and Showtemperature labels displays numbersrepresenting equivalent noise temperature ofthe map's contours.
Select frequency ofSky Temperature map
Additional options
User'shorizon
Satellite (belowthe horizon here)
Very noisy sky
"Quiet" sky
Orbcomm View's Sky Noise map shows a contour map ofequivalent noise temperature.
The Sky Noise page of the MapConfiguration notebook sets options forthe Sky Noise map

23
Horizon Table Configuration
Horizon Table is a means of modeling the observer’shorizon to account for obstructions such asmountains, buildings, or trees. The full-circle
horizon is divided into 20° slices in the Horizon tableconfiguration page. For each slice, enter the actualhorizon elevation as seen from the satellite trackingantenna’s point of view. For example, if mountainsobstruct the horizon from 80°-180°, then their
general profile can be entered inthe 80°-180° slices (seeexample). Where the horizon isflat, enter 0°. It is also possibleto enter negative values ifnecessary.
Horizon table modeling is usedin display of NASA-stylefootprints and in the outerperimeter of the Radar map.The horizon table is notincluded in AOS/LOScalculations, which are basedon a horizon mask set in eachView.
Utilities/Satellite PassTimesOrbcomm Viewincludes apowerful tool formanagingautomatedtracking ofmultiple satellites.The Satellite PassTimes utilitycalculates a time-sorted list ofpasses for all thesatellites in aView.
The Satellite PassTimes utilityconsists of two
The Horizon table models obstructions to the observer’s horizon
The bottom axis is time.Readout of the time
where the mouse cursoris pointed.
Use slider to scan through time
Night - Day
Orbcomm View’ graphics display of Satellite Pass Times presents a clear summary ofmultiple passes of several satellites.

24
pages: Text andGraphics. Thegraphics pagedisplays satellitepasses vs. Time.Passes arerepresented ashorizontal linesarrangedvertically bysatellite.
The Text displaylists every pass ofevery satellite inthe View's list inchronologicalorder. Each passlisting includesthe AOS andLOS times(adjusted forelevation mask, ifany) as well asthe duration ofthe pass. Thetime interval between sequential passes is indicated.
Utilities/Detailed Pass InformationOrbcomm View includes comprehensive capabilitiesfor producing tabular listings of satellite positions.Listings may be directed to the screen, to a printer,or to a disk file.
Listings of detailed pass information are available infour main formats:
• One Observer presents information about onesatellite as seen from one observer’s location.Position data are calculated at step intervals as setin the Setup screen (see below).
• AOS/LOS lists only AOS/LOS times for onesatellite and one observer; this is convenient forassessing many upcoming passes of the satelliteon one screen.
• Two Observers lists one satellite’s position fromthe points of view of two observerssimultaneously. This is similar to the OneObserver page in that data are presented at aspecified time interval (chosen in Setup).
• Two Obs. Mutual Window is a summary of themutual windows of the satellite with twoobservers; these are the times when the satellite isabove the horizon at both locations simul-taneously.
To select a format for listing, click on the notebooktabs across the bottom of the Listing screen. Selecta satellite and observer by using the Setup button.Remember to click the ReCalc button to recalculatepass information after making changes in the Setup.
Text listing shows allpasses of all satellites
Select satellites foranalysis in Setup
Text page of the Satellite Pass Times notebook shows all passes of all satellites in the list.

25
Utilities/Two-Satellite Mutual VisibilityThe Two-Satellite Mutual Visibility utility calc-ulates times when two satellites will be in line-of-sight of each other.
In addition to simple satellite-to-satellite visibility,OV also calculates the times when one of thesatellites will also be visible to an OrbcommGateway Earth Station (GES).
Time when the satellites are withinline-of-sight with each other
Time when the 1st satellite (A1 in this case)is line-of-sight with the Observer
Time when the 2nd satellite (C3) is line-of-sight with the Observer
Time when all conditions are met
Satellite with bestvisibility during the pass
Time when both satellitescan see each other
Time when both satellitescan see each other
ANDone satellite can see the
observer

26
The 1 Observer page of the Mutual Visibilityutility notebook displays data for two satellites andone observer, whereas the 2 Observers page includesa second ground station.
The first step in generating data of 2-satellite mutualvisibility is to enter the Setup screen and select thesatellites and observer(s) of interest. When this isfinished, click on the ReCalc button to perform thecalculations.
The first column of the display shows the date,followed by three columns that show when the twosatellites can see each other. The following threecolumns show the times when the satellites can see
each other and at least one of them is visible fromthe observer's location.
The Graphics display shows a diagram of thesituation for any pass. First, select a pass byclicking on it. Then press the Graphics button.Three horizontal lines are presented, representingtimes of visibility of the two satellites. The lowertwo lines show when the satellites are visible to theobserver; the top line shows when the satellites aremutually visible (i.e. visible to each other). Thevertical dotted line shows the time period of overlap,when the satellites re visible to each other and one ofthem is visible to the observer.
Utilities/EclipsesOrbcomm View’ Eclipse Utility permits prediction oftime periods during which a satellite will pass into theEarth’s shadow. Almost all Earth-orbiting satellitesare solar-powered; eclipse periods drain their batteries. If a satellite remains in eclipse for too long, itsability to function may be seriously impaired. In somecases, onboard battery failure has left a satellitetotally dependent on exposure to direct sunlight. Thesatellite cannot function while it is in eclipse.
The Eclipseutility containstwo pages: onethat displaysEclipse periodson an orbit-by-orbit basis andanother thatsummarizesentire days at atime.
The EveryOrbit pageshows thestarting andending times ofeach period ofeclipse for theselected satellite.As with the otherutilities, you mayselect thesatellite by usingthe Setup button.
Start, End, and Duration are self-explanatory.Interval between represents the time betweensuccessive eclipse periods.
Daily Summary combines all eclipses in each 24-hourperiod and presents a summary. Duration is the totalnumber of minutes of eclipse for the day. Percent isthe portion of the day that the satellite spends in theEarth’s shadow. Longest is the length of the longestEclipse of the day. Sun angle is the angle between theorbital plane of the satellite and the Sun.
Period of eclipse foreach orbit
Time between theend of one eclipseand beginning of
the next
Angle between thesatellite’s orbitalplane and the Sun
The Every Orbit page of the Eclipse Utility summarizes periods of time when the satellite isin the Earth’s shadow. This is useful for predicting daily electrical performance.

27
Utilities/QuickVisibility CheckThe Quick VisibilityCheck provides anoverview of all thesatellites in the main OVdatabase. When itappears, satellite namesare listed in either blackor blue text color. Bluenames represent satellitesthat are currently abovethe observer’s horizon.Visibility is recalculatedevery five seconds.
Azimuth/elevation datafor one satellite aredisplayed in the lowerright corner. You mayselect a different satelliteby mouse-clicking on it.
Eclipses aresummarized for the
entire day. Durationis the sum of all
eclipses during theUTC day.
Percentage of theday that the
satellite is in theEarth’s shadow.
Duration of thelongest eclipseperiod during
the day.
Eclipse Daily summary combines eclipse data for each 24-hour period,facilitating a longer-term perspective, useful for predicting spacecraft power budgets.
Currently selectedsatellite and its position
Satellites that are currentlyabove the horizon are
highlighted in blue
Utilities/Quick Visibility Check provides a summary of all satellites that arevisible above the user's horizon.

28
Frequently Asked Questions
Q: How do I update Keplerian Elements?
Step 1: Acquire a computer file of new Keplerianelements. There are many sources of these filesincluding the Orbcomm web site
http://www.orbcomm.com
as well as links through NLSA's web site
http://www.nlsa.com
Step 2: In OV's Main Menu, go to Setup, thenSatellites.
Step 3: In the Setup/Satellites screen, click on the
Update button.
Step 4: In the pop-up box that appears, tell OV thename of the file that you downloaded in step 1.
Step 5: Click OK and OV reads the file and updatesall Keplerian elements in a few seconds.
Q: How do I tell the program about my location?
Step 1: Go to the Main Menu, Setup, then Observers.
Step 2: In Setup/Observers, see if your location islisted in the Main Database (the one on the right sideof the page). If it is there, then drag it to the short liston the left. If it is not in the Main Database, do thefollowing:
• Fill in the blanks in Edit Location in the lower leftcorner of Setup/Observers. Enter your town'sname, its latitude, and its longitude.
• When all entries are completed, press the
button to add this new
location to the short list.
Step 3: Exit the Setup/Observers screen by pressingOK.
Step 4:Click on the View that you wish to configurewith your location.
Step 5: Right-click the mouse within the View toreveal the pop-up menu. Select Configure View.
Step 6: In the Individual View Configuration screen,find your town in the short Observers list on the farright side of the screen. Drag the name to toward themiddle and drop it in the Observers box underCurrent Configuration.
Step 7: Click OK and you're finished.
Step 8 (optional): If other Views have already beenlaunched, repeat steps 4-6 as necessary.
Getting HelpOrbcomm View includes context-sensitive Help onalmost every Setup or configuration page. Inaddition, small pop-up hints appear near buttons ifthey have been enabled in Setup/General.
Orbcomm's Customer Service group supports OVusers. Send e-mail to
Northern Lights Software Associates welcomesyour e-mail comments, suggestions, and criticismsat [email protected] or [email protected].
If necessary, you may telephone NLSA at (315)379-0161. Please have your serial numberavailable. NLSA's FAX number is the same as thevoice number.
NLSA's Web page is http://www.nlsa.com
aaTip: If you want all new Views to have yourlocation automatically used when the View is
created, click the Default button
before leaving Individual View Configuration.
1997,1998 Northern Lights Software AssociatesAll Rights Reserved