Embed Size (px)
Citation preview

ORAU Team NIOSH Dose Reconstruction Project
Technical Basis Document for the Y-12 National Security Complex– Occupational External Dosimetry
Document Number: ORAUT-TKBS-0014-6
Effective Date: 11/19/2003 Revision No.: 00 Controlled Copy No.:_______ Page 1 of 47
Subject Expert: George D. Kerr Document Owner Approval: Signature on File Date: 11/19/2003 William E. Murray, TBD Team Leader Approval: Signature on File Date: 11/19/2003 Judson L. Kenoyer, Task 3 Manager Concurrence: Signature on File Date: 11/19/2003 Richard E. Toohey, Project Director Approval: Signature on File Date: 11/21/2003 James W. Neton, OCAS Health Science Administrator
Supersedes:
None
TABLE OF CONTENTS
Section Page
Record of Issue/Revisions ......................................................................................................................5
Acronyms and Abbreviations ..................................................................................................................6
6.1 Introduction ....................................................................................................................................8
6.2 Basis of Comparison......................................................................................................................9
6.3 Dose Reconstruction Parameters ................................................................................................10 6.3.1 Y-12 Historical Administrative Practices .............................................................................10 6.3.2 Y-12 Dosimetry Technology................................................................................................13
6.3.2.1 Beta/Photon Dosimeters ............................................................................................13 6.3.2.2 Neutron Dosimeters ...................................................................................................16
6.3.3 Y-12 Dosimeter Calibration Procedures .............................................................................17 6.3.3.1 Beta/Photon Dosimeters ............................................................................................17 6.3.3.2 Neutron Dosimeters ...................................................................................................18
6.3.4 Y-12 Workplace Radiation Fields........................................................................................19 6.3.4.1 Workplace Beta/Photon Dosimeter Response...........................................................19 6.3.4.2 Workplace Neutron Dosimeter Response..................................................................21
6.3.4.2.1 Calibration Laboratory in Building 9983..............................................................21 6.3.4.2.1.1 Neutron Energy Spectrum ........................................................................22 6.3.4.2.1.2 Neutron-to-Photon Dose Ratio .................................................................23
6.3.4.2.2 Enriched Uranium Storage Area in Building 9212 ..............................................23 6.3.4.2.2.1 Neutron Energy Spectrum ........................................................................23 6.3.4.2.2.2 Neutron-to-Photon Dose Ratio .................................................................24
6.3.4.2.3 Nondestructive Assay Laboratory in Building 9720-5 .........................................25 6.3.4.2.3.1 Neutron Energy Spectrum ........................................................................25 6.3.4.2.3.2 Neutron-to-Photon Dose Ratio .................................................................26

Effective Date: 11/19/2003 Revision No. 00 Document No. ORAUT-TKBS-0014-6 Page 2 of 47
6.3.4.3 Typical Workplace Neutron Dosimeter Hp(10) Performance .....................................26 Section Page
6.4 Adjustments of Recorded Dose ...................................................................................................27 6.4.1 Photon Dose Adjustments ..................................................................................................27 6.4.2 Neutron Dose Adjustments .................................................................................................28
6.4.2.1 Neutron Weighting Factors ........................................................................................29 6.4.2.2 Neutron Dose Correction Factors ..............................................................................29
6.5 Missed Dose ................................................................................................................................30 6.5.1 Photon Missed Dose...........................................................................................................30
6.5.1.1 Facility or Location .....................................................................................................31 6.5.1.2 Dosimeter Type..........................................................................................................31 6.5.1.3 Year............................................................................................................................31 6.5.1.4 Energy Range ............................................................................................................31
6.5.2 Neutron Missed Dose .........................................................................................................32 6.5.2.1 Prior to 1980...............................................................................................................32 6.5.2.2 From 1980 to 1989.....................................................................................................32 6.5.2.3 Post 1989 ...................................................................................................................33
6.6 Uncertainty in Photon and Neutron Dose ....................................................................................33
6.7 Organ Dose .................................................................................................................................33
References ...........................................................................................................................................35
Glossary................................................................................................................................................40 Attachment F Occupational External Dose For Monitored Workers
F.1 Occupational External Dose ........................................................................................................41
F.2 Years of Exposure .......................................................................................................................41
F.3 Exposure Rate .............................................................................................................................41
F.4 Radiation Type.............................................................................................................................41 F.4.1. Beta and Photon Radiation .................................................................................................41 F.4.2. Neutron Radiation ...............................................................................................................42
F.5 Adjustments to Recorded Dose ...................................................................................................43 F.5.1. Parameter #1 ......................................................................................................................43 F.5.2. Adjustment to Recorded Photon Dose................................................................................43 F.5.3. Adjustments to Recorded Neutron Dose ............................................................................43 F.5.4. Unmonitored Photon and Neutron Dose.............................................................................44 F.5.5. Missing Photon Dose ..........................................................................................................44
F.5.5.1. Facility or Location .....................................................................................................44 F.5.5.2. Dosimeter Type..........................................................................................................45
F.5.6. Neutron Missed Dose .........................................................................................................45 F.5.7 Organ Dose Equivalent .......................................................................................................46 F.5.8 Parameter #2 ......................................................................................................................46

Effective Date: 11/19/2003 Revision No. 00 Document No. ORAUT-TKBS-0014-6 Page 3 of 47
F.5.9 Organ Dose Conversion Factors.........................................................................................46
LIST OF TABLES
6.3.1-1 Monitoring technique and exchange frequency used at Y-12 Plant for external whole-body exposures ..........................................................................................11
6.3.1-2 Dosimeter type, period of use, exchange frequency, laboratory minimum detectable limit, and maximum annual missed dose ...........................................12
6.3.2-1 Y-12 historical dosimetry events .........................................................................................14 6.3.2.1-1 IARC study results for US beta/photon dosimeters.............................................................16 6.3.3.1-1 Common sources of laboratory bias in the calibration parameters for
beta/photon dosimeters ......................................................................................................18 6.3.3.2-1 Common sources of laboratory bias in the calibration parameters for
neutron dosimeters .............................................................................................................19 6.3.4.1-1 Selection of beta and photon radiation energies and percentages for
Y-12 site processes ............................................................................................................20 6.3.4.1-2 Typical workplace beta/gamma dosimeter Hp(10) performance.........................................21 6.3.4.2-1 Dose fractions for Y-12 calibration laboratory .....................................................................23 6.3.4.2-2 Neutron dose fractions for Y-12 enriched uranium storage area ........................................24 6.3.4.2-3 Dose fractions for Y-12 nondestructive analysis laboratory ................................................26 6.3.4.3-1 Typical workplace neutron dosimeter Hp(10) performance ................................................26 6.3.4.3-2 Number of neutron monitored workers, cumulative neutron dose, and
average neutron dose to Y-12 workers for 12-year period following introduction of the four-element TLND dosimeter in 1989 ..................................................27
6.4.1-1 Adjustments to reported Y-12 deep photon dose ...............................................................28 6.4.2.1-1 Neutron quality factor, Q, or weighting factor, wr ................................................................30 6.4.2.2-1 Summary of neutron dose fractions and associated ICRP 60
correction factors for Y-12 site facilities ..............................................................................30 6.6-1 Default exposure geometries for calculating organ doses ..................................................34 F-1 IREP dose parameter input screen.....................................................................................41 F-2 Selection of beta and photon radiation energies and percentages for
Y-12 site processes ............................................................................................................42 F-3 Selection of neutron energies and percentages for Y-12 site facilities ...............................42 F-4 Adjustments to reported Y-12 deep photon dose ...............................................................43 F-5 Neutron dose fractions and associated ICRP 60 correction factors for
Y-12 site facilities ................................................................................................................45 F-6 Dosimeter type, period of use, exchange frequency, laboratory
minimum detectable limit, and maximum annual missed dose ...........................................45 F-7 Default exposure geometries for calculating organ dose....................................................46

Effective Date: 11/19/2003 Revision No. 00 Document No. ORAUT-TKBS-0014-6 Page 4 of 47
LIST OF FIGURES
6.1-1 Percentage of Y-12 workers monitored ................................................................................9 6.3.2.1-1 Comparison of Hp(10) for photons......................................................................................15 6.3.2.2-1 Comparision of Hp(10) for neutrons....................................................................................17 6.3.4.2-1 Results of PNL neutron spectrum measurements in Calibration
Laboratory of Building 9983 ................................................................................................22 6.3.4.2-2 Results of PNL neutron spectrum measurements in Enriched Uranium
Storage Area.......................................................................................................................24 6.3.4.2-3 Results of PNL neutron spectrum measurements made at 1 meter
from a bare 252Cf fission neutron source .............................................................................25 6.4.1-1 Maximum and average photon deep dose to Y-12 workers for the 10-
year period from 1978 to 1987............................................................................................28 6.4.2.1-1 Comparison of the neutron quality factors used in the PNL neutron
spectrum measurements and the neutron quality factors from NCRP Report 38 ............................................................................................................................29

Effective Date: 11/19/2003 Revision No. 00 Document No. ORAUT-TKBS-0014-6 Page 5 of 47
RECORD OF ISSUE/REVISIONS
ISSUE AUTHORIZATION DATE
EFFECTIVE DATE
REV. NO. DESCRIPTION
Draft 10/13/2003 00-A New document to establish occupational external dosimetry for the Y-12 National Security Complex. Initiated by William E. Murray.
11/19/2003 11/19/2003 00 First approved issue. Initiated by William E. Murray.

Effective Date: 11/19/2003 Revision No. 00 Document No. ORAUT-TKBS-0014-6 Page 6 of 47
ACRONYMS AND ABBREVIATIONS
AEC U.S. Atomic Energy Commission ANSI American National Standards Institute A-P Anterior-posterior (or front-to-back) irradiation of the body BXWT Y-12 Current operator of Y-12 under contract with DOE CATI Computer assisted telephone interview (of claimant) Ci Curie (a unit of radioactivity)
DCF Dose conversion factor DOE U.S. Department of Energy DOELAP DOE Laboratory Accreditation Program DU Depleted uranium
EEOICPA Energy Employees Occupational Illness Compensation Program Act ETTP East Tennessee Technological Park EU Enriched uranium HPRR Health Physics Research Reactor
IAEA International Atomic Energy Agency IARC International Agency for Research on Cancer ICRP International Commission on Radiological Protection ICRU International Commission on Radiation Units and Measurements IREP Interactive Radio-Epidemiological Program (a computer program) ISO International Standards Organization
K-25 Oak Ridge Gaseous Diffusion Plant, now the ETTP keV kiloelectronvolt (a unit of energy)
MDL Minimum Detectable Limit MED Manhattan Engineering District MeV Megaelectronvolt (a unit of energy) MMES Martin Marietta Energy Systems
NCRP National Council on Radiation Protection and Measurements NIOSH National Institute for Occupational Safety and Health NTA Nuclear track type A emulsion (or film) ORGDP Oak Ridge Gaseous Diffusion Plant ORISE Oak Ridge Institute for Science and Education ORNL Oak Ridge National Laboratory
PC Probability of causation PIC Pocket ionization chamber PNL Pacific Northwest Laboratory
RADCAL Radiation Calibration Laboratory at ORNL REF Radiation Effectiveness Factor

Effective Date: 11/19/2003 Revision No. 00 Document No. ORAUT-TKBS-0014-6 Page 7 of 47
rem Roentgen equivalent man (a unit of radiation dose equivalent) RPG Radiation protection guideline SD Standard deviation SSN Social Security Number
TEC Tennessee Eastman Corporation TLD Thermoluminescent Dosimeter TLND Neutron TLD
WB Whole body
UCC Union Carbide Corporation UCC-ND UCC Nuclear Division
Y-12 Y-12 Plant, now the Y-12 National Security Complex

Effective Date: 11/19/2003 Revision No. 00 Document No. ORAUT-TKBS-0014-6 Page 8 of 47
6.1 INTRODUCTION
The Y-12 Plant, now the Y-12 National Security Complex, was first conceived in the fall of 1942 by engineers of the Manhattan Engineering District (MED) of the U.S. Army Corps of Engineers, and the construction of the first building was completed in 1943 (Wilcox 2001). The Tennessee Eastman Corporation (TEC) operated Y-12 between June 1943 and May 1947. During this period, the operations at Y-12 primarily involved the use of the electromagnetic separation process to enrich uranium in 235U, with the enriched product being shipped to Los Alamos for production of atomic weapons. Until the latter part of 1945, Y-12 converted UO3 to UCl4 which was subsequently enriched in 235U by the electromagnetic separation process using two calutron stages (termed “alpha” and “beta”). In late 1945, Y-12 discontinued the use of the alpha calutron stage, and processes at Y-12 were changed to receive UF6 from the Oak Ridge Gaseous Diffusion Plant (ORGDP) or so-called K-25 Plant. The UF6 was then further enriched at Y-12 by the beta calutrons and shipped to Los Alamos. In these early days of Y-12, TEC relied entirely on facility monitoring to measure and control the radiation exposure to workers. The nature of the work at Y-12 in these early years resulted in internal occupational exposure being more important than occupational external exposure.
In May 1947, management of Y-12 was assigned to the Carbide & Chemicals Company, a division of the Union Carbide & Carbon Corporation, and emphasis was directed away from enrichment to the fabrication of nuclear weapon parts. Numerous changes have occurred over the years in the fabrication procedures, but the general features have remained the same. Typically, enriched uranium (EU) was received at Y-12 in the form of UF6, converted to UF4, reduced to a metal, and then fabricated into weapon parts. These fabrication processes involved casting of metal, rolling and forming the metal, machining the metal, and recycling of the EU salvage. The fabrication of weapon parts was expanded over the years to include other radioactive and non-radioactive materials. In addition to facility monitoring to measure and control the radiation exposure to workers, an external dosimetry program was started in 1948 to monitor individual personnel working in the Assay Laboratories, Radiographic Shop, Spectrographic Shop, and the “Metal” Machine Shops. This program which monitored less than 25% of the total number of Y-12 employees was continued through the criticality accident at Y-12 in 1958. As a result of the 1958 criticality accident, a program was instituted in 1961 to individually monitor all Y-12 workers for external radiation exposure using a dosimeter system that was an integral part of the worker’s identification badge and contained components for both routine and accident dosimetry. Thus, Y-12 has used both facility monitoring and individual worker monitoring to measure and control radiation exposures to radiation workers since 1948. The percentages of Y-12 workers monitored for external radiation exposure from the start of the external dosimetry program in 1948 through the switch to monitoring nearly all workers in 1961 are shown in Figure 6.1-1. The external monitoring data for Y-12 workers from 1948 to 1950 are not readily available by Social Security Number (SSN) and are not being supplied by Y-12 in response to Energy Employees Occupational Illness Compensation Program Act (EEOICPA) requests (Souleyrette 2003).
There are numerous Y-12 records concerning facility monitoring, safety evaluations, investigations, etc. However, it is time consuming to locate and evaluate these records for all Y-12 facilities and processes since 1943. Evaluations of the extensive scope of facility, process, and worker information relevant to an individual worker’s potential dose, many years or even decades after employment, are difficult or even impossible in some instances. Records of radiation dose to individual workers from personnel dosimeters worn by the worker and co-workers are available for the employees with the highest potential for external radiation exposure from 1950 to 1961 and for all workers from 1961 to the present. Dose from these dosimeters is recorded at the time of measurement, reviewed routinely by Y-12 operations and safety staff for compliance with radiation control limits, and made available routinely to workers. The National Institute for Occupational Safety and Health (NIOSH) External

Effective Date: 11/19/2003 Revision No. 00 Document No. ORAUT-TKBS-0014-6 Page 9 of 47
Dosimetry Implementation Guide (NIOSH 2002) has identified these records to represent the highest quality record to retrospectively assess dose. Information presented in this section pertains to
1945 1950 1955 1960
Year
0
5
10
15
20
25
Ext
erna
l Mon
itorin
g of
Y-1
2 W
orke
rs (%
)
Figure 6.1-1. Percentage of Y-12 workers monitored for external radiation exposure from start of external monitoring program in 1948 through the switch to monitoring nearly all workers in 1961 (Watkins et al. 1993).
the analysis of these records and does not address parameters regarding skin and testicular or breast radiation dose that may result from acute exposure to beta-particles in generally non-routine workplace exposure situations.
Radiation dosimetry practices were initially based on experience gained during several decades of radium and x-ray usage in medical diagnostic and therapeutic applications. These methods were generally well advanced at the start of the MED project to develop nuclear weapons in the 1940s (Morgan 1961; Taylor 1971). The primary difficulties encountered in MED efforts to measure worker doses to external radiation were (1) the large quantities of high level radioactivity that were not encountered previously and (2) the mixed radiation fields involving beta particles, photons (x-rays and gamma rays), and neutrons having a broad spectrum of energies.
6.2 BASIS OF COMPARISON
Since the initiation of the MED in the early 1940s, various radiation dose concepts and quantities have been used to measure and record occupational dose. A basis of comparison for dose reconstruction is the Personal Dose Equivalent, Hp(d), where d identifies the depth (in mm) and represents the point of reference for dose in tissue. For weakly penetrating radiation of significance to skin dose, d = 0.07 mm and is noted as Hp(0.07). For penetrating radiation of significance to “whole body” dose, d = 10 mm and is noted as Hp(10). Both Hp(0.07) and Hp(10) are the radiation quantities recommended for use as the operational quantity to be recorded for radiological protection purposes by the International Commission on Radiation Units and Measurements (ICRU 1993). In addition, Hp(0.07) and Hp(10) are the radiation quantities used in the U.S. Department of Energy’s (DOE) DOE Laboratory Accreditation Program (DOELAP) to accredit DOE personnel dosimetry systems since the 1980s (DOE 1986). The International Agency for Research on Cancer (IARC) also selected Hp(10)

Effective Date: 11/19/2003 Revision No. 00 Document No. ORAUT-TKBS-0014-6 Page 10 of 47
as the quantity to assess error in historical, recorded “whole body” dose for workers in the IARC nuclear worker epidemiologic studies (Thierry-Chef et al. 2002). The basis for comparison for neutron radiation is more complicated since historically the calibration of dosimeters to measure neutron dose was based on different dose quantities such as First Collision Dose, Multiple Collision Dose, Dose Equivalent Index, etc. The numerical difference in using these dose quantities compared to the Hp(10) dose used in current DOELAP performance testing could be evaluated by using the relative values of the dose conversion factors for the respective dose quantities in conjunction with characteristics of the respective Y-12 neutron dosimeter response characteristics and workplace radiation fields.
6.3 DOSE RECONSTRUCTION PARAMETERS
Examinations of the beta, photon (x-ray and gamma ray), and neutron radiation types, energies and exposure geometries, and the characteristics of the respective Y-12 dosimeter response are crucial for the assessment of bias and uncertainty of the original recorded dose in relation to the radiation quantity Hp(10). The bias and uncertainty for current dosimetry systems are typically well documented for Hp(10). Often the performance of current dosimeters can be compared with performance characteristics of historical dosimetry systems in the same, or highly similar, facilities or workplaces. In addition, current performance testing techniques can be applied to earlier dosimetry systems to achieve a consistent evaluation of all dosimetry systems. Dosimeter response characteristics for radiation types and energies in the workplace are crucial to the overall analysis of error in recorded dose.
Overall, the accuracy and precision of the original recorded individual worker doses and their comparability to be considered in using NIOSH (2002) guidelines depend on:
• Administrative practices adopted by facilities to calculate and record personnel dose based on technical, administrative, and statutory compliance considerations.
• Dosimetry technology used that includes the physical capabilities of the dosimetry system, such as the response to radiation type and energy, especially in mixed radiation fields.
• Calibration methods used for the respective monitoring systems and the similarity of the methods of calibration to sources of exposure in the workplace.
• Workplace radiation fields that may include mixed types of radiation, variations in exposure geometries, environmental conditions.
An evaluation of the original recorded doses based on these parameters is expected to provide the best estimate of Hp(0.07), as necessary, and Hp(10) for individual workers, with the least relative overall uncertainty.
6.3.1 Y-12 Historical Administrative Practices
A dosimetry program was started in 1948 to monitor individual external exposures of personnel working in the Assay Laboratories, Radiographic Shop, Spectrographic Shop, and “Metal” Machine Shops. At first, the external radiation monitoring was performed using pocket ionization chambers (PICs), typically exchanged on a weekly basis (Souleyrette 2003). Additionally, early efforts were concerned with using a photographic film pad on the hands of the uranium metal workers and attempting to correlate the film pad reading with whole-body exposures, which were recorded first with PICs and later with personnel whole-body (WB) film badge dosimeters. The Y-12 film badge program

Effective Date: 11/19/2003 Revision No. 00 Document No. ORAUT-TKBS-0014-6 Page 11 of 47
for external monitoring of exposures to beta particles, photons (x-rays and gamma rays), and neutrons continued through 1980, when the personnel film dosimeters were replaced with thermoluminescent dosimeters (TLDs). The frequency of exchange of these personnel dosimeters is summarized in Table 6.3.1-1 (Souleyrette 2003; Watkins et al. 1993; West 1993).
Table 6.3.1-1. Monitoring technique and exchange frequency used at Y-12 Plant for external whole-body exposures.a
Period Monitoring technique Exchange frequency Monitored personnel Beta/photon dosimeters
1948-1950 Pocket ionization chambers and two-element film dosimeters
Some daily, some weekly Personnel expected to receive over 10% of RPG
1950-04/07/58
Two-element film dosimeters
Weekly Personnel expected to receive over 10% of RPG
04/08/58-06/30/61
Two-element film dosimeters
Monthly Personnel expected to receive over 10% of RPG
06/30/61-10/01/80
Four-element film dosimeters
Quarterly Nearly all personnel monitored
10/01/80-01/03/89
Two-element TLD dosimeters
Some quarterly, some annually, a very limited group on a monthly basis
Quarterly exchange for personnel expected to receive 500 mrem or more, annual exchange for personnel expected to receive less than 500 mrem
01/03/89-Present
Four-element TLD dosimeters
Mostly quarterly, some monthly
Nearly all personnel monitored from 1989 to 1996. After 1996, only personnel entering radiological areas.
Neutron dosimeters 1950-10/01/80
NTA film Biweekly, monthly, and
quarterly Personnel exposed to neutron sources
10/01/80-01/03/89
NTA film for fast neutrons and TLND dosimeters for other energy neutrons
Quarterly Personnel exposed to neutron sources
01/03/89-Present
TLND dosimeters for neutrons of all energies
Quarterly Personnel exposed to neutron sources
a. Souleyrette (2003), Watkins et al. (1993), West (1993).
The minimum detection level (MDL) of the various dosimeters used at Y-12 to monitor for beta/gamma and neutron exposures of the whole body is summarized in Table 6.3.1-2. The first film dosimeter used at Y-12 is believed to be the same badge used at the Oak Ridge National Laboratory (ORNL) in 1949 (West 1993) and described by Thornton, Davis, and Gupton (1961). This film badge was an AEC Catalog Number PF-1B film badge manufactured by the A. M. Samples Machine Company in Knoxville, Tennessee (Patterson, West and McLendon 1957). It had an open window over a portion of the film to measure both beta and photon radiation, and a 1-mm thick cadmium filter over a portion of the film to measure higher energy photon radiation only. This film dosimeter was used at Y-12 until 1961, when a newer film dosimeter was developed for use at all Union Carbide Corporation Nuclear Division (UCC-ND) facilities (Thornton, Davis, and Gupton 1961). This newer film dosimeter served as identification badge and also provided for both personnel routine and accident monitoring. The precise minimum detectable limits (MDLs) shown in Table 6.3.1-2 are difficult to estimate, particularly for the film dosimeters. For the current TLD dosimeters, the MDLs are precisely identified in the Y-12 External Dosimetry Technical Basis Documentation (BWXT Y-12 2001) based on a DOELAP protocol (DOE 1986). For the film dosimeters, the MDLs are subject to additional uncertainty because factors involving the radiation field and film type, as well as the processing, developing, and reading system cannot be tested. The MDLs for the film dosimeters in Table 6.3.1-2 were based on information from

Effective Date: 11/19/2003 Revision No. 00 Document No. ORAUT-TKBS-0014-6 Page 12 of 47
Table 6.3.1-2. Dosimeter type, period of use, exchange frequency, laboratory minimum detectable limit, and maximum annual missed dose.a
Dosimeter Period Exchange frequency
Laboratory MDL (mrem)
Maximum annual missed dose
(mrem) Beta/photon dosimeters
Daily < 5 1,300 Pocket ionization chamber 1948-1950 Weekly < 5 260
1948-1958 Weekly 40 2,080 Two-element film badge 1958-1961 Monthly 40 480
Four-element film badge 1961-1980 Quarterly 40 160 Two-element TLD dosimeter 1980-1989 Quarterly 20 80 Four-element TLD dosimeter 1989-Present Quarterly 10 40
Neutron dosimeters Biweekly < 50 1,300b Monthly < 50 600b
NTA film 1948-1980
Quarterly < 50 200b 1980-1985 Quarterly < 50 200b Combination NTA film and TLND
dosimeter 1985-1989 Quarterly 20 80 TLND dosimeter 1989-Present Quarterly 10 40
a. Souleyrette (2003), Watkins et al. (1993), West (1993), Wilson et al (1990), Patterson, West, and McLendon (1957). b. Potential annual missed dose based on data from laboratory irradiations may not be directly applicable to workplace missed dose.
Souleyrette (2003), Watkins et al. (1993), West (1993), Wilson et al. (1990), and Patterson, West, and McLendon (1957). Y-12 administration practices that are important to dose reconstruction include the following policies for:
• Assigning dosimeters to workers
• Exchanging dosimeters
• Recording notational dose (i.e., some identified values for lower dose workers based on a small fraction of the regulatory limit)
• Estimating dose from lost or damaged dosimeters
• Replacing destroyed or missing records
• Evaluating and recording doses for incidents or accidents
• Obtaining and recording occupational dose to workers for other employer exposures.
Policies appear to have been in place at Y-12 for all of these parameters. Their routine practices appear to have required assigning dosimeters to personnel who might receive an external radiation dose that was greater than 10% of the Radiation Protection Guidelines (RPGs) that was in effect at that time. Dosimeters were exchanged on a routine schedule. All beta/photon dosimeters were processed and the measured results recorded and used for dose estimation to the individual workers. A neutron thermoluminescent dosimeter (TLND) dosimeter was not issued to a worker or the nuclear track type A (NTA) emulsion in a film badge dosimeter was not read unless a worker was exposed to neutrons. There appears to be no use of recorded notional doses, although there are issues of recording dose for low-dose exposures (see Table 6.3.1-2). There is also the problem of missing dose components from the total WB dose for a worker designated simply as “not available” or “damaged film” in the worker’s records (West 1993). These missing dose components for workers

Effective Date: 11/19/2003 Revision No. 00 Document No. ORAUT-TKBS-0014-6 Page 13 of 47
could be estimated using a method described by Watson et al. (1994) and based on examination of continuity in the worker’s job and work activities.
6.3.2 Y-12 Dosimetry Technology
The Y-12 dosimetry methods evolved during the years as improved technology was developed and the complex radiation fields encountered in the workplace were better understood. The adequacy of the respective dosimetry methods to accurately measure radiation dose as discussed in later sections depends on radiation type, energy, exposure geometry, etc. The dosimeter exchange frequency of the dosimeters was gradually lengthened and corresponded generally to downward reductions in the RPGs (Morgan 1961; Taylor 1971). During the early stages of the Y-12 program to monitor individual workers, a weekly dose control of 0.3 rem was in effect. This was changed to an annual limit of 5 rem in the latter part of the 1950s. A summary of the major historical events in the Y-12 dosimetry program for external radiation is provided in Table 6.3.2-1.
6.3.2.1 Beta/Photon Dosimeters
In 1948, Y-12 started an external dosimetry badge service with the assistance of ORNL (Murray 1948a, b). The ORNL had earlier implemented the beta/photon film dosimeter design that was developed originally at the Metallurgical Laboratory of the University of Chicago (Pardue, Goldstein, and Wollan 1944). Several minor modifications had been made to this original design as discussed by Patterson, West, and McLendon (1957) and by Thornton, Davis, and Gupton (1961). The film badge was a so-called two element badge because a portion of the film was covered with a comparatively “open window” and a portion of the film was covered by a cadmium shield or filter. In 1961, the two-element film badge was replaced by a multi-element film badge with an “open window” over a portion of the film and three filters of plastic, aluminum, and cadmium over other portions of the film (Thornton, Davis, and Gupton 1961; McLendon 1963; McRee, West, and McLendon 1965). Cadmium filters have been consistently incorporated in all film badge designs used at Y-12 since 1948 and have an approximate thickness of 1 mm or mass density of 1000 mg cm-2. The external doses to Y-12 workers from photons were always determined from film readings behind the cadmium filter (Sherrill and Tucker 1973). In addition, the Y-12 film badges have always included a comparatively “open window” to measure significant beta radiation and to distinguish film exposures due to beta and photon radiation. The film areas behind the plastic and aluminum filters of the multi-element film dosimeters were read at Y-12, but they were not used in the normal evaluation of worker doses (Sherrill and Tucker 1973).
The film badges used at Y-12 from 1948 to 1963 contained DuPont type 552 film packets (Souleyrette 2003). These packets consisted of two film emulsions: (1) a sensitive 502 emulsion with an effective range from approximately 30 mrem to 10 rem, and (2) an insensitive 510 emulsion with an effective range from approximately 500 mrem to 20 rem (Craft, Ledbetter, Hart 1952; Thornton, Davis and Gupton 1961; Parrish 1979). In 1963, Y-12 switched to the use of DuPont 554 film packets (McLendon 1963; Souleyrette 2003). These packets consisted of the following two film emulsions: (1) a sensitive 555 emulsion with an effective range from approximately 30 mrem to 5 rem (McLendon 1963), and (2) an insensitive 834 emulsion with an effective range from approximately 5 rem to 150 rem (Thornton, Davis, and Gupton 1961; Davis and Gupton 1963; Parrish 1979). In 1971, DuPont stopped manufacturing the 554 film packets and Y-12 switched to Eastman type 2 film (Jones 1971; Souleyrette 2003). Eastman type 2 packet contained one film with two emulsions bonded to opposite side of the base film. The sensitive emulsion had a minimum detectable limit of approximately 30 mrem (Jones 1971). During the switch to the Eastman type 2 film, some film to be evaluated was removed from cold storage, inserted in 16 pairs of badges, and the badges placed in racks with the office area to investigate on-site radiation background. A sample of film was developed on the day of

Effective Date: 11/19/2003 Revision No. 00 Document No. ORAUT-TKBS-0014-6 Page 14 of 47
Table 6.3.2-1. Y-12 historical dosimetry events. Date Event Reference
1948 An external dosimetry program was started to monitor personnel in radiological areas using pocket ionization chambers (PICs) and two-element film badges. Film pads were also used as an extremity monitor for beta-particle exposure to the hands of uranium “metal” workers.
Murray 1948a,b; Struxness 1949a
1949 NTA film used to monitor personnel exposed to neutron sources. Struxness 1949b 1951 Converted from film pads to film rings as an extremity monitor for beta-
particle exposure to the hands of uranium “metal” workers. Struxness 1951
1955 Strips of indium foil with a mass of approximately 1 g each were included in the security badges of all employees at Y-12. The foils provided a quick means of identifying employees who may have been exposed to elevated radiation levels during a nuclear criticality accident.
McLendon 1959
June 16, 1958
A nuclear criticality accident occurred during recovery of enriched uranium in Building 9212 of the Y-12 Plant. The indium foils in the security badges of 31 employees indicated that they were exposed to elevated levels of thermal neutron radiation during the accident.
Callihan and Thomas 1959; McLendon 1959; Hurst, Ritchie and Emerson 1959
July 1, 1961
All UCC-ND employees were issued a badge meter which served as both a security pass and a routine and accident dosimeter. The badge meter contained a four-element film dosimeter for routine monitoring of beta particle, photon, and neutron exposures. The badge meter also contained indium, other neutron activation foils, and special photon dosimeters for nuclear accident dosimetry.
Thornton, Davis and Gupton 1961; McLendon 1963; McRee, West and McLendon 1965
October1, 1980
All UCC-ND employees were issued a badge meter consisting of (1) a security badge for identification and (2) a two-element TLD badge for personnel radiation monitoring of beta particles and photons. A 1-g foil of indium was included in the security badge to provide a quick means of identifying personnel exposed to elevated levels of radiation during a nuclear accident. An additional ORNL neutron badge containing NTA film and TLND dosimeters was issued to Y-12 personnel who were exposed to neutrons.
McLendon 1980a; Howell and Batte 1982; Gupton 1978; Berger and Lane 1985
1980 The accident dosimetry components from the old “1961" UCC ND badge meter were consolidated and incorporated into Y-12 security badge covers. All persons were required to use these security badge covers when entering controlled areas that had an installed criticality alarm.
McLendon 1980b; Y-12 Plant 1982a
January3, 1989
All MMES employees were issued a badge meter consisting of (1) a security badge for identification and (2) a four-element TLD badge for personnel radiation monitoring of beta particles and photons. A 1-g foil of indium was included in the security badge for accident dosimetry purposes, and an additional four-element TLND badge was issued to Y-12 personnel potentially exposed to neutrons.
Y-12 Plant 1988b; BWXT Y-12 2001
1991 The beta-gamma dosimeter (TLD) issued to all MMES employees became the official personnel nuclear accident dosimetry (PNAD) in the event of a criticality accident. All persons were required to use a beta-gamma dosimeter attached to their security badge before entering controlled areas with an installed criticality alarm.
Y-12 Plant 1991; Kerr and Mei 1993
the background study and used as a base point for other measurements. Every two weeks, film from a pair of badges was unloaded, developed, and read with a densitometer. On the first day of the study, the fresh film had an optical density of 0.205, and after 215 days, the optical density had reached a level of 0.405. This increase in the optical density of 0.2 represented an increase of only about 15 mrem or approximately 0.5 mrem per week. It was noted that these optical density readings did not have the optical density readings of an unexposed blank subtracted from them and, therefore, represent the actual optical density readings of the films (Jones 1971).

Effective Date: 11/19/2003 Revision No. 00 Document No. ORAUT-TKBS-0014-6 Page 15 of 47
The response of the film badge to photon radiation of different energies is illustrated in Figure 6.3.2.1-1. This figure also shows the Hp(10) response. Two responses are shown for the film badges: one response for a sensitive DuPont 502 emulsion in a two-element film badge (Pardue, Goldstein, and Wollan 1944), and one response for a sensitive DuPont 555 emulsion in the a multi-element film badge (Thornton, Davis, and Gupton 1961). The response of the sensitive Eastman type 2 film in a multi-element film badge should be quite similar to that of the sensitive DuPont 555 emulsion. The film badges show an under-response at the lower photon energies and an over-response at photon energies around 100 keV. This over-response is due primarily to the silver (Ag) and bromine (Br) in the film emulsions. The response of the newer TLD badges provided a much better match to the Hp(10) response in the soft tissues of the body due to the lower atomic numbers of the lithium (Li) and fluorine (F) in the TLD chips (Horowitz 1984; Cameron, Sunthanalingham, and Kennedy 1968). The two-element TLD badges used at Y-12 from 1980 to 1989 had LiF chips covered by an “open window” and an aluminum filter for beta-photon discrimination (McLendon 1980a) and the multi-element TLD badges adopted for use at Y-12 in 1989 had four LiF chips covered by an “open window”, a plastic filter, a copper filter, and a hemispherical Teflon button (Y-12 Plant 1988b; BWXT Y-12 2001). The photon doses were determined primarily from the readings of the LiF chips covered by the aluminum filter in the two-element TLD badge and the hemispherical Teflon button in the multi-element TLD Badge. A value for “average background radiation” of 0.75 mrem per week from photons was determined for the Oak Ridge area by storing a total of 1,680 TLD dosimeters in 70 houses for up to one year (Sonder and Ahmed 1991). The distribution of results indicated a rather large variation in background among houses, with a few locations exhibiting background double the average. It was suggested that the results from the high background houses be ignored in determining values of the MDL to be used in routine personnel dosimetry monitoring.
10|-2 10|-1 10|0
Photon Energy (MeV)
0.1
1
10
Rel
ativ
e R
espo
nse
Hp(10)
Two-Element Film Badge
Multi-Element Film Badge
Figure 6.3.2.1-1. Comparison of Hp(10) from a broad beam of normally incident photons (ICRP 1996) with the energy responses for a sensitive DuPont 502 emulsion in a MED two-element film badge (Pardue, Goldstein, and Wollan 1944) and a sensitive DuPont 555 emulsion in an ORNL multi-element film badge (Thornton, Davis, and Gupton 1961).
The IARC has conducted a recent dosimeter intercomparison study of ten commonly-used historical dosimetry systems from around the world (Thierry-Chef et al. 2002). Three of the dosimeter designs

Effective Date: 11/19/2003 Revision No. 00 Document No. ORAUT-TKBS-0014-6 Page 16 of 47
were from the United States. These included a two-element film dosimeter previously used at Hanford (identified as US-2), a multi-element film dosimeter previously used at Hanford (identified as US-8), and the Panasonic TLD dosimeter currently used at the Savannah River Site (identified as US-22). The IARC study considered that exposure to workers could be characterized as a combination of anterior-posterior (A-P), rotational, and isotropic irradiation geometries. Dosimeter responses for these various irradiation geometries were investigated using two different phantoms to represent the torso of the body. The first phantom was a water-filled slab phantom with polymethyl methacrylate walls, an overall width of 30 cm, an overall height of 30 cm, and an overall depth of 15 cm. This phantom is widely used for dosimeter calibration and performance testing by the International Standards Organization (ISO). The second phantom was an anthropomorphic Alderson Rando Phantom. This realistic man-type phantom is constructed using a natural human skeleton cast inside material that has a tissue equivalent composition. The results of this IARC study, for the U.S. dosimeters only, are presented in Table 6.3.2.1-1. As noted previously, the multi-element film badge was used at Y-12 in essentially the same manner as the two-element film badge. It should also be noted that the two-element film dosimeter can significantly overestimate Hp(10) at the lower photon energies of 118 keV and 208 keV.
Table 6.3.2.1-1. IARC study results for US beta/photon dosimeters. 118 keV 208 keV 662 keV
Geometry Phantom Meana SD/Mean Meana SD/Mean Meana SD/Mean US-2 (Two-element film dosimeter)
A-P Slab 3.0 2.1 1.3 1.0 1.0 0.8 A-P Anthropomorphic 3.0 4.2 1.2 1.9 1.0 1.8 Rotational Anthropomorphic 2.2 2.0 1.4 3.0 1.2 3.2 Isotropic Anthropomorphic 1.5 4.4 1.1 1.6 1.0 2.7
US-8 (Multi-element film dosimeter) A-P Slab 1.0 1.5 1.0 0.8 0.8 1.7 A-P Anthropomorphic 0.8 9.5 0.9 6.0 0.8 1.8 Rotational Anthropomorphic 1.2 1.9 1.2 17 1.1 1.8 Isotropic Anthropomorphic 1.0 3.0 1.2 9.0 1.0 2.3
US-22 (Multi-chip TLD dosimeter) A-P Slab 0.9 4.4 0.9 3.9 0.9 3.5 A-P Anthropomorphic 0.8 3.1 0.9 2.1 0.9 3.9 Rotational Anthropomorphic 1.1 3.1 1.2 1.5 1.0 4.1 Isotropic Anthropomorphic 0.9 0.3 1.0 2.5 0.9 1.6
a. Ratio of recorded dose to Hp(10).
6.3.2.2 Neutron Dosimeters
The two general types of neutron dosimeters that have been used at Y-12 differ significantly in their response to neutrons of different energies as illustrated in Figure 6.3.2.2-1 (IAEA 1990). An NTA emulsion was included in the same holder used for the Y-12 beta/gamma dosimeter until 1980. Between 1980 and 1989, there is a serious gap in the neutron dosimetry information for Y-12. It is known that Y-12 had become increasingly dependent over the years on ORNL to process the NTA films because of the small numbers of neutron-exposed workers at Y-12. Thus, the neutron dosimetry at Y-12 is assumed to be the same as that at ORNL from 1980 to 1989. During this period, workers at both ORNL and Y-12 were provided with a two-element TLD dosimeter for beta-particle and photon dosimetry. Those ORNL and Y-12 workers who were exposed to neutrons were provided with a separate neutron dosimeter. This neutron dosimeter contained both an NTA film for measurement of the fast-neutron dose and a TLND for measurement of the neutron dose from lower energy neutrons (Gupton 1978; Berger and Lane 1985). From 1980 to 1985, the neutron doses to Y-12 workers were determined at ORNL using both the NTA and TLND dosimeters as discussed by Gupton (1978). From 1986 to 1989, they were determined at ORNL using only the TLNDs (Berger and Lane 1985).
Effective Date: 11/19/2003 Revision No. 00 Document No. ORAUT-TKBS-0014-6 Page 17 of 47
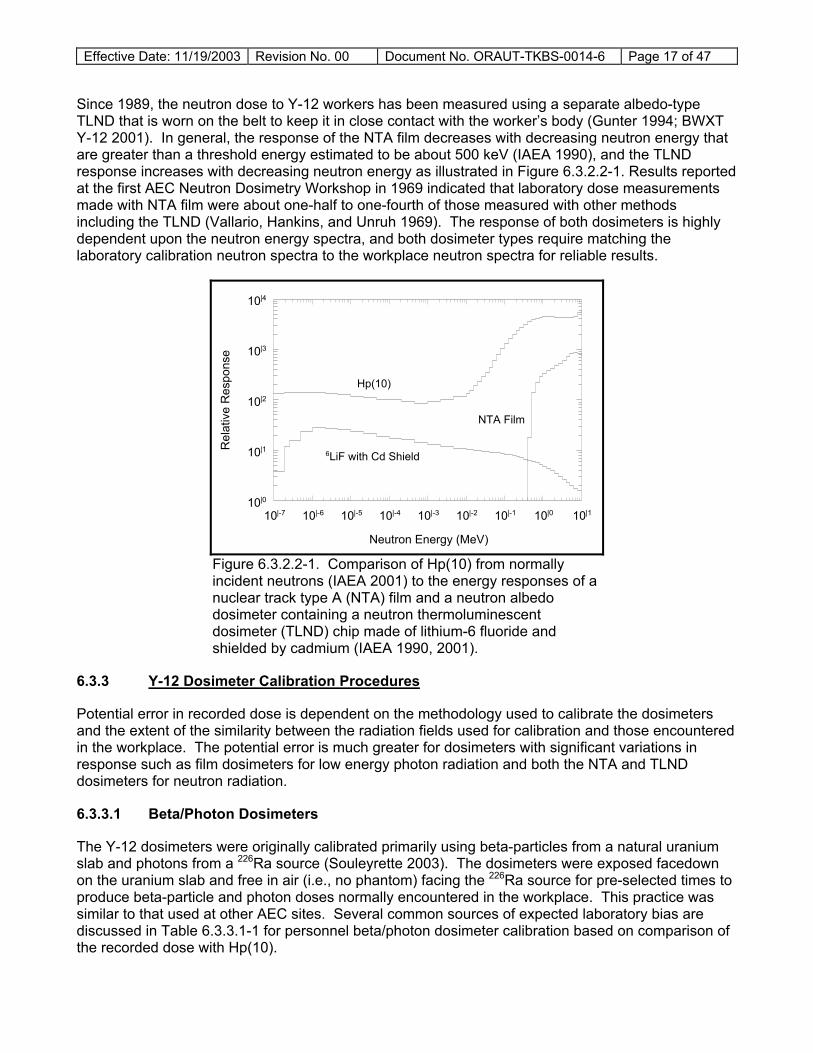
Since 1989, the neutron dose to Y-12 workers has been measured using a separate albedo-type TLND that is worn on the belt to keep it in close contact with the worker’s body (Gunter 1994; BWXT Y-12 2001). In general, the response of the NTA film decreases with decreasing neutron energy that are greater than a threshold energy estimated to be about 500 keV (IAEA 1990), and the TLND response increases with decreasing neutron energy as illustrated in Figure 6.3.2.2-1. Results reported at the first AEC Neutron Dosimetry Workshop in 1969 indicated that laboratory dose measurements made with NTA film were about one-half to one-fourth of those measured with other methods including the TLND (Vallario, Hankins, and Unruh 1969). The response of both dosimeters is highly dependent upon the neutron energy spectra, and both dosimeter types require matching the laboratory calibration neutron spectra to the workplace neutron spectra for reliable results.
10|-7 10|-6 10|-5 10|-4 10|-3 10|-2 10|-1 10|0 10|1
Neutron Energy (MeV)
10|0
10|1
10|2
10|3
10|4
Rel
ativ
e R
espo
nse
Hp(10)
NTA Film
6LiF with Cd Shield
Figure 6.3.2.2-1. Comparison of Hp(10) from normally incident neutrons (IAEA 2001) to the energy responses of a nuclear track type A (NTA) film and a neutron albedo dosimeter containing a neutron thermoluminescent dosimeter (TLND) chip made of lithium-6 fluoride and shielded by cadmium (IAEA 1990, 2001).
6.3.3 Y-12 Dosimeter Calibration Procedures
Potential error in recorded dose is dependent on the methodology used to calibrate the dosimeters and the extent of the similarity between the radiation fields used for calibration and those encountered in the workplace. The potential error is much greater for dosimeters with significant variations in response such as film dosimeters for low energy photon radiation and both the NTA and TLND dosimeters for neutron radiation.
6.3.3.1 Beta/Photon Dosimeters
The Y-12 dosimeters were originally calibrated primarily using beta-particles from a natural uranium slab and photons from a 226Ra source (Souleyrette 2003). The dosimeters were exposed facedown on the uranium slab and free in air (i.e., no phantom) facing the 226Ra source for pre-selected times to produce beta-particle and photon doses normally encountered in the workplace. This practice was similar to that used at other AEC sites. Several common sources of expected laboratory bias are discussed in Table 6.3.3.1-1 for personnel beta/photon dosimeter calibration based on comparison of the recorded dose with Hp(10).

Effective Date: 11/19/2003 Revision No. 00 Document No. ORAUT-TKBS-0014-6 Page 18 of 47
Table 6.3.3.1-1. Common sources of laboratory bias in the calibration parameters for beta/photon dosimeters.a
Parameter Historical description Anticipated laboratory biasb Free-in-air
calibration
In the 1980s, Y-12 began exposing calibration dosimeters on a phantom to simulate a worker’s body. The previous calibrations do not include response from backscattered radiation.
Recorded dose of record is too high; however, the effect of backscattered radiation from worker’s body is highly dependent on the dosimeter design.
Radiation
quantity
Photon dose quantities that were used to calibrate Y-12 beta/photon dosimeters have varied historically. The exposure from photons was used for many years.
Because of the higher energy, 226Ra and 60Co gamma radiation used to calibrate dosimeters at Y-12, this caused only a slight (about 3%) under-response in the recorded dose.
Depth of tissue
dose
Historically, Y-12 used a selected depth of 1 cm (i.e., the depth of the testes) to estimate the deep dose.
No significant effect because the Y-12 dosimeter designs had filtration density thicknesses of about 1,000 mg cm-2 that would relate to the 1-cm depth in tissue.
Angular
response
Y-12 dosimeters are calibrated using anterior-posterior (A-P) laboratory irradiation.
Recorded dose of record is likely too low because the dosimeter response is lower at non A-P angles. The effect is highly dependent on radiation type and energy.
Environmental
stability
Y-12 film and TLD dosimeters are subject of signal fade with time, heat, humidity, light, etc.
Recorded dose of record is likely too low; however, this depends strongly upon when the calibration dosimeters are irradiated during the dosimeter exchange cycle. Mid-cycle calibration minimizes the effects.
a. Judgment based on Y-12 dosimeter response characteristics. b. Recorded dose compared to Hp(10).
6.3.3.2 Neutron Dosimeters
A good account of the historical aspects of the calibration of the Y-12 neutron dosimeters is not available. It is known, however, that the NTA films were originally calibrated using a Po-Be neutron source (Struxness 1949b, 1952a) and later an Am-Be neutron source (McLendon 1963; McRee, West, and McLendon 1965). The dosimeters containing the NTA films were exposed free in air (i.e., no phantom) to neutrons from the Po-Be and Am-Be sources for pre-selected times to produce neutron doses normally encountered in the workplace. Some information on the calibration of Y-12 neutron dosimeters containing TLNDs can be found in Berger and Lane (1985) and BXWT Y-12 (2001). Several common sources of expected laboratory bias are discussed in Table 6.3.3.2-1 for personnel neutron dosimeters based on comparison of the recorded dose with Hp(10).

Effective Date: 11/19/2003 Revision No. 00 Document No. ORAUT-TKBS-0014-6 Page 19 of 47
Table 6.3.3.2-1. Common sources of laboratory bias in the calibration parameters for neutron dosimeters.a
Parameter Historical description Anticipated laboratory biasb Source energy
spectrum In 1980, Y-12 began using dosimeters that were calibrated on a phantom to simulate a worker’s body and neutron spectra that were degraded to better represent the workplace. The previous calibrations did not include response from backscattered radiation and the neutron spectra were not degraded.
The delivered dose was uncertain as noted in Section 6.3.2.2 of this report.
Radiation quantity
Neutron dose quantities that were used to calibrate Y-12 neutron dosimeters have varied historically. The first collision dose for fast neutrons and a quality factor of 10 was used for many years.
The effects of the respective neutron dose quantities used to calibrate Y-12 dosimeters is uncertain and could be evaluated in comparison to the Hp(10) dose used in DOELAP performance testing.
Angular response
Y-12 dosimeters are calibrated using anterior-posterior (A-P) laboratory irradiation.
Recorded dose of record is likely too low because the dosimeter response is lower at non A-P angles. The effect is highly dependent on neutron energy.
Environmental stability
Y-12 NTA film and TLND dosimeters are subject of signal fade with time, heat, humidity, light, etc.
Recorded dose of record is likely too low; however, this depends strongly upon when the calibration dosimeters are irradiated during the dosimeter exchange cycle. Mid-cycle calibration minimizes the effects.
a. Judgment based on Y-12 dosimeter response characteristics. b. Recorded dose compared to Hp(10).
6.3.4 Y-12 Workplace Radiation Fields
The main workplace radiation fields at Y-12 are due to processes involving either EU (235U) or depleted uranium (DU) (238U). Some other workplace radiation fields involve industrial radiation generating equipment (x-rays and electron accelerators) and isotopic gamma-ray and neutron sources for testing purposes (60Co and 252Cf). The current Y-12 External Dosimetry Technical Basis document provides a discussion of the radiation fields due to different processes and primary nuclides in the Y-12 workplace (BWXT Y-12 2001).
6.3.4.1 Workplace Beta/Photon Dosimeter Response
Radiation (beta/photon) fields characteristic of the Y-12 facilities can be generally defined based on historical information as presented in Table 6.3.4.1-1. Because Y-12 is a nuclear weapons fabrication and disassembly facility, the most common materials are EU (235U) and DU (238U). Both 235U and 238U are primarily alpha-particle emitters. However, 235U does emit a 185-keV photon in 54% of its decays. Most of the external dose from 238U comes from its short-lived 234Th, 234mPa, and 234Pa decay products. From an external dose standpoint, the most significant radiations emitted by these decay products of 238U are: (1) the 2.29-MeV beta particle from 234mPa, and (2) the photons emitted by 234Pa with energies as large as 1.962 MeV. The various Y-12 dosimeters have filtration of about 1,000 mg cm-2 (i.e., nearly equivalent to 1-cm depth in tissue) for those regions of the dosimeter used to measure the whole-body dose. The response to beta radiation in Y-12 workplaces is limited because beta radiation usually cannot penetrate this much filtration.

Effective Date: 11/19/2003 Revision No. 00 Document No. ORAUT-TKBS-0014-6 Page 20 of 47
Table 6.3.4.1-1. Selection of beta and photon radiation energies and percentages for Y-12 site processes.
Operations Y-12 site processes Building Begin End
Radiation type
Energy selection Percent
9203 1947 1951 9206a 1947 1959 9211 1947 1959
Enriched uranium product recovery
and salvage operations 9201-1 1952 1963
Beta Photon
> 15 keV 30-250 keV
100% 100%
9202 1947 1995 9206a 1947 1995
Uranium chemical operations and weapon production operations
9212b 1949 Ongoing
Beta Photon
> 15 keV 30-250 keV
100% 100%
Special nuclear material receiving and storage
9720-5 1949 Ongoing Photon 30-250 keV 100%
9201-5 1949 Ongoing 9204-4 1949 Ongoing
Uranium forming and machining for weapon component operations
9215 1950 Ongoing
Beta Photon
> 15 keV 30-250 keV
100% 100%
9201-5 1949 Ongoing 9204-4 1949 Ongoing 9766 1949 ?
Depleted uranium process
operations 9998 1949 Ongoing
Beta Photon
> 15 keV 30-250 keV > 250 keV
100% 50% 50%
9204-2 1952 Ongoing Final weapon component assembly operations 9204-2E 1952 Ongoing
Beta Photon
> 15 keV 30-250 keV
100% 100%
ORNL 86-inch cyclotron 9201-2 1950 ? Photon 30-250 keV >250 keV
50% 50%
Chemical assay and mass spectrometry laboratories
9203 1947 Ongoing Photon
Radiographic laboratory 9201-1 1947 Ongoing Photon Calibration laboratory 9983 1949 Ongoing Photon Weapon component assay
laboratory 9995 1952 Ongoing Photon
Nondestructive assay laboratory 9720-5 1980 Ongoing Photon
Specific to radiation source. Photon default values: 30-250 keV >250 keV
50% 50%
West End waste treatment facility
9616-7 1984 Ongoing Beta Photon
> 15 keV 30-250 keV >250 keV
100% 50% 50%
a. Building 9206 Complex includes Buildings 9768, 9720-17, 9409-17, 9510-2, 9767-2, and the east and west tank farm pits. b. Building 9212 Complex includes Buildings 9809, 9812, 9818, 9815, and 9980.
The largest workplace exposures at Y-12 have historically occurred in the DU process areas (Struxness 1952b; Henderson 1991). During casting operations, the decay products of 238U float to the top surface of the molten metal and remain as surface residues. These surface residues result in an increased exposure potential because of the high beta and photon energies associated with the 234Pa nuclide. The 234Pa nuclide emits a number of high-energy photons and has a specific activity that is approximately 2 x 10¹⁵ times larger than the specific activity of its 238U parent (Henderson 1991). For 234Pa, the percentages of photons with energies of 30 – 250 keV and 250 keV or more are about 7 and 93%, respectively, and for 238U in equilibrium with its short-lived 234Th, 234mPa, and 234Pa, the percentages of photons with energies of 30 – 250 keV and 250 keV or more are about 82 and 18%, respectively. Thus, an artificially high percentage of photons with energies greater than 250 keV was assumed in Table 6.3.4.1-1 for the normal and depleted uranium process areas. This produces doses that are claimant favorable because of the increased exposure potential to high energy photons from the short-lived 234Pa decay product of 238U.
Typical beta/photon personnel dosimeter parameters important to Hp(10) performance in the workplace are summarized in Table 6.3.4.1-2.

Effective Date: 11/19/2003 Revision No. 00 Document No. ORAUT-TKBS-0014-6 Page 21 of 47
Table 6.3.4.1-2. Typical workplace beta/gamma dosimeter Hp(10) performance.a Parameter Description Potential workplace biasb
Exposure
geometry
Y-12 dosimeter system calibrated using A-P laboratory irradiations.
Recorded dose of record likely too low since dosimeter response is lower at angles other than A-P. Effect is highly dependent upon radiation type and energy.
Energy response
Y-12 film “deep dose” response is too low for photon radiation less than 100 keV and too high for photon radiation greater than 100 keV.
Bias is recorded dose depends upon the photon energy in the workplace.
Highly divergent fields
Dosimeter worn at collar may under-estimate the deep dose at the waist.
Recorded dose of record may be too low for workers performing waist-level uranium handling jobs.
Mixed fields
Y-12 dosimeters respond to both beta and photon radiation.
Filtration of about 1,000 mg cm-2 over dosimeter region used to measure deep dose will minimize dosimeter response to beta radiation.
Missed dose
Doses less than Minimum Detection Level (MDL) recorded as zero dose.
Recorded dose of record likely too low. The impact of missed dose is greatest in the earlier years because of frequency dosimeters exchange and film dosimeter with higher MDLs.
Environmental effects
Workplace environment (heat, humidity, etc.) fades the dosimeter signal.
Recorded dose of record is likely too low.
a. Judgment based on Y-12 dosimeter response characteristics and workplace radiation fields. b. Recorded dose compared to Hp(10).
One serious problem with the workplace response of the Y-12 beta/gamma dosimeters involves workers who perform waist-level uranium handling jobs in the DU process areas (Henderson 1991). A personnel dosimeter worn at the collar may underestimate the Hp(10) dose at the waist by rather significant factors. It is now a practice to instruct these workers to wear the dosimeters at the waist, but many workers may have worn their dosimeters on the collar in the past. Hence, for all workers performing waist-level uranium handling jobs, it is recommended that the recorded dose before 1991 should be multiplied by 1.34 for reasons discussed in more detail by Henderson (1991). To determine when to make such adjustments, the dose reconstructor must depend on information about routine duties and work locations that are contained in the Computer Assisted Telephone Interview (CATI) file for a claimant.
6.3.4.2 Workplace Neutron Dosimeter Response
Three main facilities at Y-12 with a potential for neutron exposure are: (1) the Calibration Laboratory in Building 9983, (2) the EU Storage Area in Building 9212, and (3) the Nondestructive Assay Laboratory in Building 9720-5. The following sections discuss the neutron exposure spectra and neutron-to-photon dose ratios in these three areas using data from recent measurements made the by Pacific Northwest Laboratory (PNL 1990; McMahan 1991; BWXT Y-12 2001).
6.3.4.2.1 Calibration Laboratory in Building 9983
The Calibration Laboratory has a highly shielded room used for storage of both photon and neutron sources. The walls of the room are all 3-inch steel, with a high-density concrete floor into which several source storage pits are sunk. The types of neutron sources stored in this room include twelve 2 to 4 Ci americium boron (Am-B) sources, several americium lithium (Am-Li) sources, and several americium beryllium (Am-Be) sources. At the time of the PNL measurements, the neutron sources

Effective Date: 11/19/2003 Revision No. 00 Document No. ORAUT-TKBS-0014-6 Page 22 of 47
were stored in the room in shielded containers. The neutron shielding of the containers was either paraffin or high-density plastic, depending on the container. Several sources were stored in containers inside a steel safe, others were in their containers on the floor of the room, and still others were in the storage pits below floor level. The neutron sources have not been used for routine calibration purposes since the early 1970s, when ORNL began calibrating all Y-12 neutron detection and survey instruments. Workers at Y-12 do access the source storage area for other purposes and the PNL measurements were made outside the door to the source storage room to determine appropriate calibration factors for a worker’s TLND.
6.3.4.2.1.1 Neutron Energy Spectrum
The PNL measurements of the neutron energy spectrum at a distance of 18 inches from the door to the source storage room are shown by the solid line in Figure 6.3.4.2-1. It should be noted that the PNL measurement data were provided as dose equivalent rates (PNL 1990); however, a one-hour exposure was assumed here in order to show the results of the PNL measurements as dose equivalent. The fluence-to-dose equivalent conversion factors and neutron quality factors used in the PNL measurements are similar to those from National Council on Radiation Protection and measurements (NCRP) Report 38 (1971) and International Commission on Radiological Protection (ICRP) Publication 21 (1973). A comparison of fluence-to-dose equivalent conversion factors from NCRP Report 38, ICRP Publication 21, and several other commonly used information sources on
10|-7 10|-6 10|-5 10|-4 10|-3 10|-2 10|-1 10|0 10|1 10|2
Neutron Energy (MeV)
10|-4
10|-3
10|-2
10|-1
10|0
10|1
Dos
e E
quiv
lane
t (m
rem
)
0.255 mrem 0.0304 mrem
2.38 mrem 2.01 mrem
Figure 6.3.4.2-1. Results of PNL neutron spectrum measurements in Calibration Laboratory of Building 9983 are shown by the solid line in the graph and the dashed line shows the PNL measurement results divided into the four neutron energy groups used in the dose reconstruction for the Y-12 workers.
fluence-to-dose equivalent conversion factors and neutron quality factors can be found in a report by Sims and Killough (1983). The dashed line in Figure 6.3.4.2-1 shows the dose equivalent from the

Effective Date: 11/19/2003 Revision No. 00 Document No. ORAUT-TKBS-0014-6 Page 23 of 47
PNL measurements divided into the four energy groups discussed in NIOSH 2002, and the dose fractions in each of these four energy groups are provided in Table 6.3.4.2-1. Although PNL measured some dose from lower (< 10 keV) and intermediate energy (10-100 keV) neutrons, the contribution to the total dose was only about 6%. The Radiation Effectiveness Factor (REF) used in the Interactive Radio-Epidemiological Program (IREP) to calculate the Probability of Causation (PC) for these two neutron energy groups is less than the fast neutron energy group (or so-called fission neutron energy group) from 0.1-2 MeV (Kocher, Apostoaei, and Hoffman 2002). As a result, combining the lower and intermediate energy groups into the fast neutron group from 0.1-2 MeV is a reasonable and claimant-favorable simplification of the neutron dose calculation.
Table 6.3.4.2-1. Dose fractions for Y-12 calibration laboratory. Neutron energy group Near source storage safe
< 10 keV 0.055 10-100 keV 0.007 0.1-2 MeV 0.509 2-14 MeV 0.429
Claimant-favorable dose fractions 0.1-2 MeV 0.57 2-14 MeV 0.43
6.3.4.2.1.2 Neutron-to-Photon Dose Ratio
The neutron-to-photon dose ratio from the recent PNL measurements was approximately 8:1. For workers in the Calibration Laboratory, no other data on neutron-to-photon dose ratios have been found to use to estimate the missing neutron dose from measurements made with film dosimeters. However, the recent PNL studies indicate that more that 90% of the neutron dose is above the 500-keV threshold of the NTA films. Also, neutron dose measurements for Calibration Laboratory workers with NTA film dosimeters are expected to be reasonably accurate to within parameters discussed in NIOSH 2002.
6.3.4.2.2 Enriched Uranium Storage Area in Building 9212
Building 9212 contains a secure storage area for containers of enriched uranium fluoride (UF4) and uranium trioxide (UO3). Neutrons are produced by alpha particle reactions with the nucleus of the fluorine and oxygen atoms of the UF4 and UO3, respectively. Containers of these materials are placed on a rack of shelves and arranged in a matrix that is critically safe. The containers are spaced approximately 2 to 2.5 feet apart on a shelf, and can be placed one deep per shelf. There are four shelves per rack and 24 inches between shelves. The PNL measurements were made 39 inches above the floor and 24 inches from the shelf at a location near the center of a rack that was filled with 20 containers of UF4.
6.3.4.2.2.1 Neutron Energy Spectrum
The PNL measurements of the neutron energy spectrum near the center of the UF4 storage rack are shown by the solid line in Figure 6.3.4.2-2, and the dose fractions for the neutron energy groups shown by the dashed line in this figure are provided in Table 6.3.4.2-2. The dose fraction for the lower (<10 keV) and intermediate (10-100 keV) energy neutron groups were less than 2% of the total dose from these PNL measurements. As before, combining the lower and intermediate energy groups into the fast neutron group from 0.1-2 MeV is a reasonable and claimant favorable simplification of the neutron dose calculation.

Effective Date: 11/19/2003 Revision No. 00 Document No. ORAUT-TKBS-0014-6 Page 24 of 47
10|-7 10|-6 10|-5 10|-4 10|-3 10|-2 10|-1 10|0 10|1 10|2
Neutron Energy (MeV)
10|-4
10|-3
10|-2
10|-1
10|0
10|1
Dos
e E
quiv
lane
t (m
rem
)
0.0193 mrem
1.29 mrem
0.00381 mrem
0.340 mrem
Figure 6.3.4.2-2. Results of PNL neutron spectrum measurements in the Enriched Uranium Storage Area of Building 9212 are shown as the solid line in the graph. The dashed line shows the PNL measurement results divided into the four neutron energy groups used in the dose reconstruction for the Y-12 workers.
Table 6.3.4.2-2. Neutron dose fractions for Y-12 Enriched Uranium Storage Area.
Neutron energy group Near storage rack < 10 keV 0.012 10-100 keV 0.002 0.1-2 MeV 0.781 2-14 MeV 0.205
Claimant-favorable dose fractions 0.1-2 MeV 0.79 2-14 MeV 0.21
6.3.4.2.2.2 Neutron-to-Photon Dose Ratio
The neutron-to-photon dose ratio from the recent PNL measurements was approximately 1:1. For workers in the Enriched Uranium Storage Facility, no other data on neutron-to-photon dose ratios in Building 9212 have been found to use to estimate the missing dose from earlier measurements made with film dosimeters. However, the recent PNL studies indicate more than 95% of the neutron dose is above the 500-keV threshold of the NTA films. Also, the neutron dose measurements for workers in the Enriched Uranium Storage Area of Building 9212 with NTA film dosimeters are expected to be reasonably accurate to within parameters discussed in NIOSH 2002.

Effective Date: 11/19/2003 Revision No. 00 Document No. ORAUT-TKBS-0014-6 Page 25 of 47
6.3.4.2.3 Nondestructive Assay Laboratory in Building 9720-5
The Nondestructive Assay Laboratory in Building 9720-5 is used for recovery of highly enriched uranium (HEU) from manufacturing wastes (Hogue and Smith 1984). The laboratory contains instruments for gamma scanning and neutron interrogation of containers of solid wastes, gamma analysis of solution samples, and measurements of solution density. Because measurements of the neutron spectrum were made previously for a 252Cf fission-neutron source at ORNL’s Radiation Calibration Laboratory (RADCAL), it was not necessary to make additional neutron measurements to characterize the workplace radiation fields near the 252Cf neutron source at the Nondestructive Assay Laboratory at Y-12. The neutron measurements at the RADCAL facility were made at a distance of 39 inches from the bare 252Cf source and a height of approximately 39 inches above the floor.
6.3.4.2.3.1 Neutron Energy Spectrum
The results of the PNL neutron spectrum measurements made at 39 inches from the 252Cf fission-neutron source at ORNL’s RADCAL facility are shown by the solid lines in Figure 6.3.4.2-3. The dose fractions for the neutron energy groups shown by the dashed lines in this figure are provided in Table 6.3.4.2-3. The dose fractions for the lower (<10 keV) and intermediate (10-100 keV) energy neutron groups were less than 1% of the total dose from these PNL measurements. Thus, combining the lower and intermediate energy groups into the fast neutron group of 0.1 to 2 MeV is a reasonable and claimant favorable simplification of the neutron dose calculation.
10|-7 10|-6 10|-5 10|-4 10|-3 10|-2 10|-1 10|0 10|1 10|2
Neutron Energy (MeV)
10|-7
10|-6
10|-5
10|-4
10|-3
10|-2
10|-1
Dos
e E
quiv
lane
t (m
rem
)
9.75e-5 mrem 1.21e-4 mrem
7.59e-3 mrem
2.61e-2 mrem
Figure 6.3.4.2-3. Results of PNL neutron spectrum measurements made at 1 meter from a bare 252Cf fission neutron source are shown by the solid line in the graph and the dash line shows the PNL measurement results divided into the four neutron energy groups used in the dose reconstruction for Y-12 workers at the Nondestructive Analysis Laboratory in Building 9720-5.

Effective Date: 11/19/2003 Revision No. 00 Document No. ORAUT-TKBS-0014-6 Page 26 of 47
Table 6.3.4.2-3. Dose fractions for Y-12 nondestructive analysis laboratory.
Neutron energy group Near unshielded Cf-252 source < 10 keV 0.003 10-100 keV 0.004 0.1-2 MeV 0.224 2-14 MeV 0.769
Claimant-favorable dose fractions 0.1-2 MeV 0.23 2-14 MeV 0.77
6.3.4.2.3.2 Neutron-to-Photon Dose Ratio
The neutron-to-photon dose ratio from the recent PNL measurements was approximately 25:1. For workers in the Nondestructive Assay Laboratory in Building 9212, no other data on neutron-to-dose ratios have been found to use to estimate missing dose from earlier measurements made with film dosimeters. However, the recent PNL studies indicate that more than 97% of the neutron dose is above the 500-keV threshold of the NTA films. Also, the neutron dose measurements for workers in the Nondestructive Assay Laboratory with NTA film dosimeters are expected to be reasonably accurate to within the parameters discussed in NIOSH (2002).
6.3.4.3 Typical Workplace Neutron Dosimeter Hp(10) Performance
Typical neutron personnel dosimeter parameters important to Hp(10) performance in the workplace are summarized in Table 6.3.4.3-1. The most important parameter related to Hp(10) performance of the neutron dosimeters is the difference between calibration and workplace neutron energy spectra. Measurements made by PNL in the late 1980s and early 1990s, could be used to correct the response of the Y-12 TLND dosimeters to workplace neutron energy spectra in several Y-12 areas. These measurements were discussed in the previous section of this report and the results of the corrected TLND workplace measurements over a 12-year period starting in 1990 are shown in Table 6.3.4.3-2. These data illustrate the low potential for routine exposure to neutrons at Y-12 both now and in the past.
Table 6.3.4.3-1. Typical workplace neutron dosimeter Hp(10) performance.a
Parameter Description Potential workplace biasb Workplace neutron
energy spectra NTA dosimeter response decreases and TLND response increases with decreasing neutron energy
Depends upon workplace neutron spectra. NTA recorded dose of record likely too low because of high 500-keV threshold for detection of neutrons.
Exposure geometry
NTA dosimeter response increases with increasing exposure angle and TLND response decreases with increasing exposure angle.
NTA recorded dose likely too high since dosimeter response is higher at angles other than A-P. TLD recorded dose is lower at angles other than A-P. Effect is highly dependent on neutron energy.
Missed dose
Doses less than Minimum Detection Limit (MDL) recorded as zero dose.
Recorded dose of record is likely too low. The impact of missed dose is greatest in earlier years because of the higher MDLs of the neutron dosimeters.
Environmental effects Workplace environment (heat, humidity, etc.) fades the dosimeter signal.
Recorded dose of record is likely too low.
a. Judgment based on Y-12 dosimeter response characteristics. b. Recorded dose compared to Hp(10).

Effective Date: 11/19/2003 Revision No. 00 Document No. ORAUT-TKBS-0014-6 Page 27 of 47
Table 6.3.4.3-2. Number of neutron monitored workers, cumulative neutron dose, and average neutron dose to Y-12 workers for 12-year period following introduction of the four-element TLND dosimeter in 1989.
Year
Neutron monitored workers
Cumulative neutron dose
(mrem)
Average neutron dose
(mrem) 1990 82 1085 13.2 1991 64 463 7.2 1992 86 200 2.3 1993 215 343 1.6 1994 301 1289 4.3 1995 165 116 0.7 1996 203 470 2.3 1997 38 10 0.3 1998 47 57 1.2 1999 141 121 0.9 2000 49 35 0.7 2001 73 55 1.3
The recent PNL measurements also indicate that the past NTA film dosimeters worked reasonably well in the Y-12 workplace because the Ra-Be and Po-Be neutron spectra used to calibrate them were reasonably well matched to the workplace neutron spectra. These measurements suggest that the NTA film dosimeters missed less than 10% of the neutron dose equivalent at the Calibration Laboratory of Building 9983 and less than 5% of the neutron dose equivalent at the Enriched Uranium Storage Area of Building 9212 and the Nondestructive Assay Laboratory of Building 9720-5. It must be noted that there are a lot of recorded zeros in the neutron dose data for Y-12 workers for two reasons: (1) a worker’s NTA film was not developed and read, or (2) a worker’s neutron dose equivalent was less than the MDL for the NTA film.
6.4 ADJUSTMENTS OF RECORDED DOSE
Adjustments to the Y-12 recorded doses are necessary to arrive at a claimant-favorable dose, considering the uncertainty associated primarily with the complex workplace radiation fields and exposure geometries.
6.4.1 Photon Dose Adjustments
The average and maximum deep photon dose to Y-12 workers for the 10-year period from 1978 to 1987 is shown in Figure 6.4.1-1 (Y-12 Plant 1978, 1980, 1981, 1982b, 1983, 1984, 1985, 1986, 1987, 1988a). The UCC-ND policy at that time was to limit the maximum deep photon dose to workers to 500 mrem or less per quarter and 2,000 mrem or less per year. The average deep dose from photons to all Y-12 workers was approximately 20 mrem from 1978 to 1987. This time period covers the change from film dosimeters to TLD dosimeters in 1980. It should be noted that no abrupt change occurred in the deep penetrating data for photon dose in 1980. Hence, the recorded doses for the photon deep dose from both film and TLD dosimeters appear to be in very close agreement and no adjustments are deemed necessary to the recorded deep photon doses for most Y-12 workers.

Effective Date: 11/19/2003 Revision No. 00 Document No. ORAUT-TKBS-0014-6 Page 28 of 47
1978 1979 1980 1981 1982 1983 1984 1985 1986 1987
Year
10|0
10|1
10|2
10|3
10|4
10|5
Ann
ual D
ose
Equ
ival
ent (
mre
m)
Maximum photon deep dose
Average photon deep dose
Figure 6.4.1-1. Maximum and average photon deep dose to Y-12 workers for the 10-year period from 1978 to 1987.
There is one group of Y-12 workers for which an adjustment in the recorded photon dose is recommended (see Section 6.3.4.1). These workers performed waist-level handing jobs in DU process areas (see Table 6.3.4.1-1). Examples of waist-level handling jobs are the unloading and sorting of DU scrap materials, shearing of larger pieces of scrap materials, cleaning of the scrap materials, crucible loading during the melting and casting operations, and materials sampling (Henderson 1991). It is now a practice to instruct workers performing these operations to wear their beta/photon dosimeters at the waist, but many of these workers may have worn their dosimeters at the collar in the past. The photon dose correction summarized in Table 6.4.1-1 is necessary to calculate an adjusted photon dose that is claimant favorable prior to 1991. For the years 1991 to the present, no correction is needed because the recorded photon dose is Hp(10) equivalent.
Table 6.4.1-1. Adjustments to reported Y-12 deep photon dose. Parameter Description
Period Prior to 1/1/1991 Dosimeters All beta/photon dosimeters Facilities Depleted uranium process operations Workers Waist-level metal handling operators Adjustment to recorded dose Multiply reported deep photon dose by a
factor of 1.34 to estimate Hp(10)
6.4.2 Neutron Dose Adjustments
The Y-12 facility incorporated the energy variation of the dose equivalent from neutrons into their calibration methodology. Thus, the recorded dose equivalent is a combination of all neutron energies. To calculate the probability of causation, the recorded neutron dose must be separated into neutron energy groups as discussed in Section 6.3.4.2 and then converted into ICRP Publication 60 (1990) methodology.

Effective Date: 11/19/2003 Revision No. 00 Document No. ORAUT-TKBS-0014-6 Page 29 of 47
6.4.2.1 Neutron Weighting Factors
An adjustment to the neutron dose is necessary to account for the change in neutron quality factors between historical and current scientific guidance as discussed by NIOSH (2002). At Y-12, the TLNDs were calibrated using PNL measurements based on fluence-to-dose conversion factors and quality factors similar to those from ICRP Publication 21 (1973) and NCRP Report 38 (NCRP 1971). These quality factors are point-wise data because they were calculated for a broad-parallel beam of monoenergetic neutrons incident on a 30-cm diameter cylinder of tissue representing the torso. The NCRP Report 38 quality factors are compared in Figure 6.4.2.1-1 with those used in the PNL measurements at Y-12. In order to convert from NCRP 38 quality factors to ICRP Publication 60 radiation weighting factors, a curve was fit that described the quality factors as a function of neutron energy. A group average quality factor was then calculated as shown in Figure 6.4.2.1-1 for each of the neutron energy groups used to define the radiation weighting factors in ICRP Publication 60 (1990). A summary of the group averaged NCRP Report 38 quality factors used in the dose reconstruction is provided in Table 6.4.2.1-1. This table also compares the group averaged NCRP 38 quality factors with historical dosimetry guidelines from the First Tripartite Conference at Chalk River in 1949 (Fix et al. 1994).
10|-8 10|-7 10|-6 10|-5 10|-4 10|-3 10|-2 10|-1 10|0 10|1
Neutron Energy (MeV)
0
5
10
15
Neu
tron
Qua
lity
Fact
or
PNL Measurements
NCRP 38: Point-wise data
NCRP38: Group averaged data
Figure 6.4.2.1-1. Comparison of the neutron quality factors used in the PNL neutron spectrum measurements and the neutron quality factors from NCRP Report 38 (NCRP 1971) shown both as point-wise data and grouped averaged data over the four neutron energy groups used in the dose reconstruction for the Y-12 workers.
6.4.2.2 Neutron Dose Correction Factors
The average quality factor for the four energy groups that encompass the Y-12 neutron exposures are provided in Table 6.4.2.1-1. The neutron dose equivalent correction factor for each of these four energy groups, Cf(En), can be calculated by the use of the following equation:

Effective Date: 11/19/2003 Revision No. 00 Document No. ORAUT-TKBS-0014-6 Page 30 of 47
( ) ( )( ) ( )C E
D E
Q Ew Ef n
f n
avg nR n= ×
where Df(En) is the dose fraction from section 6.3.4.2 for the specific neutron energy group of interest, Qavg(En) is the group average NCRP 38 neutron quality factor for that specific energy group, and Wr(En) is the ICRP 66 neutron weighting factor for that specific energy group.
Table 6.4.2.1-1. Neutron quality factor, Q, or weighting factor, wr.
Neutron energy (MeV) Historical dosimetry
guidelinea
NCRP Report 38 group averaged quality
factorb
ICRP Publication 66 neutron weighting
factor Thermal 3 0.5 ev–10 keV
2.35 5
10 keV–100 keV 5.38 10 100 keV–2 MeV 10.49 20
2 MeV–14 MeV 7.56 10 14 MeV–60 MeV
10
Not applicable 5 a. First Tripartite Conference at Chalk River in 1949 (Fix et al. 1994). b. See Figure 4.6.2-1.
The neutron dose distributions by energy for the various neutron exposure areas at Y-12 are summarized in Table 6.4.2.2-1. By multiplying the recorded neutron dose by the area-specific correction factors, the neutron dose equivalent is calculated as follows. Consider security personnel who inventory fissile material in the Enriched Uranium Storage Area of Building 9212. Assume that the worker receives a recorded annual neutron dose of 100 mrem. The corrected neutron dose is 151 mrem for neutrons with energies between 0.1-2 MeV, 28 mrem for neutron with energies between 2-14 MeV, and 179 mrem for neutrons of all energies. These corrections should be applied to both measured neutron dose and missed neutron dose. The dose fractions by energy and the associated ICRP 60 (1990) correction factors for various neutron exposure areas at Y-12 are summarized in Table 6.4.2.2-1.
Table 6.4.2.2-1. Summary of neutron dose fractions and associated ICRP 60 (1990) correction factors for Y-12 facilities.
Operations Y-12 facilities Building Begin End Neutron energy
Neutron dose fraction
ICRP 60 correction factors
Calibration Laboratory 9983 1949 Ongoing 0.1-2 MeV 2-14 MeV
0.57 0.43
1.09 0.57
Enriched Uranium Storage Area
9212 1949 Ongoing 0.1-2MeV 2-14 MeV
0.79 0.21
1.51 0.28
Nondestructive Analysis Laboratory
9720-5 1980 Ongoing 0.1-2 MeV 2-14 MeV
0.23 0.77
0.44 1.02
6.5 MISSED DOSE
There is undoubtedly missed dose for Y-12 workers. Analysis of the missed dose has been separated according to photon and neutron missed dose. The missed photon dose is discussed first and then the neutron missed dose.
6.5.1 Photon Missed Dose
Missed photon dose to Y-12 workers may occur for the following reasons: (1) the worker was not monitored before 1961, (2) there is no recorded dose for short periods of time after 1961, and (3) the

Effective Date: 11/19/2003 Revision No. 00 Document No. ORAUT-TKBS-0014-6 Page 31 of 47
worker’s dose during a monitoring period was recorded as zero because the dosimeter response was less than the MDL. Before 1961, the policy at Y-12 was to issue a film badge only to those workers who might exceed 10% of the RPGs in effect at that time. This practice resulted in large numbers of workers not being monitored for external radiation exposure prior to 1961 (see Figure 6.1.1).
If a worker’s routine duties and work location remained essentially the same during the 1950s and early 1960s, it may be feasible to use his recorded annual doses in the early 1960s to estimate his missed dose prior to 1961. Methods are being investigated at present based on department numbers, job descriptions, and work locations that might be used to estimate annual doses for other workers who were not monitored for external radiation exposure prior to 1961 and did not remain in the same jobs during the 1950s and early 1960s.Methods to be considered when there is no recorded dose for short periods of time for normally monitored workers have been discussed by Watson et al. (1994). Estimates of the missed dose can be made using dose results for co-workers or using the nearby recorded dose for the specific worker of interest prior to and after a period of missed dose. Regardless of how the missing dose is estimated for non-monitored periods of time, these situations do require careful consideration.
The missed dose for dosimeter results less than the MDL is particularly important for earlier years when MDLs were higher and dosimeter exchange was more frequent. NIOSH (2002) describes several different options to calculate the missed dose in these situations. One option to estimate a claimant-favorable maximum potential dose is to multiply the MDL by the number of zero dose results. This will provide an estimate of the maximum missed dose to the worker. The following sections consider missed photon dose for dosimeter results less than the MDL according to facility or location, dosimeter type, year, and energy range.
6.5.1.1 Facility or Location
Information has not been found that is adequate to describe the potential missing photon dose by facility or location within the Y-12 Plant. This is particularly true during the early years when the missed photon dose was most significant due to the frequent exchange of film dosimeters and the higher MDLs.
6.5.1.2 Dosimeter Type
The missed photon dose by dosimeter type is discussed in Section 6.3.1 and summarized in Table 6.3.1-2. The MDLs for the respective Y-12 beta/photon dosimeters are based on results of laboratory irradiations, and the actual MDLs for the workplace may be somewhat greater than these values because of additional uncertainty in actual field use. Nevertheless, the values provided in Table 6.3.1-2 are expected to provide reasonable estimates of the missed dose for Y-12 workers.
6.5.1.3 Year
Analysis of the missed photon dose by year and dosimeter exchange frequency is discussed in Section 6.3.1 and summarized in Table 6.3.1-2. The missed photon dose for workers who were unmonitored for external radiation exposures prior to 1961 is also discussed in Section 6.5.1.
6.5.1.4 Energy Range
An estimate of the missed dose by energy range may be possible based on the type of facility and predominant radiation sources or radionuclides at the facility. The recorded dose from the dosimeter response does not typically provide information to estimate discrete energy ranges. It is possible to

Effective Date: 11/19/2003 Revision No. 00 Document No. ORAUT-TKBS-0014-6 Page 32 of 47
examine the energy response characteristics of the multi-element film and TLD dosimeters, but this analysis does not recognize the substantial uncertainties present in the workplace associated with differing exposure geometries and mixed radiation fields.
6.5.2 Neutron Missed Dose
There may be significant missed neutron dose at Y-12 because of the very low potential for neutron exposure as illustrated by the data in Table 6.3.4.3-2. The neutron missed dose is divided into three time periods in the following discussion. The first time period is before 1980 when only NTA film dosimeters were used. The second time period is from 1980 to 1989 when the switch from NTA film dosimeters to TLNDs was being completed. The third time period is after 1989 when only TLNDs were used. The estimated MDLs for these neutron dosimeters are summarized in Table 6.3.1-2. It is possible to estimate the missed neutron dose using the MDLs because the neutron dosimeters were calibrated with neutron sources that had energies similar to those encountered in the workplace and more than 90% of the neutrons to which workers were normally exposed had energies greater than the 500-keV threshold of the NTA film dosimeters. There was, of course, no threshold energy for the TLNDs as illustrated in Figure 6.3.2.2-1.
6.5.2.1 Prior to 1980
The use of NTA films for neutron dosimetry prior to 1980 is well documented in various Y-12 reports. As noted above, it is possible to estimate the missed dose using the MDLs. It was also noted previously that there are a lot of recorded zeros in the neutron dose data for Y-12 workers for two reasons: (1) a worker’s NTA film was not developed and read, or (2) a worker’s NTA film indicated a neutron dose equivalent that was less than the film’s MDL, approximately 50 mrem. If the MDL for NTA film is used in estimating the missed neutron dose, it should be multiplied by 1.10 for workers in Calibration Laboratory and by 1.05 for workers in the Enriched Uranium Storage Area of Building 9212 and the Nondestructive Analysis Laboratory. It is also possible to estimate the missed neutron dose in some facilities by use of neutron-to-photon dose ratios (NIOSH 2002). However, the only Y-12 facility where this dose ratio is expected to provide a reasonably reliable estimate of the missed neutron dose is the Enriched Uranium Storage Area of Building 9212. For this area, the dose ratio was determined by recent PNL measurements to be approximately 1:1. The dose ratios for other neutron exposure areas at Y-12 determined from recent PNL measurements were quite large and the use of these data could lead to gross overestimates of missed neutron dose if a worker were also exposed to pure photon sources at the Calibration Laboratory or the Nondestructive Analysis Laboratory.
6.5.2.2 From 1980 to 1989
There is a serious gap in the neutron dosimetry information from 1980 to 1989. Y-12 became increasingly dependent over the years on ORNL to process the NTA films and to determine their neutron doses because of the small numbers of neutron exposed workers. Thus, the neutron dosimetry at Y-12 is assumed to be the same as that at ORNL for this time period. All workers at both ORNL and Y-12 were provided with a two-element TLD dosimeter for beta-particle and photon dosimetry (McLendon 1980a) and workers exposed to neutrons were provided with a separate neutron dosimeter (Gupton 1978). This dosimeter was a modification of the film badge dosimeter previously used at both ORNL and Y-12. During the switch from film to TLD, the film badge dosimeter was modified to hold four TLD chips in a polyethylene mount, 1 mm thick. For workers exposed to neutrons, the modified badge contained a combination of two TLD chips and two TLND chips for low and intermediate energy neutron dosimetry plus an NTA film for fast neutron dosimetry. The MDL of this neutron dosimetry is assumed to about the same as that of the NTA film alone because most of

Effective Date: 11/19/2003 Revision No. 00 Document No. ORAUT-TKBS-0014-6 Page 33 of 47
the neutron dose at Y-12 comes from neutrons above the 500-keV threshold of the NTA film. In the mid-1980s, the NTA film was removed because of poor film quality, its large MDL, and the labor intensive processing requirements (Berger and Lane 1985). The dosimeter was further modified to serve as a neutron albedo dosimeter for neutrons of all energies. This neutron albedo dosimeter functioned reasonably well in the workplace neutron fields because it was calibrated using the fast fission neutrons from the Health Physics Research Reactor (HPRR) at ORNL (Berger and Lane 1985). The mean energies of the fast fission neutrons from the HPRR can be varied from 0.56 MeV using a concrete shield (or spectrum shifter) to 1.28 MeV with no shielding (or spectrum shifter) between the reactor and the dosimeter. Based on very limited data from test studies at the HPRR, it is estimated that the MDL for this neutron albedo dosimeter was approximately 20 mrem.
6.5.2.3 Post 1989
Since 1989, the neutron dose has been measured using a newly developed albedo-type TLND worn on the belt to keep in close contact with the body. The characteristics of this dosimeter are well documented (BWXT Y-12 2001) and the MDL to be used in estimating missed dose is 10 mrem (see Table 6.3.1-2).
6.6 UNCERTAINTY IN PHOTON AND NEUTRON DOSE
For film badges, the MDLs that are quoted in the literature range from about 30 to 50 mrem for beta/photon irradiation (Morgan 1961; Parrish 1979; West 1993; Souleyrette 2003) and from 50 to 100 mrem for neutrons (Morgan 1961; Parrish 1979; Wilson et al. 1990). These are not the expected uncertainties at larger photon and neutron dose readings. For example, it was possible to read a photon dose of 100 mrem to with ± 15 mrem if the exposure involved photons with energies between several hundred keV and several MeV (Morgan 1961). If the exposure involved photons with energies less than several hundred keV, the uncertainty was at least twice that for the more energetic photons. Thus, the standard error in the recorded film badge doses from photons of any energy is estimated here to be ± 30%. The standard error for the recorded dose from beta irradiation was essentially the same as that for photon irradiation, but when an unknown mixture of beta and photon irradiation was involved the standard error for the dose from beta irradiation was somewhat larger than 30% (Morgan 1961). The situation for neutrons was not as favorable as that for photons. With NTA films, the estimated standard error was much larger and varied significantly with the energy of the neutrons. Thus, the standard error for a neutron dose reading of approximately 100 mrem is estimated here to be ± 50%. For the TLD dosimeters used at Y-12 after 1980 and the TLND dosimeters used at Y-12 after 1985, the standard errors for a recorded dose reading of 100 mrem or more are estimated here to be approximately ± 15% for photons, beta particles, and neutrons. The standard errors for TLD and TLND dose measurements less than 100 mrem and for TLD and TLND dose measurements in mixed radiation fields would be expected to be somewhat larger.
6.7 ORGAN DOSE
Once the photon and neutron doses and their associated standard errors have been calculated for each year, the values are then used to calculate organ doses of interest using the NIOSH External Dose Reconstruction Implementation Guideline (NIOSH 2002). There are many complexities and uncertainties when applying organ dose conversion factors to the adjusted doses of record. Many of the factors that affect the recorded dose have already been discussed in the various tables throughout this section. Some factors such as backscattering (phantom calibration) and the over response of low energy photons would indicate the recorded dose was too high. Other factors such as calibration methodology, angular response, low energy threshold, and film fading would result in a recorded dose that was too low. As a result differences in film badge design (filtration) and calibration can have both

Effective Date: 11/19/2003 Revision No. 00 Document No. ORAUT-TKBS-0014-6 Page 34 of 47
positive and negative effects on the overall dose comparison to Hp(10). The International Commission on Radiation Units and Measurements (ICRU 1988) has indicated that film badge dosimeters, while not tissue equivalent, can be used for personnel dosimetry. They also indicate that it is more difficult to ensure that the variation in response with energy and angle of incidence with low energy. Given the voluminous uncertainties above especially with film badge dosimetry in the 1950-1980s, a claimant favorable approach is used to estimate organ dose. Since exposure to organ dose conversion factors result in a higher organ dose and higher probability of causation, given the Radiation Effective Factors of the intermediate energy photons, these dose conversion factors (DCFs) will be used to convert recorded film badge doses to organ dose. In the conversion of all recorded photon and neutron doses to organ doses, the exposure geometry must also be given careful consideration. Some of the more common exposure geometries encountered in the workplace are defined as follows: (1) an anterior-posterior (AP or front-to-back) exposure is typical for an individual who works in a directional radiation field and faces the source of the radiation source while working, (2) rotational exposure is typical of an individual who is constantly turning in a directional radiation field while working, and (3) an isotropic exposure is typical of an individual who is working in a highly non-directional or omni-directional radiation field. The proposed default options based on claimant-favorable exposure geometries for long-term workers are listed in Table 6.6-1. In Attachment F, the use of the parameters presented in Section 6 will be discussed to aid the dose reconstructor in preparing dose reconstructions for long-term Y-12 workers.
Table 6.6-1. Default exposure geometries for calculating organ doses. Claim status Job category Exposure geometry Percentage
Likely non-compensable All A-P 100% Compensable worker All A-P
Rotational 50% 50%
Compensable supervisor All A-P Isotropic
50% 50%

Effective Date: 11/19/2003 Revision No. 00 Document No. ORAUT-TKBS-0014-6 Page 35 of 47
REFERENCES
Berger, C. D. and B. H. Lane, 1985, Neutron Dosimetry with the ORNL Badge, ORNL/TM-9450, Oak Ridge National Laboratory, Oak Ridge, Tennessee.
BWXT Y-12, L.L.C., 2001, Technical Basis for the External Dosimetry Program at the Y-12 National Security Complex, RCO/TBD-007, Revision 3, Y-12 National Security Complex, Oak Ridge, Tennessee.
Callihan, D. and J. T. Thomas, 1959, “Accidental Radiation Excursion at the Oak Ridge Y-12 Plant−I. Description and Physics of the Accident,” Health Physics (The Radiation Safety Journal), volume 1, number 4, pp. 363-372.
Cameron, J. R., N. Sunthanalingham, and G. N. Kennedy, 1968, Thermoluminescent Dosimetry, University of Wisconsin Press, Madison, Wisconsin.
Craft, H. R., J. C. Ledbetter, and J. C. Hart, 1952, Personnel Monitoring Operating Techniques, ORNL-1411, Oak Ridge National Laboratory, Oak Ridge, Tennessee.
Davis, D. M. and E. D. Gupton, 1963, Health Physics Instrument Manual, ORNL-332, 3rd Edition, Oak Ridge National Laboratory, Oak Ridge, Tennessee.
DOE (U.S. Department of Energy), 1986, Department of Energy Standard for the Performance Testing of Personnel Dosimetry Systems, DOE/EH-0027, Washington, D.C.
Fix, J. J., E. S. Gilbert, and W. V. Baumgartner, 1994, An Assessment of Bias and Uncertainty in Recorded Dose from External Sources of Radiation for Workers at the Hanford Site, PNNL-11196, Pacific Northwest National Laboratory, Richland, Washington.
Gunter, R. J., 1994, Evaluation of the Neutron Dosimeter used by Martin Marietta Energy Systems, Inc., Ability to Meet the Requirements of the American National Standard for Personnel Neutron Dosimeters (Neutron Energies Less Than 20 MeV) ANSI N319-1976, ORNL/TM-12748, Oak Ridge National Laboratory, Oak Ridge, Tennessee.
Gupton, E. D., 1978, Dosimetry with the ORNL Badge, 1978, ORNL/TM-6357, Oak Ridge National Laboratory, Oak Ridge, Tennessee.
Henderson, M. D., 1991, Evaluation of Radiation Exposure in Metal Preparation Depleted Uranium Process Areas, Y/DQ-5/R1, Y-12 Plant, Oak Ridge, Tennessee.
Hogue, H. H. and S. E. Smith, 1984, Off-line Nondestructive Analysis at a Uranium Recovery Facility, Y/DW-441, Y-12 Plant, Oak Ridge, Tennessee.
Horowitz, Y. S., 1984, Thermoluminescence and Thermoluminescent Dosimetry, CRC Press, Boca Raton, Florida.
Howell, R. L. and Z. Batte, 1982, Thermoluminescent Dosimetry for Union Carbide Corporation Nuclear Division Personnel, Y/DK-291, Y-12 Plant, Oak Ridge, Tennessee.

Effective Date: 11/19/2003 Revision No. 00 Document No. ORAUT-TKBS-0014-6 Page 36 of 47
Hurst, G. S., R. H. Ritchie, and L. C. Emerson, 1959, “Accidental Radiation Excursion at the Oak Ridge Y-12 Plant−III. Determination of Radiation Doses,” Health Physics (The Radiation Safety Journal), volume 2, number 2, pp. 21-29.
IAEA (International Atomic Energy Agency), 1990, Compendium of Neutron Spectra and Detector Responses for Radiation Protection Purposes, Technical Report Series No. 318, IAEA, Vienna, Austria.
IAEA, 2001, Compendium of Neutron Spectra and Detector Responses for Radiation Protection Purposes, Supplement to Technical Report Series No. 318, Technical Report Series No. 403, IAEA, Vienna, Austria.
ICRP (International Commission on Radiological Protection), 1973, Data for Protection Against Ionizing Radiation from External Sources: Supplement to ICRP Publication 15, ICRP Publication 21, Pergamon Press, Oxford, England.
ICRP 1990, “1990 Recommendations of the International Commission on Radiological Protection,” ICRP Publication 60, Annals of the ICRP, volume 21, numbers 1-3, Pergamon Press, Oxford, England.
ICRP 1996, "Conversion Coefficients for Use in Radiological Protection Against External Radiation," ICRP Publication 74, Annals of the ICRP, volume 26, numbers 3-4, Pergamon Press, Oxford, England.
ICRU (International Commission on Radiation Units and Measurements), 1988, Determination of Dose Equivalents from External Radiation Sources, Part 2, ICRP Report 43, Bethesda, Maryland.
ICRU (International Commission on Radiation Units and Measurements), 1993, Quantities and Units in Radiation Protection Dosimetry, ICRU Report No. 51, Bethesda, Maryland.
Jones, D. A., 1971, Evaluation of Personnel Monitoring Films for Y-12 Security Meter Badge, Y/DD-85, Y-12 Plant, Oak Ridge, Tennessee.
Kerr, G. D. and G. T. Mei, 1993, Technical Basis for Nuclear Accident Dosimetry at the Oak Ridge National Laboratory, ORNL/TM-12224, Oak Ridge National Laboratory, Oak Ridge, Tennessee.
Kocher, D. C., A. I. Apostoaei, and F. O. Hoffman, 2002, “Radiation Effectiveness (REFs) for Use in Calculating the Probability of Causation of Radiogenic Cancers,” Health Physics (The Radiation Safety Journal), volume 82, number 6, supplement, p. S1888.
McLendon, J. D., 1959, “Accidental Radiation Excursion at the Oak Ridge Y-12 Plant−II. Health Physics Aspects of the Accident,” Health Physics (The Radiation Safety Journal), volume 2, number 1, pp. 21-29.
McLendon, J. D., 1963, Y-12 Radiation Safety Manual, Y/KB-29, Y-12 Plant, Oak Ridge, Tennessee.
McLendon, J. D., 1980a, External Radiation Monitoring of Union Carbide Nuclear Division Personnel, Y/DD-268, Y-12 Plant, Oak Ridge, Tennessee.

Effective Date: 11/19/2003 Revision No. 00 Document No. ORAUT-TKBS-0014-6 Page 37 of 47
McLendon, J. D., 1980b, Y-12 Plant Health Physics Quarterly Report, January-March 1980, Y/DD-264, Y-12 Plant, Oak Ridge, Tennessee.
McMahan, K. L., 1991, “The Martin Marietta Energy Systems Personnel Neutron Dosimetry Program,” Eleventh DOE Workshop on Personnel Neutron Dosimetry, CONF-9106235 (PNL-SA-21596), Pacific Northwest Laboratory, Richland, Washington.
McRee, P. C., C. M. West, and J. D. McLendon, 1965, Y-12 Radiation Safety Manual, Y-1401 Revised, Y-12 Plant, Oak Ridge, Tennessee.
Morgan, K. Z., 1961, “Dosimetry Requirements for Protection from Ionizing Radiation,” Selected Topics in Radiation Dosimetry, International Atomic Energy Agency, Vienna, Austria, pp. 3-23.
Murray, R. L., 1948a, Health Physics Progress Report, January 1-31, 1948, Y-120, Y-12 Plant, Oak Ridge, Tennessee.
Murray, R. L., 1948b, Health Physics Progress Report, February 1-29, 1948, Y-134, Y-12 Plant, Oak Ridge, Tennessee.
NCRP (National Council on Radiation Protection and Measurements), 1971, Protection Against Neutron Radiation, NCRP Report No. 38, NCRP Publications, Bethesda, Maryland.
NIOSH (National Institute for Occupational Health and Safety), 2002, External Dose Reconstruction Implementation Guidelines, OCAS-IG-001, Revision 1, Cincinnati, Ohio.
Pardue, L. A., N. Goldstein, and R. O. Wollan, 1944, Photographic Film as a Pocket Radiation Dosimeter, CH-1553, University of Chicago, Chicago, Illinois.
Parrish, B. R., 1979, Analysis of External Monitoring Devices and Data for Oak Ridge National Laboratory Epidemiological Study, Masters Thesis, School of Public Health, University of North Carolina, Chapel Hill, North Carolina.
Patterson, C. M. Jr., C. M. West, and J. D. McLendon, 1957, The Y-12 Health Physics Program, Y-1186 Deleted Revision, Y-12 Plant, Oak Ridge, Tennessee.
PNL (Pacific Northwest Laboratory), 1990, Neutron Dose Equivalent and Energy Spectra Measurements at the Oak Ridge National Laboratory and Y-12 Plant, PNL-7528, Richland, Washington.
Sherrill, M. W. and W. O. Tucker, 1973, Evaluation of New Film Badge Film Reader and Revised Exposure Computations, Y/DK-111, Y-12 Plant, Oak Ridge, Tennessee.
Sims, C. S. and G. G. Killough, 1983, “Neutron Fluence-to-Dose Equivalent Conversion Factors: A Comparison of Data Sets and Interpolation Methods,” Radiation Protection Dosimetry, volume 5, number 1, pp. 45-48.
Sonder, E. and A. B. Ahmed, 1991, Background Radiation Accumulation and Lower Limit of Detection in Thermoluminescent Beta-Gamma Dosimeters Used by the Centralized External Dosimetry System, ORNL/TM-11995, Oak Ridge National Laboratory, Oak Ridge, Tennessee.

Effective Date: 11/19/2003 Revision No. 00 Document No. ORAUT-TKBS-0014-6 Page 38 of 47
Souleyrette, M. L., 2003 (February 18), Summary of Historical Monitoring Techniques Provided to NIOSH for EEOICPA Data Requests, Y-12 National Security Complex, Oak Ridge, Tennessee.
Struxness, E. G., 1949a, Health Physics-Hygiene Progress Report, February 1-28, 1949, Y-365/1R, Y-12 Plant, Oak Ridge, Tennessee.
Struxness, E. G., 1949b, Health Physics-Hygiene Progress Report, May 1-31, 1949, Y-429/1R, Y-12 Plant, Oak Ridge, Tennessee.
Struxness, E. G., 1951, Health Physics Progress Report, January 1, 1951-June 30, 1951, Y-836, Y-12 Plant, Oak Ridge, Tennessee.
Struxness, E. G., 1952a, Health Physics Progress Report, January 1, 1952-July 1, 1952, Y-940, Y-12 Plant, Oak Ridge, Tennessee.
Struxness, E. G., 1952b, Health Physics Progress Report, July 1, 1952-December 31, 1952, Y-1066, Y-12 Plant, Oak Ridge, Tennessee.
Taylor, L. S., 1971, Radiation Protection Standards, CRS Press, Cleveland, Ohio.
Thierry-Chef, I., F. Pernicka, M. Marshall, E. Cardis, and P. Andreo, 2002, “Study of a Selection of 10 Historical Types of Dosimeters: Variation of the Response of Hp(10) with Photon Energy and Geometry of Exposure,” Radiation Protection Dosimetry, volume 102, number 2, pp. 101-113.
Thornton, W. T., D. M. Davis, and E. D. Gupton, 1961, The ORNL Badge Dosimeter and Its Personnel Monitoring Applications, ORNL-3126, Oak Ridge National Laboratory, Oak Ridge, Tennessee.
Vallario, E. J., D. E. Hankins, and C. M. Unruh, 1969, AEC Workshop on Personnel Dosimetry, BNWL-1340, Battelle Pacific Northwest Laboratory, Richland, Washington.
Watkins, J. P., J. L. Reagan, D. L. Cragle, E. L. Frome, C. M. West, D. J. Crawford-Brown, and W. G. Tankersley, 1993, Data Collection, Validation, and Description for the Oak Ridge Nuclear Facilities Mortality Study, ORISE-93/J-42, Oak Ridge Institute for Science and Education, Oak Ridge, Tennessee.
Watkins, J. P., D. L. Cragle, E. L. Frome, C. M. West, D. J. Crawford-Brown, and W. G. Tankersley, 1994, Adjusting External Dose from the ORNL and Y-12 Facilities for the Oak Ridge Nuclear Facilities Mortality Study, ORISE-94/G-34, Oak Ridge Institute for Science and Education, Oak Ridge, Tennessee.
Watson, J. E. Jr., J. L. Wood, W. G. Tankersley, and C. M. West, 1994, “Estimation of Radiation Dose for Workers Without Monitoring Data for Retrospective Epidemiologic Studies,” Health Physics (The Radiation Safety Journal), volume 67, number 4, pp. 402-405.
West. C. M. (Hap), 1993 (June 7), Brief History of the Y-12 External Monitoring Program, Memorandum to Donna Cragle, Oak Ridge Institute for Science and Education, Oak Ridge, Tennessee.
Wilcox, W. J., Jr., 2001, An Overview of the History of Y-12, 1942-1992, American Museum of Science and Energy, Oak Ridge, Tennessee.

Effective Date: 11/19/2003 Revision No. 00 Document No. ORAUT-TKBS-0014-6 Page 39 of 47
Wilson, R. H., W. V. Baumgartner, J. J. Fix, and L. L. Nichols, 1990, Description and Evaluation of the Hanford Personnel Dosimeter Program From 1944 Trough 1989, PNL-7447, Pacific Northwest Laboratory, Richland, Washington.
Y-12 Plant, 1978, “Low-Level Exposures to Ionizing Radiation,” Radiation Safety and Industrial Hygiene Information Bulletin, Number 79-1, Y-12 Plant, Oak Ridge, Tennessee.
Y-12 Plant, 1980, “Occupational Radiation Experience,” Radiation Safety and Industrial Hygiene Information Bulletin, Number 80-1, Y-12 Plant, Oak Ridge, Tennessee.
Y-12 Plant, 1981, “Ionizing Radiation Exposures – CY 1980,” Radiation Safety and Industrial Hygiene Information Bulletin, Number 81-1, Y-12 Plant, Oak Ridge, Tennessee.
Y-12 Plant, 1982a, “Personnel Dosimetry−External Dosimetry”, Radiation Safety and Industrial Hygiene Information Bulletin, Number 82-1, Y-12 Plant, Oak Ridge, Tennessee.
Y-12 Plant, 1982b, “Ionizing Radiation Exposures – CY 1981,” Radiation Safety and Industrial Hygiene Information Bulletin, Number 82-2, Y-12 Plant, Oak Ridge, Tennessee.
Y-12 Plant, 1983, “Ionizing Radiation Exposures – CY 1982,” Radiation Safety and Industrial Hygiene Information Bulletin, Number 83-1, Y-12 Plant, Oak Ridge, Tennessee.
Y-12 Plant, 1984, “Ionizing Radiation Exposures – CY 1983,” Radiation Safety and Industrial Hygiene Information Bulletin, Number 84-1, Y-12 Plant, Oak Ridge, Tennessee.
Y-12 Plant, 1985, “Ionizing Radiation Exposures – CY 1984,” Radiation Safety and Industrial Hygiene Information Bulletin, Number 85-2, Y-12 Plant, Oak Ridge, Tennessee.
Y-12 Plant, 1986, “Ionizing Radiation Exposures – CY 1985,” Radiation Safety and Industrial Hygiene Information Bulletin, Number 86-2, Y-12 Plant, Oak Ridge, Tennessee.
Y-12 Plant, 1987, “Ionizing Radiation Exposures – CY 1986,” Radiation Safety and Industrial Hygiene Information Bulletin, Number 87-2, Y-12 Plant, Oak Ridge, Tennessee.
Y-12 Plant, 1988a, “Ionizing Radiation Exposures – CY 1987,” Radiation Safety and Industrial Hygiene Information Bulletin, Number 88-13, Y-12 Plant, Oak Ridge, Tennessee.
Y-12 Plant, 1988b, “New Radiation Dosimeter to be Issued,” Health, Safety, Environment, and Accountability Information Bulletin, Health Physics Number 88-14, Y-12 Plant, Oak Ridge, Tennessee.
Y-12 Plant, 1991, “Nuclear Accident Dosimetry,” Health, Safety, Environment, and Accountability Information Bulletin, Health Physics Number 91-5, Y-12 Plant, Oak Ridge, Tennessee.

Effective Date: 11/19/2003 Revision No. 00 Document No. ORAUT-TKBS-0014-6 Page 40 of 47
GLOSSARY
IN PREPARATION

Effective Date: 11/19/2003 Revision No. 00 Document No. ORAUT-TKBS-0014-6 Page 41 of 47
ATTACHMENT F OCCUPATIONAL EXTERNAL DOSE FOR MONITORED WORKERS
F.1 OCCUPATIONAL EXTERNAL DOSE
The information needed to evaluate claims is directed to the technical parameters of the annual estimates of the primary organ dose that is calculated from the dosimeter interpreted personal dose equivalent, Hp(10), and Hp(0.07) in the case of skin, testicular, and breast cancer. These are used as a consistent basis of comparison for all years of Y-12 occupational external dose starting in 1950.
The primary IREP screen used to input dose parameters is illustrated in Table F-1. The input to these fields is obtained from the Y-12 dose of record. The claim provides the primary organ of interest and other worker information needed to run the IREP computer program. Guidance to the dose reconstruction analysis in selecting the technical external dose parameters to complete the respective fields in Table F-1 is provided in the following sections.
Table F-1. IREP dose parameter input screen. Exposure Distribution parameters
# Year Rate Radiation type Type 1 2 3 1 1960 Acute Photon, 30-250 keV Normal 2 2 0 2 1961 3 1962
F.2 YEARS OF EXPOSURE
The years of exposure should be identified from the Y-12 radiation dose reports. Missed dose is calculated for each of the following reasons: (1) the worker was not monitored for external radiation exposure before 1961, (2) there is no recorded dose for short periods of time after 1961, and (3) the recorded dose during a monitoring period was zero because the dosimeter response was less than the MDL. The missed dose should be calculated for a claimant for each year of record as an employee unless there are valid reasons for years in which there are no records.
F.3 EXPOSURE RATE
Acute is selected for all types of external beta and photon dose and chronic is selected for neutron dose (NIOSH 2002).
F.4 RADIATION TYPE
F.4.1. Beta and Photon Radiation
Claimant-favorable assumptions should be made using guidance in Table F-2 for beta particles and for photons (x-rays and gamma rays) to assure that dose is not underestimated. The values presented in this table are intended to provide a reasonable estimate of parameters used to calculate the organ dose without significant numerical error for long-term Y-12 workers in the respective facilities. There is no direct evidence to select the specific values shown other than considerations of the radiation sources and usual work tasks. In those cases where there is some doubt in the values, a range of realistic values should be selected for comparison and the most claimant-favorable option selected.

Effective Date: 11/19/2003 Revision No. 00 Document No. ORAUT-TKBS-0014-6 Page 42 of 47
Table F-2. Selection of beta and photon radiation energies and percentages for Y-12 site processes. Operations
Y-12 Site Processes Building Begin End Radiation
type Energy
selection Percent9203 1947 1951 9206a 1947 1959 9211 1947 1959
Enriched Uranium Product Recovery
and Salvage Operations 9201-1 1952 1963
Beta Photon
> 15 keV 30-250 keV
100% 100%
9202 1947 1995 9206a 1947 1995
Uranium Chemical Operations and
Weapon Production Operations 9212b 1949 Ongoing
Beta Photon
> 15 keV 30-250 keV
100% 100%
Special Nuclear Material Receiving and Storage
9720-5 1949 Ongoing Photon 30-250 keV
100%
9201-5 1949 Ongoing 9204-4 1949 Ongoing
Uranium Forming and Machining for Weapon Component Operations
9215 1950 Ongoing
Beta Photon
> 15 keV 30-250 keV
100% 100%
9201-5 1949 Ongoing 9204-4 1949 Ongoing 9766 1949 ?
Depleted Uranium Process Operations
9998 1949 Ongoing
Beta Photon
> 15 keV 30-250 keV > 250 keV
100%
50% 50%
9204-2 1952 Ongoing Final Weapon Component Assembly Operations 9204-2E 1952 Ongoing
Beta Photon
> 15 keV 30-250 keV
100% 100%
ORNL 86-Inch Cyclotron 9201-2 1950 ? Photon 30-250 keV >250 keV
50% 50%
Chemical Assay and Mass Spectrometry Laboratories
9203 1947 Ongoing Photon
Radiographic Laboratory 9201-1 1947 Ongoing Photon Calibration Laboratory 9983 1949 Ongoing Photon Weapon Component Assay Laboratory 9995 1952 Ongoing Photon Nondestructive Assay Laboratory 9720-5 1980 Ongoing Photon
Specific to radiation source Photon default values: 20-250 keV >250 keV
50% 50%
West End Waste Treatment Facility
9616-7 1984 Ongoing Beta Photon
> 15 keV 30-250 keV >250 keV
100% 50% 50%
a. Building 9206 Complex includes Buildings 9768, 9720-17, 9409-17, 9510-2, 9767-2, and the east and west tank farm pits. b. Building 9212 Complex includes Buildings 9809, 9812, 9818, 9815, and 9980.
F.4.2. Neutron Radiation
The default neutron dose distributions by energy for each of the neutron exposure areas at Y-12 are summarized in Table F-3.
Table F-3. Selection of neutron energies and percentages for Y-12 site facilities. Operations
Y-12 site facility Building Begin End Neutron energy
Default dose fraction (%)
Calibration Laboratory 9983 1949 Ongoing 0.1-2 MeV 2-14 MeV
57% 43%
Enriched Uranium Storage Area 9212 1949 Ongoing 0.1-2MeV 2-14 MeV
79% 21%
Nondestructive Assay Laboratory
9720-5 1980
Ongoing 0.1-2 MeV 2-14 MeV
23% 77%

Effective Date: 11/19/2003 Revision No. 00 Document No. ORAUT-TKBS-0014-6 Page 43 of 47
F.5 ADJUSTMENTS TO RECORDED DOSE
F.5.1. Parameter #1
Selection of the distribution parameters in Table F-1 involves the adjustments to the dose of record for missed dose prior to entry into the IREP input screen. The selection of a normal distribution for the “Type” determines the definition of Parameters #1 and #2. For a normal distribution, Parameter #3 is not used and Parameter #1 is the mean of the distribution of recorded dose for each year of monitoring.
F.5.2. Adjustment to Recorded Photon Dose
Adjustments to the Y-12 reported photon dose are necessary to arrive at a claimant-favorable dose considering uncertainties associated primarily with the complex workplace radiation fields and exposure geometries. Henderson (1991) identified such problems for workers performing waist-level handling jobs in the DU process areas of Y-12. Examples of waist-level handling jobs are unloading and sorting of DU scrap materials, shearing of larger pieces of scrap materials, cleaning of the scrap materials, crucible loading during the melting and casting operations, and materials sampling. It is now a practice to instruct workers performing these operations to wear their beta/photon dosimeters at the waist, but many of these workers may have worn their dosimeters on the collar in the past. The photon dose correction summarized in Table F-4 is necessary to calculate an adjusted photon dose that is claimant favorable prior to 1991. From 1991 to present, no correction in needed because the recorded dose is Hp(10) equivalent. To determine when to make such adjustments, the dose reconstructor must depend on information about routine duties and work locations that are contained in the Computer Assisted Telephone Interview (CATI) file for a claimant.
Table F-4. Adjustments to reported Y-12 deep photon dose. Parameter Description
Period Prior to 1/1/1991 Dosimeters All beta/photon dosimeters Facilities Depleted uranium process operations Workers Waist-level metal handling operators Adjustment to
recorded dose Multiply reported deep photon dose by a factor of 1.34
to estimate Hp(10)
F.5.3. Adjustments to Recorded Neutron Dose
The Y-12 facility incorporated the energy variation of the dose equivalent from neutrons into their calibration methodology. Thus, the recorded dose equivalent is a combination of all neutron energies. In order to calculate the neutron dose input to IREP (see Table F-1), the recorded neutron dose must be separated into neutron energy groups as shown in Table F-3 and subsequently converted into ICRP 60 methodology (ICRP 1990). The dose fractions by neutron energy group and the associated ICRP 60 correction factors for the various neutron exposure areas at Y-12 are summarized in Table F-5. As an example, consider security personnel who inventory fissile material in the Enriched Uranium Storage Area of Building 9212 and assume that such a person receives a neutron dose of 100 mrem. The corrected neutron dose is 151 mrem for neutrons with energies between 0.1-2 MeV and 28 mrem for neutrons with energies between 2-14 MeV. Thus, the total corrected neutron dose is a total of 179 mrem. These corrections should be applied to both recorded dose and missed dose.

Effective Date: 11/19/2003 Revision No. 00 Document No. ORAUT-TKBS-0014-6 Page 44 of 47
F.5.4. Unmonitored Photon and Neutron Dose
Missed photon and neutron would occur where there is no recorded dose because the worker was not monitored or the dose is unavailable for a short period of time because a film was either lost or damaged while being processed. Before 1961, the policy at Y-12 was to issue a film badge only to those workers who might exceed 10% of the RPGs in effect at that time. This practice resulted in large numbers of workers not being monitored for external radiation exposure prior to 1961 (see Figure 6.1.1).
Table F-5. Neutron dose fractions and associated ICRP 60 correction factors for Y-12 site facilities. Operations
Y-12 facilities Building Begin End Neutron energy Neutron dose
fraction ICRP 60 correction
factors Calibration Laboratory 9983 1949 Ongoing 0.1-2 MeV
2-14 MeV 0.57 0.43
1.09 0.57
Enriched Uranium Storage Area
9212 1949 Ongoing 0.1-2MeV 2-14 MeV
0.79 0.21
1.51 0.28
Nondestructive Analysis Laboratory
9720-5 1980 Ongoing 0.1-2 MeV 2-14 MeV
0.23 0.77
0.44 1.02
If a worker’s routine duties and work location remained essentially the same during the 1950s and early 1960s, it may be feasible to use his recorded annual doses in the early 1960s to estimates his missing dose prior to 1961. Methods are being investigated at present using department numbers, job descriptions, and work locations that might be used to estimate annual doses for other workers who were not monitored for external radiation exposure prior to 1961 and did not remain in the same jobs during the 1950s and early 1960s.
Methods to be considered when there is no recorded dose for short periods of time for normally monitored workers have been discussed by Watson et al. (1994). Estimates of the missed dose can be made using dose results for coworkers or using nearby recorded dose for the specific worker of interest prior to and after a period of missed dose due to a film that was either lost or damaged while being processed. Regardless of how the missing dose is estimated for non-monitored periods of time, these situations do require careful consideration.
F.5.5. Missing Photon Dose
Missing photon dose also occurs when the recorded dose is zero because the dosimeter response was less than the MDL. This kind of missed dose is most important for earlier years when MDLs were higher and dosimeter exchange was more frequent. NIOSH (2002) guidance should be followed to calculate the missing photon dose by using a claimant-favorable maximum potential missed dose. This is calculated by multiplying the MDL by the number of zero dose results to estimate the maximum potential missed dose. The following sections discuss the missed photon dose corrections according to facility or location, dosimeter type, year, and energy range.
F.5.5.1. Facility or Location Information has not been found that is adequate to describe the potential missing photon dose by facility or location within Y-12. This is particularly true during the early years when the missed photon dose was most significant due to the frequent exchange of film dosimeters and their higher MDLs.

Effective Date: 11/19/2003 Revision No. 00 Document No. ORAUT-TKBS-0014-6 Page 45 of 47
F.5.5.2. Dosimeter Type The missed photon dose by dosimeter type is summarized in Table F-6. The MDLs for the respective Y-12 beta/photon dosimeters are based on results of laboratory irradiations. The actual MDLs for the workplace may be somewhat greater than these values because of additional uncertainty in actual field use. Nevertheless, the values provided in Table F-6 are expected to provide reasonable estimates of the missed dose for Y-12 workers.
F.5.5.3 Year Analysis of the missed photon dose by year and dosimeter exchange frequency is summarized in Table F-6. The missed photon dose for workers who were unmonitored for external occupational radiation exposure prior to 1961 is also discussed in Section F.5.4.
F.5.5.4. Energy Range An estimate of the missed dose by energy range may be possible based on the type of facility and predominant radiation sources or radionuclides at the facility. The recorded dose from the dosimeter response does not typically provide information to estimate discrete energy ranges. It is possible to examine the energy response characteristics of the multi-element film and TLD dosimeters, but this analysis does not recognize the substantial uncertainties present in the workplace associated with differing exposure geometries and mixed radiation fields.
Table F-6. Dosimeter type, period of use, exchange frequency, laboratory minimum detectable limit, and maximum annual missed dose.
Dosimeter Period Exchange frequency
Laboratory MDL (mrem)
Maximum annual missed dose (mrem)
Beta/photon dosimeters Daily < 5 1,300 Pocket ionization chamber 1948-1950 Weekly < 5 260
1948-1958 Weekly 40 2,080 Two-element film badge 1958-1961 Monthly 40 480
Four-element film badge 1961-1980 Quarterly 40 160 Two-element TLD dosimeter 1980-1989 Quarterly 20 80 Four-element TLD dosimeter 1989-Present Quarterly 10 40
Neutron dosimeters Biweekly < 50 1,300 Monthly < 50 600
NTA film 1948-1980
Quarterly < 50 200 1980-1985 Quarterly < 50 200 Combination NTA film and TLND
dosimeter 1985-1989 Quarterly 20 80 TLND dosimeter 1989-Present Quarterly 10 40
F.5.6. Neutron Missed Dose
The estimated MDLs for the neutron dosimeters used at Y-12 are summarized in Table F-6. It is possible to calculate the missed neutron dose at Y-12 using the MDLs because the neutron dosimeters were calibrated with neutron sources that had energies similar to those encountered in the workplace and more than 90% of the neutrons to which workers were normally exposed had energies greater than the 500-keV threshold of the NTA film dosimeters. If the MDL for NTA film is used in estimating the missed neutron dose, it should be multiplied by 1.10 for workers in the Calibration Laboratory and by 1.05 for workers in the Enriched Uranium Storage Area of Building 9212 and the Nondestructive Analysis Laboratory. It is also possible to estimate missed neutron dose in some

Effective Date: 11/19/2003 Revision No. 00 Document No. ORAUT-TKBS-0014-6 Page 46 of 47
facilities by use of neutron-to-photon dose ratios (NIOSH 2002). However, the only Y-12 facility where a neutron-to-photon dose ratio is expected to provide a reasonably reliable estimate of the missed dose is for workers in the Enriched Uranium Storage Area of Building 9212. For this area, the neutron-to-dose ratio was approximately 1:1. The neutron-to-dose ratios for other neutron exposure areas at Y-12 were quite large and the use of these data could lead to gross overestimates of missed neutron dose if an individual was also exposed to pure photon sources during the course of their work at either the Calibration Laboratory or the Nondestructive Analysis Laboratory.
F.5.7 Organ Dose Equivalent
Once the adjusted photon and neutron doses have been calculated for each year, the values are used to calculate organ doses of interest using the NIOSH External Dose Reconstruction Implementation Guideline (NIOSH 2002). There are many complexities and uncertainties when applying organ dose conversion factors to the adjusted doses of record. Many of the factors that affect the recorded dose have already been discussed in the various tables throughout this section. Some factors such as backscattering (phantom calibration) and the over response of low energy photons would indicate the recorded dose was too high. Other factors such as calibration methodology, angular response, low energy threshold, and film fading would result in a recorded dose that was too low. As a result differences in film badge design (filtration) and calibration can have both positive and negative effects on the overall dose comparison to Hp(10). The International Commission on Radiation Units and Measurements (ICRU 1988) has indicated that film badge dosimeters, while not tissue equivalent, can be used for personnel dosimetry. They also indicate that it is more difficult to ensure that the variation in response with energy and angle of incidence with low energy. Given the voluminous uncertainties above especially with film badge dosimetry in the 1950-1980s, a claimant favorable approach is used to estimate organ dose. Since exposure to organ dose conversion factors result in a higher organ dose and higher probability of causation, given the Radiation Effective Factors of the intermediate energy photons, these DCFs will be used to convert recorded film badge doses to organ dose. In the conversion of all recorded photon and neutron doses to organ doses, the exposure geometry must also be given careful consideration. The proposed default options based on claimant-favorable exposure geometries for long-term workers are listed in Table F-7.
F.5.8 Parameter #2
Parameter #2 is the standard deviation of the normal distribution for the organ dose. The individual dose result for each dosimeter exchange period will be available to calculate the mean and standard deviation for each year. If not available, the adjusted organ dose can be used for each year and a default standard deviation value used for parameter #2.
Table F-7. Default exposure geometries for calculating organ dose.
Claim status Job
category Exposure geometry Percentagea
Non-compensable All A-P 100% Compensable worker All A-P
Rotational 50% 50%
Compensable supervisor All A-P Isotropic
50% 50%
a. Apply this percentage to the dose conversion factor in Appendix B of NIOSH (2002) to arrive at the total organ dose equivalent from the adjusted recorded dose.

Effective Date: 11/19/2003 Revision No. 00 Document No. ORAUT-TKBS-0014-6 Page 47 of 47
F.5.9 Organ Dose Conversion Factors
A detailed discussion of the conversion of measured dose to organ dose equivalent is provided in Appendix A of NIOSH (2002). Appendix B of NIOSH (2002) contains the appropriate dose conversion factors (DCFs) for each organ, radiation type, and energy range based on the type of monitoring performed. In some cases, simplifying assumptions are appropriate.