Embed Size (px)
Citation preview

2011Orange County
C O M M U N I T Y I N D I C A T O R S
2011The Community Indicators Report provides
readers with an inside look at the overall well-
being of the Orange County community – track-
ing business climate, health, education, public
safety, and the status of our valuable natural
environment. Over the years, we have learned
how quickly conditions can change. For exam-
ple, we have experienced the gamut of eco-
nomic realities – from boom to bust. This year,
the impact of the extended economic recession
is reflected in nearly every indicator related to
Orange County’s business climate.
Thankfully, recovery appears to be on the hori-
zon. However, it will take time and hard work
for businesses, local governments, and non-
profit organizations to regain fiscal health. Pub-
lic finance issues in particular loom large, with
budgets strained to the breaking point, creat-
ing considerable momentum at the local, state
and national levels in the realignment and re-
form of governmental finance, service delivery,
and pension obligations.
In addition to Orange County’s economic
health, residents’ physical health and general
wellbeing play an integral role in the overall
status of the county. This year’s special feature
provides an in-depth look at the wellbeing of
our residents – from their ability to access the
basic necessities of life, to health status and out-
look for the future. Broadly speaking, Orange
County residents fare well compared to the
state and nation. But a closer look reveals ex-
treme disparities.
Understanding where we have been helps lead
the way forward. Creative solutions to our
current challenges require everything from pre-
ventive action to community leadership. It is our
hope that this report offers the context and per-
spective of Orange County’s unique history and
culture. But most of all, we hope it provides in-
spiration as we strive to meet the needs of our
changing population in an ever-changing
world. On behalf of the Children and Families
Commission of Orange County, the County of
Orange, and the Orange County Business Coun-
cil, we welcome your feedback and look for-
ward to working together as we address these
future challenges.
Michael M. Ruane
Project Director

T A B L E O F C O N T E N T S
Wellbeing Index
Business ClimateTourism-Related Spending and JobsWorld TradeCost of LivingPer Capita IncomeEmployment by Industry ClustersHousing DemandHousing AffordabilityRental Affordability MobilityTransit
High-Tech Growth and DiversityInternet AccessVenture Capital and Patent GrantsTechnology Workforce PreparationTechnology-Related Degrees
Career PreparationEducational AttainmentCollege ReadinessAcademic PerformanceEnglish Learners
Prenatal CareLeading Causes of Death for Children Under FiveVaccine-Preventable Disease and Immunization Rates Pediatric Asthma Overweight and ObesityChild Care Quality and AffordabilityFamily Income SecurityFamily Housing SecurityHealth Insurance Coverage Wellbeing of Older AdultsMental HealthSubstance AbuseHealth Status
Family SafetyJuvenile CrimeCrime RateGang-Related CrimeHate Crime
Renewable EnergySustainable Transportation PracticesGreen JobsCoastal Water QualitySolid and Household Hazardous WasteAir QualityWater Use and Supply
Voter Participation Census ParticipationNonprofits
Data for at least one element of this indicator is updated every two years or more.
IntroductionCounty Profile
Special Feature
Economic and Business Climate
Technology and Innovation
Education
Community Health and Prosperity
Public Safety
Environment
Civic Engagement
Acknowledgements and Sources
23
12
1617181920212223242526
2829303132
3435363738
40414243444546474849505152
5455565758
60616263646566
686970
72

The purpose of the Orange County Community Indicators report is to inform and inspirecommunity members, policymakers, and business leaders working to make Orange County
the best it can be. Released annually since 2000, the report tracks key countywide trends that allow residents to evaluate the critical factors which contribute to sustaining communityvitality, as well as a healthy economy, environment, and populace.
Securing a Prosperous Orange County: Now and in the Future The data in the Orange County Community Indicators report allows community members to ask whether a certain practice or trend is sustainable. In other words, are we investing in the future? To invest, we must make deci-sions that help our community thrive today, and foster and maintain Orange County’s vitality into the future.Otherwise, we are leaving it up to future generations to pay the costs and consequences of our decisions. The issueswe face are complex and interrelated. By investing wisely, communities and individuals alike can provide for a sustainable and successful place for us, our children, and our children’s children to call home.
Ensuring Relevant Measurement: Indicator Selection CriteriaGood indicators are objective measurements that reflect how a community is doing. They reveal whether key com-munity attributes are improving, worsening, or remaining constant. The indicators selected for inclusion in thisreport: • Reflect broad countywide interests which impact a significant percentage of the population• Illustrate fundamental factors that underlie long-term regional health• Can be easily understood and accepted by the community• Are statistically measurable and contain data that is both reliable and available over the long-term• Measure outcomes, rather than inputs whenever possible• Fall within the categories of the economy, technology, education, community health and prosperity, public
safety, environment, and civic engagement
Placing Orange County in Context: Peer RegionsTo place Orange County’s performance in context, many indicators compare the county to the state, nation or otherregions. We compare ourselves to our neighbors to better understand our position within the Southern Californiaregion and to “peer” regions, both within California and nationwide. Peer regions are considered economic com-petitors or good barometers for comparison due to the many characteristics we have in common. Each section ofthe report includes slightly different peer regions based on the characteristics considered relevant to that topic.
As one of the largest counties in the country with both urban and suburban qualities, Orange County is similar toother large metro areas. These areas may consist of single counties as Orange County does, but in most casesinclude a collection of counties or local jurisdictions. For example, the San Jose metro area includes both SantaClara and San Benito counties. When “San Jose” is referenced, it typically includes data for both counties, but whencounty-only data was used for comparative analysis, “Santa Clara County” is used to represent that region.
Since the manner in which data is collected and reported varies among data sources, the boundaries of our peersvary as well. Whenever possible, metro areas or divisions, as defined by the U.S. Office of Management and Budgetwere used. In other instances, the county boundary or some other boundary defined by the data source was used.For additional information regarding the boundaries used for a particular measure, please [email protected].
2 INTRODUCTION 2011
Introduction

County Profile
RiversideCounty
San BernardinoCounty
Los AngelesCounty
San DiegoCounty
Orange County is located in Southern California, withLos Angeles County to the north, San Diego County tothe south, and Riverside and San Bernardino countiesto the east. There are currently 34 cities within thecounty and several unincorporated areas.
Orange County

POPULATIONGrowthOrange County is the third largest county in California:• With a population of 3,166,461 in January 2010, Orange County falls behind Los Angeles (10,441,080) and San Diego
(3,224,432) counties.1
• Orange County is the sixth largest county in the nation, with more residents than 22 of the country’s states, includingMississippi, Kansas, New Hampshire, and Alaska.2
• At its peak, Orange County’s population increased rapidly – an average of 22% per year in the 1950s and 10% per year in the1960s.
• The average annual increase slowed considerably to 1.8% between 1990 and 2000.• Between 2009 and 2010, population growth was only 1% per year.3
• Orange County ranks fifth out of more than 3,000 counties nationwide in terms of the number of people added between 2008and 2009.
• However, Orange County’s already high base population combined with slowing growth places it 510th in the nation in termsof the percentage of change between 2008 and 2009.4
• The county’s population growth is projected to continue at an increasingly slower rate, reaching nearly four million by 2050.5
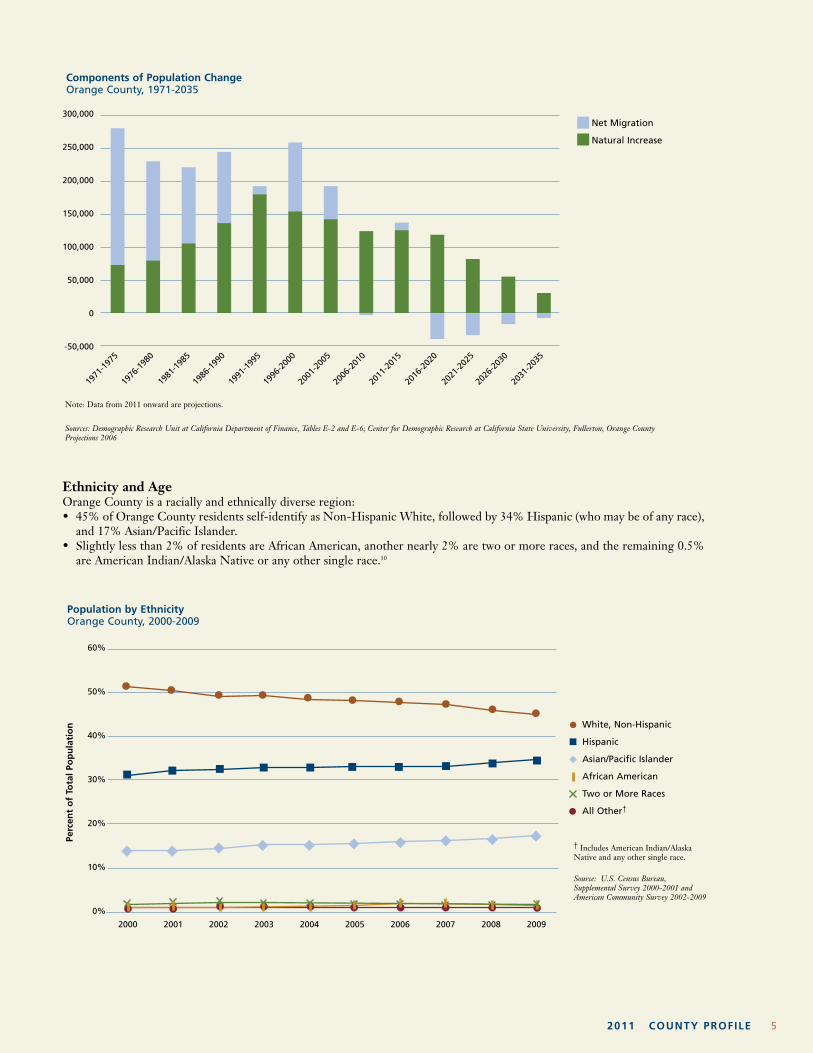
Components of Population ChangeSince the 1980s, natural increase (births minus deaths) has outpaced migration as the county’s principal source of growth:• From the 1950s through the 1970s, much of the county’s growth stemmed from migration into the county from within the
state as well as from other states (domestic migration).6
• International immigration – largely from Asia and Latin America – has also contributed to Orange County’s growth in thelast 30 years, shifting the county’s proportion of foreign-born residents from 6% in 1970 to 30% in 2009.7
• Between 2009 and 2010, Orange County added 22,442 residents through natural increase and 12,223 through internationalimmigration.
• At the same time, the county lost 6,475 residents through domestic out-migration, for a net migration increase of an estimat-ed 5,748.8
• Long-range projections suggest this pattern will continue, with natural increase becoming the sole contributor to growth.9
RiversideCounty
San Bernardino CountyLos AngelesCounty
San DiegoCounty
4 COUNTY PROFILE 2011
52011 COUNTY PROFILE
60%
50%
40%
30%
20%
10%
0%
Population by Ethnicity Orange County, 2000-2009
Percen
t of Total Po
pulation
2000 2001 2002 2003 2004 2005 2006 2007 2008 2009
White, Non-Hispanic
Hispanic
Asian/Pacific Islander
African American
Two or More Races
All Other†
† Includes American Indian/AlaskaNative and any other single race.
Source: U.S. Census Bureau,Supplemental Survey 2000-2001 andAmerican Community Survey 2002-2009
Note: Data from 2011 onward are projections.
Sources: Demographic Research Unit at California Department of Finance, Tables E-2 and E-6; Center for Demographic Research at California State University, Fullerton, Orange CountyProjections 2006
Ethnicity and AgeOrange County is a racially and ethnically diverse region:• 45% of Orange County residents self-identify as Non-Hispanic White, followed by 34% Hispanic (who may be of any race),
and 17% Asian/Pacific Islander.• Slightly less than 2% of residents are African American, another nearly 2% are two or more races, and the remaining 0.5%
are American Indian/Alaska Native or any other single race.10
300,000
250,000
200,000
150,000
100,000
50,000
0
-50,000
Components of Population ChangeOrange County, 1971-2035
1971
-197
5
1976
-198
0
1981
-198
5
1986
-199
0
1991
-199
5
1996
-200
0
2001
-200
5
2006
-201
0
2011
-201
5
2016
-202
0
2021
-202
5
2026
-203
0
2031
-203
5
Net Migration
Natural Increase

6 COUNTY PROFILE 2011
Projected Change in Older Adult Population Comparedto All Ages, by Race/EthnicityOrange County, 2010-2030
300%
250%
200%
150%
100%
50%
0%
-50%
Source: State of California, Department of Finance, Population Projections forCalifornia and Its Counties 2000-2050, by Age, Gender and Race/Ethnicity,Sacramento, California
44%
-22%
152%
31%
173%
16%
260%
52%
94%
15%
White Asian Other Hispanic All Races/Ethnicities
65+ All Ages
In 2009, more than a third (30%) of the people living in Orange County were foreign born: • Among Orange County residents at least five years of age or older, 45% speak a language other than English at home. • Of those, the majority speak Spanish (60%) followed by Asian/Pacific Islander languages (28%), and other Indo-European
languages (9%). The remaining 2% speak some other language. • 22% of the total population report that they do not speak English "very well."11
In 2009, Orange County’s median age was 36 years:• 25% of the population was under 18 years and 11% were 65
years and older.12
• Projections from 2010 through 2030 anticipate a 94% increasein the older adult population, compared to a 15% increaseamong all ages.
• As a result, the proportion of the population that is 65 yearsand older will increase from a projected 11% in 2010 to 22%percent in 2050.13
The trend toward an increase in the older adult population hasalready begun:• Between 2004 and 2008, there was an increase in the number
of residents over age 45. • At the same time, the number of 35- to 44-year-old residents
declined, a trend that is thought to be linked to these residentsseeking less expensive home prices inland.
• Although the number of teens and young adults ages 15 to 34increased, there were far fewer children and youth under age15 in 2009 compared to 2005.14
<5
5-14
15-24
25-34
35-44
45-54
55-59
60-64
65-74
75-84
85+
Population by AgeOrange County, 2005 and 2009
Age Ran
ge
Population
0 100,000 200,000 300,000 400,000 500,000 600,000
2009
2005
Source: U.S. Census Bureau,American Community Survey,2005 and 2009
72011 COUNTY PROFILE
EMPLOYMENTOrange County enjoys a diverse economy, with economic output and employment well-distributed among sectors:• After shrinking from mid-2009 to early-2010, Orange County’s total civilian labor force has mostly remained above 1.6 mil-
lion throughout the remainder of 2010, similar to the size of the labor pool from 2006 through mid-2009. • Non-farm industry accounts for 99.8% of the total labor force. • As of December 2010, the largest labor markets included Trade, Transportation and Utilities (18%), Professional and
Business Services (18%), and Leisure and Hospitality (13%).15
Small businesses flourish in Orange County’s entrepreneurial climate:• In 2009, fewer Orange County residents worked in large firms of 500+ employees (15%) than the statewide average (21%). • Larger firms witnessed the most significant employment losses between 2004 and 2009 (-33% among firms with 500+
employees). • At the same time, small firms with fewer than 20 employees only witnessed a 2% decline in employment.16
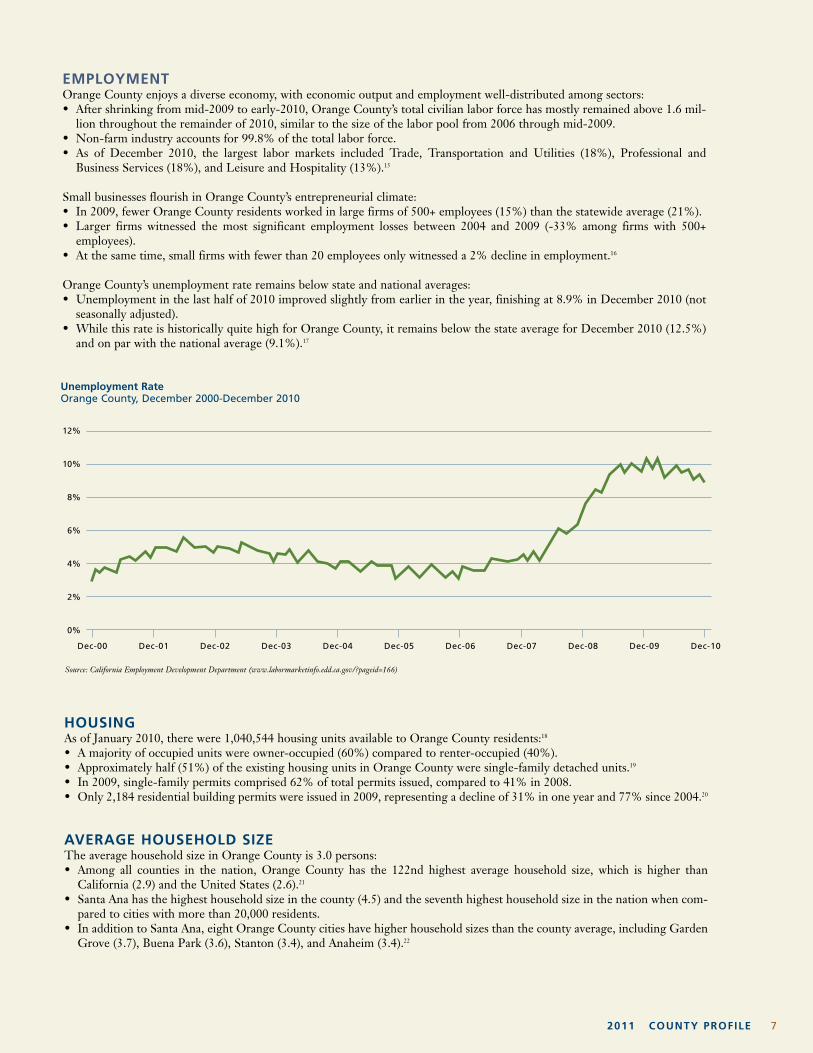
Orange County’s unemployment rate remains below state and national averages:• Unemployment in the last half of 2010 improved slightly from earlier in the year, finishing at 8.9% in December 2010 (not
seasonally adjusted). • While this rate is historically quite high for Orange County, it remains below the state average for December 2010 (12.5%)
and on par with the national average (9.1%).17
HOUSINGAs of January 2010, there were 1,040,544 housing units available to Orange County residents:18
• A majority of occupied units were owner-occupied (60%) compared to renter-occupied (40%).• Approximately half (51%) of the existing housing units in Orange County were single-family detached units.19
• In 2009, single-family permits comprised 62% of total permits issued, compared to 41% in 2008. • Only 2,184 residential building permits were issued in 2009, representing a decline of 31% in one year and 77% since 2004.20
AVERAGE HOUSEHOLD SIZEThe average household size in Orange County is 3.0 persons:• Among all counties in the nation, Orange County has the 122nd highest average household size, which is higher than
California (2.9) and the United States (2.6).21
• Santa Ana has the highest household size in the county (4.5) and the seventh highest household size in the nation when com-pared to cities with more than 20,000 residents.
• In addition to Santa Ana, eight Orange County cities have higher household sizes than the county average, including GardenGrove (3.7), Buena Park (3.6), Stanton (3.4), and Anaheim (3.4).22
12%
10%
8%
6%
4%
2%
0%
Unemployment RateOrange County, December 2000-December 2010
Dec-00 Dec-01 Dec-02 Dec-03 Dec-04 Dec-05 Dec-06 Dec-07 Dec-08 Dec-09 Dec-10
Source: California Employment Development Department (www.labormarketinfo.edd.ca.gov/?pageid=166)

8 COUNTY PROFILE 2011
LAND USEOrange County covers 798 square miles of land, including 42miles of coastline:• A substantial portion (28%) of the county’s land is devoted to
various types of residential housing. • More than a quarter (28%) of the county’s land is classified
“Governmental/Public,” including open space and parks. • Transportation infrastructure (e.g. roads, rails) accounts for
12% of county land, followed by 11% devoted to commercialand industrial uses.
• About one-tenth of county land is classified as “Uncommitted,”meaning it is either vacant or there is no data available.27
Land Use by CategoryOrange County, 2010
ResidentialGovernmental/PublicTransportationCommercial and IndustrialAgriculturalUncommitted
28%
28%12%
11%
11%
10%
Source: County of Orange Public Works
DENSITYCensus 2000 data show Orange County is one of the most dense-ly populated areas in the United States, falling 18th among allcounties in the nation:23
• As of January 2010, Orange County’s population density wasestimated at 3,967 persons per square mile, an increase of 10%since 2000.24
• Unlike Orange County, many otherwise urbanized peer coun-ties (such as San Diego and Los Angeles) have large amounts ofundeveloped, rural land which reduce their overall density.
• When comparing Orange County to the cities within our peerregions, Orange County is the ninth densest area.
• In comparison to large urban areas across the country (such ascities, townships, boroughs, and other county subdivisions),Orange County ranks 299th.25
• Densities vary by location among Orange County’s incorporat-ed areas, from a low of 2,132 in Seal Beach to a high of 13,105in Santa Ana.
• Population density is much lower in unincorporated areas (434persons per square mile).26
16 1 San Francisco, CA 16,63432 2 Boston, MA 12,16682 3 Los Angeles, CA 7,877
103 4 Minneapolis, MN 6,970110 5 Seattle, WA 6,717168 6 San Jose, CA 5,118233 7 Sacramento, CA 4,189279 8 San Diego, CA 3,772299 9 Orange County, CA 3,606313 10 Dallas, TX 3,470340 11 Riverside, CA 3,267363 12 San Bernardino, CA 3,152435 13 Phoenix, AZ 2,782465 14 Austin, TX 2,610
Rank out of all U.S.
Urban Areas
Rank outof Selected
Peers
Population Density RankingRegional Comparison, 2000
Persons perSquareMile of
Land AreaCity
Note: U.S. rank includes cities, boroughs, townships, and other county subdivisionswith population over 50,000.
Source: U.S. Census Bureau, GCT-PH1-R: Population, Housing Units, Area, and Density,Census 2000
Accolades for Regional Parks and TrailsRegional parks and trails received numerous local and national accolades in 2010. In The Orange County Register’s annual list-ing, eight regional parks and/or trails received a “Best of Orange County” designation (www.ocregister.com/sections/bestofoc/). Four regional park programs attracted national attention, receiving awards for excellence or innovation from theNational Association of Counties or National Association of County Park and Recreation Officials: • Caspers Wilderness Park 2010 Adventure Day • Second Sundays Habitat Restoration Program • Clark Regional Park Interpretive Center • Habitat Improvement Program at Limestone Canyon To learn more about these programs or other natural and historical resources within Orange County, visit www.ocparks.com.

92011 COUNTY PROFILE
$600
$500
$400
$300
$200
$100
$0
Gross Metro ProductRegional Comparison, 2008
In Billions
$527
.1
Los A
ngeles
$310
.8
San Fr
ancis
co
$281
.3
Dalla
s
$192
.4
Min
neapolis
$190
.7
Orange County
$189
.0
Seat
tle
$187
.4
Phoen
ix
$169
.3
San D
iego
San Jo
se
Boston
Riversi
de/
San B
ernar
dino
$146
.7
$142
.8
$113
.1
$93.
7
Sacr
amen
to
$80.
1
Austin
Source: U.S. Conference of Mayors,U.S. Metro Economies, Pace ofEconomic Recovery: GMP and Jobs,January 2010(www.usmayors.org/metroeconomies/)
STATE AND LOCAL FINANCESThe County of Orange General Fund receives the lowest share of property tax dollars compared to all counties in the state ofCalifornia:• In Orange County, the largest share of all property taxes supports public schools (47%). • The next largest proportion goes to Orange County cities, which share 19% of the typical property tax dollar. • The County of Orange receives substantially less of the typical property tax dollar (13%) than peers such as San Francisco
County (71%) and Los Angeles County (24%). • Of the 13% received by the County of Orange, 12% goes to the County of Orange General Fund and 1% is earmarked for
the Orange County Public Libraries.29
GROSS METRO PRODUCTIf Orange County were a country, its gross metro product (GMP) in 2008 would rank 45th in the world:• This is greater than such nations as Singapore, Ukraine, Algeria, and Chile. • Within the United States, Orange County is the 15th top producing economy in the nation. • Orange County’s GMP ranks fifth among 12 peer regions compared.• Between 1998 and 2003, Orange County’s GMP growth rate was faster than the state and nation, yet in the last five years
(between 2003 and 2008) GMP growth has slowed.• Still, over the past 10 years, Orange County’s GMP growth rate (75%) has outpaced the state (69%) and nation (70%).28
100%
90%
80%
70%
60%
50%
40%
30%
20%
10%
0%
Gross Metro Product, Five-Year Growth RatesOrange County, California, and United States, 1998-2003 and 2003-2008
42%
36%
29%24% 24%
31%
Growth 1998-2003 Growth 2003-2008
Orange County
California
United States
Source: U.S. Conference of Mayors, U.S. MetroEconomies, Pace of Economic Recovery: GMP and Jobs,January 2010 (www.usmayors.org/metroeconomies/)

California Department of Finance, Demographic Research Unit, Table E-1 (www.dof.ca.gov/research/demographic/reports/view.php)U.S. Census Bureau, Population Estimates Program, Resident Population Estimates for the 100 Largest U.S. Counties Based on July 1, 2009 Population Estimates: April 1, 2000 to July1, 2009 (CO-EST2009-07) (www.census.gov/popest/counties/CO-EST2009-07.html); U.S. Census Bureau, Population Estimates Program, Annual Estimates of the Resident Populationfor the United States, Regions, States, and Puerto Rico: April 1, 2000 to July 1, 2009 (NST-EST2009-01) (www.census.gov/popest/states/NST-ann-est.html)U.S. Census Bureau and California Department of Finance as reported by Center for Demographic Research, California State University, Fullerton, Orange County Progress Report2010 (www.fullerton.edu/cdr)U.S. Census Bureau, CO-EST2009-ALLDATA (www.census.gov/popest/datasets.html)California Department of Finance, Table P-3: Population Projections by Race/Ethnicity, Gender and Age for California and its Counties 2000-2050Center for Demographic Research, California State University, Fullerton, Orange County Projections 2006Center for Demographic Research, California State University, Fullerton, Orange County Projections 2006; U.S. Census Bureau, 2009 American Community Survey(http://factfinder2.census.gov/main.html)California Department of Finance, Tables E-2 & E-6Center for Demographic Research, California State University, Fullerton, Orange County Projections 2006U.S. Census Bureau, 2009 American Community SurveyU.S. Census Bureau, 2009 American Community SurveyU.S. Census Bureau, 2009 American Community SurveyCalifornia Department of Finance, Population Projections for California and its Counties 2000-2050, by Age, Gender and Race/Ethnicity, Sacramento, California, July 2007U.S. Census Bureau, 2005 and 2009 American Community SurveyEmployment Development Department, Employment by Industry Data for Orange County (www.labormarketinfo.edd.ca.gov/?pageid=166)Employment Development Department, Size of Business Data, 2001-Present (www.labormarketinfo.edd.ca.gov/?PAGEID=138) California Employment Development Department (www.labormarketinfo.edd.ca.gov/?pageid=166) and (www.labormarketinfo.edd.ca.gov/?pageid=1006)California Department of Finance, Table E-5U.S. Census Bureau, 2009 American Community SurveyCenter for Demographic Research, California State University, Fullerton, Orange County Progress Report 2010, page 196U.S. Census Bureau, 2005-2009 American Community Survey Five-Year EstimatesU.S. Census Bureau, 2007-2009 American Community Survey Three-Year Estimates Geographic Ranking Tables. Note: only selected cities with population over 20,000 are included inthe ranking.U.S. Census Bureau, Census 2000, Table GCT-PH1-R. Population, Housing Units, Area, and Density2010 density calculated from land area data presented in the Orange County Progress Report 2010 by the Center for Demographic Research, California State University, Fullerton, andCalifornia Department of Finance, Table E-1, January 1, 2010 population figures. Growth since 2000 calculated using U.S. Census Bureau 2000, U.S. Census Bureau, Census 2000, TableGCT-PH1-R. Population, Housing Units, Area, and Density U.S. Census Bureau, Census 2000, Table GCT-PH1-R. Population, Housing Units, Area, and DensityCalculated from land area data presented in the Orange County Progress Report 2010 by the Center for Demographic Research, California State University, Fullerton, and CaliforniaDepartment of Finance, Table E-1, January 1, 2010 population figuresCounty of Orange Public WorksU.S. Conference of Mayors, U.S. Metro Economies, Pace of Economic Recovery: GMP and Jobs, January 2010 (www.usmayors.org/metroeconomies/) County of Orange, County Executive Office, Orange County Facts & Figures 2010 (http://bos.ocgov.com/finance/ff2010/pages_frm.asp?OPT=facts_full)PublicCEO, Moody's Begins Treating Pension Liabilities like Bond Debt, by Ed Mendel, February 3, 2011 (http://publicceo.com)Wall Street Journal, April 27, 2010 (http://online.wsj.com/article/SB10001424052702303695604575181983634524348.html)PublicCEO, Moody's Begins Treating Pension Liabilities like Bond Debt, by Ed Mendel, February 3, 2011Wall Street Journal, April 27, 2010
10 COUNTY PROFILE 2011
12
3
4567
8910111213141516171819202122
2324
2526
27282930313233
100%
90%
80%
70%
60%
50%
40%
30%
20%
10%
0%
Where the Typical Property Tax Dollar GoesOrange County, 2009/10
Schools, 47%
Cities, 19%
County, 13%
Special Districts, 11%
Community Redevelopment Agencies, 10%
Note: The “County” percentage includes 12% to the County of OrangeGeneral Fund and 1% to the Orange County Public Libraries.
Source: County of Orange, County Executive Office, County Facts & Figures, 2010(http://bos.ocgov.com/finance/ff2010/pages_frm.asp?OPT=facts_full)
80%
70%
60%
50%
40%
30%
20%
10%
0%
Percent of Each Dollar of Property Tax Collected that Remains in the County General FundCounty Comparison, 2009/10
71%
24% 23% 21%18%
12%
San Fr
ancis
co
Los A
ngeles
Orange County
San B
ernar
dino
San D
iego
Santa
Cla
ra
Source: County of Orange, County Executive Office, County Facts & Figures, 2010(http://bos.ocgov.com/finance/ff2010/pages_frm.asp?OPT=facts_full)
CalPERS, CalSTRS, and the University of California Retirement System – the state public pension programs – reported steepshortfalls: • As of June 2009, the pensions reported a combined $91.5 billion in unfunded obligations.30
• A 2010 Stanford University study suggests that the figure could be even higher, nearly $500 billion, if more strict accounting methods are applied.31
• The credit-rating agency, Moody’s, reports California's combined bond and unfunded pension debt is 162.6% of annual state revenue, ranking it 19th highest in the nation.32
• In 2010, $5.5 billion was diverted from other programs such as higher education and parks to cover the shortfall in California'sretiree pension and health-care benefits.
• Without reform, some estimates suggest this figure will grow to over $15 billion in the next 10 years with effects felt through-out California, including Orange County.33

Special Feature

Description of IndicatorThis indicator measures the wellbeing of Orange County residents. Using the Gallup-Healthways Well-Being Index, more than 7,100Orange County residents were surveyed regarding a variety of topics including access to basic needs, physical health, healthy behav-iors and an evaluation of their current status and outlook toward the future.1 The results are presented in a “telescoping” format inwhich Orange County is compared outward to the state and nation, as well as inward by congressional districts within the county.
Why is it Important?Studies show that individuals with higher levels of wellbeing take fewer sick days, have lower health care costs, and display greaterengagement at work and in their communities. Higher community wellbeing is also associated with lower unemployment and pover-ty, and greater literacy rates. Several of the conditions that determine wellbeing, such as healthy behaviors and access to basic needs,can be influenced by preventive measures and community leadership.
How is Orange County Doing?In 2010, Orange County’s wellbeing scores ranked higher than thestate and the nation: • Orange County ranked 70.4 on the Composite Index, compared to
a score of 67.0 for both California and the United States.• On each of the six sub-indices, Orange County also scored higher
than both California and the United States.
12 SPECIAL FEATURE 2011
WELLBEING INDEX
Residents Fare Well Overall; Local Disparities Exist
Through a total of 55 questions, results of the Gallup-Healthways Well-Being survey are grouped into six sub-indices or areas of inter-est. The responses are also compiled into one overall Composite Score, which is an average of the six sub-indices. While descriptionsare provided for each sub-index that was measured in the study, the focus of this special feature is primarily on the areas of BasicAccess, Physical Health, and Healthy Behaviors.
What it Measures
Health care, community satisfaction, and whether or not residents have money for basic necessi-ties. Respondents were asked about personal safety, access to clean water, medicine, dentists anddoctors, and affordable food and shelter.
Health conditions, lifestyles, and related outcomes. Questions inquired about minor illness, useof sick days and chronic diseases (including asthma and obesity).
Incidences of smoking, healthy eating and regular exercise.
How residents evaluate their current status and outlook for the future based on a ranking ofzero at the bottom to 10 at the top.
Feelings regarding enjoyment, happiness, worry and sadness, as well as stress management andclinical depression.
Levels of job satisfaction and work environment.
Sub-Index/Area of Interest
Basic Access
Physical Health
Healthy Behaviors
Life Evaluation
Emotional Health
Work Environment
Orange County California United States
Gallup Well-Being Index Scores Composite and Sub-IndiciesOrange County, California, and United States, 2010
Composite Score
Basic
Acces
s
Phys
ical H
ealth
Emotio
nal H
ealth
Health
y Beh
avio
rs
Life
Eval
uatio
n
Work
Envir
onmen
t
90
80
70
60
50
40
30
20
10
0
Source: Gallup-Healthways Well-Being Index, 2010
1 Gallup-Healthways surveys 1,000 residents daily across the United States. Survey results forOrange County residents were obtained as a subset of the national data set for analysis in thisindicator. Interviews were conducted between January and November 2010.

Orange County as the 51st StateTo gain a better understanding of the significance of thevarious index scores, Orange County can be comparedwith our nation’s 50 states as if it were the 51st state.When ranked in this manner, Orange County falls in thetop 10 in five of the six sub-indices: • Orange County would rank second, only trailing the
state of Hawaii, in the Composite Well-Being Index.• For Physical Health, Orange County would rank first
– higher than all 50 states.• For Healthy Behaviors, Orange County would rank
second.• Orange County’s lowest ranking among the states
would be for Basic Access at 15th.
Basic Access IndexOrange County respondents indicated significantly high-er levels of satisfaction with where they live than thosethroughout California and the United States:• More Orange County residents have health insurance
than in the state, but fewer than have it than in thenation.
• In the last 12 months, more Orange County residentsvisited the dentist compared to both the state andnation.
• Compared to the state and nation, more OrangeCounty respondents believe their cities are gettingbetter, and feel safe walking alone at night.
Physical Health IndexOrange County scored better than the state and nationon several components of the Physical Health Index:• Orange County respondents reported less high blood
pressure, obesity, diabetes, and asthma than thosethroughout the state and nation.
• Fewer Orange County residents report high choles-terol and cancer diagnoses than the nation, but morethan the state.
Healthy Behaviors IndexOrange County roughly mirrors California and nation-wide scores on the Healthy Behaviors Index, with theexception of scores related to smoking:• About the same proportion of residents report eating
healthy foods and exercising as the state and nationalaverages.
• However, notably fewer Orange County residentssmoke compared with those throughout the state andnation.
WELLBEING INDEX
132011 SPECIAL FEATURE
0% 20% 40% 60% 80% 100%
Basic Access IndexOrange County, California, and United States, 2010
Satisfied with City/Area
Have Health Insurance
Feel Safe Walking Alone at Night
Visited Dentist in Last 12 months
City Where you Live GettingBetter
Orange County California United States
0% 5% 10% 15% 20% 25% 30% 35%
Physical Health IndexOrange County, California, and United States, 2010
High Cholesterol
High Blood Pressure
Obesity (BMI=30+)
Diabetes
Asthma
Cancer Diagnosis
Orange County California United States
Percent of Respondents Reporting…
Percent of Respondents Reporting…
0% 10% 20% 30% 40% 50% 60% 70% 80% 90% 100%
Healthy Behaviors Index Orange County, California, and United States, 2010
Excercised 30 Minutesat Least 3 Days Last
Week
Ate 5 Servings of Fruitsand Vegetables at
Least 4 Days Last Week
Ate Healthy all Day
Do Not Smoke
Source: Gallup-Healthways Well-Being Index, 2010
Orange County California United States
Percent of Respondents Who…

CA-40 70 188 191 156
CA-42 7 54 104 33
CA-44 176 217 204 45
CA-46 15 19 70 25
CA-47 306 113 432 435
CA-48 5 3 5 9
Rank
Focusing Within Provides a Unique PerspectiveOn average, Orange County ranks favorably comparedto the state and nation. However, a deeper look with-in the county helps explain the 40% of residents whoreport they are struggling.
A review of Orange County’s congressional districtsshows wide disparities:• Among California’s 435 congressional districts,
Orange County has districts that scored at bothextremes on the Composite Well-Being Index.
• One congressional district ranks at the top of theComposite Well-being Index in second place (CA-48), while another ranks at the bottom at 430th(CA-47).
Similar disparities are evident within the sub-indices:• Congressional District 48 ranks in the top 10 for
Basic Access, Physical Health, Healthy Behaviors,and Life Evaluation.
• In contrast, Congressional District 47 ranks lastamong all California districts for Life Evaluationand 432nd for Healthy Behaviors.
Orange County Congressional District Basic Access Physical Health Healthy Behaviors Life Evaluation
Orange County Congressional District Ranking by Sub-Index, 2009
WELLBEING INDEX
SPECIAL FEATURE 201114
Orange CountyCongressional
District
CA-48
CA-46
CA-42
CA-40
CA-44
CA-47
Communities
Aliso Viejo, Dana Point, Irvine, Laguna Beach,Laguna Hills, Laguna Niguel, Laguna Woods,Lake Forest, Newport Beach, San JuanCapistrano, Santa Ana, Tustin, Foothill Ranch,Portola Hills, San Joaquin Hills, Tustin Foothill,Newport Coast
Costa Mesa, Fountain Valley, Garden Grove,Huntington Beach, Santa Ana, Seal Beach,Westminster
Anaheim, Brea, La Habra, Mission Viejo, RanchoSanta Margarita, Yorba Linda, Las Flores
Anaheim, Buena Park, Cypress, Fullerton, GardenGrove, La Palma, Los Alamitos, Orange, Placentia,Stanton, Villa Park, Westminster, Rossmoor
San Clemente, San Juan Capistrano, Coto deCaza, Las Flores
Anaheim, Fullerton, Garden Grove, Santa Ana
Composite Well-Being IndexRanking out of
435 Districts
2
15
25
94
169
430
Source: Gallup-Healthways Well-Being Index, 2009
1-109 Top 25%
110-218
219-327
328-435 Bottom 25%

Economic andBusiness Climate
The impact of the extended economic recession is reflected in nearly every indicatorrelated to Orange County’s business climate. Per capitaincome and growth declined along withemployment in most sectors, while the costs of living anddoing business remained high among peers. However,continued growth in world trade andincreased visitor spending provide brightspots in a continually challenging economic landscape.
NATIONAL PEERS
Austin, Boston, Dallas, Minneapolis, Seattle
CALIFORNIA PEERS
San Francisco, San Jose
NEIGHBORS
Los Angeles, Riverside/San Bernardino, San Diego

16 ECONOMIC AND BUSINESS CLIMATE 2011
BUSINESS CLIMATE
1
20
40
60
80
100
120
140
160
180
200
Best Places for Business RankingOrange County, 2001-2010
Ran
king (1 Best, 200 W
orst)
2001 2002 2003 2004 2005 2006 2007 2008 2009 2010
Best Places for Business RankingRegional Comparison, 2006-2010
RankCrime Rate1 15Culture and Leisure2 22Educational Attainment3 28Economic Growth (Projected)4 30Colleges5 34Income Growth6 41Job Growth (Projected)7 71Subprime Mortgages8 130Job Growth9 164Net Migration10 172Cost of Doing Business11 177Cost of Living12 197Overall 79
1 Crimes per 100,000 residents2 Index based on museums, theaters, golf course, sports teams, and other activities3 Share of population over age 25 with a bachelor’s degree or higher4 3-year annualized figure5 Measure of 4-year colleges in area with extra credit for highly-rated schools6 5-year annualized figure7 3-year annualized figure8 As a percent of total originations between 2006 and 20089 5-year annualized figure10 5-year annualized figure11 Index based on cost of labor, energy, taxes, and office space12 Index based on cost of housing, utilities, transportation, and other expenditures
Best Places for Business Ranking, by ComponentOrange County, 2010
Source: Forbes magazine, April 13, 2010 (www.forbes.com)
Source: Forbes magazine, April 13, 2010 (www.forbes.com)
Note: Through 2005, the ranking was out of 150 metro areas. In 2006,the ranking was expanded to include 200 metro areas.
Source: Forbes magazine, March 25, 2009 (www.forbes.com)
Business Climate Ranking ReboundsDescription of IndicatorThis indicator measures Orange County’s business climate through Forbes magazine’s “2010 Best Places for Business” regional rankings.The Forbes ranking compares metropolitan regions using multiple topics including: cost of doing business, number of colleges, cost of liv-ing, crime rate, culture and leisure amenities, educational attainment, income growth, job growth, and net migration.
Why is it Important?A region’s business climate reflects its attractiveness as a location, the availability of business support and resources, opportunities forgrowth, and barriers to doing business. Since businesses provide jobs, sales tax revenue, economic growth, and entrepreneurship oppor-tunities, a strong business climate is important for maintaining Orange County’s economic health and quality of life.
How is Orange County Doing?Orange County’s ranking increased significantly in 2010:• Forbes’ 2010 national rankings placed Orange County 79th out of the 200 metro areas ranked.• This spot marks an increase of 28 places from the previous year. • Within California, only San Francisco and San Jose ranked higher at 38th and 48th, respectively.• Among peers outside of California, Orange County is outranked by Austin, Seattle, Dallas, Minneapolis, and Boston.• Orange County’s peak ranking was 27th in 2005. • Orange County ranks well in crime rate, culture and leisure, educational attainment, and projected economic and income growth;
but poorly in the cost of doing business, cost of living, and job growth.
2006 2007 2008 2009 2010Austin 28 66 47 8 10Seattle 101 62 20 17 18Dallas 25 111 93 32 26San Francisco 167 175 166 127 38San Jose 166 183 174 115 48Minneapolis 71 106 103 76 57Boston 94 142 160 90 67Orange County 58 70 92 107 79Riverside/San Bernardino 133 110 78 94 88San Diego 61 92 106 104 89Los Angeles 147 159 154 180 120
Lowest Rank Highest Rank200-161 160-121 120-81 80-41 40-1
Bottom 40 Top 40
11 10
72
4027
5870
92107
79

TOURISM-RELATED SPENDING AND JOBS
172011 ECONOMIC AND BUSINESS CLIMATE
Description of IndicatorThis indicator measures visitor spending on accommodations, food, recreation, retail products, and travel arrangements, as well as taxrevenue generated within the county by visitor spending. It also tracks travel industry employment trends.
Why is it Important?Visitors traveling to Orange County for recreation and business generate revenue and jobs for the local economy. Tourism is one ofthe leading industries in Orange County, accounting for 10% of the county’s employment (see Employment by Industry Clusters).Hotels, shops, restaurants, and entertainment venues rely on the tourism market for a significant percentage of their business.Moreover, Orange County benefits from tax revenue generated by visitor spending.
How is Orange County Doing?Overall spending and tax receipts rose:• Spending by visitors to Orange County totaled
$8.55 billion in 2008, up from $8.46 billion in 2007.• In 2008, Orange County tourism generated $544
million in taxes – compared to $542 million in 2007and $527 million in 2006.
• Tourism-related tax receipts increased for all coun-ties compared except Santa Clara, which remainedthe same.
• Orange County ranks fifth among California peersin terms of growth in visitor spending.
• However, the average annual growth rate hasdeclined from 5.6% between 2003 and 2007 to4.1% between 2004 and 2008.
Tourism-related jobs declined:• The average number of tourism-related jobs in
Orange County decreased by nearly 6,000 jobs in2009 to 154,764.
• Workers employed in the tourism arena are amongthe lowest paid in Orange County with an averageannual salary of approximately $20,000 (see Employment by Industry Clusters).
• Employment at restaurants and eateries comprise the greatest proportion of tourism-related jobs (69%), followed by hotels andaccomodations (15%), and amusement and theme parks (13%).
Visitor Spending Up; Growth Rate Slows
Visitor Spending by CountyAverage Annual Growth Rate, 2004-2008
San Fr
ancis
co
Santa
Cla
ra
Los A
ngeles
San B
ernar
dino
Orange County
Riversi
de
San D
iego
7%
6%
5%
4%
3%
2%
1%
0%
Percen
t Annual Growth Rate
Tourism-Related Tax ReceiptsCounty Comparison, 2008
$1,374
$683$584 $544
$352$266 $218
Los A
ngeles
San D
iego
San Fr
ancis
co
Orange County
Riversi
de
Santa
Cla
ra
San B
ernar
dino
$1,400
$1,200
$1,000
$800
$600
$400
$200
$0
In M
illions
Source: California Division of Tourism, California Travel Impacts by County, Dean Runyan Associates (http://tourism.visitcalifornia.com)
Source: California Division of Tourism, California Travel Impacts by County, Dean Runyan Associates(http://tourism.visitcalifornia.com)
Tourism-Related EmploymentOrange County, 2000-2009
132,
180
140,
514
142,
105
141,
496
148,
000
149,
259
152,
893
156,
184
160,
691
154,
764
180,000
160,000
140,000
120,000
100,000
80,000
60,000
40,000
20,000
0
Number of Jobs
Source: California Employment Development Department
4.0% 4.0%
6.1% 6.0%5.4%
4.9%
4.1%
2000 2001 2002 2003 2004 2005 2006 2007 2008 2009

18 ECONOMIC AND BUSINESS CLIMATE 2011
WORLD TRADE
Upward Trend in International Trade ContinuesDescription of IndicatorThis indicator measures the change in dollarvalue of Orange County exports. These meas-ures include exports by destination compared topeer regions, as well as the leading exports bytype of commodity.
Why is it Important?The ability to access foreign markets is impor-tant for a strong and growing local economy.Trade agreements like the North American FreeTrade Agreement (NAFTA) and subsequentagreements with individual countries continueto open new markets for Orange County busi-nesses. The county’s location on the PacificRim, proximity to the Long Beach and SanPedro ports, and large population of Spanishand Asian language speakers make us well posi-tioned for international trade.
How is Orange County Doing?Exports from Orange County have trendedupward since 2002:• In 2008, exports from Orange County were
$19.7 billion, compared to $17.9 billion in2007.
• Preliminary estimates suggest a 25% drop inOrange County’s 2009 exports; however, arebound is expected in 2010 data.
• In 2008, Orange County’s largest single-country export destinations included Canada($2.71 billion), Mexico ($2.33 billion), Japan($1.78 billion), China ($1.75 billion), andSouth Korea ($1.01 billion).
• Transportation equipment, computer andelectronic products, chemicals, machinery,petroleum and coal products, and food werethe top exports to those countries.
Source: California State University, Fullerton, Institute for Economic and Environmental Studies
Exports by SectorOrange County, 2008
Food
Petro
leum
and
Coal P
roduct
s
Mac
hiner
y
Chemica
ls
Misc
ella
neous
Compute
r and
Elec
tronics
Pro
ducts
Export Value (in Billions)
Tran
sporta
tion
Equip
men
t
$0.82 $0.98 $1.16 $1.26$1.39
$3.61
$4.51
Note: Data is derived from a new report which uses different methodology for estimating export volumes. As such,figures have been updated and are not directly comparable to previous Community Indicators reports.
Total Orange County Exports Worldwide, 1999-2008
2005
2006
2007
2008
1999
2000
$25
$20
$15
$10
$5
$0
Export Value (in Billions)
2001
2002
2003
$13.4$15.8
$17.9 $19.7
$10.1$11.9
$10.4 $9.5$10.7
2004
$11.8
51%
Source: California State University, Fullerton, Institute for Economic and Environmental Studies
Source: California State University, Fullerton, Institute for Economic and Environmental Studies
Exports by CountryOrange County, 2008
Canada
Mexico
China
Japan
South Korea
Rest of the World
12%
9%
9%
5%
14%
$5.0
$4.5
$4.0
$3.5
$3.0
$2.5
$2.0
$1.5
$1.0
$0.5
$0.0

COST OF LIVING
192011 ECONOMIC AND BUSINESS CLIMATE
Cost of Living Still High Among Peers
Description of IndicatorThis indicator uses a cost of living index to compare prices of housing, consumer goods, and services for Orange County and peermetropolitan regions. The weighted index compares local market prices in the following areas:
• Housing (28%) • Groceries (13%)• Utilities (10%) • Transportation (10%)• Health care costs (4%) • Miscellaneous items (35%)
The average for all metro areas equals 100 and each area’s individual index is read as a percentage of the average for all places.
Why is it Important?A high cost of living relative to peer markets can make Orange County less attractive as a destination for businesses and workers.In addition, businesses already operating in Orange County may opt to relocate or expand elsewhere. Current residents – particularly young workers – may decide to move to more affordable areas.
How is Orange County Doing?In the second quarter of 2010:• Orange County’s cost of living ranked the third highest among peer regions,
which are among the highest of the 300 metro areas analyzed in the index. • San Francisco and San Jose were the only markets more expensive. • With 100.0 being average, Orange County measured 146.5 on the index,
down from 148.8 in 2009. • Overall cost of living decreased in all regions compared except Austin.• Orange County’s cost of living measures for groceries, utilities, transporta-
tion, and miscellaneous items tended to rank in the middle among peers, buthigh housing costs significantly affected the index, continuing to makeOrange County’s score among the highest.
300
250
200
150
100
50
0
Cost of Living Index, by ComponentRegional Comparison, 2nd Quarter 2010
San Francisco
San Jose
Orange County
Los Angeles
San Diego
Boston
Seattle
Riverside/San Bernardino
Austin
Dallas
Housing Groceries Transportation Health Miscellaneous Utilities
San Francisco 162.1San Jose 154.1Orange County 146.5Los Angeles 138.4San Diego 133.2Boston 131.5Seattle 122.0Riverside/San Bernardino 112.1Austin 96.2Dallas 91.5
Cost of Living IndexRegional Comparison, 2nd Quarter 2010
Location Total Index Value
Source: Council for Community and Economic Research (www.c2er.org/)
Source: Council for Community and Economic Research (www.c2er.org/)

20 ECONOMIC AND BUSINESS CLIMATE 2011
PER CAPITA INCOME
Per Capita Income Average Annual Percent ChangeRegional Comparison, 1999-2008
4.6%
4.4%
4.3%
4.3%
4.1%
3.6%
3.5%
3.5%
3.1%
3.0%
2.0%
San D
iego
Los A
ngeles
Orange County
Boston
San Fr
ancis
co
Seat
tle
Riversi
de/
San B
ernar
dino
California (4.1%) United States (4.0%)
San Jo
se
Dalla
s
Austin
Min
neapolis
6%
5%
4%
3%
2%
1%
0%
Source: U.S. Bureau of Economic Analysis (www.bea.gov)
Source: Milken Institute (www.milkeninstitute.com)
Source: U.S. Bureau of Economic Analysis (www.bea.gov)
Note: The U.S. Bureau of Economic Analysis refines and updates their data each year.Thus, these figures have been updated from previous Community Indicators reports.
Per Capita IncomeRegional Comparison, 2008
$62,
598
$58,
531
$55,
187
$53,
999
$51,
894
$47,
653
$46,
649
$43,
458
$42,
265
$37,
362
$30,
634
San Fr
ancis
co
San Jo
se
Boston
Seat
tle
Orange County
Min
neapolis
Dalla
s
California ($41,805) United States ($38,615)
Los A
ngeles
Austin
Riversi
de/
San B
ernar
dino
San D
iego
$70,000
$60,000
$50,000
$40,000
$30,000
$20,000
$10,000
$0
Source: U.S. Bureau of Economic Analysis (www.bea.gov)
Per Capita Income and Income Growth Decline
Orange County California United States
$60,000
$50,000
$40,000
$30,000
$20,000
$10,000
$0
1999 2000 2001 2002 2003 2004 2005 2006 2007 2008
Per Capita IncomeOrange County, California, and United States, 1999-2008
Description of IndicatorThis indicator measures per capita income levels and incomegrowth. Total personal income includes wages and salaries, propri-etor income, property income, and transfer payments such as pensions and unemployment insurance. Figures are not adjusted forinflation.
Why is it Important?A high per capita income for county residents is crucial in the context of the county’s high housing costs. In addition, a higher relative per capita income signals greater discretionary income forthe purchase of goods and services.
How is Orange County Doing?Orange County’s per capita income is down: • In 2008, per capita income was $51,894 – down 0.2% from
$52,009 in 2007.• At the same time, the inflation rate for 2008 was 3.8%.• This nominal decrease in per capita income, combined with the
inflation rate increase, resulted in a substantial loss in realincome.
• When compared to peer and neighboring markets, OrangeCounty has the fifth highest per capita income, trailing San Jose,San Francisco, Boston, and Seattle.
• Per capita income decreased for all regions compared.• Between 1999 and 2008, Orange County posted a per capita
average annual income growth of 4.3%.• With the exception of San Diego and Los Angeles, this rate is still
greater than all peer regions compared, but it is down from the previous 10-year average annual growth of 5.0%.
In a ranking of 200 large metro areas, Orange County ranked121st in five-year salary growth (2003-2008) and 170th in one-year salary growth (2007-2008).

Description of IndicatorThis indicator shows employment and salaries in 10 majorOrange County industry clusters. The clusters were chosen toreflect the diversity of Orange County employment, major economic drivers within the county, and important industrysectors for workforce development. Approximately 40% of allOrange County jobs can be found in the 10 clusters describedin this indicator.
Why is it Important?Employment change within specific clusters illustrates howOrange County’s economy is evolving. Tracking salary levels bycluster shows whether these jobs can provide a wage highenough for workers to afford to live in Orange County.
How is Orange County Doing?Between 2008 and 2009, employment grew in only two ofOrange County’s 10 major industry clusters:• Communications employment grew by 6.3%, while Health
Services employment grew by 1.4%. • All other clusters experienced declines in employment with
the biggest losses in Construction (15.3%) and ComputerHardware (12.5%).
Five of the 10 major Orange County industry clusters experi-enced salary increases between 2008 and 2009: • The largest salary increases were in Defense and Aerospace
(8.4%) and Biomedical (3.9%). • Three of the five clusters experiencing wage growth had
growth of less than 2%.• As presented in the Housing Affordability indicator, the
annual income needed to purchase a median-priced home inOrange County is $84,700 – affordable to only the top-pay-ing cluster, Defense and Aerospace.
Tourism is the industry cluster with the largest employment inOrange County:• Between 2008 and 2009, Tourism experienced employment
declines of 3.7%.• Tourism is the lowest paying cluster, with wages declining by
1.3% in 2009.
EMPLOYMENT BY INDUSTRY CLUSTERS
212011 ECONOMIC AND BUSINESS CLIMATE
2009 Change 2008-09Defense and Aerospace $91,183 8.4%Computer Software $82,771 -3.5%Biomedical $74,114 3.9%Computer Hardware $72,356 -0.6%Communications $66,185 -0.9%Energy and Environment $60,719 -0.8%Construction $57,371 1.5%Business and Professional Services $55,879 1.4%Health Services $49,521 1.0%Tourism $20,251 -1.3%
Source: Orange County Business Council analysis of data from the California EmploymentDevelopment Department
Average Annual Salaries in Selected ClustersOrange County, 2009
180,000
160,000
140,000
120,000
100,000
80,000
60,000
40,000
20,000
0
Employment in Selected ClustersOrange County, 2005-2009
Number of Jobs
Busines
s and
Profe
ssional
Serv
ices
Touris
m
Construct
ion
Health
Serv
ices
Biom
edica
l
Compute
r Har
dwar
e
Defen
se a
nd Aer
ospac
e
Compute
r Softw
are
Ener
gy and E
nvironm
ent
Comm
unicatio
ns
2005 2006 2007 2008 2009
Employment Declines in Most Industry Clusters
Source: Orange County Business Council analysis of data from the California Employment DevelopmentDepartment
Source: Milken Institute (www.milkeninstitute.com)
In a ranking of 200 large metro areas, Orange Countyranked 178th in five-year job growth (2004-2009) and 186thin one-year job growth (2008-2009).

Description of IndicatorThis indicator shows the ratio of new housing permits divided by new jobs created in Orange County compared with peer metro areasacross the state and the country.
Why is it Important?An adequate housing supply is essential for a community’s labor force. When an economy is growing, new housing is needed for theadditional workers employed. If the housing demand is unmet, it can drive up home prices and apartment rents beyond what is afford-able to many workers and residents.
How is Orange County Doing?Due to a significant decline in employment, the long-term housingshortage that has existed since the late-1990s has been reversed:• In 2009, employment dropped by 110,200 jobs, while 2,143 new
housing permits were granted. • The resulting ratio of –51.42 jobs (job losses) for every new hous-
ing permit leaves Orange County with the greatest negative ratioamong peers compared.
• Prior to 2007, Orange County’s significant job growth created asituation of too many jobs for houses permitted. Since then, joblosses have reversed this trend, resulting in a negative jobs-to-housing ratio for the last three years.
• Counting both new jobs and subsequent lost jobs, Orange Countyhas 6,600 fewer jobs than it did a decade ago.
• During the same time period, 79,166 new housing units were per-mitted.
• In other words, more housing units have been permitted than jobscreated since 2000. The resulting jobs-to-housing ratio for thedecade is -0.08. The standard “healthy” ratio of jobs to permits is1.5 jobs per housing unit.
• Job losses in 2009 resulted in a negative jobs-to-housing ratio in allmarkets, the state, and the nation.
Job Losses Reverse Housing Supply Shortage
22 ECONOMIC AND BUSINESS CLIMATE 2011
HOUSING DEMAND
Austin 8,758 -17,600 -2.01Dallas 21,349 -109,200 -5.11United States 582,963 -5,870,000 -10.07Boston 5,476 -59,100 -10.79Seattle 7,419 -88,600 -11.94Riverside/San Bernardino 6,335 -91,900 -14.51Minneapolis 4,670 -83,400 -17.86San Diego 2,946 -69,100 -23.46San Francisco 5,952 -177,500 -29.82California 30,021 -902,100 -30.05Los Angeles 5,138 -241,300 -46.96Orange County 2,143 -110,200 -51.42
Sources: Hanley Wood Market Intelligence (www.hanleywood.com/hwmi); United StatesBureau of Labor Statistics (www.bls.gov)
Housing DemandRegional Comparison, 2009
HousingPermits
EmploymentChange(Jobs)
2008 to 2009
Ratio ofEmploymentChange to
Permits
180,000
160,000
140,000
120,000
100,000
80,000
60,000
40,000
20,000
0
-20,000
2000 2001 2002 2003 2004 2005 2006 2007 2008 2009
Cumulative Change in Employment and Housing Permits (2000 Baseline)Orange County, 2000-2009
Housing Permits Employment Change
10.0
0.0
-10.0
-20.0
-30.0
-40.0
-50.0
-60.0
New Jobs Created per Housing Permit Granted Orange County, California, and United States, 2005-2009
Jobs Created
per Housing Permit Granted
2005 2006 2007 2008 2009
Orange County California United States
Sources: Hanley Wood Market Intelligence (www.hanleywood.com/hwmi); United States Bureau ofLabor Statistics (www.bls.gov)
Sources: Hanley Wood Market Intelligence (www.hanleywood.com/hwmi); United States Bureau ofLabor Statistics (www.bls.gov)

Orange CountyLos Angeles Riverside
San BernardinoSan Diego
HOUSING AFFORDABILITY
Housing Affordability Doubles Since 2007Description of IndicatorThis indicator measures the value and change in value of themedian-priced existing single-family detached home. It uses theCalifornia Association of Realtors Housing Affordability Indexto measure the percentage of Orange County households thatcan afford the existing median-priced single-family detachedhome in the county.
Why is it Important?High relative housing prices adversely impact businesses’ abilityto attract and retain workers. A shortage of affordable housing,particularly for first-time buyers, discourages young workersfrom moving to or remaining in Orange County. In addition, alack of affordable housing results in longer commutes, leading toincreased traffic congestion and pollution, decreased productivi-ty and diminished quality of life. Homeownership increases sta-bility for families and communities and for many, can providelong-term financial benefits that renting cannot.
How is Orange County Doing?Orange County’s single-family median home sale price is upsomewhat from 2009, but nowhere near the 2007 peak in hous-ing prices: • In July 2010, the median sale price of an existing single-
family detached home in Orange County was $514,180, up 2.8% since July 2009.
• Orange County’s median housing prices peaked in April 2007at $747,260, followed by the low of $423,100 in January 2009.
• As of July 2010, Orange County’s median price is approxi-mately $200,000 more than the state median price for a comparable home.
Housing affordability is approximately the same as in 2009: • The minimum household income needed to purchase a
median priced single-family home in Orange County isapproximately $84,700.1
• Second quarter 2010 results indicate 54% of households inOrange County could afford an existing single-familydetached home that was priced at 85% of median (or$437,100).
• This is compared with housing affordability of 53% in 2009,41% in 2008, and only 23% in 2007.
• Orange County’s affordability rate is lower than all peers compared.
• Neighboring Riverside and San Bernardino counties remainmore affordable with rates of 75% and 81%, respectively.
232011 ECONOMIC AND BUSINESS CLIMATE
100%
90%
80%
70%
60%
50%
40%
30%
20%
10%
0%
2006 2007 2008 2009 2010
Housing Affordability IndexCounty Comparison, 2006-2010
Source: California Association of Realtors
Percen
t Able to Afford M
edian-Priced Home
Income Needed to Afford Median-Priced Home Compared to Typical Salaries Orange County, 2007-2010
2007 2008 2009 2010
$120,000
$100,000
$80,000
$60,000
$40,000
$20,000
$0
Sources: Orange County Business Council analysis of California Association of Realtors data;California Employment Development Department (www.edd.ca.gov)
Elementary School TeacherNurseComputer Programer
ArchitectCivil EngineerAnnual Income Needed
$101,550
$78,100 $72,600$84,700
1 The California Association of Realtors defines the parameters for the First-TimeBuyer Housing Affordability Index. In 2010, these parameters were 10% down and4.09% adjustable interest rate.

$12.84
Retail Salesperson
24 ECONOMIC AND BUSINESS CLIMATE 2011
RENTAL AFFORDABILITY
Rental Housing Remains More Expensive than Most PeersDescription of IndicatorThis indicator measures the Housing Wage – the hourly wage a resident needs to afford “Fair Market Rent” (the median rent in theOrange County market).
Why is it Important?Lack of affordable rental housing can lead to crowding and household stress. Less affordable rental housing also restricts the ability ofrenters to save for a down payment on a home, limiting their ability to eventually realize the long-term advantages of home-ownership.Ultimately, a shortage of affordable housing for renters can instigate a cycle of poverty.
How is Orange County Doing?Orange County’s Housing Wage decreased in 2011: • The hourly wage needed to afford a one-bedroom unit decreased from $25.69 in 2010 to $25.52 in 2011. The Housing Wage is
equivalent to an annual income of $53,080.• The hourly wages needed to afford two- and three-bedroom apartments also decreased.• Orange County has the third highest Housing Wage (less affordable housing) compared to peer metro areas.
Hourly Wage Needed to Afford a One-BedroomUnit Compared to Typical Hourly WagesOrange County, 2011
$12.30$14.31
Janitor FactoryWorker
$30
$25
$20
$15
$10
$5
$0
Typical Hourly Wage Hourly Wage Needed
$25.52
Sources: Orange County Business Council analysis of US Department of Housing and Urban Development FairMarket Rent (www.huduser.org) using the methodology of the National Low Income Housing Coalition(www.nlihc.org); California Employment Development Department (www.edd.ca.gov)
Note: The Housing Wagedata in this indicatorreflects 2011 Fair MarketRent as reported by theU.S. Department ofHousing and UrbanDevelopment (HUD).
Hourly Wage Needed to Afford Fair Market RentRegional Comparison, 2011
Min
neapolis
Dalla
s
Seat
tle
Austin
Riversi
de/
San B
ernar
dino
Los A
ngeles
Boston
Orange County
San D
iego
San Jo
se
San Fr
ancis
co
One Bedroom
Two Bedroom
Three Bedroom
$14.
63 $17.
77 $23.
27
$14.
58 $17.
62 $22.
92
$18.
65 $22.
00$3
0.96
$15.
21 $18.
52$2
4.92
$18.
79 $22.
62$3
1.96
$22.
56$2
8.17
$37.
83
$22.
10 $25.
95$3
1.02
$25.
52$3
0.46
$43.
10
$22.
10$2
7.04
$38.
44
$27.
24 $32.
73$4
7.06
$28.
17$3
5.25
$47.
06
$50
$45
$40
$35
$30
$25
$20
$15
$10
$5
$0
2010 2011
Fair Market Rent (Monthly)
One Bedroom $1,336 $1,327
Two Bedroom $1,594 $1,584
Three Bedroom $2,256 $2,241
Amount a Household Earning Minimum Wage Can Afford to Pay in Rent (Monthly) $416 $416
Number of Hours per Week a Minimum Wage Earner Must Work to Afford a One-Bedroom Apartment 131 130
Renting in Orange County

MOBILITY
Less Congestion on Freeways
252011 ECONOMIC AND BUSINESS CLIMATE
Minutes
35
30
25
20
15
10
5
0
Average Commute Time to Work in MinutesRegional Comparison, 2009
Riversi
de/
San B
ernar
dino
Los A
ngeles
San Fr
ancis
co
Boston
Seat
tle
Dalla
s
Orange County
Austin
Min
neapolis
San Jo
se
San D
iego
Source: U.S. Census Bureau, American Community Survey 2009 (www.census.gov)
Source: U.S. Census Bureau, Census 2000, Supplementary Survey 2001, AmericanCommunity Survey 2002-2009 (www.census.gov)
27.228
.6
26.3
25.9
24.9
24.3
24.1
23.9
28.6
28.430
.0
1 Congestion is defined as a condition lasting for 15 minutes or longerwhere travel demand exceeds freeway capacity and vehicular speeds are 35miles per hour or less during peak commute times.
Primary Mode of Travel to WorkOrange County, 2000-2009
100%
90%
80%
70%
60%
50%
40%
30%
20%
10%
0%2000 2001 2002 2003 2004 2005 2006 2007 2008 2009
Drive Alone
Carpool
Public Transportation
Work at Home
Description of IndicatorThis indicator includes commute times, residents’ primarymode of travel to work, and hours of delay due to conges-tion on Orange County freeways.
Why is it Important?Long commutes impact personal lives and worker produc-tivity due to the time lost in transit. Tracking commutertrends and transportation system demand helps gauge theease with which residents, workers, and goods can movewithin the county.
How is Orange County Doing?Orange County commute times remain the same: • In 2009, the average commute time to work for Orange
County residents remained relatively unchanged at 25.9minutes, compared to 26.0 minutes in 2008.
• Austin, San Jose, Minneapolis, and San Diego have lowercommute times among peers compared.
Primary travel modes have varied little over the past decade:• Most Orange County commuters continue to drive alone
(78.1% in 2009, up from 76.8% in 2008).• Although the number of Orange County commuters who
drive alone has remained largely unchanged since 2000,the 2009 rate is slightly higher than the average for thepast decade.
• Carpooling – the second most common mode of travel towork – dropped to 9.9% in 2009 compared to 11.2% in2008.
• In 2009, 4.9% of people worked at home, up from 4.7%in 2008.
• The number of people using public transportationdropped slightly in 2009 to 2.9%, compared to 3.3% in2008.
Vehicle delays declined significantly:• In 2008, there were 69,857 daily hours of vehicle delay
due to freeway congestion in Orange County, the lowestlevel since 2002.1
• Between 2007 and 2008, there was a difference of 28,939daily hours of vehicle delay.
• A sustained increase in fuel prices, the economic reces-sion, and the completion of freeway improvement proj-ects are likely responsible for this sharp decline in hoursof vehicle delay.
Source: Caltrans, State Highway Congestion Monitoring Program (www.dot.ca.gov)
Daily Hours of Vehicle DelayOrange County, 1999-2008
78,7
96
71,2
86
66,5
22
71,3
76 83,0
02 96,5
22
97,5
81
98,6
40
98,7
96
69,8
57
2005
2006 20
0720
0819
9920
00
120,000
100,000
80,000
60,000
40,000
20,000
0
2001
2002
2003
2004

Description of IndicatorThis indicator measures ridership and operatingcosts for Orange County’s bus system, as well asridership on the commuter rail system.
Why is it Important?The ability of residents and workers to moveefficiently within Orange County is important toour quality of life and a prosperous business cli-mate. An effective public transit system is essen-tial for individuals who cannot afford, are unable,or choose not to drive a car.
How is Orange County Doing?Per capita bus boardings for Orange CountyTransportation Authority (OCTA) bus servicedeclined:• Bus boardings dropped in 2009/10 to 18 per
capita, compared to 22 per capita in 2008/09.• This is equivalent to a 22% decline in total bus
passenger boardings, from 68,768,740 in2008/09 to 53,364,753 in 2009/10.
• Orange County’s bus ridership per capita ishigher than San Jose, Dallas, San Bernardino,San Diego, and Riverside, but lower than allremaining peers compared.
• Orange County’s bus system operating costsare among the lowest when compared to trans-portation agencies in peer regions, with onlyAustin and Los Angeles having lower costs.
Ridership declined on Orange County’s com-muter rail lines for the second consecutive year: • The Orange County Line (between Oceanside
and downtown Los Angeles) dropped fromapproximately 1.84 million riders in 2008/09to 1.82 million riders in 2009/10.
• The Inland Empire Line (between SanBernardino and San Juan Capistrano) droppedfrom 1,217,956 to 1,081,257 riders during thesame period.
• The 91 Line (parallels State Route 91, linkingRiverside with Fullerton and downtown LosAngeles) dropped by approximately 34,000riders, bringing its total to 552,867 in 2009/10.
• In 2009/10, ridership dropped 5% to 3.4 mil-lion riders on all lines combined.
26 ECONOMIC AND BUSINESS CLIMATE 2011
TRANSIT
Regional Transportation System Boardings Cost per per Capita Boarding
Twin Cities Area Transportation Authority (Minneapolis) 55 $3.58
King County Department of Transportation, Metro Transit Division (Seattle) 50 $4.13
Los Angeles County Metropolitan Transportation Authority 38 $2.36
Massachusetts Bay Transportation Authority (Boston) 34 $3.33
Capital Metropolitan Transportation Authority (Austin) 28 $3.27
Orange County Transportation Authority 21 $3.30
Santa Clara Valley Transportation Authority (San Jose) 20 $5.69
Dallas Area Rapid Transit 18 $5.45
Omnitrans (San Bernardino) 9 $3.74
San Diego Metropolitan Transit System 7 $3.84
Riverside Transit Agency 3 $5.01
Bus System Boardings per Capita and Operating Costs per BoardingRegional Comparison, 2009
Source: Orange County Transportation Authority
4,500,000
4,000,000
3,500,000
3,000,000
2,500,000
2,000,000
1,500,000
1,000,000
500,000
0
Number of Commuter Rail Riders Orange County, Inland Empire/Orange County, and 91 Lines, 2001-2010
Bus and Rail Ridership Rates Decline
Source: Orange County Transportation Authority (www.octa.net)
Source: Federal Transit Administration, National Transit Database, 2009 (www.ntdprogram.gov)
Note: The Orange County Transportation Authority measures per capita bus boardings based on a fiscal yearwhereas the Federal Transit Administration measures on a calendar year. As such, per capita bus boardingcounts differ in the Orange County and regional comparison charts based on the data source.
OCTA Bus Passenger Boardings, 2001-2010
00/01 01/02 02/03 03/04 04/05 05/06 06/07 07/08 08/09 09/10
00/01 01/02 02/03 03/04 04/05 05/06 06/07 07/08 08/09 09/10
Boardings per Cap
ita
22
18
20
22 22 23 23
22
23
21
24
23
22
21
20
19
18
17
16
15

Technology and Innovation
The diversity of our high-tech industries continues to outperform most peer regions.Patent grants are on the rise along withtech-related degrees at Orange County universities. Almost half of Orange County high school students took Algebra or otherAdvanced Math courses critical to futurescience and engineering careers. Sustaining OrangeCounty’s high-tech stronghold will require a reversalof lackluster growth in high-tech outputand inconsistent venture capital.
NATIONAL PEERS
Austin, Boston, Dallas, Minneapolis, Seattle
CALIFORNIA PEERS
San Francisco, San Jose
NEIGHBORS
Los Angeles, Riverside/San Bernardino, San Diego

Description of IndicatorThis indicator measures how diversified our high-tech economy is relative to other metro areas in the country. It tallies all of the tech-nology sectors for which employment is more concentrated at the local level compared to the national average. A diversified technol-ogy sector will include concentrations in many high-tech employment clusters, so a larger number shows a more diversified technolo-gy employment base. Orange County’s ranking among economic peers in gross domestic product (GDP) growth within high-techindustries is also included.
Why is it Important?High-tech industries such as computer software programming, pharmaceuticals, or communications equipment development use a highdegree of advanced technology, science, and research in the creation or implementation of their primary goods and services. Whenhighly productive, these industries provide strong economic growth potential and higher than average wages. A diverse high-tech econ-omy attracts a broad range of skilled workers and professional services, and may help foster dynamic new ventures. A diverse high-techsector is also more resilient during unanticipated downturns than economies that are more reliant upon a particular industry.
How is Orange County Doing?Orange County is among the most diverse high-tech economies in the country: • The number of high-tech industries with an employment concentration above
the national average increased to 17 in 2009. • With the exception of Boston, Orange County tied or was higher than all
peers compared in its number of high-tech clusters above the national average.• Since 2003, Orange County’s cluster concentration has ranged from 15 to 18.
Orange County ranks poorly in terms of growth in high-tech output:• Orange County ranks 148th out of 200 large metro areas compared in terms
of high-tech GDP growth from 2004 to 2009.• Among peers compared during the same period, only Los Angeles had a lower
ranking for high-tech economic growth.
28 TECHNOLOGY AND INNOVATION 2011
HIGH-TECH GROWTH AND DIVERSITY
Diversity is Strong, but Tech GDP Growth Lags
High-Tech Cluster Diversification Regional Comparison, 2007-2009
Boston
Orange County
San D
iego
Dalla
s
San Fr
ancis
co
San Jo
se
Seat
tle
Min
neapolis
Los A
ngeles
Austin
Riversi
de/
San B
ernar
dino
Number of High-Tech Clusters
20
18
16
14
12
10
8
6
4
2
0
2007 2008 2009
Metro Area Rank
San Diego 36
Riverside/San Bernardino 38
Seattle 42
Austin 53
Dallas 73
San Jose 97
San Francisco 98
Boston 101
Minneapolis 123
Orange County 148
Los Angeles 149
Source: Milken Institute (www.milkeninstitute.org)
Source: Milken Institute (www.milkeninstitute.org)
High-Tech GDP Five-Year Growth RankingRegional Comparison, 2004-2009

INTERNET ACCESS
Internet Access Increases Slightly
292011 TECHNOLOGY AND INNOVATION
Description of IndicatorThis indicator measures the percentage of adults who haveaccess to the Internet either at home or work.
Why is it Important?The Internet has become an essential communications platform for work, education, social interaction, and govern-ment-related communication. Access to the Internet allowsresidents to tap into a wealth of information, resources, prod-ucts, and services. Increased access not only benefits residents,it also significantly expands the marketplace for the sale ofgoods and services by local businesses.
How is Orange County Doing?Orange County’s Internet access rate remains higher than theUnited States metro area average:• In 2009, Orange County’s Internet access rate for adults
was 79%, up from 77% in 2008.• While higher than Los Angeles, this rate of access is the
same or lower than all other peers compared.• Orange County’s rate of increase since 2002 roughly mir-
rors the rate of increase in the national metro area average.
Internet Access Among AdultsRegional Comparison, 2009
Los A
ngeles
U.S. Metro Area Average (75%)
Orange County
Min
neapolis
San D
iego
Boston
San Fr
ancis
co
Austin
Seat
tle
Dalla
s
70%
79%
79%
79%
79%
80%
81%
82%
82%
Note: Data for 2000 and 2001 are not available.
Source: Scarborough Research
Source: Scarborough Research
Percen
tage of Adults with Internet Access
100%
90%
80%
70%
60%
50%
40%
30%
20%
10%
0%
100%
90%
80%
70%
60%
50%
40%
30%
20%
10%
0%
Internet Access Among AdultsOrange County and United States, 1999-2009
1999 2000 2001 2002 2003 2004 2005 2006 2007 2008 2009
Orange County U.S. Metro Area Average
Wireless Usage GrowsAccording to the National Health Interview Survey, the num-ber of American homes that are replacing traditional land-lines with wireless telephones is growing rapidly. During thefirst half of 2010, over half (51%) of 25 to 29 year oldsreported living in homes with only cell phone service. For allage groups, more than one out of every four households(27%) had only cell phones, while one out of six homesreceived all or almost all calls on wireless telephones despitehaving access to a landline.
Source: Centers for Disease Control and Prevention (www.cdc.gov)

Description of IndicatorThis indicator measures Orange County businesses’ access to venture capital (financing for early-stage companies) by tracking invest-ment among metro areas. It also measures the number and growth of patent grants awarded to inventors.
Why is it Important?Innovation and the development of new technology are critical for a regional economy’s long-term viability. Venture capital facilitatesnew business growth and exploits new technologies. The number of patent grants awarded for county businesses and residents is a goodbarometer of both the ingenuity of the local workforce and businesses’ commitment to research and development.
How is Orange County Doing?Venture capital investment decreased in 2009, remainingbelow the 10-year average of $668 million:• Venture capital funding in 2009 was $298.2 million, com-
pared to $711.9 million in 2008.1
• However, investments for the first half of 2010 totaled$453.5 million, which is ahead of the pace of 2009.
• Top sectors receiving funding in the first half of 2010include medical devices ($107.6 million), industrial/ener-gy ($93.2 million), and semiconductors ($44.4 million).
• Orange County’s share of national venture capital isapproximately 2.0%.
Patent grants rose for the third year in a row:• In 2009, there were 2,231 patents granted to county
inventors – up from 2,205 in 2008 and 2,052 in 2007.• The number of patents awarded in 2009 increased for all
peers compared except Riverside/San Bernardino.• Patent grants to Orange County inventors grew by 21.4%
between 2005 and 2009 – a rate of growth that ranks onthe lower end of the mid-range among peers compared.
• In terms of patent density (patents per capita), OrangeCounty ranks in the middle among peers compared, with7.43 patents per 10,000 residents.
VENTURE CAPITAL AND PATENT GRANTS
Venture Capital Investment Mixed; Patent Grants Increase
60
50
40
30
20
10
0
Number of Patent Grants Awarded per 10,000 ResidentsRegional Comparison, 2009
56.4
San Jo
se
21.6
Seat
tle
16.2
Austin
10.7
Boston
7.4
Orange County
6.7
Min
neapolis
7.3
San D
iego
San Fr
ancis
co
Dalla
sLo
s Angel
esRive
rside/
San B
ernar
dino
Number of Patent Grants per 10,000
In M
illions
200%
180%
160%
140%
120%
100%
80%
60%
40%
20%
0%
Percent Change in Patent Grants Awarded Regional Comparison, 2005-2009
Seat
tle
San Fr
ancis
co
Austin
Boston
Min
neapolis
San Jo
se
San D
iego
Orange County
Los A
ngeles
Dalla
s
16.3
%
9.6%
4.0%
21.4
%
25.5
%
41.3
%
180.
2%
84.8
%
37.0
%
30.6
%
24.9
%Rive
rside/
San B
ernar
dino
30 TECHNOLOGY AND INNOVATION 2011
1 These figures have been updated from previous Community Indicators reports.
Source: United States Patent Office (www.uspto.gov)
$1,800
$1,600
$1,400
$1,200
$1,000
$800
$600
$400
$200
$0
Venture Capital InvestmentOrange County, 2000-2009
Source: PricewaterhouseCoopers/Thomson Venture Reuters/NVCA Moneytree Venture CapitalProfiles (http://vx.thomsonib.com/VxComponent/static/stats/2010q2/metro_2112.html)
2000 2001 2002 2003 2004 2005 2006 2007 2008 2009
0.82.2
5.0
5.1

TECHNOLOGY WORKFORCE PREPARATION
Advanced Science Test Scores Improve
312011 TECHNOLOGY AND INNOVATION
Description of IndicatorThis indicator measures the technological know-how of Orange County’sfuture workforce. It tracks the percent of high school students enrolled inan upper level math (Intermediate Algebra /Algebra II or other AdvancedMath) and/or science (first year Chemistry or Physics) course in the coun-ty’s public school districts; the percentage of 11th grade students whodemonstrate achievement in these courses by being “Advanced” or“Proficient”; the number of K-12 students per computer; and the numberof classrooms with Internet access.
Why is it Important?Computer, math, and science competency are critical in our knowledge-and computer-driven economy. Computer and Internet access are impor-tant instructional devices and provide students with indispensible researchtools. In addition, enrollment and achievement in upper level math andscience courses are required for UC/CSU entry, imparting the necessarybackground for many college level courses and technology-related jobs(see Technology-Related Degrees and Employment by Industry Clusters).
How is Orange County Doing?A significant percentage of Orange County students enroll in upper levelmath courses, while fewer participate in upper level science courses:1
• In 2008/09, approximately 47% of high school students enrolled inIntermediate Algebra/Algebra II, and 42% took other Advanced Mathcourses.
• 35% of high school students enrolled in first year Chemistry, while15% took first year Physics.
• The percentage of Hispanic high school students taking upper levelmath and science courses is less than the Orange County average.
Test scores among Orange County’s 11th grade students are mixed:• Between 2006 and 2010, the proportion of 11th grade students scoring
“Advanced” or “Proficient” in Chemistry increased from 34% to 42%. • During this same time period, the proportion of 11th grade students
scoring “Advanced” or “Proficient” in Physics increased from 54% to67%.
• In 2010, only 20% of 11th grade students scored “Advanced” or“Proficient” in Algebra.
• Since 2006, the percentage of students scoring “Advanced” or“Proficient” in Algebra increased from 18% to 20%.
The number of students per computer remained constant while Internetaccess improved:• In 2008/09, there were 4.4 students per computer in Orange County
schools, which was the same as the previous year but higher than thestate at 4.1.
• However, the number of students per computer improved 49%between 1999/00 and 2008/09.
• In 2008/09, the number of Orange County classrooms with Internetaccess increased 6% above 2007/08 levels, but is still 9% below thepeak in 2006/07.2
1 The California Department of Education revised its method for gathering thisdata and the categories of upper level math and science courses. Thus, this indi-cator includes data for 2008/09 only and it is not directly comparable with pre-vious Community Indicators reports.2 The number of classrooms with Internet access includes all classrooms andother instructional settings at the school (such as a computer lab, library, orcareer center) with an Internet connection. If a classroom has more than oneInternet connection, that classroom is still only counted once.
Upper Level Math and Science Course Enrollment asPercent of Grade 9-12 Enrollment, by Race/Ethnicity Orange County, 2008/09
Intermediate Algebra/
Algebra II
Other Advanced
Math Course
First Year Chemistry
First Year Physics
80%
70%
60%
50%
40%
30%
20%
10%
0%
Hispanic Asian
White Orange County Average (All Students)
41%
53%
50%
25%
51%
71%
27%
41% 46
%
7%19
%25
%
Percent of 11th Grade Students Scoring “Advanced” or“Proficient” in Math and Science TestingOrange County, 2006-2010
2006 2007 2008 2009 2010
70%
60%
50%
40%
30%
20%
10%
0%
47%42%
35%
15%
Algebra II Chemistry Physics
Source: California Department of Education (http://data1.cde.ca.gov/dataquest)

32 TECHNOLOGY AND INNOVATION 2011
TECHNOLOGY-RELATED DEGREES
Undergraduate Degrees Bounce Back Description of IndicatorThis indicator measures the number of tech-related degrees conferred by local universities.1
Why is it Important?Effective workforce development and training supports Orange County’s high-tech sector, nurtures our innovation economy, and con-tributes to our overall economic wellbeing. High-tech jobs provide good wages (see Employment by Industry Clusters) for employ-ees and an increasing number of local graduates with technical skills helps employers by reducing the need to recruit workers fromoutside the county.
How is Orange County Doing?In 2009, roughly 18% of total undergraduate degrees granted were tech-related:• After declining in 2008, the number of tech-related undergraduate degrees increased 8.5% in 2009 to 2,208. • Disciplines with the greatest growth since 2005 include Physical Sciences (26% gain) and Biological Sciences/Biology (24% gain). • Undergraduate degrees in Computer Sciences declined for the fifth consecutive year, while undergraduate degrees in Information
and Computer Sciences declined for the fourth year in a row.
Approximately 32% of total graduate degrees conferred in 2009 were tech-related:• In 2009, tech-related graduate degrees increased by approximately 10%.• Orange County universities awarded 892 tech-related graduate degrees in 2009.• Between 2005 and 2009, the number of Engineering degrees at the graduate level continued to increase with 50% growth, while
Computer Science-related graduate degrees posted 37% growth.
2005 2006 2007 2008 2009Biological Sciences 710 798 833 789 894Biology 125 108 139 115 140Engineering 504 518 518 525 530Information and Computer Sciences 478 288 269 190 178Computer Sciences 114 102 79 75 70Physical Sciences 273 307 380 338 388Other Sciences 4 4 17 3 8Total 2,208 2,125 2,261 2,035 2,208Note: “Other Sciences” includes food science.
Tech-Related Bachelor’s Degrees Conferred at Orange County Universities
2005 2006 2007 2008 2009Biological Sciences 60 54 63 88 70Biology 10 8 17 15 11Engineering 240 300 273 305 360Information and Computer Sciences 73 89 110 60 91Computer Sciences 85 129 120 115 126Physical Sciences 150 155 139 178 180Other Sciences 36 36 43 49 54Total 654 771 765 810 892Note: “Other Sciences” includes physical therapy and food science.
Sources: California State University, Fullerton; Chapman University; University of California, Irvine
Tech-Related Graduate Degrees Conferred at Orange County Universities
Number of Tech-Related Degrees GrantedOrange County, 2000-2009
2,500
2,000
1,500
1,000
500
02000 2001 2002 2003 2004 2005 2006 2007 2008 2009
Bachelor’s Degrees Graduate Degrees
1 Orange County universities that offer tech-related graduate and undergraduate degrees include California State University, Fullerton, ChapmanUniversity, and University of California, Irvine.
Sources: California State University, Fullerton; ChapmanUniversity; University of California, Irvine

Education
Test scores are rising, helping more school
districts meet their academic performance targets.
Orange County students have among the highestaverage SAT scores in California, and UC/CSU
eligibility remains above the 15-year average.
However, the high school dropout rate rosefor the third consecutive year, only two districts met the
No Child Left Behind benchmarks, and wideeducational disparities remain throughout
the county.
NATIONAL PEERS
Boston, Dallas, Minneapolis, Phoenix
CALIFORNIA PEERS
Sacramento, San Jose, San Francisco
NEIGHBORS
Los Angeles, Riverside/San Bernardino, San Diego

Description of IndicatorThis indicator aggregates and reports career technical education (CTE) data from the Orange County Regional OccupationalPrograms (ROP) and Orange County community colleges.
Why is it Important?Career technical education allows residents to acquire skills for spe-cialized jobs instead of (or in preparation for) obtaining a two- orfour-year degree. It provides opportunities for those reentering theworkforce, changing careers, or needing on-the-job skill upgrades.Ultimately, this indicator enables the community to assess the abilityof CTE providers to supply the local economy with a diverse andappropriately-trained labor force.
How is Orange County Doing?ROP and community colleges served fewer students: • In 2008/09, only 0.6% of all Orange County adults participated in
ROP. However, adults comprise 30% of total ROP enrollmentcountywide.
• Approximately 20% of all Orange County high school studentsparticipated in ROP in 2008/09, just under the five-year average of22%.
• Community college enrollment in 2009/10 dropped to the secondlowest level in the past 10 years. Still, 9% of all adult residents areenrolled in one of Orange County’s nine community colleges inany given semester.
Performance remained strong among CTE students:• 95% of 12th grade students enrolled in ROP graduated from high
school, while 81% of community college students received a credential, certificate, or degree.
• Within six months of graduating, 82% of ROP students wereplaced and 60% of those students obtained jobs related to theirfield of study.
• Within a year, 82% of community college students were placed.• On average, Orange County community college students exceeded
or met the state performance goals for skill attainment and place-ment rates, but not for completion.
• Placement rates in the two most popular community college con-centrations – Business and Management and Engineering andIndustrial Technologies – dropped, while the three next popularconcentrations – Health, Public and Protective Services, andCommercial Services – remained the same or improved slightly.
2004/05 2005/06 2006/07 2007/08 2008/09
34
Job Placement Remains Steady for Career Tech Students
EDUCATION 2011
CAREER PREPARATION
Note: “Placement” and “Job Related to Studies” include both high school and adult students.
Sources: Capistrano-Laguna, Coastline, Central County, and North County Regional OccupationalPrograms
Source: California Community Colleges, Chancellor’s Office, Vocational Education(https://misweb.cccco.edu/perkins/main.aspx)
100%
90%
80%
70%
60%
50%
40%
30%
20%
10%
0%
High Sc
hool
Graduat
ion R
ate
Regional Occupational Programs Student PerformanceOrange County, 2005-2009
Plac
emen
t in M
ilita
ry,
School o
r Job
Job R
elat
ed to
Studie
s
95%
89%
86%
96%
94%
82%
91%
78%
80%
82%
60%
58%
57%
67%
55%
Note: The core performance indicators are defined as follows: “Technical SkillAttainment” is earning a “C” grade or better; “Completion” is receiving a credential, certificate or degree; and “Placement” is finding employment, an apprenticeship, or joiningthe military.
100%
90%
80%
70%
60%
50%
40%
30%
20%
10%
0%
Tech
nical S
kill
Attain
men
t Rat
e
Community College CTE Student Performance Orange County, 2004-2008
Comple
tion R
ate
Plac
emen
t Rat
e
93%
94%
93%
90%
91%
87%
87%
88%
81%
81%
81%
82%
83%
83%
82%
2003/04 2004/05 2005/06 2006/07 2007/08
2007/08 State Performance Goals
Business and Management 1,461 70%Engineering and Industrial Technologies 1,303 88%Health 1,167 90%Public and Protective Services 867 91%Commercial Services 505 79%
Number ofStudents
PlacementRate
Placement Rate for Five Most Popular Community CollegeCareer Technical Concentrations Orange County, 2007/08
Source: California Community Colleges, Chancellor’s Office, Vocational Education(https://misweb.cccco.edu/perkins/main.aspx)

Description of IndicatorThis indicator measures the educational attainment of Orange County residents over age 25 compared to the state, nation, and peerregions. It also measures the percentage of public high school students who drop out annually, in total and by race/ethnicity.
Why is it Important?A high school diploma or college degree opens many careeropportunities that are closed to those without these achievements.Additionally, the education level of residents is evidence of thequality and diversity of our labor pool – an important factor forbusinesses looking to locate or expand in the region.
How is Orange County Doing?The high school dropout rate rose for the third consecutive year:• According to 2008/09 figures, 14.3% of Orange County stu-
dents drop out over the course of four years of high school,compared to 10.9% in 2007/08, and 10.0% in 2006/07.
• In spite of this increase, Orange County’s rate remains wellbelow California’s four-year dropout rate of 21.5%.
• Hispanic students comprise 41% of the high school studentbody, yet a disproportionate 65% of the dropout population.
Broad economic and educational disparities remain: • The county is home to more highly-educated residents as well
as more residents without a high school diploma than thenational average.
• In Laguna Beach and Newport Beach for example, nearly allresidents over age 25 have graduated from high school, com-pared to only half in Santa Ana.
• Countywide, the proportion of residents over age 25 withBachelor’s degrees remained steady at 35%.
• Orange County is above state and national averages forBachelor’s degrees, but in the mid-range among peers com-pared.
• In 2009, 83% of residents over age 25 had a high school diplo-ma or GED – exceeding the state average but still below thenational average.
352011 EDUCATION
EDUCATIONAL ATTAINMENT
High School Dropout Rate Trends Upward
Percen
tage of Grades 9-12
Enrollm
ent an
d Dropouts
Comparison of Racial/Ethnic Composition of Grades 9-12Enrollment and One-Year Dropout PopulationOrange County, 2008/09
100%
90%
80%
70%
60%
50%
40%
30%
20%
10%
0%
Source: California Department of Education, DataQuest (http://data1.cde.ca.gov/dataquest/)
Note: “Asian” includes students identified as Asian, Pacific Islander, and Filipino. “Other”includes all races and/or ethnicities not otherwise shown in this chart, as well as multipleor no response.
Enrollment Dropouts
Hispanic
White
Asian/Pacific Islander
Other
27,401
63,458
66,681
525
1,250
2,852
100%
90%
80%
70%
60%
50%
40%
30%
20%
10%
0%50%
45%
40%
35%
30%
25%
20%
15%
10%
5%
0%
Min
neapolis
Percent Over Age 25 Earning a High School Diploma/GED or Higher and Bachelor's Degree or HigherRegional Comparison, 2009
Boston
San Fr
ancis
co
Sacr
amen
to
San Jo
se
San D
iego
Phoen
ix
Orange County
Dalla
s
High School Graduate or Higher:RegionCalifornia (80%) United States (85%)
Bachelor’s Degree or Higher:RegionCalifornia (30%)United States (28%)
93%
38%
90%
41%
87%
30%
87%
44%
85%
43%
85%
35%
85%
27%
83%
35%
81%
32%
Riversi
de/
San B
ernar
dino
79%
19%
Los A
ngeles
76%
29%
Source: U.S. Census Bureau, American Community Survey, 2009 (http://factfinder.census.gov/)
4449,239
Four-Year Dropout Rate for Grades 9-12Orange County and California, 2007-2009
2006/07 2007/08 2008/09
Orange County
California
Source: CaliforniaDepartment ofEducation,DataQuest(http://data1.cde.ca.gov/dataquest/)
21.1%18.9% 21.5%
14.3%10.9%10.0%

Percent of Test-Takers Scoring 1,500 or Better:School District
Percent Tested:School District
Description of IndicatorThis indicator measures the number of public highschool graduates who have fulfilled minimum courserequirements to be eligible for admission to Universityof California (UC) or California State University(CSU) campuses. It also includes the percentage ofhigh school graduates taking the SAT and the percent-age of students scoring 1,500 or better.
Why is it Important?A college education is important for many jobs inOrange County. To gain entry to most four-year uni-versities, high school students must complete the nec-essary coursework and take standardized tests.
How is Orange County Doing?UC/CSU eligibility is above the 15-year average:• During the 2008/09 school year, 40% of Orange
County students completed the necessary course-work to be UC or CSU eligible, compared to 35%statewide.
• While UC/CSU eligibility has fluctuated over thepast 15 years, the average eligibility rate is 38%.
Overall, SAT test-taking and scores are strong:• At 1,600, Orange County trails only the San Jose
metro area for the highest average SAT scoreamong California peers compared.
• 62% of Orange County test-takers scored above1,500 points, which is higher than the Californiaaverage of 49%.
• In recent years, there has been a slight decline inthe proportion of students tested, countered by aslight increase in the proportion of test-takers scor-ing 1,500 or better.
Throughout the county, there are wide disparities inSAT test-taking, SAT scores, and UC/CSU eligibility: • In Irvine Unified School District, 83% of students
scored above 1,500 on the SAT, compared to 28%in Santa Ana Unified School District.
• Asian students are the most likely to be UC/CSUeligible (61%), but comprise only 19% of all highschool graduates.
• Hispanic students are the least likely to beUC/CSU eligible (24%), but comprise 35% of allhigh school graduates.
• However, eligibility among Hispanic students hasimproved 5% annually since 2000, compared to nochange among White students, and 1% averageannual improvement among Asian students.
36 EDUCATION 2011
COLLEGE READINESS
College Eligibility and SAT Scores Remain Steady
Note: The highest score possible is 2,400.
Source: California Department of Education, DataQuest (http://data1.cde.ca.gov/dataquest/)
Note: “Asian” includes students identified asAsian, Pacific Islander, and Filipino. “Other”includes all races and/or ethnicities not other-wise shown in this chart, as well as multiple orno response.
16,000
14,000
12,000
10,000
8,000
6,000
4,000
2,000
0
100%
90%
80%
70%
60%
50%
40%
30%
20%
10%
0%
Percent of High School Graduates Eligible for UC/CSU Compared to Number of Graduates, by Race/EthnicityOrange County, 2008/09
Number of Graduates
Percen
t UC/CSU
Elig
ible
Asian
Other
White
Hispan
ic
Africa
n Am
erica
n
Number of Graduates:
by Race/Ethnicity
Percent UC/CSU Eligible:
by Race/Ethnicity
Orange County (40%)
California (35%)
6,62
3
61%
710
46%
14,7
21
44%
24%
12,1
62
657 27
%
Percent of 12th Grade Students Taking the SAT and Scoring 1,500 or Better, by DistrictOrange County, 2008/09
Irvine Unified
Laguna Beach Unified
Los Alamitos Unified
Placentia-Yorba Linda Unified
Saddleback Valley Unified
Capistrano Unified
Brea-Olinda Unified
Huntington Beach Union High
Tustin Unified
Orange Unified
Orange County Average
Fullerton Joint Union High
Newport-Mesa Unified
Garden Grove Unified
California Average
Anaheim Union High
Santa Ana Unified
0% 10% 20% 30% 40% 50% 60% 70% 80% 90% 100%

Description of IndicatorThis indicator summarizes academic performanceof K-12 public schools and districts as determinedby the California Department of Education (CDE)and the federal No Child Left Behind Act (NCLB) of2001.
Why is it Important?Tracking academic performance enables schooladministrators and the public to evaluate how wellOrange County schools are meeting state andnational standards.
How is Orange County Doing?More schools met the CDE academic performancetarget:• In 2010, 22 out of 27 school districts had
Academic Performance Index (API) scores abovethe statewide target of 800 – three more than theprevious year.
• The average API score among Orange Countyschool districts – currently 832 – rose 5% overthe last five years, and 14% over the last 10 years.
• For the third consecutive year, Orange County’saverage API score exceeded 800.
• 87% of Orange County public schools met theirstate-identified API growth targets (districts donot have growth targets).
Few districts met No Child Left Behind targets:• Out of the 27 Orange County school districts,
only two achieved Adequate Yearly Progress(AYP) in 2010, compared to 11 in 2009, eight in2008, and 15 in 2007.
• Districts had the most difficulty meeting theEnglish-Language Arts (ELA) and mathematicscriteria, with only 11% meeting ELA and 15%meeting mathematics.
• 12 districts have been identified for ProgramImprovement, the same number as in 2009.
• Only 43% of Orange County public schools metall the criteria to achieve AYP, down from 63% in2009, 64% in 2008, and 78% in 2007.
• Similar trends were witnessed statewide, withfewer schools achieving AYP than in 2009.
• Slightly over half of all Orange County schoolsare “Title I” eligible and 51% of those schoolshave been identified for Program Improvement.1
ACADEMIC PERFORMANCE
372011 EDUCATION
Above State API Target
Below State
API Target
Difficulties Meeting Adequate Yearly Progress Criteria
Irvine Unified (5%) 916 •Los Alamitos Unified (2%) 904 •Laguna Beach Unified (1%) 894Fountain Valley Elementary (1%) 892Huntington Beach City Elementary (1%) 889Cypress Elementary (1%) 877Brea-Olinda Unified (1%) 864Capistrano Unified (11%) 862 Year 1Saddleback Valley Unified (6%) 859Ocean View Elementary (2%) 857 Year 2Fullerton Elementary (3%) 855 Year 3Tustin Unified (4%) 850Placentia-Yorba Linda Unified (5%) 847Orange County Average 832 N/A N/ACentralia Elementary (1%) 830Huntington Beach Union High (3%) 826 Year 3Westminster Elementary (2%) 821Newport-Mesa Unified (4%) 820Fullerton Joint Union High (3%) 811 Year 3+Buena Park Elementary (1%) 811 Year 2Orange Unified (6%) 806 Year 2Garden Grove Unified (10%) 802 Year 3Magnolia Elementary (1%) 800Savanna Elementary (1%) 775La Habra City Elementary (1%) 760 Year 3+Anaheim City Elementary (4%) 755 Year 3+Anaheim Union High (7%) 748 Year 3Santa Ana Unified (11%) 723 Year 3+
Note: No entry in the Program Improvement Status column indicates the district has not been identified for PI.
Source: California Department of Education (www.cde.ca.gov)
Average Academic Performance Index Scores Adequate Yearly ProgressOrange County, 2010 Orange County, 2010
School District (Percent of Total Enrollment)
2010API
AchievedAYP
ProgramImprovement
Status
Performance TargetsStatewideThe California Department of Education uses API scores to measure perform-ance. The API – ranging from a low of 200 to a high of 1,000 – is calculated foreach school based on the performance of individual pupils on several stan-dardized tests. Each year, schools are given an API growth target.
NationalA school district is said to have achieved the national AYP threshold if the fourNCLB targets have been met: API growth score; testing participation rate; pro-ficient performance or better in English-language arts and mathematics; andhigh school graduation rates for districts with high schools.
Source: California Department of Education (www.cde.ca.gov)
Program Improvement for Title I Districts and SchoolsDistricts that fail to achieve AYP for two consecutive years on the same crite-ria are identified for Program Improvement (PI) and must develop or reviseperformance improvement plans among other interventions. A district mustachieve AYP for two consecutive years to exit PI status and avoid correctiveaction from the state Department of Education. Districts that advance to athird year of PI obtain a “Year 3” designation and a “Year 3+” designation forany subsequent year in PI. PI for schools is similar, but designed on a five-yeartimeline and interventions vary from those imposed on districts. For example,schools in “Year 1” must offer students an option to attend a non-PI school inthe same district with paid transportation.
Source: California Department of Education (www.cde.ca.gov/ta/ac/ti/programimprov.asp)
1 Schools with a high percentage of students from low incomefamilies receive federal “Title I” funding. All Orange Countyschool districts have schools that receive Title I funding.

141,
762
142,
833
140,
887
141,
608
150,
653
156,
725
159,
145
153,
055
149,
535
96,9
83
99,8
92
100,
318
102,
995
100,
954
Number of Bilingual Students on the RiseDescription of IndicatorThis indicator measures public school enroll-ment of English Learners (EL) and bilingualstudents.
Why is it Important?An educated workforce with good communica-tion skills is important for a strong economy.Students with limited English speaking skillsoften face academic, employment, and financialchallenges. English Learners who become flu-ent in English can provide a rich employmentresource for companies seeking to expand inter-nationally (see World Trade).
How is Orange County Doing?The proportion of EL students has not changedappreciably:• 28.2% of students in Orange County public
schools are EL.• Among California peers compared, Orange
County continues to have the highest proportion of EL.
• 20.1% of non-native English speaking students are bilingual (Fluent-English-Proficient).
• Of students formerly designated as EL,10.9% were redesignated bilingual in2009/10, the highest proportion in 15 years.
• The majority of EL speak Spanish as theirprimary language (82%), followed byVietnamese (9%), and Korean (3%).
38 EDUCATION 2011
ENGLISH LEARNERS
110,000
100,000
90,000
80,000
70,000
60,000
50,000
40,000
30,000
20,000
10,000
0
180,000
160,000
140,000
120,000
100,000
80,000
60,000
40,000
20,000
0
35%
30%
25%
20%
15%
10%
5%
0%05/06 06/07 07/08 08/09 09/10
Number Fluent-English-Proficient
NumberRedesignatedFluent
Percent Fluent-English-Proficient
Percent of EnglishLearnersRedesignatedFluent
California Average (23.7%)
Number of English Learners English Learners as a Percent of Total Enrollment
19.0%
27.9% 28.2%30.5% 31.1% 31.1%29.7% 29.1%
19.8% 20.1%
3%
20.4%19.9%
9.7% 9.3%7.8%
10.9%
8.1%
English Learners as a Percent of Total Enrollment Regional Comparison, 2009/10
Orange County
Los Angeles
San Jose
San Diego
Riverside/San Bernardino
San Francisco
Sacramento
0% 10% 20% 30% 40% 50% 60% 70% 80% 90% 100%
28.2%
26.2%
26.0%
23.8%
21.4%
21.1%
15.6%
English LearnersOrange County, 2001-2010
Fluent-English-Proficient Students and English Learners RedesignatedFluent-English-ProficientOrange County, 2006-2010
00/01 01/02 02/03 03/04 04/05 05/06 06/07 07/08 08/09 09/10
Source: Department of Education, DataQuest (http://data1.cde.ca.gov/dataquest/)
14,5
38
11,1
42
13,0
76
15,4
31
100%
90%
80%
70%
60%
50%
40%
30%
20%
10%
0%
Language Assessment ExplainedWhen students enter school, their language skills are assessed and they are given a designation. Each spring, English Learners are reassessed to deter-mine whether their designation should be changed. The designations are as follows:
144,
118
28.3%
11,7
25
English Learners by Primary LanguageOrange County, 2009/10
Spanish
Vietnamese
Korean
All Other Languages
82%
9%
6%
English Learner: A student who does not speak English fluently.
Fluent-English-Proficient: A student whose primary language is not Englishbut who is also fluent in English (bilingual).
Redesignated Fluent-English-Proficient: A student initially designated asan English Learner who has become fluent in English.
English Only/English Primary: Native English speakers for whom English istheir primary or only language.
28.1% 28.4%

Community Health and Prosperity
With growing enrollment in welfare andMedi-Cal programs, the effects of the recession areunmistakable. Nearly five percent of people in the countyreceive Food Stamps and the number of studentsliving in unstable housing conditions increased 18% in one year.
As for physical health, most measures of substance abuse showed improvement, the recent downward trend in early prenatal care was halted,and immunization rates remained steady. Still, there were 79 cases of life-threatening vaccine-preventable diseases and more accidentaldeaths among children.
CALIFORNIA PEERS
Sacramento, San Francisco, San Jose
NEIGHBORS
Los Angeles, Riverside/San Bernardino, San Diego

40
Downward Trend Halted
COMMUNITY HEALTH AND PROSPERITY 2011
PRENATAL CARE
Description of IndicatorThis indicator measures the percentage of live births toOrange County women who began prenatal care duringthe first three months of pregnancy, including racial andethnic detail. Rates of early prenatal care in OrangeCounty are also compared to peer regions and the state.
Why is it Important?Early prenatal care provides an effective and cost-efficientway to prevent, detect and treat maternal and fetal medicalproblems. It provides an excellent opportunity for healthcare providers to offer counseling on healthy living habitsthat lead to optimal birth outcomes. Conditions such aslow birth weight and infant mortality – which are oftenassociated with late or no prenatal care – may also beavoided. Showing birth rates by ethnicity provides aglimpse into the future in terms of the coming school agepopulation and overall demographic shifts in the county.
How is Orange County Doing?On average early prenatal care rates show improvement:• The downward trend in the early prenatal care rate that
began in 2005 was halted in 2009. • The rate rose 0.4 percentage points to 88.2% after
falling a total of 3.8 percentage points from a high of91.6% in 2004.
• This improvement is driven by increases in early prena-tal care for mothers in the racial/ethnic categories ofHispanic and Other.
• However, prenatal care for White, Asian and AfricanAmerican mothers continued to decline in 2009.
• Orange County exceeded the statewide rate of 81.3% in2009, but remained below the Healthy People 2010objective of 90%.
• Early prenatal care among Orange County mothersremains the highest among peers compared.
• The majority of births in Orange County are toHispanic mothers (50.3% or 20,323 births), followed byWhite mothers (29.9% or 12,107 births), and Asianmothers (16.8% or 6,788 births).
• Among California counties compared, only Los Angelesand San Diego counties had more babies born thanOrange County’s 40,431 in 2009.
What is Healthy People 2010?Healthy People 2010 is a national health promotion and diseaseprevention initiative which establishes national objectives toimprove the health of all Americans, eliminate disparities, andincrease the years and quality of healthy life.
The Healthy People 2020 objectives have recently been released(www.healthypeople.gov). The Community Indicators report willbegin using 2020 objectives for comparison in the 2012 report.
100%
90%
80%
70%
60%
50%
40%
30%
20%
10%
0%
Orange County
Percent of Mothers Receiving Early Prenatal CareRegional Comparison, 2008 and 2009
2008 2009 Healthy People 2010 Objective
California (81.3% in 2009)
San Fr
ancis
co
Los A
ngeles
San D
iego
San Jo
se
Riversi
de/
San B
ernar
dino
Sacr
amen
to
87.8
%
88.2
%
85.7
%
85.8
%
83.5
%
83.6
%
82.7
%
83.5
%
81.0
%
80.2
%
81.3
%
78.3
%
79.7
%
Live Births by Race and EthnicityOrange County, 2009
Hispanic (50.3%)
White (29.9%)
Asian (16.8%)
Other (1.9%)
African American (1.1%)
Sources: County of Orange Health Care Agency, Epidemiology and Assessment; California Department of Public Health
81.9
%
443770
12,107
6,788
20,323
Percent of Mothers Receiving Early Prenatal Careby Race and EthnicityOrange County, 2000-2009
100%
95%
90%
85%
80%
75%2000 2001 2002 2003 2004 2005 2006 2007 2008 2009
WhiteAsianOrange County Average
HispanicAfrican AmericanOther
Note: The ethnic category “Hispanic” includes any race; the racial categories “White,”“Asian,” and “African American” are all non-Hispanic. “Other” includes the categories oftwo or more races, Pacific Islander, and American Indian/Native Alaskan.

LEADING CAUSES OF DEATH FOR CHILDREN UNDER FIVE
412011 COMMUNITY HEALTH AND PROSPERITY
Accidental Deaths Rise; Long-Term Trend Still DownwardDescription of IndicatorThis indicator measures the leading causes of death for infants less than one year old and children ages one through four in OrangeCounty (shown as raw number of deaths). Also shown are deaths for children ages birth through four years due to all causes comparedto peer California regions (shown as number of deaths per 100,000 children).
Why is it Important?Awareness of the leading causes of death for children can lead to intervention strategies that can help prevent mortality. Many of thesedeaths are preventable through preconception health care, early and ongoing prenatal care, and education.
How is Orange County Doing?Although deaths for children under five rose in 2008, the overalltrend remains downward, falling 9% since 1999:• The number of deaths among infants rose from 187 in 2007 to
202 in 2008.• There was no change in deaths among young children, with 30
deaths in both 2007 and 2008.• In 2008, there was approximately one death for every 225
infants born in Orange County, and one in 5,916 among chil-dren ages one through four.
• Congenital defects (e.g. spina bifida or heart malformations)and chromosomal abnormalities (e.g. Down syndrome) con-tinue to top the list of leading causes of infant deaths at 64.
• Accidents – the leading cause of death for young children –rose in 2008, but the 10-year trend remains downward.
Los A
ngeles
San D
iego
180
160
140
120
100
80
60
40
20
0
Riversi
de/
San B
ernar
dino
Death Rate Due to All Causes for Children Under FiveRegional Comparison, 2007 and 2008
2007 2008 California (120 in 2008)
Sacr
amen
to
Orange County
San Fr
ancis
co
135
118
11712
6
115
137
104
98 99
109
San Jo
se
8996
Source: California Department of Public Health, Center for Health Services, Vital Statistics QuerySystem (www.apps.cdph.ca.gov/vsq/default.asp)
Note: Causes with fewer than five deaths for infants and fewer than two deaths for youngchildren are included in “All Other Causes.”
Source: County of Orange Health Care Agency, Family Health Division
*2008 cause of death data is considered preliminary.
Deaths per 100,000 Child
ren Under Five
143
128
30
25
20
15
10
5
0 1999 2000 2001 2002 2003 2004 2005 2006 2007 2008
Number of Accidental Deaths Among Children Ages 0-4Orange County, 1999-2008
Cause of Death Number of DeathsInfants (Under Age One)
Congenital Defects/Chromosomal Abnormalities 64Maternal Pregnancy Complications Affecting Newborn 23Prematurity/Low Birth Weight 14Circulatory System Diseases 9Cord, Placenta or Membranes Complications 7Respiratory Distress 6Neonatal Hemorrhage 5Collapsed Lung 5All Other Causes 69Total 202
Young Children (Ages 1-4)Accidents
Drowning 6Motor Vehicle Accidents 7Falls 1
Cancer 4Congenital Defects/Chromosomal Abnormalities 4Endocrine, Nutritional or Metabolic Diseases 4Homicide 2All Other Causes 2Total 30
Leading Causes of Death for Infants and Young ChildrenOrange County, 2008*
Number of Deaths Trend (Accidents Only)(Accidents Only)
14
28
1214
26
17 17
11 10
15
Source: County of Orange Health Care Agency, Family Health Division

Immunization Registry As of June 2010, there were 151,287 children ages 0-5 enrolled inthe countywide computerized immunization registry that waslaunched in March 2005. This represents a 24.2% increase in thenumber of children in the registry since June 2009. The HealthyPeople 2010 objective is that 95% of children ages 0-5 areenrolled in an immunization registry. Currently, 56% of OrangeCounty children ages 0-5 are enrolled, up from 45% a year ago.
Sources: 16th Annual Report on the Conditions of Children in Orange County(www.ochealthinfo.com/cscc/report/); California Department of Finance, Race/EthnicPopulation with Age and Sex Detail, 2000–2050(www.dof.ca.gov/research/demographic/data/race-ethnic/2000-50/)
42
Vaccine-Preventable Diseases Rise by 20%
COMMUNITY HEALTH AND PROSPERITY 2011
VACCINE-PREVENTABLE DISEASE AND IMMUNIZATION RATES
Vaccine-Preventable Disease (VPD) Cases or Hospitalizations Among Children Ages 0-5Orange County, 2000-2009
120
100
80
60
40
20
0
2000 2001 2002 2003 2004 2005 2006 2007 2008 2009
Total Number of Reportable VPDCases or Hospitalizations Trend (Total VPD)
Number of Cases of VPDReportable Prior to 2003 OnlyTrend (VPD Reportable Prior to2003)
79
57
85
5962
58
76
43
18
34
Percent of Children Adequately Immunized at Two Years of AgeOrange County and California, 2001-2010
100%
90%
80%
70%
60%
50%
40%
30%
20%
10%
0%20092006 2007 2008
Orange County CaliforniaHealthy People 2010 Objective (90%)
77%
77%
78%
81%
77%
77%
71%
70%
2004 20102001 2002 2003
72%
72%
71%74
%
72%
71% 76
%78%
78%
79%
1 Immunization rate data presented for “Orange County” includes Imperial,San Bernardino, Riverside, San Diego, and Orange counties in the analysis.
Source: California Department of Public Health, Immunization Branch, Kindergarten Retrospective Survey(www.cdph.ca.gov/programs/immunize/Pages/ImmunizationLevels.aspx)
Note: VPD since 1999 includes polio, tetanus, diphtheria, pertussis, hepatitis A, hepatitis B, HIB,mumps, measles, and rubella. Total VPD includes all of the above plus pneumococcal disease (as of2003) and varicella (chicken pox) hospitalization (as of 2004).
Source: County of Orange Health Care Agency, Epidemiology and Assessment
Adequately ImmunizedTo be considered “adequately immunized” at age two, a child must have:four doses of diphtheria/tetanus/pertussis (DTaP), three doses of polio, andone dose of measles/mumps/rubella (MMR). Other vaccines recommendedby age two include: hemophilus influenza type B (Hib), hepatitis A, hepati-tis B, pneumococcal disease, varicella (chicken pox), and annual flu shots.
Source: California Department of Public Health
19
83
59
50
66
Description of IndicatorThis indicator measures immunization rates for children attwo years of age and reported cases of vaccine-preventabledisease (VPD) among children less than six years of age.
Why is it Important?Immunization is one of the most important interventionsavailable for preventing serious diseases among infants andchildren. The Healthy People 2010 immunization objec-tive is for 90% of young children (age 1½ to 2¾) to be pro-tected by universally recommended vaccines.
How is Orange County Doing?Immunization rates have remained relatively constant:• According to the 2010 analysis of kindergarten immu-
nization records, 77% of Orange County children wereadequately immunized at age two.1
• Since 2005, Orange County’s early immunization rateshave remained equal to or higher than the state average,yet still fall short of the national objective.
Despite a recent rise in VPD, Orange County continues toshow positive long-term trends:• In 2009, there were 79 VPD cases with a majority (48)
among children under age one. • Pertussis (whooping cough) was the most common
VPD with 39 cases, followed by 21 cases of pneumococ-cal disease during the same time period.
• Because of newly available vaccines and case reportingrequirements, more VPD cases are reported today thanwhen the Community Indicators report began tracking.
• The addition of new VPD in recent years has led to aslightly upward trend over the past 10 years.
• However, when only tracking VPD reportable prior to2003, the trend is toward fewer cases. 108
2005
76%79%

California (13.4%) United States (9.6%)
Description of IndicatorThis indicator measures asthma diagnoses among children under 18 years of age.
Why is it Important?Nationwide, asthma prevalence has more than doubled inthe past 30 years and the rate continues to grow. Childrenare more likely than adults to suffer from asthma, experiencean asthma attack, visit an emergency room, and be hospital-ized due to asthma. Children with poorly controlled asthmaare more likely to miss school than those whose symptomsare well-managed. Parents of children with uncontrolledasthma miss more days of work and rate their quality of lifelower than parents of children with controlled asthma.1
How is Orange County Doing?Asthma prevalence has decreased since 2003:• As of 2009, 7.4% of children in Orange County have been
diagnosed with asthma at some point in their lives. This islower than the adult rate of 11.1%.
• Orange County’s asthma rate is lower than the Californiaaverage (13.4%) and the national average (9.6%).
• Among Orange County youth with asthma, 92% hadsymptoms within the past year.
PEDIATRIC ASTHMA
432011 COMMUNITY HEALTH AND PROSPERITY
Asthma Prevalence Continues to Decline
Children Ever Diagnosed with AsthmaOrange County and California, 2001-2009
2001 2003 2005 2007 2009
30%
25%
20%
15%
10%
5%
0%
Children Ever Diagnosed with Asthma by Age, Ethnicity, Sex,and IncomeOrange County, 2009
4.7%
6.0%
You
ng
C
hild
(1-
5)
You
th(6
-11)
Teen
(1
2-17
)
Wh
ite
By Age By Ethnicity By Sex By Income
Lati
no
Asi
an
Mal
e
Fem
ale
Low
Mid
dle
Hig
h
10%
9%
8%
7%
6%
5%
4%
3%
2%
1%
0%
1 Centers for Disease Control and Prevention, National Health Statistics Reports, “Asthma Prevalence, Health Care Usage, and Mortality: United States, 2005-2009”(www.cdc.gov/nchs/data/nhsr/nhsr032.pdf)Dean BB, et. al. (2009) “The impact of uncontrolled asthma on absenteeism and health-related quality of life,” Journal of Asthma, Vol. 46, Issue 9, p861-866.Children are considered to have uncontrolled asthma if they are on controller medications, were hospitalized or visited an emergency room in the past six months, complain of night-time symptoms, or complain of daily or continual symptoms.
Children Ever Diagnosed with AsthmaRegional Comparison, 2009
San Fr
ancis
co
50%
40%
30%
20%
10%
0%
Sources: University of California, Los Angeles, Center for Health Policy Research, CaliforniaHealth Interview Survey (www.chis.ucla.edu); Centers for Disease Control and Prevention,National Center for Health Statistics, Summary Health Statistics for U.S. Children: NationalHealth Interview Survey, 2009 (www.cdc.gov/nchs/faststats/asthma.htm)
Note: Estimates for the subpopulations “Young Child” and “Asian” are considered unstable and should beinterpreted with caution. Prevalence data by income bracket is not comparable to previous CommunityIndicators reports. The income brackets relate to the 2009 Federal Poverty Guidelines. For a family offour: “Low” is $44,100 or below, “Middle” is between $44,101 and $88,200, and “High” is $88,201 andabove.
Source: University of California, Los Angeles, Center for Health Policy Research, California Health InterviewSurvey (www.chis.ucla.edu)
9.1%
17.6
%
San D
iego
13.7
%
Riversi
de/
San B
ernar
dino
13.7
%
Los A
ngeles
13.0
%
Sacr
amen
to
12.6
%
San Jo
se
11.8
%
Orange County
7.4%
Orange County California
Source: University of California, Los Angeles, Center for Health Policy Research, California HealthInterview Survey (www.chis.ucla.edu)
9.3%
8.1%
7.8%
7.5%
7.1%
8.6%
6.1% 6.
7%

44 COMMUNITY HEALTH AND PROSPERITY 2011
OVERWEIGHT AND OBESITY
Fewer Obese Residents than the State and NationDescription of IndicatorThis indicator measures the weight status of children and adults. Children’s weight status is obtained from the Center for DiseaseControl and Prevention’s Pediatric Nutrition Surveillance System (PedNSS), which tracks the percentage of children from low-incomefamilies who are considered overweight. The weight status of adults is obtained from the California Health Interview Survey and theNational Health Interview Survey.
Why is it Important?Overweight children are more likely to become overweight or obeseadults. A sedentary lifestyle and being overweight are among the pri-mary risk factors for many health problems and premature death.Building a commitment to fitness and maintaining a healthy bodyweight can have positive impacts on physical and mental health.
How is Orange County Doing?The weight status of children and youth has not changed significantly:• In 2009, 16% of children ages two through four years were over-
weight and 17% were obese. • Among five through 19-year olds, 19% were considered overweight
and 21% were obese.• Orange County has approximately the same proportion of over-
weight youth as the California average, but a lower proportion ofobesity.
• Orange County youth remain far from achieving the HealthyPeople 2010 objective to reduce the percent of overweight youthamong six- to 19-year-olds to 5%.
According to the latest survey data available:• In 2009, 36% of Orange County adults were considered overweight
and 18% obese. • Overall, California and the United States have similar proportions
of residents considered overweight, but higher proportions of obe-sity among the adult population.
Weight Status of AdultsOrange County, California and United States, 2009
Underweight
Healthy Weight
Overweight
Obese
Orange County California United States
2005 2006 2007 2008 2009
Ages 2 through 4OverweightObese
Ages 5 through 19OverweightObese
Healthy People 2010 Objective (5%)
30%
25%
20%
15%
10%
5%
0%
Percent Overweight Among Low-Income YouthOrange County, 2005-2009
Note: See “Prenatal Care” for a description of Healthy People 2010 objectives.
Source: Centers for Disease Control and Prevention, Pediatric Nutrition SurveillanceSystem (www.dhcs.ca.gov/services/chdp/Pages/PedNSS2009.aspx)
Note: Data for United States do not sum to 100%due to omission of “Unknown” category.
Sources: University of California, Los Angeles, Centerfor Health Policy Research, California HealthInterview Survey; Centers for Disease Control andPrevention, National Health and NutritionExamination Survey
According to the California Department of Education Fitness Test –administered annually to fifth, seventh, and ninth graders – 26%of Orange County students in these grades in 2009 had anunhealthy body composition (in other words, overweight or, lessfrequently, underweight).
This indicator uses recent changes in terminology for overweight recommended by an expert panel of the American Medical Association andemployed by the Centers for Disease Control and the National Center for Health Statistics. Children with a Body Mass Index for age (BMI-for-age)in the 95th percentile are classified as “obese” (formerly “overweight”) and children with a BMI-for-age in the 85th percentile are classified as“overweight” (formerly “at-risk for overweight”).
1%
44%
36%
18%2%
39%
35%
24%2%
34%
35%
27%
NEWDATA
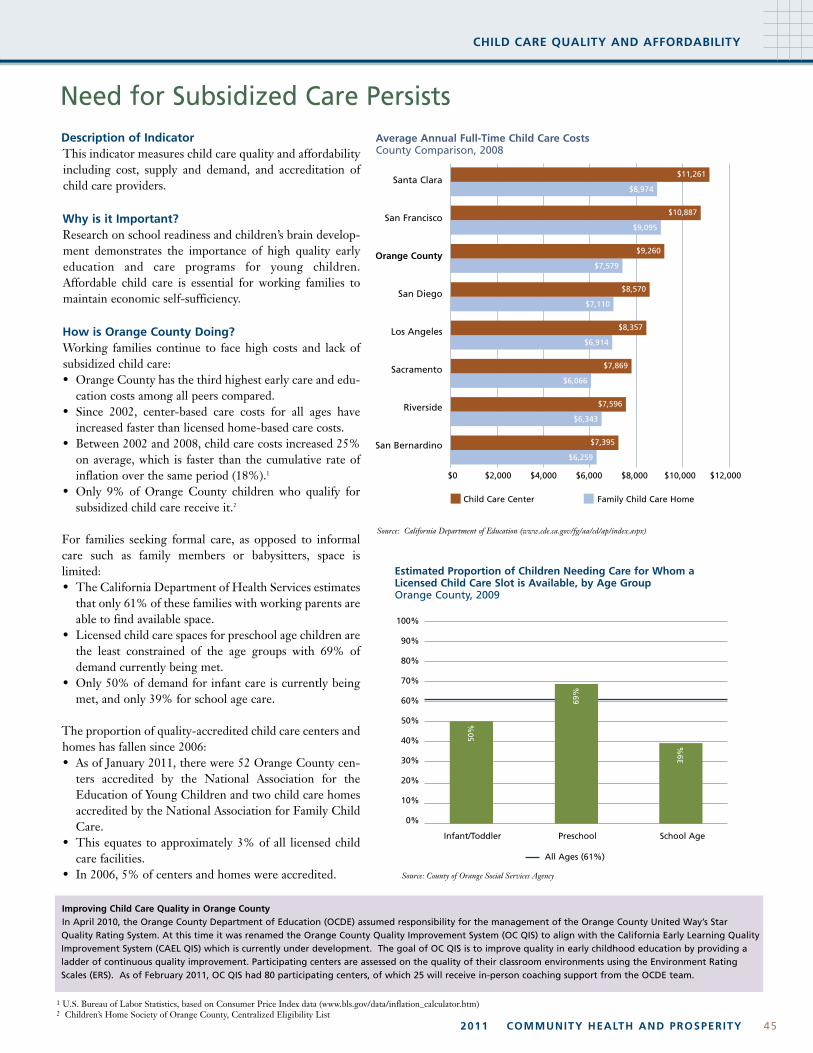
Improving Child Care Quality in Orange CountyIn April 2010, the Orange County Department of Education (OCDE) assumed responsibility for the management of the Orange County United Way’s StarQuality Rating System. At this time it was renamed the Orange County Quality Improvement System (OC QIS) to align with the California Early Learning QualityImprovement System (CAEL QIS) which is currently under development. The goal of OC QIS is to improve quality in early childhood education by providing aladder of continuous quality improvement. Participating centers are assessed on the quality of their classroom environments using the Environment RatingScales (ERS). As of February 2011, OC QIS had 80 participating centers, of which 25 will receive in-person coaching support from the OCDE team.
CHILD CARE QUALITY AND AFFORDABILITY
45
Need for Subsidized Care Persists
2011 COMMUNITY HEALTH AND PROSPERITY
Description of IndicatorThis indicator measures child care quality and affordabilityincluding cost, supply and demand, and accreditation ofchild care providers.
Why is it Important?Research on school readiness and children’s brain develop-ment demonstrates the importance of high quality earlyeducation and care programs for young children.Affordable child care is essential for working families tomaintain economic self-sufficiency.
How is Orange County Doing?Working families continue to face high costs and lack ofsubsidized child care:• Orange County has the third highest early care and edu-
cation costs among all peers compared. • Since 2002, center-based care costs for all ages have
increased faster than licensed home-based care costs.• Between 2002 and 2008, child care costs increased 25%
on average, which is faster than the cumulative rate ofinflation over the same period (18%).1
• Only 9% of Orange County children who qualify forsubsidized child care receive it.2
For families seeking formal care, as opposed to informalcare such as family members or babysitters, space is limited: • The California Department of Health Services estimates
that only 61% of these families with working parents areable to find available space.
• Licensed child care spaces for preschool age children arethe least constrained of the age groups with 69% ofdemand currently being met.
• Only 50% of demand for infant care is currently beingmet, and only 39% for school age care.
The proportion of quality-accredited child care centers andhomes has fallen since 2006:• As of January 2011, there were 52 Orange County cen-
ters accredited by the National Association for theEducation of Young Children and two child care homesaccredited by the National Association for Family ChildCare.
• This equates to approximately 3% of all licensed childcare facilities.
• In 2006, 5% of centers and homes were accredited.
Source: California Department of Education (www.cde.ca.gov/fg/aa/cd/ap/index.aspx)
Average Annual Full-Time Child Care CostsCounty Comparison, 2008
Santa Clara
San Francisco
Orange County
San Diego
Los Angeles
Sacramento
Riverside
San Bernardino
$0 $2,000 $4,000 $6,000 $8,000 $10,000 $12,000
Child Care Center Family Child Care Home
$8,974
$9,095
$7,579
$7,110
$6,914
$6,066
$6,343
$6,259
$5,712
1 U.S. Bureau of Labor Statistics, based on Consumer Price Index data (www.bls.gov/data/inflation_calculator.htm) 2 Children’s Home Society of Orange County, Centralized Eligibility List
Estimated Proportion of Children Needing Care for Whom aLicensed Child Care Slot is Available, by Age GroupOrange County, 2009
100%
90%
80%
70%
60%
50%
40%
30%
20%
10%
0%
Infant/Toddler Preschool School Age
Source: County of Orange Social Services Agency
50%
39%
$11,261
$10,887
$9,260
$8,570
$8,357
$7,869
$7,596
$7,395
All Ages (61%)
69%

Description of IndicatorThis indicator measures Orange County families’ progress toward self-sufficiency and economic stability by tracking enrollment in corepublic assistance programs and the proportion of children living in low income families.
Why is it Important?The challenges associated with poverty are many. Stress, strainedfamily relationships, substandard housing, lower educationalattainment, limited employment skills, unaffordable child care, andtransportation difficulties can make it hard for low income familiesto obtain and maintain employment. Economic stability can havelasting and measurable benefits for both parents and children.
How is Orange County Doing?The economic recession continues to dramatically affect OrangeCounty’s low income families:• The number of people receiving CalWORKs cash assistance
increased 20% in one year, rising to a monthly average of52,528 in 2009/10.
• Food Stamps enrollment jumped 37% during the same timeperiod, on top of a 24% rise in 2008/09.
• Enrollment data reveals a monthly average of 150,141 residentsreceived Food Stamps in 2009/10, equivalent to 4.7% of thecounty’s total population.1
• Medi-Cal enrollment grew 10%, while Healthy Families enroll-ment dipped for the first time since tracking began, falling 6%.
• In addition to current economic conditions, the increasingenrollment in public assistance programs may also reflectexpanded eligibility and increased efforts to enroll income-eli-gible residents.
The proportion of children living in low income families continuesto grow: • 45% of students were eligible for free- or reduced-priced school
meals in 2009/10 – an increase of 6% in one year and 22% since2000/01.
• A child is eligible if his or her family’s income is below 185% ofthe Federal Poverty Guidelines (e.g. $40,793 for a family of fourin 2010).2
• Wide disparities within the county persist with the highest rateof eligibility in Santa Ana Unified School District (84%) and thelowest rate of eligibility in Laguna Beach Unified SchoolDistrict (9%).
46
Food Stamps and Welfare Show Double Digit Growth
COMMUNITY HEALTH AND PROSPERITY 2011
FAMILY INCOME SECURITY
50%
48%
46%
44%
42%
40%
38%
36%
34%
32%
30%
Children Eligible for Free- or Reduced-Priced School MealsOrange County, 2001-2010
2009
/10
45.0%
36.9%
38.2%
38.6%37.5% 39.5%
38.4%
38.5%
40.0%42.3%
2000
/01
2001
/02
2002
/03
2003
/04
2004
/05
2005
/06
2006
/07
2007
/08
2008
/09
400,000
350,000
300,000
250,000
200,000
150,000
100,000
50,000
0
Major Public Assistance Program EnrollmentOrange County, 2001-2010
2000
/01
2001
/02
2002
/03
2003
/04
2004
/05
2005
/06
2006
/07
2007
/08
2008
/09
2009
/10
Number of People
Medi-Cal
Healthy Families
+37%
+10%
-6%
+20%
Food Stamps
CalWORKs
Note: Food Stamps and Medi-Cal counts include all persons who receive Medi-Cal and FoodStamps - both those who receive CalWORKs and those who do not.
Sources: County of Orange Social Services Agency; State of California, Managed Risk Medical InsuranceBoard, Healthy Families (www.mrmib.ca.gov/MRMIB/HFPReportsJune10.shtml)
Source: California Department of Education (http://data1.cde.ca.gov/dataquest/ andwww.cde.ca.gov/ds/sh/cw/filesafdc.asp)
Program Descriptions
• Food Stamps provides low income households with assistance for the purchase of food.
• Healthy Families is a health insurance program for children under 19years who do not qualify for free (zero share-of-cost) Medi-Cal.
• CalWORKS provides cash benefits for the care of low income children. • Medi-Cal is a health care program for certain low income populations.
Most programs require income and asset limitations, as well as citizenship or permanent legal resident status. Other eligibility factors may apply such ascounty or state residency, age, or time in the program (time-limits).
1 California Department of Finance, Table E-4 (www.dof.ca.gov/research/demographic/reports/view.php) 2 Health and Human Services Federal Poverty Guidelines 2010 (http://aspe.hhs.gov/poverty/10poverty.shtml)

FAMILY HOUSING SECURITY
472011 COMMUNITY HEALTH AND PROSPERITY
Description of IndicatorThis indicator measures Orange County families’ progresstoward housing stability by tracking the availability of rentalassistance and the number of children that are homeless or liv-ing in unstable housing arrangements.
Why is it Important?High housing costs force many families into living conditionsthey would not choose otherwise. Living doubled- or tripled-upwith another family due to economic constraints can place stresson personal relationships, housing stock, public services, andinfrastructure. When shared housing is not an option – or ifother factors arise such as foreclosure, financial loss, or domes-tic violence – the result can be homelessness.
How is Orange County Doing?Federal law requires public school districts to report the num-ber of students living in shelters or unsheltered in cars, parks orcampgrounds, as well as students living in motels or with anoth-er family due to economic hardship:• In 2009/10, there was an 18% increase in the number of stu-
dents (grades Pre-K through 12) who were identified as liv-ing in one of these unstable housing conditions, bringing thenumber to 25,964.1
• Families living doubled- or tripled-up are the largest andfastest growing cohort, with 24,057 students living in theseconditions.
• Additionally, 1,074 students live in motels, 665 live in shel-ters, and 168 live unsheltered in cars, parks or campgrounds.
• When student enrollment is taken into account, OrangeCounty has proportionately more homeless and unstably-housed students than the statewide average and all Californiapeers compared.
Most residents seeking rental assistance continue to wait: • In November 2005, the Orange County Housing Authority
(OCHA) accepted over 18,000 applications for assistance. Asof September 2010, there were approximately 9,000 appli-cants still on the waiting list for a Housing Choice Voucher.
• During 2010, OCHA used all of its allocated vouchers toassist an average of 9,575 households each month and issuedapproximately 300 vouchers to applicants on the waiting list(to replace households that terminated from the program).
• Housing authorities have not had the opportunity to apply tothe federal government for additional vouchers since 2003and, compared to 2009, fewer households terminated fromthe program in 2010.
• However, during 2010, OCHA applied for and received 150vouchers reserved for the Veteran Affairs SupportiveHousing Program, plus another 37 vouchers to expand itsFamily Unification Program (which reunites children in fos-ter care with their parents once the family has been stabilizedand housing is indicated as a key need for family success).
1 Districts are able to make changes to reported counts so these figures may besubject to revision.
More Students Living Doubled-Up
California (3.1%)
Homeless and Unstably-Housed Students by Percentage of Total EnrollmentRegional Comparison, 2009/10
5.2%
4.9%
3.0%
2.7%
2.7%
2.4%
1.9%
168 66
5 1,07
4
Orange County
Riversi
de/Sa
n
Bernar
dino
Sacr
amen
to
Los A
ngeles
San D
iego
San Jo
se
San Fr
ancis
co
10%
9%
8%
7%
6%
5%
4%
3%
2%
1%
0%
Source: California Department of Education, December 2010
Homeless and Unstably-Housed Pre-K through 12th GradeStudents by Primary Nighttime Residence Orange County, 2006-2010
2005/06 2006/07 2007/08 2008/09 2009/10
25,000
20,000
15,000
10,000
5,000
0
Note: The category “Unknown” was discontinued after 2006/07.
Source: Orange County Department of Education (http://mv.ocde.us/OC_Homeless_Data.htm)
Unknown
Unsheltered (e.g., cars, parks, campgrounds)
Shelters
Hotels/Motels
Doubled-up/Tripled-up
24,0
57
550
21 64 60 385 78
9
143
441
892
20,5
49
15,8
17
144
473 81
311
,646
464 85
69,
747

Description of IndicatorThis indicator measures the proportion of residents who did not havehealth insurance coverage at the time of the survey. Results by age, race andethnicity, and income are provided.
Why is it Important?Access to quality health care is heavily influenced by health insurance cov-erage. Due to the high cost of health care, individuals who have healthinsurance are more likely to seek routine medical care and to take advan-tage of preventive health screening services than those without such cover-age. This results in a healthier population and more cost-effective healthcare.
How is Orange County Doing?Estimates indicate approximately one in six residents are uninsured:• In 2009, 16.1% of Orange County residents surveyed reported being
uninsured.1
• This proportion is higher than the United States average, but lower thanthe California average.
• Young adults were the most likely to be uninsured (32%), followed bylow income residents (25%).
48 COMMUNITY HEALTH AND PROSPERITY 2011
HEALTH INSURANCE COVERAGE
One in Six are Uninsured
25%
20%
15%
10%
5%
0%
Uninsured (All Ages)Orange County, 2001-2009
Uninsured by Race/Ethnicity, Income and AgeOrange County, 2009
Asian
White
Low
By Ethnicity By Income By Age
Mid
dle
High
Young A
dult
(18-
24)
Adult
(25-
64)
Older
Adult
(65+
)
35%
30%
25%
20%
15%
10%
5%
0%
9%
13%
23%
25%
18%
7%
6%
32%
21%
2%
14.7%16.5%
15.1%
12.7%
16.1%
Note: Estimates for the subpopulations “White” and “Older Adult” are considered unstable and should beinterpreted with caution. Prevalence data by income bracket relates to the 2009 Federal Poverty Guidelines.For a family of four, “Low” is considered to be an annual income of $44,100 or below, “Middle” ranges from$44,101 - $88,200, and “High” is $88,201 and above. These income brackets are not comparable to data byincome bracket published previously in Health Insurance Coverage.
Source: California Health Interview Survey, University of California, Los Angeles (www.chis.ucla.edu)
Source: California Health Interview Survey, University of California, LosAngeles (www.chis.ucla.edu)
20%
18%
16%
14%
12%
10%
8%
6%
4%
2%
0%
Riversi
de/
San B
ernar
dino
Uninsured (All Ages)Regional Comparison, 2009
Los A
ngeles
Orange County
San D
iego
Sacr
amen
to
10.0
%
San Fr
ancis
co
9.8%
San Jo
se
9.7%
California (14.0%) United States (15.3%)
Sources: California Health Interview Survey, University of California, LosAngeles (www.chis.ucla.edu); National Health Interview Survey, Centers forDisease Control and Prevention (www.cdc.gov/nchs)
1 The margin of error for this estimate is plus or minus four percentage points.
2001 2003 2005 2007 2009
Childre
n and
Youth
(0-1
7)La
tino
19.5
%
17.0
%
16.1
%
12.4
%

Description of IndicatorThis indicator measures the economic, safety, and health status of Orange County older adults (65 years of age and over).1
Why is it Important?Orange County’s older population is expected to increase by 94%between 2010 and 2030, and experience a significant shift in racialand ethnic composition.2 This trend will place greater and changingdemands on health, transportation and support services for this pop-ulation.
How is Orange County Doing?Orange County’s older adults face unique economic conditions:• The 2009 median household income of older adults is $47,992,
almost $24,000 less than the county median income of $71,865. • However, while the county median income fell by $3,000
between 2008 and 2009, the older adult median rose by $500.• In 2009, approximately 6.9% of older adults were living under
the poverty level, compared to 7.6% in 2008.• Between 2000 and 2009, poverty among Orange County’s older
adults increased an average of 3% each year, compared to 1%statewide and a slight decrease nationwide.
• Homeownership rates among older adults (79%), compared tothe non-senior adult population (55%) have not changed appre-ciatively this decade.
Most older adults are healthy, but demand for services grows:• According to the 2009 California Health Interview Survey, 70%
of older adults rate their health as “excellent,” “very good” or“good.” The remaining 30% rate their health as “fair” or “poor.”
• About one-third (33%) of older adults have a disability, comparedto 5% of the non-senior adult population.
• Congregate and in-home meals served to older adults in 2009/10by the County of Orange Office on Aging increased 51% since2005/06.
• Demand among older adults for the County of Orange SocialServices Agency’s (SSA) In-Home Supportive Services programincreased 171% over the past 10 years.
• The number of older adults receiving Medi-Cal has grownsteadily for seven years at almost 5% per year.
• At the same time, the number of seniors receiving Food Stampsgrew steadily, then increased more rapidly to almost double inthree years through 2009/10.
Crime and abuse reports decline:• In 2009, the rate of violent crime against Orange County’s older
adults remained steady and significantly lower than the statewideaverage (85 crimes per 100,000 residents 65+ compared to 186crimes per 100,000 65+ statewide).3
• Of the 295 reported crimes, robbery was the most common.• On average, elder abuse reported to SSA has grown 5% each year
since 2000/01, however reports rose 15% in 2009/10.• Elder abuse includes self-neglect (the most common form of
abuse) as well as abuse by others including neglect or financial,physical, or emotional abuse.
WELLBEING OF OLDER ADULTS
492011 COMMUNITY HEALTH AND PROSPERITY
Poverty Rate Rising Faster than State and Nation
United States California Orange County
Percent Age 65 and Over in PovertyOrange County, California, and United States, 2000-2009
2000 2001 2002 2003 2004 2005 2006 2007 2008 2009
14%
12%
10%
8%
6%
4%
2%
0%
Source: U.S. Census Bureau, American Community Survey and Supplementary Survey(www.census.gov)
Medi-Cal (Monthly Average Enrollment)
Congregate/In-Home Meals Served (Meals)
In-Home Supportive Services (Caseload)
Food Stamps (Monthly Average Enrollment)
Older Adult Support Services, Medi-Cal and Food StampsEnrollment and Meals ServedOrange County, 2006-2010
2006 2007 2008 2009 2010
1,900,000
1,700,000
1,500,000
1,300,000
1,100,000
900,000
50,000
45,000
40,000
35,000
30,000
25,000
20,000
15,000
10,000
5,000
0
Note: Data for In-Home Supportive Services is the caseload as of June of a given year;Congregate/In-Home Meals served, Medi-Cal enrollment and Food Stamps enrollment are byfiscal year (2010 refers to 2009/10). In-Home Supportive Services include domestic assistance,personal and paramedical care, and protective supervision to prevent self-harm.
Sources: County of Orange Social Services Agency (IHSS, Medi-Cal, Food Stamps); Orange CountyCommunity Services/Office on Aging (C/IHMS)
1 Data is from the U.S. Census Bureau, 2009 American Community Survey unless otherwise noted.2 California Department of Finance3 California Department of Justice, Criminal Justice Statistics Center, Special Requests Unit; U.S.Census Bureau, American Community Survey and Supplementary Survey (www.census.gov)
47,161
1.8M
2,2351,082 1,147
1.30M
1.73M
44,858
1.19M
41,64243,455
40,383
1.16M
1,271 1,553
12,172
8,228 9,06610,715 11,586

50 COMMUNITY HEALTH AND PROSPERITY 2011
MENTAL HEALTH
More Children Receive Mental Health Care
Source: California Department of Mental Health, Client and Services InformationSystem
Sources: Orange County Health Care Agency, Behavioral Health Services; CaliforniaDepartment of Mental Health, Client and Services Information System; CaliforniaDepartment of Mental Health, Series P5 Estimates of Need for Mental Health Servicesfor Serious Mental Illness, 2007(www.dmh.ca.gov/Statistics_and_Data_Analysis/Prevalence_Rates.asp)
Unduplicated Count of Clients Served by OrangeCounty Health Care Agency Mental Health Programsper 1,000 Residents, by Age GroupOrange County, 2008-2010
Young Child Adult
Youth Senior
Number of Clients
Clients Served
Estimated Need (All Incomes)
Estimated Need (Low Income)
Per 1,000 in Each Age Group
The Mental Health/Substance Abuse ConnectionAdults with serious psychological distress (SPD) are more likely than the generalpopulation to use illicit drugs, be heavy drinkers, or participate in binge drink-ing. Nationwide, 22.3% of adults with SPD were dependent on or abused illicitdrugs or alcohol, compared to 7.7% of adults without SPD. Adults sufferingfrom depression are also more likely than the general population to abusedrugs or alcohol.
Source: Substance Abuse and Mental Health Services Administration, 2006 National Survey on Drug Use andHealth (www.samhsa.gov)
1 Need estimates are based on California Department of Mental Health “Series P5 Estimates of Need for Mental Health Services for Serious Mental Illness, 2007,” adjusted by annualpopulation change as reported by the California Department of Finance, Tables E-1 and E-2.
25
20
15
10
5
02008 2009 2010
Unduplicated Count of Clients Served by Orange CountyHealth Care Agency Programs Compared to Estimated Needfor Mental Health ServicesOrange County, 2006-2010
160,000
140,000
120,000
100,000
80,000
60,000
40,000
20,000
0
44,074 44,793 45,223 44,651 45,645
Description of IndicatorThis indicator measures the need for and access to mental health careservices. It also measures the number of clients served by publicly-funded Orange County mental health programs compared to the estimated need for services.
Why is it Important?Mental health disorders often go unreported and untreated. If leftuntreated, mental health disorders can worsen and lead to difficulties inthe home and workplace, and in severe cases, suicide.
How is Orange County Doing?In 2009/10, publicly-funded mental health programs served approxi-mately 31% of the estimated need for mental health services: • As many as 142,617 residents (or 4.5% of the population) are
estimated to have a serious mental illness in need of treatment.1
• The number of low income residents estimated to need treatment is64,576.
• Orange County Health Care Agency mental health programs served44,645 Orange County residents (1.5% of the total population) in2009/10.
• This reflects a gap of 93,627 residents (among all incomes) or 19,931(low income) needing care who – as an alternative to County-fund-ed services – may obtain private care or no care at all.
• Slightly more residents statewide (5.0%) are estimated to have seri-ous mental illness than Orange County residents (4.5%), withroughly the same proportionate gap in need compared to servicesaccessed.
Residents of all ages are affected by mental and behavioral health conditions:• Since 2007/08, the number of young children treated grew 13% and
the number of youth treated grew 5%, while the number of seniorstreated fell 40%.
• Children ages 0 to 5 accounted for 4% of the Orange CountyHealth Care Agency’s mental health clients in 2009/10.
• This is equivalent to less than 1% of the population ages 0 to 5,which is far less than the estimated proportion of children of this ageneeding care (7%).
• Youth ages six to 18 accounted for 29% of the clients served, adultsages 19 to 64 accounted for 64%, and seniors age 65 and overaccounted for the remaining 3%.
2005/06 2006/07 2007/08 2008/09 2009/10
137,263 138,272 139,807 141,205 142,617
65,152 62,609 63,304 63,987 64,576

Description of IndicatorA variety of commonly used indicators are shown to help gauge the extent of alcohol and other drug (AOD) abuse. These includeAOD use among youth, AOD-related deaths and arrests, admissions to treatment facilities, and alcohol-involved car collisions.
Why is it Important?A broad spectrum of public health and safety problems are directly linked with substance abuse including addiction, traffic accidents,domestic violence, crime, unintended pregnancy, and serious conditions such as cancer, liver disease, HIV/AIDS, and birth defects.
How is Orange County Doing?With the exception of AOD-related deaths, all sub-stance abuse indicators showed improvement:• According to 2007-09 data, compared to the
California average, Orange County high schoolyouth engaged with similar frequency in bingedrinking, slightly less frequently in current alco-hol use, and were significantly less likely to haveused alcohol or other drugs in their lifetimes.1
• Among Orange County’s 11th grade students,51% reported that alcohol is very easy for them toget and approximately 27% reported driving afterdrinking or being in a car with someone who hadbeen drinking and driving.1
• Drug-related arrests fell 8% between 2000 and2009, while alcohol-related arrests fell 11%.
• Orange County consistently has fewer AOD-related arrests per capita than the state average.
• Over the past five years, Orange County hasmaintained a consistently lower rate of alcohol-involved injury and fatal motor vehicle collisionsthan the state averages and the long-term trend istoward fewer collisions per capita.2
• In 2009, alcohol was a factor in 62 fatal motorvehicle collisions and 1,492 injury collisions.
• Although rates of death caused by drugs andchronic liver disease/cirrhosis increased, OrangeCounty’s rates are still lower than the statewideaverage, but well above the Healthy People 2010objectives.
• Since 2008/09, substance-related treatmentadmissions fell 15%.
• Among people admitted for treatment, the age atfirst use clusters around age 13 for alcohol andmarijuana, while age at first use clusters aroundage 18 for heroin, methamphetamine, andcocaine/crack.
SUBSTANCE ABUSE
512011 COMMUNITY HEALTH AND PROSPERITY
Most Substance Abuse Measures Improve
Source: California Department ofJustice, Criminal Justice StatisticsCenter, Special Requests
Source: California Department of Public Health, County Health Status Profiles (www.cdph.ca.gov/programs/ohir/Pages/CHSP.aspx)
2,500
2,000
1,500
1,000
500
0
Alcohol- and Drug-Related Arrests per 100,000 at RiskOrange County and California, 2000-2009
2000 2001 2002 2003 2004 2005 2006 2007 2008 2009
Per 100,000 at Risk (Ages 10-69)
Orange County
California
Note: See “Prenatal Care” for adescription of Healthy People 2010objectives. Counties with varying agecompositions can have widely disparatedeath rates since the risk of dying ismostly a function of age. To enablecounty comparisons, age-adjusteddeath rates, which control for this vari-ability, are used rather than crudedeath rates.
Orange County:Alcoholic Liver DiseaseDrug-Induced
California:Alcoholic Liver DiseaseDrug-Induced
Drug- and Alcohol-Related Age-Adjusted Death RatesOrange County and California, 2003-2008
12
10
8
6
4
2
02003-05 2004-06 2005-07 2006-08
Alcohol- and Drug-Related Admissions to Publicly-Funded or State-Licensed Recovery and Treatment Services, All AgesOrange County, 2006/07-2009/10
12,000
10,000
8,000
6,000
4,000
2,000
0
Alcohol
Methamphetamine
Marijuana/Hashish
Heroin
Cocaine/Crack
Other
2006/07 2007/08 2008/09 2009/10
1,375
2,028
6,044
1,203629
1,462
2,322
5,665
1,452684
1,023
2,044
4,378
1,377507
844
1,800
3,639
1,231352
Source: Orange CountyHealth Care Agency,Behavioral Health Servicesfrom the CalOMS database
1 WestEd, California Healthy Kids Survey(http://chks.wested.org/reports)
2 California Highway Patrol (www.chp.ca.gov/switrs) and CaliforniaDepartment of Justice, Criminal Justice Statistics Center, PopulationEstimates (http://ag.ca.gov/cjsc/publications/profiles/pub.php)
Healthy People 2010 Objective: Liver Disease/Cirrhosis Drug-Induced Deaths

Description of IndicatorThis indicator reports mortality rates (age-adjusted deaths per 100,000 people) and progress toward the Healthy People 2010 objectivesfor 18 commonly measured health status indicators.1 AIDS and HIV data are also presented.
Why is it Important?Viewing the county in relation to statewide averages and nationalhealth objectives identifies public health issues that are compara-tively more or less pronounced in Orange County. This aids thedevelopment and prioritization of public health initiatives.
How is Orange County Doing?In 2008, death rates rose for 11 of the 18 common causes tracked:• Despite these increases, the changes were not significant
enough to reverse the overall promising five-year trends formost causes of death.
• Deaths due to drugs, homicide, and chronic liver disease andcirrhosis increased the most in the past year; deaths due to diabetes, prostate cancer, and heart disease declined the most.
• The county continued to meet national objectives for lung,breast and prostate cancers, as well as the general category of“all cancers,” heart disease, stroke, motor vehicle accidents,and homicide.
• Orange County’s death rates are lower than the Californiaaverage for all causes compared except Alzheimer’s andinfluenza or pneumonia.
Although reported AIDS cases fell in 2009, the number of peoplein Orange County living with HIV or AIDS continues to rise:• As of December 2009, approximately 6,676 people were known
to be living with HIV, up from 4,138 in 2000. • Over half of current HIV cases have been diagnosed with
AIDS and 241 of those cases were newly diagnosed in 2009. • Compared to the 1980s, White residents account for a decreas-
ing proportion of the county’s HIV cases, while otherraces/ethnicities account for an increasing proportion.
52 COMMUNITY HEALTH AND PROSPERITY 2011
HEALTH STATUS
Death Rates Rise for 11 of 18 Common Causes
Age-Adjusted Death Rates: Progress Towards 2010 ObjectivesOrange County, 2008
Drug-Induced
Chronic Liver Diseaseand Cirrhosis
Suicide
Unintentional Injuries
Firearms Injury
Colon Cancer
All Cancers
Homicide
Breast Cancer
Motor Vehicle Accidents
Lung Cancer
Stroke
Heart Disease
Prostate Cancer
Improving Worsening No ChangeHealthy People 2010 Objective
Note: Deaths due to Diabetes, Chronic Lower Respiratory Disease, Alzheimer’s, and Influenzaor Pneumonia do not have a Healthy People 2010 objective and are not included in this chart.
Source: California Department of Public Health, County Health Status Profiles (www.cdph.ca.gov/programs/ohir/Pages/CHSP.aspx)
7 Firearms Injury8 Unintentional Injuries8 Motor Vehicle Accidents
10 Suicide15 Chronic Lower Respiratory Disease18 Lung Cancer18 Chronic Liver Disease and Cirrhosis18 Drug-Induced19 All Cancers19 Breast Cancer19 Homicide20 Diabetes21 Prostate Cancer23 Colon Cancer28 Stroke36 Heart Disease42 Influenza or Pneumonia46 Alzheimer's Disease
Rank AmongCaliforniaCounties Cause of Death
Objective Not Met Objective Met
Orange County Age-Adjusted Death Rate Ranking andComparison to California Average, 2008
1 See Substance Abuse for an explanation of age-adjusted death rates. See Prenatal Carefor an explanation of Healthy People 2010. Data reflect three-year averages; “2008” is anaverage of 2006, 2007, and 2008 data.
Note: Ordered by Orange County’s rank among California counties (one is best, 58 is worst).
Source: California Department of Public Health, County Health Status Profiles (www.cdph.ca.gov/programs/ohir/Pages/CHSP.aspx)
Better thanCalifornia Average
Worse thanCalifornia Average
Change Since 2007
Source: Orange County Health Care Agency, HIV/AIDS Surveillance and Monitoring Program(www.ochealthinfo.com/public/hiv/local.htm)
AIDS Cases by Year of ReportOrange County, 2000-2009
350
300
250
200
150
100
50
02000 2001 2002 2003 2004 2005 2006 2007 2008 2009
296
232
233
216 23
3
175
225
236
278
241

Public Safety
A low incidence of crime continues to be an
Orange County hallmark. The adult arrest rate is down,
gang-related homicides are down, and hate
crime remains low compared to peers. Childabuse reports declined for the third
consecutive year. Of concern however, is the increasing
proportion of serious crime committed
by gang-related individuals.
NATIONAL PEERS
Phoenix, Seattle
CALIFORNIA PEERS
Sacramento, San Francisco, San Jose
NEIGHBORS
Los Angeles, Riverside/San Bernardino, San Diego

Description of IndicatorThis indicator tracks confirmed child abuse and neglect reports (sub-stantiated referrals) and the number of children entering foster care.Domestic violence is tracked by measuring domestic violence calls forassistance and spousal abuse arrests.
Why is it Important?Foster care placement is often the final act to protect children fromabuse and neglect after repeated attempts to stabilize their familieshave failed. Domestic violence threatens the physical and emotionalwellbeing of children and women in particular, and can have lastingnegative impacts. It can also lead to homelessness when the abusedflees a dangerous environment.
How is Orange County Doing?Child abuse and neglect reports declined again:• In 2009, Orange County had slightly more substantiated child
abuse and neglect referrals per 1,000 children (ages 0-17) than thestatewide average, yet a 7% decrease over 2008 levels.
• Foster care entries declined 12% from 2008 to 2009.• Among California peers, Orange County shares the lowest rate of
children entering foster care with the San Jose metro area (1.7 per1,000 children).
• When possible, the Orange County Social Services Agency keepsfamilies intact while providing stabilizing services. This mayaccount for the fact that only 17% of substantiated referrals inOrange County result in foster care placement, compared tobetween 28% and 42% in peer regions.
Domestic violence indicators remained steady:• In 2009, there were 10,377 domestic violence-related calls for assis-
tance, compared to 10,219 in 2008. • There were 2,101 spousal abuse arrests in 2009, compared to 2,121
in 2008. • Despite little change last year, the 10-year trends for calls for assis-
tance and arrests are notably downward.• Orange County continues to have significantly lower levels of calls
for assistance and spousal abuse arrests than the statewide averages.
54
Child Abuse Reports Continue Decline
PUBLIC SAFETY 2011
FAMILY SAFETY
2006 20072003 2004
12,000
10,000
8,000
6,000
4,000
2,000
0
9,40
9
2002
9,82
4
8,61
4
9,34
3
9,88
2
8,49
82005
Substantiated Referrals Entries
Substantiated Referrals and Entries to Foster CareRegional Comparison, 2009
San Jo
se
San D
iego
Orange County
Los A
ngeles
Sacr
amen
to
Riversi
de/
San B
ernar
dino
12
10
8
6
4
2
0
1.7
4.0
San Fr
ancis
co
2.7
9.69.9
3.4
9.6
3.9
10.1
4.6
11.0
Substantiated Referrals: Entries:Region RegionCalifornia (9.2) California (3.2)
Inciden
ce per 1,000 Child
ren
Domestic Violence-Related Calls for Assistance and Spousal Abuse ArrestsOrange County, 2000-2009
450
400
350
300
250
200
150
100
50
0
Per 100,000 or per 100,000 at Risk
Calls for Assistance Spousal Abuse Arrests
410
131
409
124
414
126
424 410
364344 327
86
329
84
Note: Domestic violence-related calls for assistance per 100,000 are calculated using the totalpopulation. Spousal abuse arrests per 100,000 are calculated using the total population at risk,10-69 years of age.
Source: California Department of Justice, Criminal Justice Statistics Center, Special Requests Unit
A recent review of child welfare data conducted by the NationalCoalition for Child Protection Reform found that among 25 largeCalifornia counties, Orange County has one of the best safety out-comes, as measured by a low reoccurrence of maltreatment and fostercare recidivism.
Substantiated Referrals and Entries to Foster CareOrange County, 2000-2009
200920082000
10,5
01
7,93
68,89
3
9,73
1
2001
2006 20072003 20042002 2005 200920082000 2001
426
119 123 102 93 95
2.0
4.8
1.7
3.9
Note: Data has been updated from previous Community Indicators reports.
Source: University of California Berkeley, Center for Social Services Research, Child WelfareResearch Center (http://cssr.berkeley.edu/ucb_childwelfare/default.aspx)
Source: University of California Berkeley, Center for Social Services Research, Child WelfareResearch Center (http://cssr.berkeley.edu/ucb_childwelfare/default.aspx)

JUVENILE CRIME
55
Total Adults Juveniles
Note: The juvenile population at risk is 10-17 years of age, the adult population at risk is18-69 years of age, and the total population at risk is 10-69 years of age.
Adult and Juvenile Arrest Rate Gap Hits 10-Year LowDescription of IndicatorThis indicator uses arrests as a means of measuring juveniles’(persons under 18 years of age) participation in felony andmisdemeanor crimes, compared to adults and peer regions.Felonies include crimes such as murder, assault, rape, robbery,burglary, and serious drug offenses. Misdemeanors includecrimes such as assault and battery, prostitution, petty theft,vandalism, driving while intoxicated, and less serious drugoffenses.
Why is it Important?Tracking juvenile arrests helps the community understand thelevel of major and minor crime in Orange County and theextent to which youth contribute to that crime. While youthsmake up a small portion of overall arrests, criminal justiceexperts argue that intervening early with at-risk youth canhelp reduce criminal activity in their adult lives.
How is Orange County Doing?The gap between the adult and juvenile arrest rate is narrow-ing as the adult rate falls and the juvenile rate remains steady:• In 2009, there were 3,561 arrests per 100,000 youth com-
pared to 3,701 per 100,000 adults. • Still, since the juvenile population is much smaller than the
adult population, juveniles only account for 14% of allarrests (12,734 juvenile arrests compared to 79,736 adultarrests).
• Out of the 12,734 juvenile arrests, 68% were for misde-meanors.
• Orange County had the lowest juvenile felony arrest rateamong peers in 2009, and the third highest juvenile misde-meanor arrest rate.
Total Adult and Juvenile Arrests and Proportion of Juvenile Arrests that are Felonies or Misdemeanors Orange County, 2009
Adults
Juveniles
Felonies
Misdemeanors
32%
Source: California Department of Justice, Criminal Justice Statistics Center (http://caag.state.ca.us/cjsc/)
Source: California Department of Education, DataQuest(http://data1.cde.ca.gov/Dataquest/)
86% 14%
68%
School CrimeStudents are expelled from school for vio-lent or dangerous behavior, or for commit-ting drug or firearm offenses on schoolgrounds. Compared to the state, OrangeCounty has a lower rate of expulsions.
Adult and Juvenile Felony and Misdemeanor Arrests Orange County, 2000-2009
6,000
5,000
4,000
3,000
2,000
1,000
0
2008
2009
2000
2001
2002
2003
2004
2005
2006
2007
Juvenile Felony and Misdemeanor ArrestsRegional Comparison, 2009
San Jo
se
Riversi
de/
San B
ernar
dino
Orange County
San Fr
ancis
co
San D
iego
4,000
3,500
3,000
2,500
2,000
1,500
1,000
500
0
1,37
0
3,78
5
1,21
3
2,70
8
1,15
7
2,40
4
1,29
4
2,36
3
1,29
9
2,28
0
1,46
3
2,09
0
Los A
ngeles
1,19
1
1,74
9
Per 100,000 Po
pulation at Risk
Per 100,000 Po
pulation at Risk
2011 PUBLIC SAFETY
Orange County 1.7 2.2 2.4California 2.8 2.7 3.4
Expulsions per 1,000 Students EnrolledOrange County and California, 2008-2010
2007/08 2008/09 2009/10
Sacr
amen
to
Felonies: Misdemeanors:Region RegionCalifornia (1,290) California (2,555)

Crime Rate Falls for Fifth Consecutive Year Description of IndicatorThis indicator uses FBI Uniform Crime Reportsto compare crime rates among regions and totrack crime rate trends. This analysis includesviolent felonies (homicide, forcible rape, robbery,and aggravated assault) and property felonies(burglary, motor vehicle theft, and larceny-theft).The number of homicide victims by race or eth-nicity is also shown.
Why is it Important?Crime impacts both real and perceived safety ina community. It can also negatively affect invest-ment in a community if a neighborhood is con-sidered unsafe.
How is Orange County Doing?Orange County’s crime rate continues to fall:• Between 2008 and 2009, Orange County’s
crime rate fell 5%. • Over the past 10 years, reported crime in
Orange County dropped 14%, or an average ofapproximately 2% each year.
• Compared to peers, Orange County has thelowest overall crime rate, as well as the lowestviolent and property crime rates.
• Of the 69 homicides in Orange County in2009, 46% of the victims were Hispanic, com-pared to 33% White, and 9% Asian/PacificIslander.
• Based on Orange County’s overall racial andethnic composition, Hispanic residents contin-ue to be disproportionately more affected byhomicides than White and Asian/PacificIslander residents.
56 PUBLIC SAFETY 2011
CRIME RATE
3,000
2,500
2,000
1,500
1,000
500
02000 2001 2002 2003 2004 2005 2006 2007 2008 2009
Crime RateOrange County, 2000-2009
Crimes per 100,000
Crimes per 100,000
4,500
4,000
3,500
3,000
2,500
2,000
1,500
1,000
500
0
Seat
tle
Crime RateRegional Comparison, 2009
Property Crimes Violent Crimes
Phoen
ix
San Fr
ancis
co
Sacr
amen
to
California (3,204) United States (3,466)
Riversi
de/
San B
ernar
dino
San Jo
se
Source: Federal Bureau of Investigation, Uniform Crime Reporting Program (www.fbi.gov/ucr/ucr.htm)
Source: Federal Bureau of Investigation, Uniform Crime Reporting Program (www.fbi.gov/ucr/ucr.htm)
Source: California Department of Justice, Office of the Attorney General,Criminal Justice Statistics Center, Special Request Unit(http://caag.state.ca.us/cjsc/)
Pacific IslanderHispanic White Asian/ Other
60
50
40
30
20
10
0
Victims of Homicides by Race/EthnicityOrange County, 2000-2009
2000 2001 2002 2003 2004 2005 2006 2007 2008 2009
Number of Homicides
4,27
3
3,99
6
3,93
1
3,70
4
3,24
7
Los A
ngeles
3,00
8
San D
iego
2,74
1
Orange County
2,69
6
2,25
7
According to a poll conducted by Gallup-Healthways, nearly three quarters (74%)of Orange County residents feel safe walking alone at night.
Source: Gallup-Healthways Well-Being Index (www.well-beingindex.com)

GANG-RELATED CRIME
572011 PUBLIC SAFETY
Gang Membership Up; Homicides Reach 10-Year Low
45
40
35
30
25
20
15
10
5
0
Victims of Gang-Related HomicidesOrange County, 2000-2009
2000 2001 2002 2003 2004 2005 2006 2007 2008 2009
2005 2006 2007 2008 2009
Number of Homicides
20
24
1816 16
30
22
35
31
36
Number of Gan
gs
Gangs and Gang MembershipOrange County, 2000-2009
2000 2001 2002 2003 2004 2005 2006 2007 2008 2009
20,000
18,000
16,000
14,000
12,000
10,000
8,000
6,000
4,000
2,000
0
400
350
300
250
200
150
100
50
0Number of Mem
bers
Source: County of Orange Office of the District Attorney
Number of Members Number of Gangs
338335
314 306 305
365 368
305
367357
60%
50%
40%
30%
20%
10%
0%
Anti-Gang Unit and Gang-Related Felony Filings as a Percentageof all District Attorney Filings, by OffenseOrange County, 2005-2009
1 A filing is a charging document filed with the superior court clerk bya prosecuting attorney alleging that a person committed or attemptedto commit a crime.
11,1
07
11,4
9213,2
5914,1
11
17,4
56
12,0
84
12,5
84
13,3
82
17,9
95
17,3
06
Description of IndicatorThis indicator measures gang-related crime filings, homicides,and the percentage of countywide filings that are gang-related.Also measured are the numbers of identified gang members andidentified gangs in Orange County.
Why is it Important?Tracking gang-related crime can help the community gauge theextent and nature of gang participation in crime. It can also aidpolicymakers in decisions regarding the effectiveness of pro-grams designed to combat gang-related crime and the level offunding needed to support these programs now and in thefuture.
How is Orange County Doing?Gang-related crime continues to account for a growing propor-tion of all serious crime:• In 2009, 10.4% of all felony filings in Orange County were
gang-related – the highest proportion this decade.1
• Anti-gang unit and gang-related misdemeanor and felony fil-ings reached the second highest number this decade at 2,071.
• The number of gang members rose for the third consecutiveyear, while the number of gangs remained steady.
• Gang-related homicides fell from 24 in 2008 to 16 in 2009,the lowest level since 2000.
• In 2009, gang members were responsible for 46% of county-wide felony homicide/manslaughter filings, 44% of felonyweapons filings, 30% of all felony robbery charges, and 21%of felony assault charges.
• Gangs were responsible for less than 8% of other crimes suchas narcotics possession or sales, sexual assault, or theft.
Gang MembershipUsing a detailed set of criteria, law enforcement agencies submitinformation on gang members to a statewide law enforcement data-base. Gang members are removed from the state database if theyhave not had contact with law enforcement in the last five years.
Homicide/Manslaughter
Weapons
Robbery
Assault

Hate Crime Remains LowDescription of IndicatorThis indicator measures the number of reported hate crime incidents inOrange County compared to peer regions and the number of hate crime-related cases filed in Orange County court. When bias against another per-son’s race, religion, disability, sexual orientation, or ethnicity drives a crim-inal act, the offense is classified as a hate crime.
Why is it Important?Hate crimes are particularly threatening crimes because the perpetratorviews his or her victim as lacking full human worth due to their skin color,ethnic background, religion, sexual orientation, or disability. In addition, ahate crime impacts the entire group to which the victim belongs, spreadingconcern throughout the community.
How is Orange County Doing?In 2009, there was little change in Orange County’s already low level ofbias-motivated crimes:• The number of hate crime events (68) and victims (77) remained below
the 10-year averages of 71 and 83, respectively.• The number of hate crime-related cases filed in criminal court in 2009
was the same number filed in 2008 (19).1
• All peer regions compared witnessed fewer hate crimes in 2009.• Orange County’s hate crime event rate of 2.2 per 100,000 is lower than
the statewide average and all regions compared, with the exception ofRiverside/San Bernardino, which showed substantial improvement in thelast year.
• Statewide, the most frequent bias motivation was race, ethnicity ornational origin (60%), followed by sexual orientation (21%), and religion(17%).
58 PUBLIC SAFETY 2011
HATE CRIME
100
90
80
70
60
50
40
30
20
10
0
Reported Hate Crime Events and Filings Orange County, 2000-2009
2000 2001 2002 2003 2004 2005 2006 2007 2008 2009
65
3
Events Filings
California (2.9)
Reported Hate Crime EventsRegional Comparison, 2009
Los A
ngeles
7
6
5
4
3
2
1
0
1.7
San Jo
se
4.1
San D
iego
3.6
San Fr
ancis
co
3.4
Sacr
amen
to
2.6
Orange County
2.3
Riversi
de/
San B
ernar
dino
2.2
91
7
59
16
58
17
71
79
18
78
14
70
17
69
19
68
19
5.0
4.0
3.0
2.0
1.0
0.0
Reported Hate Crime Events and VictimsOrange County, 2000-2009
2000 2001 2002 2003 2004 2005 2006 2007 2008 2009
Source: California Department of Justice, Criminal Justice Statistics Center, Hate Crime in California Reports(http://caag.state.ca.us/cjsc/)
Source: California Department of Justice, Criminal Justice Statistics Center, HateCrime in California Reports (http://caag.state.ca.us/cjsc/)
Source: California Department of Justice, Criminal Justice Statistics Center, HateCrime in California Reports (http://caag.state.ca.us/cjsc/)
Victims Events
2.6
2.3
2.5
2.3
2.4
2.22.3
3.6
3.12.7
2.0
2.2
1.9
2.6
2.3
2.8
2.6
Even
ts per 100,000
Number of Even
ts or Filin
gs
Victims or Even
ts per 100,000
1 A filing is a charging document filed with the superior court clerk by a prosecuting attorney alleging that a person committed or attempted to commit a crime.
3.1
2.5
2.9
6

EnvironmentPropelled by the growth of clean transportation and solar-related jobs, employment in greenindustries is growing. Residents are alsoembracing the shift to alternative fuelvehicles with the second highest proportion ofnew registrations statewide. In addition, wateruse and waste disposal are continuing theirdownward trends. Beach closures and sewage spills are also on the decline.
NATIONAL PEERS
Boston, Minneapolis, Phoenix, Seattle
CALIFORNIA PEERS
Sacramento, San Francisco, San Jose
NEIGHBORS
Los Angeles, Riverside/San Bernardino, San Diego

60
Renewable Energy Production on the Rise
ENVIRONMENT 2011
RENEWABLE ENERGY
Description of IndicatorThis indicator assesses the percentage of Orange County’s electric-ity generated from renewable sources using data from the county’sthree major electricity suppliers.1 It also measures grid-connectedsolar installations completed through the California Solar Initiative(CSI).
Why is it Important?Generating energy from renewable sources reduces a community’simpact on the environment. Home and business energy use con-tributes significantly to greenhouse gas emissions, as well asresource supply challenges when the sources are nonrenewable. Anincreasing proportion of carbon-neutral, renewable sources inOrange County’s energy portfolio – together with reduced autoemissions – will help the county meet statewide greenhouse gasreduction goals while contributing to improved air quality.
How is Orange County Doing?In 2009, the amount of Orange County’s electricity generated fromrenewable sources increased for all providers:• Southern California Edison provides most of Orange County’s
electricity, 17.4% of which was from renewable energy sources,up from 15.8% in 2008.
• San Diego Gas & Electric, which serves many South County res-idents, increased its renewable energy from 6.1% in 2008 to10.2% in 2009.
• The City of Anaheim has its own utility, which increased renew-able energy from 7.0% in 2008 to 9.4% in 2009.
• In comparison, the 2009 California and national averages forrenewable energy sources were 13.9% and 10.6%, respectively.
Although solar installations increased, Orange County still lagsbehind peers:• In 2010, homeowners, businesses, governments, and nonprofit
organizations installed 283.4 kilowatts of grid-connected solarcapacity per 100,000 residents.
• Orange County ranks behind all California peers comparedexcept Los Angeles in solar installations.
Renewable Electricity StandardIn a measure approved by the California Air Resources Board inSeptember 2010, the state’s investor-owned utilities are required toincrease procurement from eligible renewable sources to 33% by theend of 2020.
What is Renewable Energy? Renewable energy sources are those that can be replenished. The mostcommon renewable energy sources include biomass (such as wood andwood waste, municipal solid waste, landfill gas and biogas, ethanol andbiodiesel), water (hydropower), geothermal, wind, and solar.
Source: U.S. Energy Information Administration (www.eia.doe.gov)
1 Orange County’s electricity is generated by individual utilities and because service territories do not always match jurisdictional boundaries, data are not available for the county as a whole.
20%
18%
16%
14%
12%
10%
8%
6%
4%
2%
0%
Electricity Generated from Renewable SourcesOrange County Utilities, California, and United States2005-2009
Southern California Edison
California
United States
San Diego Gas & Electric
Anaheim Public Utility
2005 2006 2007 2008 2009
Nonprofit Commercial
Government Residential
Sources: Anaheim Public Utilities (www.anaheim.net); California Public Utilities Commission(www.cpuc.ca.gov); San Diego Gas & Electric (www.sdge.com); Southern California Edison(www.sce.com); U.S. Energy Information Administration (www.eia.doe.gov)
Grid-Connected Solar InstallationsKilowatts per 100,000 ResidentsRegional Comparison, 2010
San Jo
se
700
600
500
400
300
200
100
0
San D
iego
Sacr
amen
to
San Fr
ancis
co
Riversi
de/
San B
ernar
dino
Orange County
Los A
ngeles
Source: California Solar Statistics (www.californiasolarstatistics.ca.gov)
Per 100,000 Residen
ts
NEWDATA

Description of IndicatorThis indicator measures transportation practices of OrangeCounty residents including total vehicle miles traveled on publicroads, public transit usage, and Alternative Fuel Vehicle (AFV)purchases.
Why is it Important?Gasoline-powered motor vehicles are a significant source of airpollution and one of the largest contributors of greenhouse gasemissions. Adopting land use practices that make transit use andalternatives (such as walking and cycling) more feasible can reducethe amount of miles traveled by vehicles. Reducing miles on theroad – as well as replacing gasoline-powered vehicles with moreefficient AFV options – can improve air quality, reduce green-house gas emissions, and limit dependence on fossil fuels.
How is Orange County Doing?Mirroring trends in rail and bus ridership, the depressed economyis affecting driving habits: • From a high in 2007, overall Vehicle Miles Traveled (VMT) and
VMT per capita fell in 2009, marking the second year ofreduced-VMT.
• The long-term trend in total VMT remains upward, while thelong-term trend on a per capita basis is downward.
Compared to peers, Orange County performs well with regard toAFV purchases:• Orange County has a higher concentration of new AFV regis-
trations than the state average.• This is especially true for natural gas vehicles; Orange County
has nearly twice the percentage of natural gas vehicles as thestate average.
• Of all newly registered vehicles in California in 2008, OrangeCounty had the highest rate of AFV registrations, with theexception of San Francisco, among peers compared.
Ridership on Orange County’s transit system remains averagecompared to peers (see Transit for details):• In 2009, Orange County bus ridership averaged 21 boardings
per capita.• Per capita boardings varied throughout peer regions compared
from highs in Minneapolis (55) and Seattle (50), to lows in SanDiego (7) and Riverside (3).
SUSTAINABLE TRANSPORTATION PRACTICES
61
Recession Makes Long-Term Analysis Difficult
ENVIRONMENT 2011
What Orange County Residents are Saying• 87% believe it is important to reduce dependence on fossil fuels. • 51% would seriously consider buying an electric vehicle that can go at
least 100 miles without recharging. • 59% would seriously consider buying a hybrid vehicle (3% already own
a hybrid). • 54% acknowledge climate change is real and action is required.
Source: Brandman University’s 2010 State of Orange County Survey
Vehicle Miles Traveled (VMT) measures the total number of milestraveled by automobiles on public roads in a given year.
Sources: Caltrans, Public Road Data; U.S. Census Bureau, Supplementary Survey 2001and American Community Survey 2002-2009
Daily VMT (in Thousands)
Daily Vehicle Miles Traveled and Daily Vehicle Miles TraveledPer Capita (Age 18 and Older)Orange County, 2001-2009
76,000
74,000
72,000
70,000
68,000
66,000
64,0002001 2002 2003 2004 2005 2006 2007 2008 2009
67,7
99
71,4
59
71,1
48
73,1
83
71,5
69
71,7
27
74,5
75
73,5
90
72,8
01
Daily VMT per Cap
ita (18+
)35
34
33
32
31
Daily VMT (in Thousands) Daily VMT per Capita (18+)
Electric Natural Gas Hybrid
Source: Next 10 Green Innovation Index, analysis conducted by Collaborative Economicswith data from R.L. Polk & Co. and California Department of Finance
Note: Regions for this analysis vary from the typical presentation in the CommunityIndicators report. Specifically, Los Angeles includes Los Angeles and Venture counties; SanDiego includes San Diego and Imperial counties; Sacramento includes El Dorado, Placer,Sacramento, Sutter, Yolo, and Yuba counties; and San Francisco includes Alameda, ContraCosta, Marin, Napa, San Benito, San Francisco, San Mateo, Santa Clara, Santa Cruz,Solano, and Sonoma counties.
Alternative Fuel Vehicle (AFV) Registrations per 100,000 of All Registered VehiclesRegional Comparison, 2008
3,500
3,000
2,500
2,000
1,500
1,000
500
0
San Fr
ancis
co
Orange County
Los A
ngeles
Califo
rnia
San D
iego
Sacr
amen
to
Riversi
de/
San B
ernar
dino
NEWDATA

62 ENVIRONMENT 2011
Employment in Green Sectors Outpaces Overall Job GrowthDescription of IndicatorThis indicator assesses Orange County’s growth in green jobs –employment within industries that provide products and services relat-ed to alternative energy, resource conservation, and pollution reduc-tion – compared to other California regions and the state.
Why is it Important?Jobs related to using alternative energy, conserving natural resources,and reducing pollution have increasing economic and environmentalvalue. Growth in green industries supports economic resiliency, envi-ronmental health, and national security.
How is Orange County Doing?Employment in green industries continues to grow: • Between 2008 and 2009, green industry employment in Orange
County grew 2.4%.• Between 1995 and 2009, green industry employment in Orange
County grew 67%, exceeding California’s green industry growthrate of 56%.
• Orange County’s green job growth between 1995 and 2009 also out-paced overall job growth during this period.
• Orange County has the third fastest green job growth rate amongthe regions included in the study.1
• After Air & Environment, Energy Generation holds the largestshare of employment (18%) among green sector jobs and was thesector with the fastest growth between 2008 and 2009 – up 20% dueto the rise in solar-related jobs.
• Orange County’s employment in Clean Transportation is more thantwo times the state average. Motor Vehicles & Equipment drivesmuch of this growth, with employment increases of 116% (450 jobs)from 1995 to 2009.
Source: Green Establishment Database, January 2011. Analyzed by Collaborative Economics andpresented in the Next10 report “Many Shades of Green: Regional Distribution and Trends inCalifornia’s Green Economy, 2011” (www.next10.org/next10/publications/green_jobs/2011.html)
Other
Agriculture Support
Finance & Investment
Research & Advocacy
Energy Storage
Clean Transportation
Green Building
Recyling & Waste
Water & Wastewater
Energy Efficiency
Energy Generation
Air & Environment
Core Green Economy Segments
Advanced Materials Air & EnvironmentAgriculture SupportBusiness ServicesClean TransportationEnergy EfficiencyEnergy GenerationEnergy Infrastructure Energy StorageFinance & InvestmentGreen BuildingManufacturing & Industrial SupportRecycling & WasteResearch & AdvocacyWater & Wastewater
Employment by Green IndustryOrange County, 1995-2009
20,000
18,000
16,000
14,000
12,000
10,000
8,000
6,000
4,000
2,000
01995 1996 1997 1998 1999 2000 2001 2002 2003 2004 2005 2006 2007 2008 2009
Source: Green Establishment Database, January 2011. Analyzed by Collaborative Economics and presented in the Next10 report “Many Shades of Green: RegionalDistribution and Trends in California’s Green Economy, 2011” (www.next10.org/next10/publications/green_jobs/2011.html)
GREEN JOBS
1 For this analysis, the following regions were compared: Bay Area, Los Angeles, Sacramento, Sacramento Valley, Orange County, Central Coast, North Coast, San Joaquin Valley, InlandEmpire, San Diego, and Sierra Region.
Green Job Growth Compared to Overall Job GrowthOrange County and California, 1995-2009
Orange County
California
Orange County
CaliforniaOve
rall
Job
Gro
wth
Gre
en J
ob
Gro
wth
0% 20% 40% 60% 80% 100%
67%
56%
23%
18%
NEWDATA

COASTAL WATER QUALITY
Fewer Ocean Water Closures and Sewage Spills
63
Description of IndicatorThis indicator measures coastal water quality by tracking when ocean and bay waters are closed to the public (closures) or warningsigns have been posted (postings) due to a sewage spill or other contamination. Closures and postings are shown by Beach Mile Days,which is calculated by multiplying the number of days of closure or posting by the number of miles of beach closed or posted. Thismeasurement takes into account both the length of time and amount of beach that is unavailable for recreational use due to a closureor posting. For additional information, visit www.ocbeachinfo.com.
Why is it Important?When ocean or bay waters are closed to the public or warnings are posted on beaches that indicate the water quality is poor, touristsand local residents are discouraged from visiting Orange County’s beaches. This results in less consumer traffic in the beach commu-nities and diminishes our overall sense of quality of life. Furthermore, pollutants that enter the ocean or bays through urban runoffand sewage spills have the potential to compromise public health and endanger marine life.
How is Orange County Doing?The number of closures dropped substantially and postings reached the lowest levels on record:• In 2009, there were six Beach Mile Days of closures, compared to 30 in 2008. • Six pipeline blockages were responsible for the closures.• The number of Beach Mile Days of postings reported in 2009 dropped 66% to 124, compared to 363 in 2000.
Sewage spills reported by sanitation districts, cities that operate sewage collections systems, and private property owners decreased forthe seventh consecutive year: • There were 208 sewage spills reported in 2009, continuing the downward trend that began in 2003.• The average annual number of spills in the late-1980s was 68, compared to 137 in the 1990s and 338 in the 2000s.
450
400
350
300
250
200
150
100
50
0
Reported Sewage SpillsOrange County, 2000-2009
2000 2001 2002 2003 2004 2005 2006 2007 2008 2009
374 367341
293
266
208
340
387408 399
Note: Posting data reflects monitoring from April 1 through October 31 and is not comparable to calendar year datapreviously reported. Orange County suspended ocean and bay water monitoring from November 1 to March 31 due toa reduction in sustainable funding for the program.
Number of Sp
ills
Beach Mile Days of Ocean Water Postings and ClosuresOrange County, 2000-2009
2000 2001 2002 2003 2004 2005 2006 2007 2008 2009
19
363
3015
132
177
52
363
Beach M
ile Days
Source: Orange County Health Care Agency, Public Health Services, Environmental Health
Postings
Closures
400
350
300
250
200
150
100
50
06
124
59
282
15
248
14
197
74
198
2
139
Closures By state law, recreational ocean or bay watersmust be closed when they have been directlycontaminated by sewage or when the streams,creeks and rivers that discharge into them havebeen contaminated by sewage.
PostingsThe Orange County Health Care Agency isrequired to post warning signs when waterquality exceeds state bacteriological standards.This poor water quality is largely attributed tourban runoff.
Sewage SpillsSewage spills occur when wastewater in underground pipes overflows through a man-hole, cleanout or broken pipe.
Pipeline Blockages and BreaksGrease build-up is the most common cause ofpipeline blockages. Pipeline blockages orbreaks in sewer pipes are also caused by treeroots in the lines, undersized sewers, and broken or cracked pipes.
Infrastructure CapabilityIntense rain can overwhelm certain portions ofa sewer system and lead to sewage spills. Anaging sewer system in need of maintenance isalso at increased risk of blockages and breaks.
2011 ENVIRONMENT

Description of IndicatorThis indicator measures the tons of commercial and residential solid waste deposited in Orange County landfills and provides a region-al comparison of jurisdictions meeting state-defined waste diversion targets. It also measures the pounds of household hazardous wastecollected (such as oil, paint, batteries, cell phones, computers, and monitors) and the number of annual participants.
Why is it Important?Reducing solid waste production and diverting recy-clables and green waste extends the life of landfills,decreases the need for costly alternatives, and reducesenvironmental impact. Collection of household haz-ardous waste helps protect the environment and publichealth by reducing illegal and improper disposal.
How is Orange County Doing?Waste disposal continues to decrease:• Waste disposed in Orange County landfills dropped
for the fourth consecutive year, reaching the lowestlevel in more than a decade.
• Recent reductions in waste disposal have shifted the10-year trend in the amount disposed by OrangeCounty residents to an average of -2% annually. Thisis in contrast to the county’s average annual popula-tion growth rate of +1.2% since 2000.
• In 2008, 97% of Orange County jurisdictions mettheir population-based waste diversion targets, while94% met their employment-based targets. Both ratesexceed the California average.1
• In 2009/10, the number of residents bringing house-hold hazardous waste to regional collection centerswas slightly higher than the prior year; however, thenumber of overall pounds disposed declined sharply(-44%).
• Economic factors tend to drive solid and hazardouswaste reductions, with waste collection peaking dur-ing boom years.
64
Recession Contributes to Reduced Waste Disposal
ENVIRONMENT 2011
SOLID AND HOUSEHOLD HAZARDOUS WASTE
125,000
115,000
105,000
95,000
85,000
75,000
65,000
55,000
45,000
35,000
9,000,000
8,000,000
7,000,000
6,000,000
5,000,000
4,000,000
3,000,000
2,000,000
Household Hazardous WasteOrange County, 2001-2010
Number of Participan
ts
Pounds of Waste
Pounds CollectedNumber of Participants
Source: County of Orange Integrated Waste Management Department; California Integrated WasteManagement Board (www.ciwmb.ca.gov/)
Sources: County of Orange Integrated Waste Management Department; California Integrated WasteManagement Board (www.ciwmb.ca.gov/); California Department of Finance, Tables E-4(www.dof.ca.gov)
1 Annually, the California Integrated Waste Management Board calculates ajurisdiction’s per capita (per resident and per employee) disposal rates; targetsfor each jurisdiction are based on these calculations.
2008
/09
2009
/10
2000
/01
2001
/02
2002
/03
2003
/04
2004
/05
2005
/06
2006
/07
2007
/08
6,000,000
5,000,000
4,000,000
3,000,000
2,000,000
1,000,000
0
Population Trend (Orange County Waste)
2000 2001 2002 2003 2004 2005 2006 2007 2008 2009
Solid Waste Disposal in Orange County Landfills Compared to Population Growth, 2000-2009
Orange County Waste
Imported Waste
Population or Tons of Waste
Total WasteDisposed inOrangeCounty
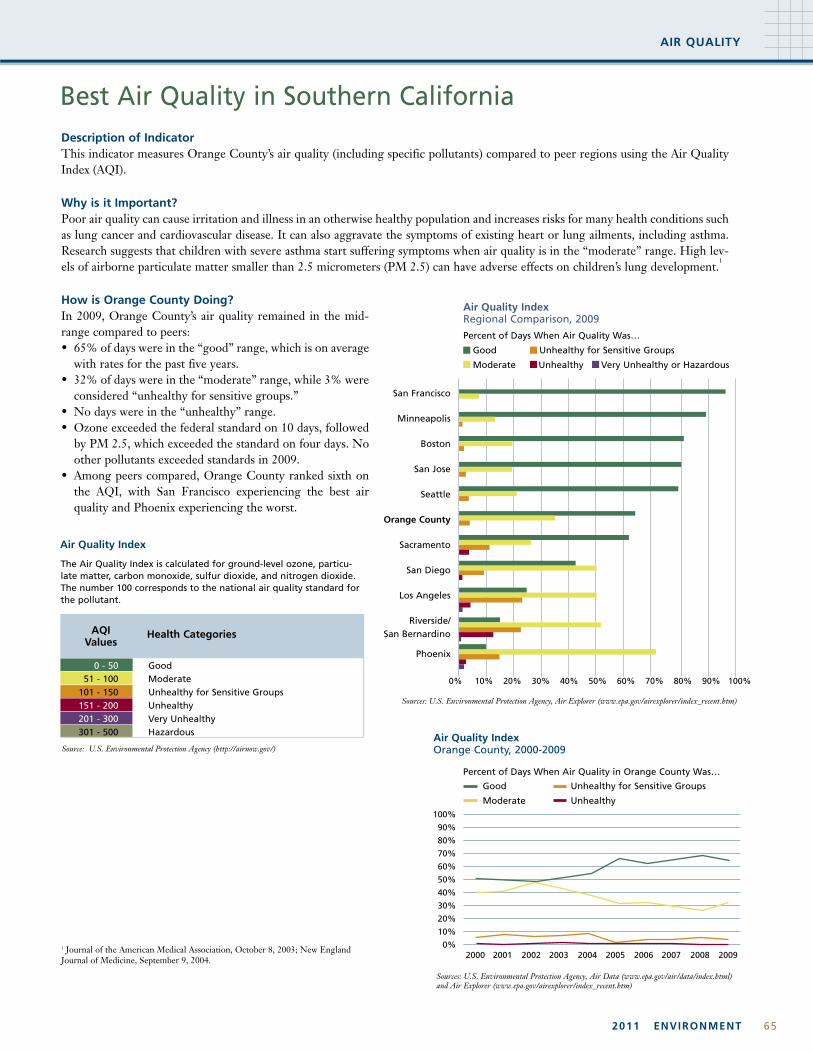
Description of IndicatorThis indicator measures Orange County’s air quality (including specific pollutants) compared to peer regions using the Air QualityIndex (AQI).
Why is it Important?Poor air quality can cause irritation and illness in an otherwise healthy population and increases risks for many health conditions suchas lung cancer and cardiovascular disease. It can also aggravate the symptoms of existing heart or lung ailments, including asthma.Research suggests that children with severe asthma start suffering symptoms when air quality is in the “moderate” range. High lev-els of airborne particulate matter smaller than 2.5 micrometers (PM 2.5) can have adverse effects on children’s lung development.
1
How is Orange County Doing?In 2009, Orange County’s air quality remained in the mid-range compared to peers:• 65% of days were in the “good” range, which is on average
with rates for the past five years. • 32% of days were in the “moderate” range, while 3% were
considered “unhealthy for sensitive groups.”• No days were in the “unhealthy” range. • Ozone exceeded the federal standard on 10 days, followed
by PM 2.5, which exceeded the standard on four days. Noother pollutants exceeded standards in 2009.
• Among peers compared, Orange County ranked sixth onthe AQI, with San Francisco experiencing the best airquality and Phoenix experiencing the worst.
AIR QUALITY
65
Best Air Quality in Southern California
2011 ENVIRONMENT
0 - 50 Good51 - 100 Moderate
101 - 150 Unhealthy for Sensitive Groups151 - 200 Unhealthy201 - 300 Very Unhealthy301 - 500 Hazardous
The Air Quality Index is calculated for ground-level ozone, particu-late matter, carbon monoxide, sulfur dioxide, and nitrogen dioxide.The number 100 corresponds to the national air quality standard forthe pollutant.
Air Quality Index
AQIValues
Health Categories
Source: U.S. Environmental Protection Agency (http://airnow.gov/)
Sources: U.S. Environmental Protection Agency, Air Explorer (www.epa.gov/airexplorer/index_recent.htm)
Sources: U.S. Environmental Protection Agency, Air Data (www.epa.gov/air/data/index.html)and Air Explorer (www.epa.gov/airexplorer/index_recent.htm)
100%
90%
80%
70%
60%
50%
40%
30%
20%
10%
0%
Air Quality IndexOrange County, 2000-2009
Percent of Days When Air Quality in Orange County Was…
Good Unhealthy for Sensitive Groups
Moderate Unhealthy
2000 2001 2002 2003 2004 2005 2006 2007 2008 2009
Air Quality IndexRegional Comparison, 2009
San Francisco
Minneapolis
Boston
San Jose
Seattle
Orange County
Sacramento
San Diego
Los Angeles
Riverside/San Bernardino
Phoenix
0% 10% 20% 30% 40% 50% 60% 70% 80% 90% 100%
Good Unhealthy for Sensitive Groups
Moderate Unhealthy Very Unhealthy or Hazardous
Percent of Days When Air Quality Was…
1 Journal of the American Medical Association, October 8, 2003; New EnglandJournal of Medicine, September 9, 2004.

66
Water Usage Down for Third Consecutive Year
ENVIRONMENT 2011
WATER USE AND SUPPLY
$3,000
$2,500
$2,000
$1,500
$1,000
$500
$0
Cost of Water per Acre-Foot to Wholesaler by Source, 2010
Drought Conditions are NormalCalifornia, February 2011
Groundw
ater
Conserv
atio
n
Importe
d Surfa
ce W
ater
Wat
er Tr
ansfe
rs
Brack
ish G
roundw
ater
Desal
inat
ion
Ocean
Wat
er
Deslin
atio
n
Recyc
led W
ater
Sources: Municipal Water District of Orange County; Orange County Water District
Source: California Department of Water Resources (www.water.ca.gov/drought/conditions/)
800,000
700,000
600,000
500,000
400,000
300,000
200,000
100,000
0
250
200
150
100
50
0
Urban Water Usage Orange County, 2001-2010
Acre-Feet
Gallons per Capita per Day
10-Year Trend (Acre-Feet)
10-Year Trend (per Capita)
02/0
303
/04
01/0
204
/05
05/0
606
/07
07/0
808
/09
09/1
000
/01
Gallons per Cap
ita per Day
Acre-Feet of Water
683,
471
196 188180
$435
$407
$800
$200
$951
$775
$1,100
$700
$1,300
$900
$1,300
$1,500
$2,500
$900
164
197 201190 196
182 184
654,
286
630,
476
582,
253
638,
617
662,
499
633,
285
661,
136
620,
473
630,
475
Description of IndicatorThis indicator measures Orange County’s annual urban(residential and commercial) water usage. It also showsprojected water use and supply through 2030.
Why is it Important?Given our arid climate, effective water management isessential to ensure that the county has an ample watersupply now and in the future. As population and busi-ness growth drive water demand, reliance on importedwater will continue. The county’s long-term sustainabil-ity will also rely on increased conservation and invest-ment in additional water supplies, such as groundwaterbasin replenishment and desalination.
How is Orange County Doing?Urban water usage dropped in 2009/10:• Between 2008/09 and 2009/10, per capita usage expe-
rienced a 9% decline, while total acre-feet usagedecreased 8%.
• Although usage fluctuates from year-to-year, long-term trends show per capita usage rates continuingdownward by approximately 2% annually, and overallacre-feet usage declining by approximately 1% annu-ally – even while population grows by roughly 1%each year.
• To meet future water demand, continued conserva-tion efforts are increasingly important.1 SB 7 passedby the state legislature requires an approximate 20%reduction in per capita demand by the year 2020.
• Ocean water desalination remains one of the mostcostly sources of water, though it will become morefinancially viable as imported water rates increase.
• Over the past five years, imported water costs haveincreased approximately 65%.
Drought StatusAs of early 2011, California’s precipitation and reservoir stor-age were above average. An unusually cool summer in 2010lowered demand and enabled some refill of storage that wasseverely depleted as a result of dry years from 2007 to 2009.However, if the drought continues in the Colorado RiverBasin, water flows to Southern California could be restricted.Flows from the Sacramento-San Joaquin River Delta arealready reduced due to endangered species protection. Dueto these challenges, and the fact that some local storage hasyet to recover, local water officials are warning consumersthat municipal water use restrictions are likely to remain in effect.
Source: Municipal Water District of Orange County
1 Presentation of water source projection data and water cost data alternate annually. Refer to the 2010 Orange County Community Indicators report (page 68) to view water use andsupply projections through 2030.
Note: Figures have been revisedsince previously reported.
Sources: Municipal Water Districtof Orange County; Orange CountyWater District; CaliforniaDepartment of Finance (Tables E-4)
NORMAL DRY SEVERE EXTREME✓

Civic Engagement
Despite more charitable organizations,there is also less revenue. Half of nonprofitservice organizations experienced budget decreases,reducing the availability of services to those in need.Registered voter participation in the2010 mid-term election was low compared topeers. However, participation in the census wasnotable with 75% of Orange County residents mailing back surveys.
NATIONAL PEERS
Austin, Boston, Dallas, Minneapolis, Seattle
CALIFORNIA PEERS
Sacramento, San Francisco, San Jose
NEIGHBORS
Los Angeles, Riverside/San Bernardino,
San Diego, Ventura

68 CIVIC ENGAGEMENT 2011
VOTER PARTICIPATION
Description of IndicatorThis indicator measures voter registration and voter turnout.Voter turnout is measured among registered voters and the vot-ing eligible population. Also shown are percentages of OrangeCounty’s electorate who are voting by mail.
Why is it Important?Voter participation measures civic interest and the public’s opti-mism regarding their impact on the decision-making process. Ahigh level of citizen involvement increases personal investmentin community issues and government accountability. Anincrease in the number of constituents voting by mail mayreduce the cost of holding elections.
How is Orange County Doing?While turnout varies depending on how it is measured, OrangeCounty maintains high voter registration:• As of October 2010, 86% of Orange County residents who
are eligible to vote were registered.• This rate is greater than state and national averages, and 10%
greater than all peers compared including Los Angeles,Sacramento, San Francisco, San Diego, San Jose, andRiverside/San Bernardino.
• Among registered Orange County voters, 55% chose to votein the November 2010 mid-term election, which is lowerthan the statewide average and all peer counties comparedexcept Los Angeles.
• Among Orange County residents eligible to vote, 48% votedin the 2010 mid-term election.
• This participation rate for the voting eligible population ishigher than the statewide average and several peer countiescompared.
• In 2010, 52% of Orange County voters chose to vote by mail,compared with 49% of voters statewide.
• Since 2000, the percentage of voters who vote by mail hassteadily increased.
Voting by Mail Increases
100%
90%
80%
70%
60%
50%
40%
30%
20%
10%
0%
General and Mid-Term Election Turnout Among Registered VotersOrange County, 1990-2010
79%
66% 69
%
61%
73%
51%
Source: California Secretary of State (www.sos.ca.gov)
55%62
%
20101990 1992 1994 1996 1998 2000 2002 2004
73%
2006
51%
2008
73%
Mid-Term Election Turnout Among Registered Voters and Voting Eligible PopulationRegional Comparison, 2010
San Fr
ancis
co
100%
90%
80%
70%
60%
50%
40%
30%
20%
10%
0%
San Jo
se
Sacr
amen
to
San D
iego
Orange County
Riversi
de/
San B
ernar
dino
Los A
ngeles
69%
48%
67%
46%
65%
49%
64%
44%
56%
37%
55%
48% 53
%
41%
80%
70%
60%
50%
40%
30%
20%
Percentage Voting by Mail in General, Mid-Term and Special ElectionsOrange County, 2000-2010
2000 2002 2003* 2004 2005* 2006 2008 2009* 2010
*Special Elections
Source: Orange County Registrar of Voters
Voting Eligible Population Turnout:RegionCalifornia (44%)
Registered Voter Turnout:RegionCalifornia (60%)
Registered Voter TurnoutThe number of votes cast in any given election divided by the numberof residents who are registered to vote.
Voting Eligible Population TurnoutThe number of votes cast in any given election divided by the numberof all eligible residents (U.S. Citizens 18 years of age or older who arenot convicted felons in prison or on parole).
Source: California Secretary of State, 2010 Returns (http://www.sos.ca.gov/elections/elections_u.htm )
26%29% 31%
36%
45%48% 45%
67%
52%

NEWDATACENSUS PARTICIPATION
692011 C IVIC ENGAGEMENT
Description of IndicatorThis indicator compares Orange County’s participation in the April 2010 U.S. Census with peer regions. Participation is measured bythe proportion of surveys returned by mail.
Why is it Important?The U.S. Census is a survey conducted every 10 years to count each resident in the United States. Information collected through thecensus includes economic, social, and housing data and determines the number of seats each state has in the U.S. House ofRepresentatives. It is also used to distribute billions in federal funds to help local communities. Many jurisdictions actively encourageresidents to participate in the census to obtain a better picture of their community and access more government funds.
How is Orange County Doing?At 75%, a slightly greater proportion of Orange County residents mailed back census forms than the national average:• Orange County’s mail-back rate was second among Southern California counties, behind Ventura (76%).• Orange County’s mail-back rate exceeded Dallas, Austin, Los Angeles, San Diego, Boston, and Riverside/San Bernardino.• Minneapolis (84%) had the highest mail-back rate among peers compared.
Census Mail-Back Rate Mirrors National Average
Seat
tle
U.S. Census Participation RateRegional Comparison, 2010
100%
90%
80%
70%
60%
50%
40%
30%
20%
10%
0%
San Jo
se
Ventu
ra
Orange County
Min
neapolis
Dalla
s
Austin
Los A
ngeles
San D
iego
Boston
Riversi
de/
San B
ernar
dino
84%
77%
76%
76%
San Fr
ancis
co
75%
75%
74%
73%
73%
72%
72%
71%
Source: U.S. Census Bureau (http://2010.census.gov)
United States Average (74%)
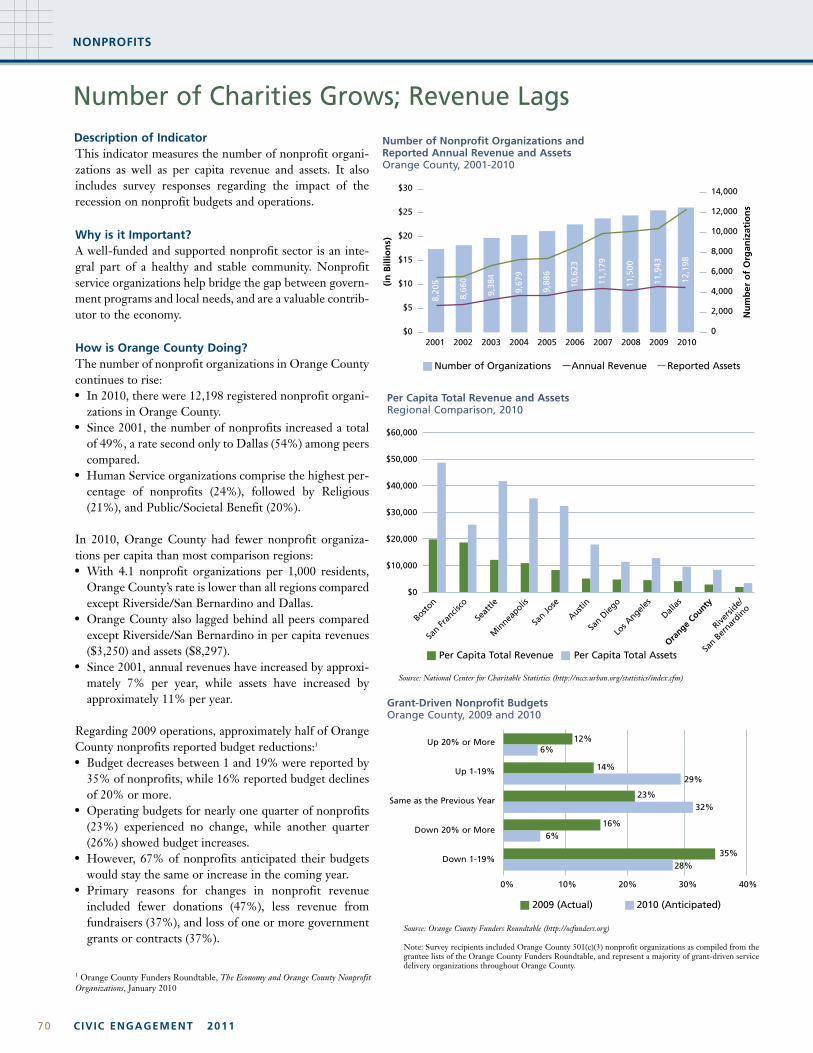
70 CIVIC ENGAGEMENT 2011
NONPROFITS
Number of Charities Grows; Revenue Lags
Number of Nonprofit Organizations and Reported Annual Revenue and AssetsOrange County, 2001-2010
$30
$25
$20
$15
$10
$5
$0
14,000
12,000
10,000
8,000
6,000
4,000
2,000
0
Per Capita Total Revenue Per Capita Total Assets
Per Capita Total Revenue and AssetsRegional Comparison, 2010
Boston
San Fr
ancis
co
Seat
tle
Min
neapolis
San Jo
se
Austin
San D
iego
Los A
ngeles
Dalla
s
Orange County
Riversi
de/
San B
ernar
dino
$60,000
$50,000
$40,000
$30,000
$20,000
$10,000
$0
2009 (Actual) 2010 (Anticipated)
Grant-Driven Nonprofit BudgetsOrange County, 2009 and 2010
Up 20% or More
Up 1-19%
Same as the Previous Year
Down 20% or More
Down 1-19%
Source: Orange County Funders Roundtable (http://ocfunders.org)
Note: Survey recipients included Orange County 501(c)(3) nonprofit organizations as compiled from thegrantee lists of the Orange County Funders Roundtable, and represent a majority of grant-driven servicedelivery organizations throughout Orange County.
Source: National Center for Charitable Statistics (http://nccs.urban.org/statistics/index.cfm)
0% 10% 20% 30% 40%
12%6%
14%
23%32%
16%6%
35%28%
Number of Organizations Annual Revenue Reported Assets
2001 2002 2003 2004 2005 2006 2007 2008 2009 2010
(in Billions)
Number of Organ
izations
8,20
5
8,66
0
9,38
4
9,67
9
9,88
6
10,6
23
11,1
79
11,5
00
11,9
43
12,1
98
Description of IndicatorThis indicator measures the number of nonprofit organi-zations as well as per capita revenue and assets. It alsoincludes survey responses regarding the impact of therecession on nonprofit budgets and operations.
Why is it Important?A well-funded and supported nonprofit sector is an inte-gral part of a healthy and stable community. Nonprofitservice organizations help bridge the gap between govern-ment programs and local needs, and are a valuable contrib-utor to the economy.
How is Orange County Doing?The number of nonprofit organizations in Orange Countycontinues to rise:• In 2010, there were 12,198 registered nonprofit organi-
zations in Orange County. • Since 2001, the number of nonprofits increased a total
of 49%, a rate second only to Dallas (54%) among peerscompared.
• Human Service organizations comprise the highest per-centage of nonprofits (24%), followed by Religious(21%), and Public/Societal Benefit (20%).
In 2010, Orange County had fewer nonprofit organiza-tions per capita than most comparison regions:• With 4.1 nonprofit organizations per 1,000 residents,
Orange County’s rate is lower than all regions comparedexcept Riverside/San Bernardino and Dallas.
• Orange County also lagged behind all peers comparedexcept Riverside/San Bernardino in per capita revenues($3,250) and assets ($8,297).
• Since 2001, annual revenues have increased by approxi-mately 7% per year, while assets have increased byapproximately 11% per year.
Regarding 2009 operations, approximately half of OrangeCounty nonprofits reported budget reductions:1
• Budget decreases between 1 and 19% were reported by35% of nonprofits, while 16% reported budget declinesof 20% or more.
• Operating budgets for nearly one quarter of nonprofits(23%) experienced no change, while another quarter(26%) showed budget increases.
• However, 67% of nonprofits anticipated their budgetswould stay the same or increase in the coming year.
• Primary reasons for changes in nonprofit revenueincluded fewer donations (47%), less revenue fromfundraisers (37%), and loss of one or more governmentgrants or contracts (37%).
1 Orange County Funders Roundtable, The Economy and Orange County NonprofitOrganizations, January 2010
29%

NOTES
7171

72 ACKNOWLEDGEMENTS AND SOURCES 2011
16th Annual Report on the Conditions ofChildren in Orange County
Anaheim Public UtilitiesBrandman UniversityCalifornia Association of RealtorsCalifornia Community Colleges,
Chancellor’s OfficeCalifornia Department of EducationCalifornia Department of FinanceCalifornia Department of Justice, Criminal
Justice Statistics CenterCalifornia Department of Mental HealthCalifornia Department of Public HealthCalifornia Department of Water ResourcesCalifornia Division of TourismCalifornia Employment Development
DepartmentCalifornia Highway PatrolCalifornia Integrated Waste Management
DepartmentCalifornia Managed Risk Medical Insurance
BoardCalifornia Public Utilities CommissionCalifornia Secretary of StateCalifornia Solar StatisticsCalifornia State University, FullertonCaltransCapistrano-Laguna Beach Regional
Occupational ProgramCenter for Demographic Research at
California State University, FullertonCentral County Regional Occupational
ProgramChapman UniversityChildren’s Home Society of Orange CountyCoastline Regional Occupational ProgramCollaborative EconomicsCouncil for Community and Economic
ResearchCounty of Orange Community
Services/Office on AgingCounty of Orange Community
Services/Orange County HousingAuthority
County of Orange Health CareAgency/Behavioral Health Services
County of Orange Health CareAgency/Environmental Health
County of Orange Health CareAgency/Epidemiology and Assessment
County of Orange Health CareAgency/Family Health Division
County of Orange Health CareAgency/HIV/AIDS Surveillance &Monitoring Program
County of Orange Integrated WasteManagement Department
County of Orange Office of the DistrictAttorney
County of Orange Public WorksCounty of Orange Registrar of VotersCounty of Orange Social Services AgencyFederal Bureau of InvestigationFederal Transit AdministrationForbes magazineGallup-HealthwaysGallup-Healthways Well-Being IndexGreen Establishment DatabaseHanley Wood Market IntelligenceInstitute for Economic and Environmental
Studies at California State University,Fullerton
Milken InstituteMunicipal Water District of Orange CountyNational Center for Charitable StatisticsNational Low Income Housing CoalitionNext 10North Orange County Regional
Occupational ProgramOrange County Department of EducationOrange County Funders RoundtableOrange County Transportation AuthorityOrange County Water DistrictPricewaterhouseCoopers/Thomson Venture
Reuters/NVCA Moneytree PublicCEOR.L. Polk & Co.San Diego Gas & ElectricScarborough ResearchSouth Coast Air Quality Management
DistrictSouthern California Edison
Substance Abuse and Mental HealthAdministration
United States Bureau of Economic AnalysisUnited States Bureau of Labor StatisticsUnited States Census BureauUnited States Centers for Disease Control
and PreventionUnited States Conference of MayorsUnited States Department of Health and
Human ServicesUnited States Department of Housing and
Urban DevelopmentUnited States Energy Information
AdministrationUnited States Environmental Protection
AgencyUnited States Patent OfficeUniversity of California, Berkeley/Center
for Social Services ResearchUniversity of California, IrvineUniversity of California, Los
Angeles/Center for Health PolicyResearch
Wall Street JournalWestEd
Orange County Community Indicators2011 Project Team:Michael Ruane (Project Director), Children
and Families Commission of OrangeCounty
Carolyn McInerney (Project Manager),County of Orange County ExecutiveOffice
Lisa Burke, Burke ConsultingTillie Martinez, Children and Families
Commission of Orange CountyTracy McNiven, McNiven ConsultingRoger Morton, Tech Coast Consulting
Group Kari Parsons, Parsons Consulting, Inc.Ray Schmidler, Raymond Ari DesignWallace Walrod, Tech Coast Consulting
Group
The Community Indicators report would not be possible without the data provided by the following agencies and the expertise of their representatives:

The Orange County Community Indicators Project is sponsored by:
Contributing Partners:
www.oc.ca.gov www.ocbc.org www.occhildrenandfamilies.com
www.lajollainstitute.org
Thank you to the members of the Urban Land Institute/Orange County and Inland Empire's SustainabileCommunities Initiative Council for their continued partnership and input.
www.orangecounty.uli.org

Orange County Community Indicators Project
17320 Redhill Avenue, Suite 200Irvine, California 92614
(714) 834-7257www.oc.ca.gov/ceocommunity.asp